Article

Acoustic Optimization of Classroom Environments Using Oriented Strand Board Panels: Layout Strategy and Simulation Validation

1
Jiyang College, Zhejiang A&F University, Zhuji 311800, China
2
College of Materials Science and Engineering, Northeast Forestry University, Harbin 150040, China
*
Authors to whom correspondence should be addressed.
Buildings 2026, 16(11), 2159; https://doi.org/10.3390/buildings16112159
Submission received: 24 April 2026 / Revised: 22 May 2026 / Accepted: 25 May 2026 / Published: 28 May 2026
(This article belongs to the Section Building Energy, Physics, Environment, and Systems)

Abstract

Classroom acoustic quality plays a crucial role in speech intelligibility and effective learning. However, many existing classrooms suffer from excessive reverberation and insufficient speech clarity. This study investigates the acoustic regulation potential of oriented strand board (OSB) panels through a combined approach of field measurements and numerical simulations. A typical classroom was first characterized in terms of reverberation time and speech transmission index within the frequency range of 250–2000 Hz. Based on previous acoustic performance tests of OSB materials, 15 mm thick OSB panels were selected for further spatial layout optimization. Three installation configurations with identical material quantities were designed and evaluated using COMSOL Multiphysics 6.2 simulation. The simulation results were subsequently validated through in situ measurements. The results indicate that the distributed installation of OSB panels on both the side and rear walls provides the most balanced acoustic performance, reducing reverberation time from approximately 1.55 s to 1.42–1.48 s, while increasing the speech transmission index by 1.8–9.4%. This study establishes a layout-oriented acoustic design framework that explicitly integrates material performance with spatial configuration, highlighting spatial distribution as the dominant control variable under constrained material conditions. These findings provide practical guidance for cost-effective acoustic retrofitting in educational buildings and demonstrate the effectiveness of layout-oriented acoustic design strategies.

1. Introduction

Classroom acoustic quality, as an important aspect of indoor acoustic regulation, is closely related to teaching effectiveness, students’ learning experience, and acoustic comfort in educational spaces [1,2,3]. In many existing classrooms, excessive reverberation time, high background noise, and insufficient speech clarity remain common acoustic defects [4,5,6]. These problems may reduce students’ listening comprehension and learning efficiency, and make it more difficult for teachers’ speech to be clearly transmitted to the rear seating areas [7]. For teachers, long-term speaking in a reverberant or noisy environment may increase vocal effort and reduce teaching comfort [8]. Previous classroom-acoustic studies and guideline-oriented evaluations generally suggest that core learning spaces require low background noise levels and controlled reverberation time to ensure effective speech communication [9,10,11,12]. Therefore, improving classroom acoustic quality is not only a technical issue in architectural acoustics but also an important requirement for educational quality and occupational health.
Reverberation time and speech transmission index are widely recognized as key indicators for evaluating classroom acoustic quality [8,9,10,11,12]. Among them, reverberation time reflects the persistence of sound energy in an enclosed room, while STI quantifies the clarity of speech transmission under reverberant conditions [13,14]. Previous studies have further shown that reverberation and background noise can strongly affect speech intelligibility in classrooms and other complex acoustic environments [11,15]. Therefore, targeted optimization of these two indicators is the core task for improving classroom acoustic quality.
Conventional classroom acoustic treatments commonly rely on porous sound-absorbing materials, such as mineral wool, foam plastics, and fiberglass panels [16,17]. These materials can effectively dissipate sound energy through viscous and thermal losses inside interconnected pores. However, their practical application in classrooms is often limited by uneven frequency-dependent absorption, relatively weak mid- to low-frequency regulation, environmental concerns, and poor visual compatibility with educational spaces. These limitations have encouraged the exploration of renewable and environmentally friendly alternatives.
Wood and wood-based materials have attracted increasing attention because of their renewable origin, natural texture, structural stability, and acoustic regulation potential [18,19,20,21,22]. Their pore structure, fiber arrangement, and internal damping characteristics allow part of the incident sound energy to be dissipated or redistributed during propagation. Previous studies have shown that the acoustic performance of wood-based materials can be adjusted by changing density, thickness, moisture content, and porosity [23,24,25,26,27,28]. In addition to acoustic performance, the texture and color characteristics of wood-based materials can also improve the visual compatibility and environmental quality of indoor spaces [29,30]. Moreover, studies on sound-absorbing materials and green acoustic treatments provide useful references for classroom acoustic correction and material selection [31,32]. However, compared with conventional wood panels and natural fiber absorbers, the acoustic application of oriented strand board (OSB) in classrooms remains insufficiently investigated. In particular, the relationship between OSB panel thickness, acoustic impedance matching, and classroom sound-field regulation still requires further clarification.
In addition to material selection, numerical simulation has become an important tool for classroom acoustic design. Existing studies have used Ecotect, COMSOL, CadnaR, and other tools to evaluate reverberation time, speech transmission index, and sound-absorbing panel layouts [33,34,35]. These studies demonstrate the usefulness of simulation methods for predicting indoor acoustic performance. However, many of them focus on the effect of adding absorptive materials, while the interaction between material properties and spatial distribution is not fully quantified.
Layout optimization is another important factor in classroom acoustic regulation. Previous studies have suggested that sound-absorbing materials placed on ceilings, rear walls, or reflective wall areas can effectively reduce reverberation and improve speech clarity [36,37,38]. Nevertheless, most existing studies treat material performance and spatial configuration as separate design variables. As a result, the coupled effect of material properties and layout strategy under fixed material usage remains unclear. Therefore, this study focuses on the acoustic regulation effect of 15 mm thick OSB panels and systematically compares different panel layout strategies under identical material quantities, aiming to clarify the role of spatial distribution as a dominant control variable in classroom sound-field optimization.
In this study, based on previous research on the acoustic performance of oriented strand boards (OSB) with different thicknesses [39], the regulatory effects of OSB panels with thicknesses of 8 mm, 12 mm, and 15 mm on the classroom sound field were first compared. Earlier results showed that the 15 mm thick OSB panel achieved better acoustic impedance matching, reducing reverberation time and increasing the average speech transmission index more effectively than the thinner panels. Therefore, the 15 mm thick OSB panel was selected as the optimal thickness for further classroom spatial layout design. On this basis, the present study focuses on the arrangement of 15 mm thick OSB panels in a typical rectangular classroom, aiming to verify the effectiveness of the previously established acoustic simulation model and to identify a practically feasible installation strategy. During the layout design process, the installation areas of the OSB panels were planned according to the geometric characteristics of the classroom. The core acoustic indicators, including reverberation time and speech transmission index, were then measured after installation and compared with model predictions. This research not only further verifies the practical application effect of 15 mm thick OSB panels, but also provides a detailed demonstration of the prediction accuracy of the simulation model and the rationality of different layout strategies through combined numerical and experimental validation. Compared with previous studies, this work goes beyond conventional approaches by integrating material characteristics with spatial distribution strategies and demonstrating that spatial configuration functions as the dominant control variable in sound field regulation under constrained material conditions. The study demonstrates that OSB panels, as a cost-effective engineered wood material, can provide balanced acoustic regulation within the frequency range relevant to speech communication. More importantly, by systematically comparing multiple installation configurations under identical material conditions, it demonstrates that spatial distribution functions as the dominant control variable governing sound field regulation mechanisms, highlighting a perspective that has been insufficiently addressed in existing research.
Moreover, the study establishes and experimentally validates a COMSOL-based simulation workflow, offering a practical and transferable tool for predictive acoustic design in educational environments. Unlike previous studies that primarily focus on material performance or layout optimization separately, this study integrates both aspects within a unified analytical framework, emphasizing the dominant role of spatial configuration under constrained material conditions. This study aims not only to evaluate the acoustic performance of OSB panels but also to develop a transferable layout-oriented design methodology for building acoustic optimization. Based on the above research gap, the main scientific question of this study is how the spatial layout of OSB panels influences classroom acoustic performance when the material type and total material quantity are constrained. Specifically, this study aims to address the following objectives:
(1)
To clarify the acoustic regulation potential of 15 mm thick OSB panels in a typical classroom environment;
(2)
To compare the effects of different OSB panel layout strategies on reverberation time, speech transmission index, and sound field uniformity under the same material quantity;
(3)
To validate the reliability of a COMSOL-based acoustic simulation model through in situ measurements;
(4)
To propose a practical layout-oriented design strategy for cost-effective classroom acoustic retrofitting.
By explicitly linking material performance with spatial configuration, this study seeks to quantify the coupled influence of material selection and layout strategy on classroom sound field regulation.

2. Materials and Methods

Before the acoustic indicators, material properties, and simulation procedure are introduced, it is necessary to clarify the main modeling assumption adopted in this study. A spatially uniform distribution assumption was used for the absorption and scattering properties of classroom surfaces. Under this assumption, surfaces made of the same material were assigned identical acoustic parameters in the numerical model. This simplification reduces computational complexity and improves the reproducibility of the simulation framework. It also allows the influence of OSB panel layout to be compared under consistent boundary conditions. The possible limitations of this assumption and its influence on the simulation results are further discussed in the finite element simulation section.

2.1. Acoustic Quality Indicators

2.1.1. Reverberation Time

To calculate the reverberation time of the classroom, the Eyring reverberation formula with an air attenuation term was used as the theoretical basis, as shown in Equation (1) [40,41]. This equation is applicable to ordinary enclosed rooms under approximately diffuse-field conditions, where the room geometry is relatively regular, the absorption distribution can be represented by an average absorption coefficient, and the room dimensions are much larger than the acoustic wavelength within the investigated frequency range. In the present study, the classroom was treated as a typical rectangular enclosed space, and the sound absorption of each type of surface was represented by its average absorption coefficient. Therefore, Equation (1) was used as a theoretical estimate of reverberation time for the classroom acoustic analysis. The air attenuation term was included to better describe sound energy decay under the measured indoor environmental conditions.
T 60 , E = 0.161 V S I n 1 α ¯ + 4 m V
In the formula, T 60 , E denotes the Reverberation Time, referring to the time required for the sound pressure level to decrease by 60 dB, with the unit of seconds (s). V represents the volume of the room, with the unit of cubic meters m3; S stands for the total surface area of the room, with the unit of square meters m2; m is the attenuation coefficient of sound in air; and α ¯ is the average indoor sound absorption coefficient.

2.1.2. Speech Transmission Index

Speech intelligibility in this study was evaluated using the Speech Transmission Index (STI), which reflects the transmission quality of speech signals under reverberant conditions. STI was obtained from the acoustic measurement system and used together with reverberation time to assess classroom acoustic performance.

2.1.3. Sound Field Uniformity

Compared with ordinary classrooms, smart classrooms have higher requirements for sound field uniformity. Sound field uniformity directly affects the sound coverage range and clarity during the teaching process. A uniform sound field ensures that listeners at every position in the classroom can obtain a consistent auditory experience, avoiding phenomena such as excessive sound concentration or dispersion, thereby improving teaching effectiveness and learning efficiency. This imposes higher design requirements on the distribution of sound waves across different frequency bands, which need to be achieved through the precise configuration of sound-absorbing materials and scientific layout design.
Sound field uniformity is usually determined by comparing the spatial differences in sound pressure levels at different receiver positions. To quantitatively describe the spatial fluctuation of the classroom sound field, the Sound Pressure Uniformity Index (SPUI) was introduced in this study based on the mean-square deviation of sound pressure levels at different receiver positions. This definition follows the general room-acoustic measurement principle that spatial variations should be evaluated using multiple receiver positions [42]. The SPUI is expressed as Equation (2):
S P U I = i = 1 n ( L P i L P ) ¯ 2 n
In Equation (2), L i is the sound pressure level at the i -th measurement point, L ¯ is the average sound pressure level of all measurement points, and n is the total number of measurement points. A smaller SPUI value indicates a more uniform sound pressure distribution. In the subsequent analysis, because the field measurements mainly recorded reverberation time and speech transmission index at the eight receiver positions, the same mean-square-deviation principle was further applied to the measured RT and STI values to evaluate the spatial fluctuation of acoustic performance and to supplement the analysis of sound field uniformity.

2.2. Materials

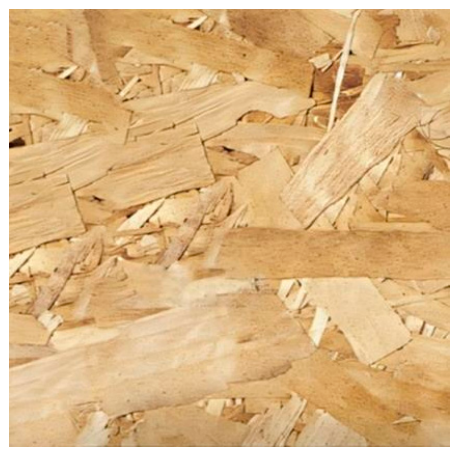
The oriented strand board (OSB) panels used in this study were commercially produced wood-based composite boards manufactured from oriented wood strands bonded with resin adhesives under high temperature and pressure, as shown in Figure 1. Part of the acoustic energy is converted into thermal energy through viscous and thermal losses within the pores, enabling the material to exhibit sound absorption characteristics.
Based on our previous acoustic performance tests of OSB panels with different thicknesses [39], a 15 mm thick OSB commonly available on the market was selected as the experimental material in this study. The previous comparison indicated that the 15 mm thick OSB panel showed more favorable acoustic impedance matching and better acoustic regulation performance than the 8 mm and 12 mm panels, especially in reducing reverberation time and improving the average speech transmission index.
The original board size was 2400 mm × 1200 mm, and each board was cut into four smaller panels of approximately 1200 mm × 600 mm for classroom installation and acoustic testing. The moisture content of the OSB panels was measured using a MERLIN HM8-WS13 instrument (Merlin Technology GmbH, Tumeltsham, Austria) and was 8.1%. The density of the OSB panels was 837 kg/m3, as shown in Table 1. Previous research has shown that the amount of wooden material in a closed room can influence reverberation time, supporting the relevance of wood-based panels for indoor acoustic regulation [43].
The sound absorption coefficient of the 15 mm thick OSB panels was measured using the impedance tube method in accordance with GBJ 88-1985 and GB/T 18696.1-2004 standards [44,45]. Measurements were conducted within the frequency range of 250–2000 Hz, which corresponds to the main frequency range relevant to speech communication in classrooms. Six specimens were tested to improve the repeatability of the impedance tube measurements, and the average sound absorption coefficients were used as input parameters for the simulation model. The experimental results were expressed as mean values, and one-way analysis of variance (ANOVA) was used to examine the differences among samples. A significance level of α = 0.05 was adopted, and differences were considered statistically significant when p < 0.05. The measured average absorption coefficients are listed in Table 2.
The relatively homogeneous structure of OSB panels helps provide stable sound reflection characteristics and reproducible boundary conditions for ray-acoustics simulations. Compared with traditional wood-based panels such as plywood, OSB panels have an average density of approximately 830–850 kg/m3, and their stiffness is more compatible with the thin-panel resonance mechanism. A 15 mm thick OSB panel can keep the resonance frequency within approximately 250–500 Hz, thereby contributing to the absorption of mid- to low-frequency standing waves. In addition, its cost is only about 60–70% of that of slotted wooden sound-absorbing panels of the same thickness. While maintaining basic acoustic regulation performance, it also satisfies the practical requirements of economy and constructability.
Particleboard can provide sound absorption in both the low-frequency and mid- to high-frequency regions of the audible spectrum [28]. However, OSB is more homogeneous and tougher than ordinary particleboard, which may offer advantages for acoustic regulation. Its relatively homogeneous structure ensures stable acoustic behavior, making it suitable for reproducible simulation and experimental validation.

2.3. COMSOL Ray-Acoustics Simulation

Before establishing the numerical model, the following assumptions were adopted to make the classroom acoustic analysis reproducible and computationally feasible.
(1)
The indoor air was assumed to be homogeneous, with a temperature of 20 °C and a relative humidity of 50%, consistent with the measurement conditions.
(2)
Surfaces made of the same material were assigned identical sound absorption and scattering coefficients, and local variations caused by wear, surface defects, or small construction differences were not explicitly modeled.
(3)
The classroom was modeled as an unoccupied room. The additional absorption and scattering effects caused by students were not considered.
(4)
Desks, chairs, and seating areas were simplified as rectangular blocks with equivalent geometric dimensions. Small structural details were omitted to reduce computational complexity.
(5)
The OSB panels were treated as isotropic acoustic surfaces with frequency-dependent absorption coefficients obtained from impedance tube measurements. Directional variations in the acoustic properties of OSB were not considered.
(6)
Sound propagation was calculated using the ray-acoustics approximation, which is suitable for evaluating the overall sound propagation trend and comparative acoustic performance among different layout schemes in the investigated frequency range.
These assumptions allow different OSB panel layout schemes to be compared under consistent boundary conditions.
Previous studies have shown that numerical acoustic simulation can provide scientific support for indoor acoustic design [46,47]. In this work, a three-dimensional classroom acoustic model was developed using the Ray Acoustics interface of COMSOL Multiphysics.
In this study, the Ray Acoustics interface of COMSOL Multiphysics was used to describe sound propagation in the classroom. Under the ray-acoustics approximation, the propagation of sound rays in homogeneous air can be expressed as:
d r d t = c s
d s d t = 0
where r is the position vector of a sound ray, t is time, c is the speed of sound in air, and s is the unit direction vector of the ray. These equations indicate that, between two successive boundary reflections, each sound ray propagates along a straight path at a constant sound speed because the indoor air was assumed to be homogeneous. When a ray reaches a boundary, its direction is updated according to the reflection condition, and its energy is reduced according to the assigned absorption and scattering properties of the boundary surface.
In terms of numerical discretization, the continuous sound field was represented by 6000 sound rays emitted from the omnidirectional sound source. The trajectories of these rays were advanced step by step, and the interactions between rays and classroom boundaries were calculated at each boundary intersection. Therefore, the present simulation used a ray-tracing discretization method rather than a conventional finite-element discretization of the acoustic pressure field. The acoustic parameters at receiver positions were obtained by accumulating the ray energy contributions arriving at the receiver regions.
The geometric model of the classroom was constructed using CAD 2022 and Rhinoceros 8 software, with a total volume of 265.8 m3 and a total surface area of 291.27 m2. To simplify the simulation, desks and seating areas were represented as rectangular blocks with a height of 0.75 m.
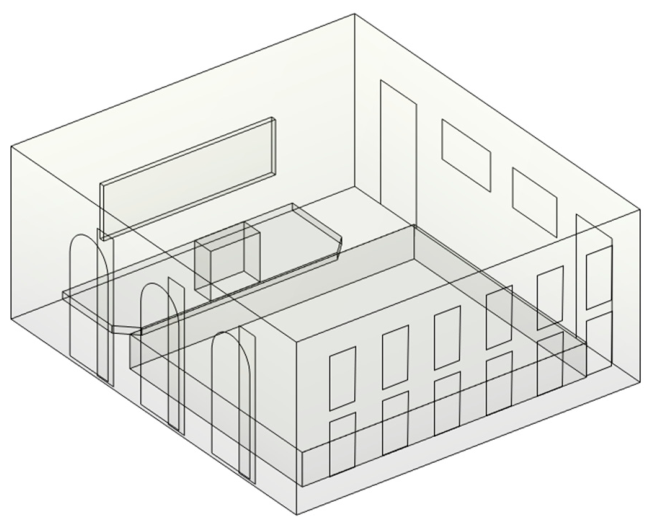
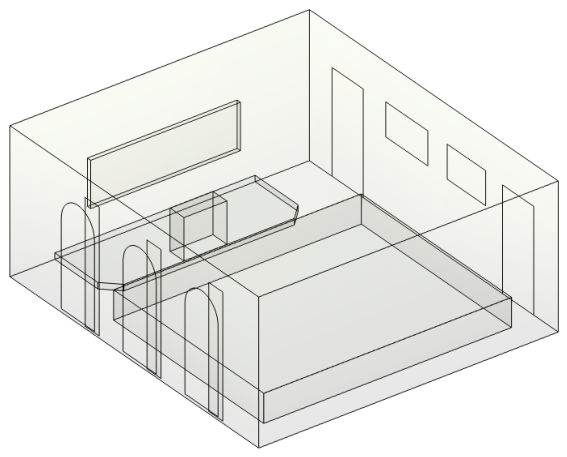
In the simulation, the positions of sound sources and receivers were set consistently with the actual measurement configuration to ensure comparability between simulated and measured data. Surface materials of classroom objects were assigned constant sound absorption coefficients according to relevant literature values. The simulation framework was explicitly designed to ensure reproducibility, with all boundary conditions, material parameters, and source configurations clearly defined to allow replication in similar classroom environments. Environmental parameters were set at a temperature of 20 °C and relative humidity of 50%, consistent with the experimental conditions, as shown in Figure 2.
During the simulation process, three groups were defined, each containing 12 OSB panels, to analyze the influence of different installation positions on classroom reverberation time and speech transmission index.
In the simulation, the positions of the sound source and receivers followed the actual measurement layout to ensure consistency between simulated and measured data. The surface finishes of objects in the classroom were assigned constant sound absorption values, with specific data presented in Table 3 [48]. To ensure sufficient angular coverage of the classroom sound field and stable receiver-point acoustic results, the number of emitted sound rays in the ray-acoustics simulation was set to 6000. In classroom-scale ray-acoustic simulations, an insufficient number of rays may lead to uneven ray distribution and fluctuations in the calculated sound pressure level, reverberation time, and speech transmission index. In contrast, an excessively large number of rays may substantially increase computational cost without producing a proportional improvement in the comparative evaluation of different layout schemes. Therefore, 6000 rays were adopted as a balance between simulation stability and computational efficiency. In the preliminary simulation checks, increasing the ray number beyond this value did not change the comparative trends among the layout schemes, indicating that the selected ray number was sufficient for the purpose of this study. The same ray number was used for all OSB panel arrangement schemes to ensure that the differences among the simulated results were mainly caused by panel layout rather than numerical parameter settings. Moreover, under the conditions of 20 °C temperature and 50% relative humidity, the amplitude attenuation of air was considered to ensure that the environmental conditions in the simulation were consistent with those of the field measurement.
To improve the accuracy of the simulation model in representing the classroom sound field, key parameters were calibrated based on measured data. Particular attention was given to the scattering coefficients of different object surfaces, as these parameters directly influence sound propagation paths and reflection behavior, and therefore affect the accuracy of reverberation time prediction and sound field distribution [49,50,51].
Based on the surface roughness and texture characteristics of classroom objects, the scattering coefficient of desks and chairs was set to 0.6, that of curtains to 0.8, and that of flat surfaces to 0.05. This parameter configuration reduces the deviation between simulation results and measured data and improves the reliability of the model predictions.
As stated at the beginning of the Section 2, the numerical model adopted a spatially uniform distribution assumption for the absorption and scattering properties of classroom surfaces. This means that surfaces made of the same material were assigned identical acoustic parameters in the simulation. Although this assumption simplifies the computational process and is generally applicable to typical classroom environments, it may not fully represent local material inhomogeneities in real classrooms. For example, wear of desks and chairs, wrinkles in curtains, and small differences in surface roughness may influence sound reflection and scattering behavior.
To evaluate the influence of this assumption on the simulation results, a sensitivity analysis was conducted by adjusting the scattering coefficient of desks and chairs from 0.6 to 0.8. The results showed that this change had only a minor influence on sound propagation behavior and did not alter the overall trend of reverberation time and speech transmission index among different OSB panel layout schemes. This indicates that the selected parameter configuration is sufficiently robust for comparative evaluation of classroom acoustic layout strategies.

3. Measurement and Analysis of Acoustic Conditions in the Untreated Classroom

3.1. Basic Parameters of the Classroom Acoustic Environment

To conduct tests and simulations on the acoustic characteristics of the classroom, it was first necessary to define the spatial and environmental conditions of the test scenario. A typical rectangular classroom was selected as the measurement object, with dimensions of 8.86 m in length, 8.00 m in width, and 3.75 m in height. The classroom contained two doors and five windows. The windows were made of large, thick glass panels, while the walls were concrete surfaces coated with white lime paint, resulting in a relatively smooth and reflective enclosure. In addition, the desks and chairs were made of medium-density fiberboard (MDF), with 20 desks, 40 chairs, and one podium arranged in the room. These spatial characteristics directly influence sound propagation paths and sound field distribution and therefore form the basis of the acoustic experiment design. During the measurement, the indoor temperature and relative humidity were maintained at 20 °C and 50%, respectively, to ensure consistent test conditions.
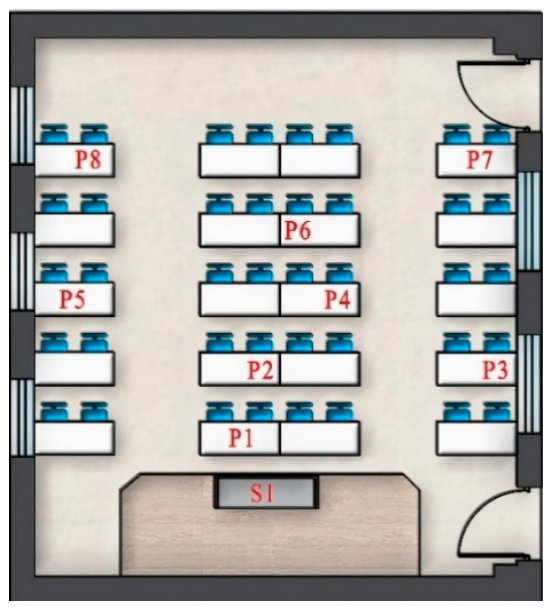
An omnidirectional sound source was used in the experiment to measure the acoustic quality of the classroom. The sound source was placed directly in front of the podium, a position corresponding to the typical sound-producing area when teachers give lectures, which represents typical sound propagation conditions during classroom teaching. This sound source position was marked as S1 in the experiment, as shown in Figure 3. In addition, 8 representative measurement points (P1–P8) were selected in the student seating area as receiver positions; these points are reasonably distributed and can effectively reflect the acoustic characteristics of different areas inside the classroom. Five repeated measurements were conducted at each measurement point to reduce accidental errors and improve data reliability. All measurement data were collected and statistically processed, as shown in Table 4 and Table 5, and further analyzed for the distribution patterns of Reverberation Time and Speech Transmission Index under different frequency conditions.
The average value calculation and error bar analysis were performed for the Speech Transmission Index in the frequency range of 250 Hz to 2000 Hz to further explore the acoustic communication characteristics in the classroom seating area. The results showed that the ratio of the standard deviation to the mean value of the Speech Transmission Index at measurement points across all frequency bands was controlled within 6%. Specifically, the standard deviation in the 250 Hz band was 0.012, accounting for 2.5% of the mean value (0.48); the standard deviation in the 500 Hz band was 0.021, accounting for 4.1% of the mean value (0.51). This fluctuation range is significantly better than the conventional accuracy requirements for acoustic measurements (generally allowing fluctuations within 10%), fully verifying the reliability and stability of the data.

3.2. Control of External Variables

To minimize the influence of external environmental variables on the core acoustic indicators, including reverberation time and speech transmission index, systematic control of temperature, humidity, and background noise was implemented throughout the measurements. Low-noise periods, such as weekends between 9:00 and 16:00, were selected for testing. Classroom doors and windows were kept closed and sealed with sound-insulating rubber strips, and non-essential electrical appliances were turned off to reduce the influence of background noise during acoustic measurements. Temperature was maintained at 20 ± 1 °C and recorded every 15 min using a thermometer with an accuracy of ±0.5 °C. Relative humidity was controlled at 50 ± 5% RH and monitored using a high-precision hygrometer. When necessary, the indoor environment was adjusted using an air conditioner, dehumidifier, or water-filled trays, and measurements were taken only after the parameters had stabilized.

4. Results and Discussion

4.1. Analysis of Acoustic Characteristics of Different OSB Panel Arrangement Methods

To explore the influence of OSB panel arrangement on classroom acoustic characteristics and to determine the most suitable installation strategy, three differentiated layout methods were designed for simulation comparison while keeping the total number of panels constant (12 panels, each measuring 1200 mm × 600 mm). This approach provided a consistent basis for comparing the acoustic consequences of panel placement rather than panel quantity.
The three layout schemes were designed according to different acoustic control principles. Arrangement Method A was defined as a mixed and balanced layout, in which OSB panels were distributed on both side walls and the rear wall to simultaneously control lateral reflections and long-path rear-wall reflections. Arrangement Method B was defined as a concentrated rear-wall layout, aiming to strengthen the absorption of long-path reflected sound from the rear wall and improve speech clarity in the rear seating area. Arrangement Method C was defined as a dispersed multidimensional layout, in which panels were placed on the side wall and ceiling to redistribute sound energy in both horizontal and vertical directions and to improve sound field uniformity. By keeping the total number of panels constant, the comparison focused on the effect of spatial layout rather than material quantity.
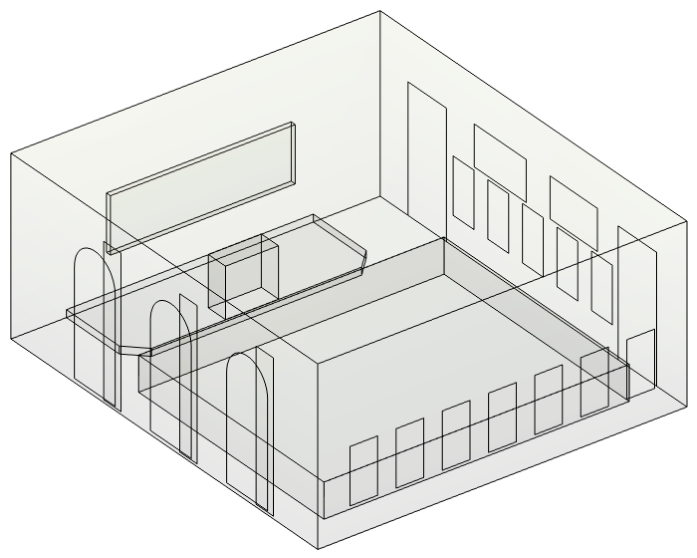
Arrangement Method A (baseline group): Based on the principle of balanced sound control across multiple interfaces, 5 panels were uniformly installed on the side walls and 7 panels on the rear wall, with a spacing of 400 mm between panels. The lower edge of all panels was 625 mm from the ground, corresponding to the ear height of seated students, as shown in Figure 4. This scheme simulates the uniform distribution strategy of sound-absorbing materials on the walls of conventional classrooms. By installing panels on both side walls and rear wall simultaneously, it achieves synergistic control over lateral reflected sound from side walls and long-path reflected sound from the rear wall, avoiding sound field imbalance caused by panel installation on a single interface, and meets the basic requirements for full-space sound absorption in ordinary classrooms.
Arrangement Method B (concentrated group): Following the principle of enhanced sound absorption on specific interfaces, all 12 panels are centrally installed on the rear wall, adopting a double-layer horizontal arrangement (6 panels in the upper layer and 6 in the lower layer). The horizontal spacing between panels is set to 160 mm, and the vertical spacing between layers is 500 mm. The lower edge of the lower-layer panels is 625 mm from the ground, while the upper edge of the upper-layer panels is 625 mm from the top of the rear wall, ensuring a balanced overall layout within the rear wall, as shown in Figure 5. This scheme covers an area of 8.64 m2 (accounting for 30% of the total rear wall area of 28.8 m2). Through the compact and regular double-layer arrangement, it fully utilizes the rear wall area, specifically enhancing the absorption efficiency of long-path reflected sound. Additionally, it avoids panels exceeding the wall boundaries, ensuring the feasibility of both the simulation model and actual construction, and is suitable for classroom acoustic optimization scenarios where speech clarity in the rear row is insufficient.
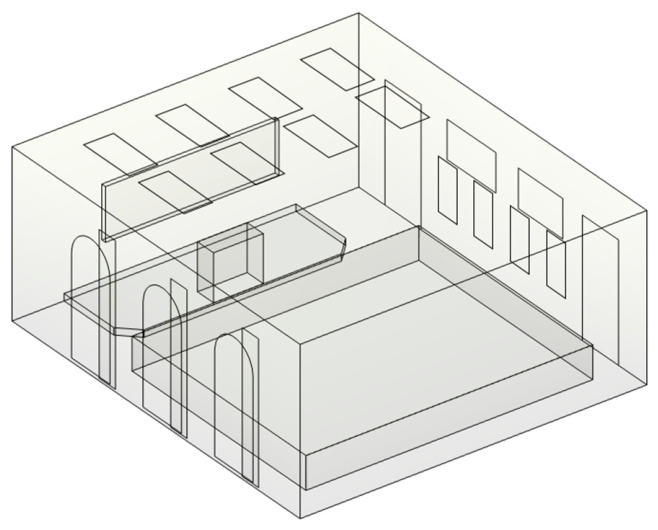
Arrangement Method C (dispersed group): Based on the principle of targeted improvement of multi-position interfaces, only 4 panels are installed on one side wall, with the lower edge of the panels 625 mm from the ground and a horizontal spacing of 500 mm between adjacent panels. Meanwhile, 8 panels are uniformly installed along the classroom in the ceiling area above the podium, with a spacing of 800 mm between adjacent panels, as shown in Figure 6. This scheme, through the multi-dimensional sound absorption layout of side walls and ceiling, not only achieves horizontal uniform sound absorption using the limited space of the single side wall but also breaks the reflection path of high-frequency sound at the top via ceiling panels, thereby improving the uniformity of the classroom in the longitudinal (front–rear) direction and the height direction of the sound field. It specifically addresses the problem of local speech interference caused by high-frequency sound focusing, making it suitable for classroom acoustic optimization scenarios with concentrated high-frequency sound reflection.
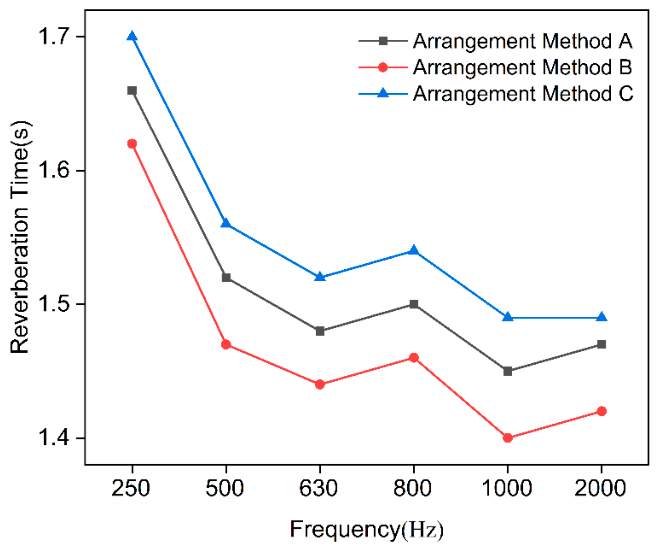
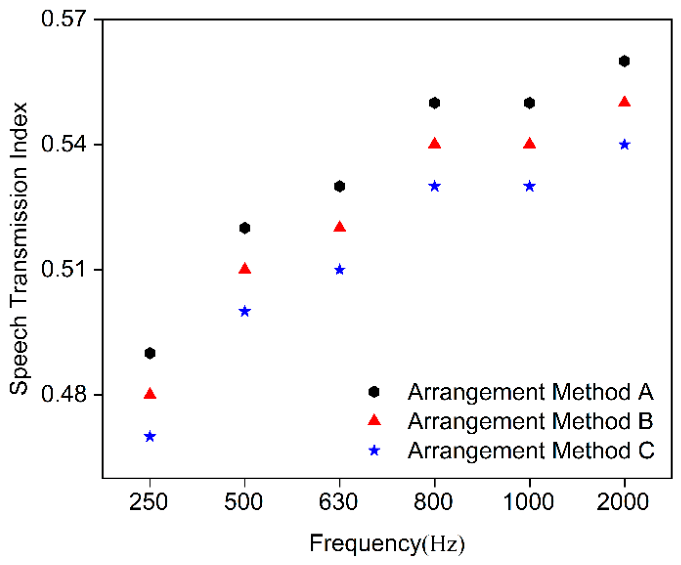
The simulation framework was designed to ensure reproducibility, with all boundary conditions, material parameters, and source configurations explicitly defined for replication in similar classroom environments. Under the same layout of the sound source (directly in front of the podium, with a sound pressure level of 100 dB) and measurement points (8 student seating areas), the Reverberation Time and Speech Transmission Index of the three arrangement methods were calculated and compared, with the results presented in Figure 7 and Figure 8.
The results show that Arrangement Method A yields an average reverberation time of 1.48 s, with values ranging from 1.45 s to 1.66 s across the investigated frequencies. The highest value occurs at the low frequency of 250 Hz (1.66 s), while the lowest value appears at 1000 Hz (1.45 s), showing an overall decrease in reverberation time with increasing frequency. For Arrangement Method B, in which all panels are concentrated on the rear wall, the average reverberation time decreases to 1.42 s, representing a 4.1% reduction compared with Method A. Reverberation time values at all frequencies are lower than those of Method A, with more noticeable reductions in the mid- to high-frequency range (630–1000 Hz). For example, the reverberation time at 1000 Hz is 1.40 s, which is 3.4% lower than that of Method A. However, because side-wall reflections remain insufficiently controlled, the difference in reverberation time between the front and rear zones is relatively large, indicating poorer sound field uniformity.
For Arrangement Method C, which introduces a multidimensional sound-absorbing layout on the side wall and ceiling, the average reverberation time is 1.51 s, slightly higher than that of Method A (by 2.0%). Nevertheless, the reverberation time distribution across the measurement points is more uniform, with smaller differences between the front and rear areas at the same frequency. This indicates that multidimensional placement is beneficial for sound field uniformity, although it also increases construction difficulty and cost.
The results show that Arrangement Method A yields an average speech transmission index of 0.53, with values ranging from 0.48 to 0.55 across the investigated frequencies. The value is lowest at 250 Hz (0.48) and highest at 2000 Hz (0.55), showing an overall increase with frequency. For Arrangement Method B, which concentrates the panels on the rear wall, the average speech transmission index increases to 0.54, representing an improvement of 1.9% compared with Method A. Values at all frequencies are higher than those of Method A, with more obvious improvements in the mid- to high-frequency range (630–2000 Hz). For example, the speech transmission index at 2000 Hz reaches 0.56, which is 1.8% higher than that of Method A. However, because side-wall reflections are not sufficiently controlled, the difference between the front and rear rows at the same frequency is slightly larger than that in Method A.
For Arrangement Method C, the average speech transmission index is 0.52, which is slightly lower than that of Method A (by 1.9%), but its spatial distribution is more uniform across the measurement points. This indicates that multidimensional placement improves the uniformity of speech intelligibility, although it is associated with increased construction complexity.
Overall, the three arrangement methods show different acoustic priorities. Arrangement Method B performs best in reducing reverberation time, with an average value of 1.42 s and a slightly higher mid- to high-frequency speech transmission index than Method A. However, because it leaves side-wall reflections insufficiently controlled, the resulting sound field uniformity is poorer, making it more suitable for spaces where reverberation time is the dominant concern but spatial consistency is less critical.
Arrangement Method C has a slightly higher average reverberation time (1.51 s), but the distributions of reverberation time and speech transmission index across the measurement points are more uniform. This makes it potentially suitable for smart classrooms or other teaching spaces with particularly high requirements for sound field uniformity, although the ceiling installation increases implementation difficulty.
Arrangement Method A does not achieve the best performance for a single indicator, but it provides the most balanced overall behavior in terms of reverberation time control, speech intelligibility, and sound field uniformity, while also remaining easy to install and adaptable to common rectangular classrooms. Therefore, it is the most reasonable baseline scheme for practical classroom acoustic regulation.
The frequency-dependent changes in both reverberation time and speech transmission index can be explained by the combined effects of OSB absorption characteristics and classroom reflection-path control. At mid- and high-frequency bands, OSB panels can dissipate part of the reflected sound energy through viscous and thermal losses within their porous and fibrous structure, thereby reducing late reflections and shortening reverberation time. Meanwhile, the reduction in excessive reflected energy improves the temporal clarity of speech signals, which contributes to the increase in STI, especially in the frequency range important for speech intelligibility.
From the perspective of acoustic path control, the superiority of Arrangement Method A can be explained by the interaction between classroom geometry, source position, and dominant reflection paths. In the tested rectangular classroom, the sound source was located in front of the podium, and the main receiver positions were distributed in the student seating area. Under this condition, lateral reflections from the side walls and long-path reflections from the rear wall are two important contributors to reverberation build-up and speech masking. If only the rear wall is treated, as in Arrangement Method B, rear-wall reflections can be reduced, but side-wall early reflections remain insufficiently controlled. If part of the panels are transferred to the ceiling, as in Arrangement Method C, the vertical distribution of sound energy can be improved, but the effective control of lateral and rear-wall reflections is weakened.
Arrangement Method A distributes the OSB panels on both the side walls and rear wall, allowing simultaneous control of lateral early reflections and long-path rear-wall reflections. The side-wall panels reduce strong early reflections arriving at the seating area from both sides, while the rear-wall panels attenuate reflected sound returning from the back of the classroom. This combined treatment reduces the accumulation of reflected sound energy and weakens local sound focusing caused by repeated reflections between parallel walls. As a result, the sound energy is redistributed more uniformly across the seating area, leading to a balanced improvement in reverberation time, speech transmission index, and sound field uniformity.
Therefore, the acoustic regulation mechanism of the distributed layout is not simply sound absorption alone, but the coordinated control of early reflection paths, long-path reflected sound, and spatial sound energy redistribution. This explains why Arrangement Method A does not produce the lowest reverberation time for a single indicator, but provides the most stable and balanced acoustic performance under the constraint of fixed OSB panel quantity.

4.2. Analysis of the Impact of OSB Panels on Indoor Sound Field Uniformity

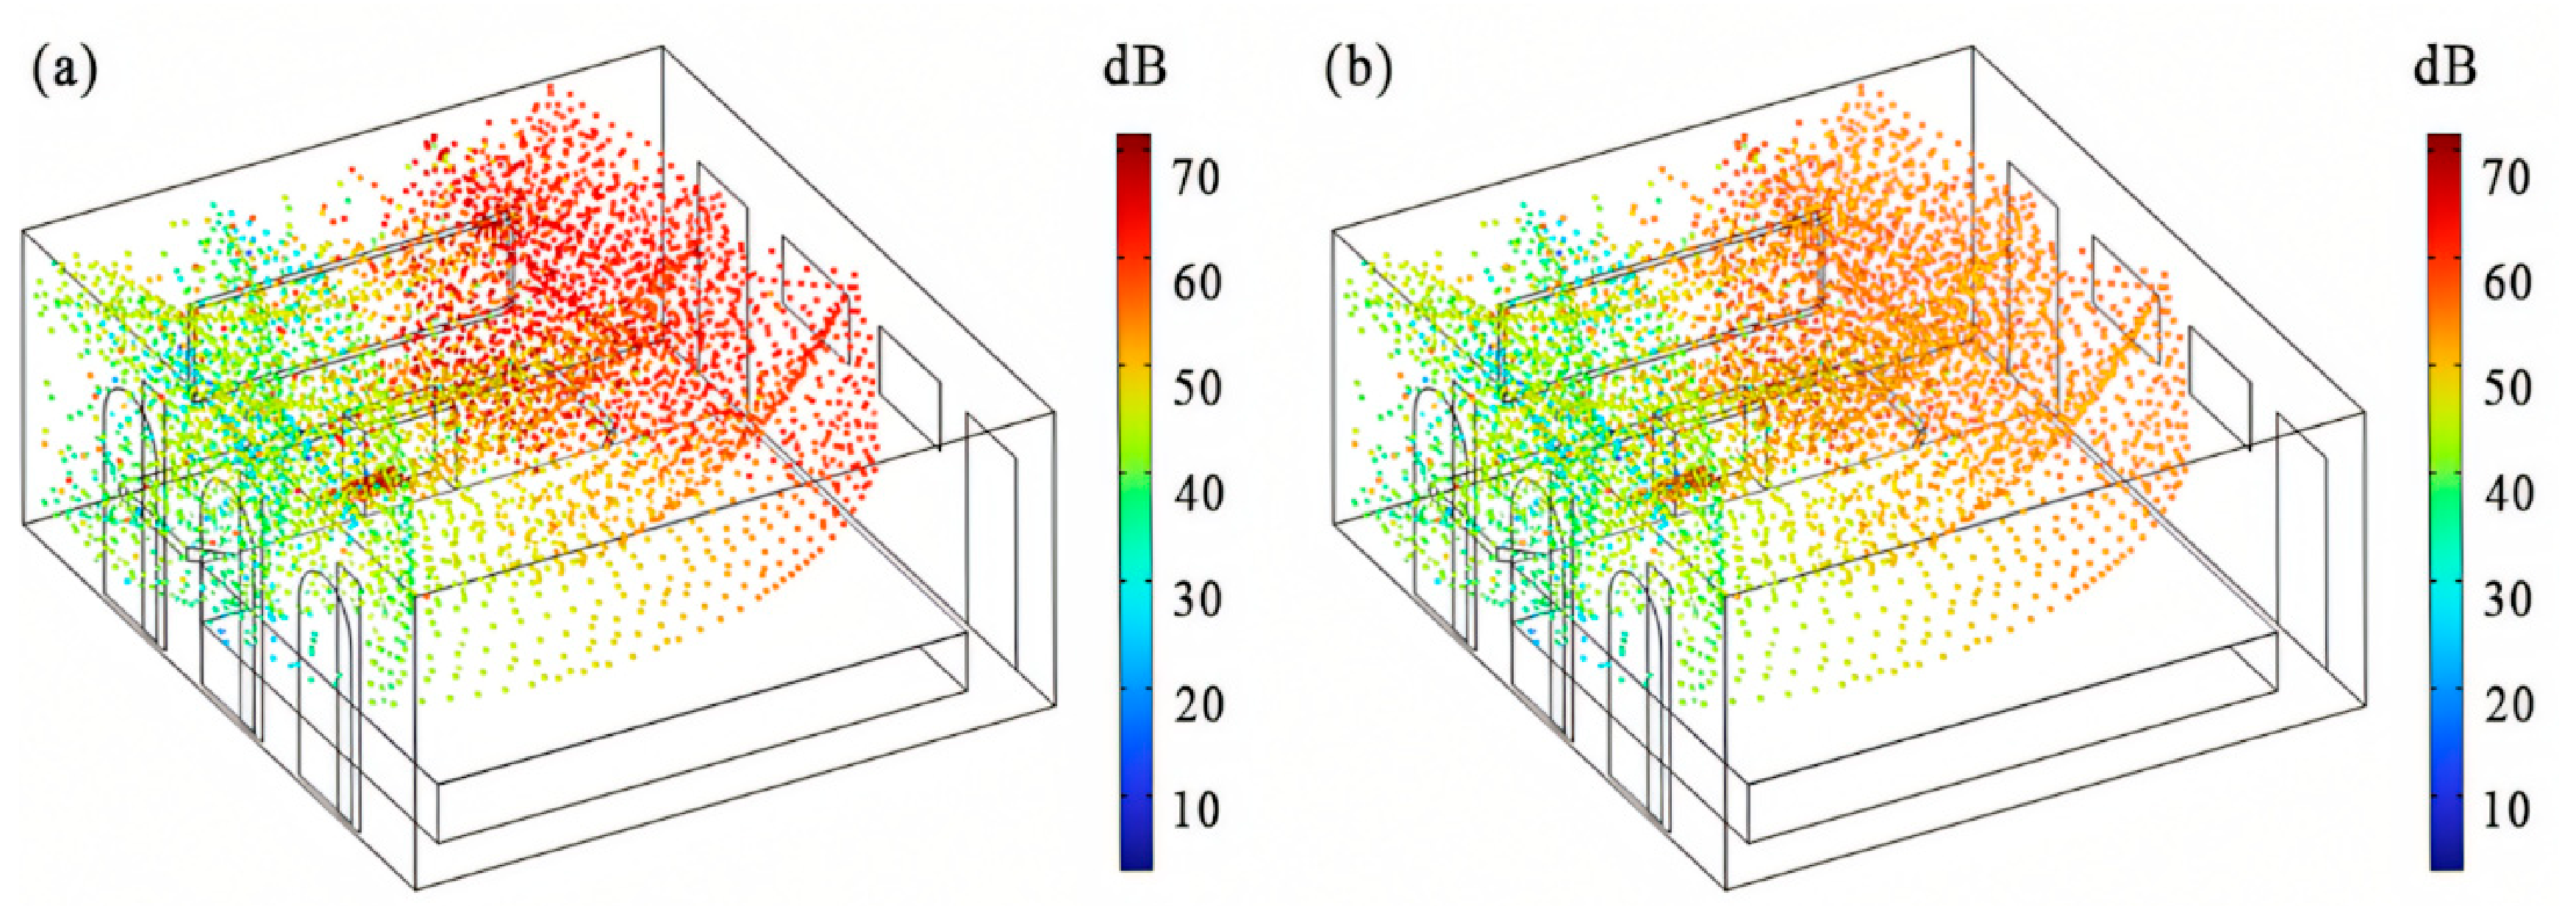
Based on the ray acoustics interface in the acoustics module of COMSOL Multiphysics, sound propagation in the classroom was simulated at 1 kHz. Following the ray-acoustics approach, sound particles were emitted from the source in all directions. When they encountered boundaries such as walls, floor, and ceiling, they were reflected according to the assigned surface absorption coefficients, with energy loss occurring at each reflection. The resulting sound field distribution is shown in Figure 9.
A comparison of the ray positions at 20 ms before (Figure 9a) and after (Figure 9b) modification reveals significant differences in sound energy distribution patterns.
High-energy regions (red: 60–70 dB): Before modification (Figure 9a), high-energy rays were concentrated in the right wall and ceiling areas of the classroom, forming obvious sound energy concentration zones; after modification (Figure 9b), the proportion of red in high-energy regions decreased significantly, replaced by a distribution dominated by orange (50–60 dB). This indicates that the 15 mm thick OSB panels effectively absorbed high-energy reflected sound and reduced peak sound pressure levels.
Sound energy uniformity: Before modification, the color gradient of rays changed sharply, with a narrow transition zone from red (high energy) to blue (low energy), reflecting poor sound field uniformity; after modification, the colors were mainly orange and yellow (40–60 dB), and the differences in sound pressure levels between regions narrowed. In particular, the sound energy distribution on the right wall became smoother, demonstrating that the layout design of OSB panels optimized the reflection paths of sound waves and improved sound field uniformity.
Ray density: Before modification, the ray density on the right wall was extremely high, forming dense energy accumulation; after modification, the overall ray density decreased, and the distribution became more dispersed. This indicates that OSB panels, through sound absorption and scattering effects, reduced multiple reflections of sound waves on the walls, allowing sound energy to diffuse more uniformly throughout the classroom space.
In summary, the optimized layout of 15 mm thick OSB panels significantly improved the sound pressure level distribution and ray energy characteristics in the classroom at 20 ms, achieving the attenuation of high-energy sound and the enhancement of sound field uniformity, thus demonstrating the effectiveness of the proposed layout strategy in improving classroom acoustic performance.
To further supplement the quantitative analysis of sound field uniformity, the spatial fluctuation of RT and STI at the eight receiver positions was calculated using the same mean-square-deviation principle as the SPUI. At 630 Hz, the RT-based spatial fluctuation value decreased from 0.0170 s2 before treatment to 0.00374 s2 after treatment, corresponding to a reduction of approximately 78.0%. The spatial range of RT also decreased from 0.46 s to 0.19 s. Similarly, the STI-based spatial fluctuation value decreased from 0.00146 before treatment to 0.000325 after treatment, corresponding to a reduction of approximately 77.8%, while the spatial range of STI decreased from 0.13 to 0.06.
These quantitative results are consistent with the ray-acoustics visualization shown in Figure 9. Before acoustic treatment, high-energy sound rays were concentrated near the right wall and ceiling, and the sound pressure level distribution showed clear spatial non-uniformity. After the installation of the OSB panel, the high-energy regions were weakened, and the ray distribution became more dispersed. This indicates that the proposed layout not only reduced excessive reflected sound energy but also improved the spatial consistency of reverberation time and speech intelligibility among different receiver positions.

4.3. Classroom Environment Regulation Based on Simulation Models

During the field measurement stage, all OSB panels were fixed to the side walls and rear wall of the classroom in accordance with the selected simulation layout so that the effects on reverberation time, speech transmission index, and sound pressure level could be examined under actual conditions. Maintaining consistency between the experimental installation and the simulation model was essential for validating the numerical results.
During installation, the panels were directly fixed to the wall using screws in order to reduce experimental cost and simplify implementation. This approach ensured stable installation while minimizing additional variables that could influence the acoustic measurements. It also reflects a practical installation method that could be adopted in actual teaching environments.
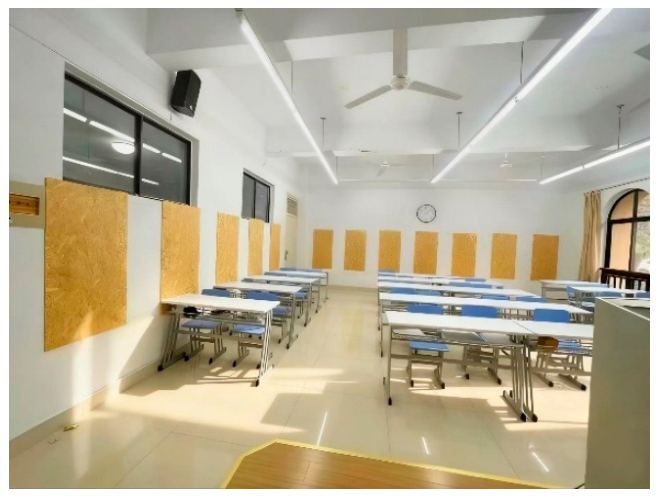
After completing the installation of the specimens, the experiment measured Reverberation Time and Speech Transmission Index, and conducted a comparative analysis of the acoustic performance of each group of specimens in the actual environment. The test measurement process and specimen installation are shown in Figure 10.
A comparison of the classroom reverberation time data before and after renovation, as shown in Table 6, indicates that the 15 mm thick OSB panels exert a clear regulatory effect on the classroom sound field. Statistical analysis was performed using paired t-tests at a 95% confidence level, based on the reverberation time values measured at eight positions across all frequency bands. The results indicate that the reduction in RT is statistically significant (p < 0.05). This effect can be observed in three aspects: the overall reduction in reverberation time, the improvement across multiple frequency bands, and the enhancement of sound field uniformity.
In terms of the average reverberation time, the untreated classroom showed values ranging from 1.50 s to 1.73 s across the investigated frequencies, with the highest average value occurring at 250 Hz (1.73 s) and the lowest at 1000 Hz (1.50 s). After treatment, the average reverberation time decreased to a range of 1.38 s to 1.59 s. The average reverberation time at 250 Hz decreased to 1.59 s (an 8.1% reduction), that at 2000 Hz decreased to 1.38 s (an 11.0% reduction), and that at 500 Hz fell from 1.64 s to 1.48 s (a 9.8% reduction). Overall, the OSB treatment achieved full-frequency optimization from the mid-low to high-frequency range.
In terms of spatial consistency, the untreated classroom exhibited obvious fluctuations in reverberation time among measurement points at the same frequency. For example, at 630 Hz, the reverberation time ranged from 1.35 s at one point to 1.81 s at another, corresponding to a spatial range of 0.46 s and indicating poor sound field uniformity. After treatment, this variation was significantly reduced. At 630 Hz, the spatial range decreased to 0.19 s, and the RT-based spatial fluctuation value decreased from 0.0170 s2 to 0.00374 s2. At 2000 Hz, the reverberation time at all measurement points remained within the range of 1.33–1.47 s. These results indicate that the 15 mm thick OSB panels effectively improved the spatial consistency of reverberation time and the uniformity of sound field distribution.
A comparison of the speech transmission index data between the untreated classroom and the classroom treated with 15 mm thick OSB panels, as shown in Table 7, indicates that the OSB panels improved speech clarity in the classroom. To further verify the statistical significance of this improvement, paired t-tests were performed using the STI values measured before and after OSB panel installation at the eight receiver positions across all investigated frequency bands. The results showed that the overall increase in STI after treatment was statistically significant at the 95% confidence level, with p < 0.001. Based on all receiver-position and frequency-band data, the mean STI increased from approximately 0.52 before treatment to approximately 0.56 after treatment. This confirms that the improvement in speech transmission performance was not only reflected in the average STI values but also supported by statistical analysis. The improvement can be observed in three aspects: an overall increase in STI, enhanced performance in key speech frequency bands, and improved spatial uniformity of intelligibility. In terms of the average speech transmission index, the untreated classroom showed values ranging from 0.48 to 0.54 across the investigated frequencies, with the lowest value at 250 Hz and the highest at 1000 Hz, corresponding overall to a moderate intelligibility level. After treatment, the average STI increased to a range of 0.52–0.58. The average STI at 250 Hz increased to 0.52 (an 8.3% increase), that at 1000 Hz increased to 0.57 (a 5.6% increase), and that at 2000 Hz increased from 0.53 to 0.58 (a 9.4% increase). Across all investigated frequencies, the STI values moved closer to the threshold generally associated with good speech intelligibility.
In the key speech frequency range of 500–2000 Hz, the untreated classroom had average STI values of 0.50, 0.54, and 0.53 at 500 Hz, 1000 Hz, and 2000 Hz, respectively. After treatment, these values increased to 0.55, 0.57, and 0.58. The largest relative increase occurred at 500 Hz, where STI improved by 10%. This improvement can be attributed to the ability of OSB panels to absorb part of the reflected acoustic energy and reduce late reflections that interfere with speech signals, which is particularly important for teacher–student communication in classrooms.
In terms of spatial consistency, the untreated classroom showed substantial STI variation among measurement points at the same frequency. For example, at 630 Hz, STI ranged from 0.46 to 0.59, corresponding to a spatial range of 0.13 and indicating clear variation in speech transmission clarity across the room. After treatment, this difference decreased to 0.06 at the same frequency, and the STI-based spatial fluctuation value decreased from 0.00146 to 0.000325. At 2000 Hz, all measurement points remained within the range of 0.56–0.60. These results indicate that the 15 mm thick OSB panels reduced positional differences in speech intelligibility by optimizing the sound field distribution.
In summary, the application of 15 mm thick OSB panels not only improved the overall speech transmission index of the classroom but also enhanced performance in key speech frequency bands. These findings confirm the practical value of OSB panels for improving speech communication conditions in classrooms.
These findings are consistent with previous studies indicating that the introduction of sound-absorbing treatments can significantly reduce reverberation time and improve speech intelligibility in educational spaces. However, the present study extends earlier work in two ways. First, it demonstrates that OSB panels can achieve measurable acoustic improvements despite their relatively simple structure and low cost. Second, it highlights that spatial configuration plays a decisive role in determining acoustic performance under constrained material conditions.
This study has several limitations that should be acknowledged. First, although the study is based on a single classroom case, the analysis focuses on fundamental acoustic mechanisms related to reflection path control and energy redistribution, which enhances the transferability of the proposed strategy. This provides a theoretical basis for extending the framework to different classroom geometries in future studies. Second, the acoustic properties of OSB were simplified as isotropic in the simulation, whereas the actual material may exhibit directional variability. Third, the measurements were conducted in an unoccupied classroom, and the presence of students could alter both sound absorption and scattering behavior. Future research should therefore extend the present framework to different classroom types, incorporate occupied-room conditions, and explore the integration of OSB with hybrid acoustic materials.
From an engineering perspective, the present study highlights that effective classroom acoustic optimization does not necessarily depend on increasing the amount of sound-absorbing material; instead, it depends strongly on the strategic placement of materials along dominant reflection paths. The results indicate that intercepting lateral and rear reflections simultaneously can produce a more balanced improvement in reverberation time, speech intelligibility, and sound field uniformity. This finding suggests a paradigm shift from material-oriented design to layout-oriented design in classroom acoustics. The validated simulation–measurement workflow proposed in this study can therefore serve as a practical design tool for architects and engineers, enabling acoustic performance prediction and optimization before implementation, particularly in cost-sensitive renovation projects.

4.4. Validation of the Simulation Model Based on Measured Data

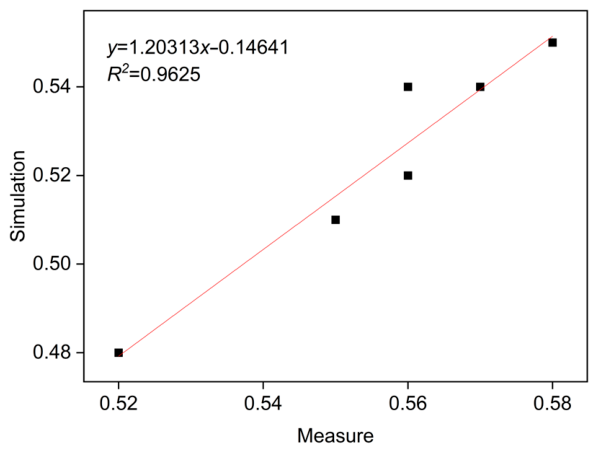
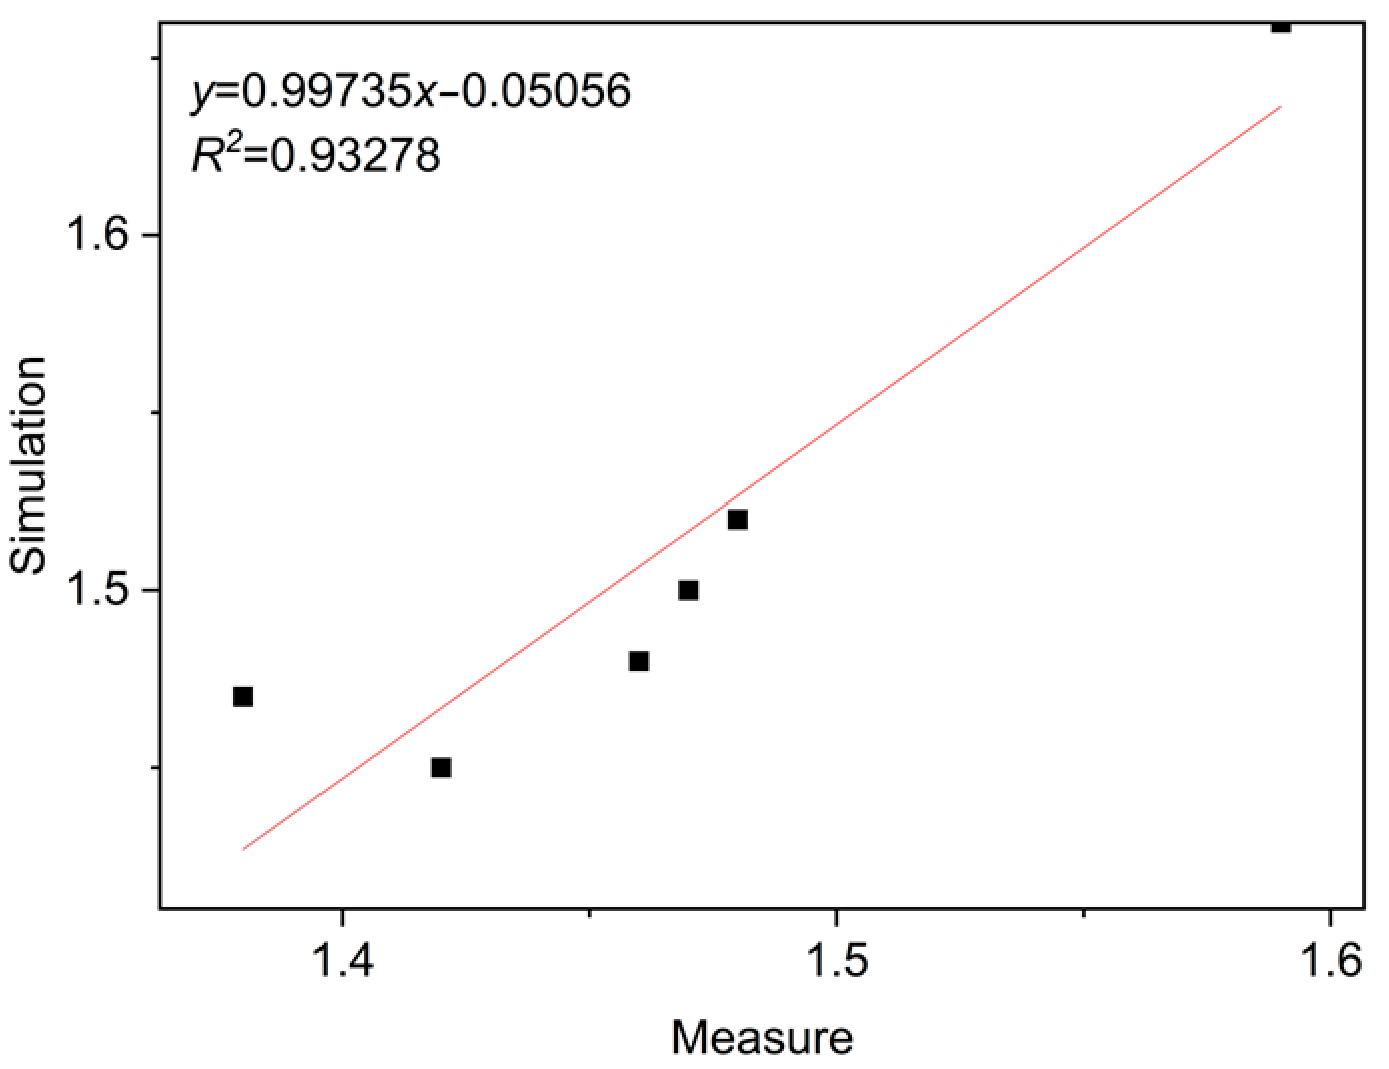
After the simulation results and field measurement data had been obtained, the reliability of the COMSOL-based acoustic model was evaluated by comparing the simulated and measured results. This validation was presented after the layout simulation and field measurement sections because the correlation analysis required paired simulation–measurement datasets. Linear regression analysis was used to quantify the agreement between the two datasets. As shown in Figure 11 and Figure 12, significant correlations were observed for both reverberation time and speech transmission index. Although the fitted slopes were less than 1, the coefficients of determination (R2) were both greater than 0.9, indicating that the COMSOL ray-acoustics simulation reproduced the measured acoustic trends with high consistency and was reliable for comparing the relative acoustic effects of different OSB panel layout strategies. The simulated values were slightly lower than the measured values, which can be attributed mainly to the idealized assumptions adopted in the simulation, including simplified environmental conditions, possible instrument error, furniture arrangement differences, and minor inhomogeneities of material surfaces in the actual classroom.
Although the ray-acoustics simulation and measured data show good consistency overall, the remaining differences still require attention. These differences can be attributed to multiple factors, including modeling simplifications, limitations in the representation of material properties, and disturbances during field measurements. OSB panels are anisotropic materials whose pore structure, sound absorption, and scattering properties may vary with direction. In the present simulation, however, uniform sound absorption coefficients were used for simplification because detailed directional acoustic parameters were not available. In addition, several architectural details were simplified during modeling; for example, desks, chairs, and seating areas were represented as rectangular geometries with a height of 0.75 m, and the classroom was treated as unoccupied. Although these assumptions reduce computational complexity, they do not fully reproduce the detailed reflection and scattering behavior of the actual room.
At the measurement stage, external noise infiltration through the large classroom windows may have reduced the signal-to-noise ratio and affected the accuracy of reverberation time measurements. In addition, small deviations in receiver orientation may have contributed to fluctuations in the measured reverberation time and speech transmission index, particularly at higher frequencies where the wavelength is shorter. Although temperature and humidity were controlled, minor transient variations may still have slightly altered the sound absorption behavior of the OSB panels.
Despite these limitations, the agreement between simulation and measurement indicates that the proposed model is sufficiently robust for comparative design evaluation. Future studies can further improve the framework by incorporating anisotropic acoustic parameters of OSB, considering occupied classroom conditions, and extending the analysis to different room sizes and teaching scenarios. In this sense, the present study should be understood not only as a material evaluation but also as a methodological step toward performance-oriented acoustic design using wood-based panels.


5. Conclusions

This study demonstrates that 15 mm thick OSB panels can effectively improve classroom acoustic performance when combined with appropriate spatial layout strategies. Among the three investigated configurations, Arrangement Method A, with OSB panels distributed on both the side walls and the rear wall, provided the most balanced acoustic performance. The simulation results showed that Arrangement Method A achieved an average reverberation time of 1.48 s and an average speech transmission index of 0.53, while maintaining better spatial consistency than the concentrated rear-wall layout.
Field measurements further confirmed the effectiveness of the selected layout. After the installation of 15 mm thick OSB panels, the average reverberation time values at the investigated frequency bands decreased from 1.50–1.73 s before treatment to 1.38–1.59 s after treatment. The average STI values at the investigated frequency bands increased from 0.48–0.54 to 0.52–0.58, with improvements of 8.3% at 250 Hz, 10.0% at 500 Hz, 5.6% at 1000 Hz, and 9.4% at 2000 Hz.
The OSB panel treatment also improved sound field uniformity. At 630 Hz, the spatial range of reverberation time among receiver positions decreased from 0.46 s before treatment to 0.19 s after treatment, while the RT-based spatial fluctuation value decreased from 0.0170 s2 to 0.00374 s2, corresponding to a reduction of approximately 78.0%. The STI range at the same frequency decreased from 0.13 to 0.06, and the STI-based spatial fluctuation value decreased from 0.00146 to 0.000325, corresponding to a reduction of approximately 77.8%. These results indicate that positional variations in reverberation time and speech intelligibility were both reduced.
The agreement between simulation and measurement was also verified. Linear regression analysis showed that the coefficients of determination for both reverberation time and STI were greater than 0.9, confirming that the COMSOL-based simulation workflow can reproduce the measured acoustic trends with high consistency.
Overall, these quantitative results indicate that effective classroom acoustic optimization does not depend only on increasing the amount of sound-absorbing material, but also on the strategic placement of materials along dominant reflection paths. The proposed layout-oriented acoustic design framework provides a practical and transferable approach for cost-effective acoustic retrofitting in educational buildings.

Author Contributions

S.Y. contributed to conceptualization, methodology, data curation, and writing—original draft. H.W. contributed to resources, supervision, and software. L.Z. and Z.L. contributed to conceptualization, writing—review and editing, and funding acquisition. All authors have read and agreed to the published version of the manuscript.

Funding

This study was financially supported by the National Natural Science Foundation of China (grant No. 32271781). Soft Science Research Program of Zhejiang Province (Grant No. 2026C35051).

Data Availability Statement

The data that support the findings of this study are available from the corresponding author upon reasonable request.

Conflicts of Interest

The authors declare no conflicts of interest.

References

  1. Yan, S.; Zhang, L.; Zhang, L.; Qi, F.; Liu, Z. Research Progress on Indoor Acoustic Regulation by Wooden Materials. China For. Prod. Ind. 2024, 61, 48–53. [Google Scholar]
  2. Juan, Y.K.; Chen, Y. The influence of indoor environmental factors on learning: An experiment combining physiological and psychological measurements. Build. Environ. 2022, 221, 109299. [Google Scholar] [CrossRef]
  3. Fang, Y.; Luo, X.; Lu, J. A review of research on the impact of the classroom physical environment on schoolchildren’s health. J. Build. Eng. 2023, 65, 105430. [Google Scholar] [CrossRef]
  4. Mogas-Recalde, J.; Palau, R.; Marquez, M. How Classroom Acoustics Influence Students and Teachers: A Systematic Literature Review. J. Technol. Sci. Educ. 2021, 11, 245–259. [Google Scholar] [CrossRef]
  5. Shield, B.; Conetta, R.; Dockrell, J.; Connolly, D.; Cox, T.; Mydlarz, C. A survey of acoustic conditions and noise levels in secondary school classrooms in England. J. Acoust. Soc. Am. 2015, 137, 177–188. [Google Scholar] [CrossRef]
  6. Chen, Q.; Ou, D. The effects of classroom Reverberation Time and traffic noise on English listening comprehension of Chinese university students. Appl. Acoust. 2021, 179, 108082. [Google Scholar] [CrossRef]
  7. Liu, C.; Zang, Q.; Li, J.; Pan, X.; Dai, H.; Gao, W. The effect of the acoustic environment of learning spaces on students’ learning efficiency: A review. J. Build. Eng. 2023, 79, 107911. [Google Scholar] [CrossRef]
  8. Razali, A.W.; Din, N.B.C.; Yahya, M.N.; Yahya, M.N.; Sulaiman, R. Conceptual Framework of Acoustic Comfort Design Enablers for a Classroom: A Systematic Review. J. Build. Eng. 2024, 95, 110160. [Google Scholar] [CrossRef]
  9. Radosz, J. A Multi-Index Method for Acoustic Quality Assessment of Classrooms. In Occupational Noise and Workplace Acoustics; CRC Press: Boca Raton, FL, USA, 2020; pp. 153–171. [Google Scholar]
  10. Prodi, N.; Visentin, C. A slight increase in Reverberation Time in the classroom affects performance and behavioral listening effort. Ear Hear. 2022, 43, 460–476. [Google Scholar] [CrossRef]
  11. Bistafa, S.R.; Bradley, J.S. Reverberation Time and maximum background-noise level for classrooms from a comparative study of speech intelligibility metrics. J. Acoust. Soc. Am. 2000, 107, 861–875. [Google Scholar] [CrossRef] [PubMed]
  12. Nijs, L.; Rychtarikova, M. Calculating the optimum Reverberation Time and absorption coefficient for good speech intelligibility in classroom design using U50. Acta Acust. United Acust. 2011, 97, 93–102. [Google Scholar] [CrossRef]
  13. Murgia, S.; Webster, J.M.; Cutiva, L.C.C.; Bottalico, P. Systematic review of literature on speech intelligibility and classroom acoustics in elementary schools. Lang. Speech Hear. Serv. Sch. 2023, 54, 322–335. [Google Scholar] [CrossRef] [PubMed]
  14. Choi, Y.J. The intelligibility of speech in university classrooms during lectures. Appl. Acoust. 2020, 162, 107211. [Google Scholar] [CrossRef]
  15. Puglisi, G.E.; Warzybok, A.; Astolfi, A.; Kollmeier, B. Effect of reverberation and noise type on speech intelligibility in real complex acoustic scenarios. Build. Environ. 2021, 204, 108137. [Google Scholar] [CrossRef]
  16. Adams, T. Sound Materials: A Compendium of Sound Absorbing Materials for Architecture and Design; Frame Publishers: Amsterdam, The Netherlands, 2016. [Google Scholar]
  17. Tang, X.; Yan, X. Acoustic energy absorption properties of fibrous materials: A review. Compos. Part A Appl. Sci. Manuf. 2017, 101, 360–380. [Google Scholar] [CrossRef]
  18. Asdrubali, F.; Ferracuti, B.; Lombardi, L.; Guattari, C.; Evangelisti, L.; Grazieschi, G. A review of structural, thermo-physical, acoustical, and environmental properties of wooden materials for building applications. Build. Environ. 2017, 114, 307–332. [Google Scholar] [CrossRef]
  19. Smardzewski, J.; Batko, W.; Kamisiński, T.; Flach, A.; Pilch, A.; Dziurka, D.; Mirski, R.; Roszyk, E.; Majewski, A. Experimental study of wood acoustic absorption characteristics. Holzforschung 2014, 68, 467–476. [Google Scholar] [CrossRef]
  20. Wang, J.; Huang, H.; Peng, L.; Chen, G.; Luan, J. Research Progress on Wooden Sound-Absorbing Materials. Wood Process. Mach. 2015, 26, 49–52. [Google Scholar]
  21. Bucur, V. The Acoustics of Wood; CRC Press: Boca Raton, FL, USA, 2017. [Google Scholar]
  22. Bucur, V. Wood and Wood-Based Materials in Architectural Acoustics. In Acoustics of Wood; Springer: Berlin/Heidelberg, Germany, 2006; pp. 21–36. [Google Scholar]
  23. Smardzewski, J.; Kamisiński, T.; Dziurka, D.; Mirski, R.; Majewski, A.; Flach, A.; Pilch, A. Sound absorption of wood-based materials. Holzforschung 2015, 69, 431–439. [Google Scholar] [CrossRef]
  24. Berardi, U.; Iannace, G. Acoustic characterization of natural fibers for sound absorption applications. Build. Environ. 2015, 94, 840–852. [Google Scholar] [CrossRef]
  25. Liu, Z.; Shen, J. Vibration Characteristics of Resonance Board Materials and Acoustic Quality of Pianos; Science Press: Beijing, China, 2009. [Google Scholar]
  26. Liu, Z.; Li, X.; Yu, Y.; Wan, K.; Hao, Q.; Wang, Y.; Wang, C. Effect of wood flour and compatibilizer content on acoustic and vibration properties of wood-plastic composites. For. Eng. 2022, 38, 62–67. [Google Scholar]
  27. Caniato, M.; Marzi, A.; da Silva, S.M.; Gasparella, A. A review of the thermal and acoustic properties of materials for timber building construction. J. Build. Eng. 2021, 43, 103066. [Google Scholar] [CrossRef]
  28. Chang, L.; Wu, Z. Study on sound absorption performance of hollow particleboard for indoor wood products. J. Nanjing For. Univ. Nat. Sci. Ed. 2011, 54, 56. [Google Scholar]
  29. Dai, Z.; Xue, J.; Wang, S. Effects of wood texture and color on aesthetic pleasure: Two experimental studies. Int. J. Reconfig. Embed. Syst. 2023, 12, 125. [Google Scholar] [CrossRef]
  30. Barmpoutis, P.; Dimitropoulos, K.; Barboutis, I.; Grammalidis, N.; Lefakis, P. Wood species recognition through multidimensional texture analysis. Comput. Electron. Agric. 2018, 144, 241–248. [Google Scholar] [CrossRef]
  31. Zhong, X. New progress in sound-absorbing materials. In Proceedings of the 9th National Conference on Building Physics: Green Building and Building Physics; China Architecture & Building Press: Beijing, China, 2004. [Google Scholar]
  32. Iannace, G.; Maffei, L.; Trematerra, P. On the use of “green materials” for the acoustic correction of classrooms. In Proceedings of the EURONOISE; European Acoustics Association: Prague, Czech Republic, 2012; pp. 89–94. [Google Scholar]
  33. Selim, A.M.; Saeed, D.M. Enhancing the classroom acoustic environment in Badr University, Egypt: A case study. Build. Acoust. 2022, 29, 577–596. [Google Scholar] [CrossRef]
  34. Torabia, M.R.; Loghmanib, A. Acoustical simulation, design and experimental investigation of a classroom: A case study. J. Theor. Appl. Vib. Acoust. 2021, 7, 1–20. [Google Scholar]
  35. Russo, D.; Ruggiero, A. Choice of the optimal acoustic design of a school classroom and experimental verification. Appl. Acoust. 2019, 146, 280–287. [Google Scholar] [CrossRef]
  36. Labia, L.; Shtrepi, L.; Astolfi, A. Improved room acoustics quality in meeting rooms: Investigation on the optimal configurations of sound-absorptive and sound-diffusive panels. Acoustics 2020, 2, 451–473. [Google Scholar] [CrossRef]
  37. Mir, S.H.; Abdou, A.A. Investigation of sound-absorbing material configuration of a smart classroom utilizing computer modeling. Build. Acoust. 2005, 12, 175–188. [Google Scholar] [CrossRef]
  38. Ribeiro, R.S.; Amlani, A.M.; de Conto, J.; Schwerz, B.G.; Amarilla, R.S.D.; Sant’aNa, L.H.; Avelar, M.; Catai, R.E.; Matoski, A. Acoustical treatment characterization of a classroom with wood-based composites. Appl. Acoust. 2021, 178, 107967. [Google Scholar] [CrossRef]
  39. Yan, S.; Zhang, L.; Miao, Y.; Deng, J.; Liu, Z. Research on regulating classroom Reverberation Time by using wood materials. J. Build. Eng. 2025, 103, 112173. [Google Scholar] [CrossRef]
  40. Sabine, W.C. Collected Papers on Acoustics; Harvard University Press: Cambridge, MA, USA, 1922. [Google Scholar]
  41. Eyring, C.F. Reverberation time in “dead” rooms. J. Acoust. Soc. Am. 1930, 1, 217–241. [Google Scholar] [CrossRef]
  42. ISO 3382-2:2008; Acoustics—Measurement of Room Acoustic Parameters—Part 2: Reverberation Time in Ordinary Rooms. ISO: Geneva, Switzerland, 2008.
  43. Wang, S.Y.; Chang, F.C.; Lin, F.C. The amount of wooden material in a closed room and its effect on the reverberation time. J. Wood Sci. 2005, 51, 474–479. [Google Scholar] [CrossRef]
  44. GBJ 88-1985; Specification for Measurement of Sound Absorption Coefficient and Specific Acoustic Impedance by Standing Wave Tube Method. China Standards Press: Beijing, China, 1985.
  45. GB/T 18696.1-2004; Acoustics—Measurement of Sound Absorption Coefficient and Impedance in Impedance Tubes—Part 1: Standing Wave Ratio Method. China Standards Press: Beijing, China, 2004.
  46. Long, M. Architectural Acoustics; Academic Press: Cambridge, MA, USA, 2014. [Google Scholar]
  47. Bistafa, S.R.; Bradley, J.S. Predicting reverberation times in a simulated classroom. J. Acoust. Soc. Am. 2000, 108, 1721–1731. [Google Scholar] [CrossRef] [PubMed]
  48. Liu, X. Building Physics, 2nd ed.; China Architecture & Building Press: Beijing, China, 2000. [Google Scholar]
  49. Dalenback, B.I.; Brown, S. Characterizing rooms regarding Reverberation Time prediction and the sensitivity to absorption and scattering coefficient accuracy. J. Acoust. Soc. Am. 2010, 127, 1752. [Google Scholar] [CrossRef]
  50. Vorlander, M. International round robin on room acoustical computer simulations. In Proceedings of the 15th International Congress on Acoustics (ICA), Trondheim, Norway, 26–30 June 1995. [Google Scholar]
  51. Christensen, C.L.; Rindel, J.H. A new scattering method that combines roughness and diffraction effects. In Proceedings of the Forum Acousticum, Budapest, Hungary, 29 August–2 September 2005; pp. 344–352. [Google Scholar]
Figure 1. A 15 mm thick OSB.
Buildings 16 02159 g001
Figure 2. Schematic Diagram of Classroom Simulation.
Buildings 16 02159 g002
Figure 3. Classroom Spatial Layout (S1: sound source; P1–P8: measurement points).
Buildings 16 02159 g003
Figure 4. Model Diagram of Arrangement Method A.
Buildings 16 02159 g004
Figure 5. Model Diagram of Arrangement Method B.
Buildings 16 02159 g005
Figure 6. Model Diagram of Arrangement Method C.
Buildings 16 02159 g006
Figure 7. Comparison of Reverberation Time for Different OSB Panel Arrangement Methods.
Buildings 16 02159 g007
Figure 8. Comparison of Speech Transmission Index for Different OSB Panel Arrangement Methods.
Buildings 16 02159 g008
Figure 9. Ray positions and sound pressure levels at 20 ms before (a) and after (b) modification with an omnidirectional sound source.
Buildings 16 02159 g009
Figure 10. Installation Effect Diagram of OSB Panels.
Buildings 16 02159 g010
Figure 11. Correlation Analysis of Actual Measurements and Simulated Reverberation Time.
Buildings 16 02159 g011
Figure 12. Correlation Analysis of Actual Measurements and Simulated Speech Transmission Index.
Buildings 16 02159 g012
Table 1. Dimensions of the Specimens.
SpecimenLength/mmWidth/mmThickness/mmDensity/kg/m3
OSB-151200.3600.415837
Table 2. Measured average sound absorption coefficients of 15 mm thick OSB panels.
Frequency/Hz250 Hz500 Hz630 Hz800 Hz1000 Hz2000 Hz
Sound absorption coefficient0.060.080.080.110.140.15
Table 3. Sound Absorption Coefficients.
PositionMaterial250 Hz500 Hz630 Hz800 Hz1000 Hz2000 Hz
Wall surfaceConcrete paint0.050.10.050.060.070.09
DoorHoneycomb panel0.250.010.010.020.020.02
WindowGlass (thickness 0.3 cm)0.200.350.250.180.120.07
FloorTiles0.010.010.010.020.020.02
SeatsWooden chair (plywood for both backrest and seat)0.040.010.020.020.030.04
Table 4. Reverberation Time at Different Positions in the Classroom (P1–P8).
Frequency/HzMeasurement Point_RT/s
P1P2P3P4P5P6P7P8Average
2501.731.801.691.711.771.691.741.711.73
5001.541.671.601.521.751.671.721.681.64
6301.351.601.491.531.681.581.811.681.59
8001.531.511.611.431.651.561.681.601.57
10001.411.551.661.281.541.491.571.541.50
20001.351.491.561.371.51.651.791.691.55
Table 5. Speech Transmission Index at Different Positions in the Classroom (P1–P8).
Frequency/HzMeasurement Point_Speech Transmission Index
P1P2P3P4P5P6P7P8Average
2500.480.460.490.490.470.490.480.490.48
5000.540.490.520.540.480.490.480.490.50
6300.590.520.550.540.490.530.460.490.52
8000.540.550.520.570.500.530.490.520.52
10000.580.530.500.620.540.550.530.530.54
20000.590.550.530.590.550.500.460.490.53
Table 6. Reverberation Time obtained after classroom renovation.
Frequency/HzMeasurement Point_Reverberation Time/s
P1P2P3P4P5P6P7P8Average
2501.551.621.521.541.681.521.651.641.59
5001.471.521.291.471.341.481.651.631.48
6301.391.511.561.501.441.431.501.371.46
8001.331.451.441.531.571.501.471.451.47
10001.271.451.351.471.441.521.411.441.42
20001.401.331.451.431.471.361.381.401.38
Table 7. Speech transmission index obtained after classroom renovation.
Frequency/HzMeasurement Point_Speech Transmission Index
P1P2P3P4P5P6P7P8Average
2500.530.510.540.540.490.540.510.510.52
5000.560.540.610.560.590.560.500.510.55
6300.580.550.530.550.570.560.550.590.56
8000.600.560.570.540.530.550.550.560.56
10000.620.560.590.560.570.540.580.570.57
20000.580.600.560.560.560.600.590.580.58
Disclaimer/Publisher’s Note: The statements, opinions and data contained in all publications are solely those of the individual author(s) and contributor(s) and not of MDPI and/or the editor(s). MDPI and/or the editor(s) disclaim responsibility for any injury to people or property resulting from any ideas, methods, instructions or products referred to in the content.