


Abstract
Accurate evaluation of indoor daylighting performance is essential for improving visual comfort and reducing lighting energy use in office buildings. However, simulation-based daylighting analysis is often too time-consuming to support rapid comparison of multiple design options in early-stage design. To address this issue, this study proposes MTL-Light, an explainable chained multi-task learning framework for fast daylighting performance prediction in typical office units. A parametric simulation dataset was constructed, and multiple representative daylighting indicators were extracted from the spatial distribution of daylight factors on the work plane. MTL-Light was then developed to jointly predict these indicators by modeling their interdependencies within a lightweight multi-task learning architecture. In addition, SHAP was employed to interpret the prediction results by quantifying the marginal contributions of geometric design variables. The results show that, compared with single-task models, MTL-Light achieves higher accuracy and more stable performance across multiple indicators, particularly for metrics sensitive to spatial distribution. Moreover, it reduces daylighting evaluation from minute-level simulation to millisecond-level inference. The interpretability analysis further indicates that room depth and window geometry dominate daylighting performance, while different indicators exhibit different sensitivities to geometric variables.
1. Introduction
Office buildings are a major category of modern public buildings, with persistently high operational energy consumption—lighting typically accounts for a substantial proportion [1]. Enhancing natural light utilization reduces artificial lighting demand, cutting operational energy use while improving visual comfort [2]: natural light offers higher color rendering, a softer illumination environment, reduced visual fatigue, and improved work efficiency, aligning better with human physiological rhythms and health needs [3]. Reliable evaluation and rapid feedback of indoor daylighting performance are therefore of significant engineering value in office building design and optimization.
Indoor daylighting performance is currently evaluated via two primary approaches: on-site measurement and computational simulation. On-site measurement yields highly reliable data in real or physical model environments but requires experimental space construction or access to existing buildings, coupled with long-term illuminance monitoring—this is costly, time-consuming, and ill-suited for systematic comparison of multiple schemes and parameter combinations [4]. In contrast, computational daylighting simulation, valued for its flexibility and lower direct economic cost, has become the mainstream method in academic research and engineering practice [5], enabling quantitative prediction of indoor lighting environments under defined climate and sky model conditions.
However, amid the emphasis on rapid iteration and multi-scheme exploration in early design stages, traditional simulation methods face notable limitations [4,5,6]. First, setting up geometric models, material parameters, and boundary conditions is labor-intensive; high-resolution or year-round simulations incur substantial computational costs and long runtimes [7], leaving conventional workflows unable to provide rapid feedback during conceptual design [8,9]. Second, daylighting simulation demands expertise in building physics and proficiency with specialized software, making it challenging for non-experts to apply in early design—operational complexity can divert attention from daylighting design decisions to software operations [10,11]. Additionally, indoor daylighting performance depends on room geometry, window size and position, surface reflectance, and external obstructions, introducing high-dimensional nonlinear interactions among variables [12]. Ibrahim et al. [13] recently demonstrated that daylighting performance in deep office spaces is governed by the coupled effects of daylight availability, spatial uniformity, glare risk, and outdoor view quality, indicating that daylighting assessment should shift from single-index evaluation toward integrated multi-criteria analysis. Consequently, exhaustive parametric simulations thus become intractable due to combinatorial growth in cases, hindering sensitivity analysis and efficient scheme exploration in practice [14,15]. These constraints relegate natural daylighting analysis to post-project verification in many cases, limiting its role in design-phase decision support.
With the widespread adoption of machine learning (ML) [16] in architectural design, ML-based prediction of indoor daylighting in office buildings offers distinct advantages over simulation-only methods [17]. Data-driven ML surrogates learn the relationship between design parameters and daylighting performance from simulated or measured datasets, enabling near-real-time evaluation of new schemes at minimal computational cost and supporting rapid alternative comparisons. Kumar et al. [18] constructed an ML model using laboratory-measured data, fusing multi-source information from sensors, digital cameras, and EVALGLARE software to improve the robustness of daylighting and glare prediction—focusing on validating ML applicability to real-time measurement data under specific spatial conditions. Ayoub [19] reviewed ML applications for predicting indoor daylighting performance, examining how building typology and climate regions influence predictive performance and highlighting the importance of data quality and feature selection for accuracy and practical relevance in design decision-making. Wagdy et al. [20] proposed an ML method integrating high dynamic range (HDR) images and user subjective feedback to improve glare prediction accuracy in open-plan offices, overcoming limitations of traditional glare assessment. However, this model was trained on only 80 survey data points and is primarily applicable to open-plan offices with low overall illuminance. Radziszewski and Waczyński [21] developed an artificial neural network-based tool, comparing 2763 traditional simulation results with ML predictions—finding that ML models drastically reduce computation time while maintaining small discrepancies with traditional simulations, validating their reliability for early building daylighting assessment.
Despite these advances, existing ML-based daylighting models still suffer from two critical limitations. First, most approaches treat different daylighting indicators as independent prediction tasks, ignoring their inherent physical coupling. Second, the majority of models remain black-box systems, limiting their ability to provide interpretable and actionable design insights [22]. To address these gaps, this study proposes an explainable chained multi-task learning framework that explicitly models inter-task dependencies while enhancing interpretability. SHapley Additive exPlanations (SHAP) [23], a post hoc interpretability method quantifying the contribution of each input variable to predictions, has been widely applied in architecture and structural engineering to improve model transparency and engineering interpretability of results. Mashaly et al. [24] developed a neural network-based tool for predicting daylight performance (SDA) in early design stages, using large-scale climate-based daylight simulation data to enable rapid, globally applicable SDA and ASE predictions. Ngarambe et al. [25] systematically compared various ML algorithms for indoor illuminance prediction and found that, although high prediction accuracy can be achieved, the lack of interpretability remains a key limitation for practical engineering applications. By integrating SHAP into the proposed framework, the influence of geometric design parameters on different daylighting tasks can be explicitly quantified, thereby providing a transparent and reliable basis for design optimization.
Against this background, an interpretable multi-task learning framework is proposed for daylighting performance prediction in office buildings. First, a parametric simulation dataset is constructed under unified climatic and boundary conditions using Ecotect. Room depth and window dimensions are selected as key variables, and four tasks, namely Mean, Min, Max, and , are defined to characterize daylighting performance. Second, a lightweight chained multi-task learning framework is developed, in which predictions from preceding tasks are incorporated as additional features to capture inter-task dependencies. Finally, SHAP is employed for global and local interpretability analysis, revealing the influence of geometric parameters and intermediate predictions and enabling actionable design insights.
2. Methodology
The methodology consists of three core components: parametric daylighting simulation, multi-task prediction, and interpretability analysis. This work aims to achieve efficient modeling and pattern identification of the natural daylighting performance of office buildings while ensuring the consistency of physical simulation. First, a parametric daylighting simulation dataset was constructed based on Autodesk Ecotect Analysis to characterize the daylighting response features of typical office units under different geometric configurations. Second, a lightweight chained multi-task learning framework (MTL-Light) was constructed to jointly predict multiple daylighting tasks, taking into account the multi-task output characteristics of the spatial distribution of daylighting coefficients. Finally, the SHAP interpretability analysis method was introduced to systematically interpret the model prediction results, revealing the influence mechanism of geometric design parameters on different daylighting tasks. The overall framework is shown in Figure 1.
Figure 1.
The framework of the proposed explainable Multi-Task Learning for daylighting.
2.1. Simulation of Indoor Natural Daylighting in Office Buildings
Natural daylighting performance is an important consideration in office building design because it directly affects indoor visual comfort and lighting energy demand [26]. To quantitatively characterize daylighting behavior under different geometric configurations, the solar radiation and daylighting simulation module of Autodesk Ecotect Analysis was employed to perform parametric simulations and obtain the spatial distribution of daylight factor (DF) in typical office units [27].
All simulation cases assumed single-sided daylighting. External obstructions, including trees, shading devices, and surrounding buildings, were neglected, and no interior curtains or other shading elements were considered. The height of the working plane was set to 0.75 m. To ensure consistency with the Chinese Standard for Daylighting Design of Buildings (GB50033-2013) [28], the indoor surface reflectance was specified using intermediate recommended values, namely 0.75 for the ceiling, 0.50 for the walls, and 0.30 for the floor, while the glass transmittance was set to 0.62. The simulated building was assumed to be located in Hangzhou, Zhejiang Province, which belongs to daylight climate zone IV according to the standard. The CIE overcast sky model was adopted for daylighting evaluation. It should be noted that the above simulation settings represent a controlled office unit daylighting scenario. The assumptions of single-sided daylighting, CIE overcast sky, fixed indoor surface reflectance, fixed glass transmittance, and the absence of shading devices or external obstructions were adopted to isolate the influence of the main geometric variables and to maintain consistency among the parametric simulation cases. Therefore, the trained MTL-Light model should be interpreted within the predefined simulation domain. Its direct application to other orientations, climate conditions, sky models, façade systems, shading configurations, surrounding obstruction conditions, or dense urban contexts require additional simulation data and further validation.
According to the minimum daylighting requirement for office buildings in GB50033-2013 [28], and considering the regional correction coefficient , a minimum DF threshold of 3.3% was used as the benchmark for compliance assessment. The work plane was discretized using a regular grid with a resolution of 0.1 m × 0.1 m. Under these unified settings, indoor daylighting performance was characterized by four output indicators: the average daylight factor (Mean), the minimum daylight factor (Min), the maximum daylight factor (Max), and the daylighting-compliance depth, denoted as . Specifically, was calculated from the DF profile along the indoor depth direction perpendicular to the glazing façade. Starting from the glazing façade and moving toward the interior, the farthest point within the first continuous segment satisfying the specified daylighting threshold, i.e., DF ≥ 3.3%, was defined as the boundary of the effective daylighting depth. When the DF profile exhibited non-monotonic fluctuations, only the farthest position of the initial continuous compliant zone was considered valid. Isolated re-compliant regions separated by non-compliant segments were excluded from the calculation of , thereby avoiding overestimation and improving the reproducibility of the indicator. These four indicators were used as the target variables for subsequent predictive modeling and interpretability analysis.
2.2. Machine Learning Model Construction and Training
Data-driven surrogate modeling enables rapid approximation of the relationship between design parameters and daylighting performance, significantly reducing the computational cost of traditional simulations. By learning from simulated or measured data, machine learning (ML) models can efficiently predict daylighting performance for unseen parameter combinations, while supporting feature contribution analysis and interaction exploration for parametric design. To this end, a parametric daylighting simulation dataset for typical office units is constructed, and an interpretable prediction model is developed to enable rapid performance evaluation and sensitivity analysis in early design stages.
After comparing various single-task regression methods, a unified modeling process is established for multi-task natural daylighting prediction, adopting two task strategies: a baseline approach that outputs four tasks (Mean, Min, Max, ) in parallel within a single model; and a chain-based multi-task strategy, defined herein as the MTL-Light framework. Both strategies use room geometry and window size parameters as input features (e.g., D, B, Hw, and their derivatives) and four daylighting evaluation tasks as supervision signals, differing only in task coupling. The Baseline method directly learns the mapping from input x to multi-dimensional output , featuring a simple structure and training process suitable as a unified comparison benchmark. In contrast, MTL-Light explicitly injects inter-task dependencies via “predictive output featureization”: first, ; is then concatenated with original features to form an extended input for predicting ; further, are combined with original features to predict ; finally, joint information from , and original features is used to predict during training. The term “Light” indicates that inter-task coupling is achieved through hierarchical recursion and feature augmentation without introducing complex shared encoders or explicit cross-task interaction modules. This design improves the learnability and prediction stability of extreme-value and threshold-based tasks, while maintaining low implementation complexity.
Model performance is evaluated using the coefficient of determination (), mean squared error (MSE), root mean square error (RMSE), mean absolute error (MAE), mean absolute percentage error (MAPE), and normalized root mean square error (nRMSE). These metrics were used to comprehensively assess explanatory ability, absolute error magnitude, sensitivity to large errors, relative error, and scale-normalized prediction accuracy. For a test set with n samples, let and denote the true and predicted values of the k output. The metrics are defined as follows:
- (1)
- MAE (Mean Absolute Error)
- (2)
- RMSE (Root Mean Squared Error)
- (3)
- (Coefficient of Determination)
- (4)
- MAPE (Mean Absolute Percentage Error)
To improve comparability among output variables with different units and numerical ranges, normalized RMSE (nRMSE) was additionally introduced. It was calculated as follows:
- (5)
- nRMSE (Normalized Root Mean Squared Error)
To ensure a fair comparison, all models were trained and evaluated using the same dataset, input variables, preprocessing workflow, and 80/20 train–test split. Hyperparameter optimization and model selection were performed only within the training set, whereas the independent test set was used solely for final performance evaluation. LightGBM, XGBoost, NeuralNetTorch, and MTL-Light were evaluated under the same validation strategy and comparable hyperparameter search budget. The baseline models were trained as independent single-task regressors for each daylighting indicator, whereas MTL-Light additionally incorporated chained prediction features and stackingbased ensemble fusion to model inter-task dependencies. This setting helps ensure that the observed performance differences mainly arise from the proposed chained multi-task strategy rather than unequal data partitioning, preprocessing, validation strategy, or tuning effort.
2.2.1. Baseline Models
To evaluate the predictive performance of different modeling strategies for daylighting prediction, three regression models were adopted as baseline methods: LightGBM [29], XGBoost [30], and NeuralNetTorch [31]. LightGBM and XGBoost, as tree-based ensemble algorithms, are effective in modeling nonlinear relationships and feature interactions in tabular data, whereas NeuralNetTorch provides a representative neural network-based approach.
All models were implemented using an identical dataset, feature set, preprocessing procedure, and an 8:2 train–test split. Hyperparameter tuning was conducted exclusively on the training set. Model performance was assessed on the test set using MAE, RMSE, R2, and MAPE, enabling comprehensive evaluation of prediction accuracy and error characteristics. Each model is trained and evaluated separately for the four outputs (Mean, Min, Max, ).
2.2.2. MTL-Light
To enable collaborative prediction of Mean, Min, Max, and , and reduce information fragmentation from independent single-task training, the lightweight multi-task framework MTL-Light is proposed (Figure 2). Its core is chained multi-task learning: conditional dependencies between tasks are explicitly injected into subsequent tasks as “intermediate prediction results as features”, allowing the model to leverage global representation information from preceding targets to improve the learnability of subsequent tasks while learning the geometric parameter-light response mapping. Compared with conventional multi-output regressors that predict all targets simultaneously, the chained structure explicitly represents conditional dependencies among daylighting indicators, which is more consistent with the sequential information transfer among Mean, Min, Max, and . For input feature vector x, the recursive form of MTL-Light is:
Figure 2.
Stage-wise regression architecture of the MTL-Light framework.
Here, f1∼f4 can be instantiated by the same type of regressor to ensure consistency in modeling form across stages. Each stage only expands the input feature dimension, avoiding complex shared encoders or cross-task interaction modules—embodying the “Light” design. This design is motivated by the complementary nature of the four tasks: Mean reflects overall lighting levels, Min and Max characterize distribution extremes, and denotes the position meeting the 3.3% minimum daylighting coefficient threshold. Preceding tasks provide stable global priors for subsequent tasks, enhancing the robustness of extreme value and coverage task predictions.
Table 1 presents representative optimal hyperparameter configurations for MTL-Light, with “valid_stacker = TRUE” indicating activation of the two-level stacking fusion mechanism. This training strategy provides a unified baseline for subsequent result comparison, model evaluation, and interpretability analysis.
Table 1.
Hyperparameter settings.
MTL-Light training incorporates automated model selection, hyperparameter optimization, and ensemble learning to reduce subjective bias from manual tuning and improve method transferability. Under defined computational resource and time constraints, unified training and validation are performed on a candidate model set, with key hyperparameters optimized within a preset search space. Model selection and hyperparameter optimization were performed only within the training set using 5-fold cross-validation, and a weighted ensemble strategy was adopted based on validation performance. To avoid information leakage, the chained inputs , , and used during training were generated from out-of-fold predictions rather than ground-truth labels. During testing, these intermediate prediction features were generated by the trained preceding-stage models and passed to subsequent tasks. The true labels of the independent test set were used only for final performance evaluation and were not involved in chained feature generation, stacking, hyperparameter tuning, or model selection. All comparison methods use consistent data processing and evaluation workflows to ensure performance differences stem primarily from the modeling strategy itself. Section 4 compares the error performance of single-task baselines and MTL-Light across the four tasks, using SHAP analysis to examine differences in the contributions of key geometric variables and chain features.
2.3. SHAP Interpretability Analysis
Although MTL-Light achieves high predictive accuracy, its multi-component architecture retains a certain degree of black-box behavior, which limits its ability to provide directly interpretable and actionable design guidance. To improve the transparency of model predictions and quantify the marginal contribution of each input feature, the Shapley Additive exPlanations (SHAP) method was employed for interpretability analysis. Based on Shapley values from cooperative game theory, SHAP decomposes the prediction for an individual sample into a baseline term and the additive contributions of all input features, enabling feature effects to be interpreted on a unified and comparable scale. For any sample x, the predicted value can be expressed as:
Here, is the model’s predicted output for sample x; is a baseline (typically the expected output of training sample predictions, ; is the marginal contribution of input feature i to the sample’s prediction (i.e., the SHAP value), calculated as a weighted sum over all feature subsets excluding i; and M is the total number of input features (I = 1, 2, …, M).
The SHAP value is computed per the Shapley value definition: a weighted sum over all feature subsets excluding i, with the mathematical expression:
where F is the set of all features (), S is any feature subset not containing i, ∣S∣ is the cardinality of S; is a value function characterizing the expected model output performance when considering only subset S (defined herein as the conditional expectation ; is the marginal gain from introducing feature i to subset S; and is the corresponding Shapley weight. A positive indicates that feature increases the predicted value relative to the baseline. A negative indicates the opposite effect. Global feature importance and local dependency analysis were then used to characterize the influence of key input variables on target predictions. Instead of interpreting each sub-model separately, MTL-Light was treated as a holistic predictor. This ensures consistency between the interpretation results and the final deployed model. Specifically, SHAP values are calculated for all test set samples, and analysis is performed from both global and local perspectives.
2.4. Lighting Analysis Based on Interpretable Multi-Task Machine Learning
This study generates a dataset via parametric lighting simulation, establishing an integrated “multi-task prediction–interpretability analysis” workflow to enable rapid evaluation and mechanism identification of office unit daylighting performance.
During model construction and training, conventional single-task modeling and multi-task learning strategies are compared, and the chained multi-task method is defined as MTL-Light. Unlike training independent models for each task, MTL-Light explicitly leverages conditional correlations between tasks via “hierarchical recursion + feature enhancement.”
To enhance the traceability and engineering applicability of model conclusions, SHAP for systematic model interpretation is employed. At the global level, statistical analysis of for all test set samples is conducted, adopting mean (∣SHAP∣) as a measure of feature importance to rank input variables—identifying key geometric and derived parameters influencing daylighting task predictions. SHAP summary plots are also employed to analyze the correspondence between feature values and contribution directions, revealing potential nonlinear trends and interaction effects.
At the local level, the SHAP contribution decomposition for representative scenario samples is analyzed, explaining the primary basis for model predictions under specific parameter combinations. Given the multi-task prediction output, the SHAP values for the four targets (Mean, Min, Max, ) are calculated, comparing sensitivity differences and dominant factors across tasks—transforming “high-precision prediction” into interpretable design insights to guide parameter adjustment and optimization in early design stages.
Based on these considerations, this study makes three key contributions:
- Establishing a parametric simulation dataset for office building daylighting under uniform climatic conditions, providing a consistent data foundation for multi-task prediction.
- Proposing a lightweight chain-based multi-task learning method that effectively leverages correlations among daylighting tasks to improve multi-task prediction stability and accuracy.
- Quantitatively revealing the influence of geometric design parameters on different daylighting tasks via SHAP interpretability analysis, enhancing the interpretability and practical value of model results for engineering design.
3. Dataset
3.1. Dataset Construction and Task Definition
Indoor natural daylighting is jointly influenced by spatial geometric factors (room depth, width, height, shape, etc.), window configuration (width, height, position, window-to-wall ratio, etc.), material optical properties, and external shading conditions. Including all these factors as independent variables leads to significant combinatorial explosion in the design space, making systematic sampling and simulation infeasible within engineering-realistic workloads. Based on existing daylighting theories and engineering experience, three geometric variables with significant influences on single-side window daylighting and direct controllability in the early design stage are focused on: room depth (D), window width (B), and window height (Hw). Parametric simulations are conducted under unified boundary conditions to construct a supervised learning dataset and the simulation sample set required for subsequent data-driven modeling.
The research object is a standardized office room, simplified to a rectangular space with a fixed floor height of 3.5 m and room width of 4.0 m. To systematically analyze the impact of geometric dimensions and window configuration on daylighting performance, D, B, and Hw are selected as key control variables: D (m) is the horizontal distance from the inner surface of the exterior window to the inner surface of the rear wall, with 8 discrete levels (3.0, 3.5, 4.0, 4.5, 5.0, 5.5, 6.0, 6.5 m); B (m) is the net horizontal width of the side window, with 8 discrete levels (2.3, 2.5, 2.7, 2.9, 3.1, 3.3, 3.5, 3.7 m); Hw (m) is the net vertical height of the side window, with 6 discrete levels (1.1, 1.3, 1.5, 1.7, 1.9, 2.1 m). The window sill height is fixed at Hs = 1.1 m, with a single rectangular side window used for all simulation cases to ensure consistent boundary conditions and structural configurations. Full factorial combination of D, B, and Hw yields 8 × 8 × 6 = 384 simulation cases. Although the dataset contains 384 simulation cases, it was constructed using a full-factorial parametric design based on three primary geometric variables: room depth, window width, and window height. Compared with sparse random sampling, the full-factorial parametric design provides complete and uniformly distributed coverage of the predefined low-dimensional design space, while all other boundary conditions were kept constant to reduce the influence of uncontrolled factors on model training and evaluation. Therefore, the dataset is suitable for developing and evaluating the proposed lightweight chained multi-task surrogate model within the specified parameter range, while applications beyond this predefined simulation domain require further validation. The four target variables were extracted from the simulated work-plane DF distribution, and was calculated according to the continuous compliance rule described in Section 2.1. Variations in D, B, and Hw synchronously change the window area and derive indicators (window-to-wall ratio, window-to-floor ratio). All input conditions other than these geometric parameters and their derivatives are identical across cases, ensuring that differences in daylighting performance primarily stem from geometric parameter variations. Figure 3 presents the indoor daylight factor distributions for 64 simulation cases (window widths: 2.3–3.7 m; room depths: 3.0–6.5 m) using color-coded maps, where orange denotes high values and blue to indigo denotes low values.
Figure 3.
Simulated spatial distribution of daylight factors (DF, %) under different combinations of window width and room depth, presented as indoor DF contour maps. The right-hand color bar denotes DF values, with blue representing low daylight levels and red-orange-yellow indicating high daylight levels.
For each simulation case, the daylight factor (DF) distribution on the work plane was obtained through numerical simulation. Due to the pronounced spatial heterogeneity of DF, with higher values near window openings and substantial attenuation with increasing distance, a single statistical indicator is insufficient to comprehensively describe indoor daylighting performance. To characterize indoor daylighting performance from multiple perspectives, three representative metrics were extracted from the DF field of each case, including Mean (overall daylighting level), Max (local peak value), and Min (worst-case condition). In addition, a compliance-related indicator, , was defined to represent the maximum room depth that satisfies the minimum daylighting requirement.
Together, Mean, Min, Max, and form the output task system, revealing coupled variation laws between daylighting performance and parameters D, B, and Hw, and providing a unified data foundation for subsequent predictive modeling and interpretability analysis. To demonstrate response characteristics under different parameter combinations, the results section presents representative slices—e.g., comparing daylighting task variations across different window widths (B) and room depths (D) at fixed window height (Hw), and visualizing simulation results and distribution patterns of typical cases.
3.2. Dataset Characteristics
The statistical information of all variables is presented in Table 2, which details the characteristic parameters of the daylighting dataset and the Maximum, Minimum, Mean, Standard Deviation, Standard Error, and Sample Variance of each individual feature in the dataset.
Table 2.
Dataset statistics.
Table 2 summarizes the statistical characteristics of all input and output features. For input variables, room depth ranges from 3.00 to 6.50 m with a standard deviation of 1.15 (significant variation), while window height and width are more concentrated—centered at mean values of 1.60 m and 3.00 m, respectively. Among output variables, Mean (%), Min (%), and Max (%) exhibit distinct distribution characteristics: Max remains consistently high and stable (mean: 12.62%, standard deviation: 1.09), Min shows large variation (mean: 1.74%, standard deviation: 0.70), and Mean falls in a moderate range (4.25%). (m) spans 0.60–4.00 m with a standard deviation of 0.69, indicating significant differences under varying room geometric conditions. These results show that the four output variables differ in dimensionality and volatility but collectively characterize indoor daylighting performance and its correlation with spatial dimensions. Treating them as interrelated prediction tasks and adopting a multi-task learning framework for modeling thus fully exploits complementary information among tasks, enhancing overall prediction performance and exploring potential inter-variable influence mechanisms.
3.3. Feature Distribution Characteristics and Correlation Study
To systematically analyze the relationship between indoor daylighting performance tasks and design parameters, statistical analysis of the distribution characteristics and correlations of input parameters and output tasks is conducted firstly. Figure 4 presents pairwise relationship distributions between input variables (room depth, window height, window width) and daylighting performance tasks (Mean, Min, Max, ); Figure 5 quantifies linear correlations among all variables via a correlation coefficient matrix.
Figure 4.
Pairwise relationships between input parameters and daylighting metrics.
Figure 5.
Correlation Matrix of Input Parameters and Daylighting Metrics.
Figure 4 shows that input parameters are discretely and uniformly distributed within set intervals, ensuring sufficient parameter space coverage to support generalization learning of subsequent ML models for different design conditions. For output tasks, Mean, Min, Max, and exhibit distinct continuity and clear variation trends under most variable combinations. Pairwise scatter plots indicate significant positive correlations among the daylighting performance tasks. Approximately linear relationships are observed between Mean and Min, as well as between Mean and Max, while also exhibits strong correlations with all DF-related tasks. This indicates that different daylighting evaluation tasks are not independent but jointly influenced by the same geometric parameters.
Correlation analysis (Figure 5) further supports these observations. Room depth is strongly negatively correlated with Mean, Min, and , indicating that daylighting performance decreases as room depth increases. By contrast, window height and width are moderately to strongly positively correlated with all daylighting tasks, and window height shows a particularly pronounced effect on Max and . In addition, strong correlations are observed among the daylighting tasks themselves, especially between Mean and Min and between Mean and Max. This confirms the inherent coupling among the prediction targets and supports the adoption of a multi-task learning framework.
Room daylighting performance has a complex nonlinear relationship with building geometric parameters, and different output tasks exhibit strong correlations and information overlap. Single-task modeling for individual tasks neglects these inherent correlations, limiting overall model prediction stability. Therefore, a multi-task learning method is needed to explicitly characterize inter-task correlations. Such a method can better exploit the synergistic relationships between input parameters and multiple daylighting tasks. This provides both a data-driven and theoretical basis for constructing the MTL-Light framework.
4. Prediction Performance Comparison and Error Analysis
4.1. Performance Evaluation of Single-Task Models
Prior to the analysis of multi-task prediction performance, single-task modeling methods are first investigated. Independent prediction of each output variable clarifies model performance under single-task settings, providing a baseline for subsequent multi-task comparisons and revealing potential limitations of single-task models for complex problems.
This section evaluates the prediction performance of different single-task models on four daylighting performance tasks ( (Figure 6a), Max (Figure 6b), Min (Figure 6c), Mean (Figure 6d)) to assess their accuracy and robustness under independent task settings. Figure 6 presents the distributions of model prediction errors, revealing the limitations of traditional single-task models in handling multiple prediction targets, particularly their inconsistent performance across different labels. LightGBM exhibits the most dispersed error range, particularly for and Min tasks, indicating insufficient robustness to data fluctuations. NeuralNetTorch maintains relatively stable predictions overall but shows fluctuations in extreme value prediction for Max. XGBoost features the most concentrated error distribution, demonstrating higher reliability in capturing complex nonlinear relationships. Notably, single-task models can perform adequately on individual tasks. However, their performance varies across different labels. This indicates that a single-task model may not perform consistently well for all daylighting indicators. More importantly, these models do not explicitly account for potential inter-task correlations. Given the inherent connections among daylighting performance tasks, single-task modeling alone cannot fully exploit the dataset’s overall value. Introducing multi-task learning thus mitigates single-task prediction instability and improves overall prediction accuracy and robustness via inter-task information sharing.
Figure 6.
Error distribution comparison of single-task baseline models across four daylighting indicators: (a) , (b) Max, (c) Min, and (d) Mean. Values closer to 1 indicate better agreement between predicted and simulated values.
4.1.1. Comparative Prediction Performance Across Tasks
Figure 7 compares predicted results from different single-task models with experimental values for the four tasks (Mean (Figure 7d), Min (Figure 7c), Max (Figure 7b), (Figure 7a)). In general, prediction points for all models cluster around the ideal line y = x, with most samples falling within the ±12% error band—indicating single-task methods can capture overall trends and maintain favorable prediction accuracy. However, a more detailed comparison reveals discrepancies in prediction stability across tasks. For Mean and Max prediction, XGBoost yields the most concentrated point cloud distribution, demonstrating superior reliability. In contrast, LightGBM and NeuralNetTorch exhibit systematic deviations in some results for Min and prediction tasks, reflecting insufficient adaptability to extreme value and comprehensive tasks. These discrepancies embody the imbalance of single-task modeling when handling various output tasks: such models can achieve good fitting performance for certain tasks but incur significant errors in others. Given the intrinsic physical coupling among illumination-related tasks, single-task modeling often fails to fully exploit these inherent correlations, leading to inconsistent model performance across tasks. Multi-task modeling, by enabling information sharing among tasks, mitigates single-task prediction instability and enhances overall model accuracy and robustness. These results thus verify the limitations of single-task modeling and provide direct empirical support for multi-task prediction applications.
Figure 7.
Predicted versus simulated values of single-task models. (a) , (b) Max, (c) Min, (d) MEAN.
Analysis results show that single-task models can achieve reasonable accuracy on specific tasks but fail to fully capture inter-variable coupling relationships, with predictive performance susceptible to data complexity constraints. Multi-task methods, in contrast, enable mutual complementarity via information sharing, exhibiting superior overall efficacy.
4.1.2. Quantitative Comparison of Single-Task Models
Figure 8 presents evaluation results across the four daylighting tasks. Quantitative assessments reveal significant discrepancies in single-task model performance across tasks. For Mean (Figure 8d) and Max (Figure 8b) tasks, all models exhibit relatively low overall errors with R2 values generally close to 1.0, indicating strong fitting capability. In contrast, sensitive tasks such as Min (Figure 8c) and (Figure 8a) show markedly increased MAE and MAPE, revealing lower prediction stability and weaker generalization for low-illuminance and threshold-based tasks. A further comparison shows that different models exhibit varying performance advantages across individual tasks, demonstrating distinct task dependency: a single model can hardly maintain high prediction accuracy across all daylighting tasks simultaneously. This phenomenon indicates that independent modeling of multiple tasks tends to result in information isolation, making it difficult to fully characterize inherent inter-task correlations among daylighting tasks. Therefore, developing a multi-task learning framework that captures shared feature representations and inter-task dependencies is essential for improving the consistency and overall robustness of multi-task prediction.
Figure 8.
Radar comparison of normalized performance metrics for NeuralNetTorch, LightGBM, and XGBoost across four daylighting indicators: (a) , (b) Max, (c) Min, and (d) Mean. Larger radial values indicate better predictive performance.
4.2. Comparative Evaluation of MTL-Light and Baseline Models
Based on the preceding single-task prediction analysis, this section further compares the proposed MTL-Light model with representative baseline models and systematically evaluates its performance in terms of predictive accuracy, cross-task stability, and error distribution characteristics. Since Mean, Min, Max, and are physically and statistically related indicators derived from the same daylight factor distribution, the chained structure of MTL-Light is suitable for modeling their inter-task dependencies. Unlike conventional multi-output regressors that predict all targets simultaneously, MTL-Light transfers preceding task predictions to downstream tasks, thereby explicitly incorporating task-level dependency information. Compared with shared-encoder multi-task neural networks, it uses intermediate prediction information directly rather than relying on an implicit shared latent representation. This design is consistent with the sequential information transfer among the four daylighting indicators and is therefore appropriate for the present tabular daylighting prediction problem.
4.2.1. Overall Prediction Performance of MTL-Light
Figure 9 compares predicted results from the MTL-Light multi-task model with ground truth values for the four tasks (Mean (Figure 9d), Max (Figure 9b), Min (Figure 9c), (Figure 9a)), including fitting curves with 95% confidence intervals (CIs) and prediction intervals (PIs). Results indicate the following: (1) For Mean and Max prediction, the point clouds cluster tightly around the ideal line , with nearly all samples falling within the confidence interval, suggesting that the multi-task model achieves better fitting performance for overall trends and extreme values than the corresponding single-task models. (2) For Min and prediction, while some points remain relatively scattered, the model exhibits smaller overall fluctuations and higher CI coverage than single-task models, indicating better adaptability to boundary condition and comprehensive task prediction. (3) Overall, multi-task learning effectively narrows the prediction intervals and reduces predictive uncertainty, in clear contrast to the unbalanced task-wise performance of single-task models.
Figure 9.
Prediction performance and uncertainty of the MTL-Light model across four daylighting metrics (a) , (b) Max, (c) Min, (d) MEAN.
This improvement is highly significant for office building indoor daylight simulation research. Traditional simulation methods rely on extensive computations and tedious modeling, while single-task prediction frameworks exhibit accuracy discrepancies when handling multi-task outputs, making them unsuitable as robust alternative tools. Multi-task learning, in contrast, not only improves overall prediction accuracy but also enhances model generalization via inter-task complementarity—enabling ML-based prediction to replace some complex simulation processes, providing a more efficient and reliable approach for rapid daylighting performance evaluation and optimization in office buildings.
Beyond overall predictive performance comparison, it is necessary to examine error characteristics and consistency of the multi-task model across tasks. While fitting curves and CI reflect overall accuracy, they fail to reveal systematic prediction biases across numerical intervals. Residual analysis and the Bland–Altman method are thus introduced to compare the distribution of differences between predicted and actual values, enabling detailed evaluation of model stability and reliability across all task types. Figure 10 presents residual distribution and Bland–Altman analysis results for the multi-task model across the four tasks (Mean, Min, Max, ), verifying consistency and systematic biases between predicted and actual values. Most sample residuals cluster around zero; mean differences from Bland–Altman analysis are all close to zero, with over 95% of points falling within ±1.96 standard deviations (SD). These findings indicate excellent agreement between model predictions and actual values for primary tasks. In contrast, Min and tasks exhibit relatively larger predictive fluctuations and more dispersed residual distributions, suggesting some uncertainty in model performance for low-value or comprehensive tasks. Nevertheless, compared with the uneven performance of single-task methods across tasks, multi-task learning effectively suppresses error propagation via inter-task information sharing, rendering overall predictions more stable. Importantly, this consistency verification not only validates the multi-task model’s effectiveness but also provides methodological support for engineering practice. When integrated with simulations, the model further enhances daylighting performance evaluation reliability while maintaining high accuracy, offering a more robust technical basis for architectural design optimization and energy-saving strategy formulation. Residual and consistency analyses thus confirm the advantages of the multi-task framework in complex predictive tasks, laying a solid foundation for exploring its subsequent popularization and application.
Figure 10.
Residual and Bland–Altman analysis of multi-task daylighting predictions. (a) , (b) Max, (c) Min, (d) MEAN.
4.2.2. Improvement and Stability Analysis Across Tasks
To further highlight the advantages of the proposed MTL-Light framework, a comparative analysis was conducted between MTL-Light and representative single-task models. The baseline models, including NeuralNetTorch, LightGBM, and XGBoost, were trained independently for each daylighting indicator under the same data partition, preprocessing workflow, validation strategy, and evaluation metrics. This comparison aims to examine whether the proposed chained multi-task strategy can more effectively exploit the inherent correlations among Mean, Min, Max, and than conventional independent single-task prediction.
Figure 11 presents multi-metric prediction performance of the MTL-Light model across tasks. Table 3 compares the predictive performance of three single-task models (NeuralNetTorch, LightGBM, XGBoost) with the improved multi-task model MTL-Light across the four output tasks (Mean, Min, Max, ). Results show significant performance variations in single-task models across tasks: for example, in the task, LightGBM achieves a coefficient of determination (R2) of only 0.948 with a mean absolute percentage error (MAPE) as high as 7.797%; in Min task prediction, XGBoost yields a root mean square error (RMSE) of 0.100, significantly lower than in other tasks. This imbalance indicates that single-task modeling fails to effectively exploit inter-task correlations when processing each output independently, leading to large prediction errors in sensitive tasks (e.g., Min and ).
Figure 11.
Multi-metric prediction performance of the MTL-Light model.
Table 3.
Comparison of predictive performance between single-task model and MTL-Light model.
In contrast, MTL-Light demonstrates remarkable advantages across all tasks (Figure 11): it achieves a mean absolute error (MAE) of merely 0.022 and an R2 of 0.999 in the Mean task; for more challenging prediction tasks such as Min and , its MAPE remains below 4.168% and 5.598%, respectively, significantly lower than that of the corresponding single-task models. Meanwhile, MTL-Light yields universally low RMSE (below 0.1) with a narrower prediction interval, exhibiting enhanced stability and robustness. These results verify that the multi-task learning framework more effectively captures coupling relationships among output variables via inter-task shared feature representation, improving overall model performance.
The approach proposed in this study is particularly valuable for simulation-based daylighting evaluation in early-stage building design. Conventional daylighting simulation usually requires detailed model setup and relatively long computational time, whereas independent single-task prediction may show unbalanced accuracy across different indicators. The inference efficiency of MTL-Light was evaluated using the independent test set. The computational efficiency of the proposed framework was evaluated by comparing the runtime of conventional Ecotect simulation with the inference time of the offline-trained MTL-Light model under the same experimental workflow. All timing experiments were conducted on a workstation equipped with a 13th Gen Intel(R) Core(TM) i5-13400F CPU @ 2.50 GHz, 32.0 GB RAM, an NVIDIA GeForce RTX 4070 GPU, and a Windows 11 Pro 64-bit operating system. After one warm-up prediction, model prediction was repeated 200 times, and the average single-sample inference time was calculated by dividing the mean batch prediction time by the number of test samples. The timing measurement only included the prediction stage of the offline-trained model, excluding model training, model loading, data preprocessing, and file input/output operations. Under this protocol, a conventional Ecotect daylighting simulation required approximately 10 min for one office-unit case, whereas the offline-trained MTL-Light model completed prediction for all 77 independent test samples in 0.760 s on average, corresponding to 9.87 ms per case. Thus, the per-case evaluation time was reduced from approximately 600 s to 0.00987 s. These results demonstrate the potential of MTL-Light as an efficient and interpretable surrogate model for rapid daylighting performance evaluation within the predefined office-unit simulation domain.
4.2.3. MTL-Light Robustness Analysis Under Monte Carlo Cross-Validation
To further evaluate the robustness of MTL-Light and its sensitivity to data partitioning, Monte Carlo cross validation based on repeated random train–test splits was conducted. Specifically, the full dataset was randomly divided into training and testing subsets at an 80/20 ratio for 200 independent repetitions. In each repetition, the MTL-Light model was retrained from scratch using the same chained prediction strategy and evaluated on the corresponding independent test set. The results were summarized as the mean and standard deviation of each evaluation metric.
As shown in Table 4, MTL-Light maintains stable predictive performance across the repeated splits. The average R2 over the four tasks reaches 0.9794 ± 0.0053, indicating that the model consistently explains most of the variance in the daylighting indicators under different data partitions. Meanwhile, the average RMSE, MAE, MAPE, and nRMSE are 0.1073 ± 0.0184, 0.0711 ± 0.0061, 2.866 ± 0.211, and 2.492% ± 0.377%, respectively. The relatively small standard deviations suggest that the reported prediction accuracy is not dependent on a single favorable train–test split. Among the four tasks, Mean exhibits the most stable performance, with the highest R2 and lowest normalized error, while shows a relatively larger error fluctuation due to its threshold-based definition and stronger sensitivity to spatial daylight distribution.
Table 4.
Robustness evaluation of MTL-Light under Monte Carlo cross-validation.
Figure 12 further illustrates the distributions of R2, RMSE, MAE, and nRMSE across the 200 repeated splits. The performance distributions are generally concentrated, confirming the robustness of MTL-Light within the predefined simulation domain. In particular, the R2 distributions are concentrated in the high-value range for all tasks, while the nRMSE distributions are clustered at relatively low levels, indicating stable interpolation performance under repeated data partitioning. Since RMSE and MAE retain the original units of each target variable, nRMSE was additionally reported to provide a scale-normalized comparison among different tasks. It should be noted that the high R2 values should be interpreted as evidence of strong interpolation performance within the simulation space.
Figure 12.
Performance variability of MTL-Light under Monte Carlo cross-validation: (a) R2, (b) RMSE, (c) MAE, and (d) nRMSE. The distributions were obtained from 200 independent 80/20 random train–test splits, with the model retrained from scratch in each repetition.
The present study focuses on learning the relationship between geometric variables and daylight-distribution behavior under controlled simulation conditions. The proposed MTL-Light framework provides an efficient and interpretable surrogate-learning approach for rapid daylighting prediction, enabling systematic analysis of daylight-response characteristics associated with different room geometries and window configurations.
In practical building environments, daylighting performance may also interact with thermal-energy behavior, occupant activities, climate variation, work-plane configuration, and dynamic shading conditions. Increasing glazing area may improve daylight penetration and reduce dependence on artificial lighting while simultaneously influencing solar heat gain and cooling demand. Although these coupled environmental and operational factors are not explicitly represented in the current simulation domain, the proposed framework provides a transferable basis for broader building-performance evaluation and future integration with more complex environmental analysis scenarios.
5. Interpretability Based on Multi-Task Prediction
Previous chapters verified the accuracy and stability of the MTL-Light model for illuminance prediction via a multi-task learning framework. However, while numerical performance evaluation demonstrates the model’s overall prediction advantages, it fails to explain its internal decision-making logic and feature interaction mechanisms. To further clarify the contributions of different input variables and inter-task dependencies to prediction results, this chapter introduces the SHapley Additive exPlanations (SHAP) method for systematic interpretability analysis of the MTL-Light model’s prediction process.
5.1. Global Feature Importance Analysis Based on SHAP
To deepen understanding of the MTL-Light model’s decision-making mechanism across different prediction tasks, this section first conducts a systematic analysis of the feature importance of all input variables and prior prediction results. Analysis of SHAP value distributions reveals the dominant contributions of input variables and prior predictions to each output. It further identifies the direct effects of geometric variables on daylighting performance. In addition, it reveals the hierarchical coupling relationships among different illuminance prediction tasks. These findings provide a basis for subsequent nonlinear mechanism interpretation and engineering application.
Figure 13 presents SHAP value distributions of the MTL-Light model under different prediction tasks, revealing the dominant roles and hierarchical dependencies of input variables and prior predictions on each output. For Mean illuminance prediction (Figure 13a), Room Depth exhibits the most significant negative contribution, while Window Height and Window Width exert positive effects with Window Height’s impact being particularly prominent. This indicates that mean illuminance is primarily governed by the dual effects of light attenuation from room depth and light enhancement from window geometric parameters. When is introduced as an input for Min illuminance prediction (Figure 13b), its positive contribution far outweighs that of geometric variables, making it the primary explanatory factor. This demonstrates that overall illuminance levels effectively constrain minimum illuminance, implying the multi-task learning framework not only leverages raw feature information but also explicitly captures the Mean to Min dependency relationship.
Figure 13.
SHAP summary plots of the MTL-Light model across different prediction targets. (a) Base features only (b) +, (c) + +, (d) ++ +
When is further incorporated for Max illuminance prediction (Figure 13c), Window Height remains the strongest dominant factor, while and Window Width exert clear positive effects, and the negative contribution of Room Depth is relatively weakened. This means maximum illuminance is not only dominated by geometric parameters but also indirectly constrained by minimum illuminance distribution, reflecting the hierarchical transfer of Mean/Min to Max. Finally, when is introduced for prediction (Figure 13d), its positive contribution is most prominent, followed by Window Width—with and providing auxiliary positive support. The negative effect of Room Depth persists but is less pronounced. It can thus be concluded that prediction relies not only on peak illuminance but also integrates mean and minimum illuminance information, forming a key Max to link.
Overall, these four figures clearly delineate a hierarchical information flow extending from geometric inputs to output coupling: The prediction chain of MTL-Light follows the sequence: Room/window geometry → → → → . In this structure, the prediction from each preceding task is used as additional information for the subsequent task. This allows the model to capture the inherent dependency among daylighting indicators. For example, the overall daylighting level represented by Mean can help improve the prediction of distribution-sensitive indicators such as Min and . As a result, MTL-Light reduces prediction uncertainty in sensitive tasks and improves the stability of multi-indicator daylighting prediction. This mechanism highlights the unique advantages of multi-task learning in building daylighting simulation, providing theoretical support and engineering implications for replacing complex simulation processes with data-driven approaches.
SHAP summary plots reveal the direction and magnitude of feature effects but do not allow direct comparison of overall feature importance. Therefore, SHAP bar plots (Figure 14) are used to quantify feature importance across the four output tasks based on mean absolute SHAP values.
Figure 14.
Mean absolute SHAP value plots of the MTL-Light model across different prediction targets. (a) Base features only, (b) + (c) + + (d) ++ +
For Mean prediction (Figure 14a), room depth and window height show comparable importance and jointly dominate the model output, while window width plays a secondary role. For Min prediction (Figure 14b), contributes significantly more than geometric variables, indicating that overall daylighting levels strongly constrain minimum illuminance. For Max prediction (Figure 14c), window height remains the most influential factor, followed by , with window width also contributing noticeably. For prediction (Figure 14d), shows the highest importance, while geometric variables become less dominant, suggesting that this task relies more on combined information from multiple sources.
It should be noted that the SHAP interpretation of the chained MTL-Light model requires caution because the intermediate prediction features are correlated with the original geometric variables. Variables such as , , and are generated from preceding prediction stages and therefore should not be interpreted as independent physical design parameters. In the presence of correlated features, SHAP may redistribute attribution among related variables. Therefore, the importance of chained features is interpreted as model-level evidence of inter-task information transfer, rather than as a causal decomposition of independent physical effects. Overall, these results demonstrate that the MTL-Light model not only captures the dominant model-level effects of geometric variables but also effectively incorporates preceding task predictions, leading to improved stability and accuracy in multi-task daylighting prediction.
The SHAP interpretations presented in this study are derived from the predefined simulation domain under controlled geometric and environmental conditions. Since factors such as building orientation and multi-climate variation were not explicitly incorporated into the current configuration, the reported marginal feature contributions should primarily be interpreted within the present training domain. Nevertheless, the proposed MTL-Light framework provides a transferable and interpretable surrogate-learning structure that may support future orientation-aware and multi-climate daylighting analysis.
5.2. Feature Interaction Relationship and Nonlinear Mechanism Mining
The SHAP results were further interpreted in relation to daylighting principles. In single-sided daylighting, the daylight factor generally decreases with increasing distance from the window, which explains the negative contribution of room depth to Min and . Window width mainly increases the aperture area and therefore affects the overall daylighting level, whereas window height helps improve daylight penetration into deeper room regions. Beyond confirming these established physical relationships, SHAP provides quantitative and task-specific explanations. For example, improvement in Mean does not necessarily imply a proportional improvement in Min or , indicating that average daylighting alone may overlook insufficient daylighting in the rear zone. Local SHAP further shows how geometric variables and chained prediction features influence individual predictions. Therefore, SHAP analysis links data-driven model interpretation with daylighting principles and provides interpretable design guidance for multi-indicator daylighting evaluation.
This section presents representative SHAP interaction effect plots—including room depth effects for Mean, effects for Min, window height effects for Max, and effects for . These results intuitively reveal the mechanistic characteristics of the multi-task learning framework, wherein preceding task prediction results are incorporated as input features for subsequent task modeling, further highlighting differences in relative importance between geometric variables and each prediction task.
Figure 15 presents typical SHAP dependence plots of the MTL-Light model for different output tasks, uncovering interaction mechanisms of key variables and preceding task predictions on subsequent tasks. For the Mean task (Figure 15a), room depth is negatively and approximately linearly correlated with SHAP values, suggesting that increasing room depth consistently reduces its contribution to average illuminance. Points are color-coded by window width, showing that, at the same room depth, larger window widths can partially offset this negative effect, reflecting the synergistic interaction among geometric variables (Figure 15b), and SHAP values exhibit a strong positive correlation with an approximate 1:1 ratio, demonstrating the decisive role of overall average illuminance in minimum illuminance. This underscores the multi-task framework’s advantage: integrating preceding task predictions as input features enhances boundary condition constraint capability. For Max prediction (Figure 15c), and SHAP values also exhibit a strong linear relationship, indicating that maximum illuminance is directly governed by geometric parameters while being indirectly constrained by low-illuminance levels. Such cross-task dependency helps the model maintain stability in extreme value prediction. For prediction (Figure 15d), SHAP values increase monotonically with predicted values, reflecting peak illuminance’s dominant influence on the comprehensive task. Meanwhile, the color distribution of points, representing window width, reveals the secondary influence of geometric conditions, indicating that is determined by the combined effects of peak illuminance levels and spatial configuration.
Figure 15.
SHAP interaction effects in the MTL-Light model. (a) SHAP value for Room Depth with respect to Window Width, (b) SHAP value for with respect to Room Depth, (c) SHAP value for with respect to Window Height, (d) SHAP value for with respect to Window Width.
These interaction effects verify the MTL-Light model’s modeling mechanism: different task outputs are driven not only independently by geometric features but also intercoupled via preceding task predictions, improving overall prediction consistency and interpretability. This characteristic holds particular engineering significance for architectural daylight simulation, uncovering inherent logical connections among multiple illuminance distribution labels and providing a solid theoretical foundation for ML-driven rapid evaluation and optimization of architectural daylight performance.
6. Conclusions
This study presents MTL-Light, a lightweight and explainable chained multi-task learning framework for rapid daylighting performance prediction in typical office units. Based on a unified parametric daylighting dataset generated from geometric modeling and simulation, the proposed framework establishes an effective surrogate modeling pipeline that links key design variables to multiple daylighting outputs, providing a reusable basis for model development, benchmarking, and early-stage design evaluation.
- A unified parametric daylighting dataset and surrogate modeling pipeline were established. By integrating parametric geometric modeling with daylighting simulation, this study constructed a dataset from geometric design variables to multiple daylighting outputs, providing a reusable basis for model training, benchmarking, and rapid performance evaluation in early design stages.
- MTL-Light achieved accurate and consistent prediction across all four daylighting tasks. Experimental results show that all output tasks reached high predictive accuracy (R2 ≥ 0.969). In particular, the framework performed best on the Mean task and maintained similarly robust performance on the Max task, indicating the effectiveness of chained multi-task learning in improving information sharing and prediction consistency across correlated daylighting metrics.
- MTL-Light remained reliable for more sensitive tasks, although MAPE should be interpreted cautiously. For the Min and tasks, the relatively higher MAPE values are mainly attributable to output discreteness and the amplification effect associated with small target values. This suggests that model performance for such daylighting metrics should be assessed using multiple indicators, including MAE, RMSE, and R2, rather than MAPE alone.
- The proposed framework provides both rapid evaluation and interpretable design support. MTL-Light can simultaneously predict Mean, Min, Max, and in a single inference, enabling efficient parameter screening and multi-task comparison in early design stages. Combined with SHAP analysis, it also reveals the sensitivity and directional influence of key design variables, thereby offering interpretable support for room depth and window design decisions while reducing dependence on repeated numerical simulations.
Future research may extend the proposed MTL-Light framework toward more comprehensive daylighting and building-performance analysis scenarios. Although the present study focuses on controlled geometric conditions for interpretable daylighting prediction, practical building environments may involve additional factors such as climate variation, dynamic shading systems, surrounding obstructions, thermal-energy interaction, and occupant behavior. Integrating these coupled environmental and operational factors into the current surrogate-learning framework may further improve its applicability to complex real-world design conditions.
In addition, future studies may explore broader parametric design spaces and more generalized prediction settings, including different building orientations, work-plane configurations, façade systems, and multi-climate simulation domains. The proposed chained multi-task learning and SHAP-based interpretability framework may also be extended toward integrated building-performance evaluation, supporting rapid design exploration, daylight-oriented optimization, retrofit-oriented design analysis and interpretable decision making in early-stage architectural design.
Author Contributions
Conceptualization, G.L. and Y.Z.; methodology, Y.C.; software, Y.C. and Y.Z.; validation, G.L. and Y.Z.; formal analysis, Y.C.; investigation, Y.C.; resources, G.L. and Y.Z.; data curation, Y.C.; writing—original draft preparation, Y.C. and Y.Z.; writing—review and editing, Y.C. and Y.Z.; visualization, Y.C. and Y.Z.; supervision, G.L. and Y.Z.; project administration, G.L.; funding acquisition, G.L. All authors have read and agreed to the published version of the manuscript.
Funding
This work was financially supported by the Shaoxing Science and Technology Planning Project (Grant No. 2024B13004) and Zhejiang Province Science and Technology Plan (Grant No. 2026LDC01017(JT)).
Data Availability Statement
The datasets used and/or analyzed during the current study are available from the corresponding author upon reasonable request.
Conflicts of Interest
The authors declare that they have no known competing financial interests or personal relationships that could have appeared to influence the work reported in this paper.
References
- Akinbami, A.A. Integrating Natural Light for Wellbeing, Performance, and Quality Care Delivery in Healthcare Environments. 2024. Available online: https://pearl.plymouth.ac.uk/foahb-theses-other/272/ (accessed on 18 April 2026).
- Idrissi Kaitouni, S.; Sangkyu, P.; Mghazli, M.O.; El Mansouri, F.; Jamil, A.; Ahachad, M.; Brigui, J. Design parameters influencing the energy performance and indoor comfort of net zero energy building “NZEB” designed for semi-arid urban areas: Digital workflow methodology, sensitivity analysis and comparative assessment. Sol. Energy 2024, 268, 112264. [Google Scholar] [CrossRef] [Scilit]
- Le-Thanh, L.; Nguyen-Thi-Viet, H.; Lee, J.; Nguyen-Xuan, H. Machine learning-based real-time daylight analysis in buildings. J. Build. Eng. 2022, 52, 104374. [Google Scholar] [CrossRef] [Scilit]
- Ayoosu, M.I.; Utsaha, A.L.; Gabriel, K.E.; Vishigh, A.M.M.; Tuleun, M.E.; Sen, I.G.; Ayoosu, M.I.; Utsaha, A.L.; Gabriel, K.E.; Vishigh, A.M.M.; et al. Daylighting performance assessment: A review of methodologies. Path Sci. 2025, 11, 8001–8011. [Google Scholar] [CrossRef] [Scilit]
- Giovannini, L.; Lo Verso, V.; Valetti, L.; Daltrozo, J.; Pellegrino, A. Analysis of integrative lighting through field measurements and annual daylight simulations in offices. Light. Res. Technol. 2025, 57, 421–450. [Google Scholar] [CrossRef] [Scilit]
- Jain, S.; Garg, V. A review of open loop control strategies for shades, blinds and integrated lighting by use of real-time daylight prediction methods. Build. Environ. 2018, 135, 352–364. [Google Scholar] [CrossRef] [Scilit]
- A Review of Daylighting Calculation Metrics, Variables and Methods in Evaluating the Daylight Performance of a Residential Building|AIP Conference Proceedings|AIP Publishing. Available online: https://pubs.aip.org/aip/acp/article-abstract/2813/1/020016/2904941/A-review-of-daylighting-calculation-metrics (accessed on 10 January 2026).
- Wong, I.L. A review of daylighting design and implementation in buildings. Renew. Sustain. Energy Rev. 2017, 74, 959–968. [Google Scholar] [CrossRef] [Scilit]
- Li, Q.; Baltazar, J.C.; Haberl, J. Prediction of Daylighting Performance Using Machine Learning Algorithm Based on Radiance Simulated Data; IBPSA: Brisbane, Australia, 2023; Volume 18, pp. 1476–1482. [Google Scholar]
- Nourkojouri, H.; Zomorodian, Z.S.; Tahsildoost, M.; Shaghaghian, Z. A machine-learning framework for daylight and visual comfort assessment in early design stages. arXiv 2021, arXiv:2109.06450. [Google Scholar] [CrossRef] [Scilit]
- Ayoosu, M.I.; Lim, Y.-W.; Leng, P.C.; Aule, T.T.; Abdurrahman, A.B.; Aminu, S. Tropical daylight availability and sky typologies for daylighting evaluation and design. J. Tour. Hosp. Environ. Manag. 2022, 7, 157–170. [Google Scholar] [CrossRef] [Scilit]
- Nourkojouri, H.; Shafavi, N.S.; Tahsildoost, M.; Zomorodian, Z.S. Development of a machine-learning framework for overall daylight and visual comfort assessment in early design stages. J. Daylighting 2021, 8, 270–283. [Google Scholar] [CrossRef] [Scilit]
- Ibrahim, A.; Alsukkar, M.; Wang, L.; Hermaputi, R.L.; Dong, Y.; Yin, S.; Xiao, Y.; Hu, P. Targeting integrated daylighting comfort in deep office by multi-objective optimization using partial vertical deployment of adaptive corrugated shadings. Energy Built Environ. 2026, S2666123326000140. [Google Scholar] [CrossRef] [Scilit]
- Li, D.H.W.; Li, S.; Chen, W.; Lou, S. Simple correlations between point daylight factor, average daylight factor and vertical daylight factor under all sky conditions and building design implications. Indoor Built Environ. 2022, 31, 1700–1714. [Google Scholar] [CrossRef] [Scilit]
- Lim, Y.-W.; Ahmad, M.H.; Ossen, D.R. Internal shading for efficient tropical daylighting in malaysian contemporary high-rise open plan office. Indoor Built Environ. 2013, 22, 932–951. [Google Scholar] [CrossRef] [Scilit]
- Shehadeh, A.; Alshboul, O. Enhancing occupational safety in construction: Predictive analytics using advanced ensemble machine learning algorithms. Eng. Appl. Artif. Intell. 2025, 159, 111761. [Google Scholar] [CrossRef] [Scilit]
- Ngarambe, J.; Adilkhanova, I.; Uwiragiye, B.; Yun, G.Y. A review on the current usage of machine learning tools for daylighting design and control. Build. Environ. 2022, 223, 109507. [Google Scholar] [CrossRef] [Scilit]
- Kumar, S.; Kurian, C.P.; Colaco, S.G.; Mathew, V. Machine learning model for glare prediction in offices with simple architectural features. J. Green Build. 2022, 17, 79–97. [Google Scholar] [CrossRef] [Scilit]
- Ayoub, M. A review on machine learning algorithms to predict daylighting inside buildings. Sol. Energy 2020, 202, 249–275. [Google Scholar] [CrossRef] [Scilit]
- Ibrahim, A.W.M. Predicting Glare in Open-Plan Offices Using Simplified Data Acquisitions and Machine Learning Algorithms. Available online: https://eprints.qut.edu.au/204266/ (accessed on 10 January 2026).
- Radziszewski, K.; Radziszewska, M. Machine learning algorithm-based tool and digital framework for substituting daylight simulations in early-stage architectural design evaluation. In Proceedings of the 2018 Society for Modeling & Simulation International (SCS); Delft, The Netherlands, 5–7 June 2018; ISBN 978-1-5108-6315-6. [Google Scholar] [CrossRef] [Scilit]
- Amasyali, K.; El-Gohary, N.M. A review of data-driven building energy consumption prediction studies. Renew. Sustain. Energy Rev. 2018, 81, 1192–1205. [Google Scholar] [CrossRef] [Scilit]
- Lowing, D.; Techer, K. Toward a consensus on extended Shapley values for multi-choice games. Math. Soc. Sci. 2025, 137, 102407. [Google Scholar] [CrossRef] [Scilit]
- Mashaly, I.; El-Hussainy, M.; Sherif, A.; Tarabieh, K. Daylighting performance prediction tool for early design stages using machine learning. J. Build. Eng. 2025, 111, 113496. [Google Scholar] [CrossRef] [Scilit]
- Ngarambe, J.; Irakoze, A.; Yun, G.Y.; Kim, G. Comparative performance of machine learning algorithms in the prediction of indoor daylight illuminances. Sustainability 2020, 12, 4471. [Google Scholar] [CrossRef] [Scilit]
- Vanage, S.; Dong, H.; Cetin, K. Visual comfort and energy use reduction comparison for different shading and lighting control strategies in a small office building. Sol. Energy 2023, 265, 112086. [Google Scholar] [CrossRef] [Scilit]
- Do, C.T.; Dung, N.T.T.; Chan, Y.-C. Daylighting assessment of window layouts and architectural elements in early design stages. Sci. Rep. 2025, 15, 39507. [Google Scholar] [CrossRef] [Scilit]
- GB50033-2013; Standard for Daylighting Design of Buildings. China Architecture and Building Press: Beijing, China, 2013.
- Lian, H.; Ji, Y.; Niu, M.; Gu, J.; Xie, J.; Liu, J. A hybrid load prediction method of office buildings based on physical simulation database and LightGBM algorithm. Appl. Energy 2025, 377, 124620. [Google Scholar] [CrossRef] [Scilit]
- Tian, W.; Qiu, R.; Tang, Z.; Zhong, Y.; Liu, X.; Wang, X.; Zou, F.; Li, R. XGBoost assisted in identifying the structural damage behavior of fiber-reinforced concrete during the soundless demolition process through electrical resistance changes. Constr. Build. Mater. 2025, 478, 141376. [Google Scholar] [CrossRef] [Scilit]
- Emami, S.A.; Castaldi, P.; Banazadeh, A. Neural network-based flight control systems: Present and future. Annu. Rev. Control 2022, 53, 97–137. [Google Scholar] [CrossRef] [Scilit]
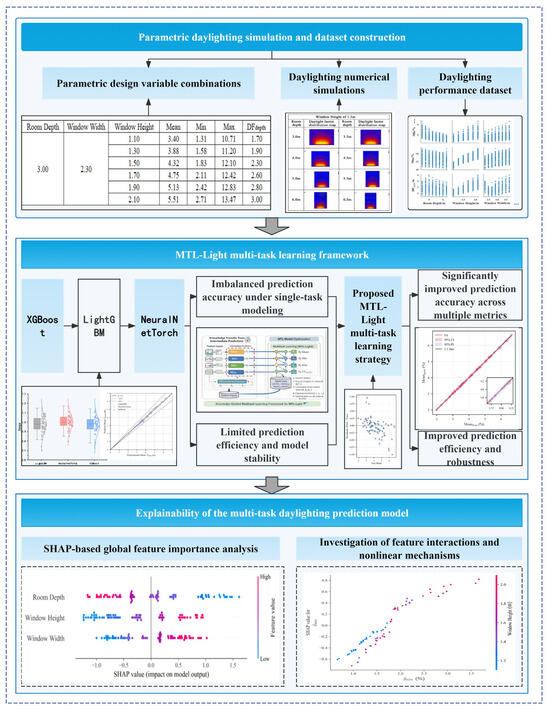
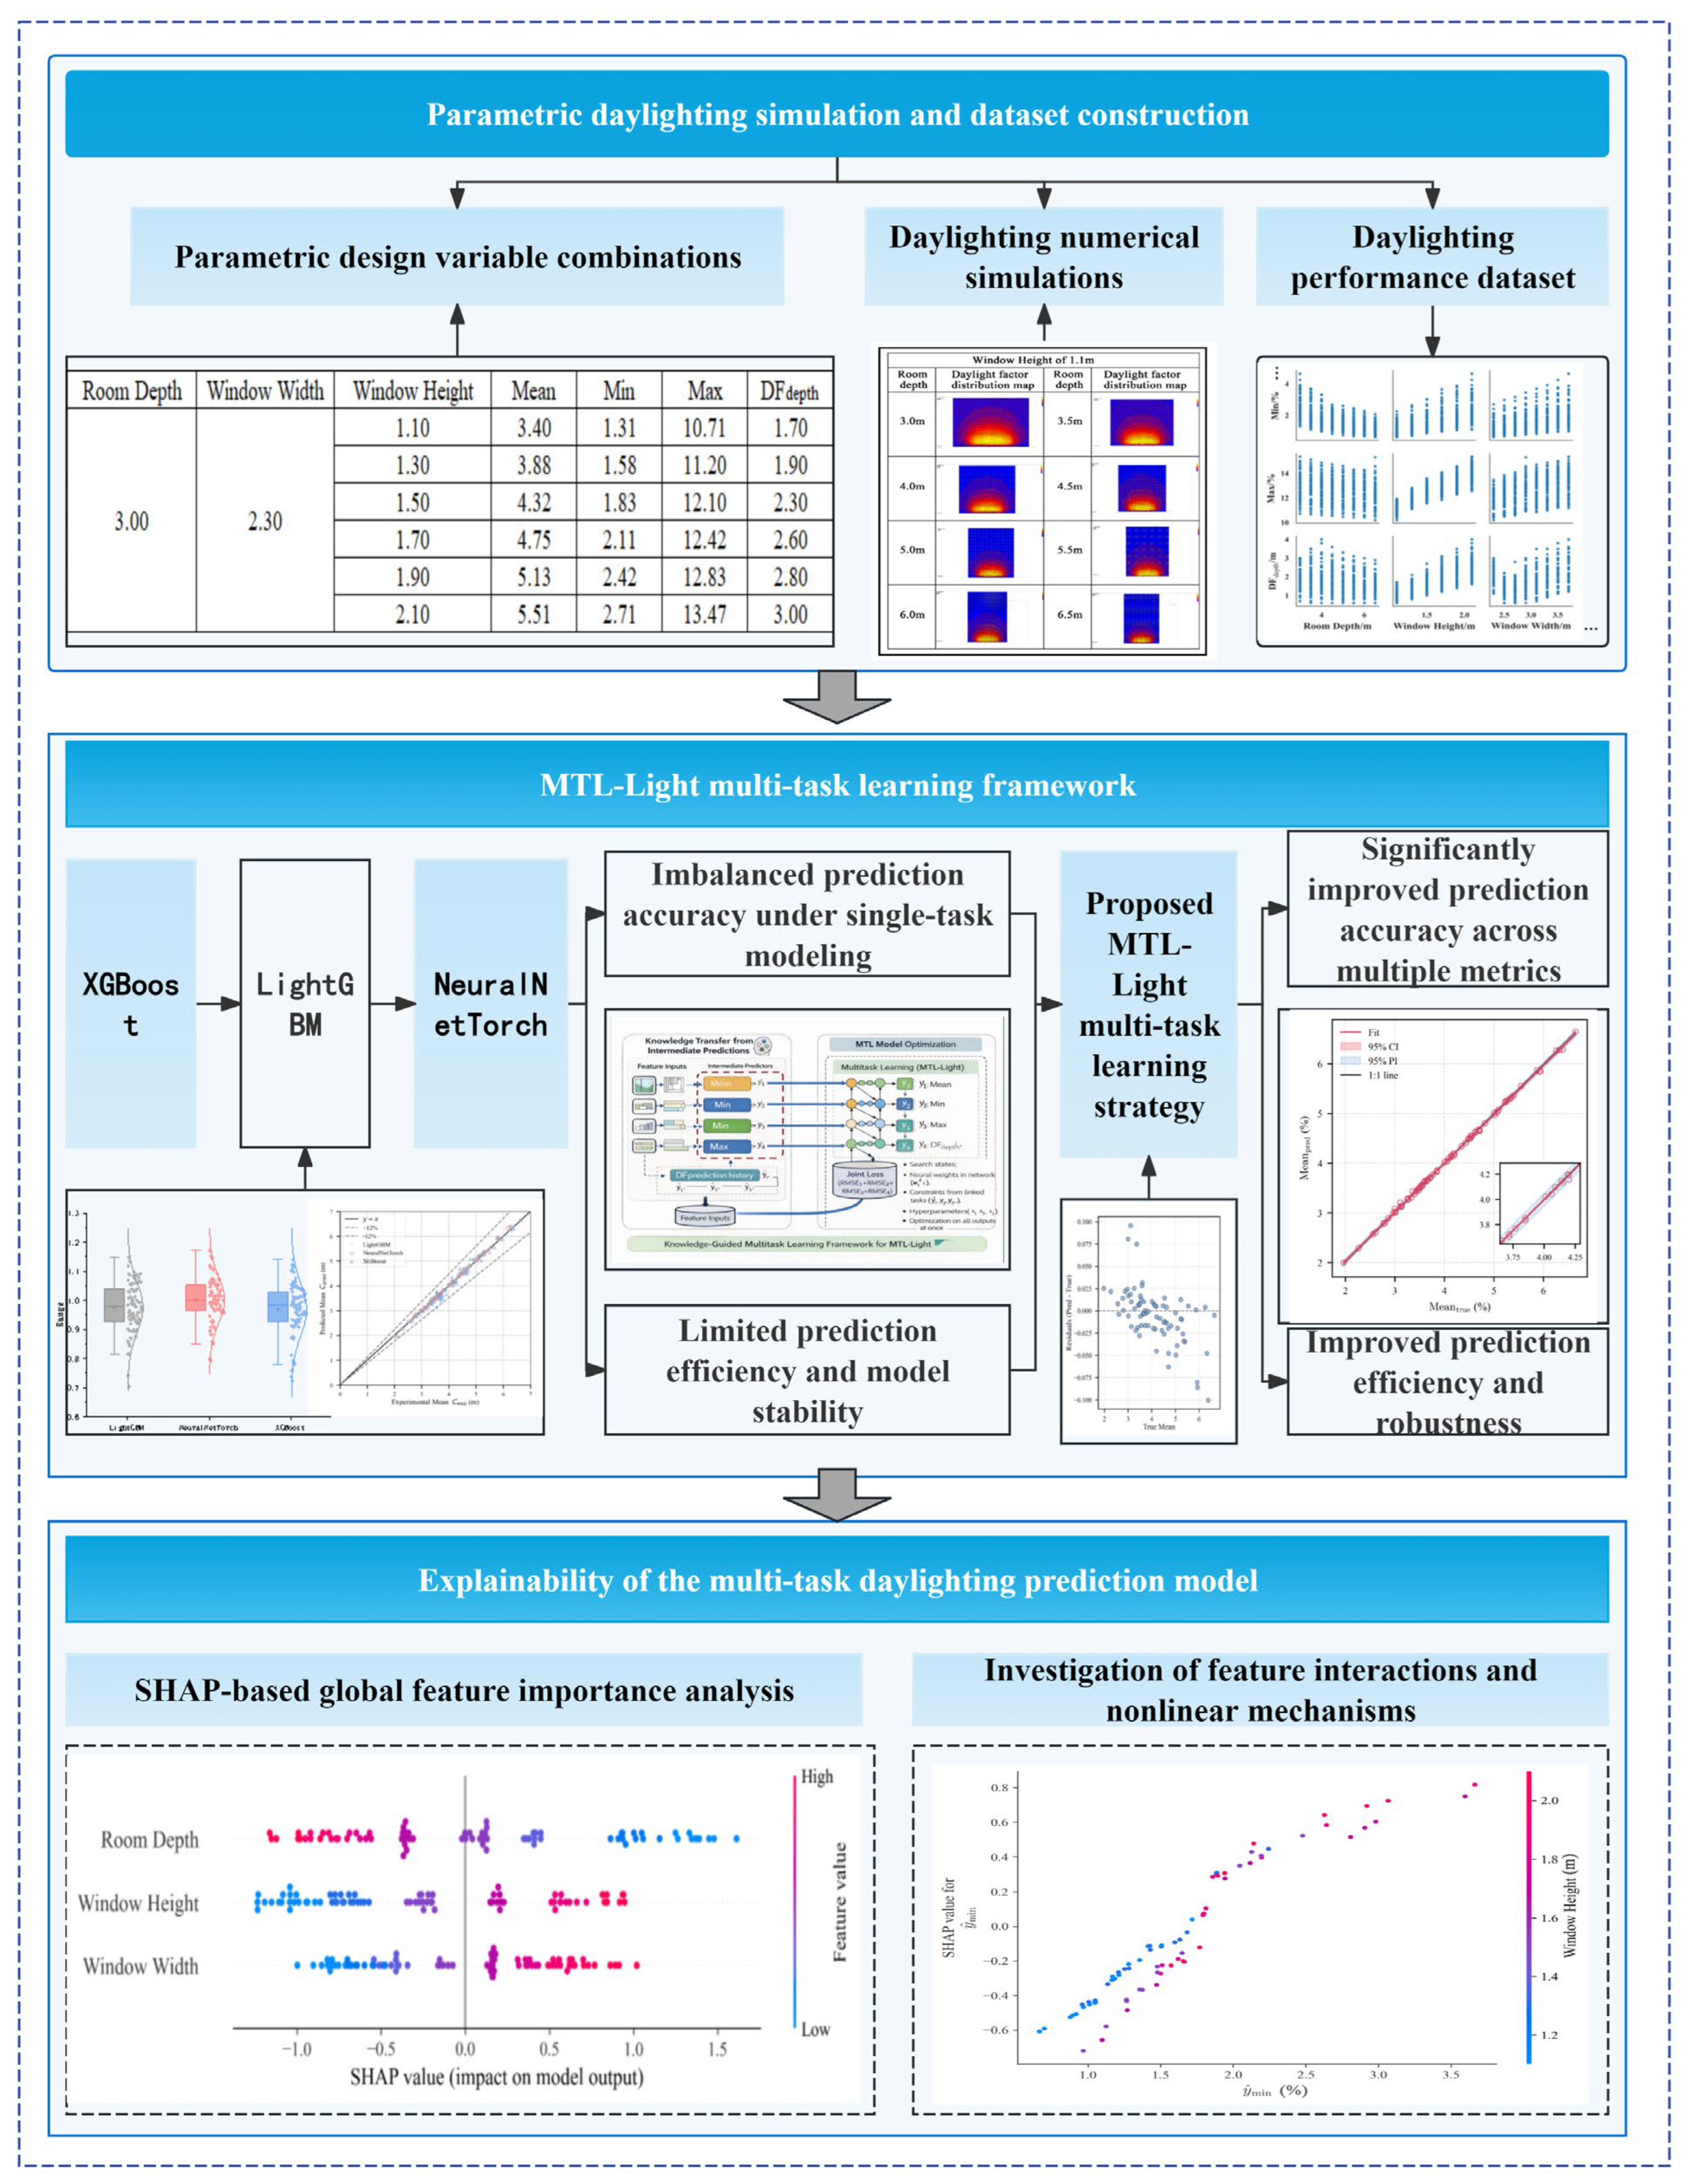
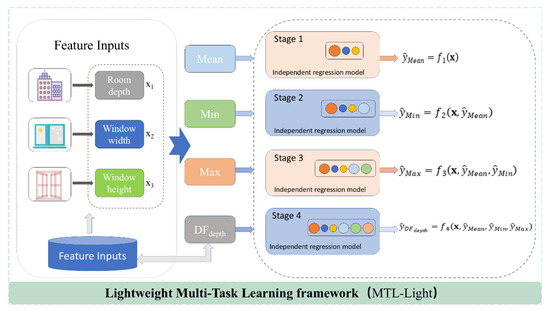
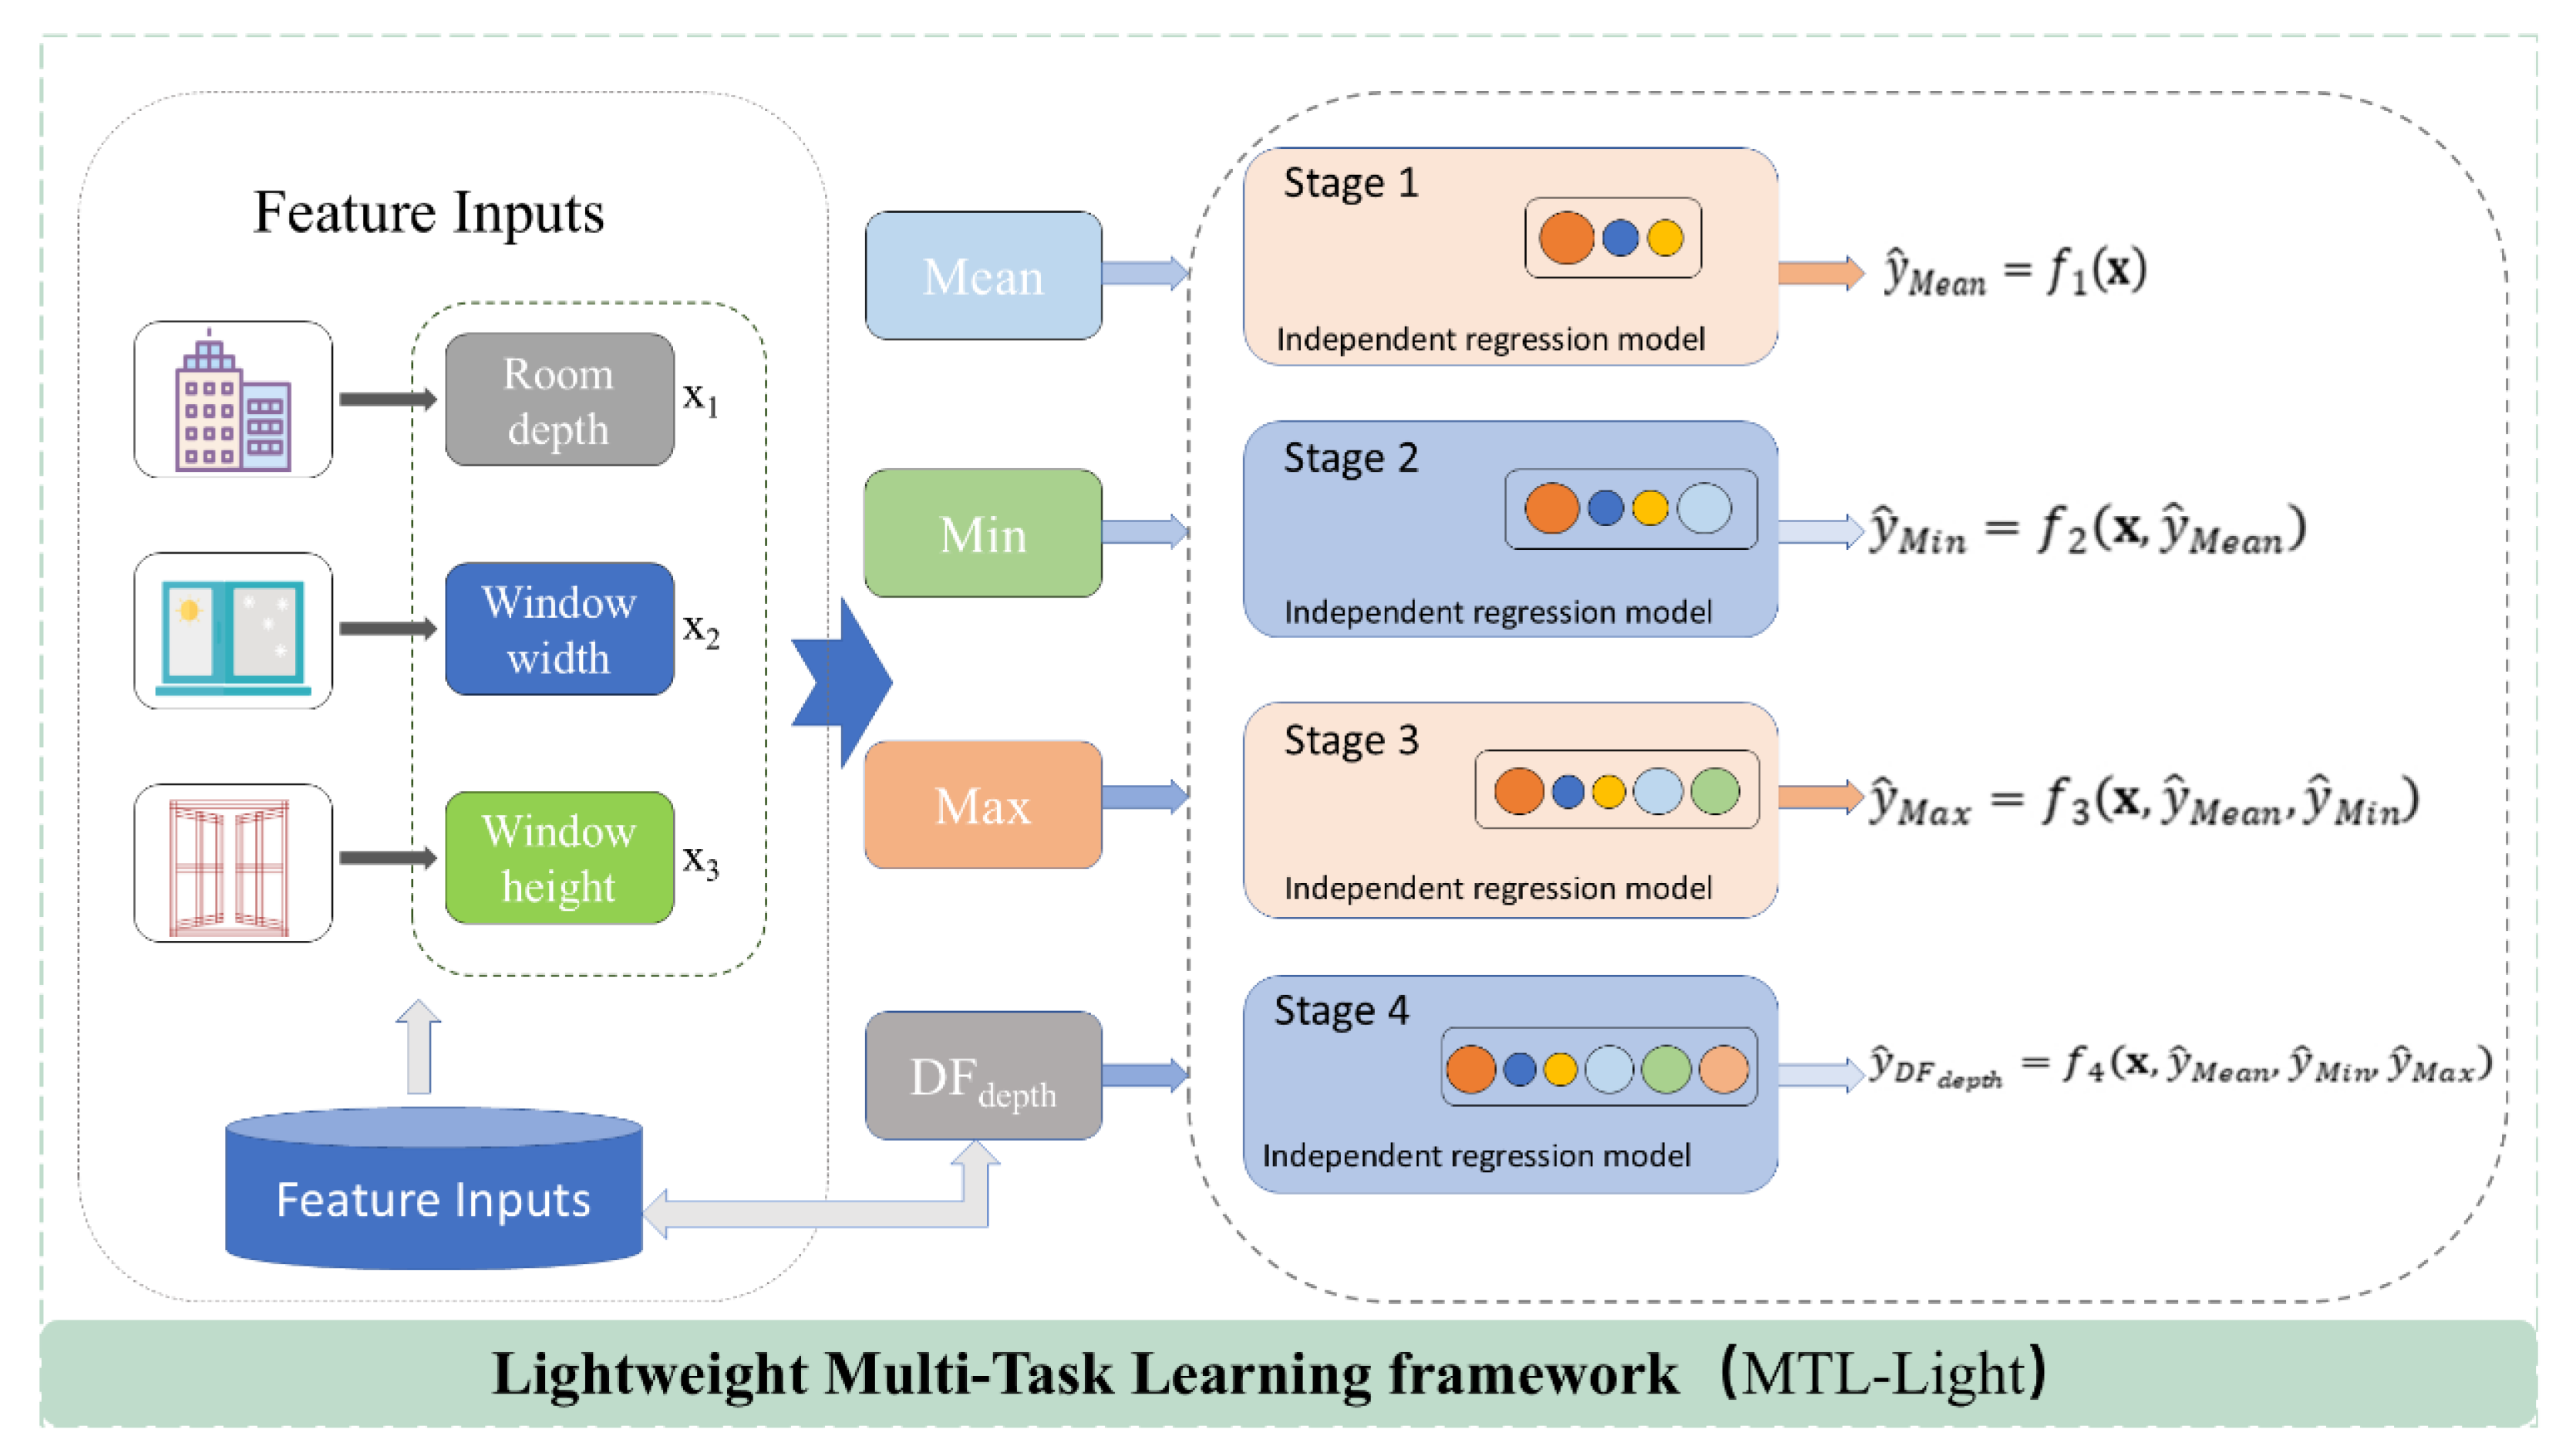
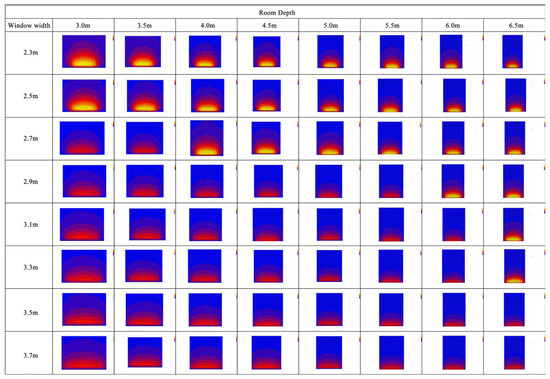
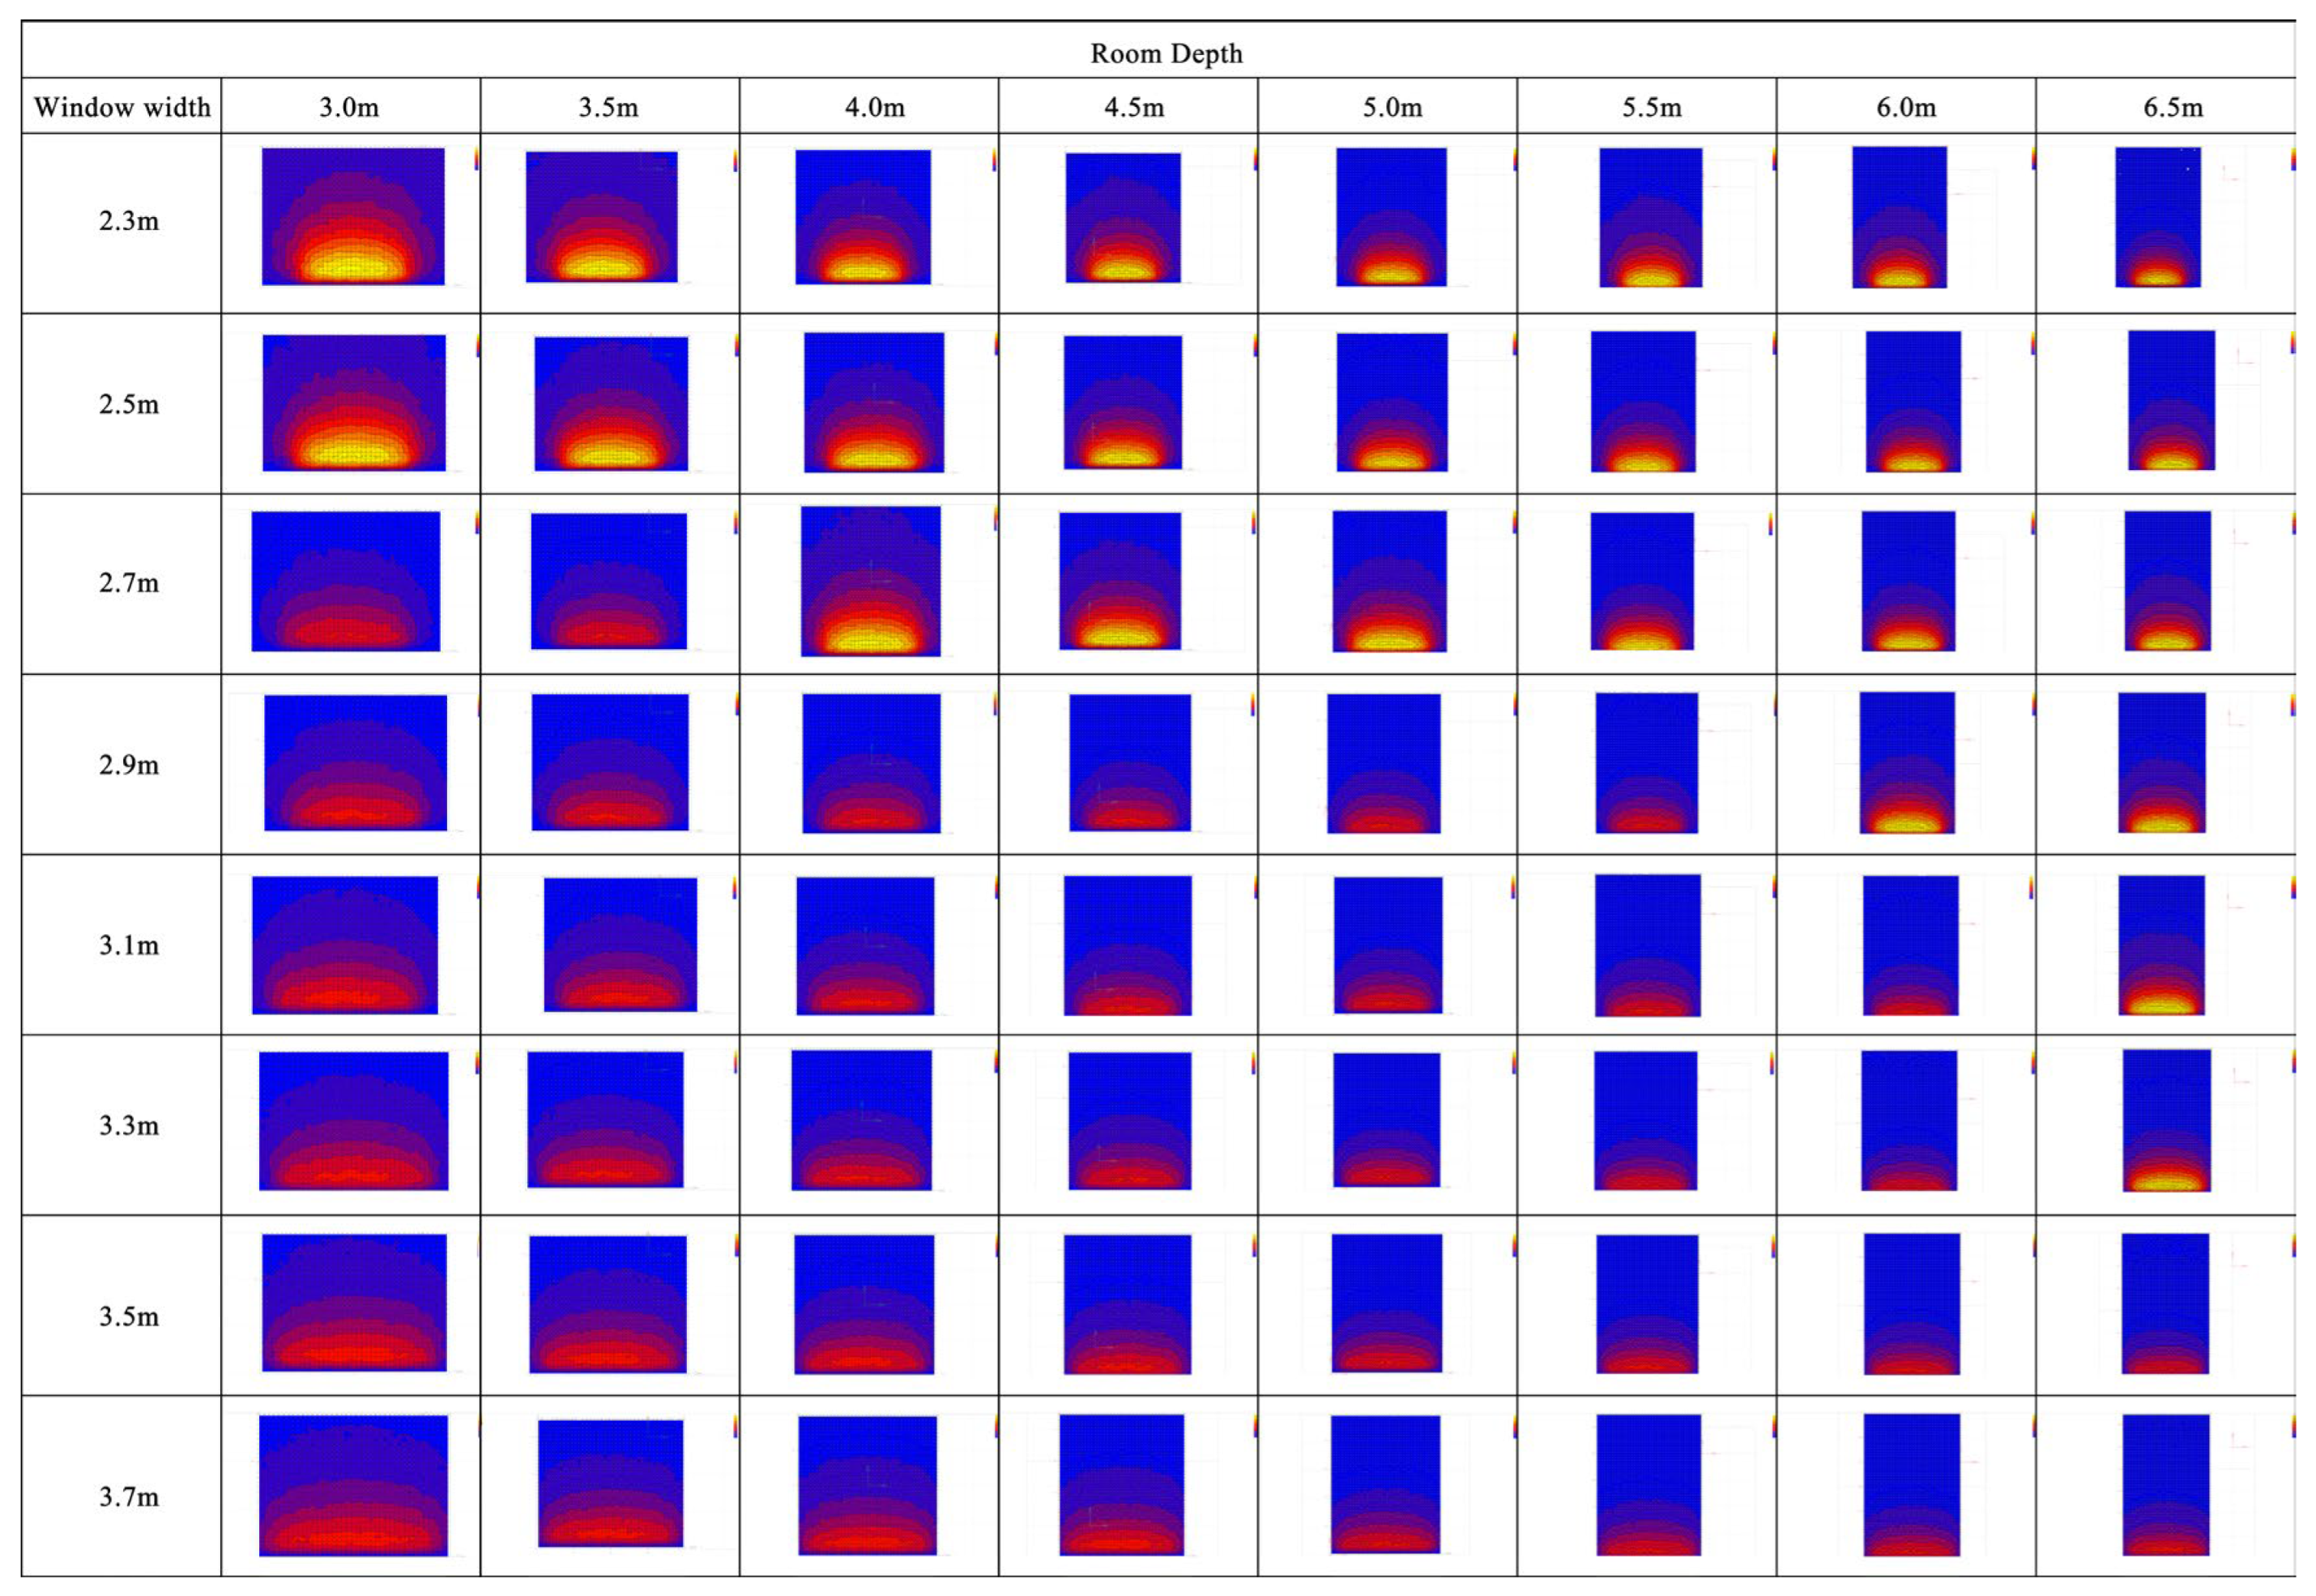
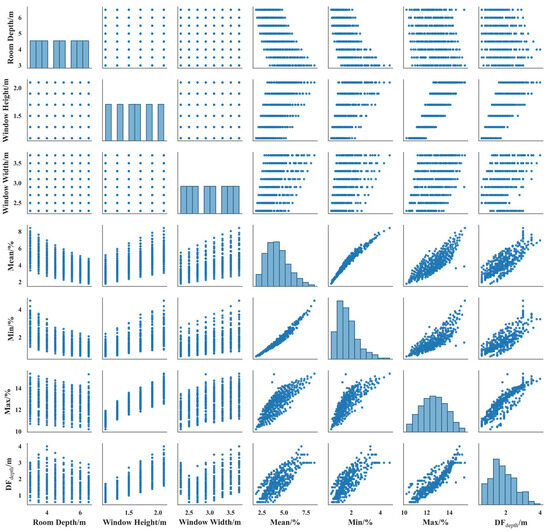
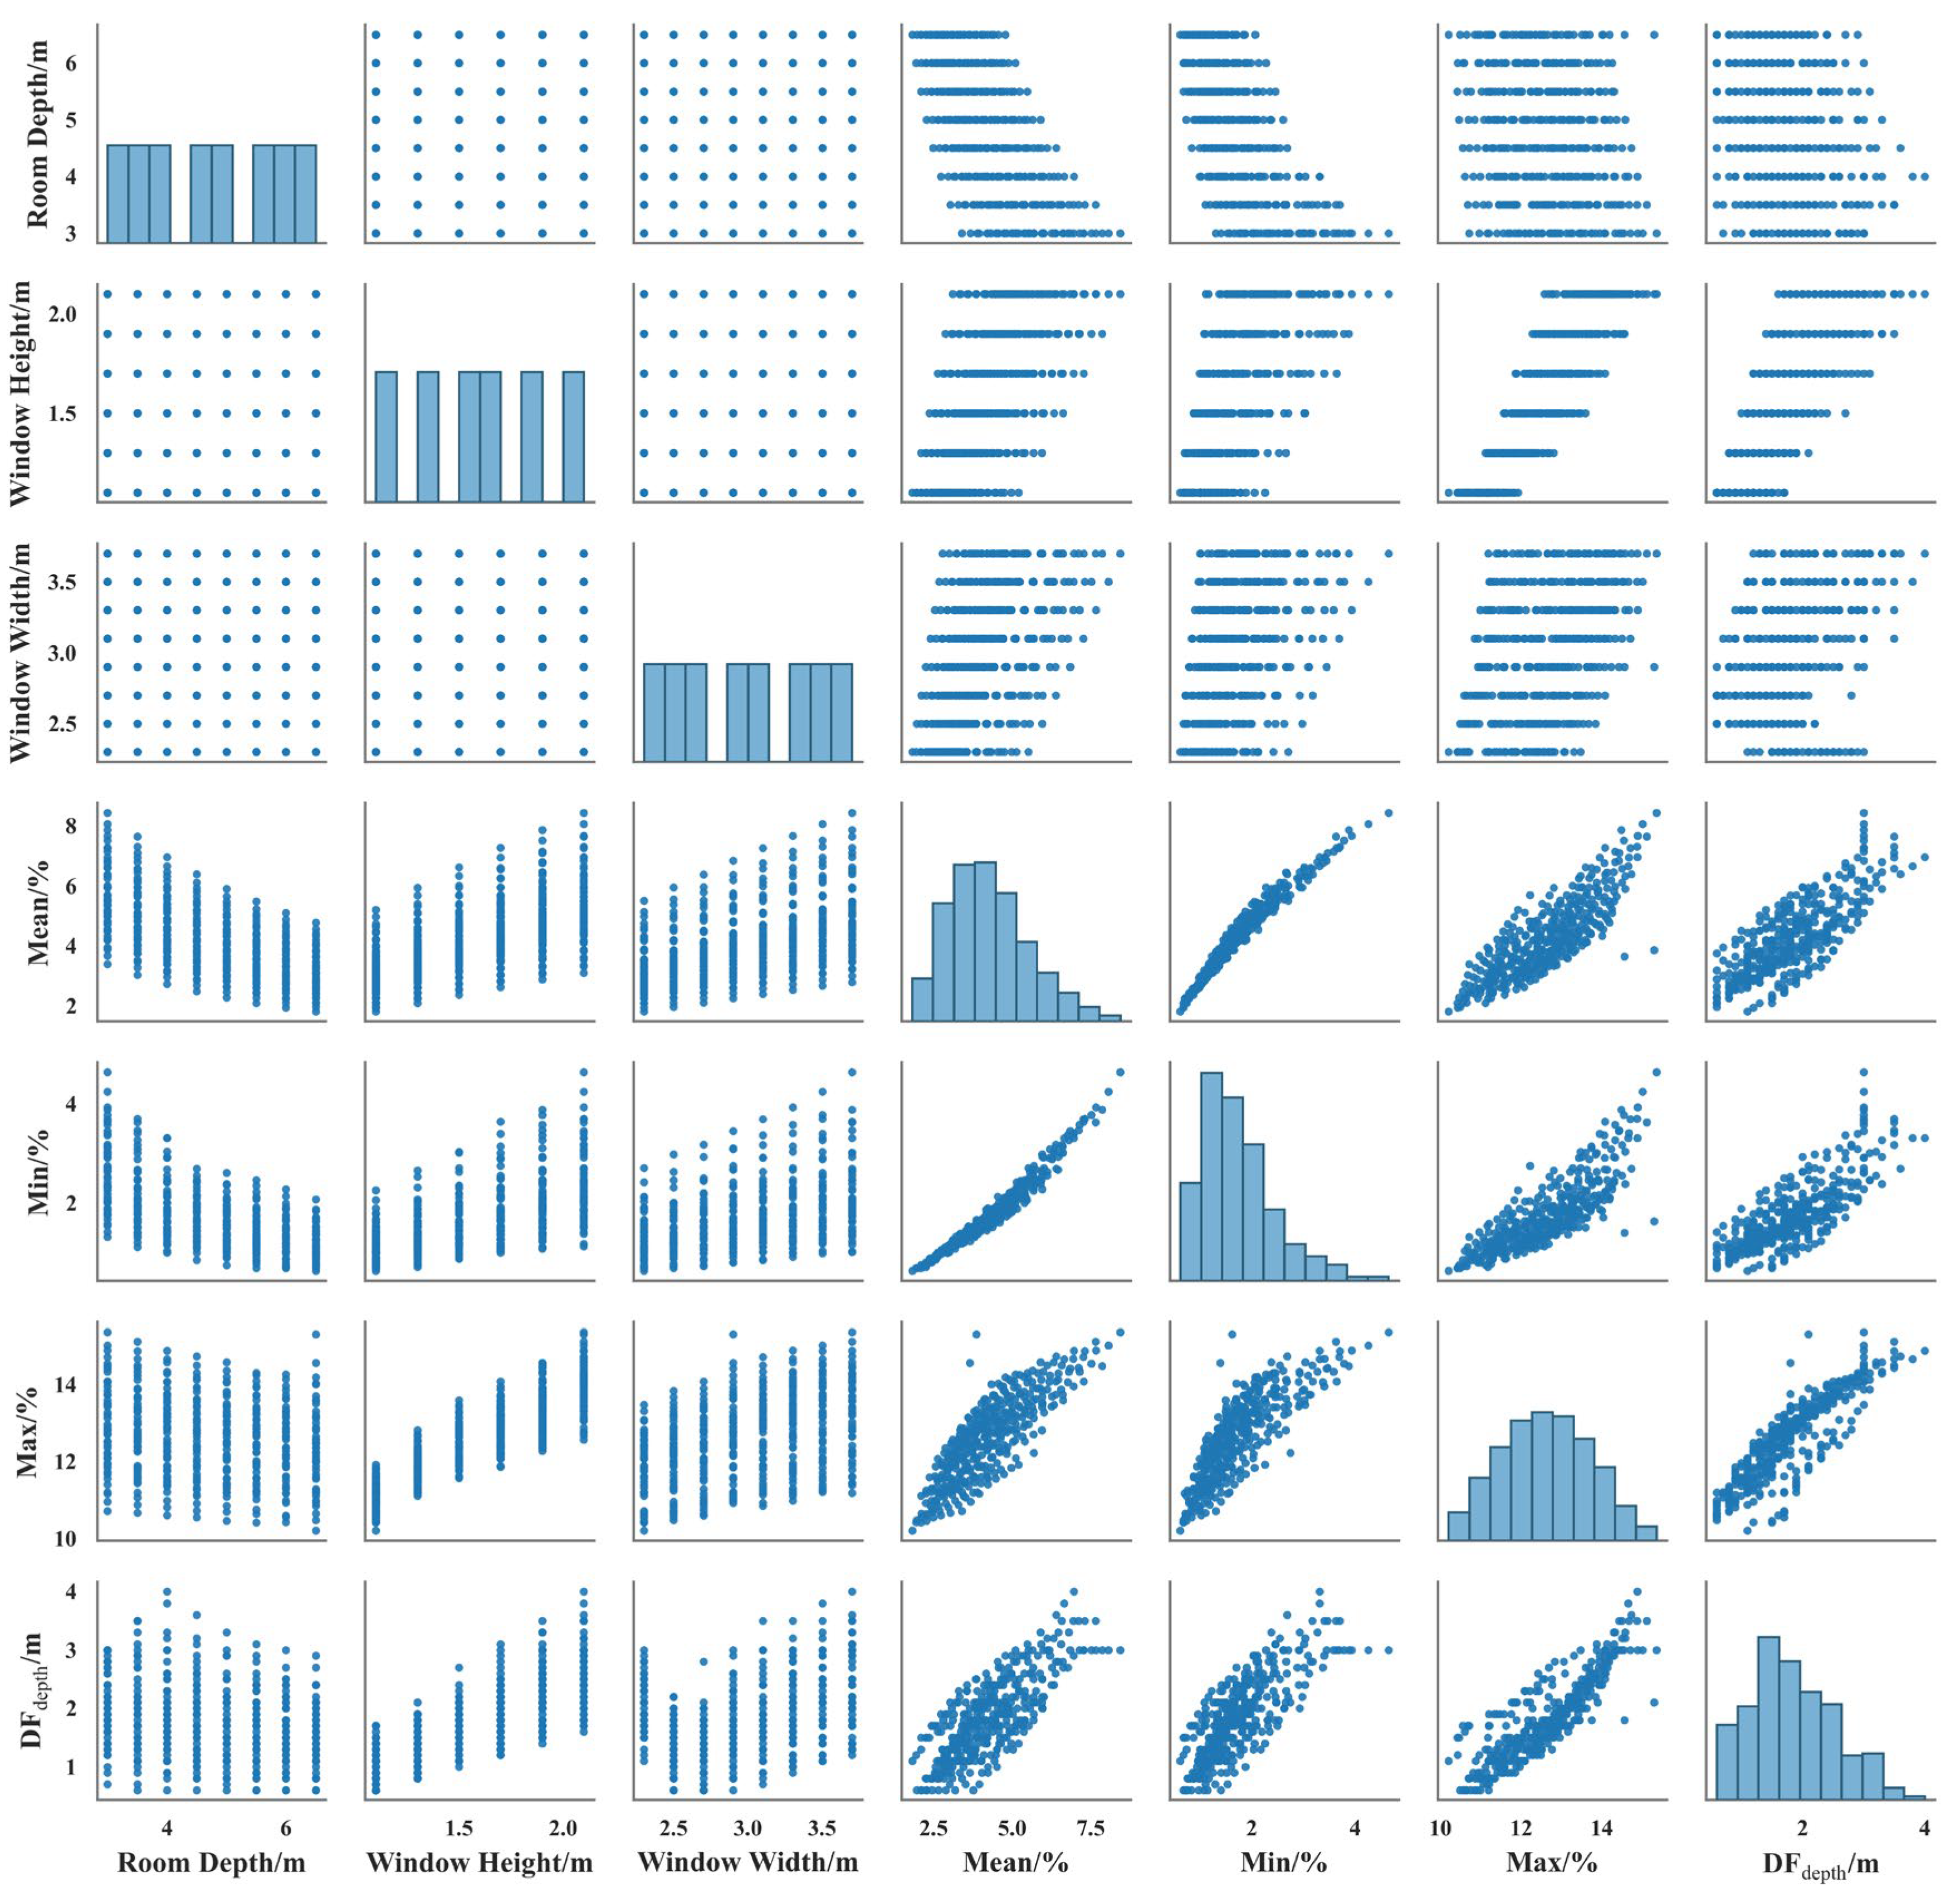
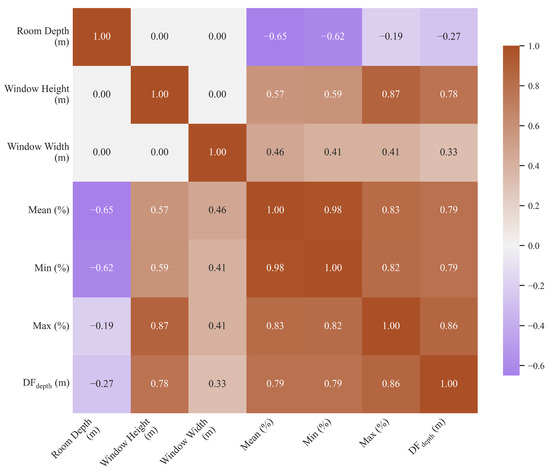
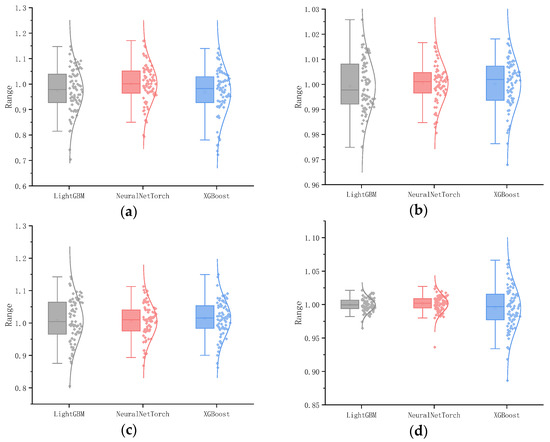
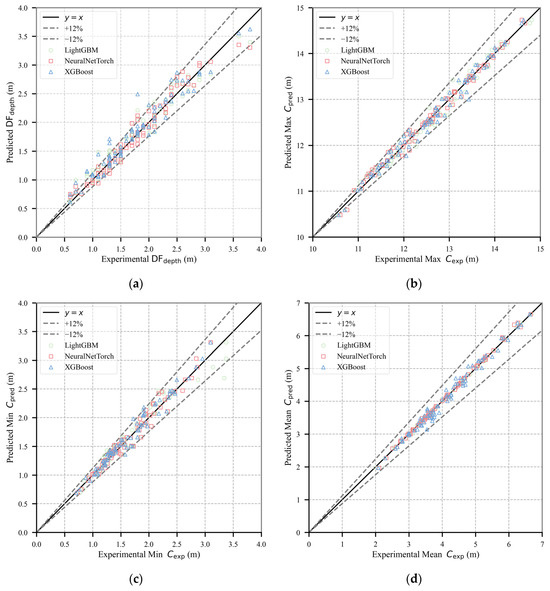
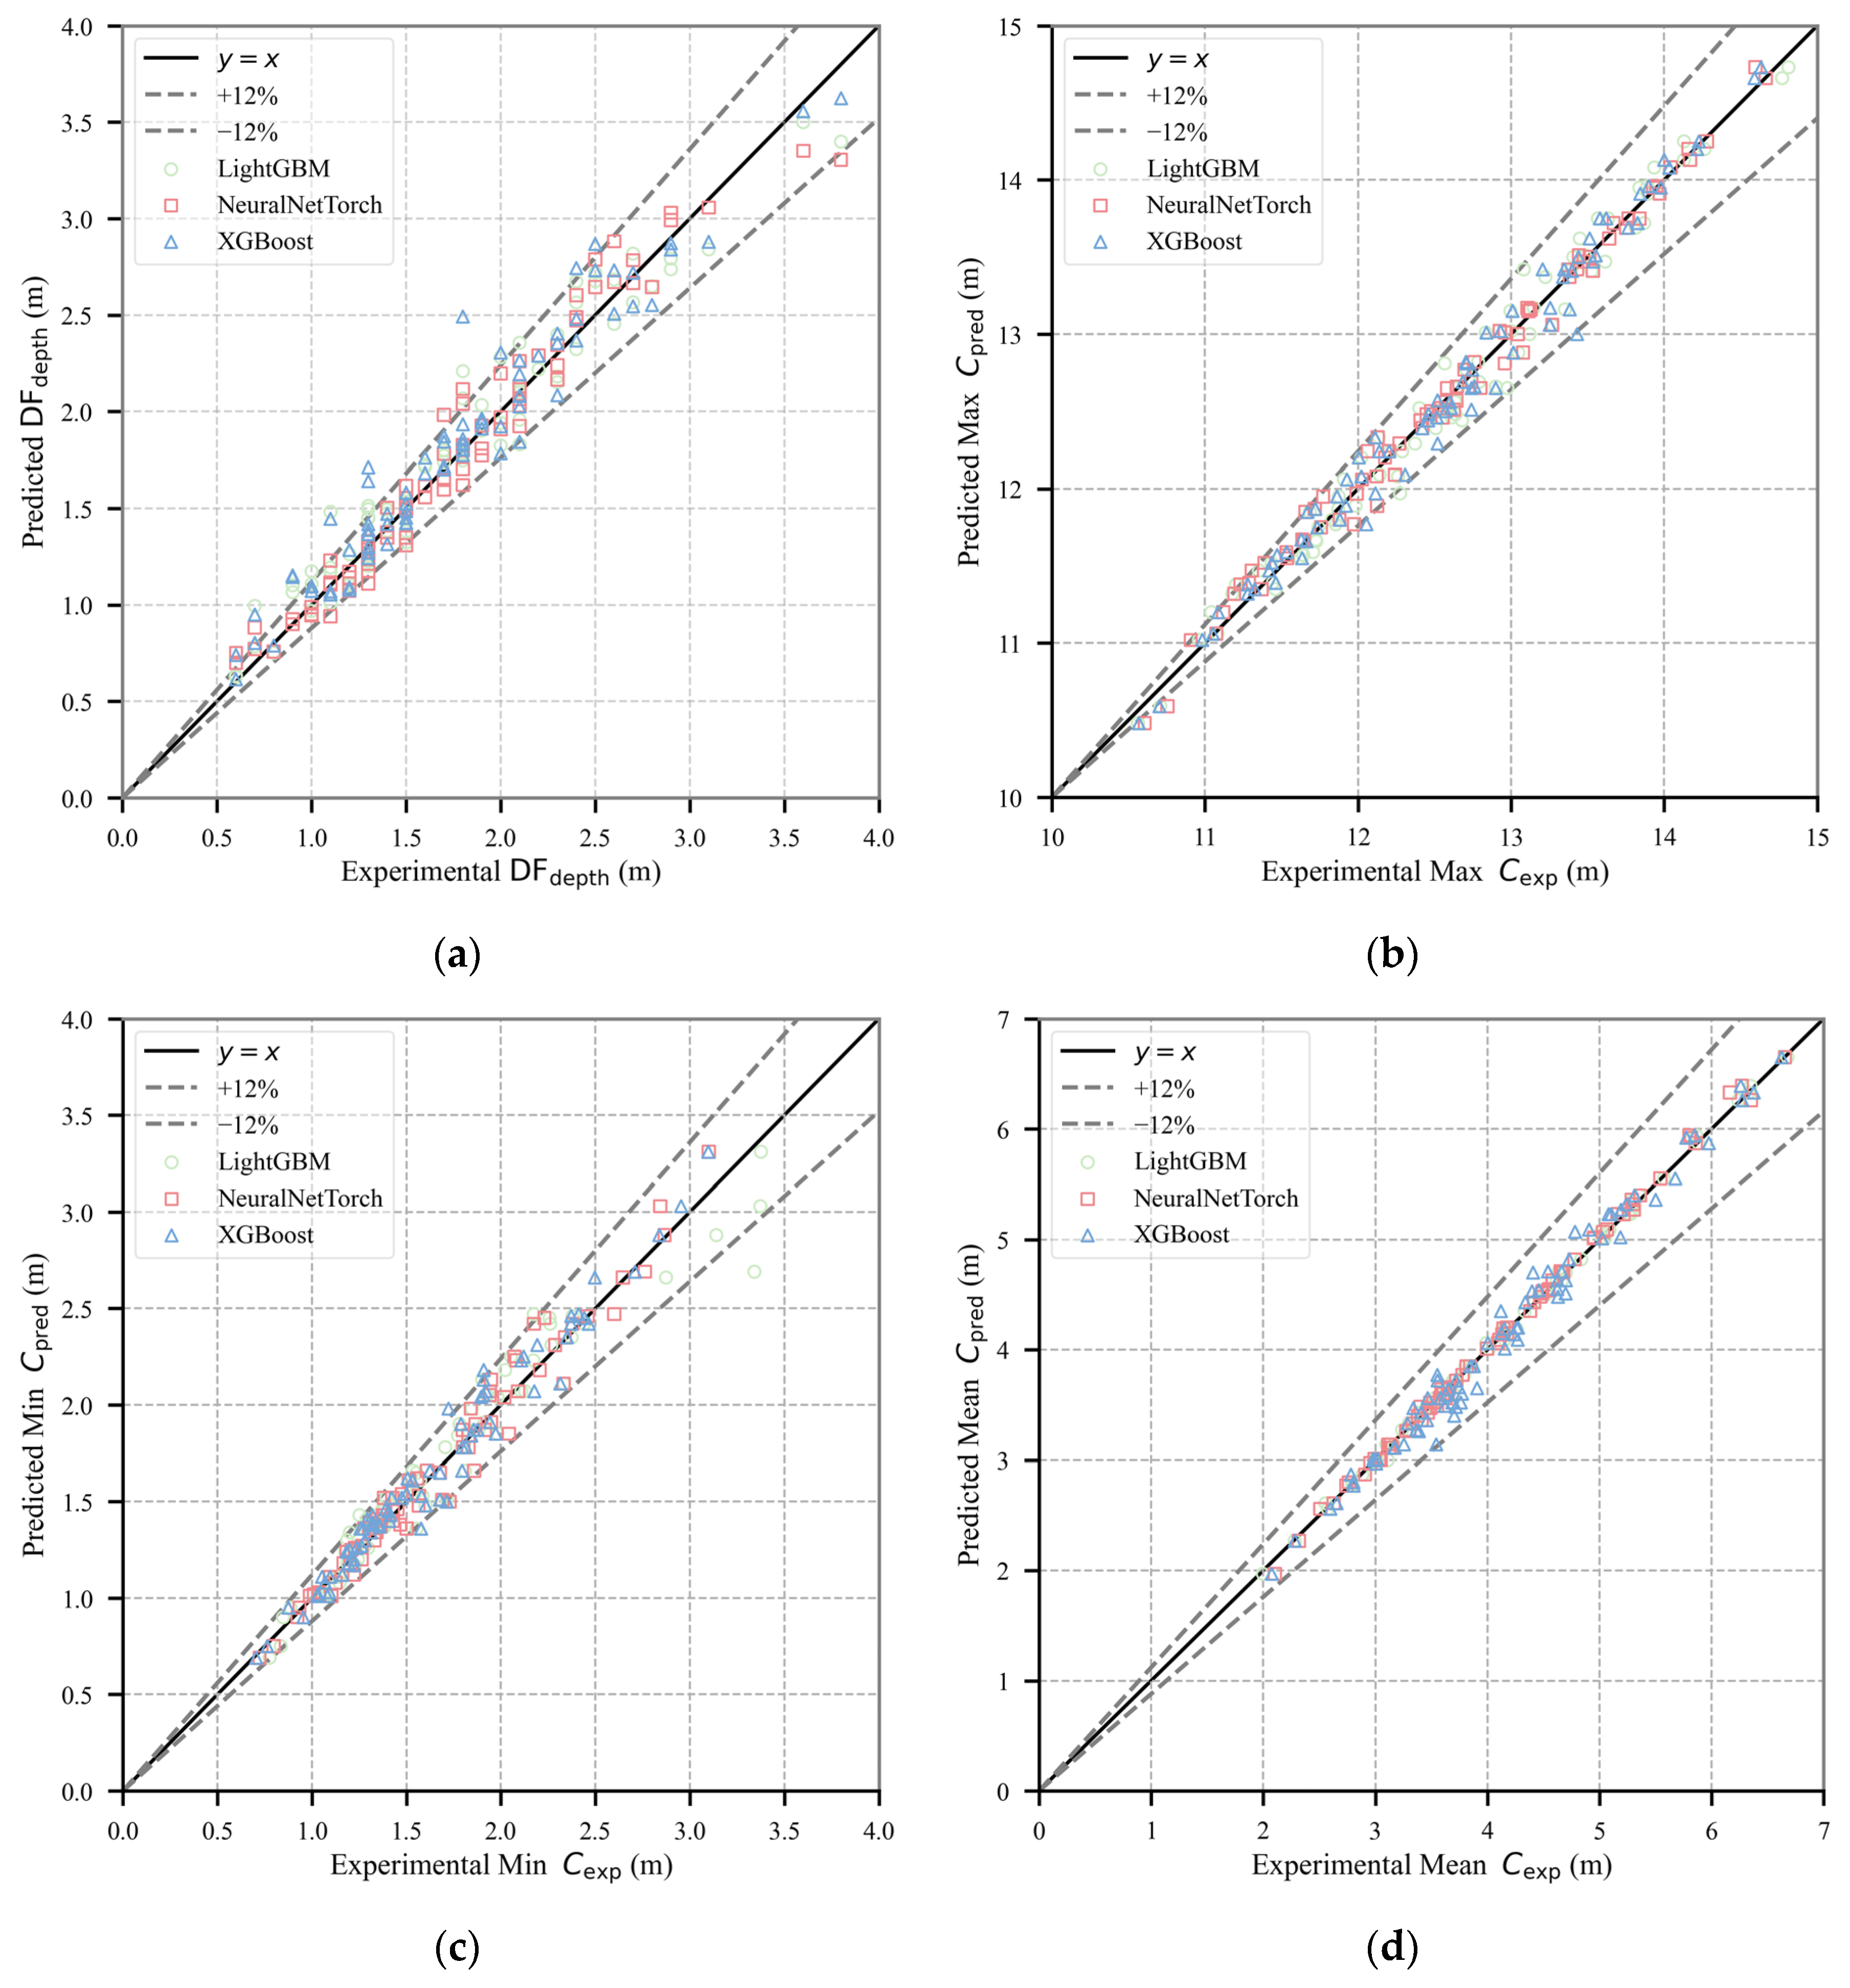
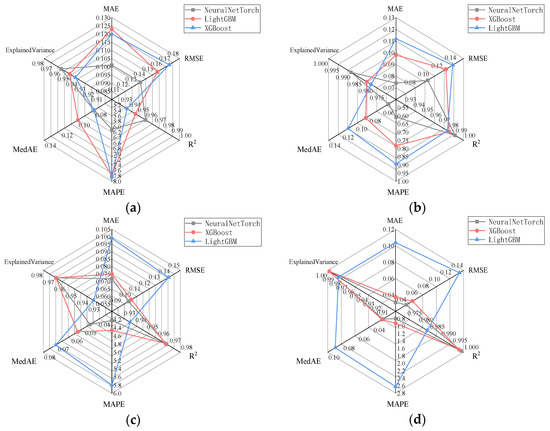
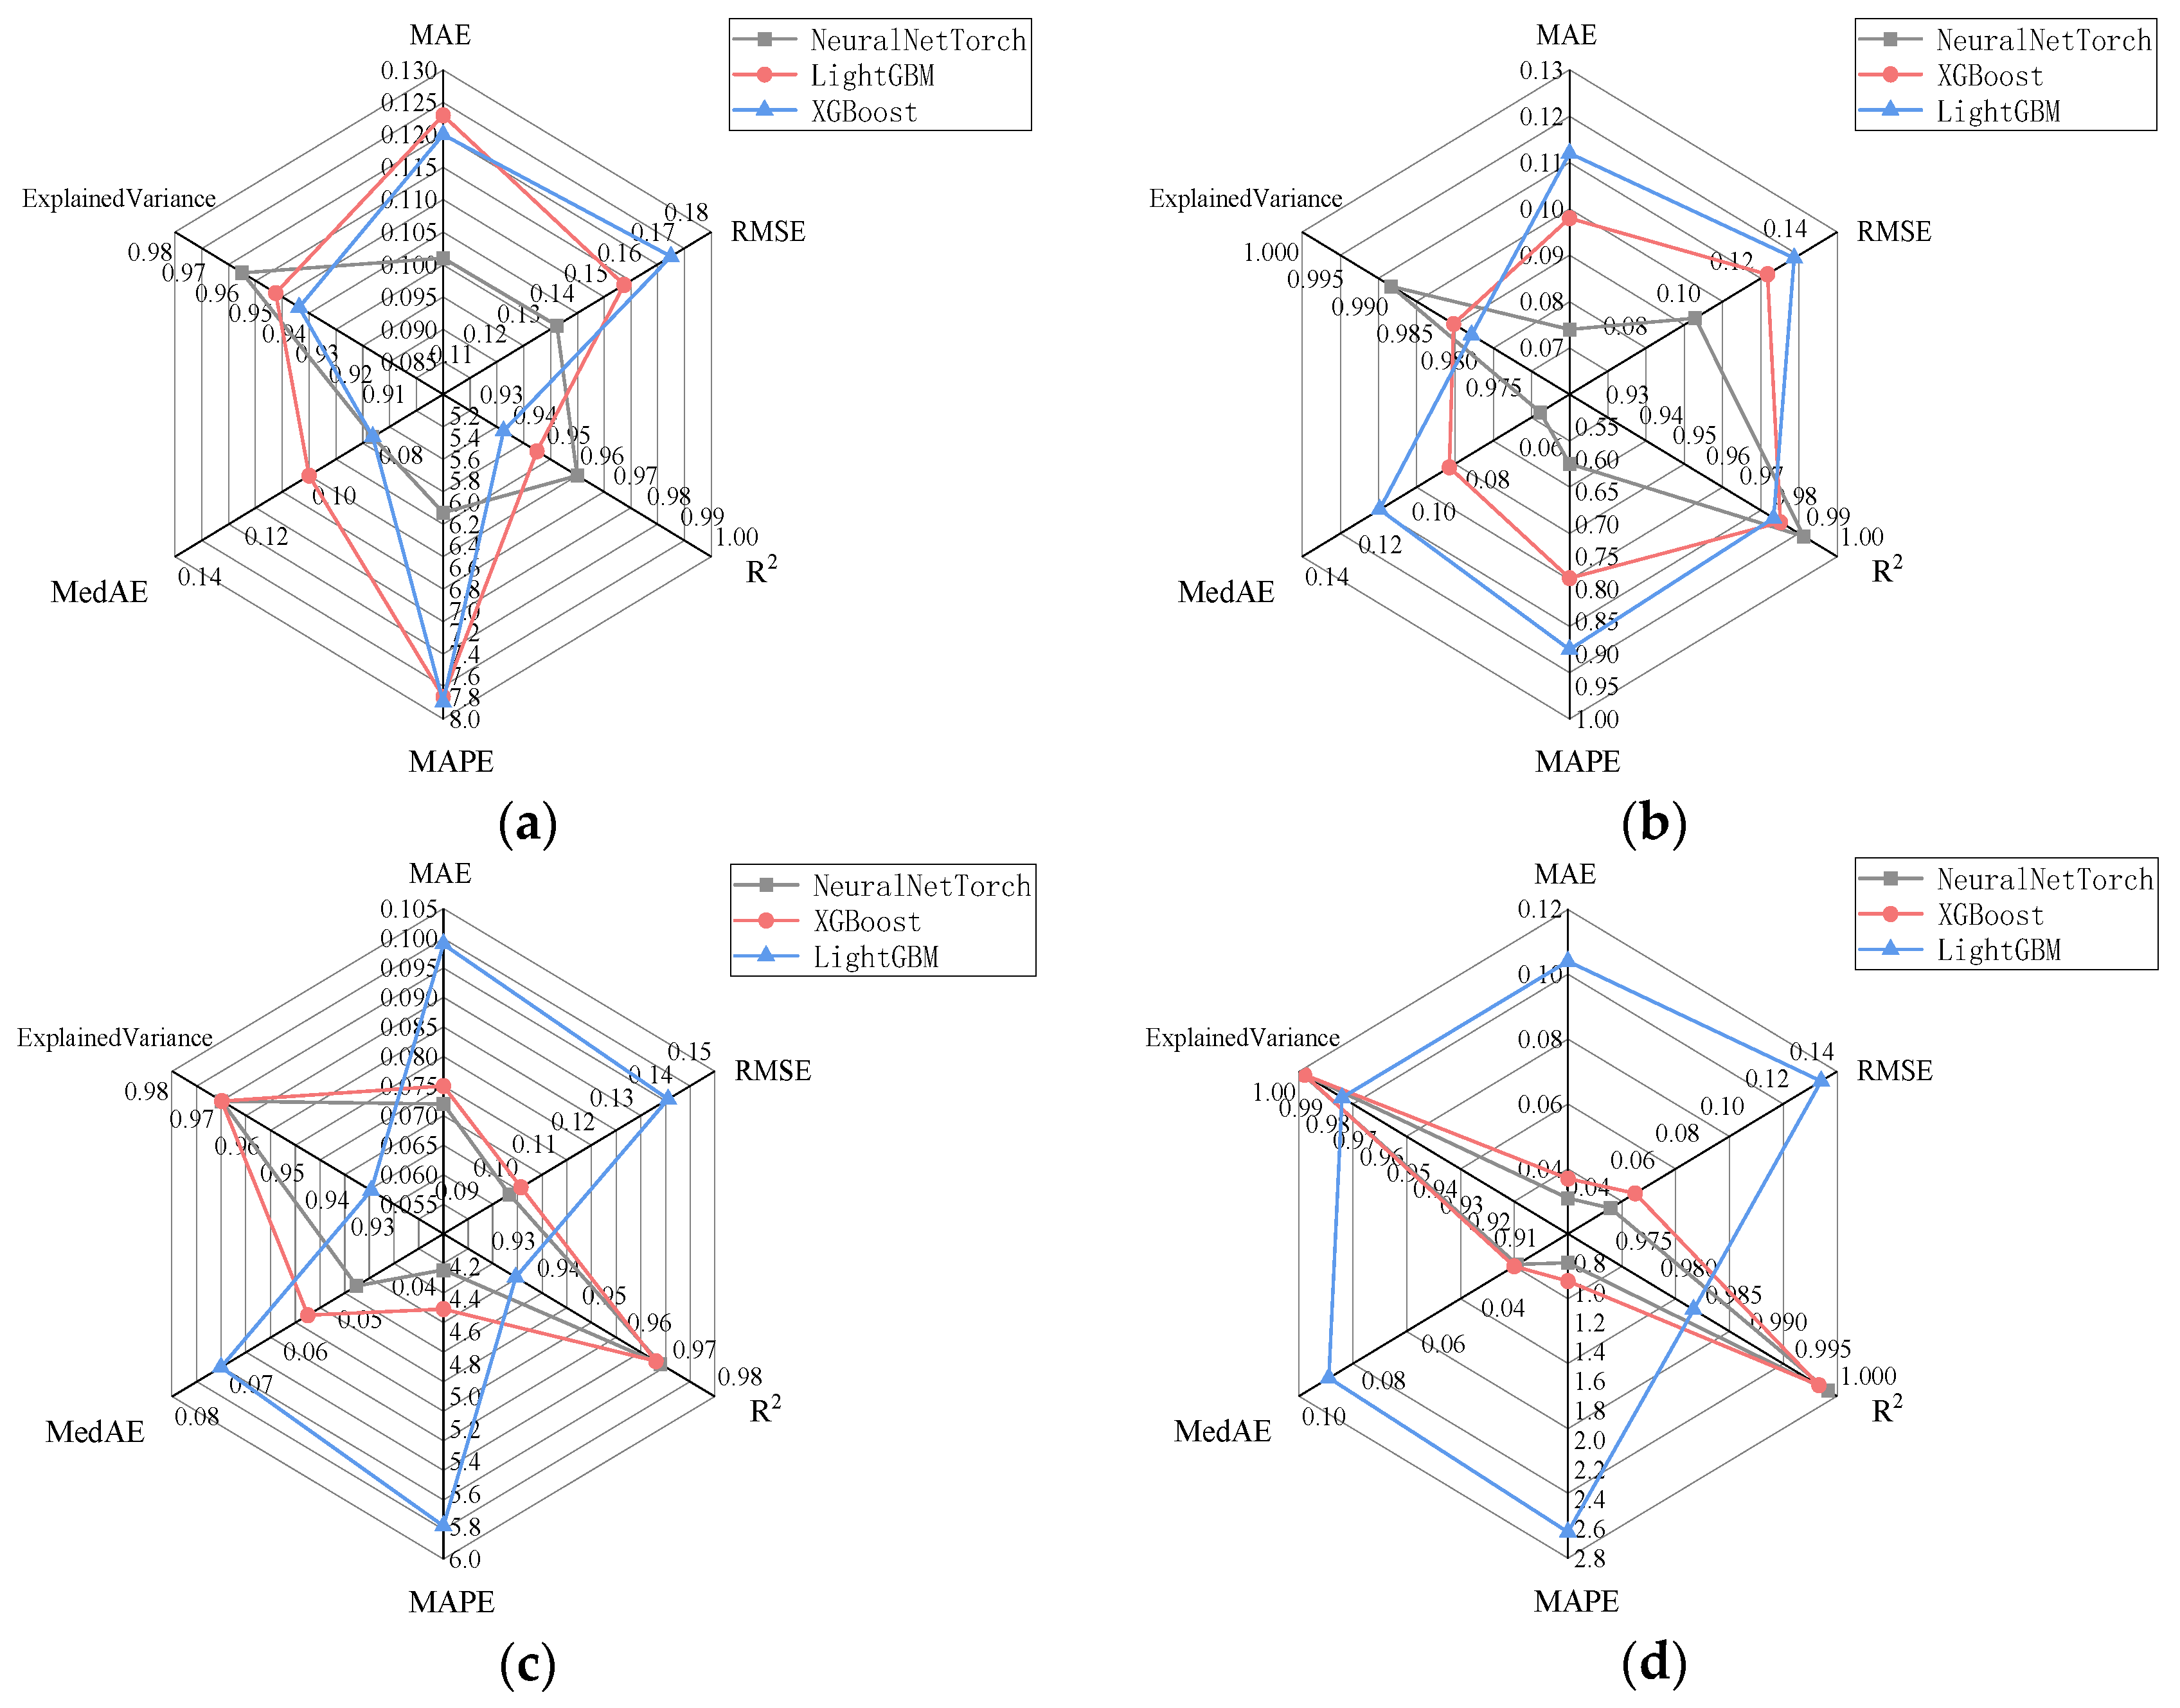
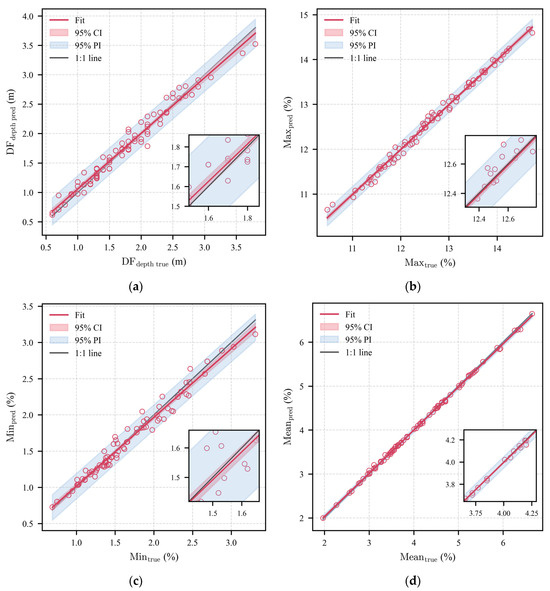
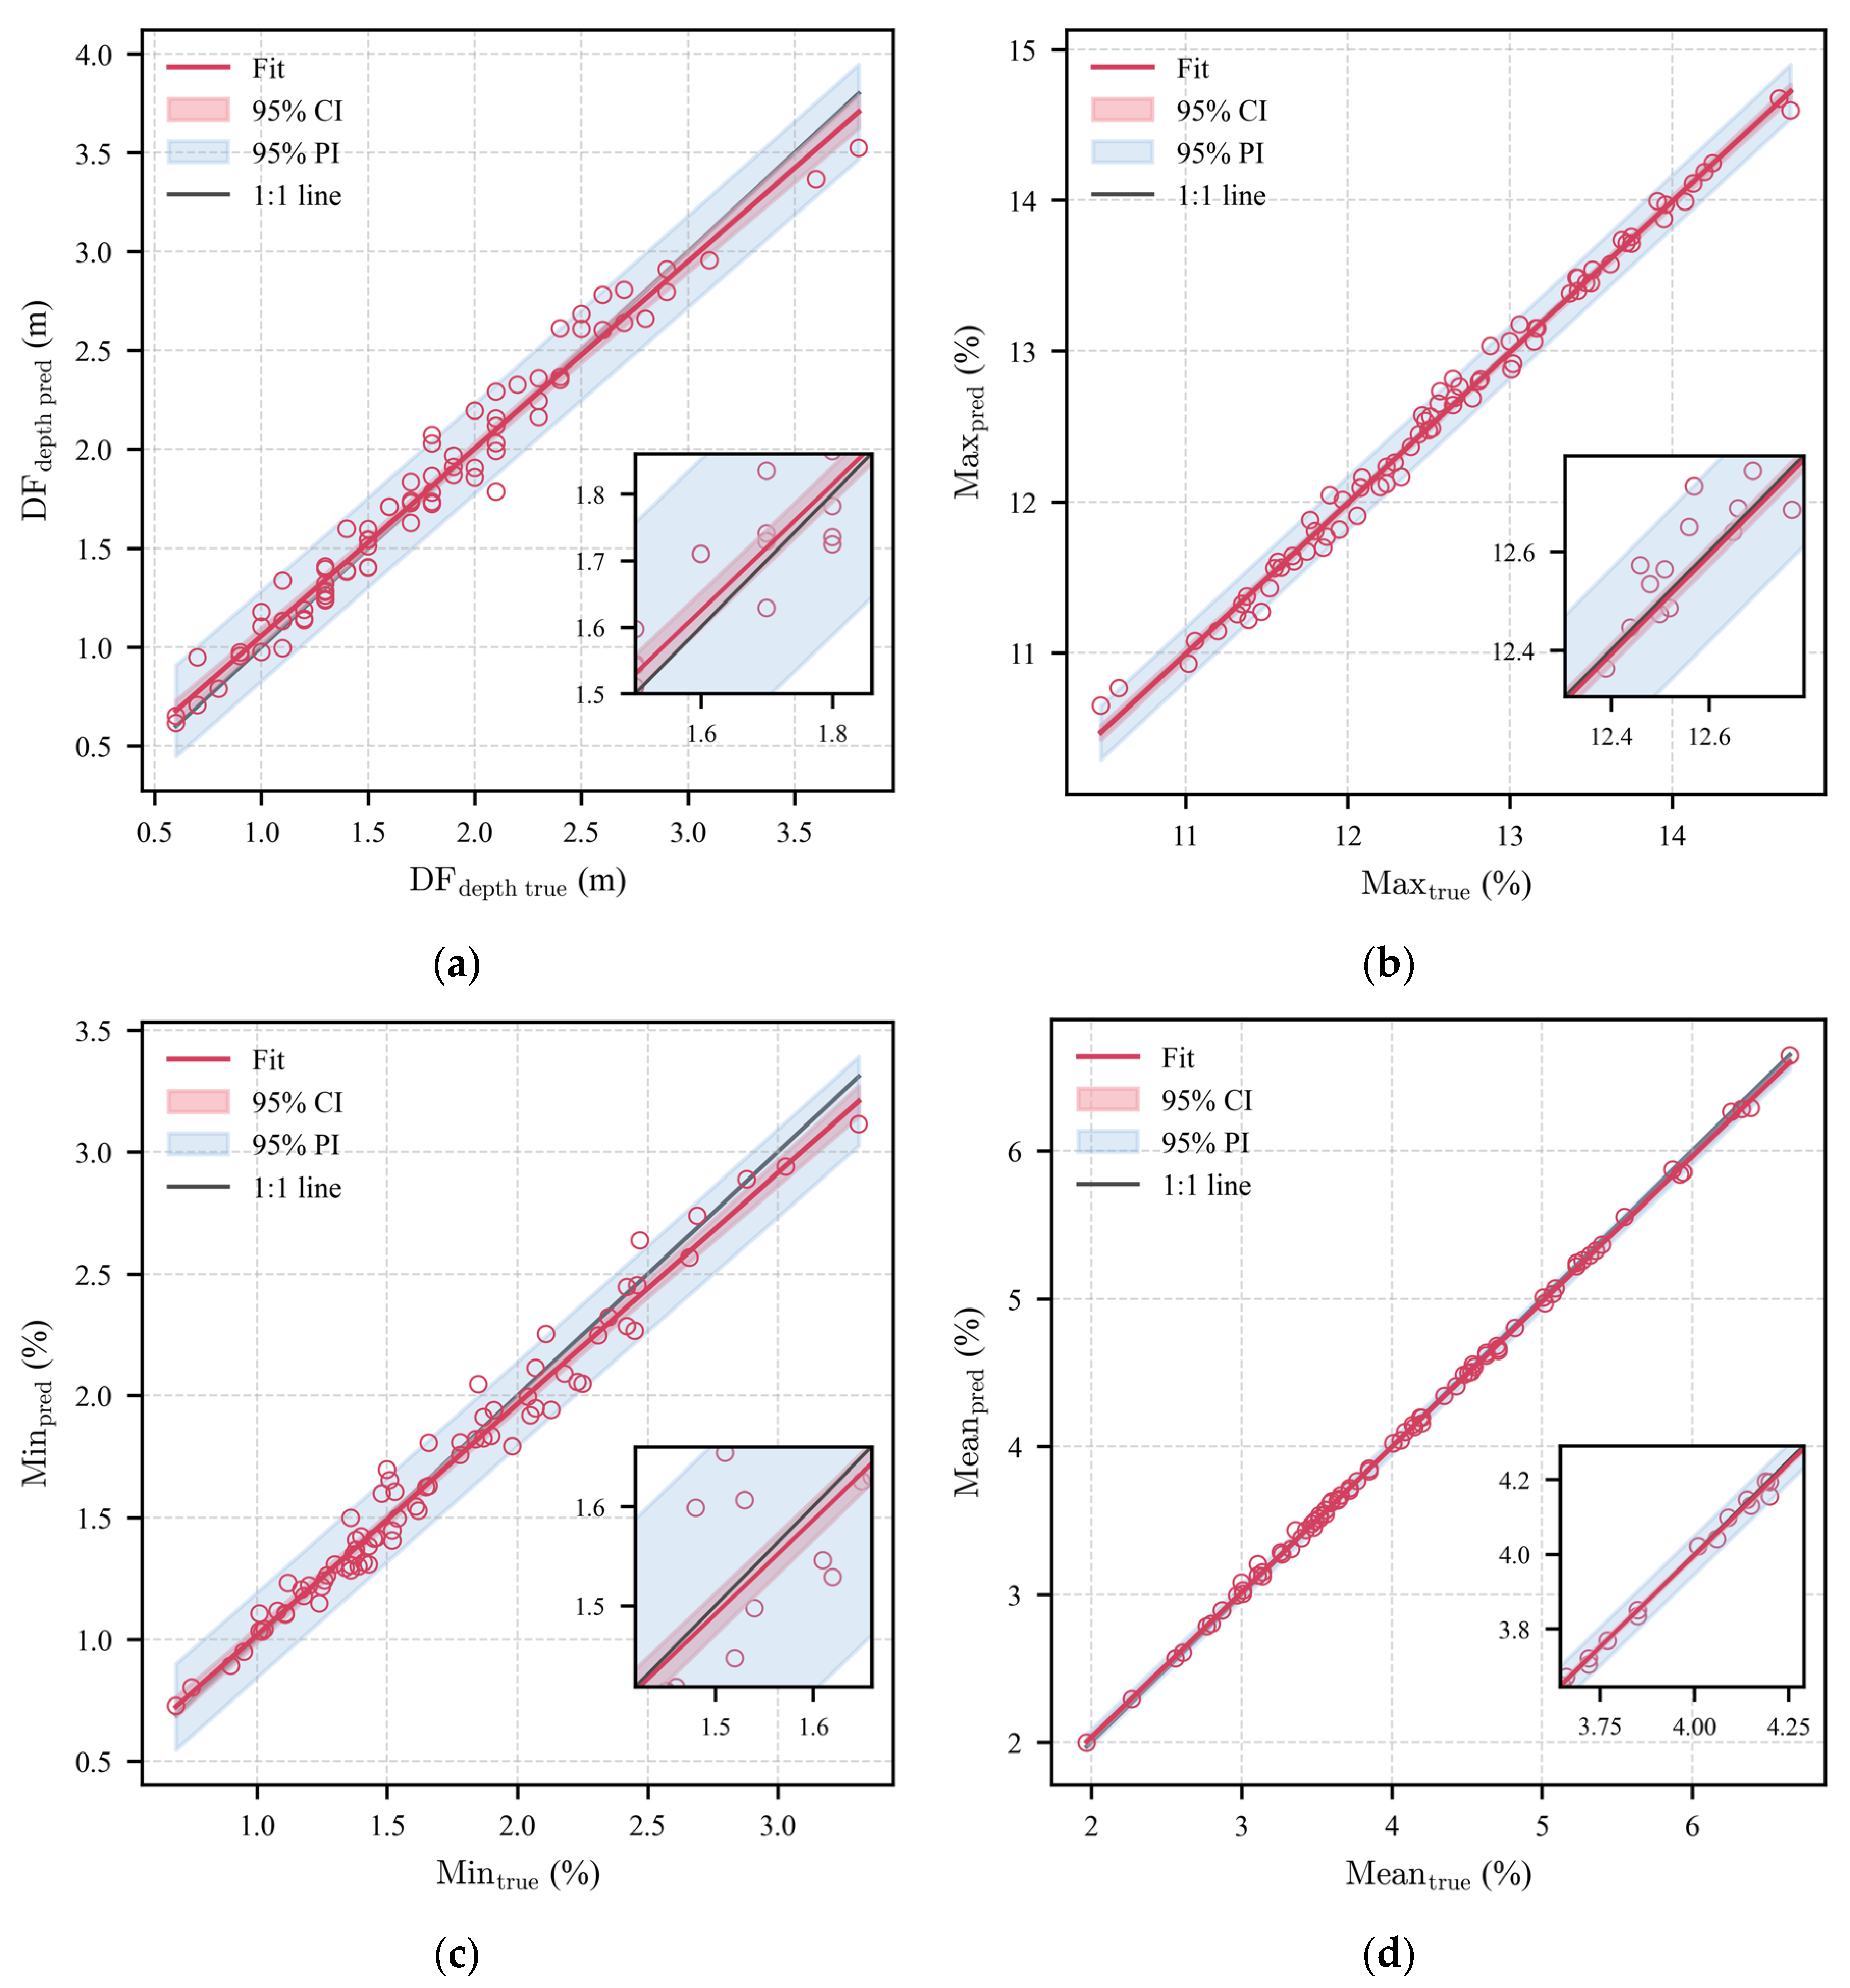
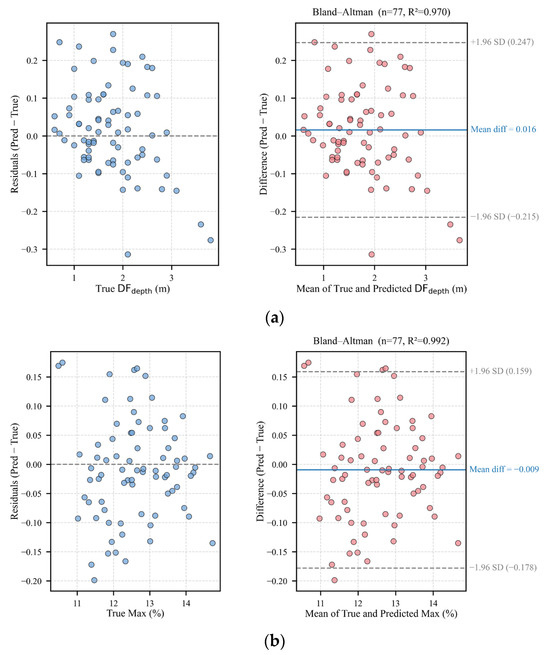
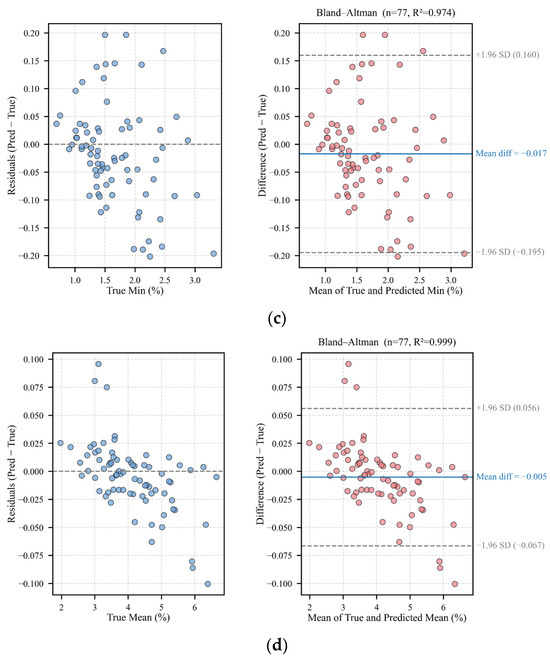
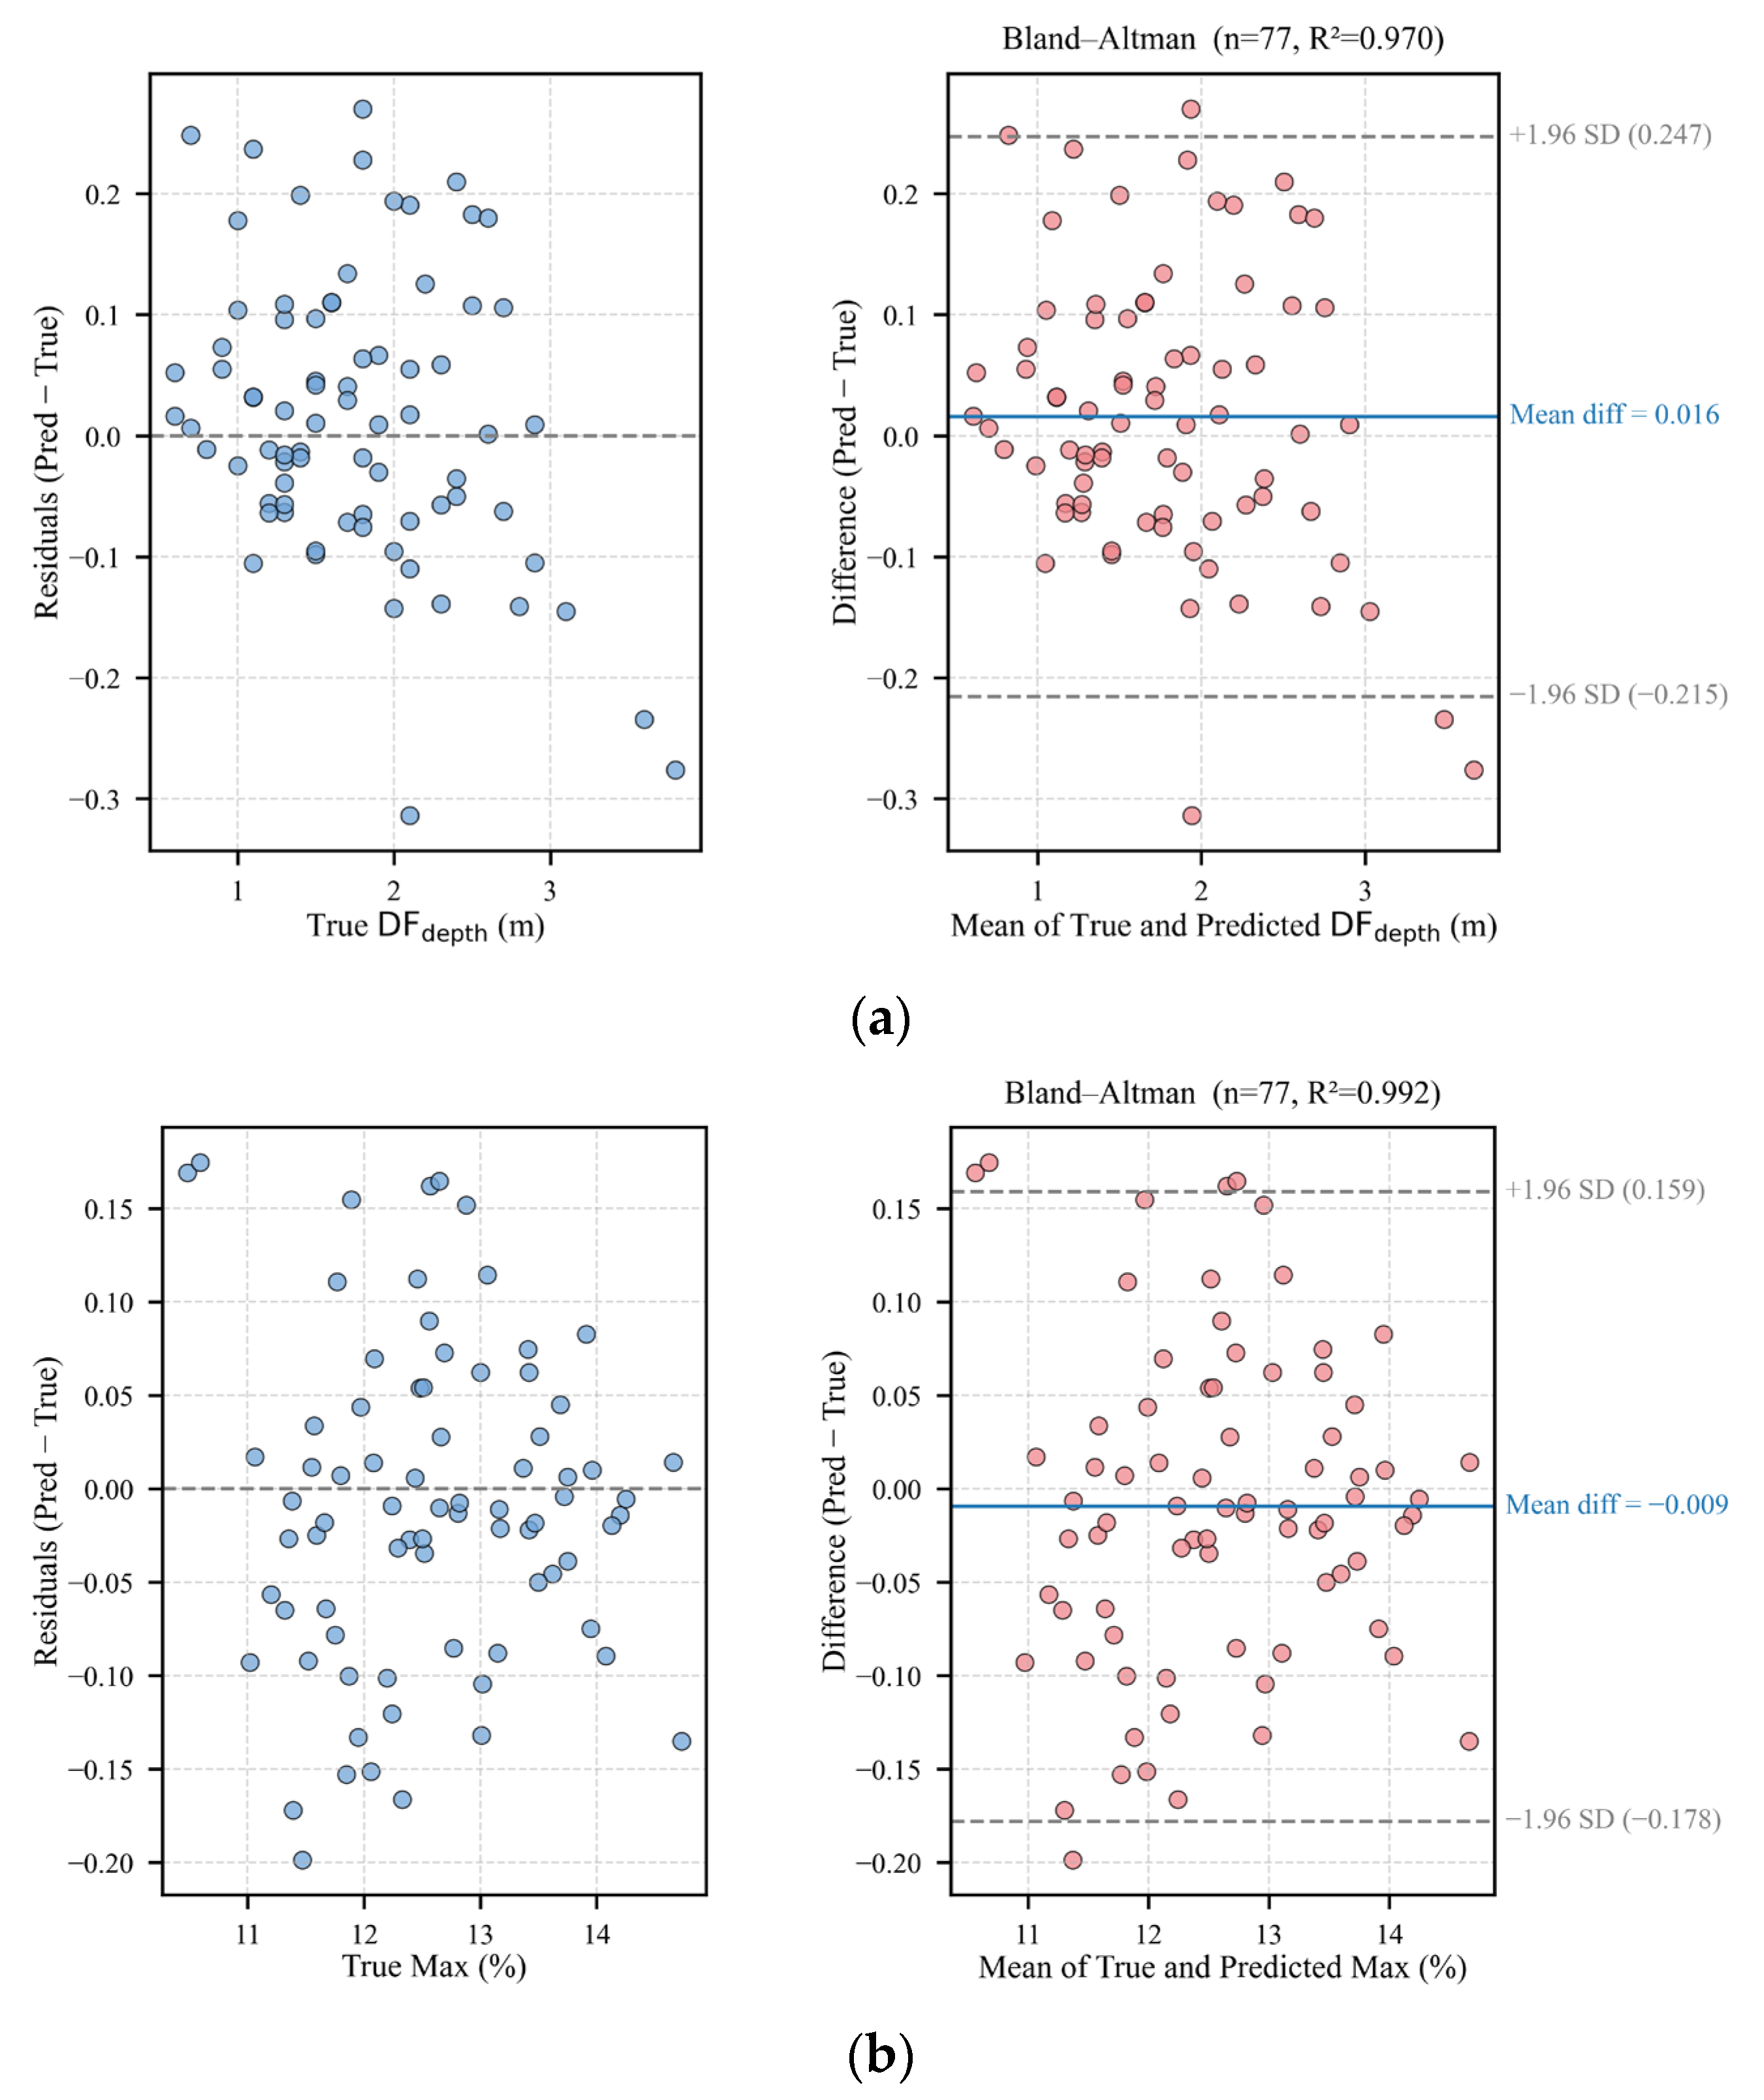
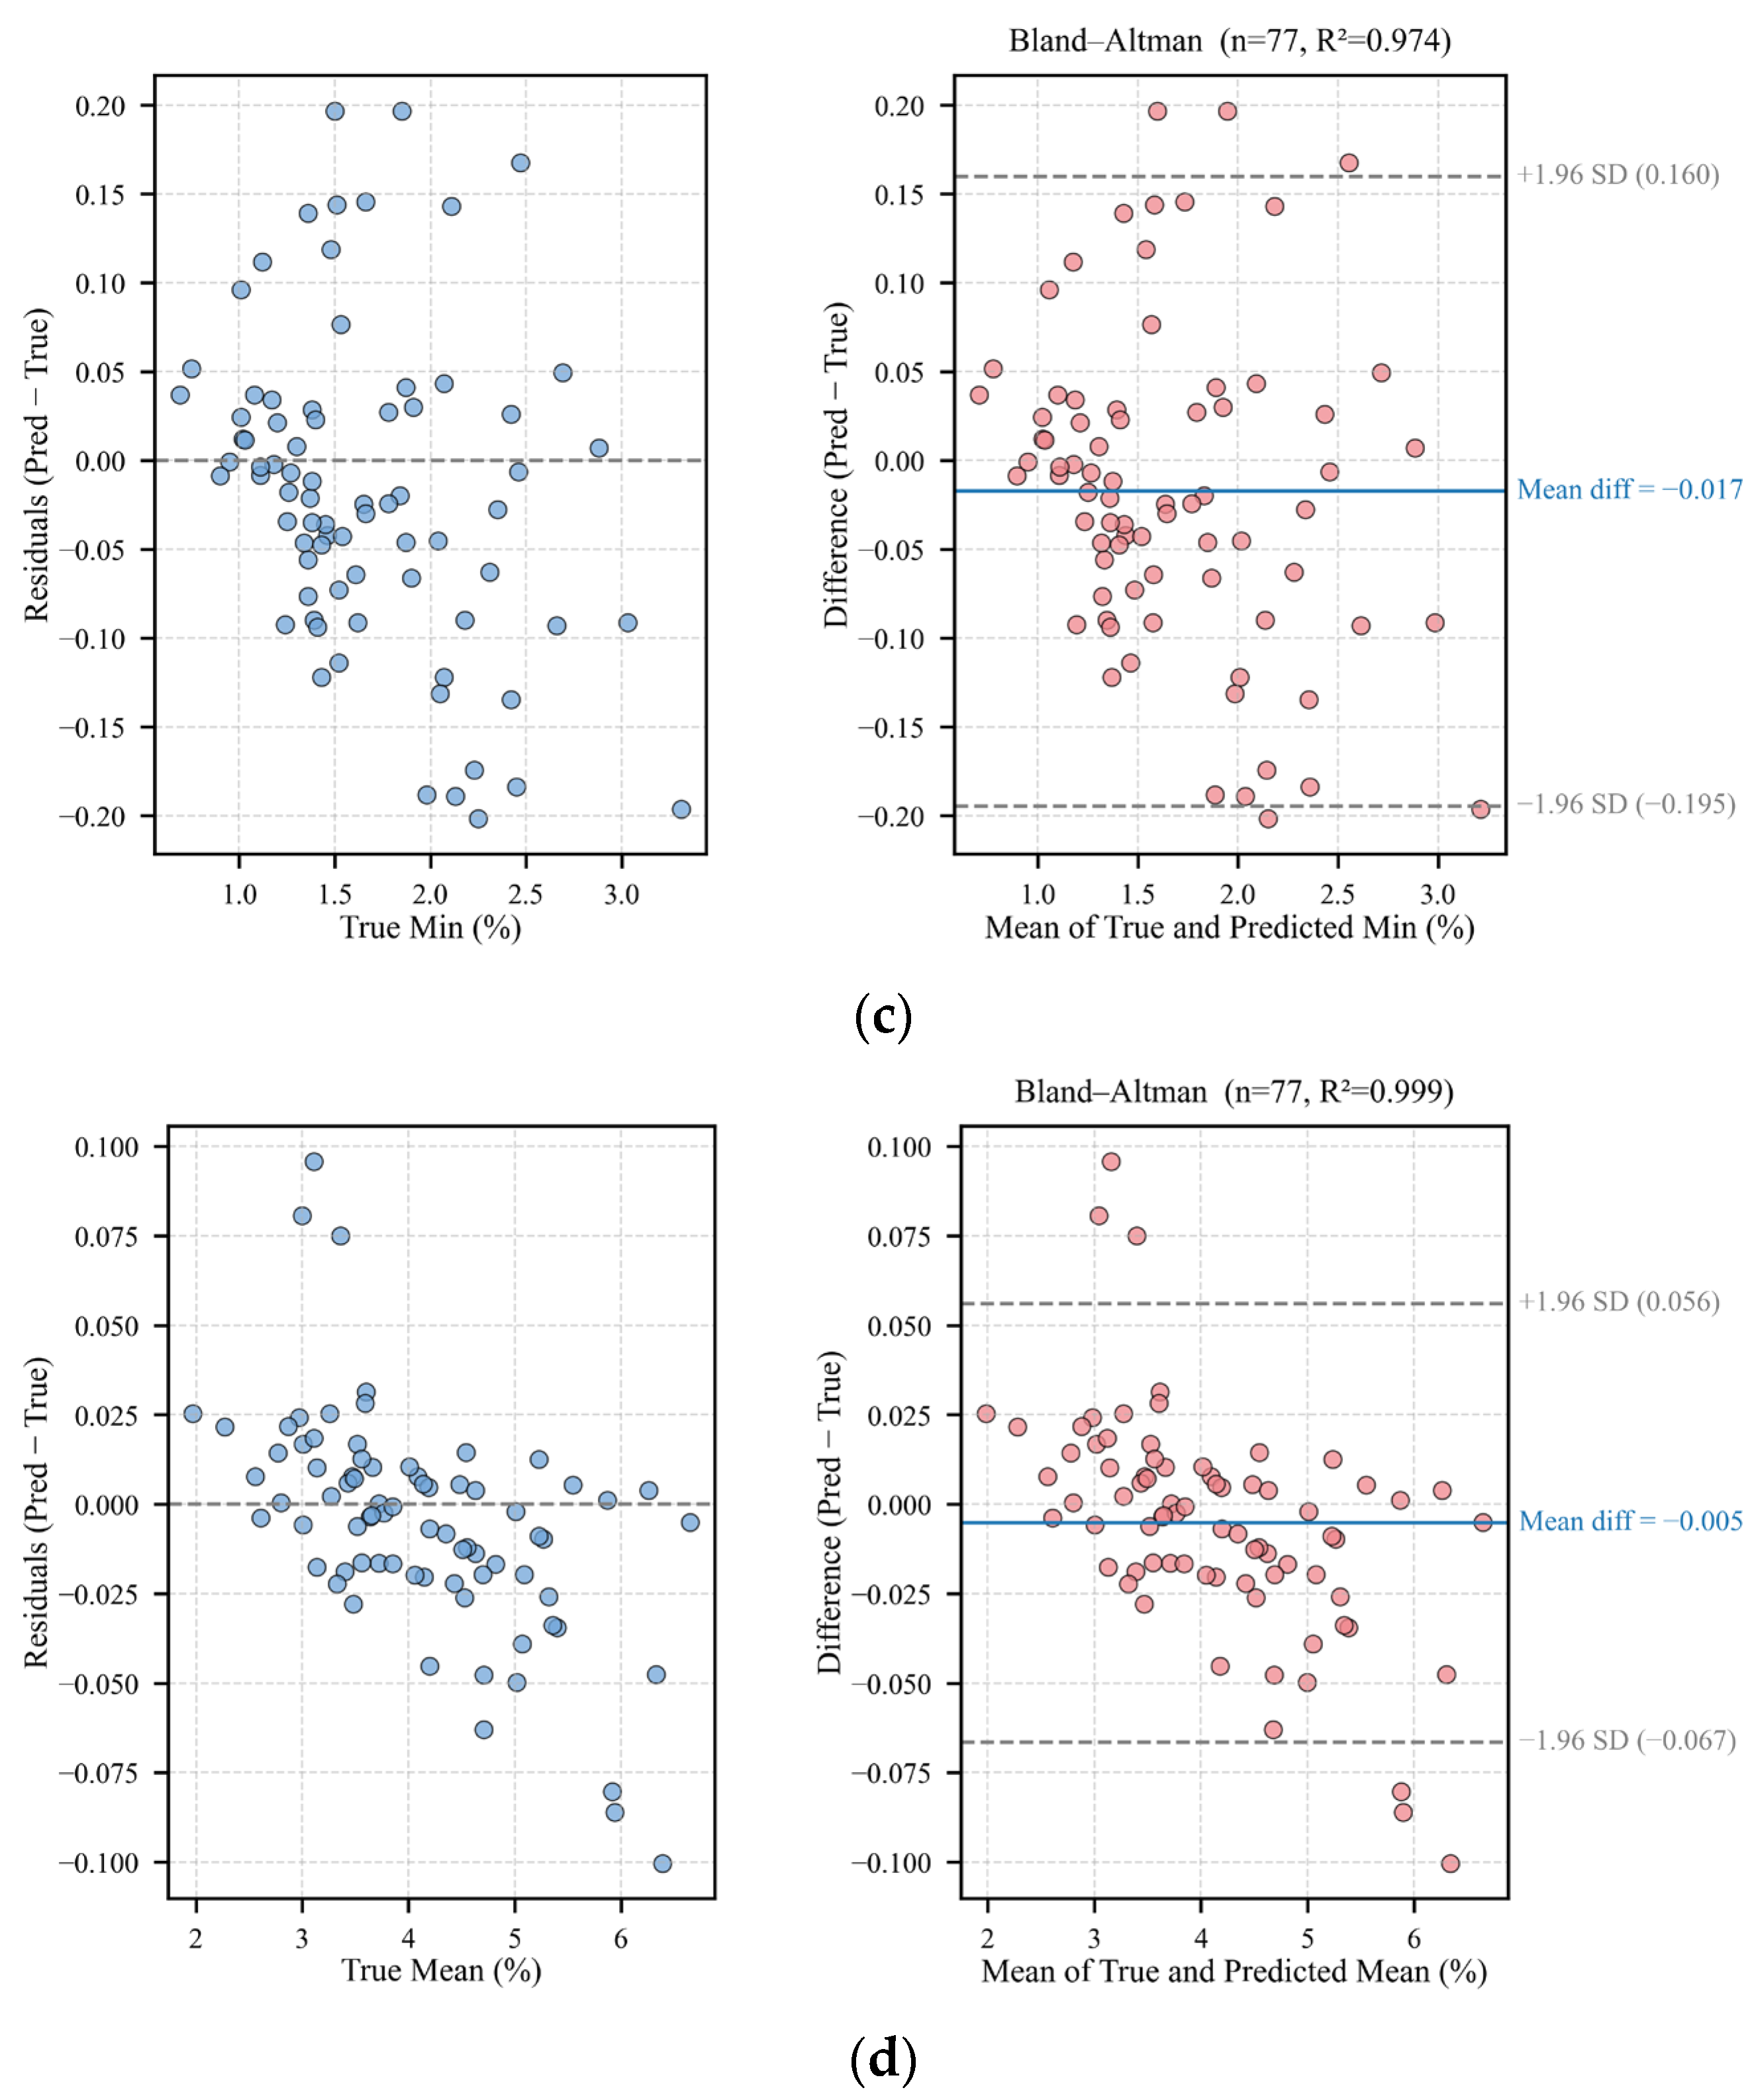
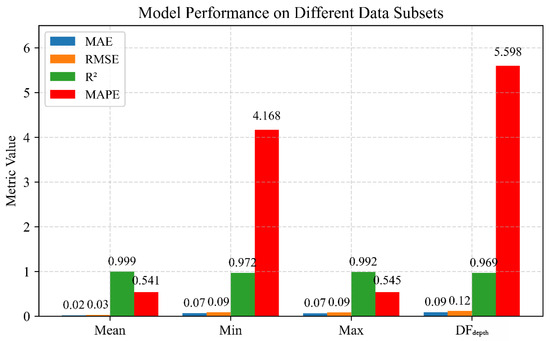
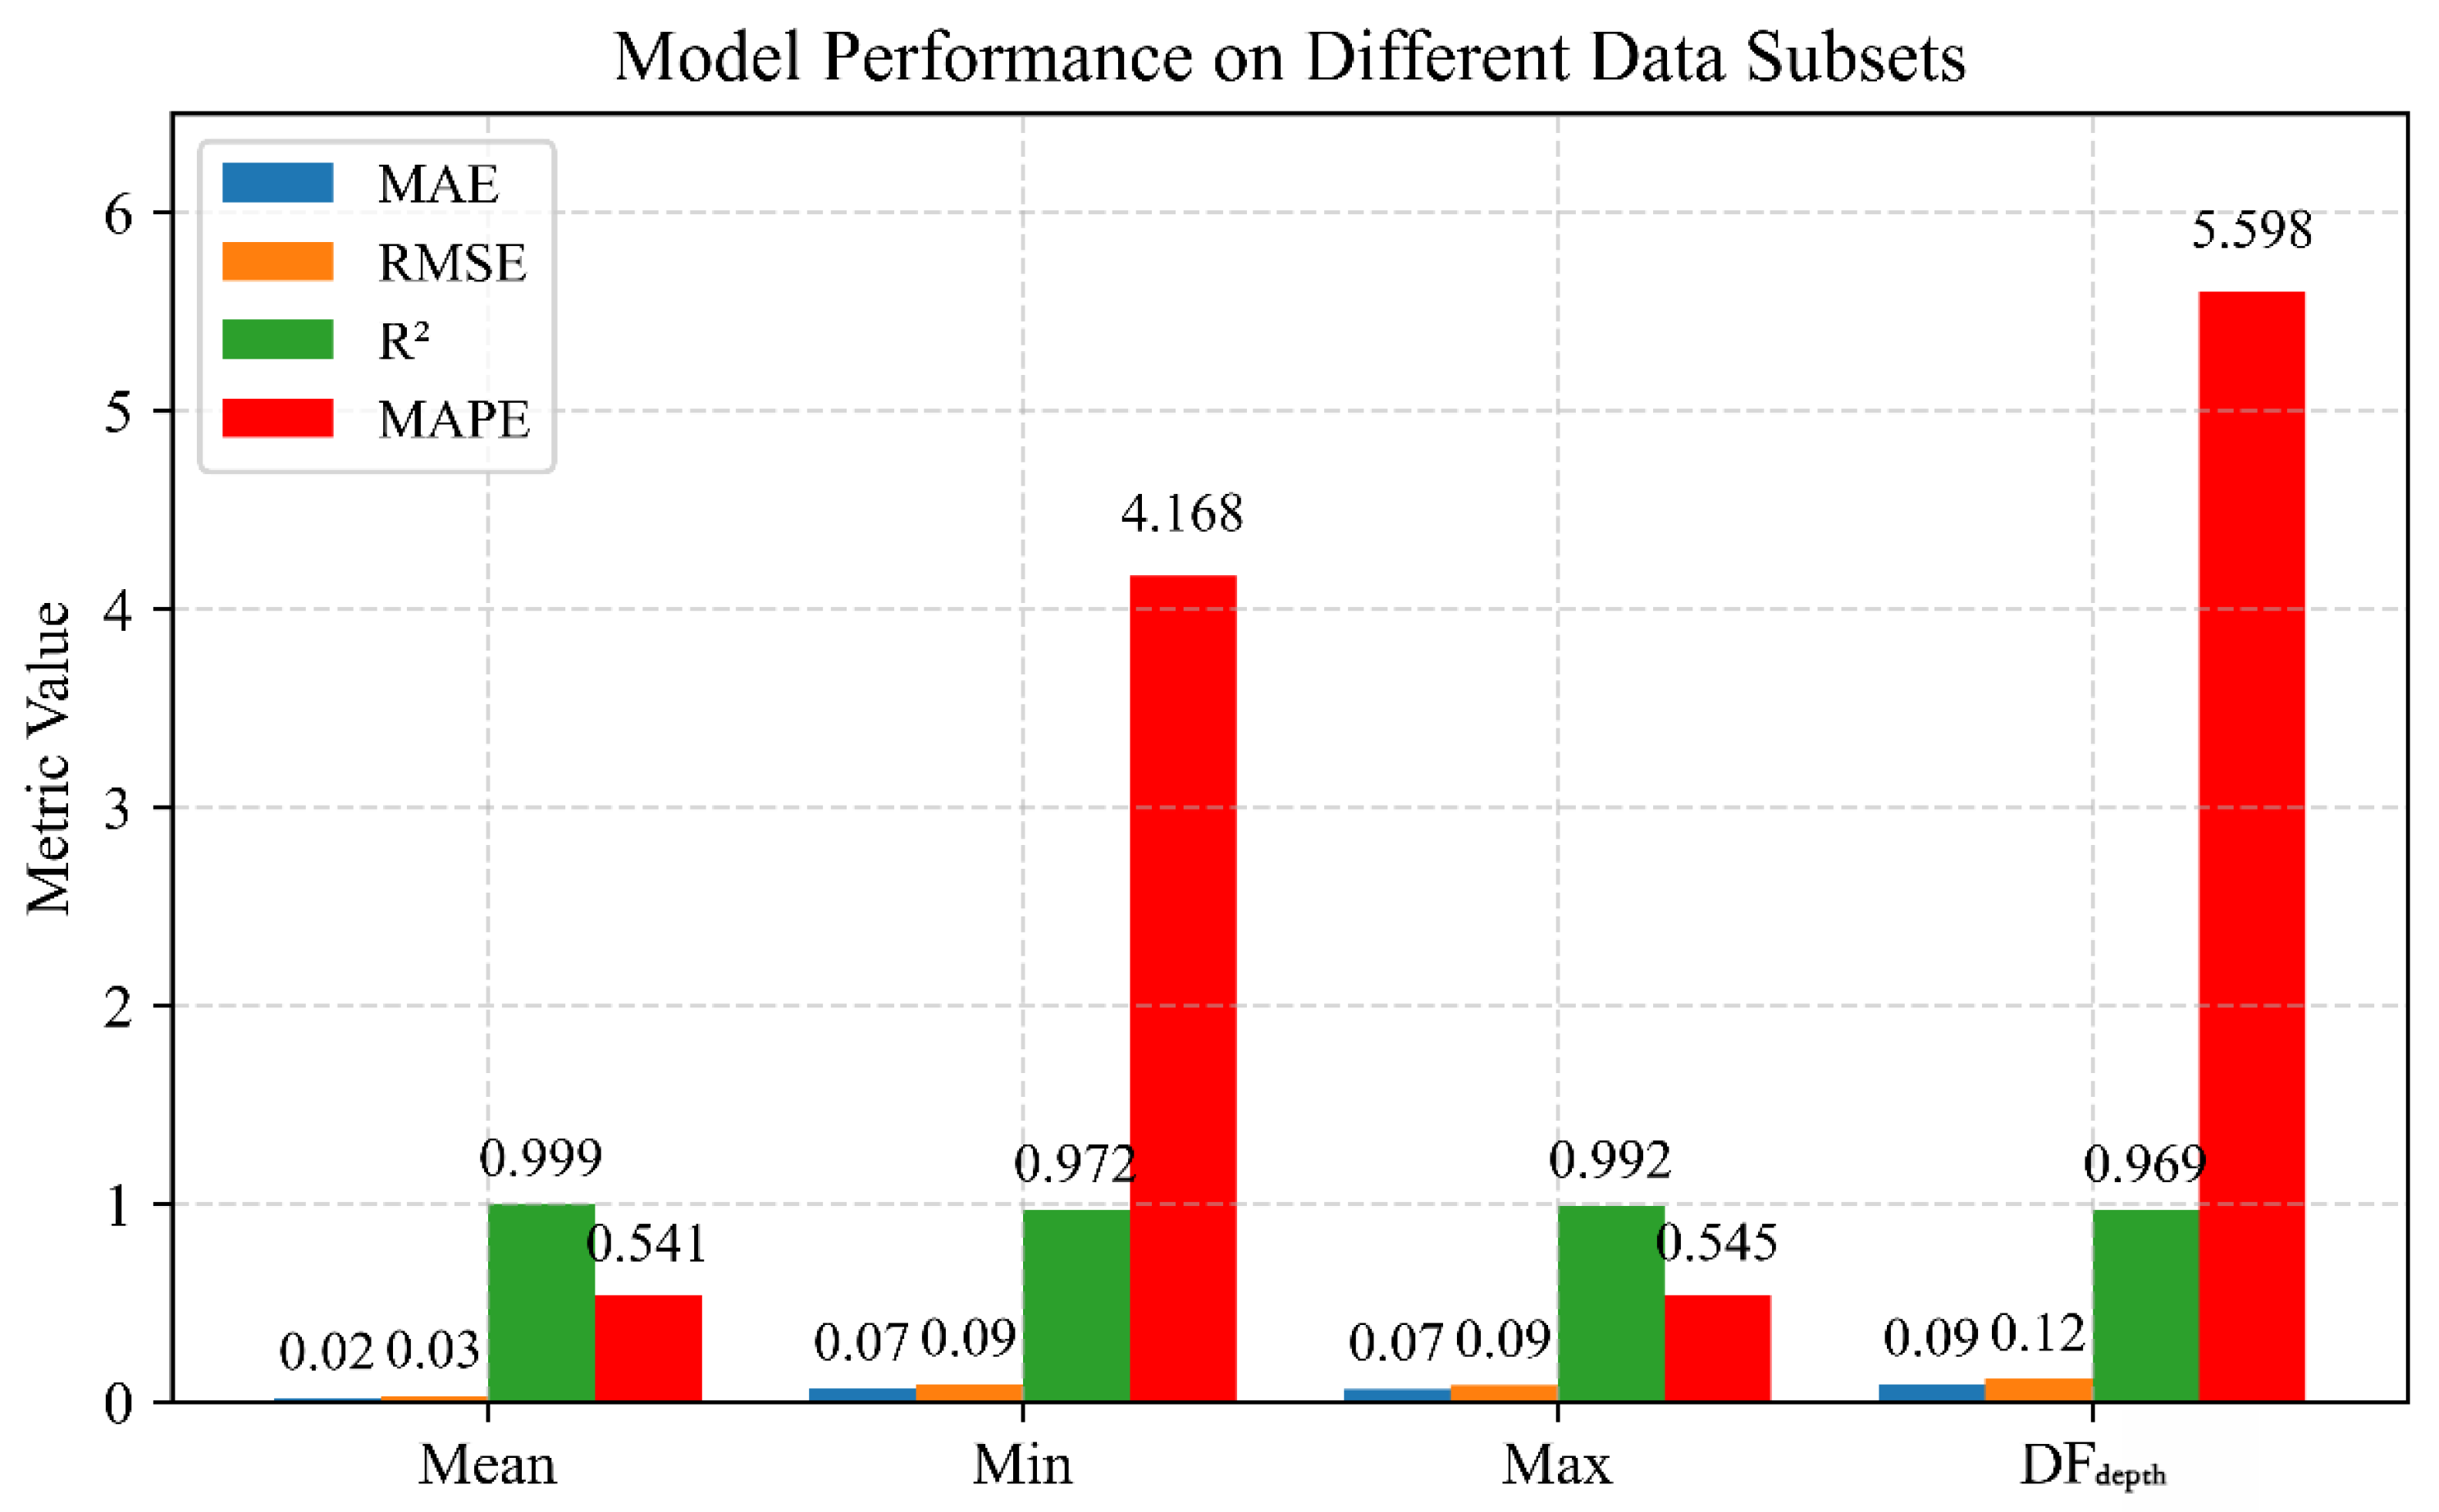
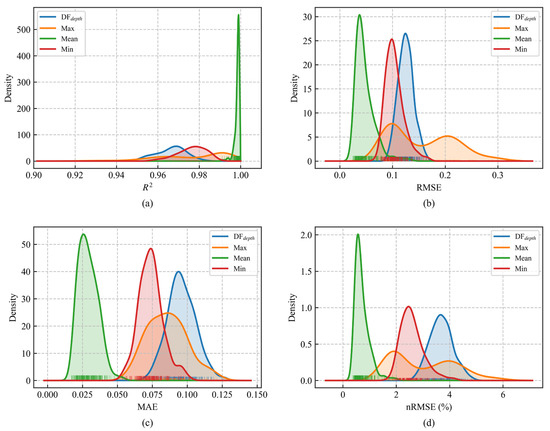
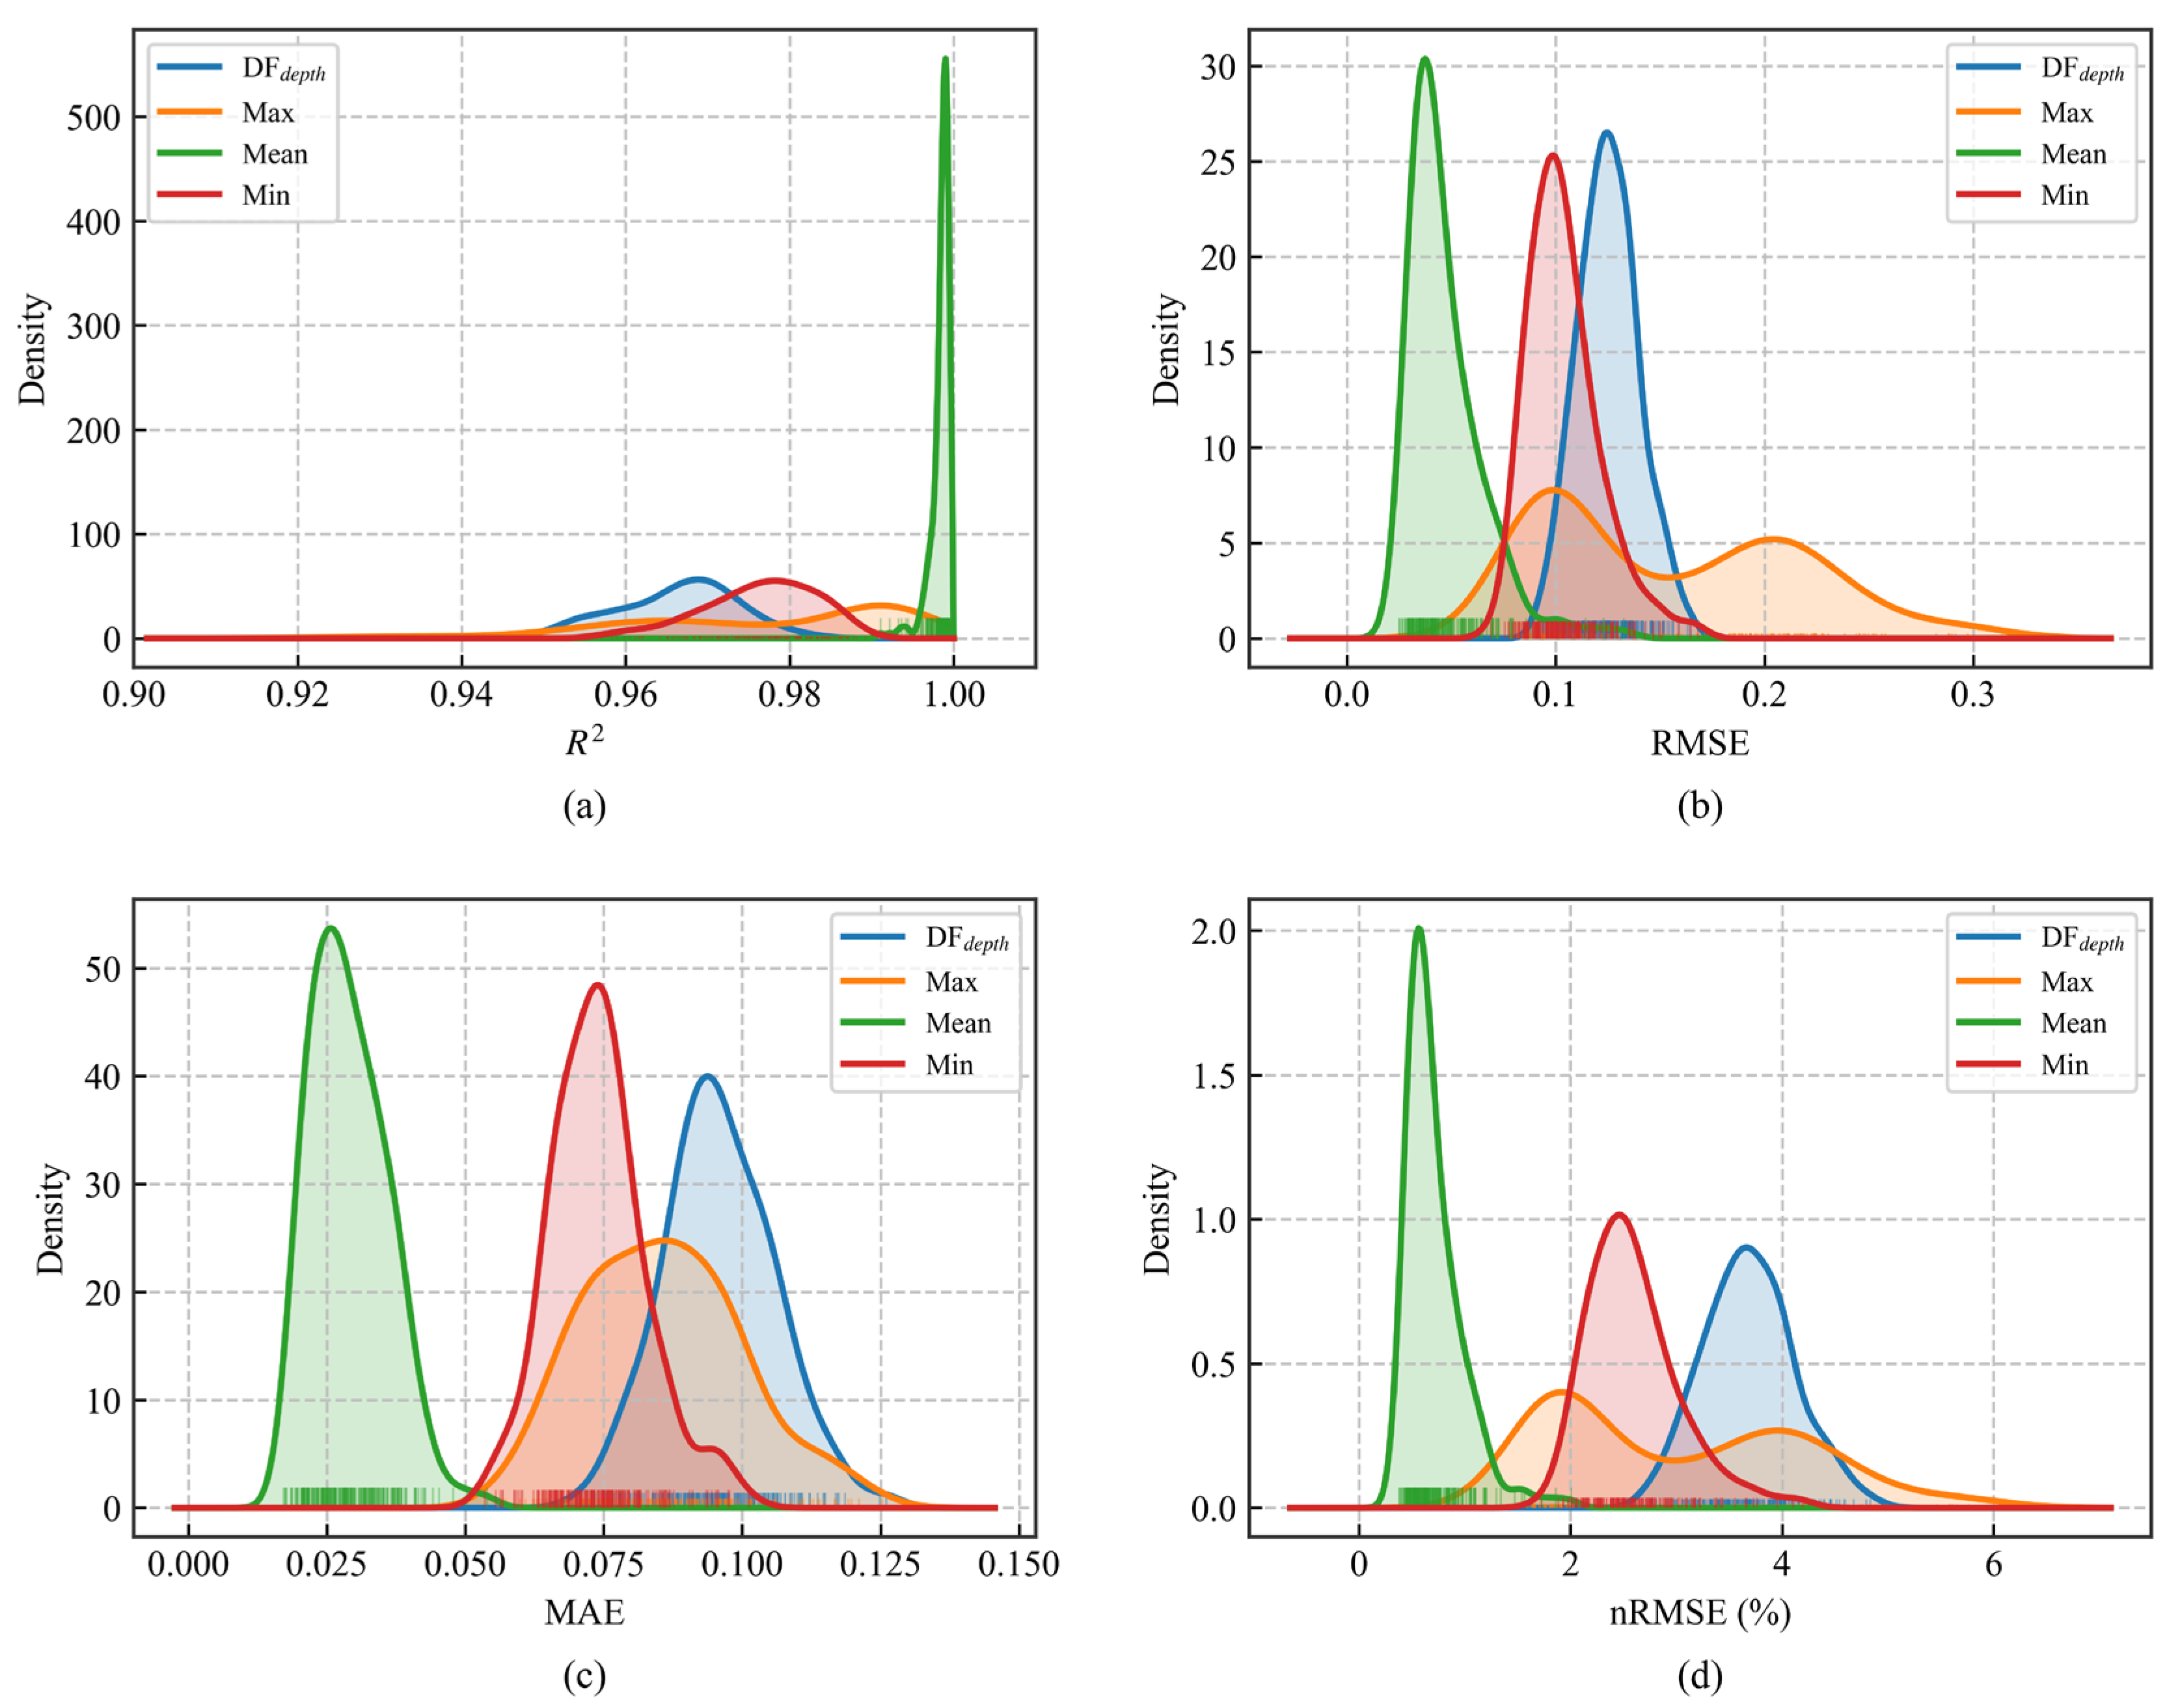
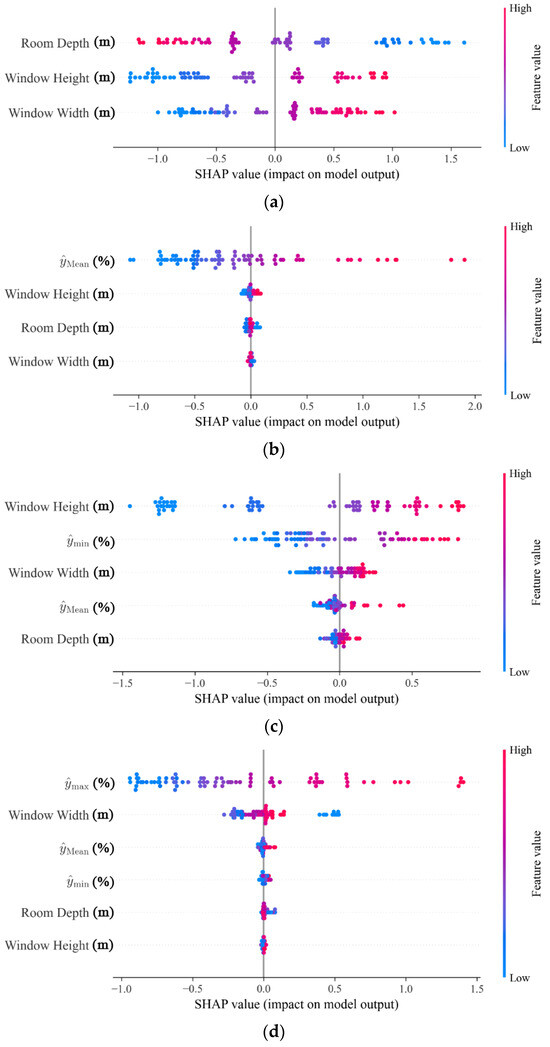
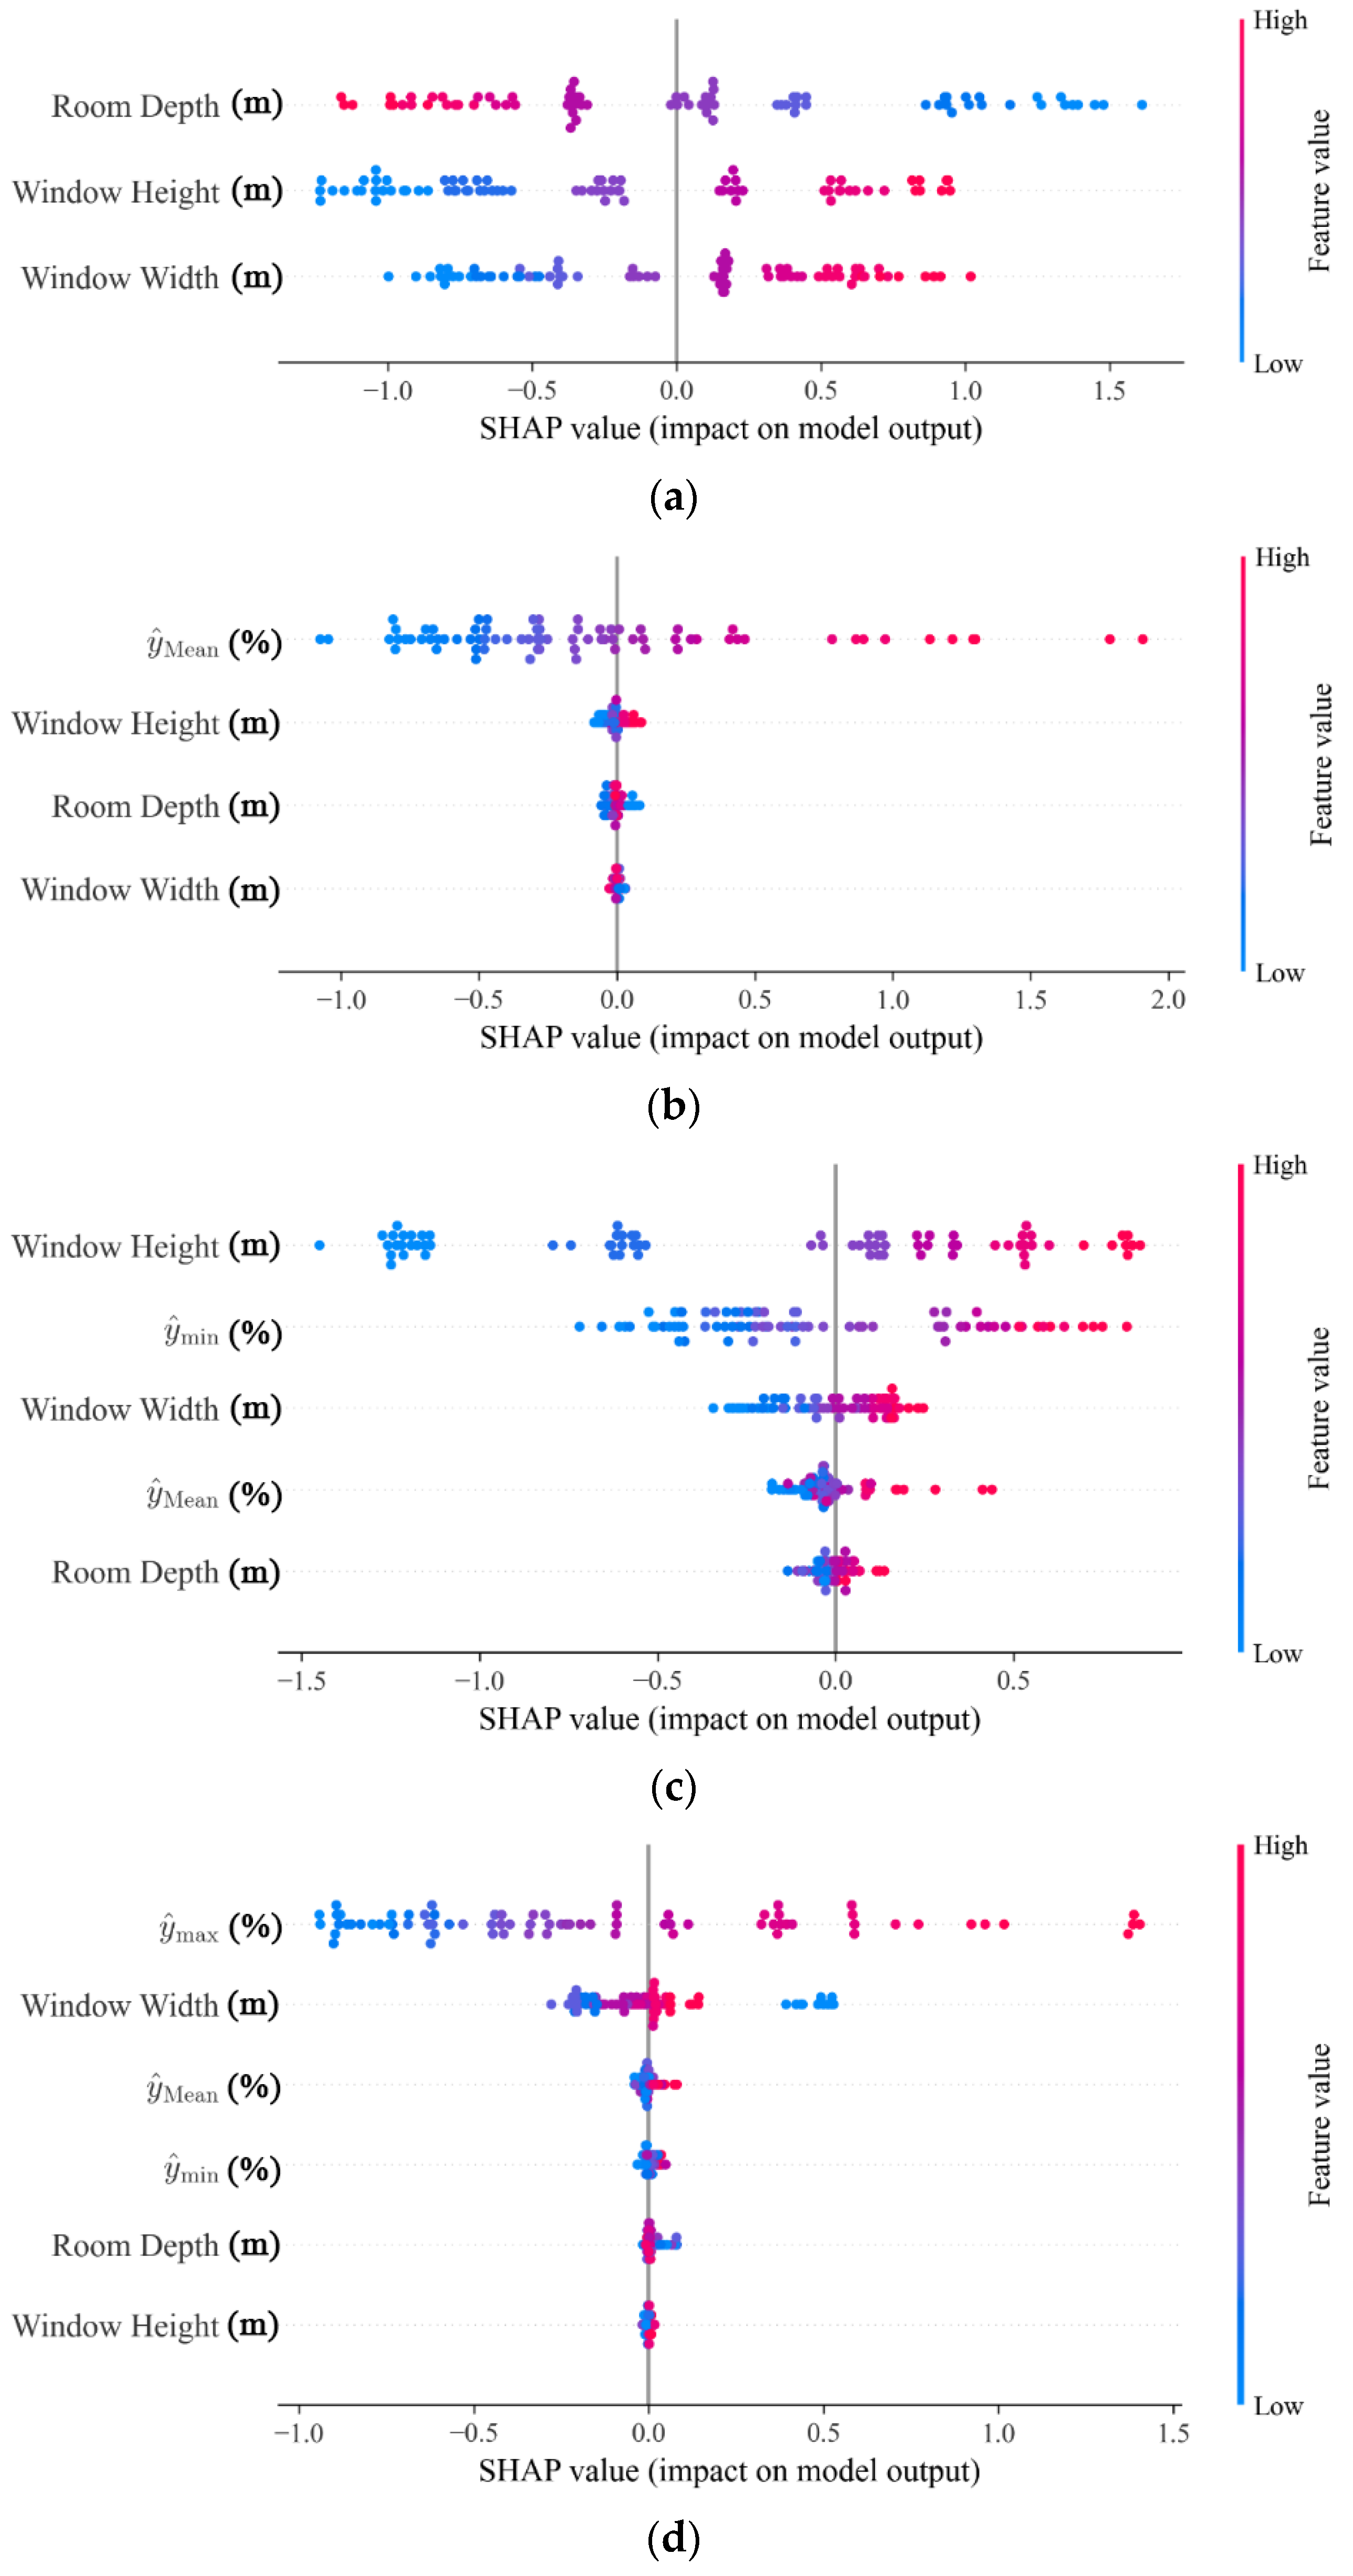
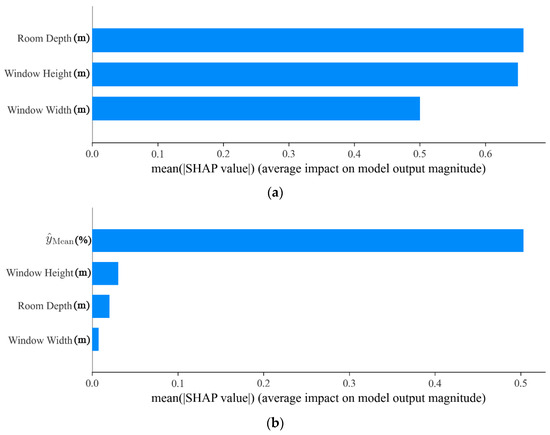
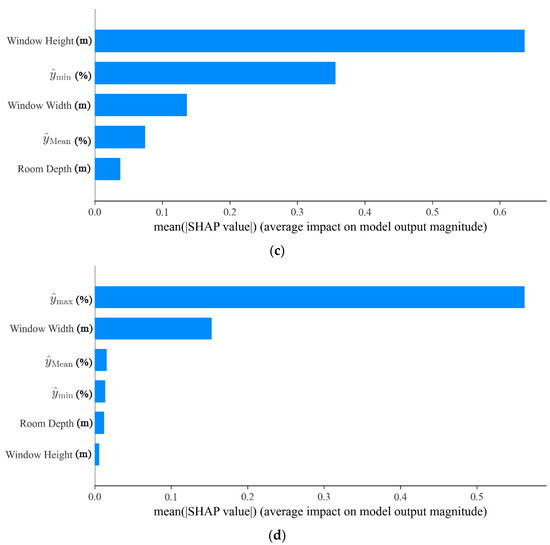
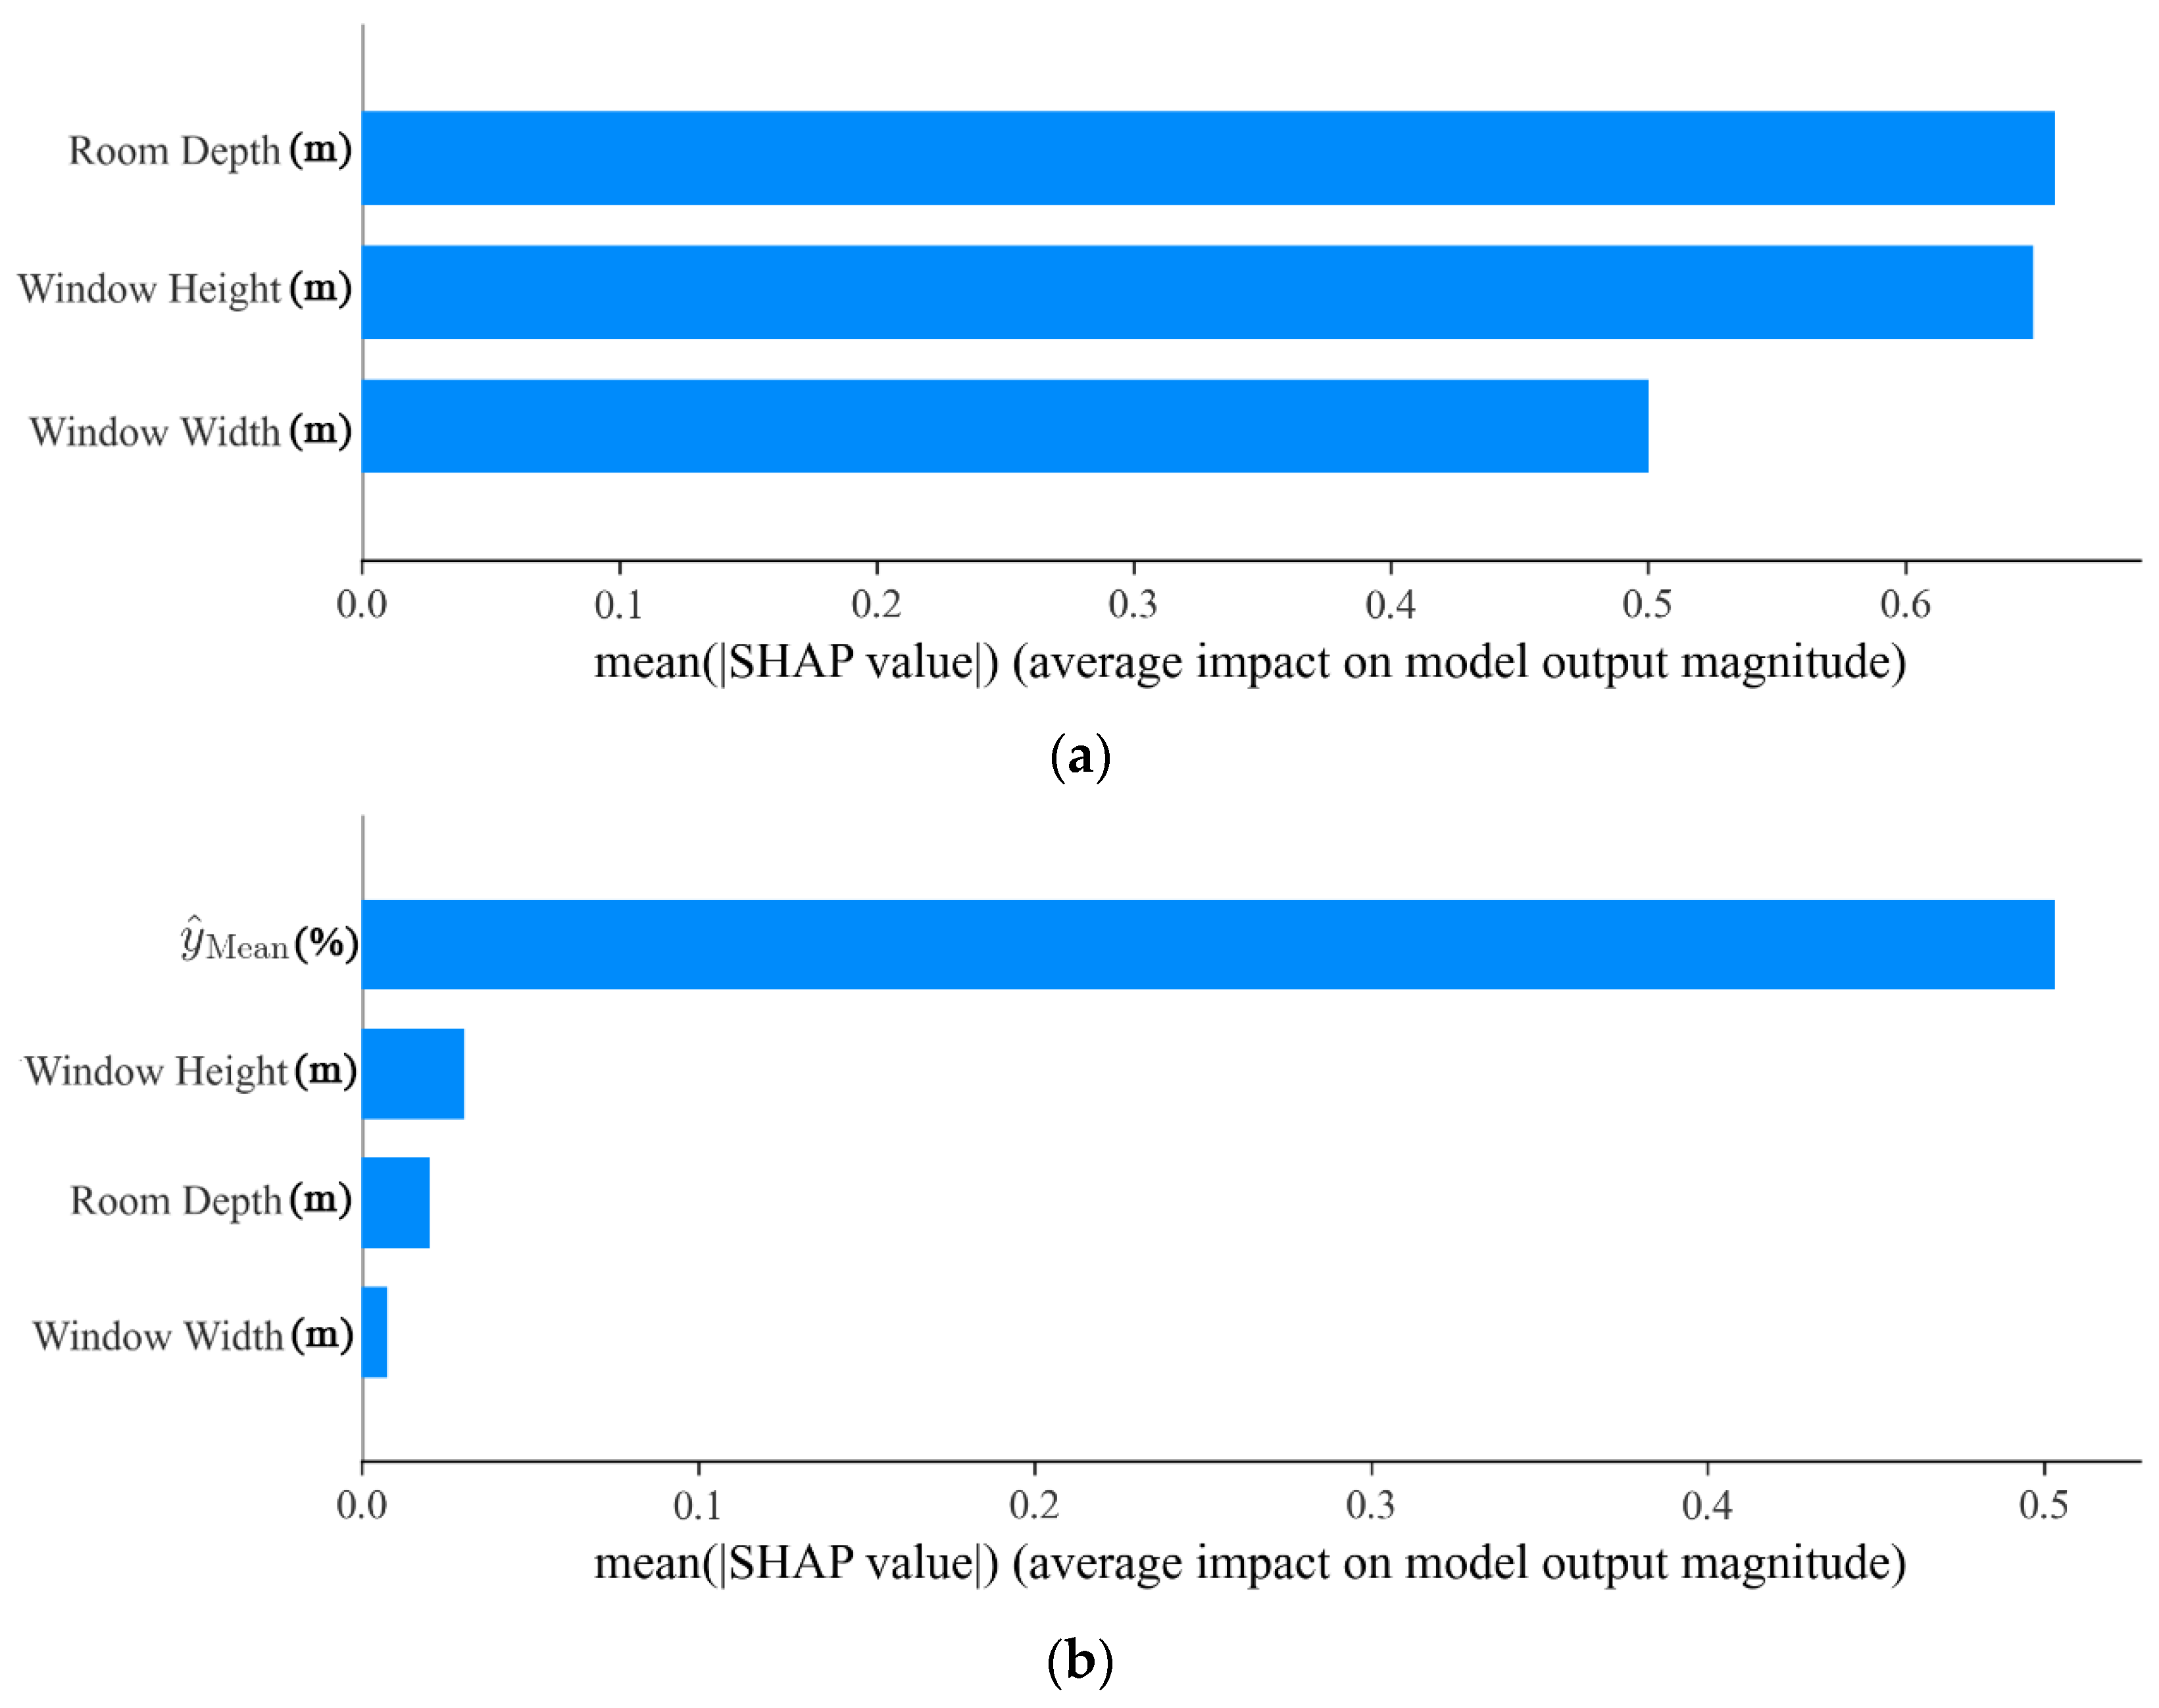
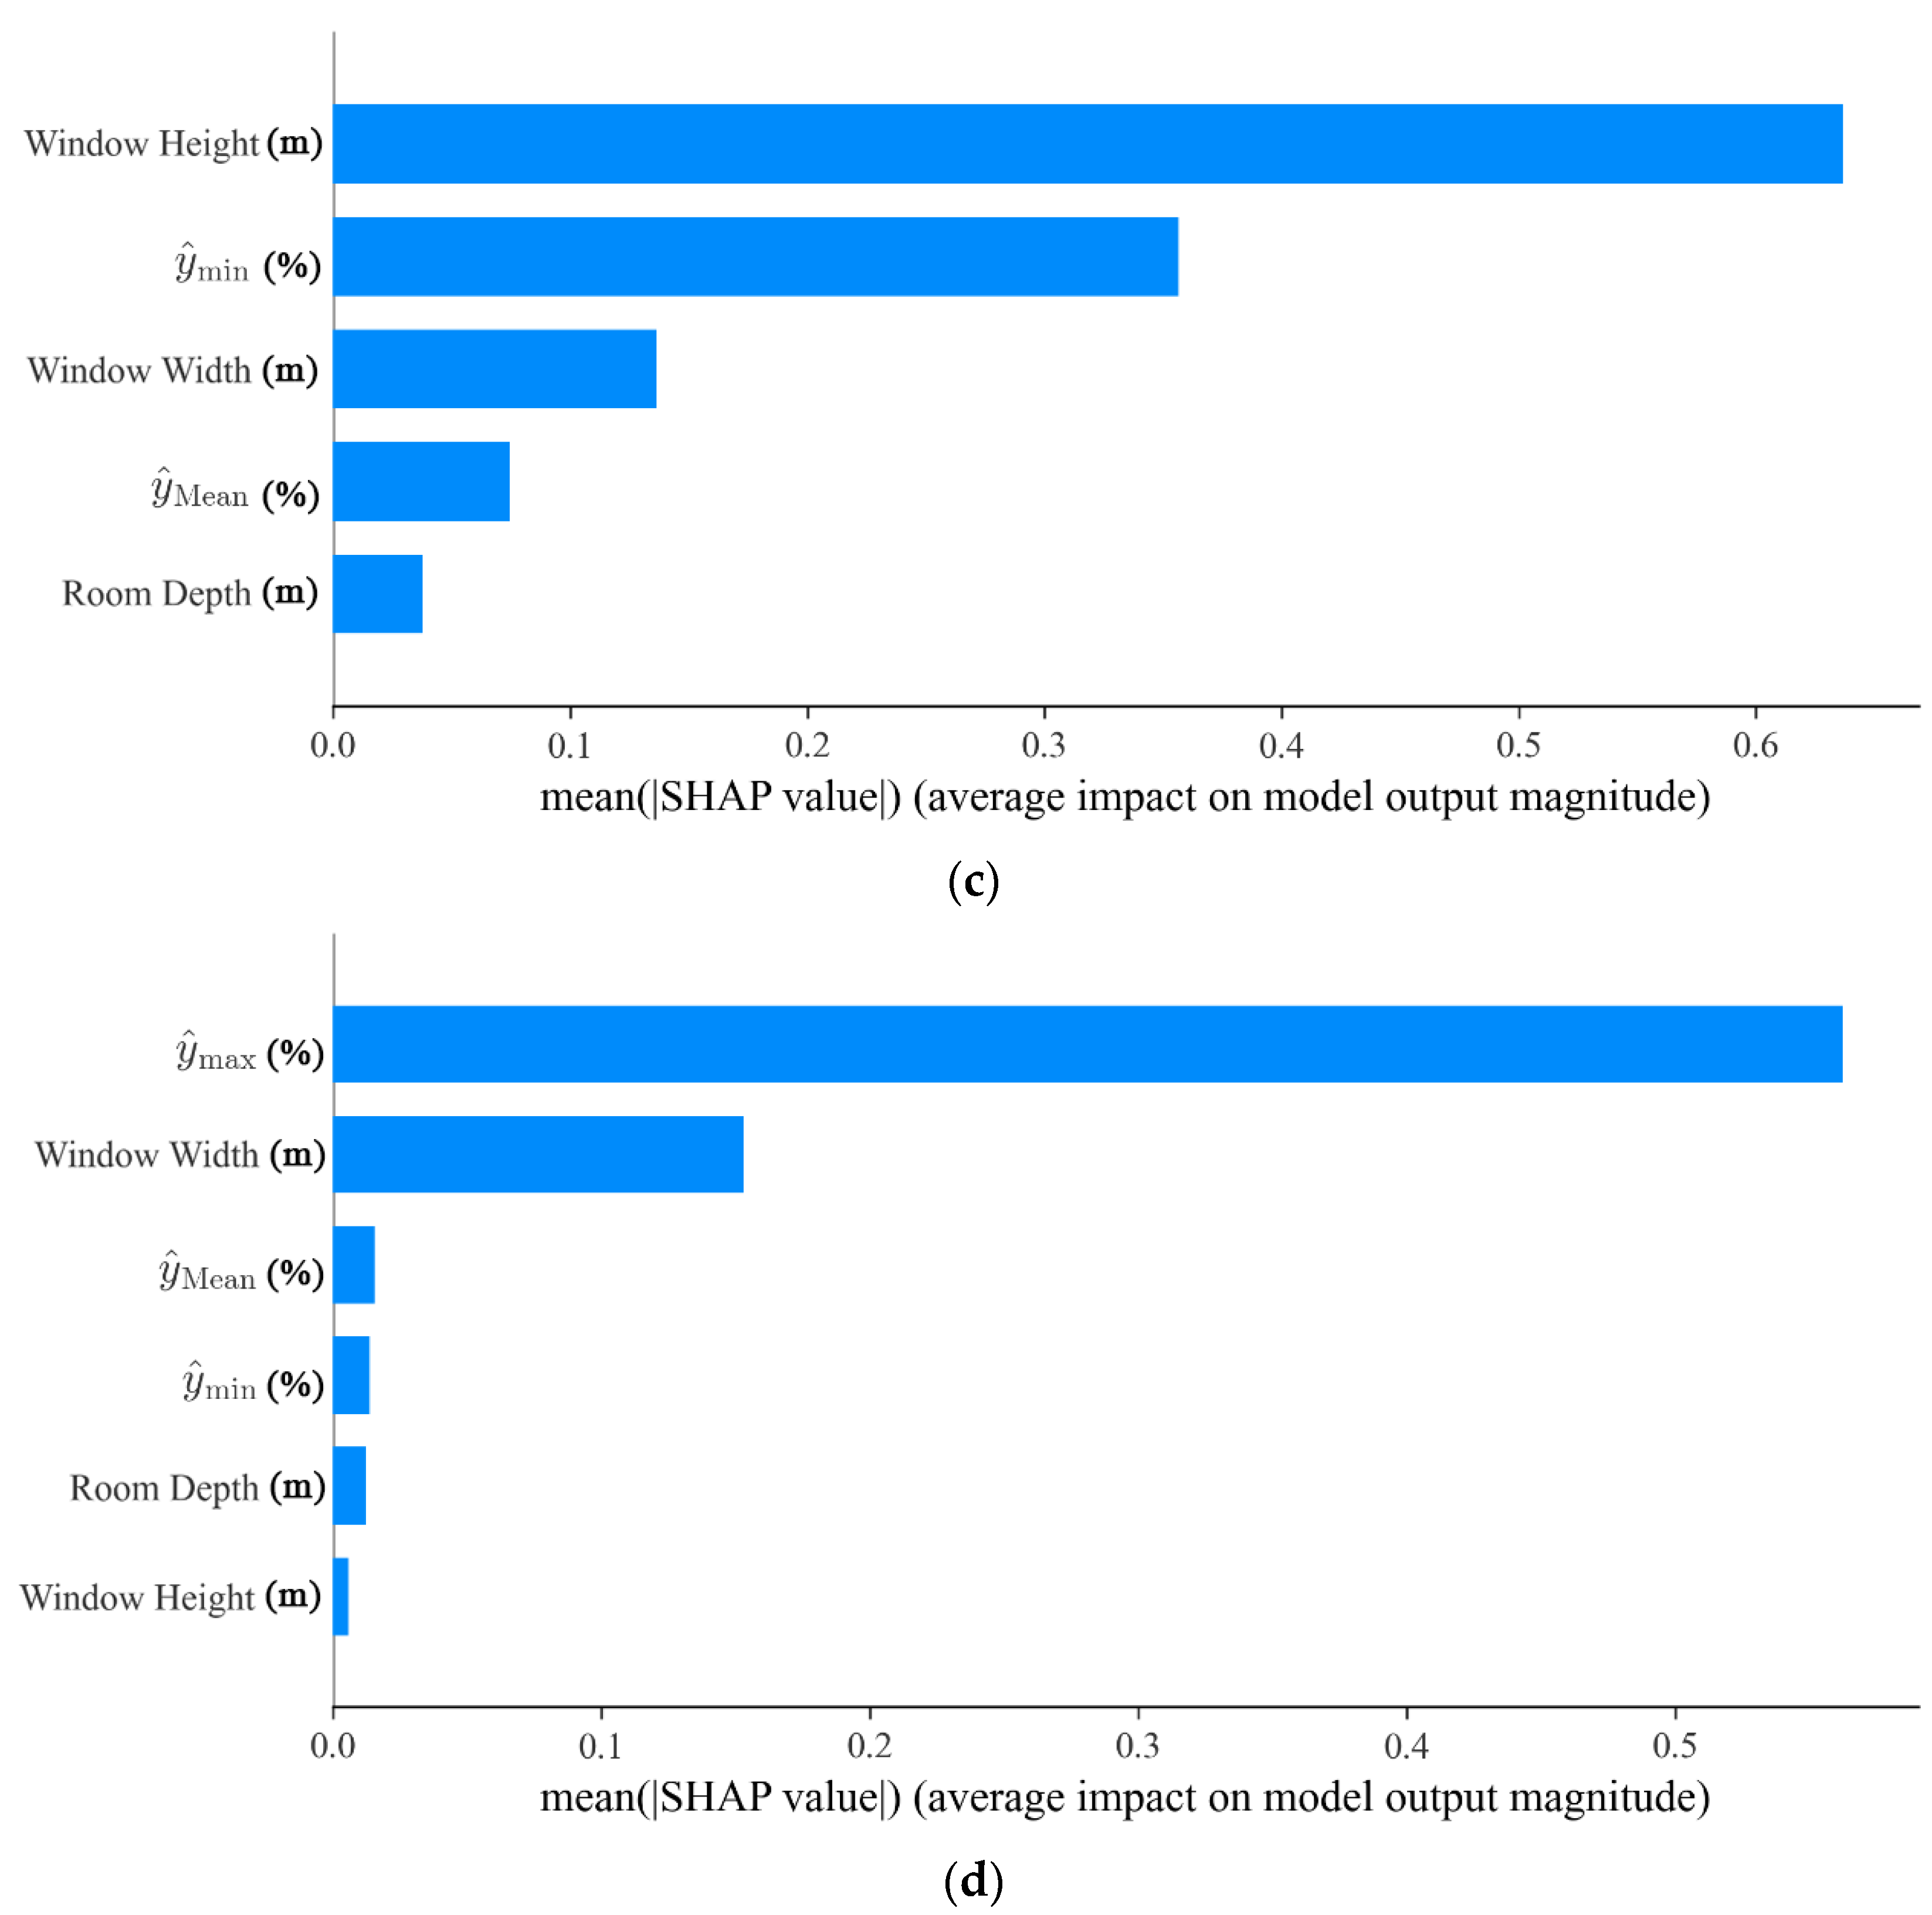
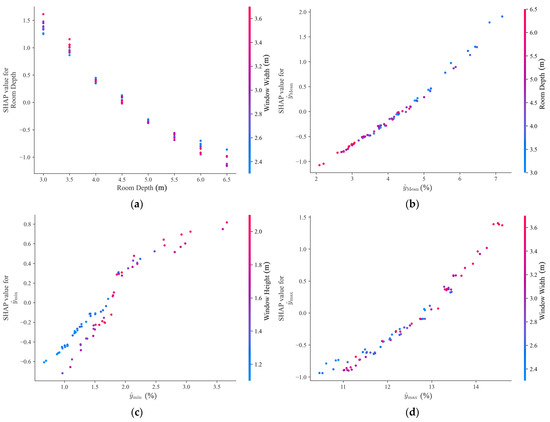
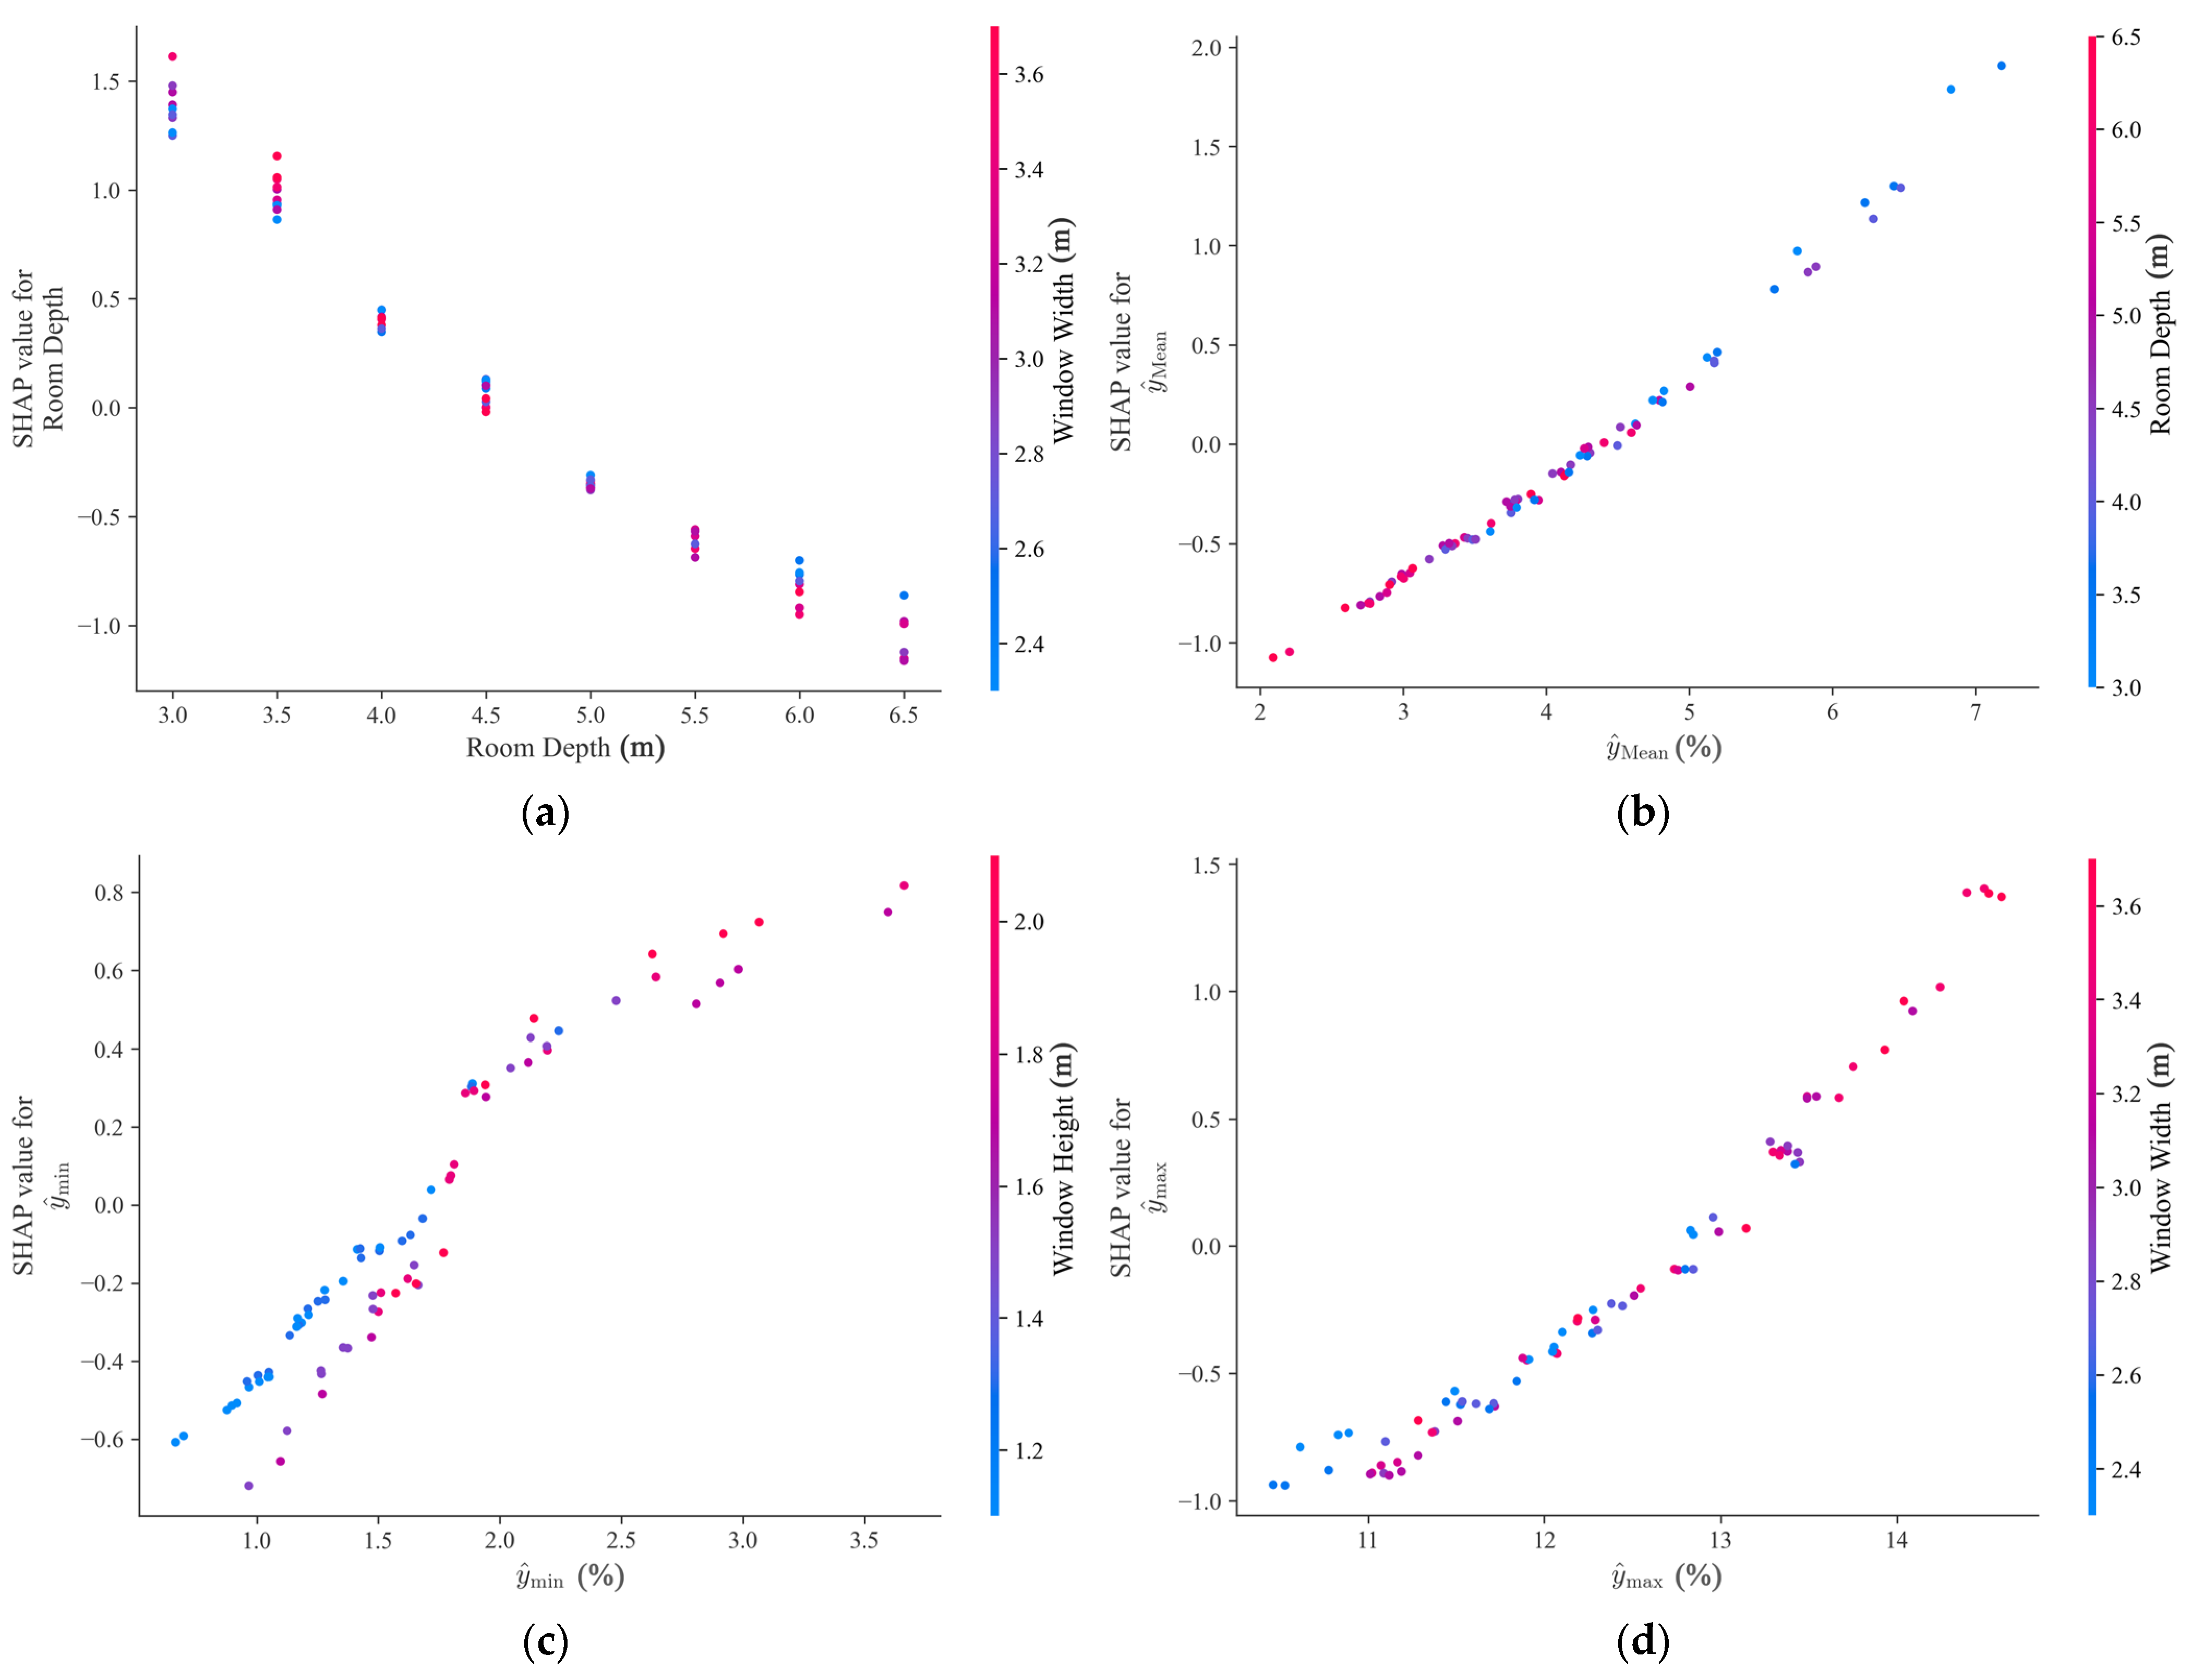

Disclaimer/Publisher’s Note: The statements, opinions and data contained in all publications are solely those of the individual author(s) and contributor(s) and not of MDPI and/or the editor(s). MDPI and/or the editor(s) disclaim responsibility for any injury to people or property resulting from any ideas, methods, instructions or products referred to in the content. |
© 2026 by the authors. Licensee MDPI, Basel, Switzerland. This article is an open access article distributed under the terms and conditions of the Creative Commons Attribution (CC BY) license.