This study primarily focused on the development of an intelligent information model for pile foundation design. The macroscopic research content and methodology involved the following steps: First, interactive input of design conditions was conducted. Subsequently, pile foundation algorithms and features were selected, the design process was determined, and an intelligent computational model for pile foundations was established, enabling the creation of a pile foundation data model with minimal input parameters. Finally, programming was employed to visualize the data model in a real-time three-dimensional visualization online, thereby producing intelligent informatized three-dimensional drawings of the pile foundation design results. The following sections elaborate on these steps.
2.2. Intelligent Information Model for Pile Foundation Design
In the pursuit of intelligent informatization in pile foundation design, it is imperative to accomplish the design and visualization. Based on this premise, this study proposes an intelligent information model for pile foundation design. Initially, the selection of appropriate features and algorithms is of paramount importance. Subsequently, the process is delineated into three major stages to achieve intelligent integration in pile foundation design and visualization. These stages include inputting design conditions for pile foundations, computing the array of pile coordinates, computing an intelligent model for pile foundations to obtain intelligent calculation data, and generating three-dimensional pile foundation drawings by visualizing the data model online in real time.
2.2.1. Correlation of Pile Foundation Design Data and Algorithm Selection
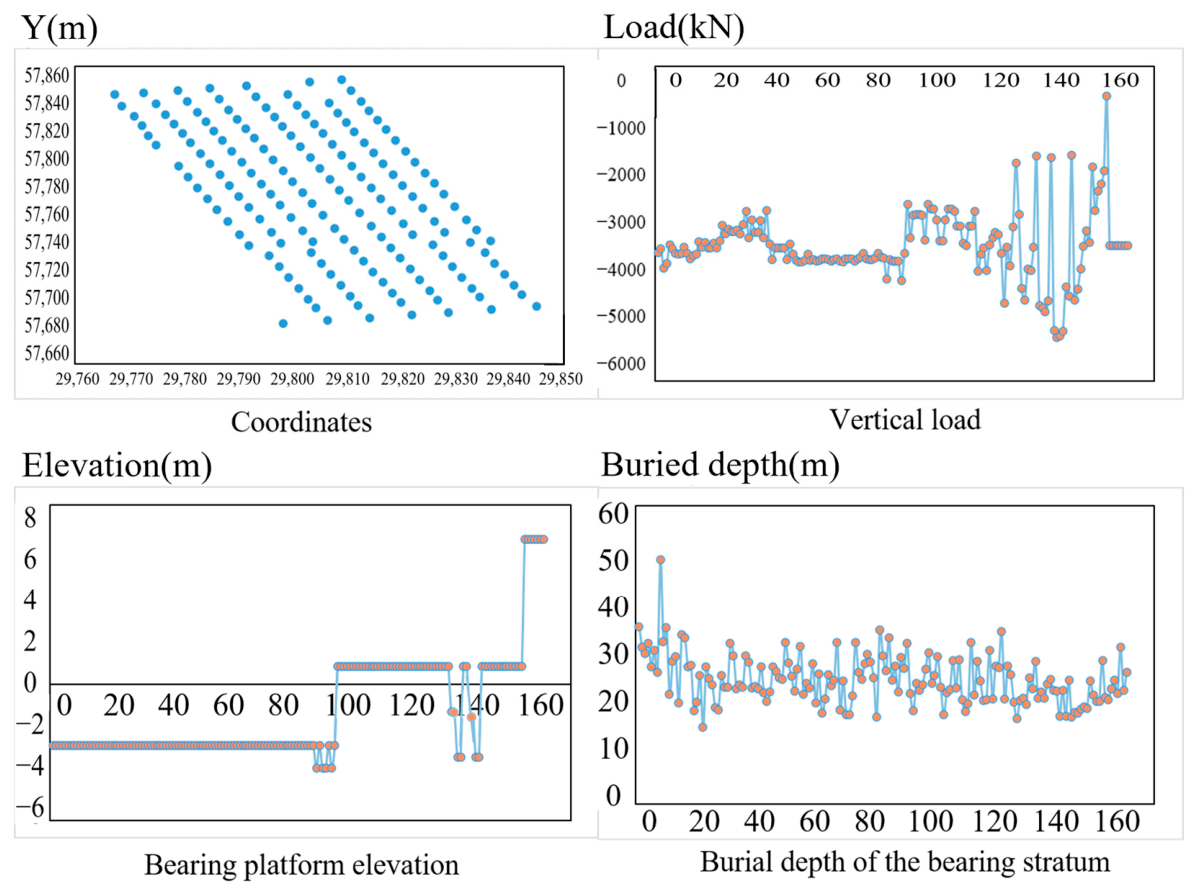
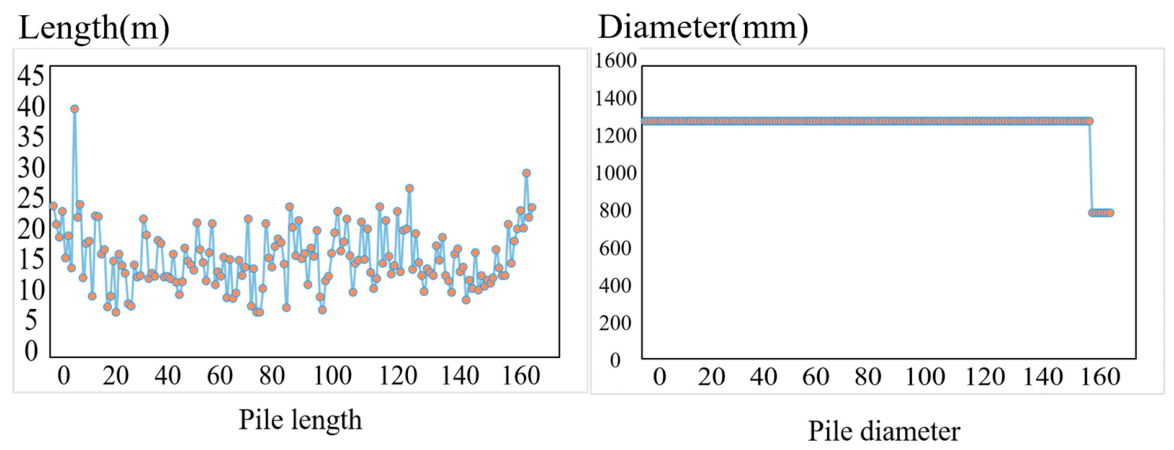
The objective of the computational stage in this study was to establish an intelligent design framework capable of predicting key pile design parameters, namely, pile length and diameter, from geological and engineering information associated with pile locations. To achieve this goal, a pile foundation database was first constructed using engineering survey reports, pile foundation design drawings, borehole records, and related design documents from the selected case project. The database contained continuous and categorical variables, including spatial coordinates, thicknesses of different strata, bearing stratum category, depth to the top of the bearing stratum, vertical load, bearing platform elevation, pile length, and pile diameter. In this study, the pile length and diameter were extracted from finalized engineering design documents and used as supervised learning target variables.
Table 1 lists the specific indicators and their statuses in the pile foundation database.
Before model development, low-variance filtering and engineering screening were performed to remove features with limited practical relevance or insufficient information content. Because the collected variables included non-normally distributed continuous parameters and encoded categorical parameters, and because the relationships between geological conditions and design results were not necessarily linear, Spearman’s rank correlation coefficient was adopted as a preliminary feature screening tool. Compared with Pearson’s correlation, Spearman’s correlation is more suitable for detecting monotonic relationships under limited distributional assumptions and is less sensitive to non-normality and outliers. It should be noted that in this study, a correlation analysis was conducted to assist feature relevance screening rather than to establish causal relationships.
The simplified expression of Spearman’s rank correlation coefficient is given as
where
ρ is Spearman’s correlation coefficient,
is the rank difference for the
i-th paired observation, and
n is the number of samples.
Based on the compiled database, the candidate input variables included pile coordinates, thicknesses of the major strata, depth to the top of the bearing stratum, bearing stratum category, vertical load, and bearing platform elevation. The target variables consisted of pile length for regression and pile diameter class for classification. The correlation analysis and engineering interpretation were combined to determine feature subsets for subsequent modeling. For pile length prediction, variables closely related to subsurface support conditions and structural demand were retained, including bearing stratum category, depth to the top of the bearing stratum, vertical load, bearing platform elevation, and thicknesses of the strata. For pile diameter prediction, the final feature set was also restricted to geologically and mechanically interpretable variables, namely, bearing stratum category, depth to the top of the bearing stratum, vertical load, bearing platform elevation, and thicknesses of the strata. Although spatial coordinates were explored during preliminary feature combination tests, they were not retained as core explanatory variables for the final pile diameter model because their direct causal interpretability from an engineering mechanics perspective is limited.
To compare candidate learning strategies, several commonly used algorithms were tested. Linear regression estimates the linear relationship between input variables and the target response. Lasso and ridge regression introduce regularization to reduce overfitting and improve stability in the presence of multiple correlated features. Decision tree models recursively split the feature space according to impurity reduction rules and can capture nonlinear relationships. Random forest combines multiple decision trees through ensemble learning and typically offers stronger robustness and generalization than a single tree [
30]. K-nearest neighbors predicts outcomes based on the local similarity of nearby samples. For classification tasks, logistic regression, naive Bayes, decision tree, random forest, and k-nearest neighbors were compared.
Table 2 lists the different pile foundation experimental features for pile length testing and their respective categories.
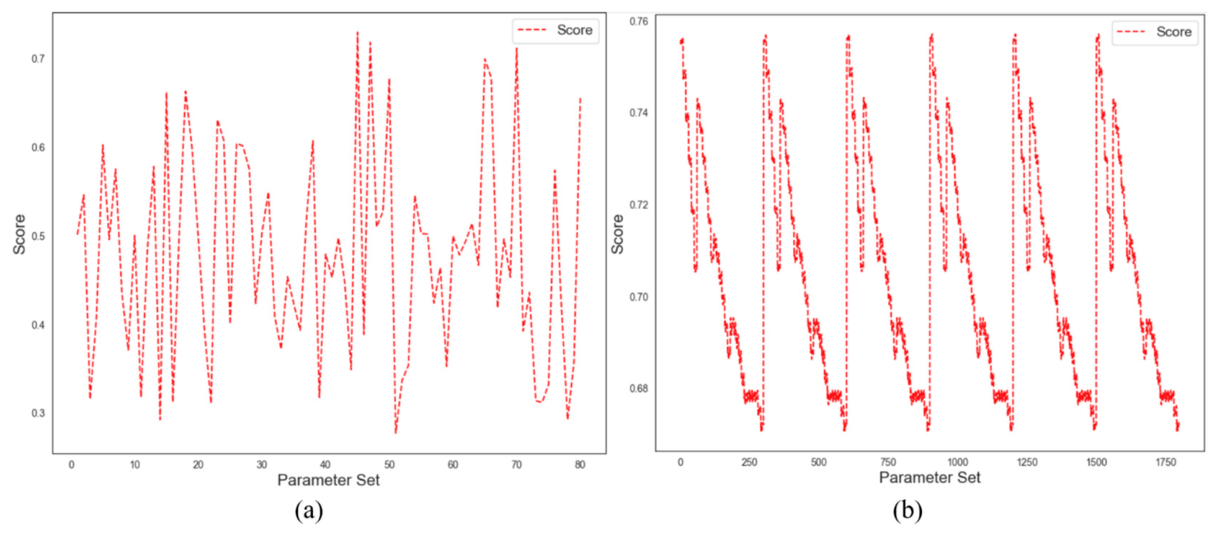
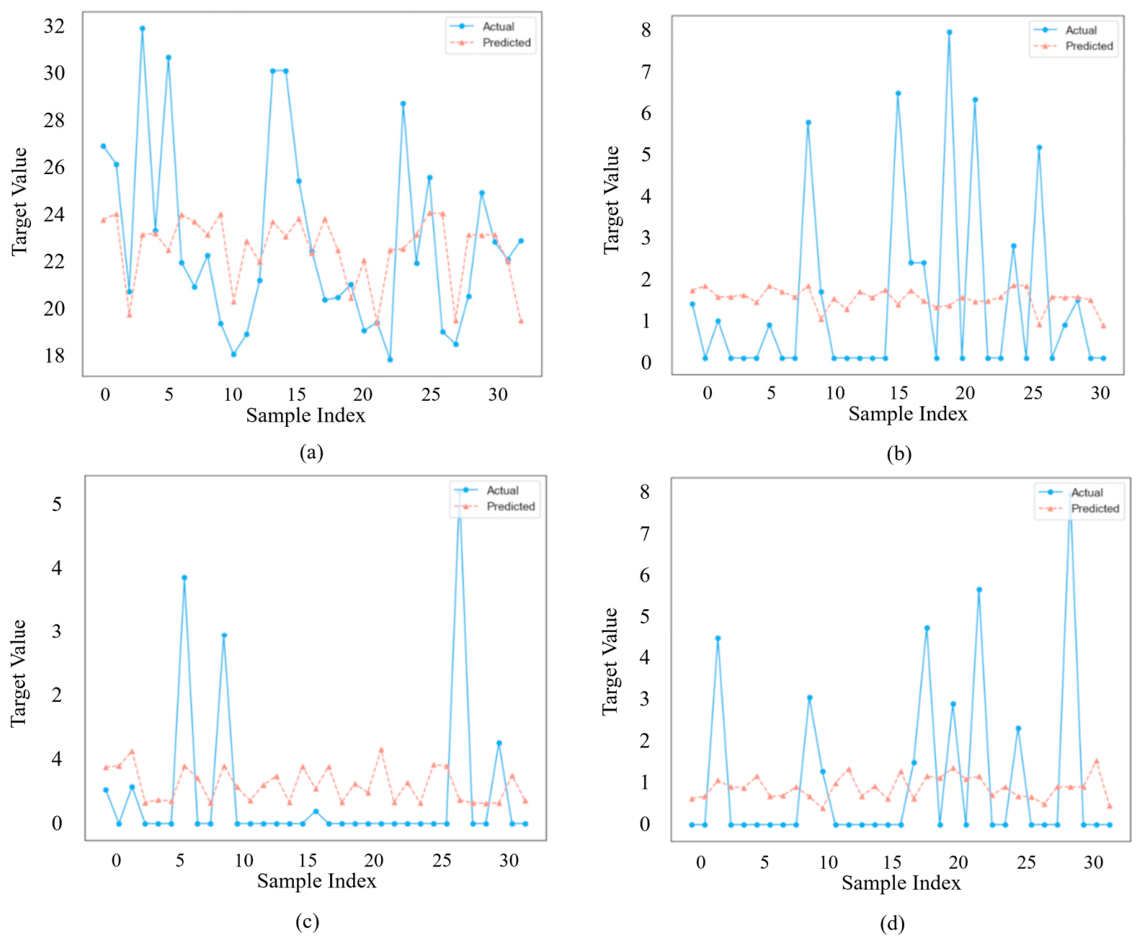
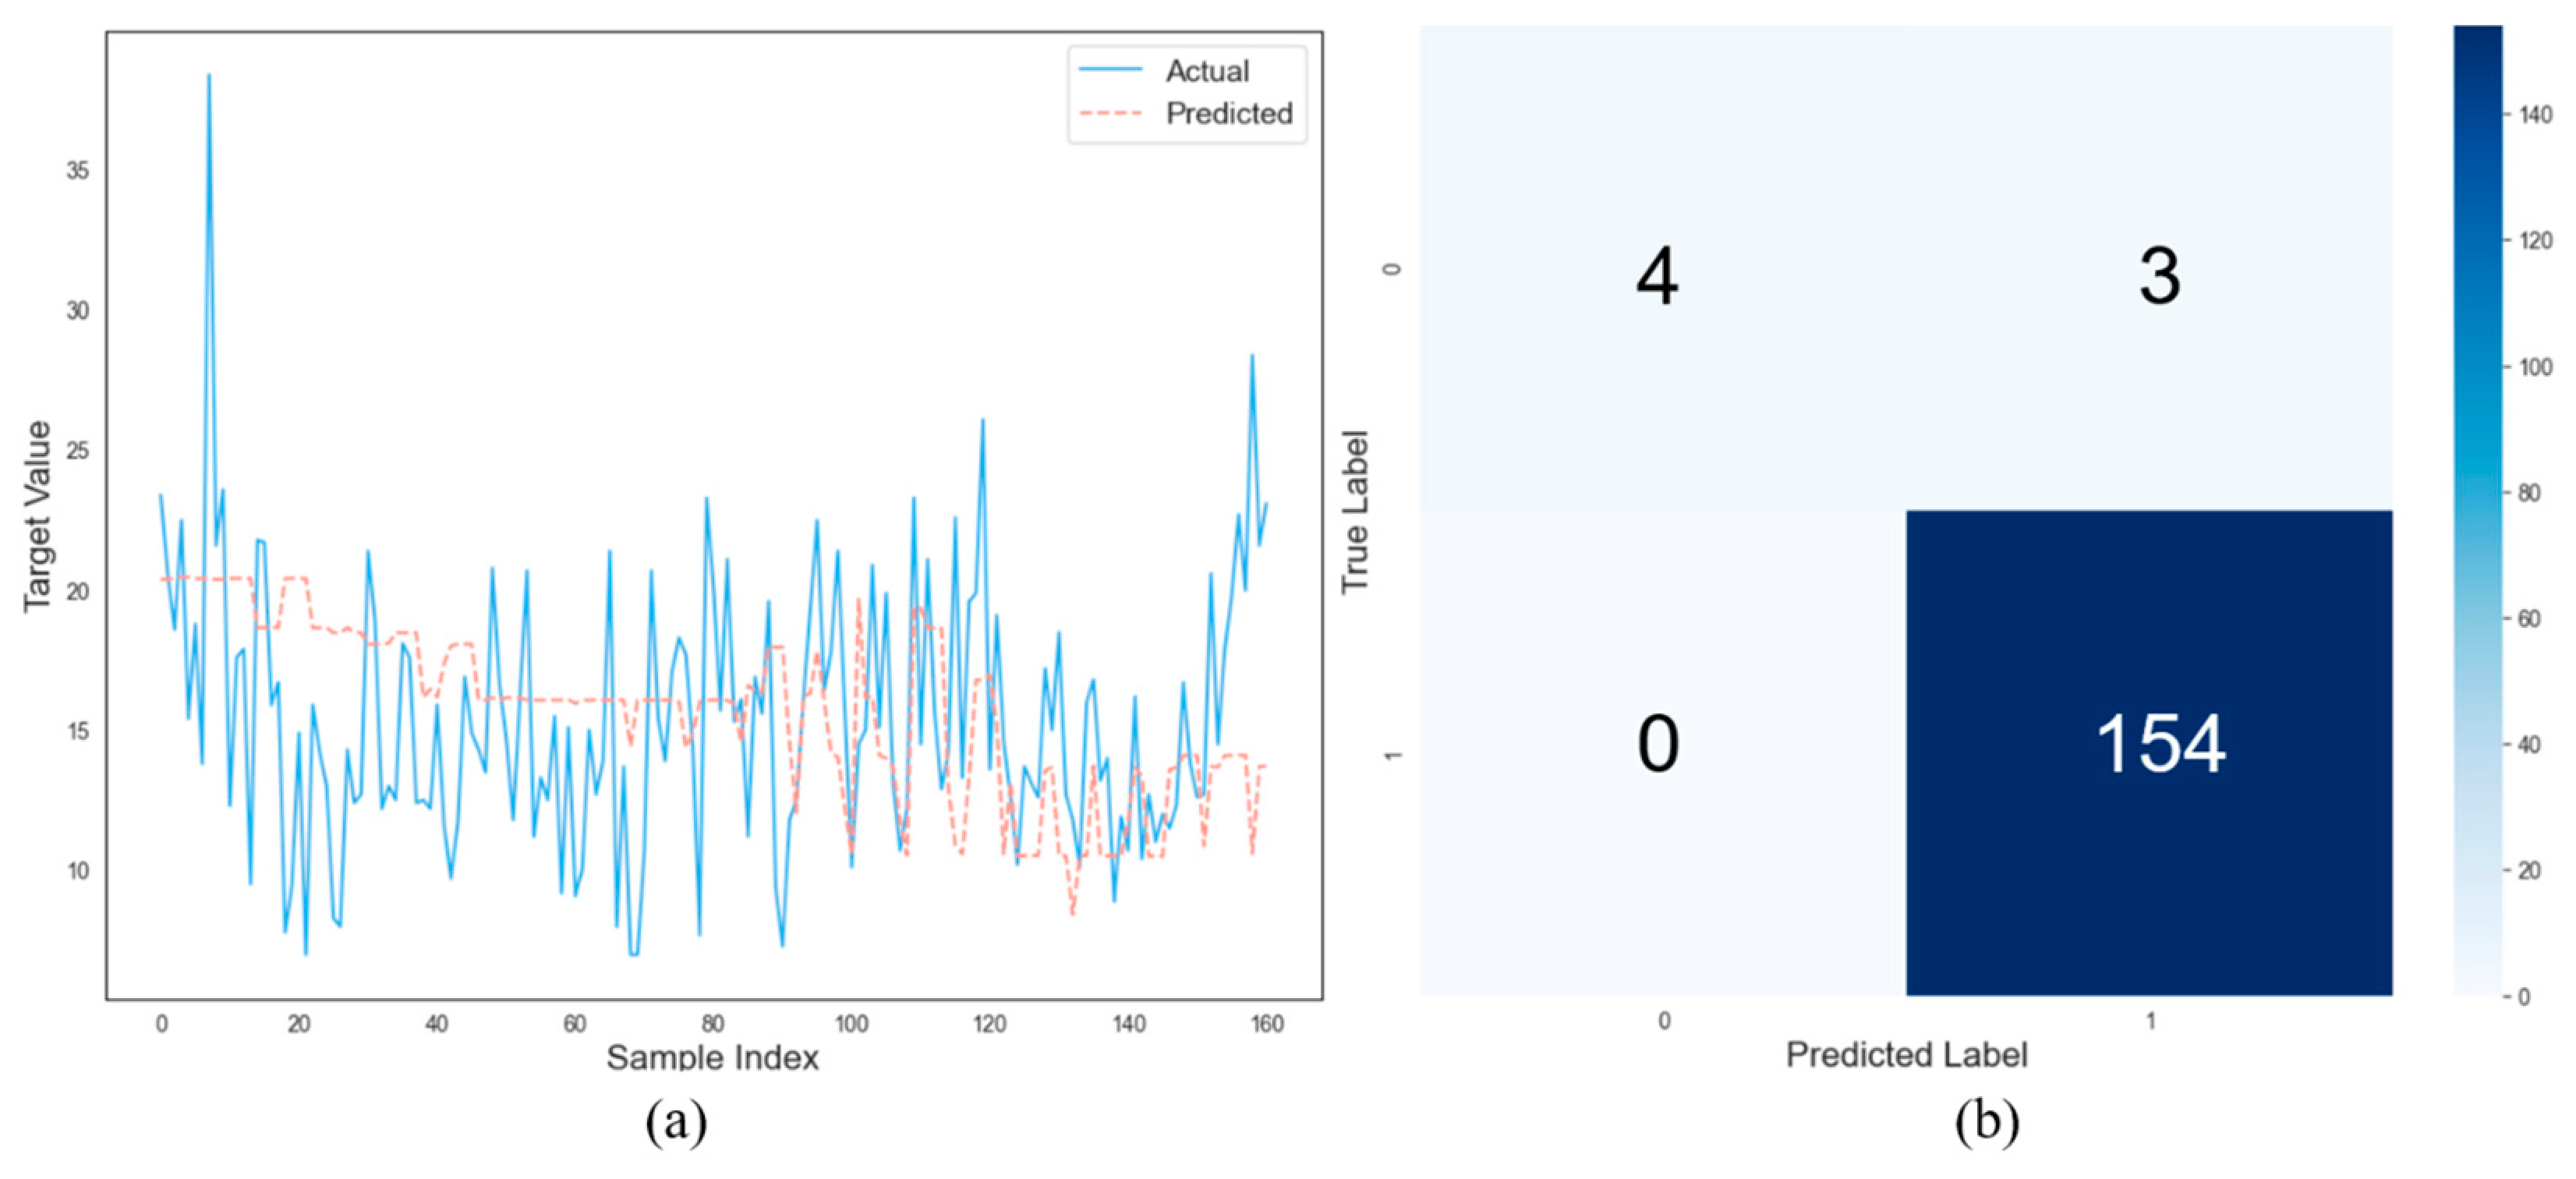
The optimal test results for the six pile length models are listed in
Table 3.
To identify the most suitable feature combinations, several experimental feature categories were constructed for pile length and diameter modeling. These candidate feature groups are summarized in
Table 2 and
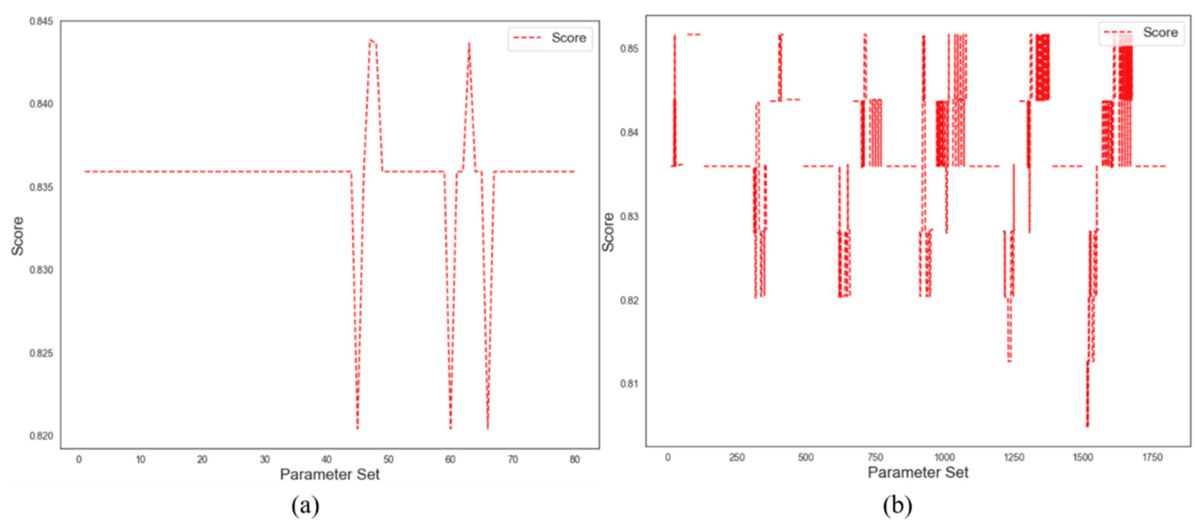
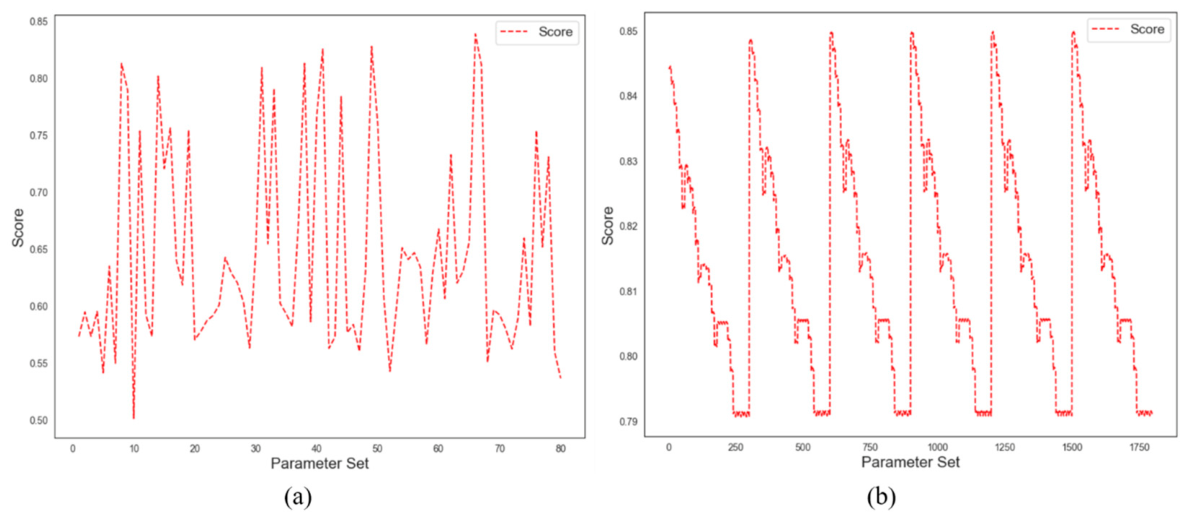
Table 4. Based on these feature groups, multiple regression and classification models were trained and compared using cross-validation metrics. The purpose of this comparison was not to claim state-of-the-art algorithmic performance but to select a stable and practically deployable modeling strategy for integration into the intelligent design workflow.
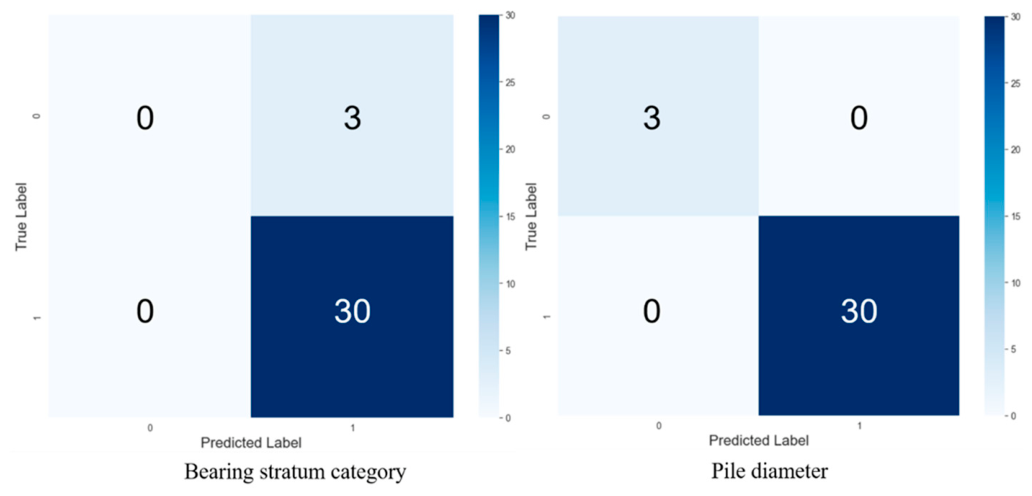
The optimal experimental results for the five pile diameter models are listed in
Table 5.
The comparison results showed that random forest achieved a favorable balance between prediction accuracy, nonlinear fitting capability, and robustness to heterogeneous engineering data. For this reason, random forest was adopted as the core algorithm for the final pile length and diameter models. Its use in this study should be understood as part of an integrated engineering design framework rather than as a standalone algorithmic benchmark study.
2.2.2. Input of Pile Foundation Design Conditions
Individual pile designs in multiple coordinates are required to generate a layout plan for a group of piles. Individually inputting the predicted factors for the pile length and diameter at each coordinate would be cumbersome. Therefore, it is necessary to explore a single value that encompasses these influencing factors. This overarching value allows for the design and calculation of intermediate parameters, followed by the calculation of target parameters such as pile length and diameter using the predicted intermediate parameters. As the parameters vary with different coordinates and each point corresponds to various parameters, these parameters can be associated with the coordinates. Thus, selecting the coordinates of the pile positions as overarching values is crucial. Consequently, a conditional input algorithm is required to receive the input for a few condition parameters, and, after the calculation, the coordinates of the pile positions are obtained. Here, “minimal input” does not imply a fully automated design process but rather a reduction in explicit manual input by using coordinate-based conditional input to implicitly generate multiple design parameters.
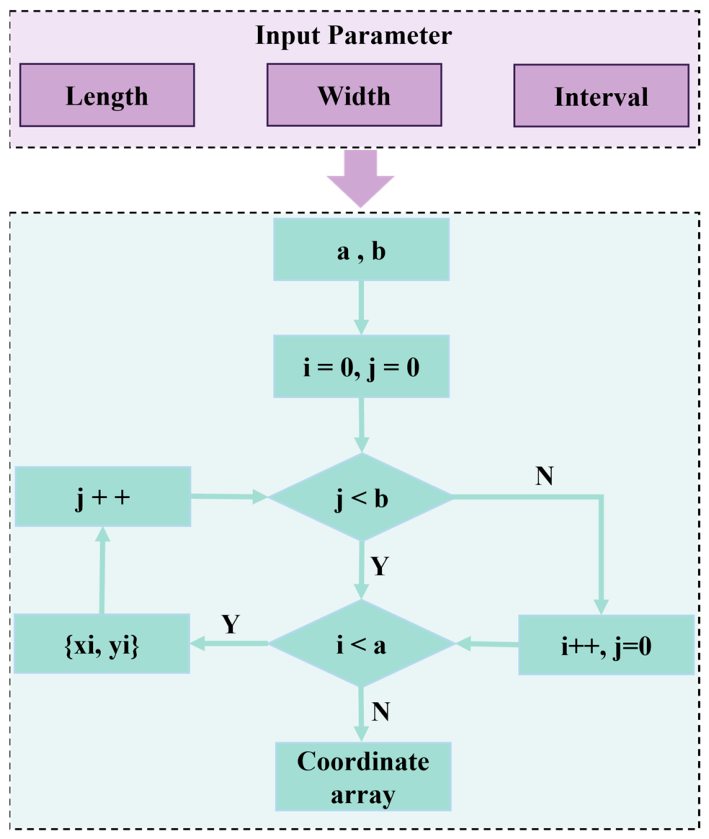
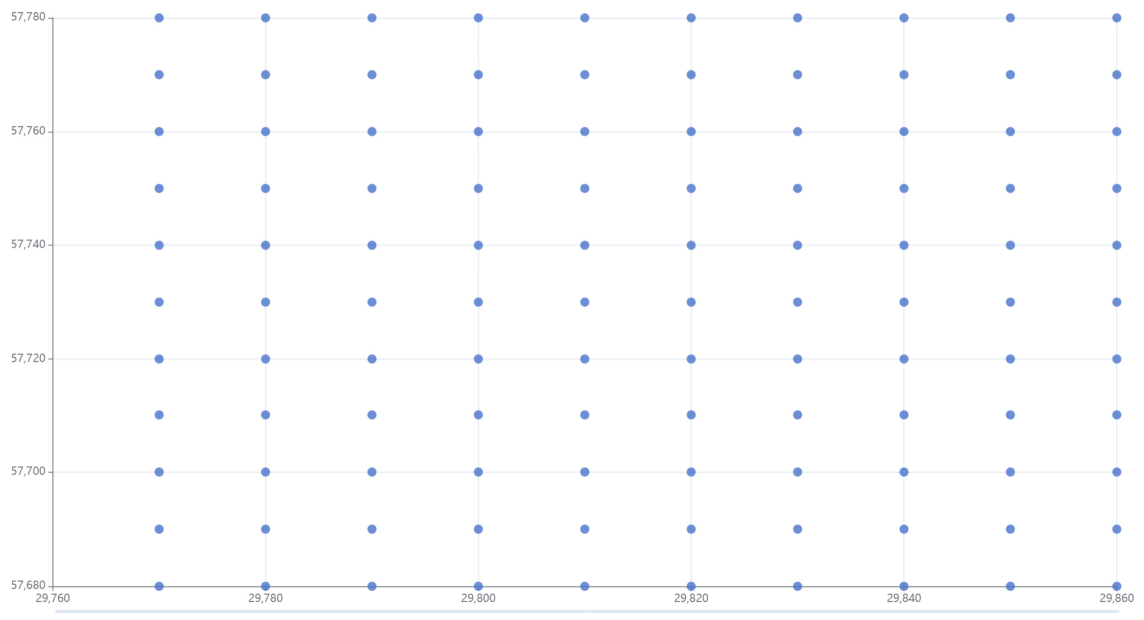
The pile foundation conditional input algorithm first requires the input data for length, width, and spacing to be obtained. Subsequently, the length and width were divided by the spacing to determine the number of points in the longitudinal (a) and transverse (b) directions. Through a nested loop calculation, coordinates were iteratively generated along the x- and
y-axis directions, resulting in the acquisition of all necessary pile position coordinates within the entire distribution area. This formed a pile position coordinate array. A schematic of the algorithm is shown in
Figure 2.
In the proposed framework, the term “coordinate-driven” does not mean that the pile coordinates directly determine the final design parameters in a purely geometric sense. Instead, the coordinates serve as indexing variables that activate the implicit generation of location-dependent geological and engineering attributes. For the
i-th pile location, the coordinate input (
,
) is first used to estimate a set of intermediate parameters related to subsurface and design conditions:
Here,
, where
denote the predicted thicknesses of different strata at coordinate
i,
denotes the predicted depth to the top of the bearing stratum,
denotes the predicted bearing stratum category,
denotes the vertical load, and
denotes the bearing platform elevation. These intermediate parameters are then used to predict the final pile design parameters:
where
and
represent the predicted pile length and diameter, respectively. Finally, the predicted design parameters are mapped to three-dimensional pile geometry for visual representation:
Therefore, the coordinate-driven logic in this study should be understood as a spatial indexing and implicit parameter generation mechanism that links pile positions, subsurface attributes, design parameters, and three-dimensional graphical representation within one integrated workflow.
2.2.3. Intelligent Model Calculation of Pile Foundation
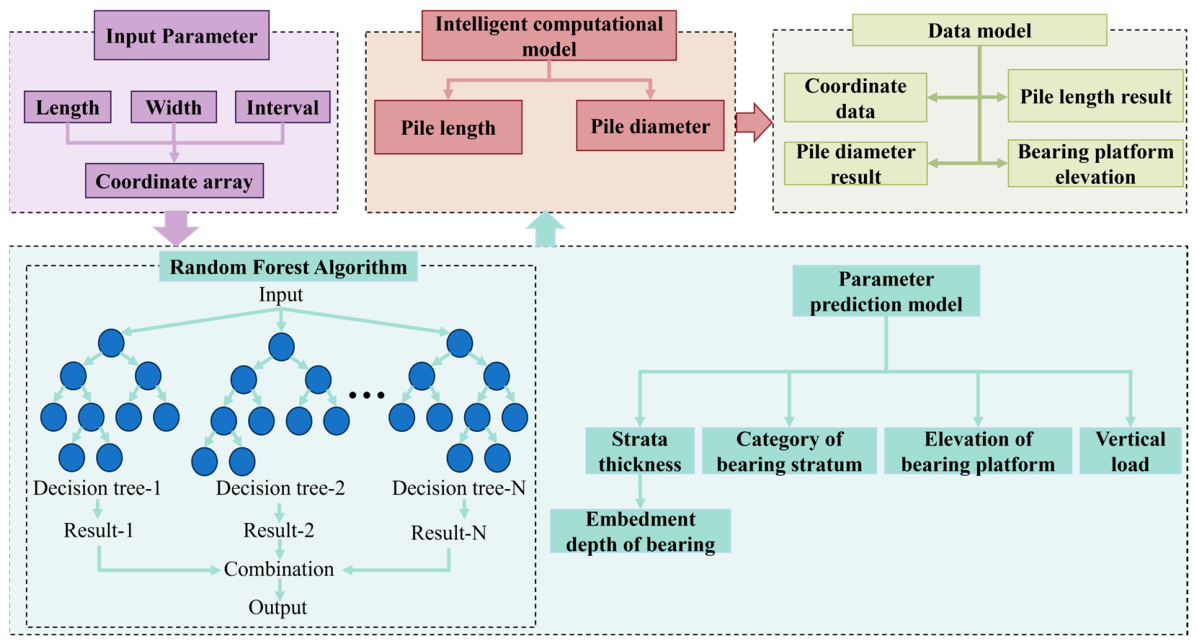
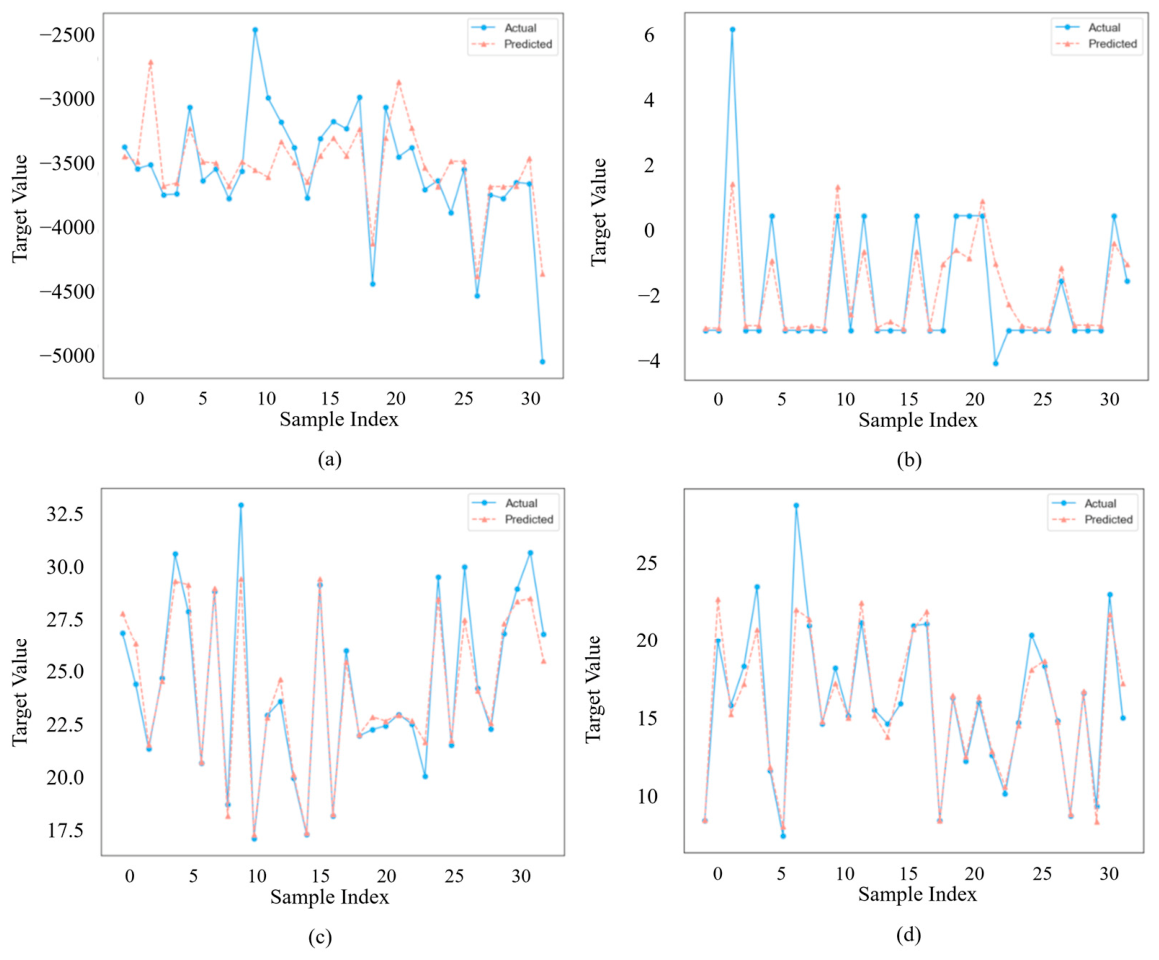
After the pile coordinate array was obtained and the candidate input features were defined, an intelligent computation framework was established for pile foundation design. This framework included multiple intermediate parameter models and final target parameter models. Specifically, random forest regression was used for continuous variables such as stratum-related parameters, bearing layer depth, and pile length, whereas random forest classification was used for categorical variables such as bearing stratum category and pile diameter.
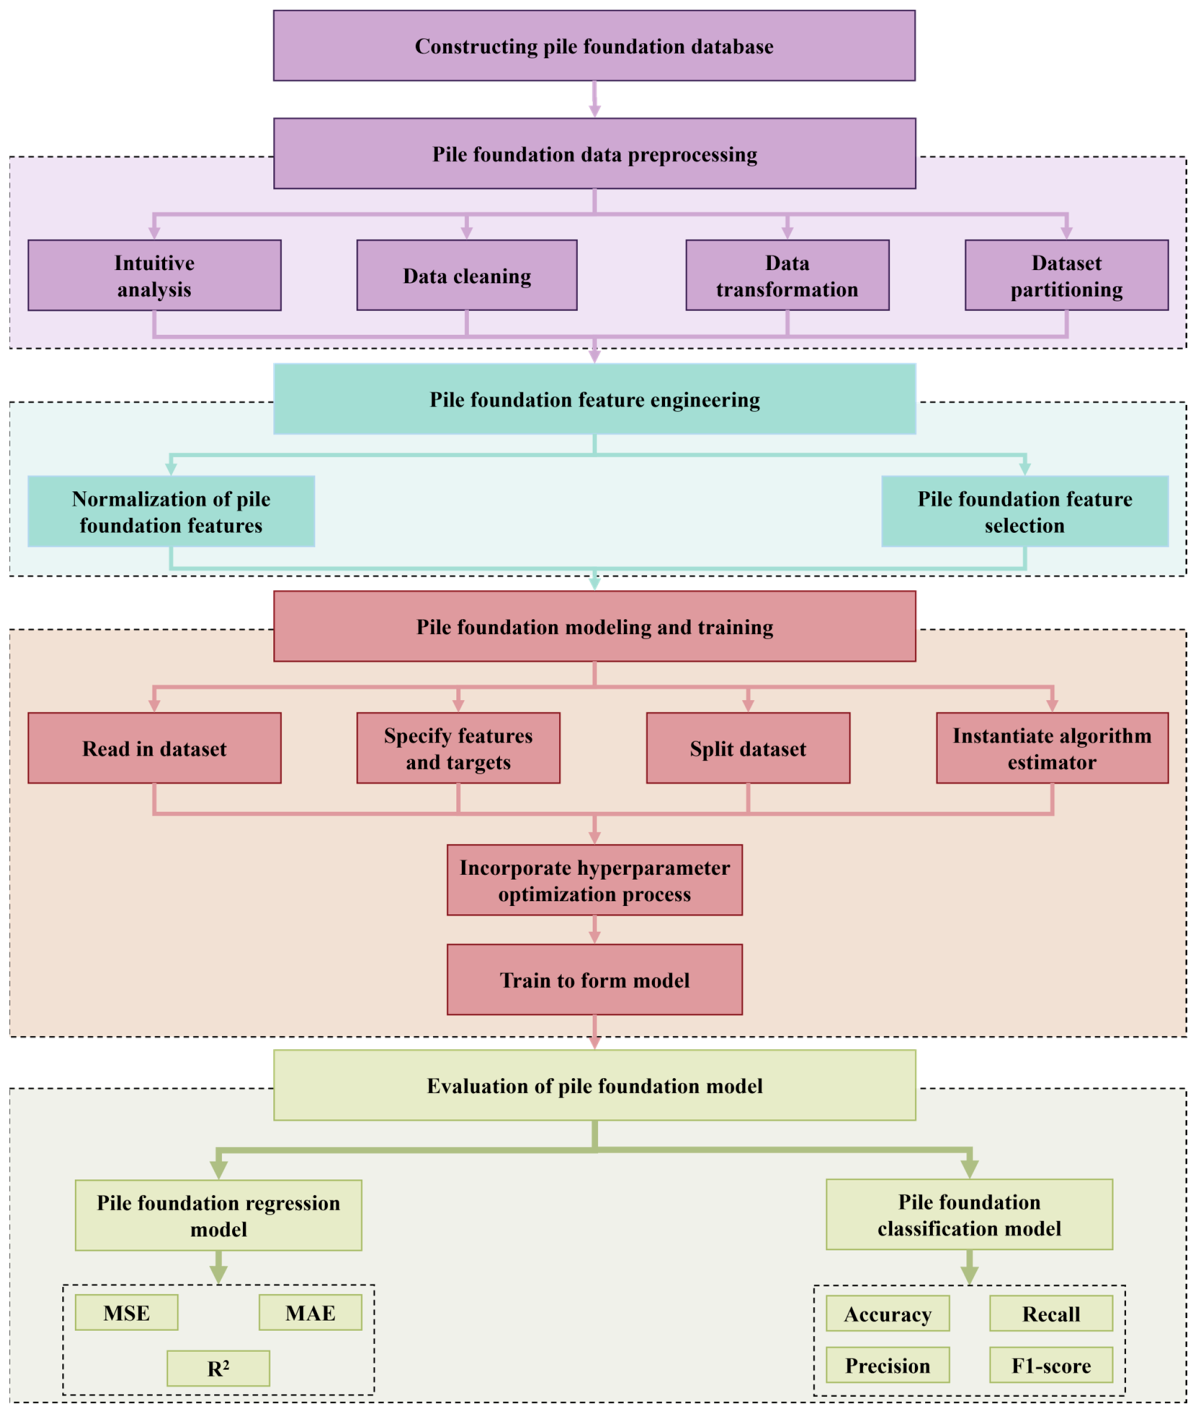
The model development procedure involved five steps: database construction, data preprocessing, feature engineering, model training with hyperparameter optimization, and model evaluation, as shown in
Figure 3. A database was compiled from engineering survey reports, pile foundation design drawings, and borehole-related records. During preprocessing, missing values for stratum thickness variables were filled with zeros when a given stratum was absent at a specific location, thereby preserving the structural consistency of the feature matrix. Categorical variables were numerically encoded before model training. Feature scaling was applied during the preliminary comparison of candidate models to maintain numerical consistency across different algorithm types; however, the final random forest models are inherently less sensitive to feature scaling than gradient-based methods [
31,
32].
To reduce random dependence and improve reproducibility, a fixed random seed was used during model training. A three-fold cross-validation strategy was adopted during hyperparameter tuning and performance evaluation. In this study, the available dataset size was limited; therefore, cross-validation was used to obtain a more stable assessment of model performance under the current project conditions. Nevertheless, it should be emphasized that this validation strategy does not constitute external validation across independent engineering sites.
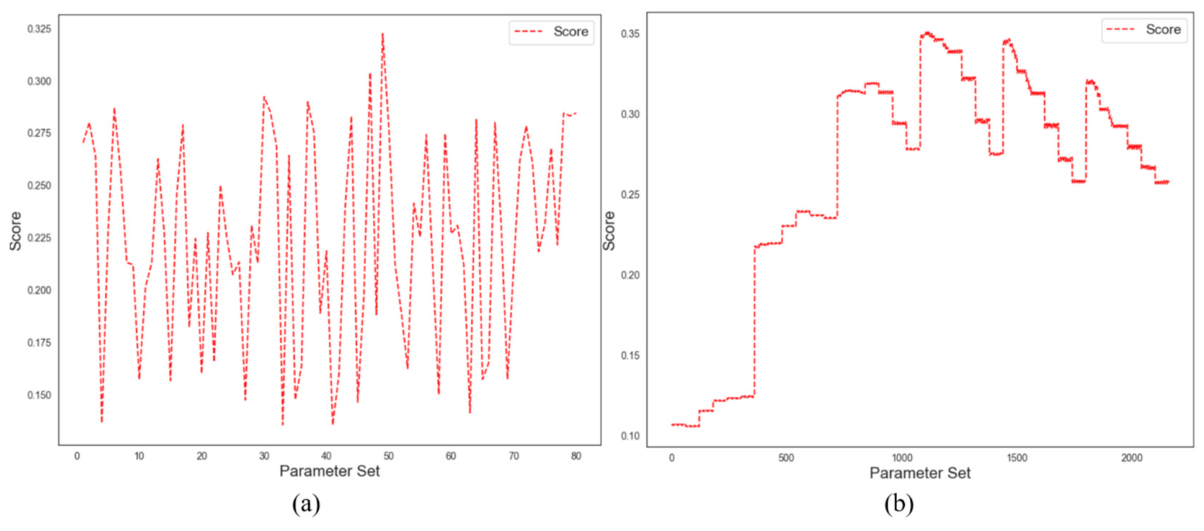
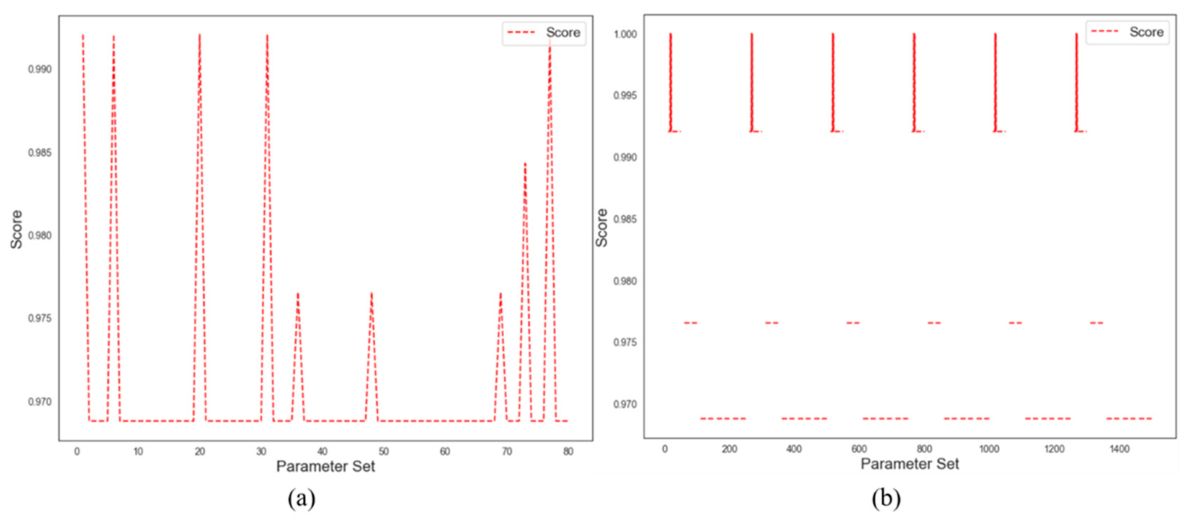
Hyperparameter optimization was conducted by combining random search and grid search. The candidate models were compared using different metrics according to the prediction task. For regression models, the mean squared error (MSE), mean absolute error (MAE), and coefficient of determination (R
2) were used. For classification models, accuracy, precision, recall, and F1-score were employed. These metrics were used to identify models that were sufficiently stable and accurate for integration into the overall intelligent design workflow. This combined calculation process is illustrated in
Figure 4.
Based on the trained intermediate models and final target models, the complete computation sequence of the proposed framework was organized as follows:
(1) Input the coordinate array of pile locations;
(2) Predict intermediate geological and engineering parameters at each coordinate, including stratum thickness, bearing layer depth, bearing stratum category, vertical load, and bearing platform elevation;
(3) Predict final pile design parameters, including pile length and pile diameter, using the generated intermediate parameter set;
(4) Organize the predicted results into a structured pile foundation data model containing coordinates, pile length, pile diameter, and platform elevation for subsequent three-dimensional mapping.
In this way, the proposed intelligent computation framework functions as a coordinated multi-model pipeline rather than as an isolated single prediction model. Its role is to support integrated pile foundation design under reduced manual input rather than to replace code-based engineering verification in final design practice.
2.2.4. Three-Dimensional Mapping and Drawing of Pile Foundation
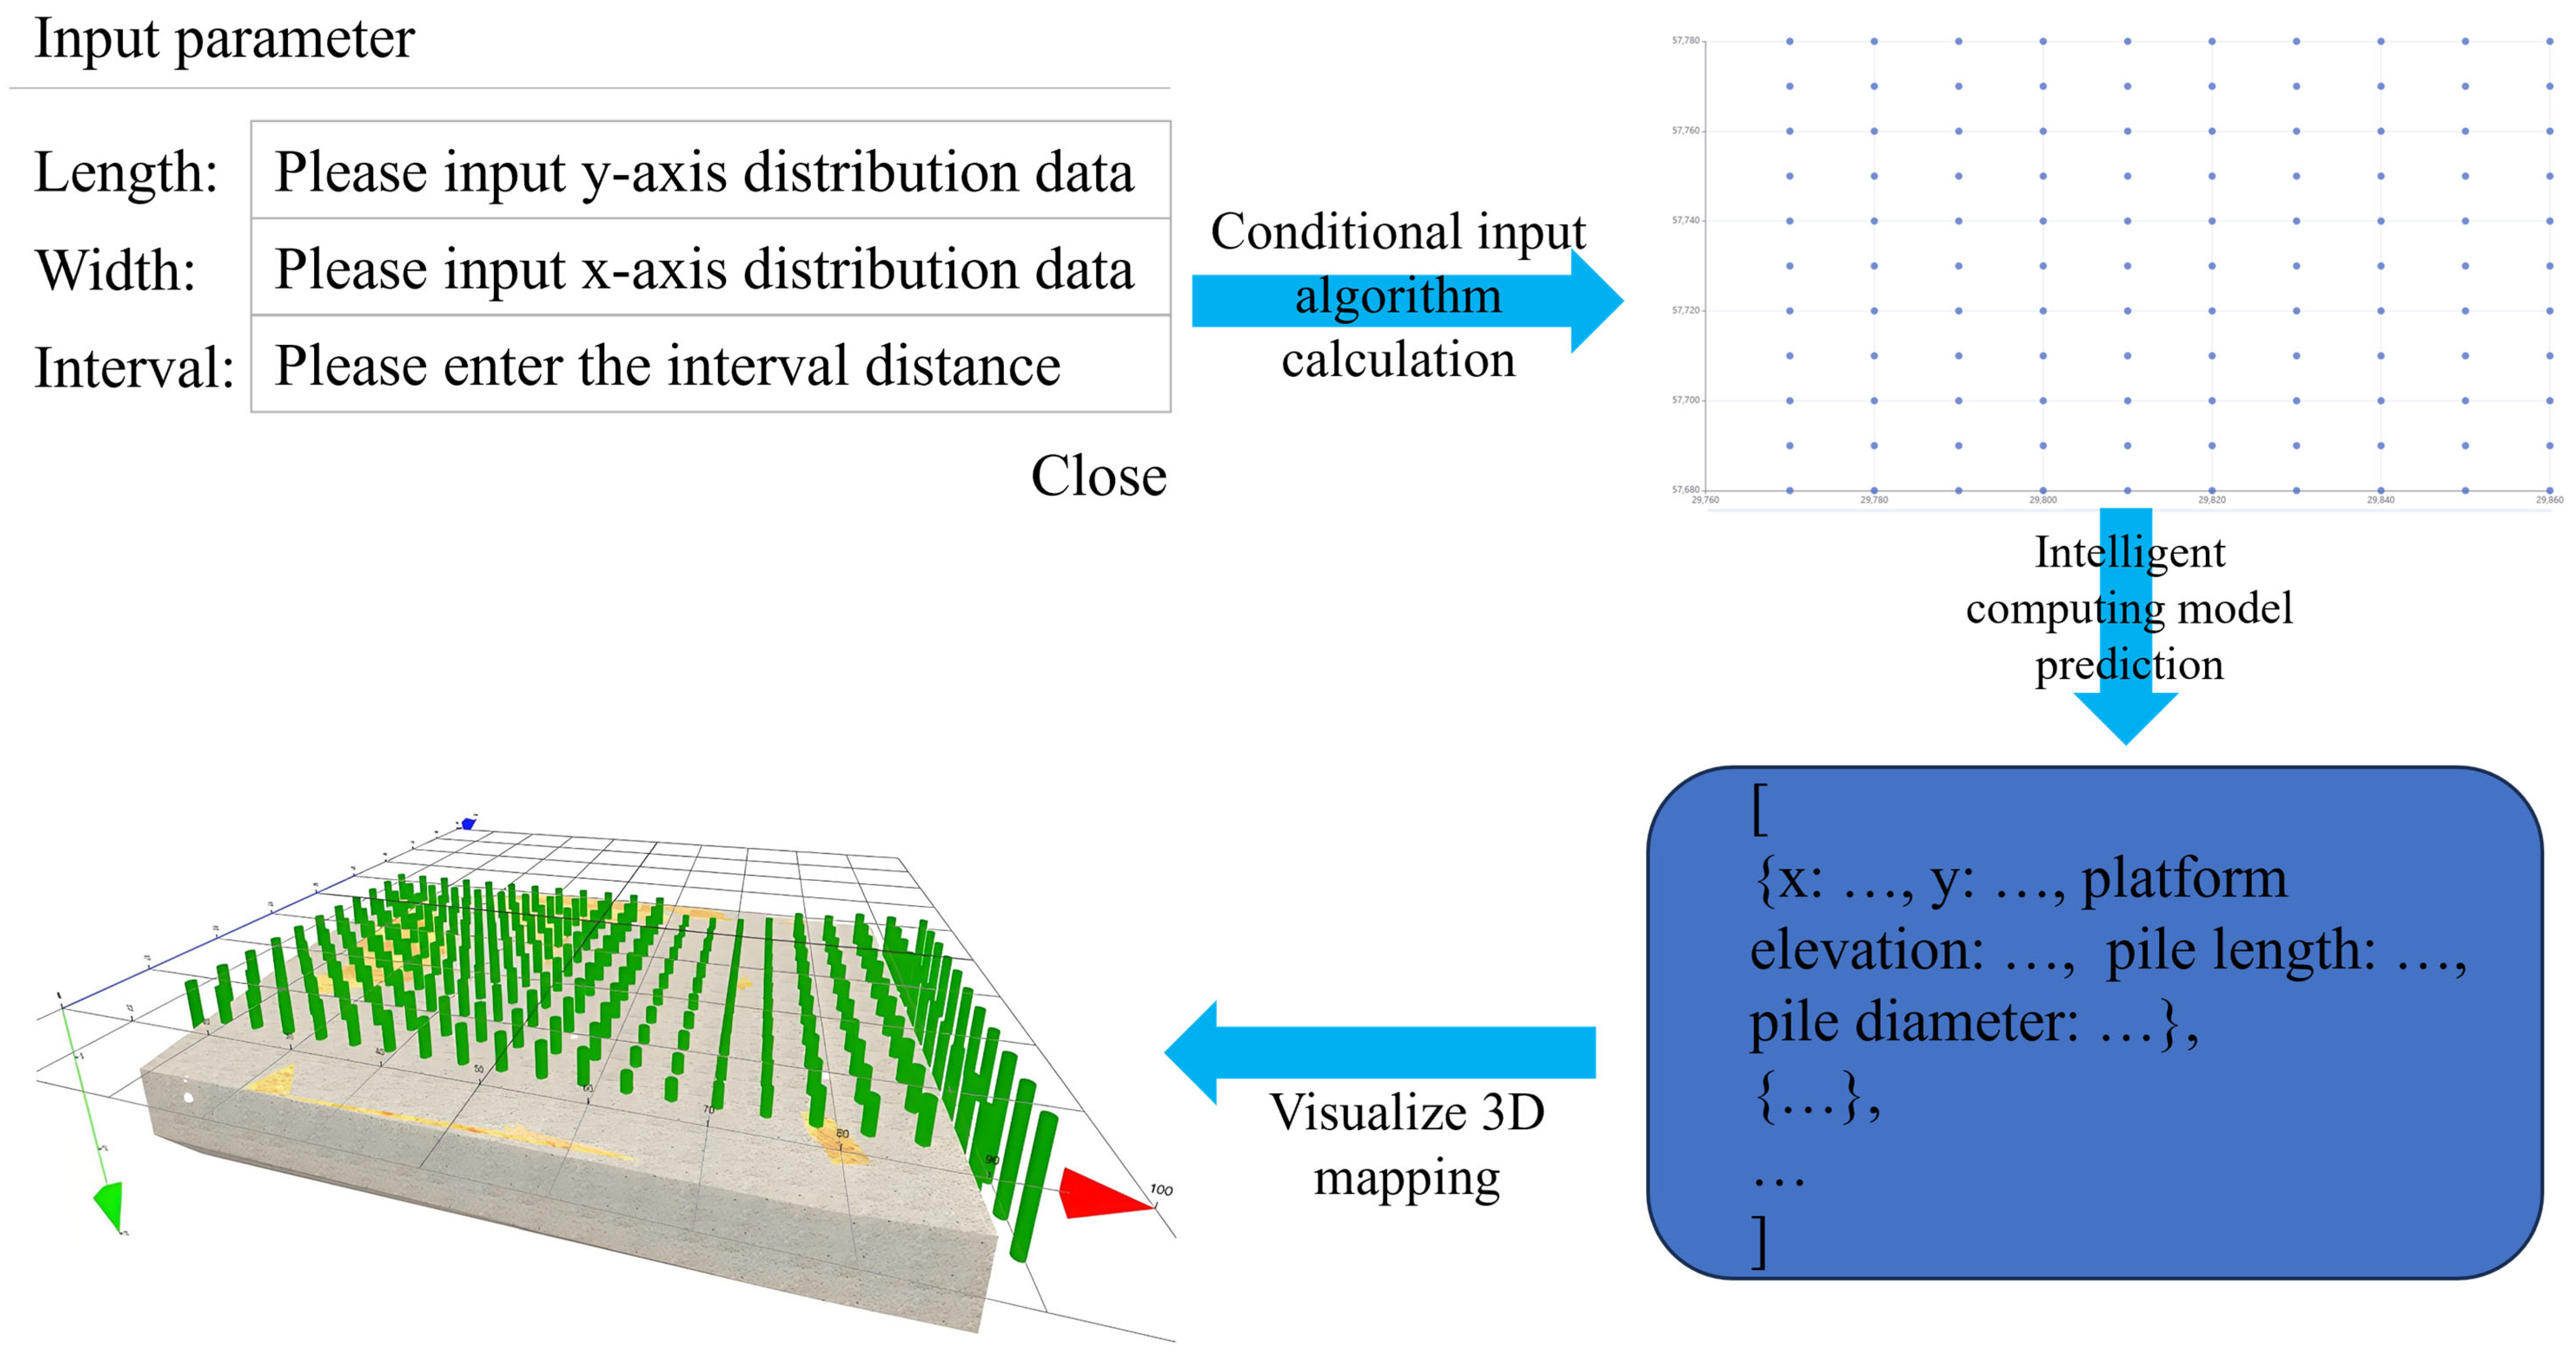
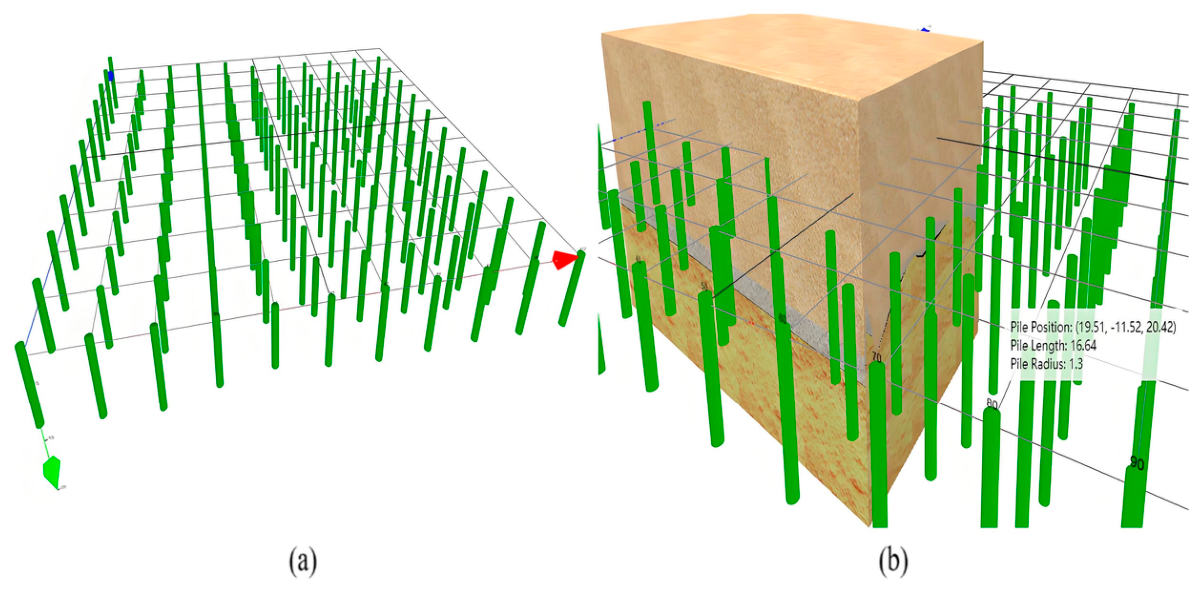
It is necessary to utilize the pile foundation data model as a basis for generating three-dimensional drawings of the pile foundation. In three-dimensional space, various data items in the data model are mapped. The x- and y-coordinates are directly mapped as coordinate information, while the platform elevation is mapped as the starting point for drawing the pile foundation in the z-axis direction. The pile foundation is represented as a cylinder in three-dimensional space, with its length indicating the height of the cylinder model and its diameter representing the diameter of the pile foundation model. Additionally, visualizing the three-dimensional pile foundation results in conjunction with a specific geological model is advisable.
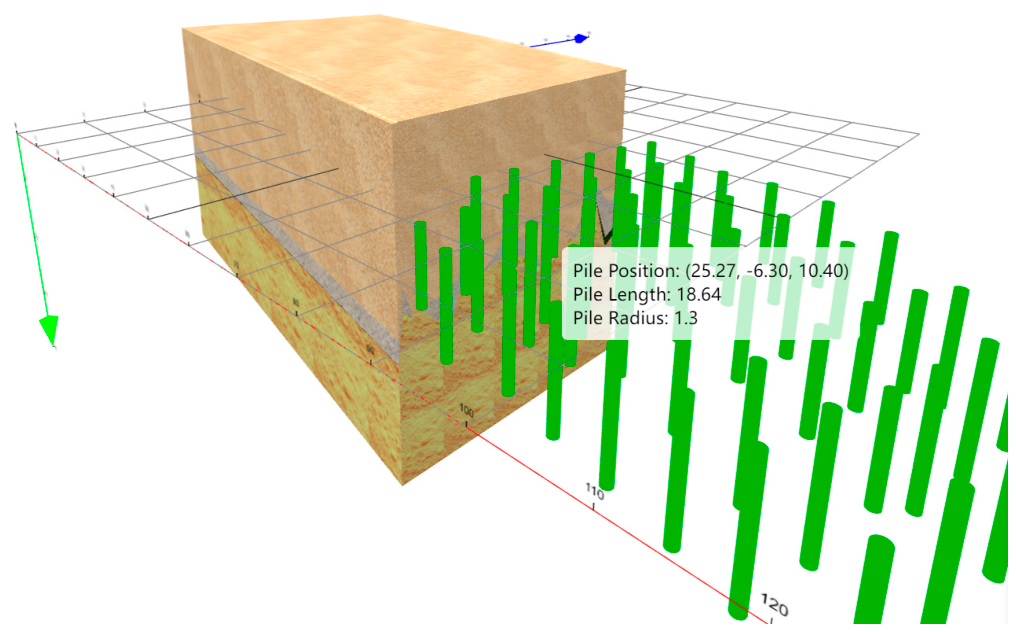
The purpose of the visualization stage is to transform the pile foundation data model into an interpretable three-dimensional representation. In the proposed mapping logic, the x- and y-coordinates define the planar location of each pile, the bearing platform elevation defines the starting elevation in the vertical direction, the pile length is mapped to the height of the pile geometry, and the pile diameter is mapped to the geometric diameter of the cylindrical pile object. In this way, the predicted design parameters are directly converted into visualized pile entities in three-dimensional space.
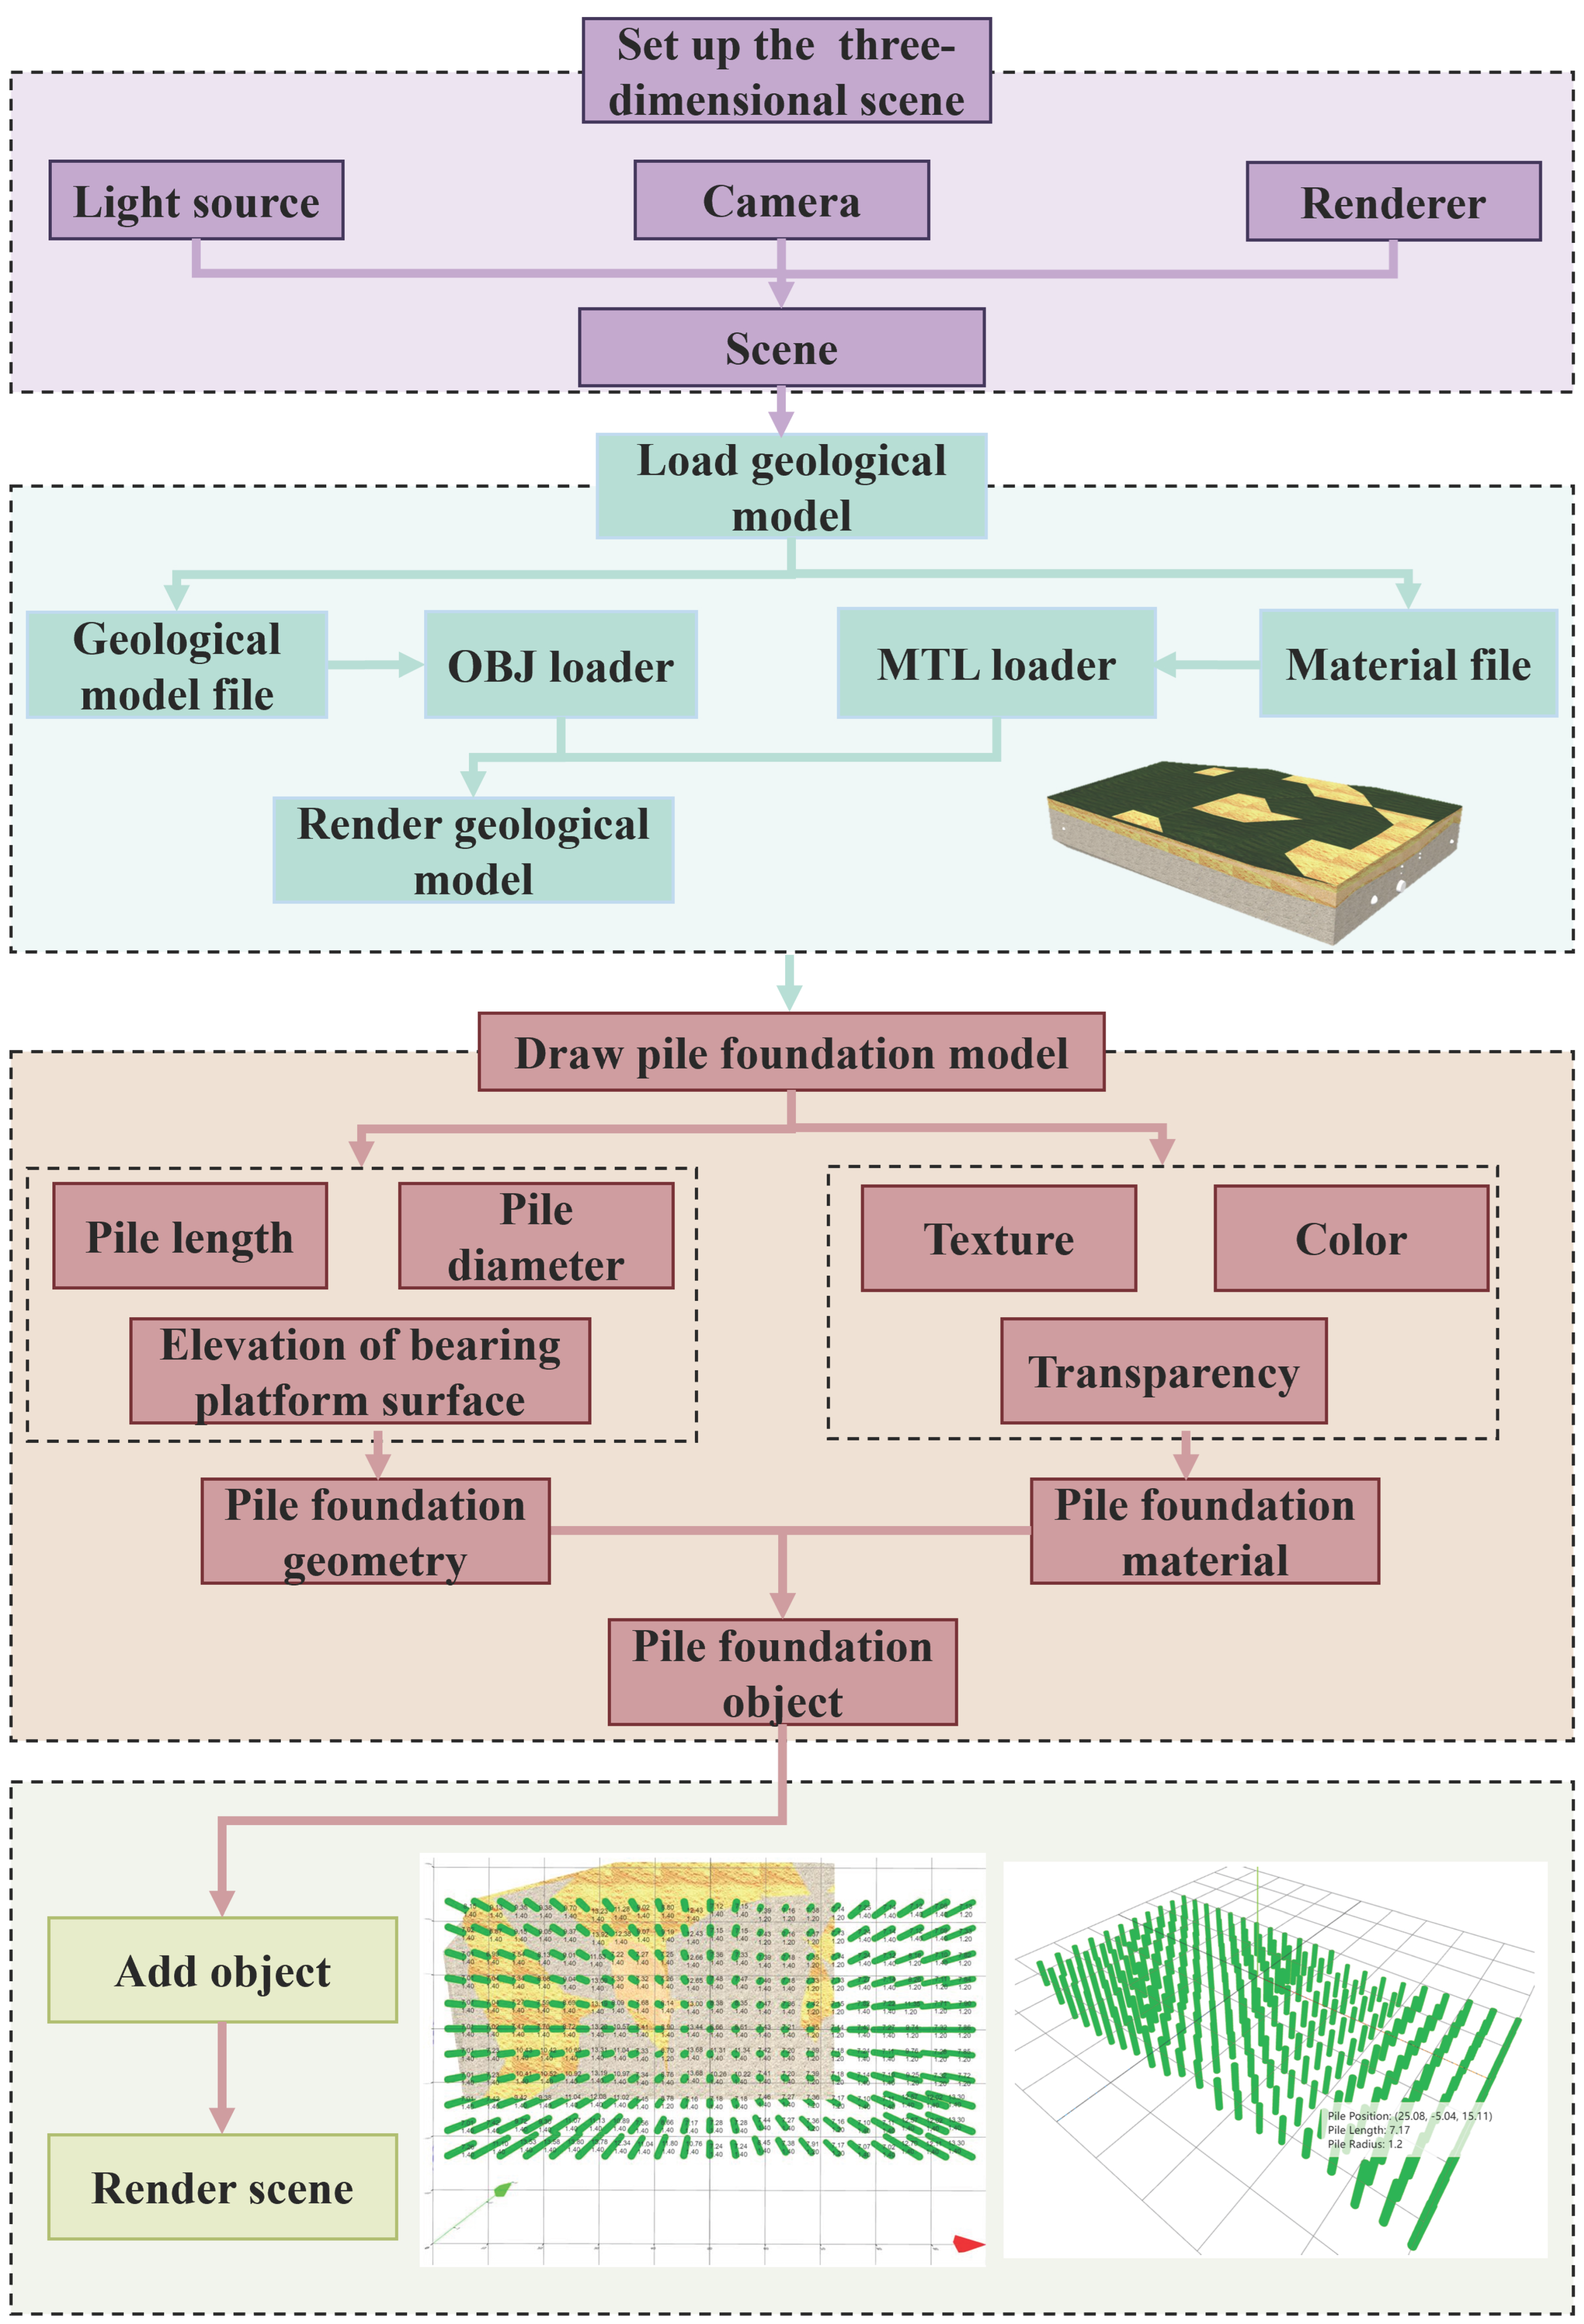
To enhance engineering interpretability, the pile geometry is displayed together with the geological model of the site. This combination makes it possible to visually inspect the spatial relationship between the pile layout, pile dimensions, and surrounding subsurface conditions. The mapping process is implemented in a web-based environment using Three.js, allowing interactive inspection of the pile group and associated design information. When the user hovers over a pile element, the system displays the corresponding design attributes, including coordinates, pile length, and pile diameter.
It should be emphasized that the focus of this visualization is not the implementation of general front-end programming operations but the establishment of a rule-based correspondence between intelligent design data and three-dimensional engineering geometry. Accordingly, the visualization module acts as the terminal expression layer of the proposed intelligent information framework. A schematic of the process is illustrated in
Figure 5.
2.3. Implementation Steps
To realize integrated intelligent pile foundation design and visualization under reduced manual input, the implementation of the proposed framework can be divided into three major stages: data preparation and feature construction, coordinate-driven intelligent computation, and rule-based three-dimensional mapping.
In the first stage, engineering survey reports, borehole records, pile foundation drawings, and related design documents are collected and organized to establish the pile foundation database. Based on these materials, design-relevant input variables and target variables are defined, and feature screening and algorithm comparison are carried out to determine the final modeling strategy.
In the second stage, the user inputs the layout boundary and pile spacing conditions, from which the coordinate array of pile locations is automatically generated. These coordinates are then passed into the intelligent computation pipeline. Intermediate geological and engineering parameters are predicted first, followed by the final pile design parameters, including pile length and diameter. The output of this stage is a structured pile foundation data model containing the key attributes required for graphical representation.
In the third stage, the structured pile foundation data model is mapped into three-dimensional engineering geometry according to predefined geometric rules. Pile coordinates, elevations, lengths, and diameters are transformed into interactive spatial objects, and the generated pile group is integrated with the site geological model for visual display. Through this process, the framework connects condition input, design computation, and three-dimensional representation into a unified intelligent information workflow.
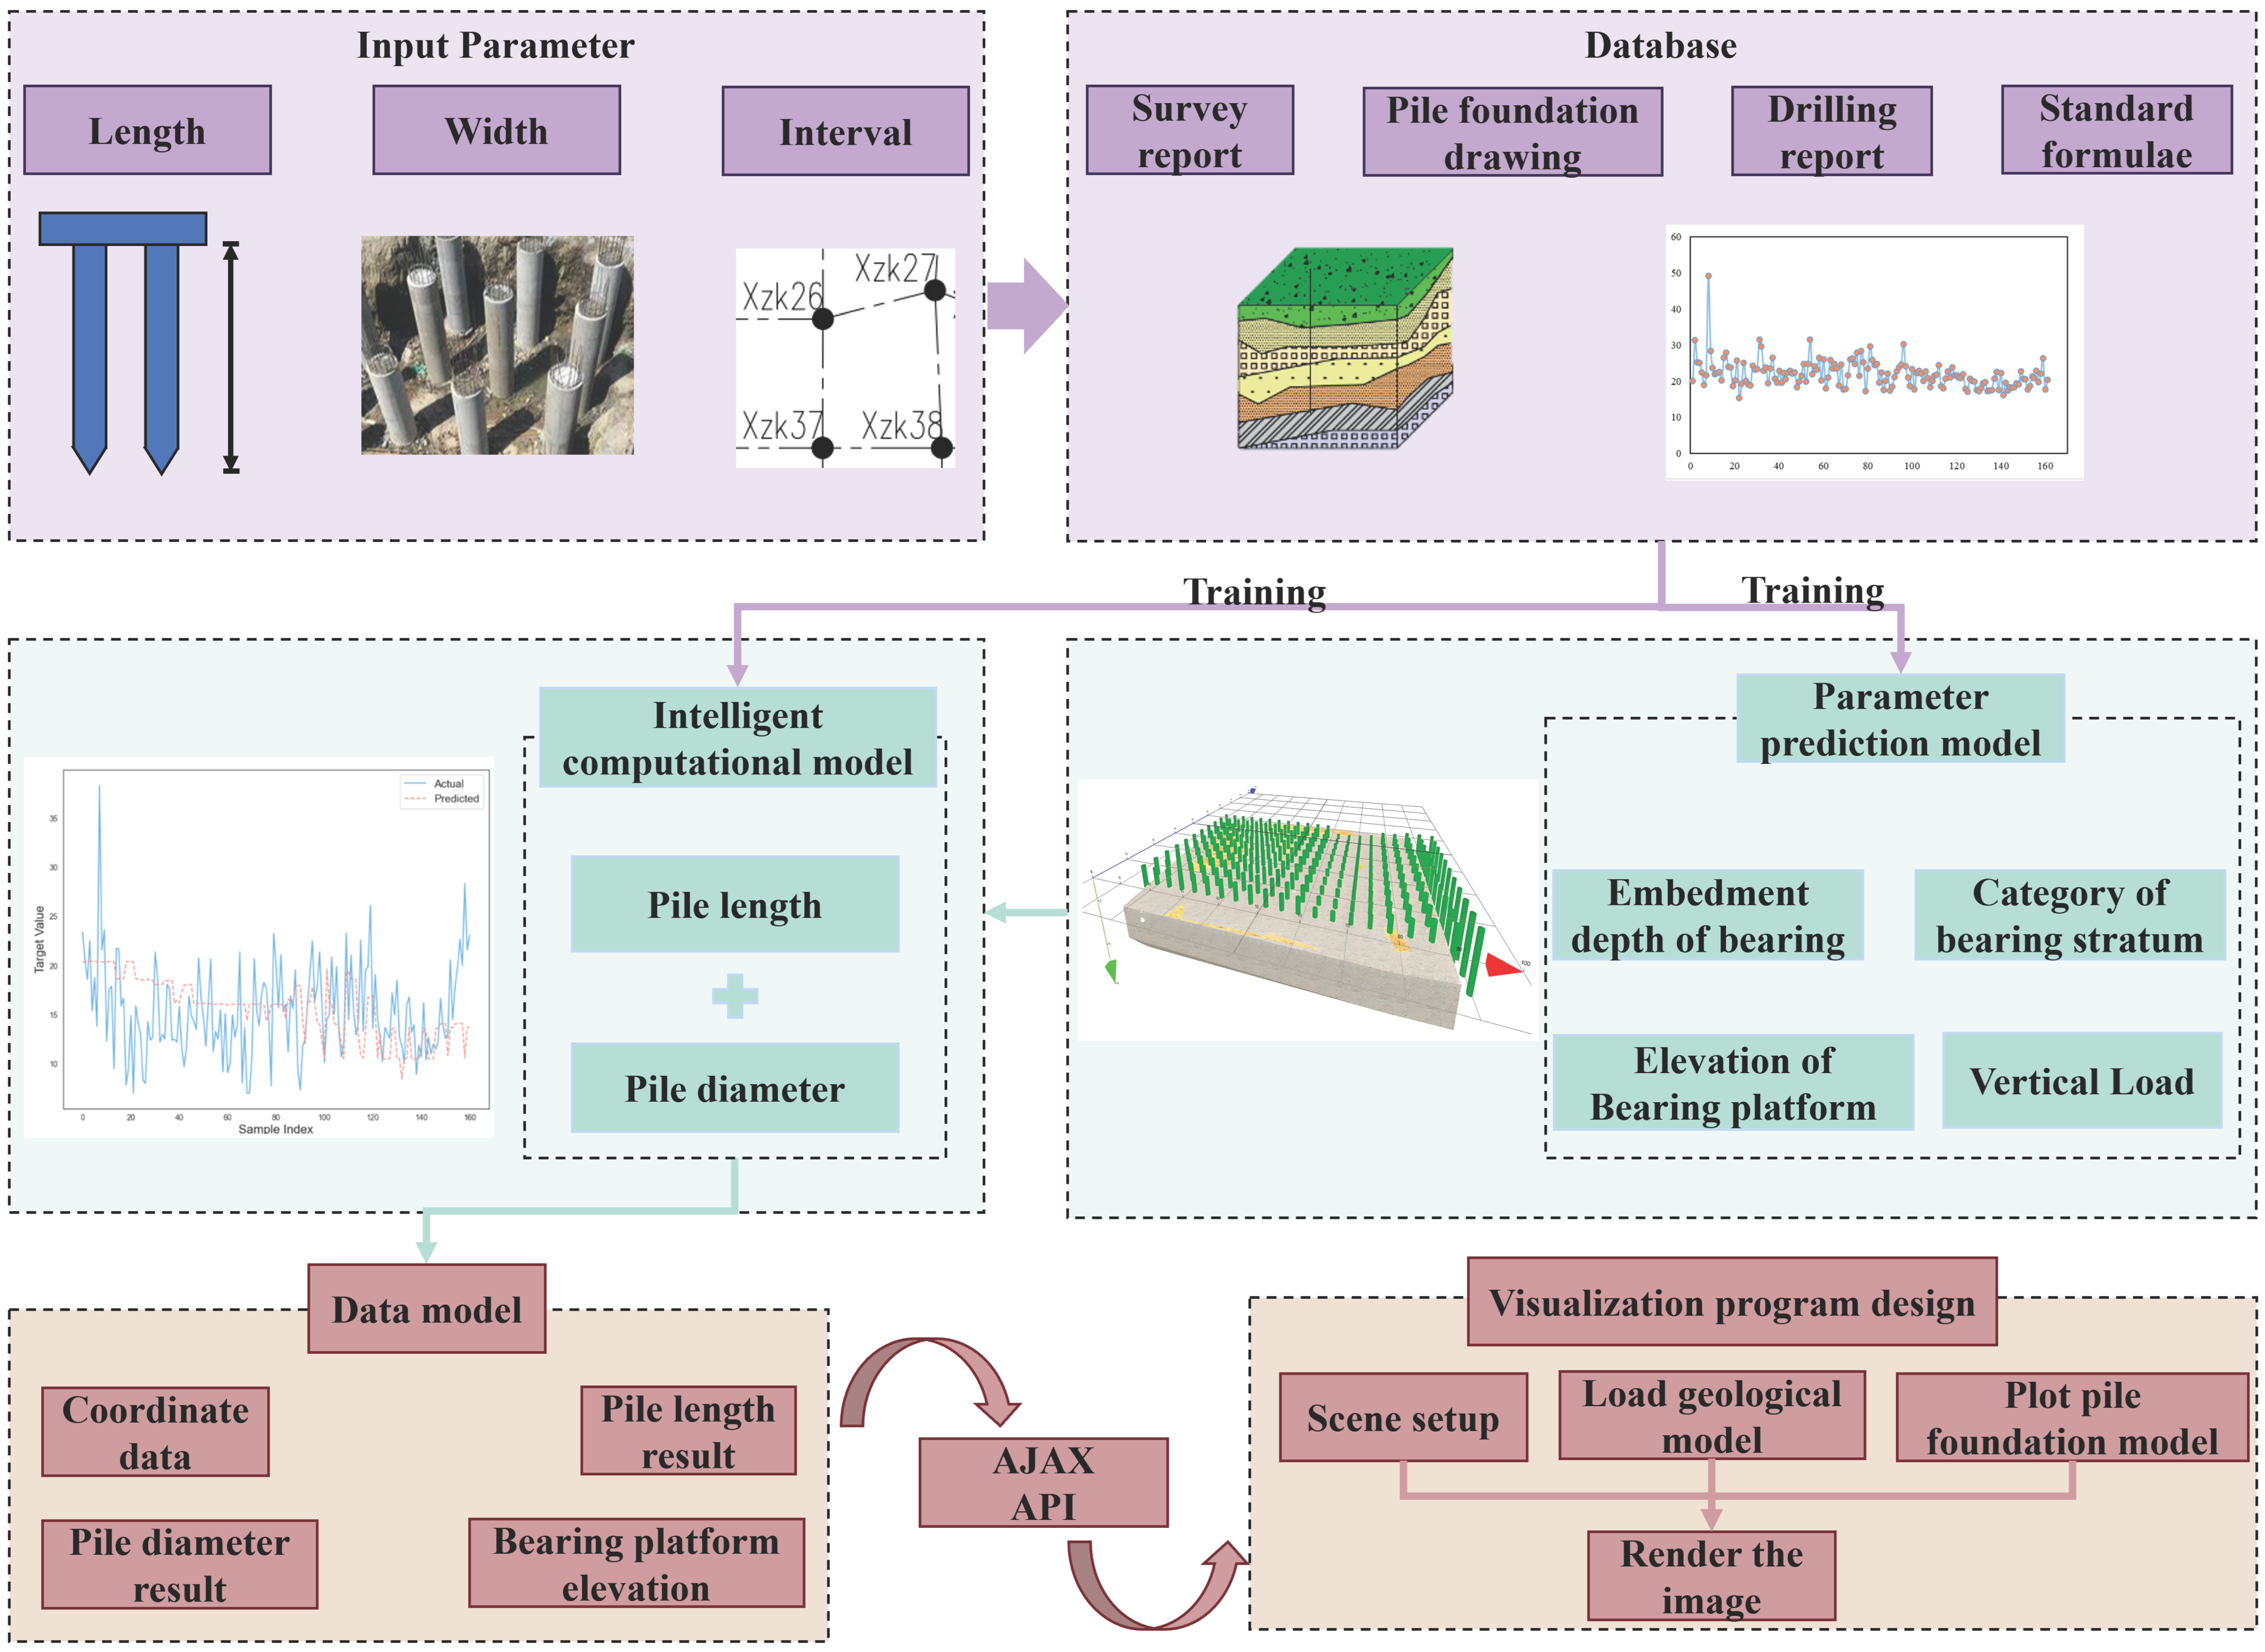
The implementation steps shown in
Figure 6 illustrate this integrated process. The emphasis of the framework lies in workflow integration and data-model-to-geometry transformation, rather than in the technical details of generic front-end programming.