Article

Intelligent Information Model for Pile Foundation Design: A Research Study

1
School of Civil Engineering, Sun Yat-sen University, Guangzhou 510275, China
2
Guangdong Engineering Research Centre for Major Infrastructure Safety, Guangzhou 510275, China
3
Institute of Disaster Prevention and Reduction of the Guangdong-Hong Kong-Macao Greater Bay Area, Guangdong University of Technology, Guangzhou 510006, China
*
Author to whom correspondence should be addressed.
Buildings 2026, 16(10), 1926; https://doi.org/10.3390/buildings16101926
Submission received: 27 March 2026 / Revised: 26 April 2026 / Accepted: 9 May 2026 / Published: 12 May 2026
(This article belongs to the Section Construction Management, and Computers & Digitization)

Abstract

Pile foundation is one of the most widely used deep foundation solutions, and the intelligent informatization of its design process holds significant theoretical and practical value. The innovation of this study lies in the construction of a systematic integrated framework for intelligent pile foundation design and 3D visualization. Unlike previous machine learning studies that primarily focus on the predictive accuracy of individual parameters, this framework establishes a “coordinate-driven” parameter generation mechanism, enabling a fully automated workflow from geological feature extraction and implicit design parameter computation to real-time 3D model mapping. We clarified the basic principles of intelligent informatization and constructed a database to conduct a correlation analysis to identify key algorithms. An intelligent calculation model based on random forest was established for predicting core design indicators such as pile length and diameter. By transforming complex nonlinear design logics into data-driven predictive models, the framework significantly reduces the reliance on empirical assumptions and the costs associated with frequent human–computer interaction in traditional design processes. Furthermore, a 3D mapping method is developed using Three.js to achieve real-time coupling of design data and spatial geometric models. The proposed method was applied to a practical engineering case in southern China for verification. The results demonstrate that the framework allows for the rapid formation of data models with reduced manual input while optimizing workflow efficiency and maintaining objective accuracy. This approach provides a closed-loop solution for geotechnical engineering transitioning from digital decision-making to visual presentation, offering high potential for adaptation to other engineering scenarios.

1. Introduction

In civil engineering, intelligent design is of significant theoretical and practical importance. Compared with the intelligent design of superstructures, the intelligent informatization of foundation design is more challenging because of the complex and variable nature of subsoil conditions, which are influenced by the superstructure and underlying soil. Pile foundations are among the most widely used deep foundation schemes and constitute a significant focus of geotechnical engineering research. Therefore, intelligent informatization of pile foundation design is a crucial aspect of intelligent design research in this field [1,2,3]. In the pile foundation design process, inferential computations among numerous conditional parameters and untangled nonlinear complex relationships are required. Introducing artificial intelligence technologies such as machine learning can effectively address these intricate relationships [4]. Therefore, focusing on pile foundations as the subject of study, the application of more scientifically rigorous and efficient design and computational methodologies has become imperative in the field of pile foundation engineering design.
Traditional pile foundation design methods can be broadly classified into three categories: (1) conventional design methods, (2) design methods that integrate building information modeling (BIM), and (3) intelligent design methods based on big data. The first two are the primary methods currently used. Conventional design processes primarily involve static or dynamic design [5,6] and use various theoretical formulas and models [7,8], resulting in one-dimensional design drawings. With the rapid development of the construction industry and the advent of BIM technologies [9,10], scholars have utilized modern simulation and BIM software [11,12,13] to create 3D models, analyze pile foundation performance, and achieve design results in three dimensions, thus improving design efficiency. Subsequently, machine learning and other artificial intelligence technologies were introduced into civil engineering design [14], leveraging big data analysis and machine learning to mine patterns from extensive pile foundation design data [15,16,17,18]. This approach digitalizes, automates, and intelligentizes the design process, thereby enhancing efficiency. The diverse nature of engineering practices results in a heterogeneous landscape within the field of pile foundation engineering research. Scholars often integrate these approaches into their designs, aiming to enhance the effectiveness and applicability of design methodologies to meet the practical requirements of various engineering projects. Traditionally, domestic and international research pertaining to pile foundation design has primarily focused on employing methods such as numerical simulations, model testing, and theoretical analyses to compute and predict the pile-bearing capacity, control pile settlement, and achieve optimized pile designs [19]. This pursuit aims to maximize the bearing potential of the foundation and piles and reduce the cost of pile foundations while simultaneously ensuring safety, quality, and economic viability [20,21,22,23,24,25,26,27,28]. Additionally, researchers have proposed various special pile types for specific geological conditions to facilitate multifunctional designs and applications [29]. After years of accumulation, significant progress has been made in design research concerning traditional design methods and those incorporating building information modeling (BIM). However, these approaches also have varying degrees of limitations. Conventional design methods often require empirical assumptions and calculations. Typically, several iterations of design modifications are necessary to achieve satisfactory solutions, which can hinder the efficiency of pile foundation design. However, BIM methods have several shortcomings in meeting actual engineering requirements, such as higher costs associated with human–computer interaction design and the potential introduction of human errors owing to assumptions and calculations during the design process, thereby impacting the accuracy of the design. Subsequently, in alignment with the trend of intelligent digitization, scholars have begun integrating artificial intelligence technologies, such as machine learning, into the field of civil engineering design. Despite the significant progress in predicting pile capacity using machine learning, most studies focus primarily on improving the accuracy of algorithms as standalone predictive tools, often neglecting the systematic integration of these models into the entire engineering design workflow. This disconnect between computation and design forces engineers to perform extensive manual data conversion and human–computer interaction, hindering the practical implementation of intelligent technologies. Furthermore, current research on BIM and visualization tends to treat them as static display tools, lacking a closed-loop logic that connects underlying data-driven insights with automated spatial geometry generation.
To address these limitations, this study proposes an integrated intelligent information framework for pile foundation design that combines machine learning-based design computation with rule-based three-dimensional mapping. Rather than directly predicting pile-bearing capacity in a strict mechanical sense, the proposed framework aims to automatically generate key pile design parameters, including pile length and diameter, from design-relevant geological and engineering information under a coordinate-driven workflow. In this framework, pile coordinates serve as indexing variables for the implicit generation of intermediate subsurface and design parameters, which are then mapped to target design parameters and corresponding three-dimensional pile geometries. Accordingly, the main contributions of this work are threefold: establishing a coordinate-driven implicit parameter generation mechanism for reducing repeated manual input, developing a machine learning-based framework for pile length and diameter prediction, and constructing a real-time web-based three-dimensional mapping approach for interactive pile foundation visualization. The proposed method is validated through a practical engineering case in southern China and is positioned as an integrated proof-of-concept framework for intelligent pile foundation design rather than a universally generalizable predictor for all geological settings.

2. Research Content and Methods

This study primarily focused on the development of an intelligent information model for pile foundation design. The macroscopic research content and methodology involved the following steps: First, interactive input of design conditions was conducted. Subsequently, pile foundation algorithms and features were selected, the design process was determined, and an intelligent computational model for pile foundations was established, enabling the creation of a pile foundation data model with minimal input parameters. Finally, programming was employed to visualize the data model in a real-time three-dimensional visualization online, thereby producing intelligent informatized three-dimensional drawings of the pile foundation design results. The following sections elaborate on these steps.

2.1. Basic Principles

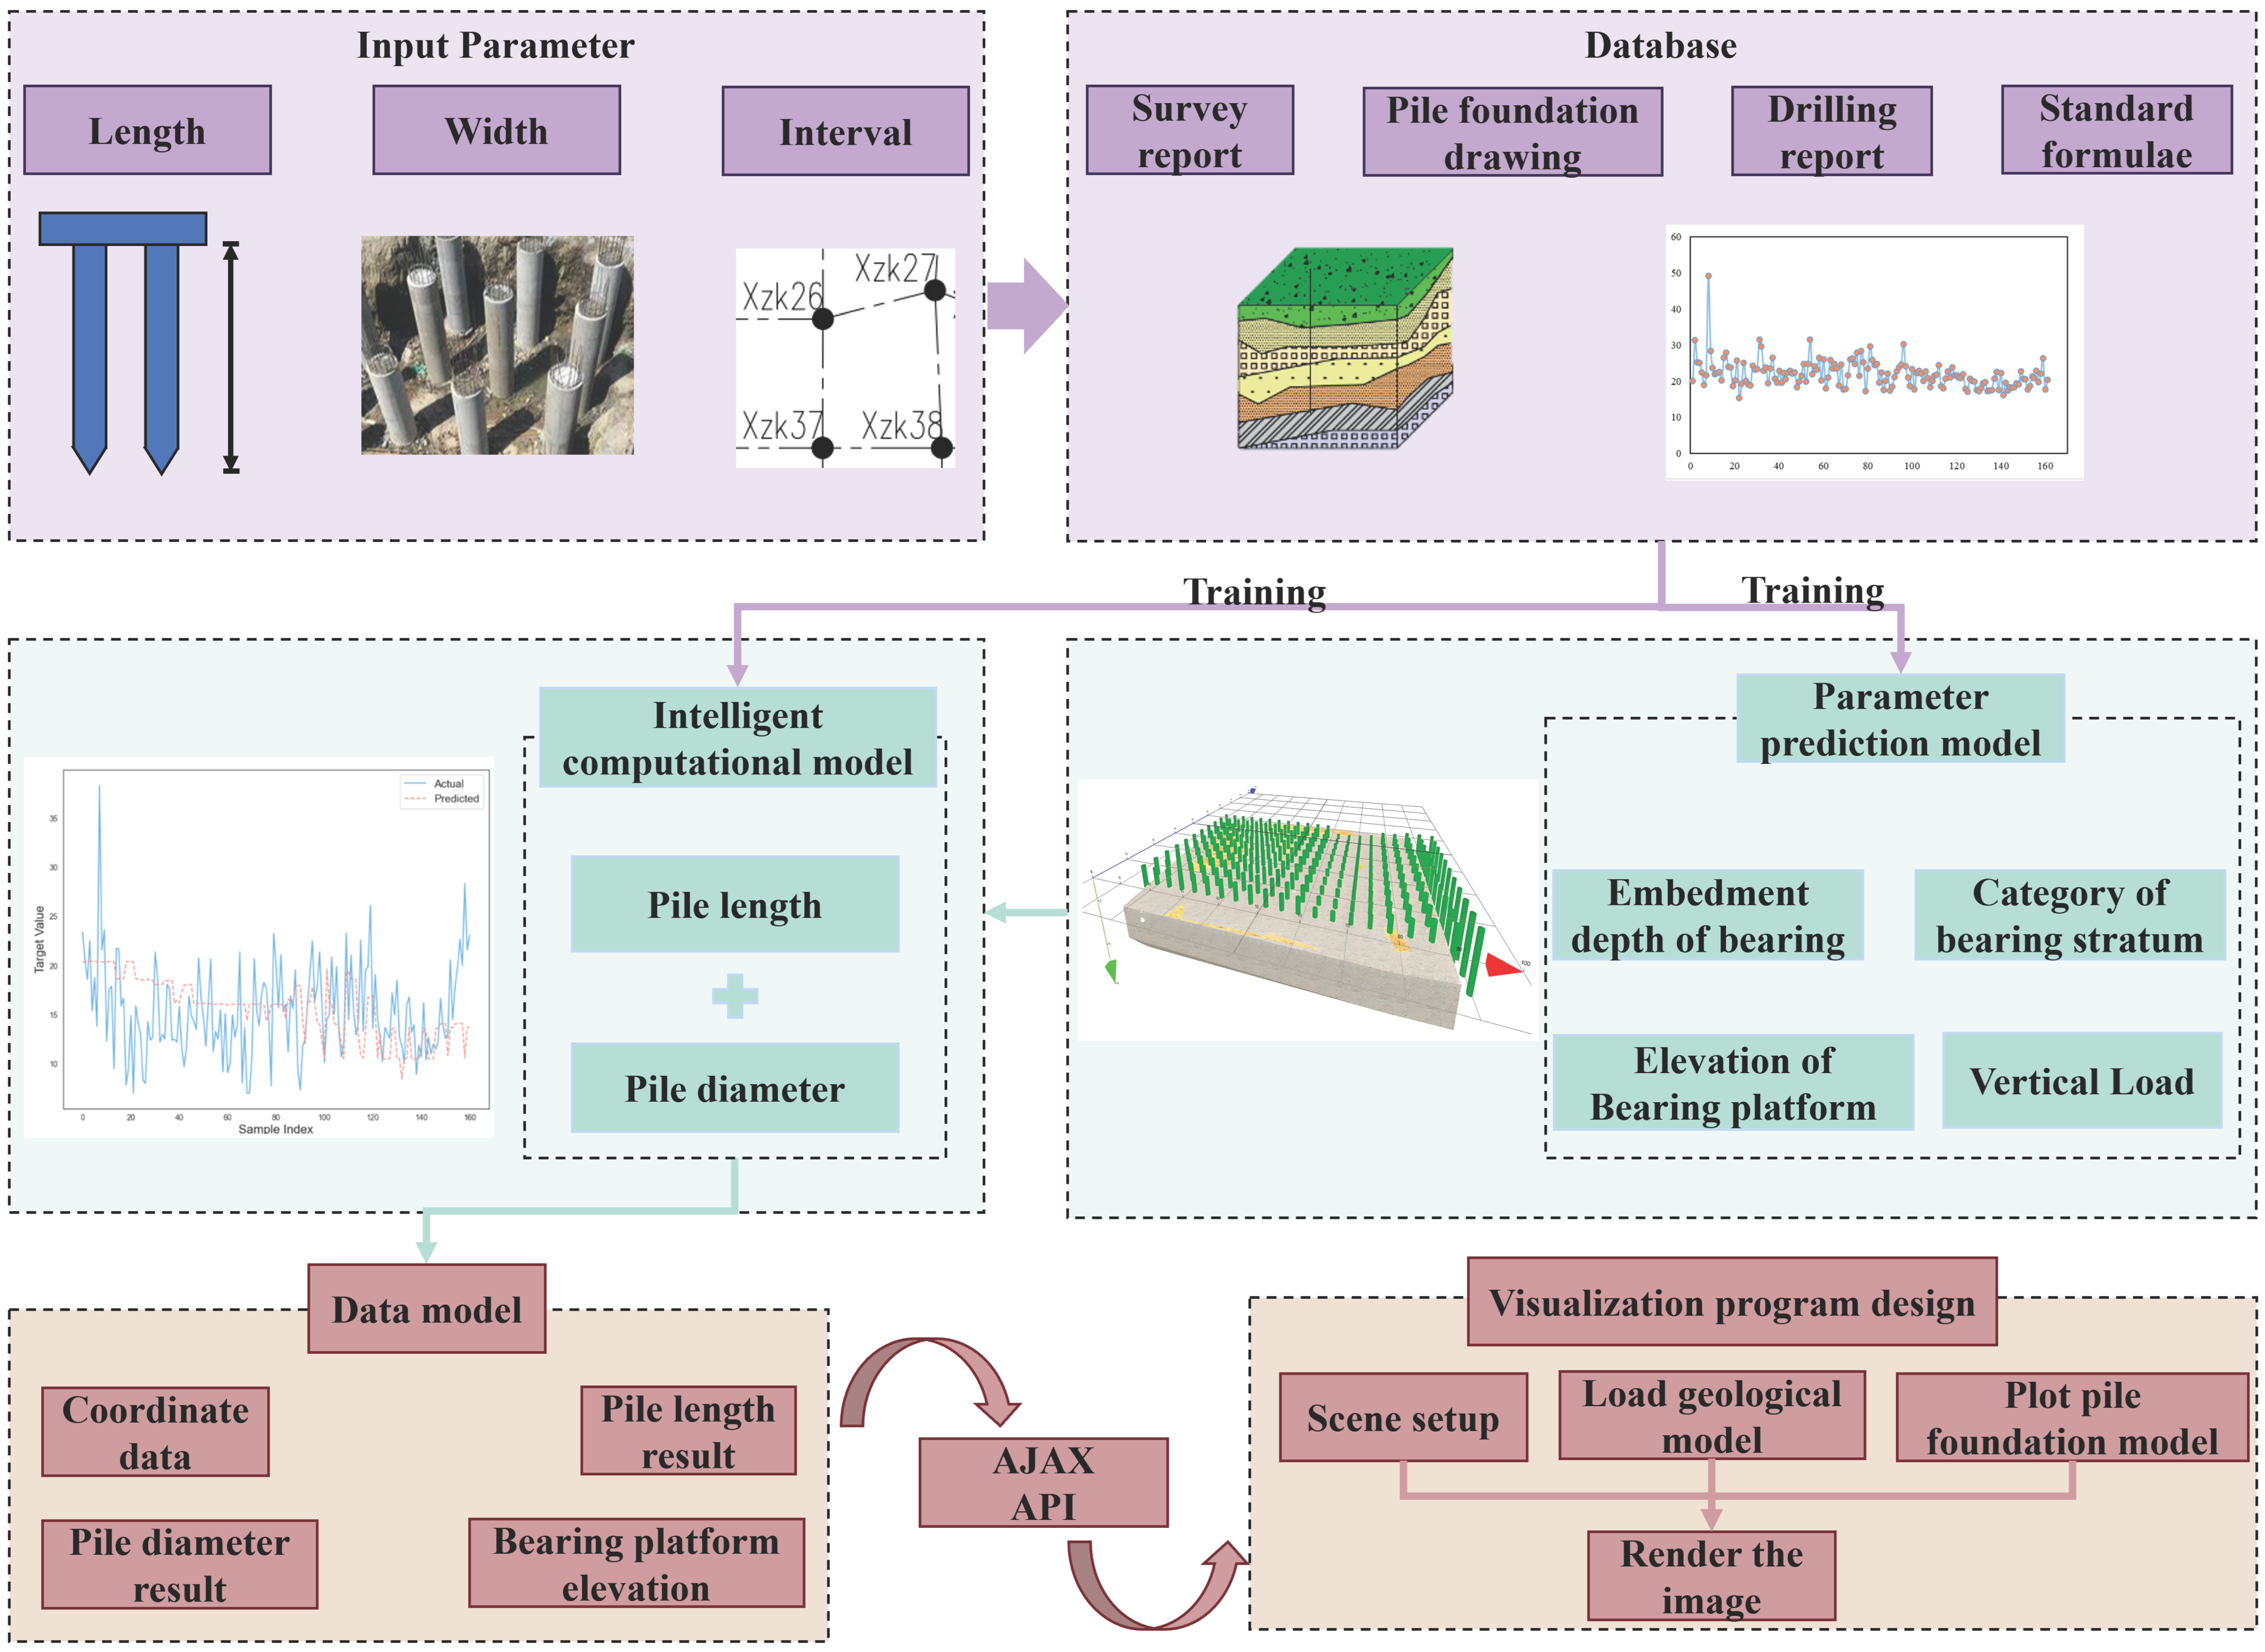
The objective of the intelligent information model for pile foundation design is to achieve intelligent integrated design and graphical representation, thereby reducing human–computer interaction costs and enhancing design efficiency. Specifically, the model utilizes implicit machine learning algorithms for design computations based on a small set of input parameters, resulting in pile foundation data outcomes and ultimately generating three-dimensional design drawings of pile groups. To accomplish these objectives, the design implementation approach can be subdivided into single-pile design and group-pile visualization. Group-pile visualization is based on single-pile designs and can be understood as the design of multiple piles at different coordinates. During the design phase, the core concept is to determine the parameters of the piles at specific coordinates using specific mathematical indicators such as coordinate data, pile length, pile diameter, and other relevant data. During the visualization phase, the core concept involves mapping the design data results onto a three-dimensional visual space through programming for display (Figure 1).

2.2. Intelligent Information Model for Pile Foundation Design

In the pursuit of intelligent informatization in pile foundation design, it is imperative to accomplish the design and visualization. Based on this premise, this study proposes an intelligent information model for pile foundation design. Initially, the selection of appropriate features and algorithms is of paramount importance. Subsequently, the process is delineated into three major stages to achieve intelligent integration in pile foundation design and visualization. These stages include inputting design conditions for pile foundations, computing the array of pile coordinates, computing an intelligent model for pile foundations to obtain intelligent calculation data, and generating three-dimensional pile foundation drawings by visualizing the data model online in real time.

2.2.1. Correlation of Pile Foundation Design Data and Algorithm Selection

The objective of the computational stage in this study was to establish an intelligent design framework capable of predicting key pile design parameters, namely, pile length and diameter, from geological and engineering information associated with pile locations. To achieve this goal, a pile foundation database was first constructed using engineering survey reports, pile foundation design drawings, borehole records, and related design documents from the selected case project. The database contained continuous and categorical variables, including spatial coordinates, thicknesses of different strata, bearing stratum category, depth to the top of the bearing stratum, vertical load, bearing platform elevation, pile length, and pile diameter. In this study, the pile length and diameter were extracted from finalized engineering design documents and used as supervised learning target variables. Table 1 lists the specific indicators and their statuses in the pile foundation database.
Before model development, low-variance filtering and engineering screening were performed to remove features with limited practical relevance or insufficient information content. Because the collected variables included non-normally distributed continuous parameters and encoded categorical parameters, and because the relationships between geological conditions and design results were not necessarily linear, Spearman’s rank correlation coefficient was adopted as a preliminary feature screening tool. Compared with Pearson’s correlation, Spearman’s correlation is more suitable for detecting monotonic relationships under limited distributional assumptions and is less sensitive to non-normality and outliers. It should be noted that in this study, a correlation analysis was conducted to assist feature relevance screening rather than to establish causal relationships.
The simplified expression of Spearman’s rank correlation coefficient is given as
ρ = 1 6 d i 2 n n 2 1
where ρ is Spearman’s correlation coefficient, d i is the rank difference for the i-th paired observation, and n is the number of samples.
Based on the compiled database, the candidate input variables included pile coordinates, thicknesses of the major strata, depth to the top of the bearing stratum, bearing stratum category, vertical load, and bearing platform elevation. The target variables consisted of pile length for regression and pile diameter class for classification. The correlation analysis and engineering interpretation were combined to determine feature subsets for subsequent modeling. For pile length prediction, variables closely related to subsurface support conditions and structural demand were retained, including bearing stratum category, depth to the top of the bearing stratum, vertical load, bearing platform elevation, and thicknesses of the strata. For pile diameter prediction, the final feature set was also restricted to geologically and mechanically interpretable variables, namely, bearing stratum category, depth to the top of the bearing stratum, vertical load, bearing platform elevation, and thicknesses of the strata. Although spatial coordinates were explored during preliminary feature combination tests, they were not retained as core explanatory variables for the final pile diameter model because their direct causal interpretability from an engineering mechanics perspective is limited.
To compare candidate learning strategies, several commonly used algorithms were tested. Linear regression estimates the linear relationship between input variables and the target response. Lasso and ridge regression introduce regularization to reduce overfitting and improve stability in the presence of multiple correlated features. Decision tree models recursively split the feature space according to impurity reduction rules and can capture nonlinear relationships. Random forest combines multiple decision trees through ensemble learning and typically offers stronger robustness and generalization than a single tree [30]. K-nearest neighbors predicts outcomes based on the local similarity of nearby samples. For classification tasks, logistic regression, naive Bayes, decision tree, random forest, and k-nearest neighbors were compared. Table 2 lists the different pile foundation experimental features for pile length testing and their respective categories.
The optimal test results for the six pile length models are listed in Table 3.
To identify the most suitable feature combinations, several experimental feature categories were constructed for pile length and diameter modeling. These candidate feature groups are summarized in Table 2 and Table 4. Based on these feature groups, multiple regression and classification models were trained and compared using cross-validation metrics. The purpose of this comparison was not to claim state-of-the-art algorithmic performance but to select a stable and practically deployable modeling strategy for integration into the intelligent design workflow.
The optimal experimental results for the five pile diameter models are listed in Table 5.
The comparison results showed that random forest achieved a favorable balance between prediction accuracy, nonlinear fitting capability, and robustness to heterogeneous engineering data. For this reason, random forest was adopted as the core algorithm for the final pile length and diameter models. Its use in this study should be understood as part of an integrated engineering design framework rather than as a standalone algorithmic benchmark study.

2.2.2. Input of Pile Foundation Design Conditions

Individual pile designs in multiple coordinates are required to generate a layout plan for a group of piles. Individually inputting the predicted factors for the pile length and diameter at each coordinate would be cumbersome. Therefore, it is necessary to explore a single value that encompasses these influencing factors. This overarching value allows for the design and calculation of intermediate parameters, followed by the calculation of target parameters such as pile length and diameter using the predicted intermediate parameters. As the parameters vary with different coordinates and each point corresponds to various parameters, these parameters can be associated with the coordinates. Thus, selecting the coordinates of the pile positions as overarching values is crucial. Consequently, a conditional input algorithm is required to receive the input for a few condition parameters, and, after the calculation, the coordinates of the pile positions are obtained. Here, “minimal input” does not imply a fully automated design process but rather a reduction in explicit manual input by using coordinate-based conditional input to implicitly generate multiple design parameters.
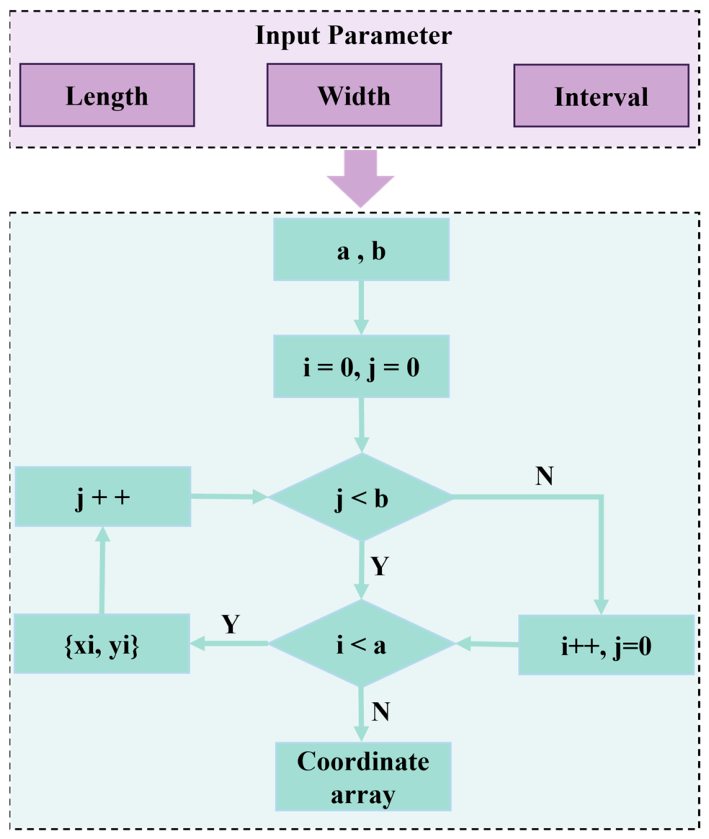
The pile foundation conditional input algorithm first requires the input data for length, width, and spacing to be obtained. Subsequently, the length and width were divided by the spacing to determine the number of points in the longitudinal (a) and transverse (b) directions. Through a nested loop calculation, coordinates were iteratively generated along the x- and y-axis directions, resulting in the acquisition of all necessary pile position coordinates within the entire distribution area. This formed a pile position coordinate array. A schematic of the algorithm is shown in Figure 2.
In the proposed framework, the term “coordinate-driven” does not mean that the pile coordinates directly determine the final design parameters in a purely geometric sense. Instead, the coordinates serve as indexing variables that activate the implicit generation of location-dependent geological and engineering attributes. For the i-th pile location, the coordinate input ( x i , y i ) is first used to estimate a set of intermediate parameters related to subsurface and design conditions:
( x i ,   y i ) g i
Here, g i = t 1 i , t 2 i , , t n i , d b i , c b i , q i , z i , where t 1 i , t 2 i , , t n i denote the predicted thicknesses of different strata at coordinate i, d b i denotes the predicted depth to the top of the bearing stratum, c b i denotes the predicted bearing stratum category, q i denotes the vertical load, and z i denotes the bearing platform elevation. These intermediate parameters are then used to predict the final pile design parameters:
g i ( L i , D i )
where L i and D i represent the predicted pile length and diameter, respectively. Finally, the predicted design parameters are mapped to three-dimensional pile geometry for visual representation:
x i ,   y i , z i , L i , D i 3 D   p i l e   g e o m e t r y
Therefore, the coordinate-driven logic in this study should be understood as a spatial indexing and implicit parameter generation mechanism that links pile positions, subsurface attributes, design parameters, and three-dimensional graphical representation within one integrated workflow.

2.2.3. Intelligent Model Calculation of Pile Foundation

After the pile coordinate array was obtained and the candidate input features were defined, an intelligent computation framework was established for pile foundation design. This framework included multiple intermediate parameter models and final target parameter models. Specifically, random forest regression was used for continuous variables such as stratum-related parameters, bearing layer depth, and pile length, whereas random forest classification was used for categorical variables such as bearing stratum category and pile diameter.
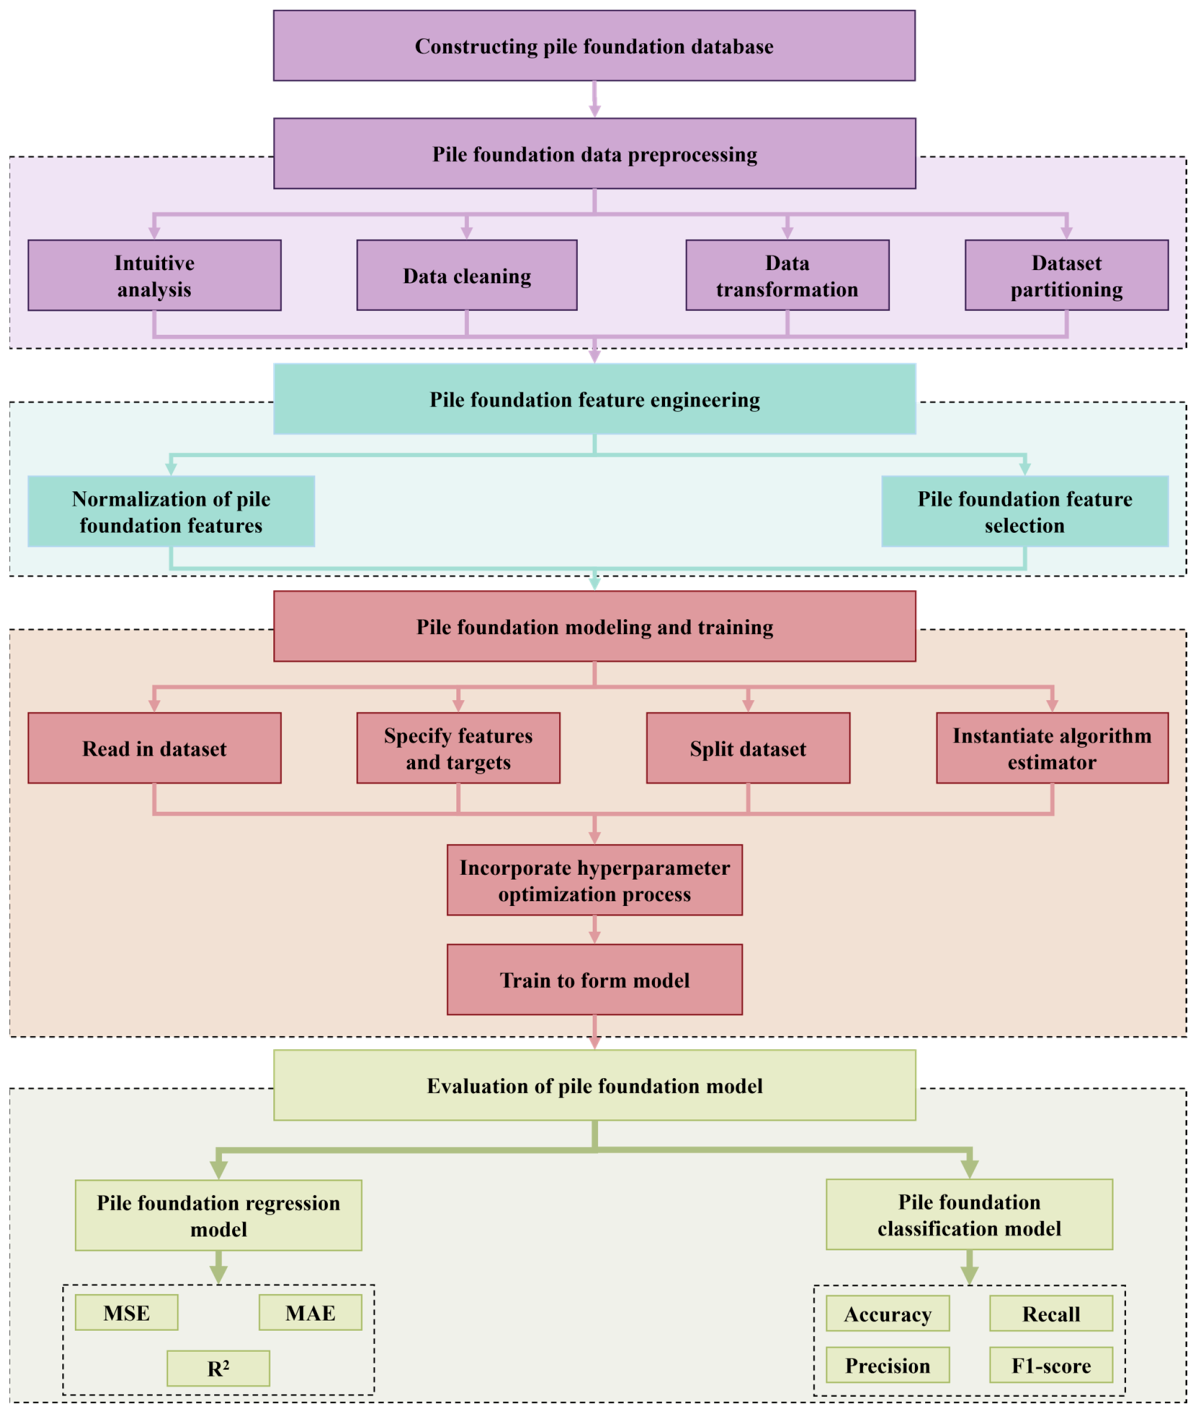
The model development procedure involved five steps: database construction, data preprocessing, feature engineering, model training with hyperparameter optimization, and model evaluation, as shown in Figure 3. A database was compiled from engineering survey reports, pile foundation design drawings, and borehole-related records. During preprocessing, missing values for stratum thickness variables were filled with zeros when a given stratum was absent at a specific location, thereby preserving the structural consistency of the feature matrix. Categorical variables were numerically encoded before model training. Feature scaling was applied during the preliminary comparison of candidate models to maintain numerical consistency across different algorithm types; however, the final random forest models are inherently less sensitive to feature scaling than gradient-based methods [31,32].
To reduce random dependence and improve reproducibility, a fixed random seed was used during model training. A three-fold cross-validation strategy was adopted during hyperparameter tuning and performance evaluation. In this study, the available dataset size was limited; therefore, cross-validation was used to obtain a more stable assessment of model performance under the current project conditions. Nevertheless, it should be emphasized that this validation strategy does not constitute external validation across independent engineering sites.
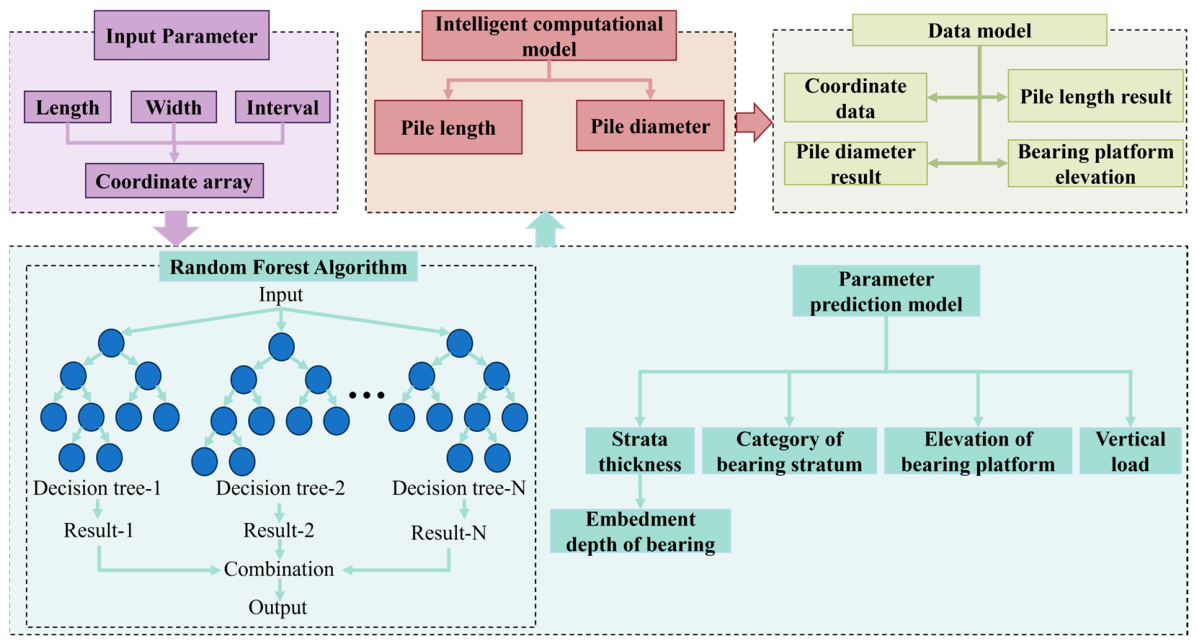
Hyperparameter optimization was conducted by combining random search and grid search. The candidate models were compared using different metrics according to the prediction task. For regression models, the mean squared error (MSE), mean absolute error (MAE), and coefficient of determination (R2) were used. For classification models, accuracy, precision, recall, and F1-score were employed. These metrics were used to identify models that were sufficiently stable and accurate for integration into the overall intelligent design workflow. This combined calculation process is illustrated in Figure 4.
Based on the trained intermediate models and final target models, the complete computation sequence of the proposed framework was organized as follows:
(1) Input the coordinate array of pile locations;
(2) Predict intermediate geological and engineering parameters at each coordinate, including stratum thickness, bearing layer depth, bearing stratum category, vertical load, and bearing platform elevation;
(3) Predict final pile design parameters, including pile length and pile diameter, using the generated intermediate parameter set;
(4) Organize the predicted results into a structured pile foundation data model containing coordinates, pile length, pile diameter, and platform elevation for subsequent three-dimensional mapping.
In this way, the proposed intelligent computation framework functions as a coordinated multi-model pipeline rather than as an isolated single prediction model. Its role is to support integrated pile foundation design under reduced manual input rather than to replace code-based engineering verification in final design practice.

2.2.4. Three-Dimensional Mapping and Drawing of Pile Foundation

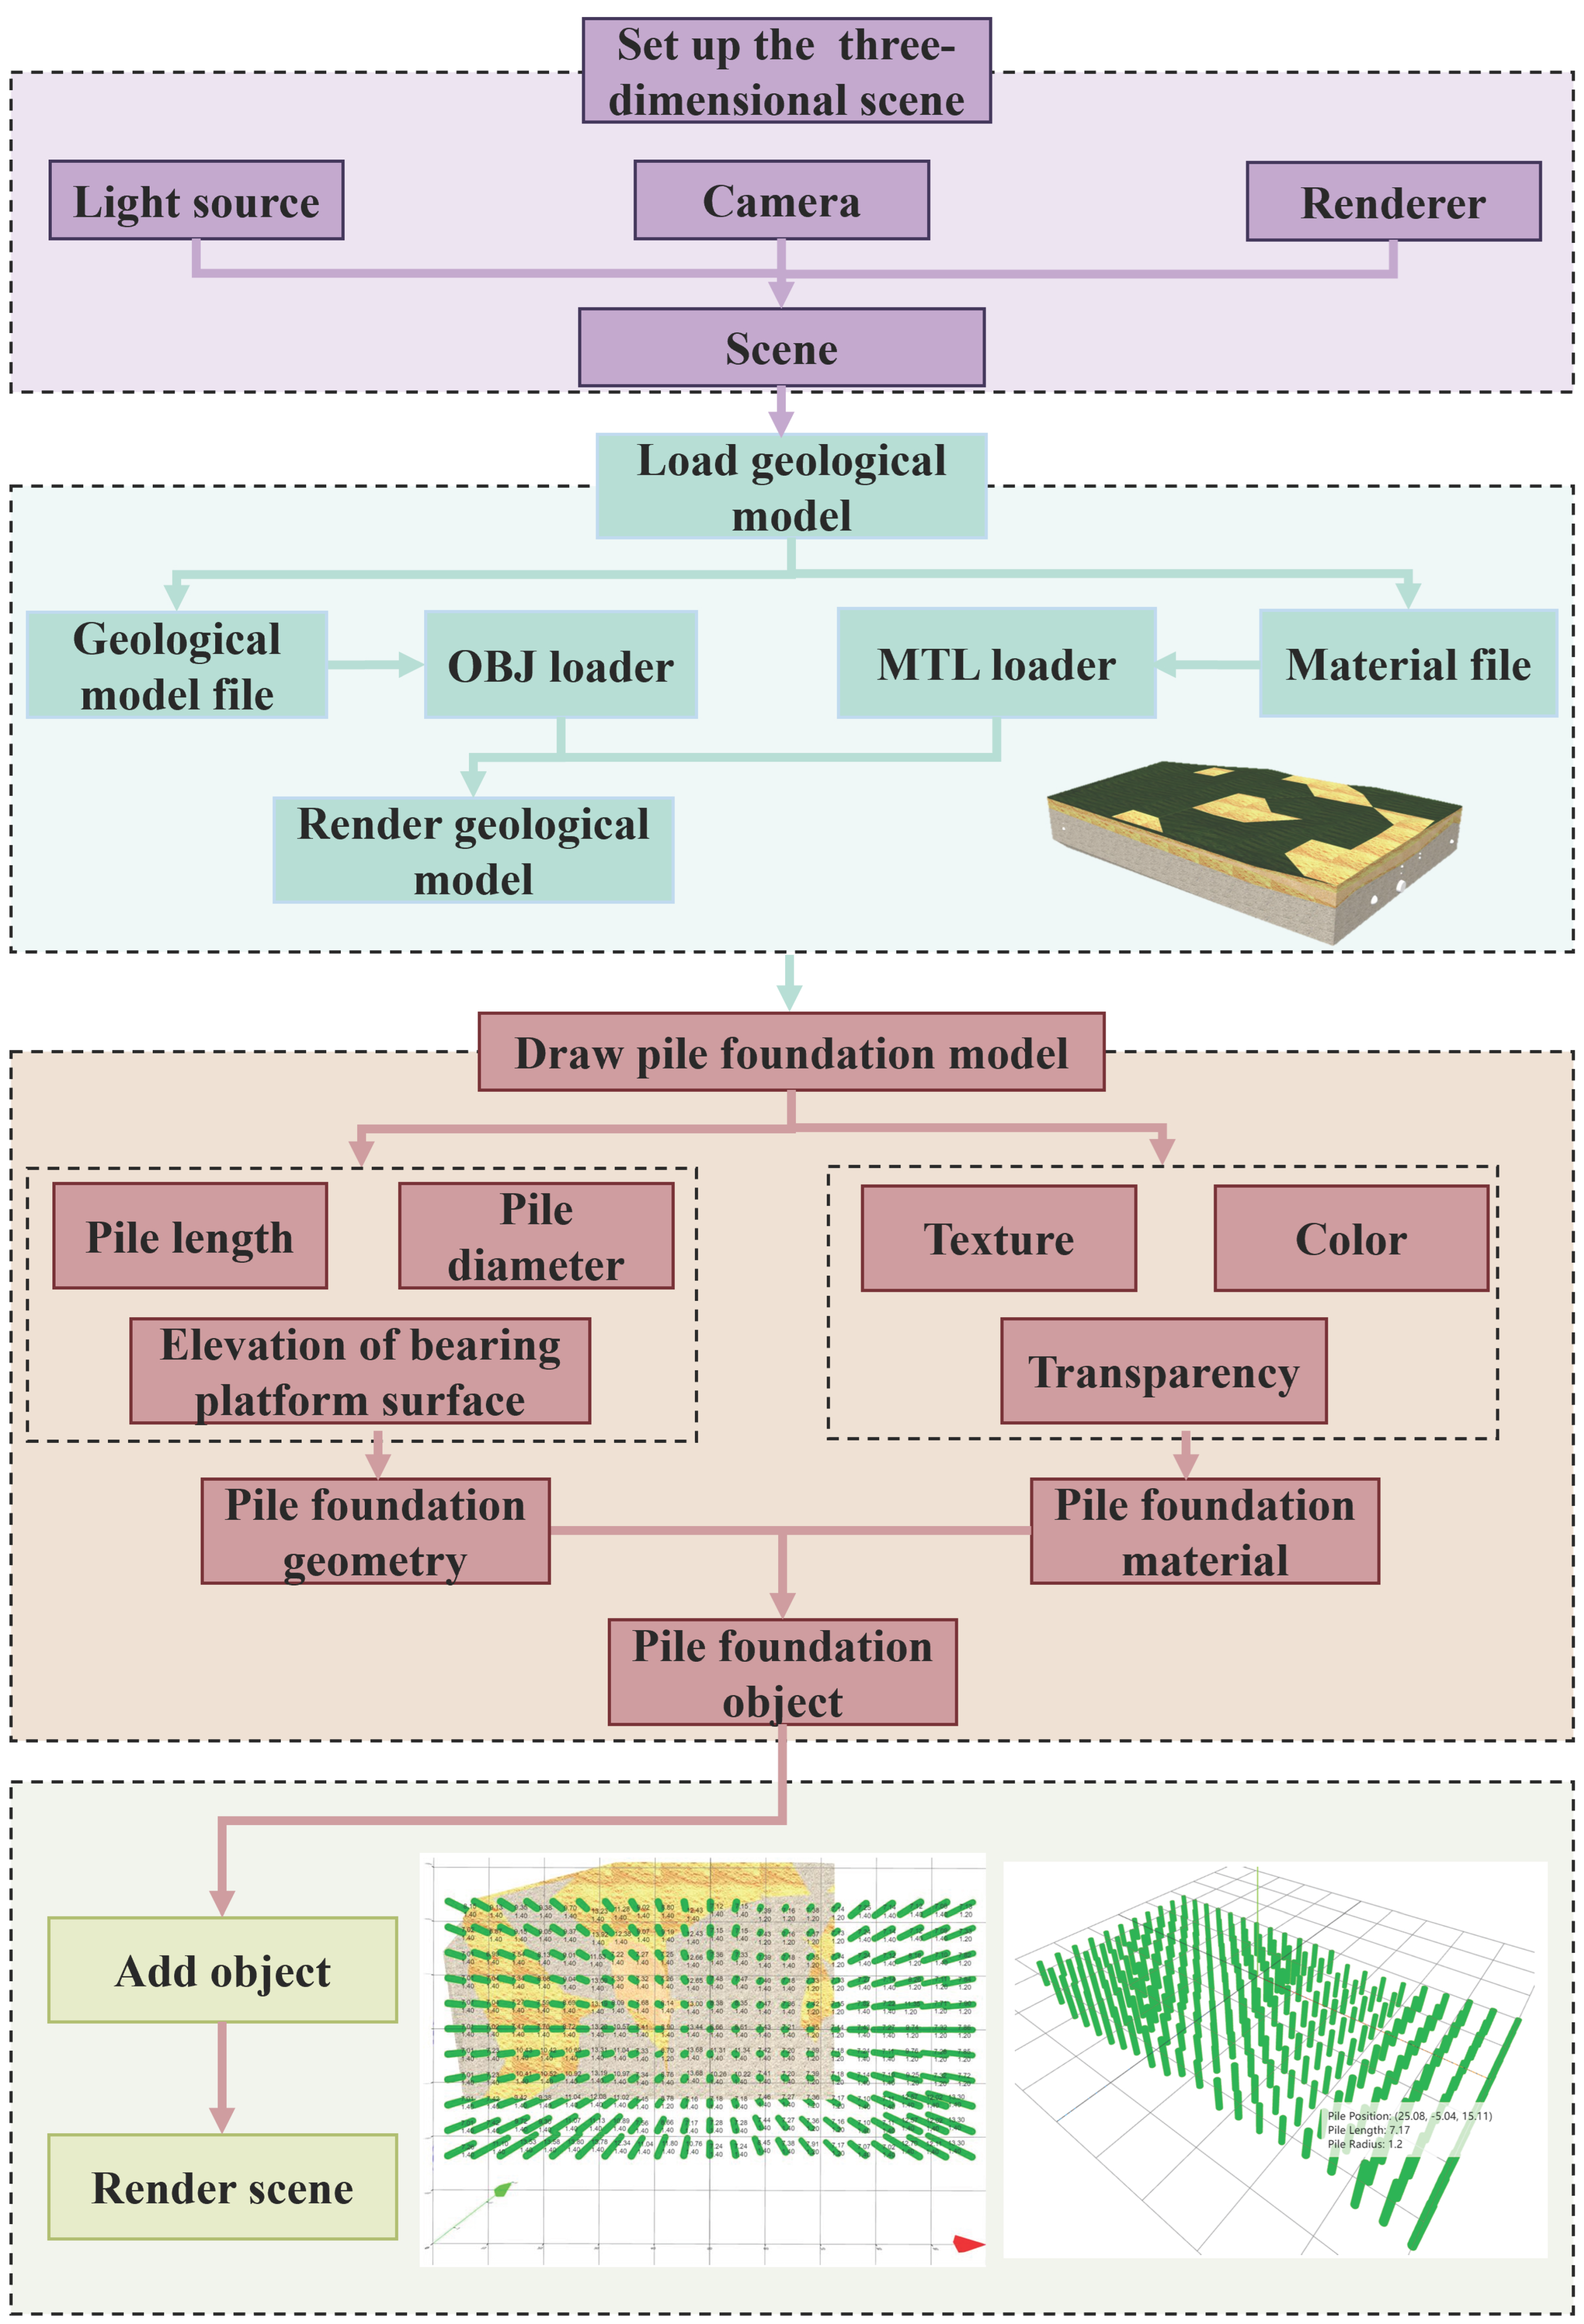
It is necessary to utilize the pile foundation data model as a basis for generating three-dimensional drawings of the pile foundation. In three-dimensional space, various data items in the data model are mapped. The x- and y-coordinates are directly mapped as coordinate information, while the platform elevation is mapped as the starting point for drawing the pile foundation in the z-axis direction. The pile foundation is represented as a cylinder in three-dimensional space, with its length indicating the height of the cylinder model and its diameter representing the diameter of the pile foundation model. Additionally, visualizing the three-dimensional pile foundation results in conjunction with a specific geological model is advisable.
The purpose of the visualization stage is to transform the pile foundation data model into an interpretable three-dimensional representation. In the proposed mapping logic, the x- and y-coordinates define the planar location of each pile, the bearing platform elevation defines the starting elevation in the vertical direction, the pile length is mapped to the height of the pile geometry, and the pile diameter is mapped to the geometric diameter of the cylindrical pile object. In this way, the predicted design parameters are directly converted into visualized pile entities in three-dimensional space.
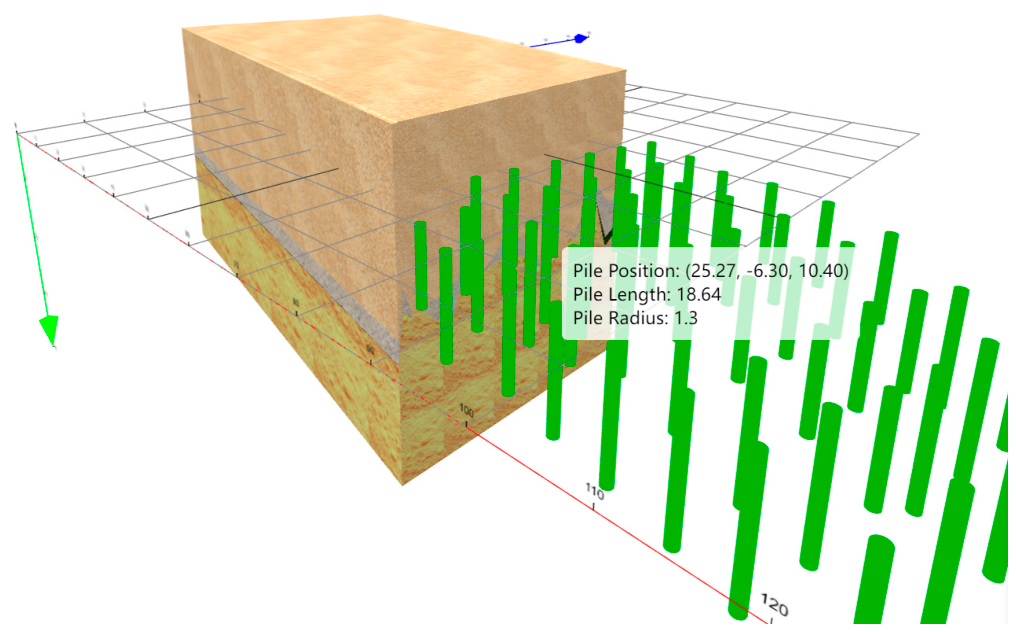
To enhance engineering interpretability, the pile geometry is displayed together with the geological model of the site. This combination makes it possible to visually inspect the spatial relationship between the pile layout, pile dimensions, and surrounding subsurface conditions. The mapping process is implemented in a web-based environment using Three.js, allowing interactive inspection of the pile group and associated design information. When the user hovers over a pile element, the system displays the corresponding design attributes, including coordinates, pile length, and pile diameter.
It should be emphasized that the focus of this visualization is not the implementation of general front-end programming operations but the establishment of a rule-based correspondence between intelligent design data and three-dimensional engineering geometry. Accordingly, the visualization module acts as the terminal expression layer of the proposed intelligent information framework. A schematic of the process is illustrated in Figure 5.

2.3. Implementation Steps

To realize integrated intelligent pile foundation design and visualization under reduced manual input, the implementation of the proposed framework can be divided into three major stages: data preparation and feature construction, coordinate-driven intelligent computation, and rule-based three-dimensional mapping.
In the first stage, engineering survey reports, borehole records, pile foundation drawings, and related design documents are collected and organized to establish the pile foundation database. Based on these materials, design-relevant input variables and target variables are defined, and feature screening and algorithm comparison are carried out to determine the final modeling strategy.
In the second stage, the user inputs the layout boundary and pile spacing conditions, from which the coordinate array of pile locations is automatically generated. These coordinates are then passed into the intelligent computation pipeline. Intermediate geological and engineering parameters are predicted first, followed by the final pile design parameters, including pile length and diameter. The output of this stage is a structured pile foundation data model containing the key attributes required for graphical representation.
In the third stage, the structured pile foundation data model is mapped into three-dimensional engineering geometry according to predefined geometric rules. Pile coordinates, elevations, lengths, and diameters are transformed into interactive spatial objects, and the generated pile group is integrated with the site geological model for visual display. Through this process, the framework connects condition input, design computation, and three-dimensional representation into a unified intelligent information workflow.
The implementation steps shown in Figure 6 illustrate this integrated process. The emphasis of the framework lies in workflow integration and data-model-to-geometry transformation, rather than in the technical details of generic front-end programming.


3. Results and Discussion

3.1. Case Overview

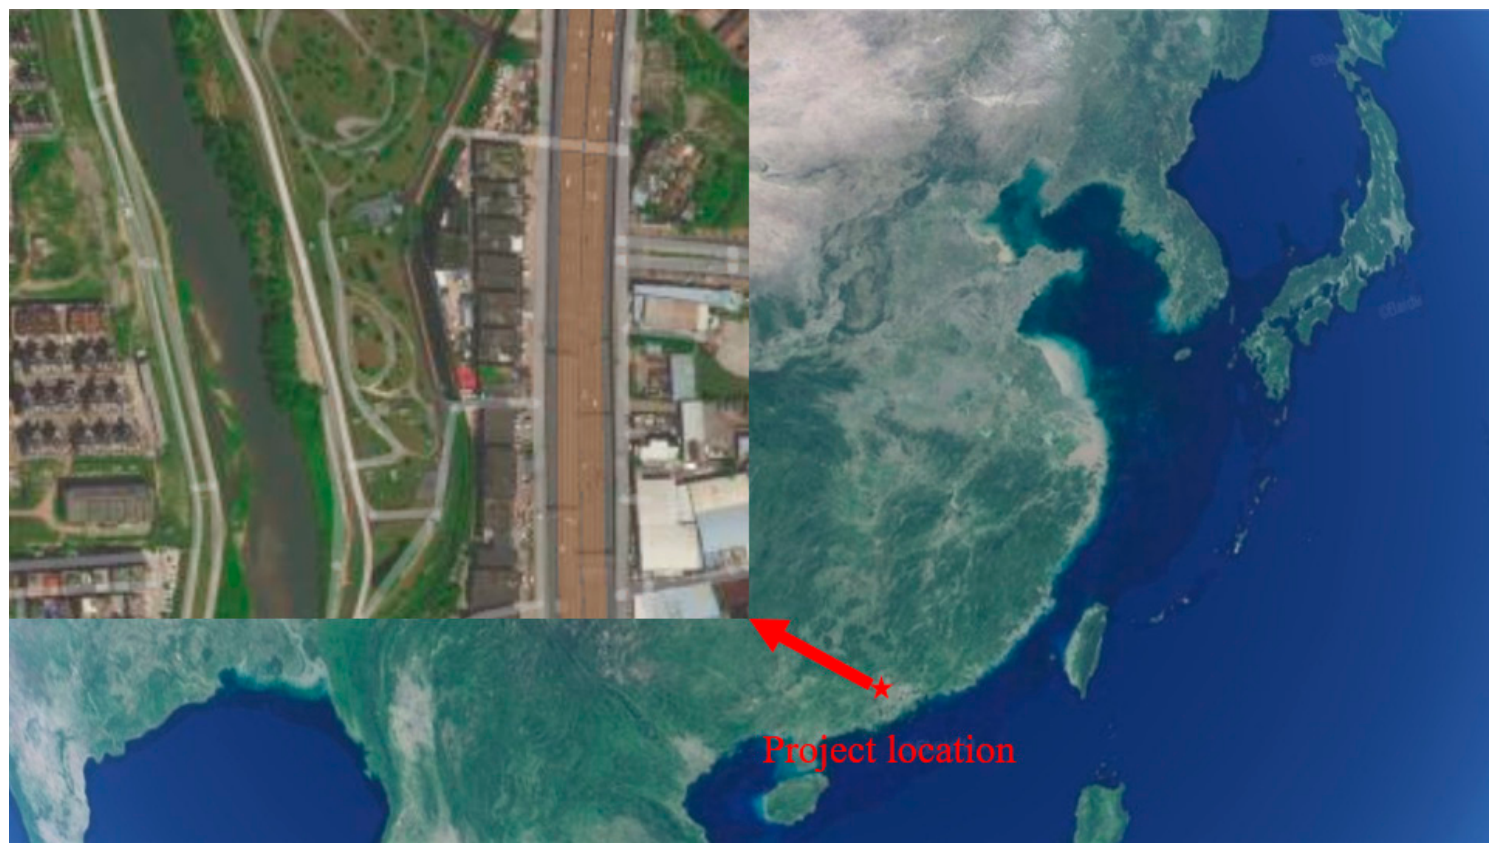
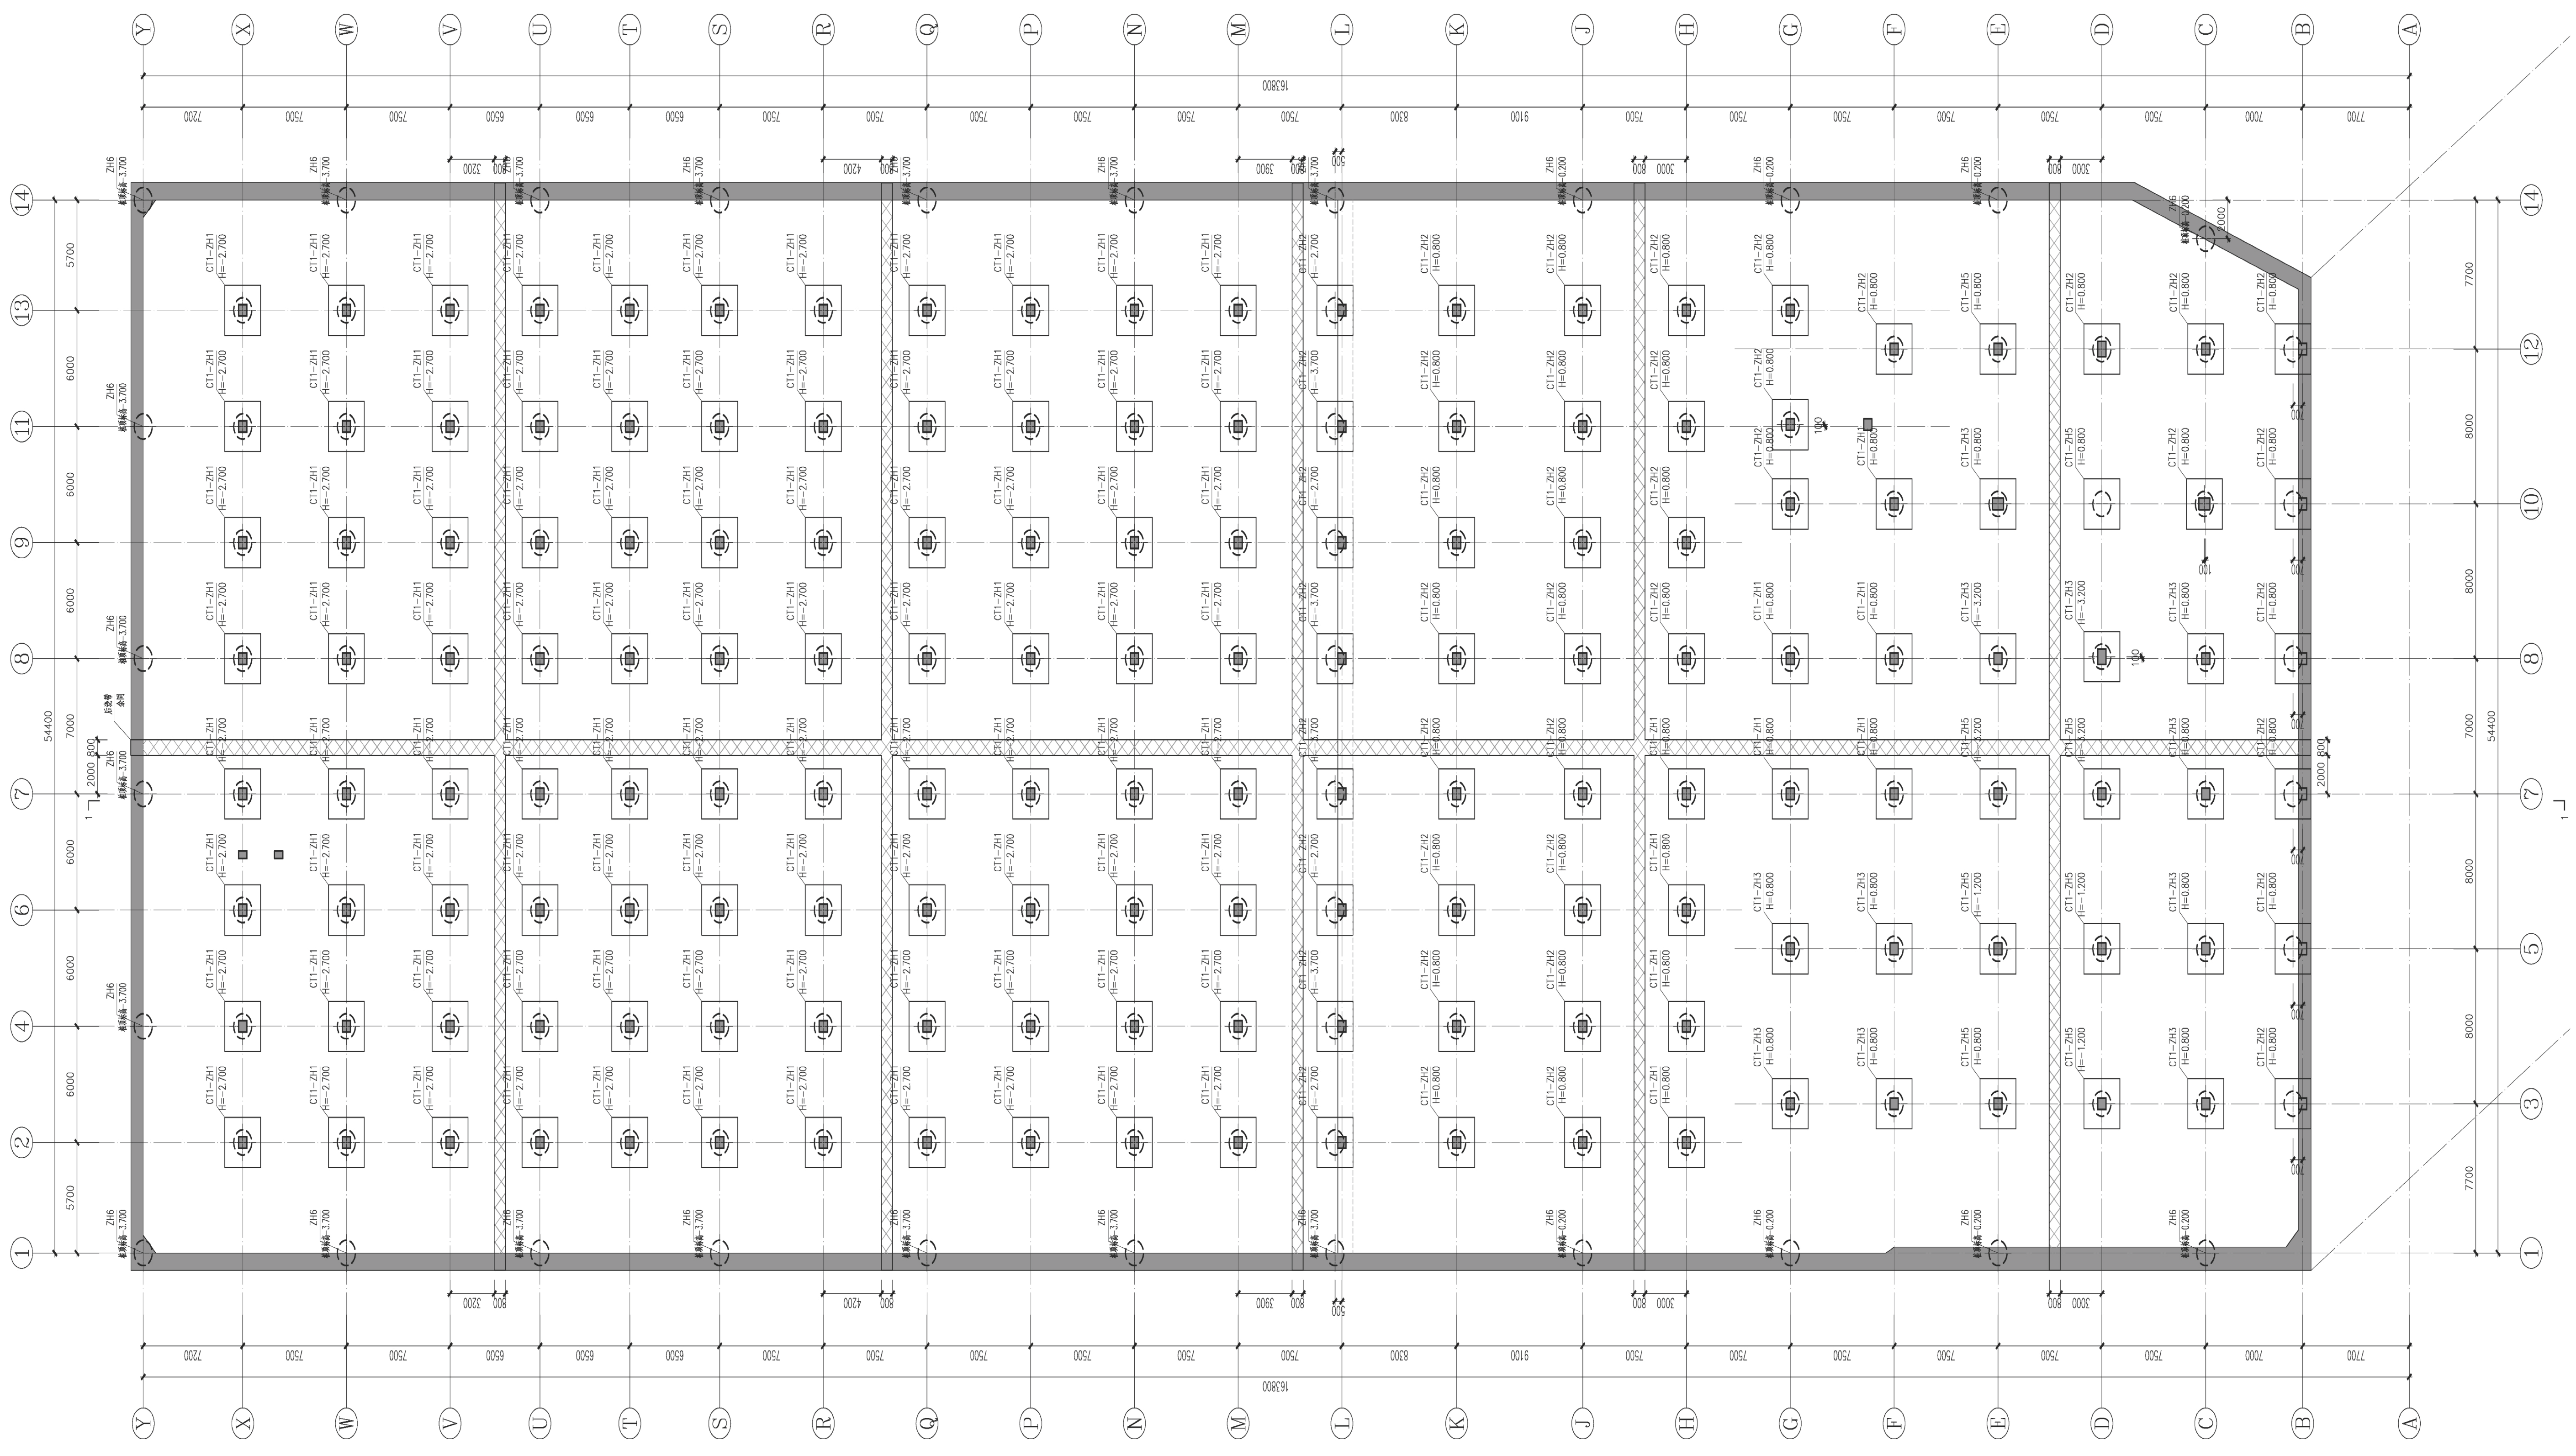
To validate the applicability of the proposed framework, it was applied to a water treatment plant project in southern China. According to the design scheme, the project includes a fully buried water treatment plant, a comprehensive building, and associated inlet and outlet pipe networks. The pile foundation system mainly involves bored cast-in-place piles with design diameters of 800 and 1300 mm. The characteristic values of the single-pile-bearing capacity in the project design range from 3500 to 9600 kN, while those of the vertical uplift resistance range from 3600 to 5300 kN.
The database used in this study was compiled from project-specific engineering survey reports, advanced drilling records, borehole-related geological information, and finalized pile foundation design documents. More than 160 pile-related locations were included in the dataset. These records provided the basis for extracting stratum thickness, depth to the bearing stratum, bearing stratum category, vertical design load, bearing platform elevation, pile length, and pile diameter. In the present study, the target design parameters were obtained from finalized engineering design results rather than from field pile load test data.
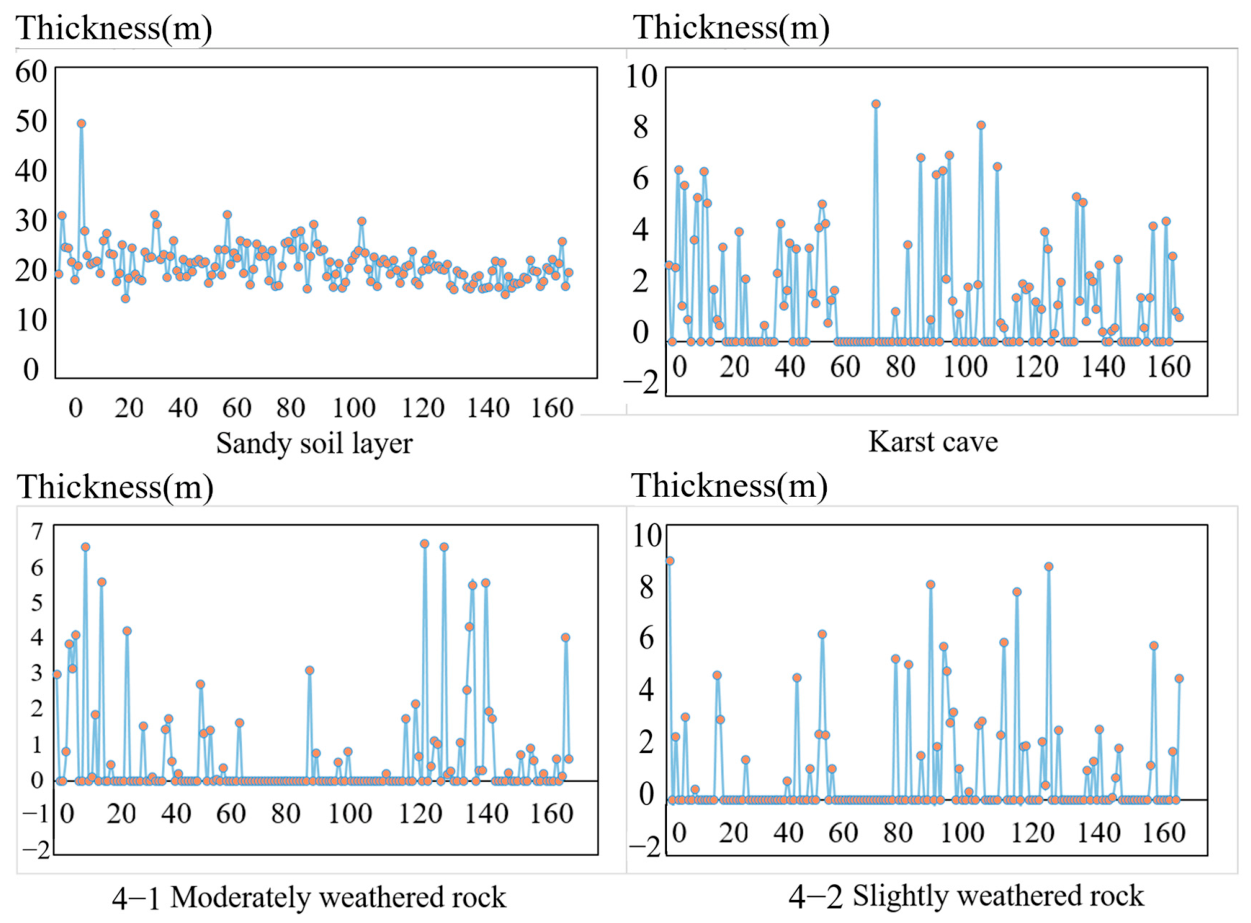
According to the geological survey, the foundation strata at the site are dominated by sandy soil layers overlying Carboniferous limestone bedrock. The limestone is mainly classified as moderately and slightly weathered limestone, and the site exhibits a moderate degree of karst development. The thickness of the sandy soil layers ranges from 15.4 to 49.17 m, with a natural density of approximately 20 kN/m3. The thickness of the moderately weathered limestone layer ranges from 0.05 to 17.90 m, with an average of 2.34 m and a natural density of about 25.5 kN/m3. The thickness of the slightly weathered limestone layer ranges from 0.1 to 10.4 m, with an average of 4.33 m and a natural density of about 26.5 kN/m3. Moderately or slightly weathered limestone was selected as the bearing layer for pile end support according to the engineering design requirements.
The case site is characterized by open and relatively flat terrain. Surface water mainly originates from rainfall runoff. During the survey period, the water depth in the river on the west side of the site ranged from 1.00 to 1.5 m, while that within the site ranged from 0.2 to 0.3 m. In this engineering and geological context, the project provides a representative case for testing the proposed integrated intelligent design and visualization framework in a karst-influenced foundation environment. The actual engineering layouts are shown in Figure 7 and Figure 8.

3.2. Results

3.2.1. Pile Foundation Data Processing

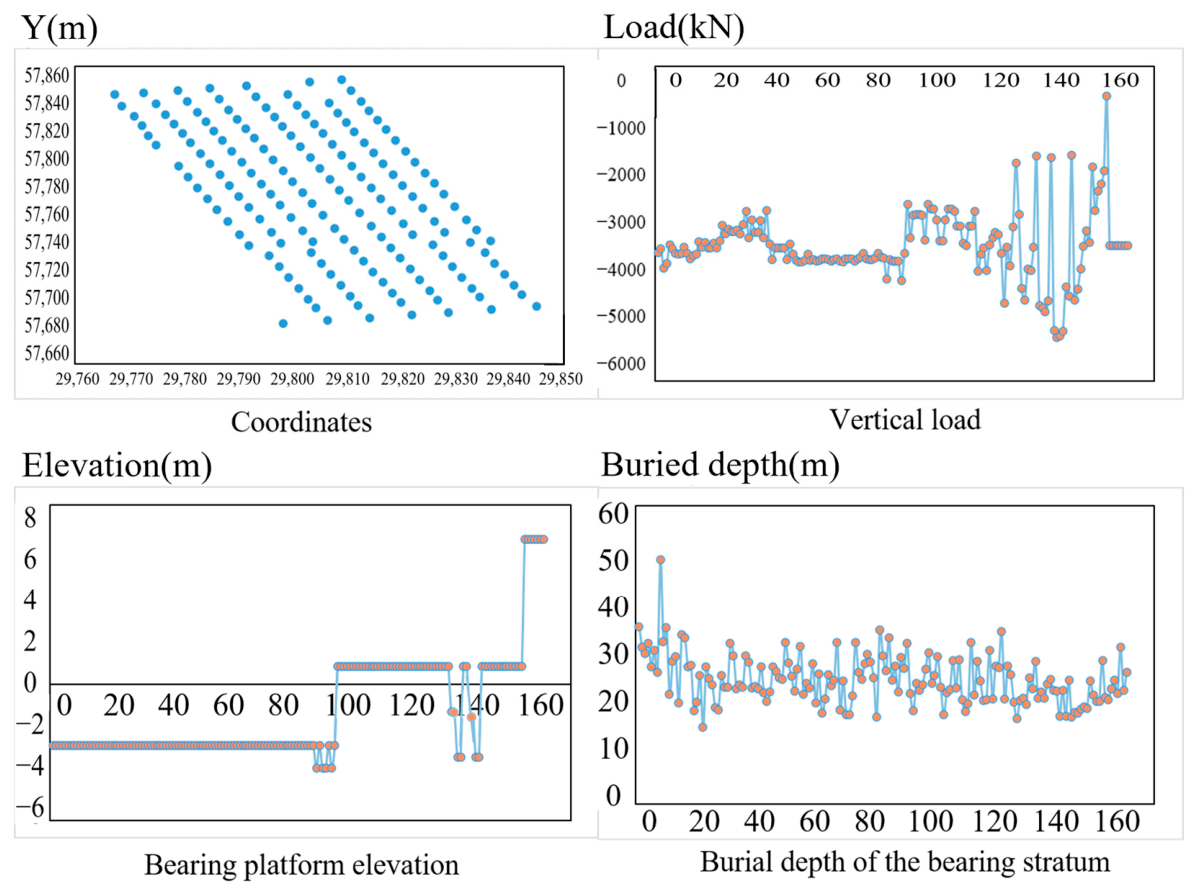
Pile foundation data constitute the basis of the proposed intelligent information framework and directly affect the upper performance bound of the prediction models. In this study, a dataset containing more than 160 pile-related samples was established based on engineering survey reports, pile foundation drawings, and advanced drilling records from the selected project. The input variables include continuous parameters such as stratum thicknesses, depth to the top of the bearing stratum, vertical load, and bearing platform elevation, as well as categorical parameters such as bearing stratum category. The supervised learning targets are pile length and diameter, both extracted from the finalized engineering design documents.
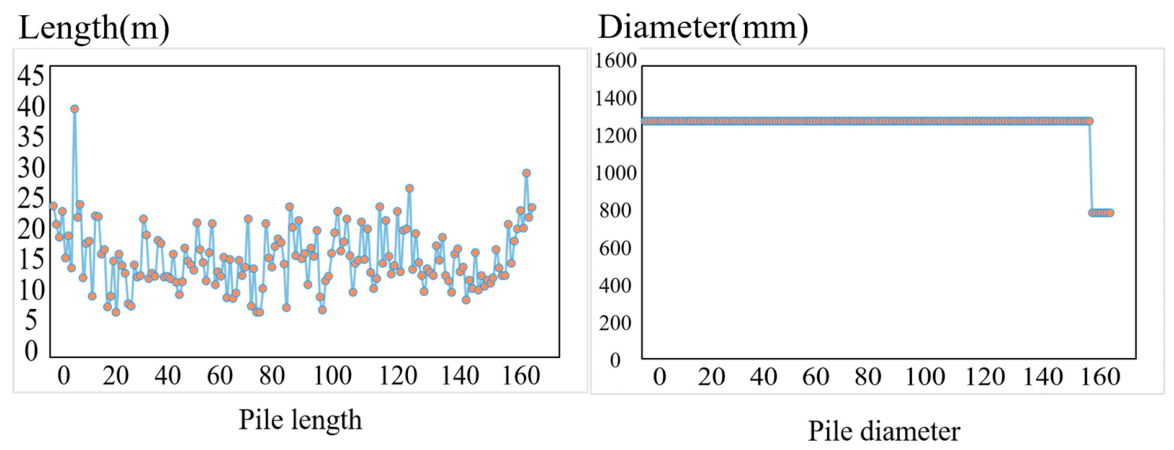
The pile length values in the dataset are distributed approximately within the range of 10 to 25 m, while the pile diameter values are concentrated in two practical engineering classes, namely, 800 and 1300 mm. This reflects the standardized nature of pile diameter selection in the project. The geological variables show substantial spatial variation, especially in stratum thickness and bearing layer depth, which is consistent with the heterogeneous subsurface conditions of the karst-influenced site.
Prior to model training, consistency checks were conducted between borehole records and corresponding design data. Missing values for the stratum thickness variables were filled with zeros when a stratum was absent at a given coordinate so that the feature matrix preserved a uniform structure without introducing artificial thickness values. Categorical variables were numerically encoded for model input. These preprocessing operations were intended to improve data usability while preserving engineering meaning.
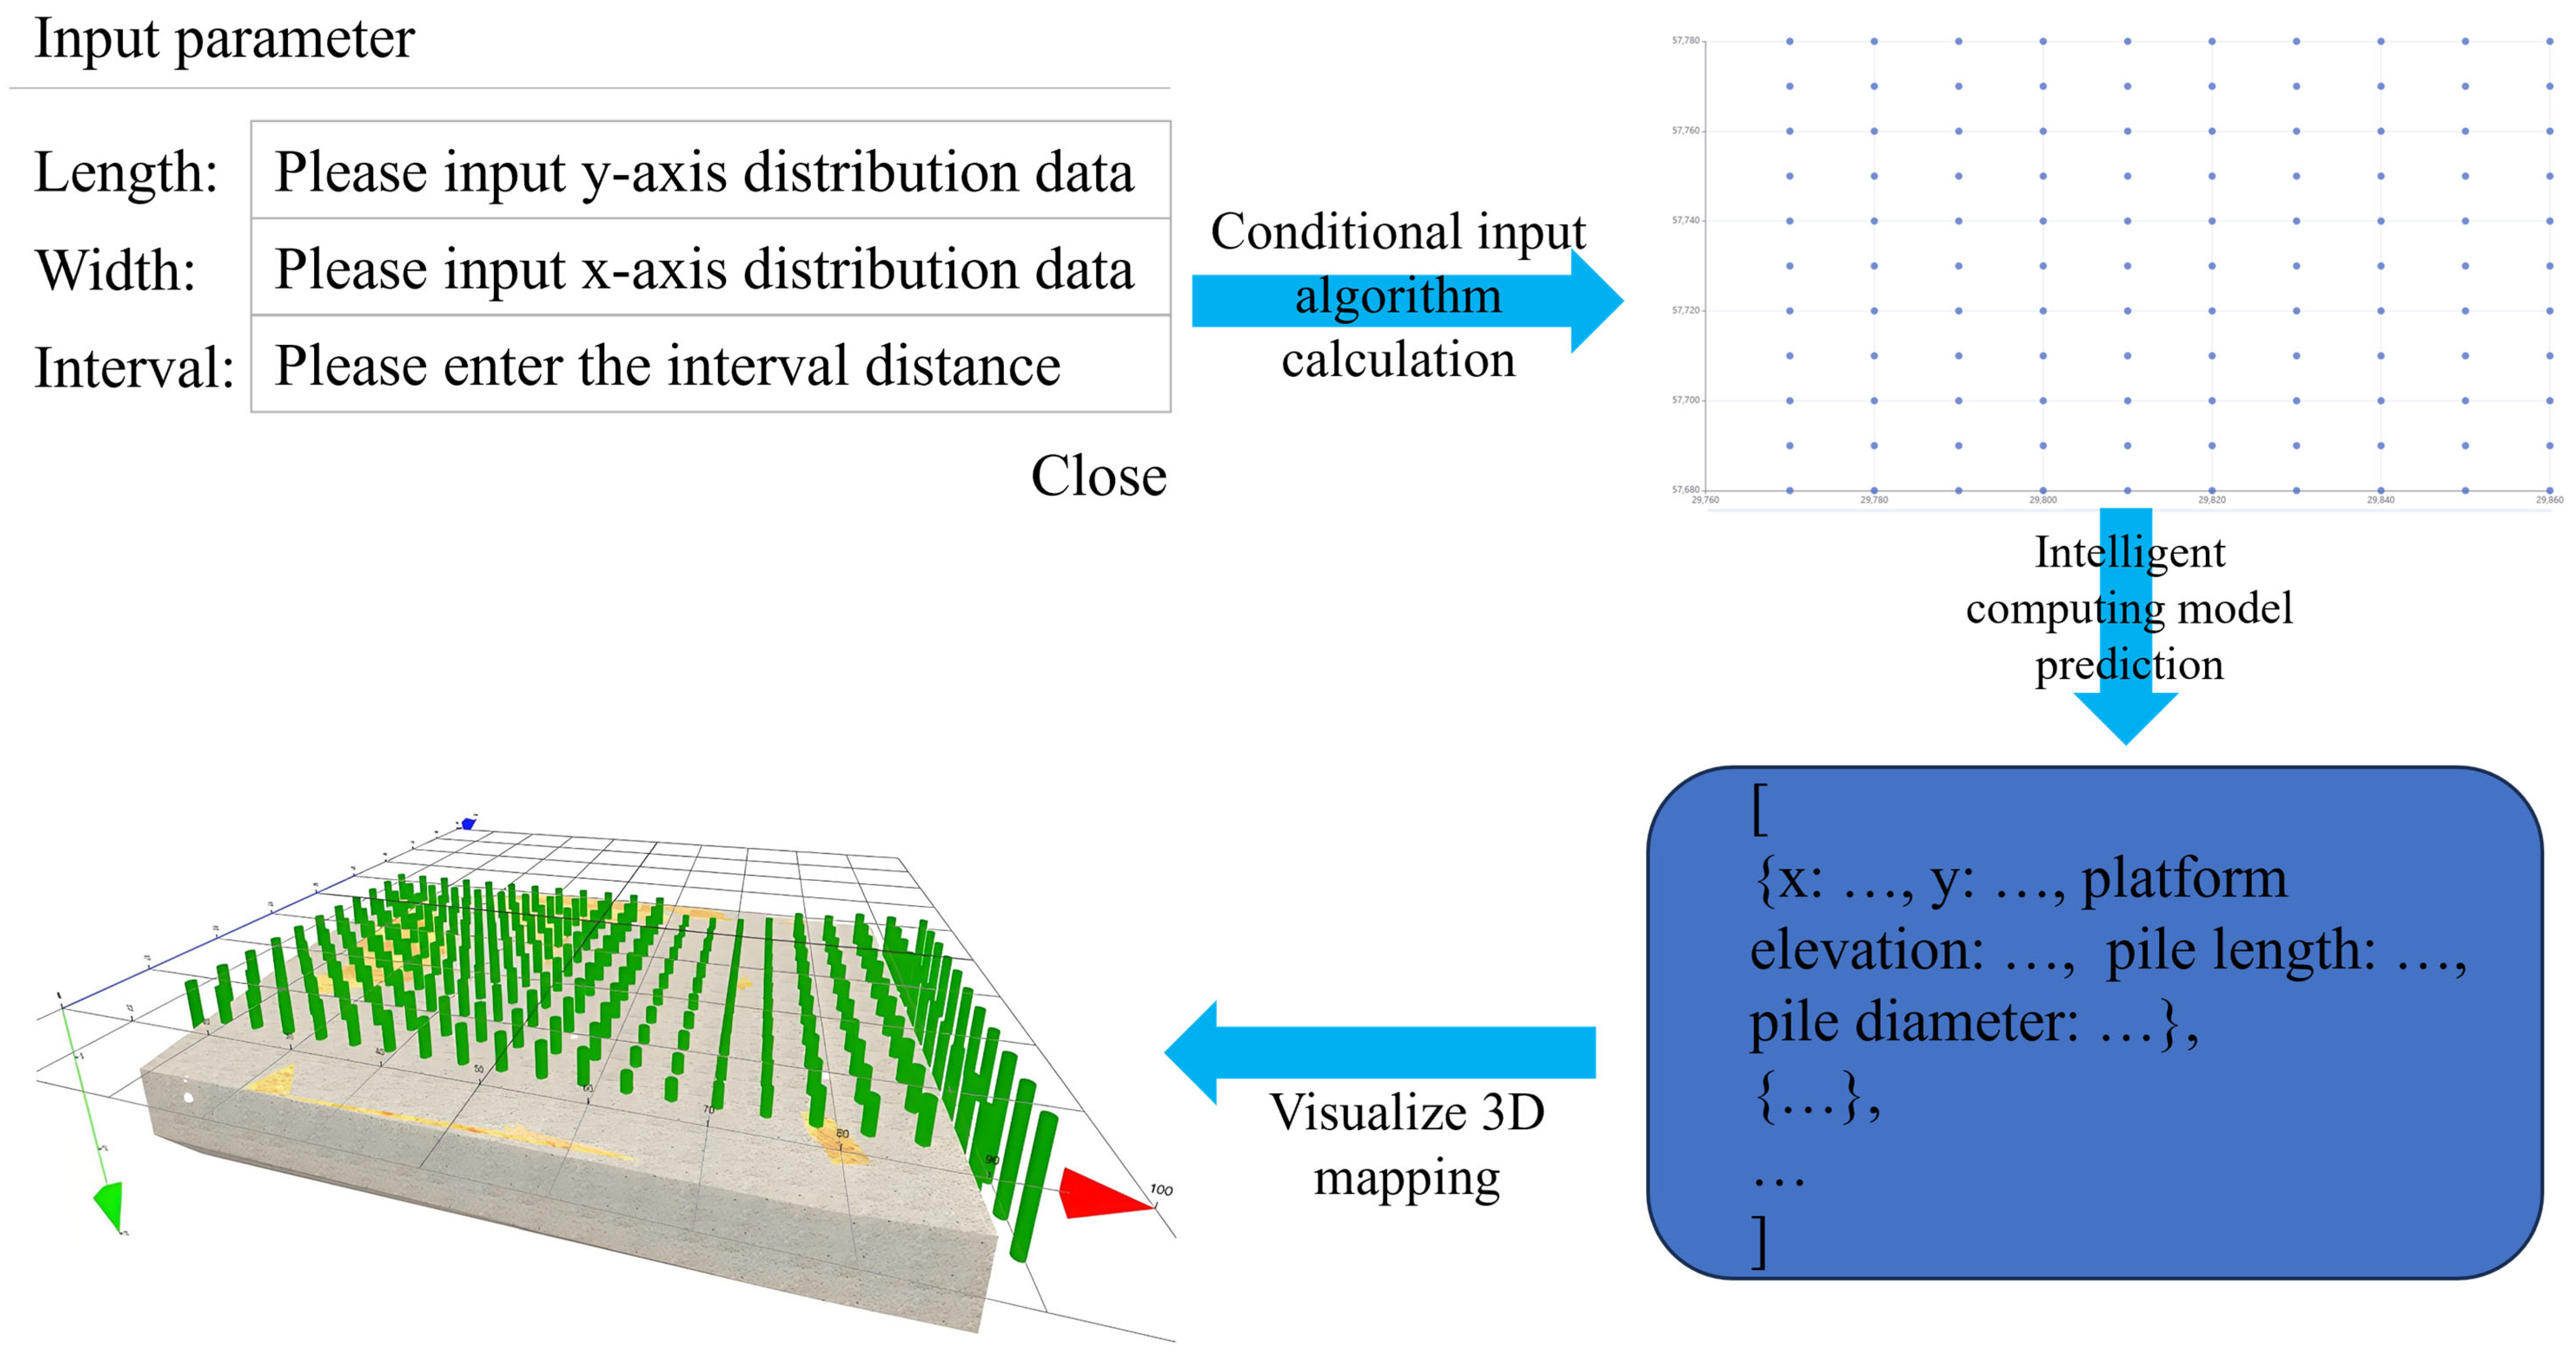
Figure 9, Figure 10 and Figure 11 present descriptive visualizations of the prepared dataset, including the stratigraphic thickness data, overall feature distributions, and pile length and diameter distributions. No obvious abnormal outliers requiring sample deletion were identified during the visual inspection. The processed dataset was then used for subsequent model training, optimization, and validation.

3.2.2. Intelligent Calculation Modeling of Pile Foundations

Based on the different requirements of various pile foundation models, different pile foundation features and target values were selected for standardization and numericalization. Five types of pile foundation parameter design calculation models were established using the random forest algorithm:
(1) Multiparameter coordinate regression prediction model (including various stratum thicknesses, vertical loads, and bearing platform elevations).
(2) Stratum thickness prediction model for predicting the burial depth of the bearing stratum.
(3) Coordinate classification model for predicting the bearing stratum category.
(4) Random forest regression model for pile length prediction.
(5) Random forest classification model for pile diameter prediction.
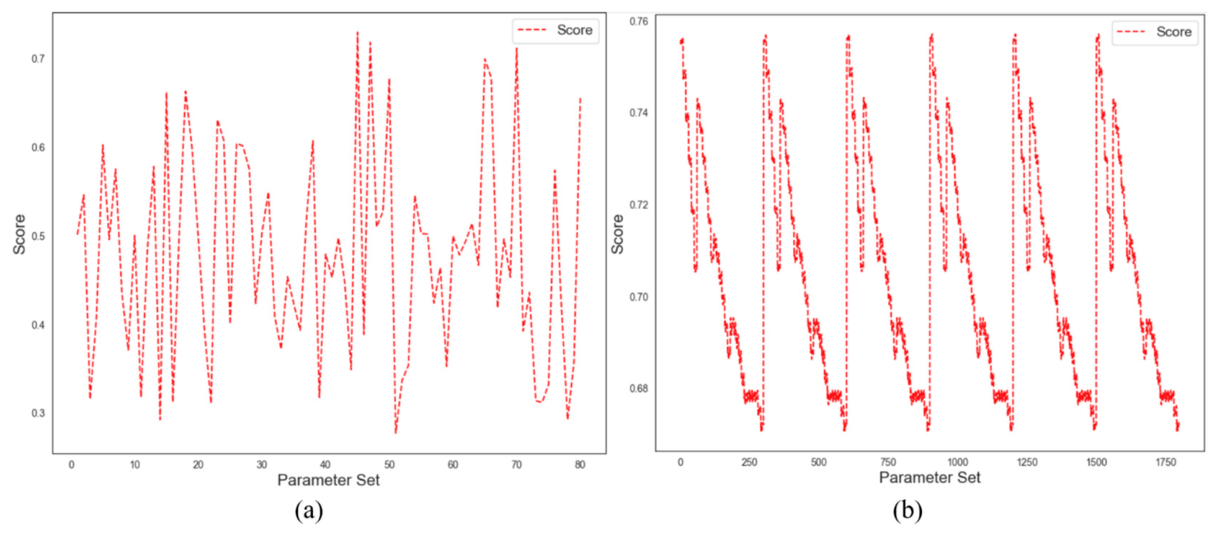
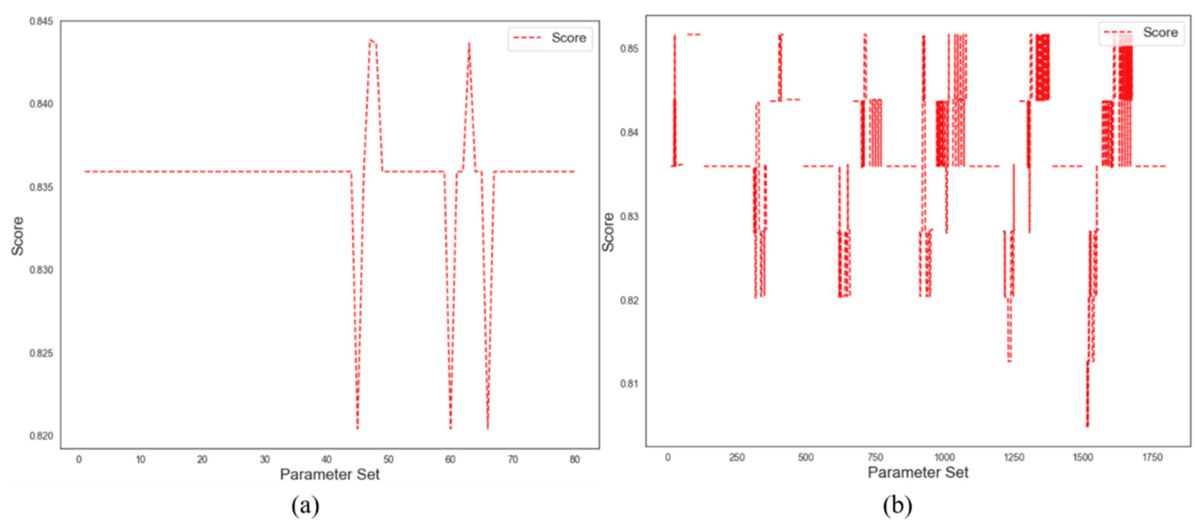
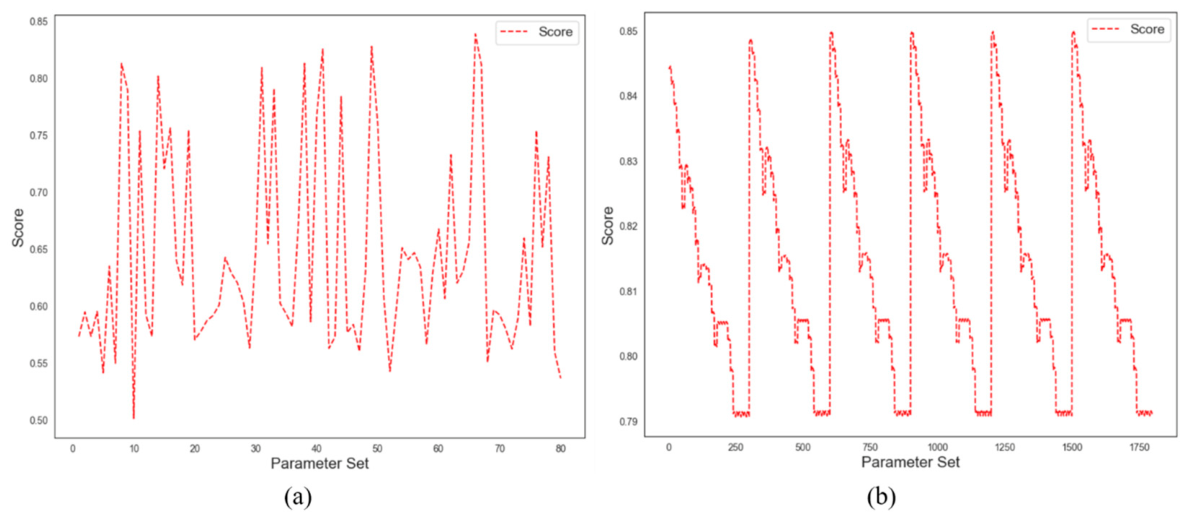
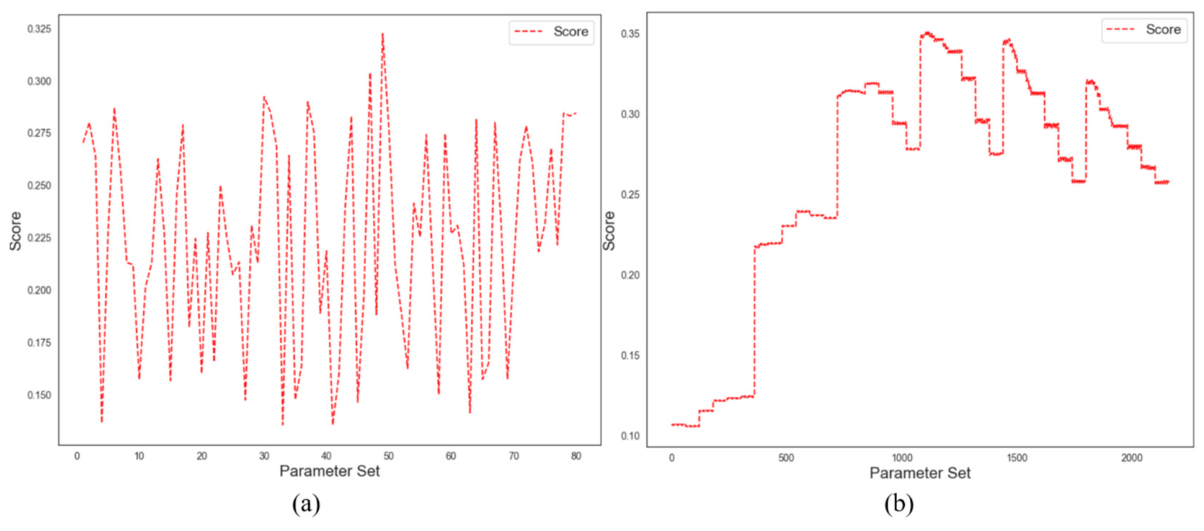
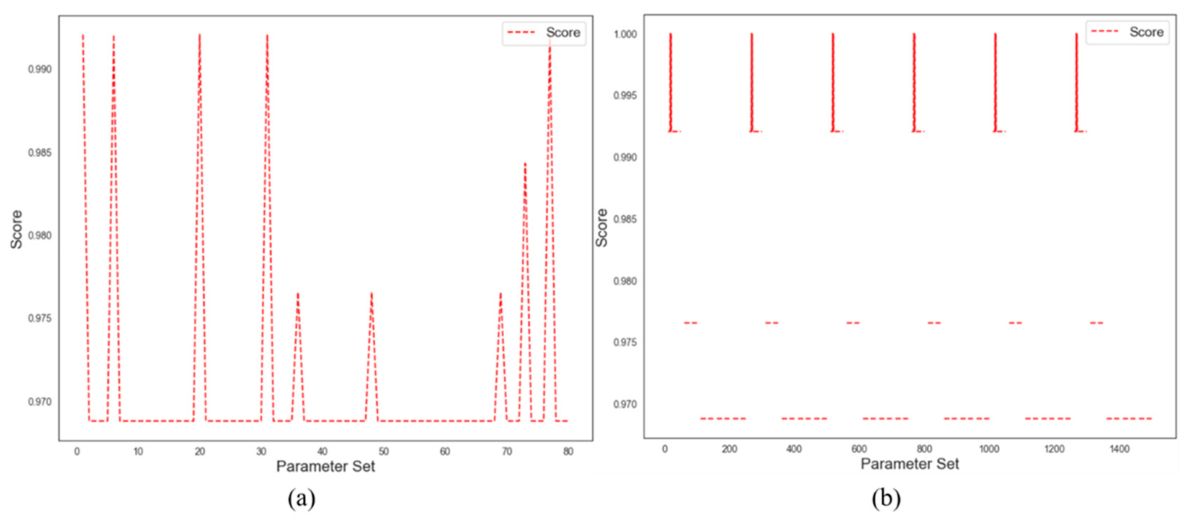
In each model training process, a random seed was set to facilitate the saving of computation results for later use. Additionally, random and grid search processes were added during the training of each model, and 3-fold cross-validation was set up. Through a cross-comparison, the model automatically selects the optimal parameters. The hyperparameter optimization process of each model can be visualized based on the average scores, as shown in Figure 12, Figure 13, Figure 14, Figure 15 and Figure 16. As shown in these figures, the random search for each model iterated 80 times, and the grid search iterated over 1400 times. Most models achieved scores greater than 0.6, indicating an overall good training performance.
The five-parameter design calculation models are interconnected in the order of intelligent computation, ensuring a smooth data transmission flow. This integration forms a unified pile foundation intelligent computing model, which, upon receiving the pile coordinate array, rapidly generates a pile foundation data model for subsequent three-dimensional rendering.
3.2.3. Intelligent Three-Dimensional Rendering of Pile Foundation Design

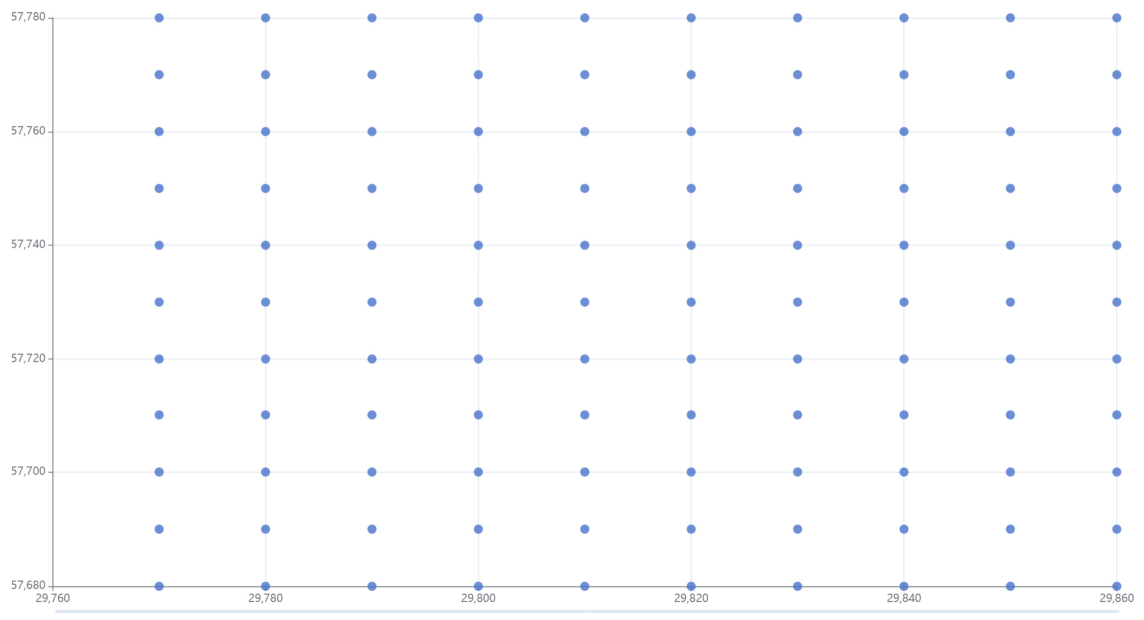
The three-dimensional visualizations presented in this study are intended to illustrate the functional integration between intelligent design computation and spatial mapping rather than represent finalized engineering drawings with detailed materials, lighting, or annotations. Taking an example with a length of 100 m, a width of 100 m, and an interval of 10 m, the visualization results are shown in Figure 17.
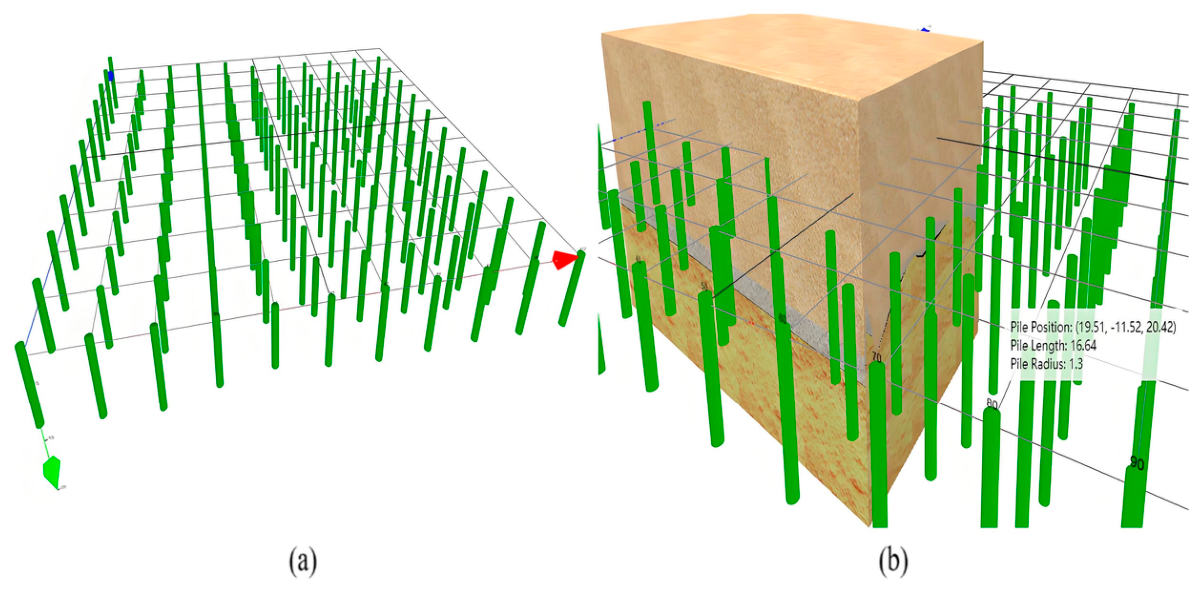
The coordinate results were transmitted to the back-end design module of the pile foundation using AJAXAPI. Design calculations were then performed using the previously mentioned models, resulting in a pile foundation data model. This data model was then imported into the developed and modified visualization module, directly generating three-dimensional group-pile design results, as shown in Figure 18a. Three coordinate axes were added to the figure. The combined results of the geological models are presented in Figure 18b. When the mouse hovered over each pile foundation, a prompt box displaying the coordinates and design information of the pile appeared. The figure also presents a partially closed cross-sectional view of the geological model, facilitating the display of the distribution of the pile foundations [33].

3.3. Discussion

3.3.1. Evaluation of Intelligent Calculation Models for Pile Foundations

Based on the integrated framework proposed in this study, the predictive performance of the intelligent computation models was evaluated separately for regression and classification tasks. Regression models were assessed using the MSE, MAE, and R2, whereas classification models were evaluated using accuracy, precision, recall, and F1-score. In addition to numerical metrics, prediction curves and confusion matrices were used to visually examine model performance.
To select an appropriate modeling strategy, random forest was compared with several commonly used baseline algorithms during the model development stage, as summarized in Table 3 and Table 5. The purpose of this comparison was to identify a model that is sufficiently stable, nonlinear-capable, and robust for integration into the proposed engineering workflow rather than to claim superiority over all possible algorithms. Based on the comparison results, random forest was adopted as the final algorithm for regression and classification tasks because it provided a favorable balance between prediction performance and robustness under heterogeneous engineering data conditions.
The optimal hyperparameters and evaluation metrics of the regression models are listed in Table 6. As shown, the bearing layer depth and pile length models both achieved high predictive performance, with R2 values of 0.931 and 0.896, respectively. These results indicate that the selected feature set can effectively capture the main design-relevant information controlling these two target variables under the current project conditions.
By contrast, the multi-parameter model achieved an R2 value of only 0.403, indicating only moderate predictive capability. This relatively low performance can be explained by several factors. First, the multi-parameter model attempts to simultaneously approximate several location-dependent variables with different controlling mechanisms, which is inherently more difficult than predicting a single well-defined target. Second, the geological heterogeneity of the site, especially under karst-influenced conditions, cannot be fully represented by a limited number of input features and samples. Third, the sample size of the current study is relatively limited for a multi-output spatial prediction task, which constrains the upper performance bound of the model. Therefore, the multi-parameter model should be understood as an intermediate approximation component within the integrated workflow rather than as a high-precision standalone predictor.
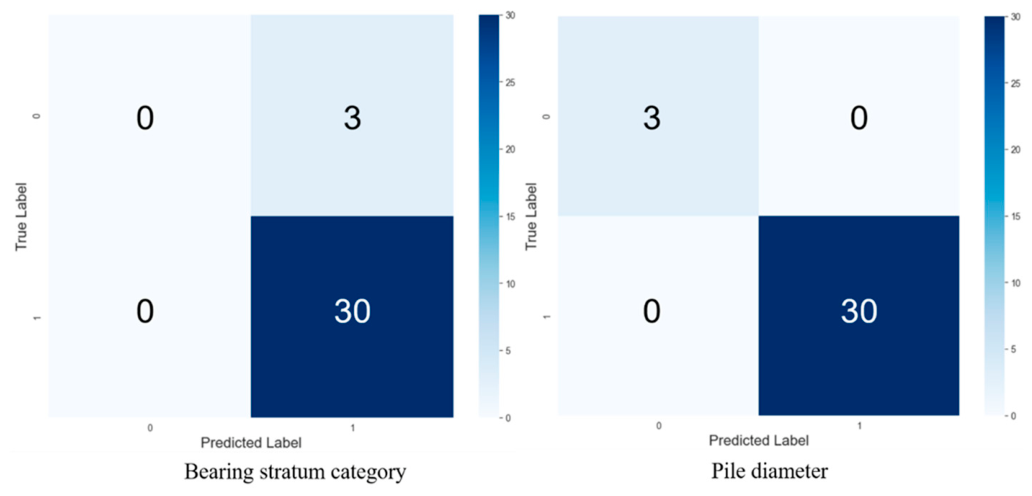
The classification results are listed in Table 7. The bearing stratum category model achieved strong performance, and the pile diameter model showed near-perfect classification results. This difference between the regression and classification tasks is consistent with the engineering characteristics of the target variables. Pile diameter is a discrete design variable strongly constrained by project design standards, whereas pile length is a continuous parameter influenced by more complex geological variability. Consequently, pile diameter is relatively easier to accurately classify than pile length is to precisely regress.
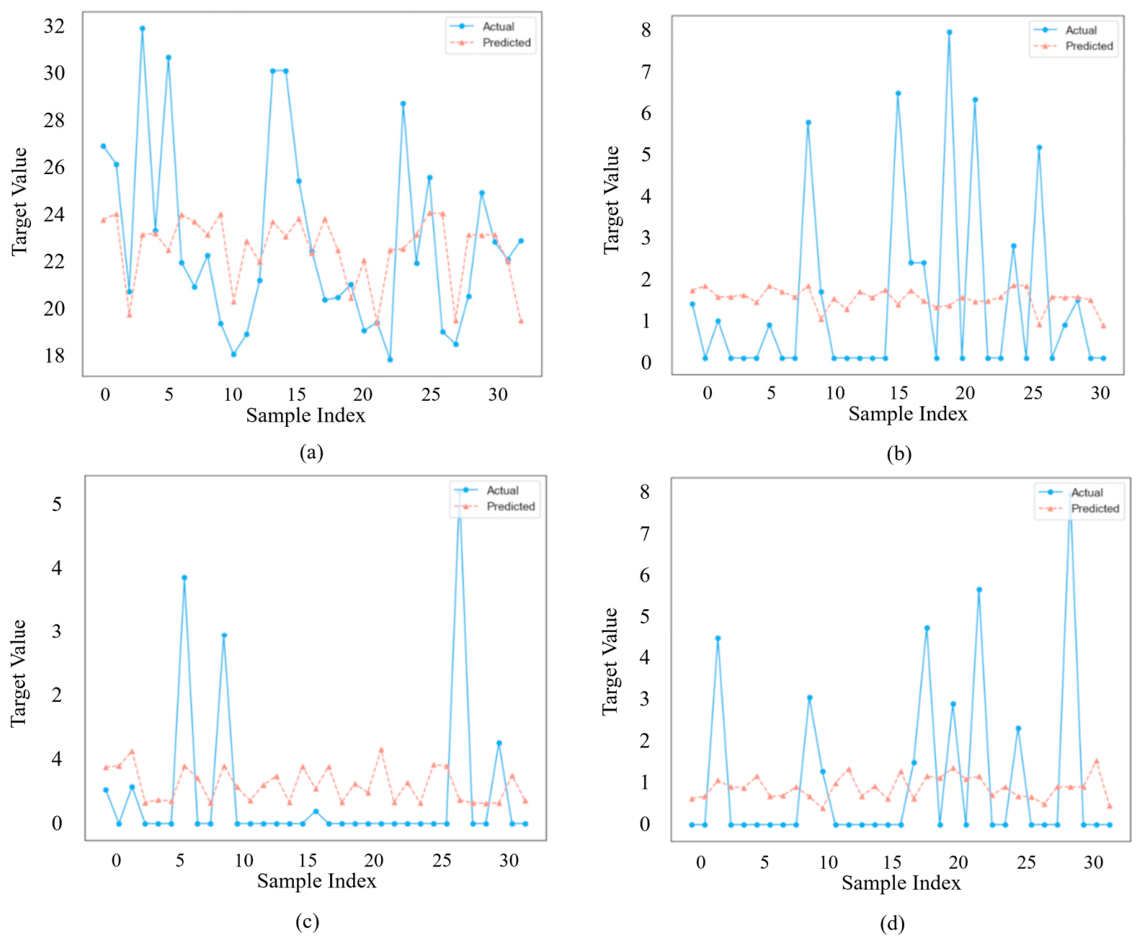
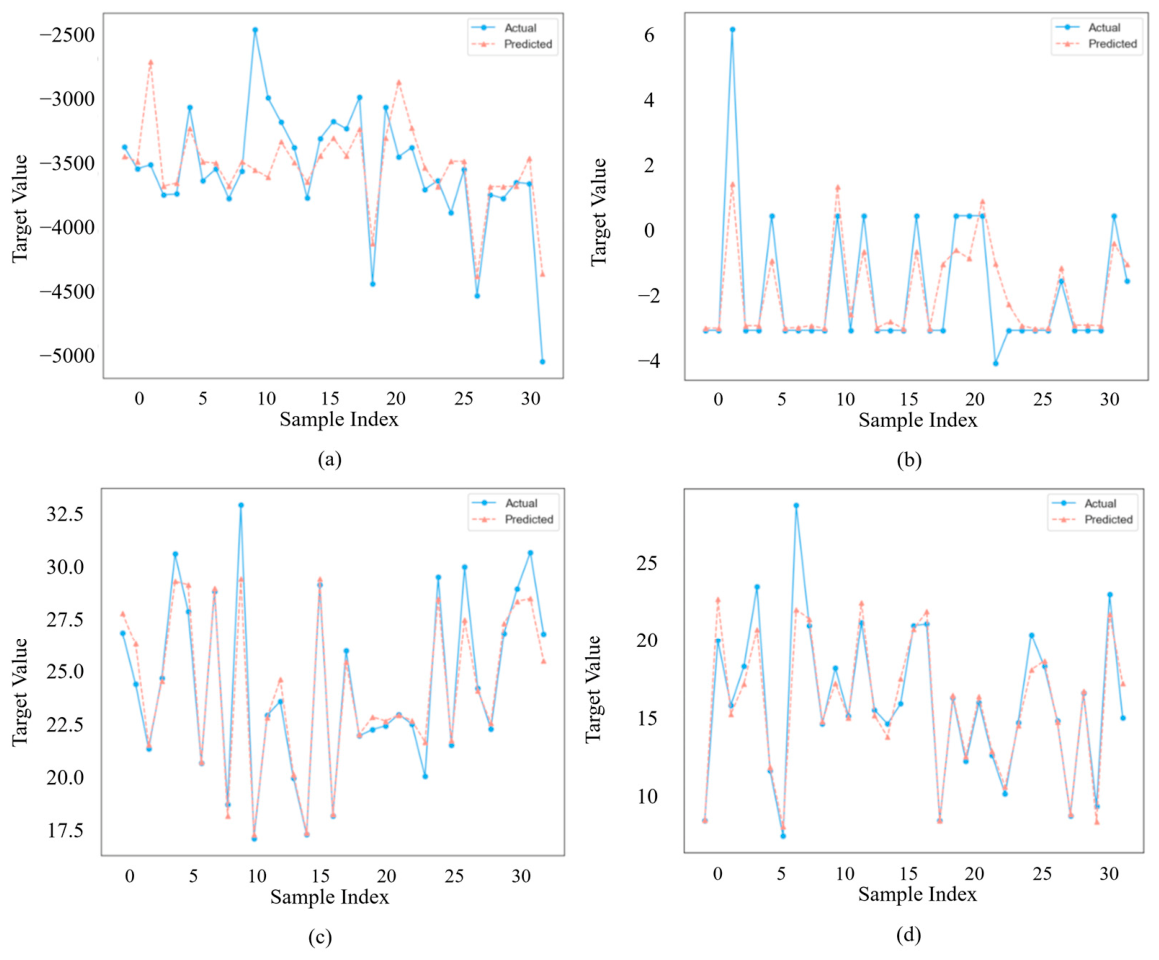
Figure 19 and Figure 20 show the prediction curves for representative regression outputs, while Figure 21 presents the confusion matrices for the classification models. Overall, the results confirm that the proposed intelligent computation framework can provide reliable target parameter prediction under the current project setting while also revealing that intermediate multi-parameter prediction remains the weaker part of the integrated pipeline and warrants improvement in future studies.

3.3.2. Validation Analysis

To further verify the practical effectiveness of the proposed framework, the predicted pile design parameter values were compared with the actual finalized design values at the same coordinates under the same project conditions. It should be emphasized that the objective of this validation is not to directly verify mechanical ultimate capacity in the sense of theoretical pile capacity formulas but to examine whether the proposed data-driven framework can reproduce actual engineering design outputs in a stable and practically meaningful manner.
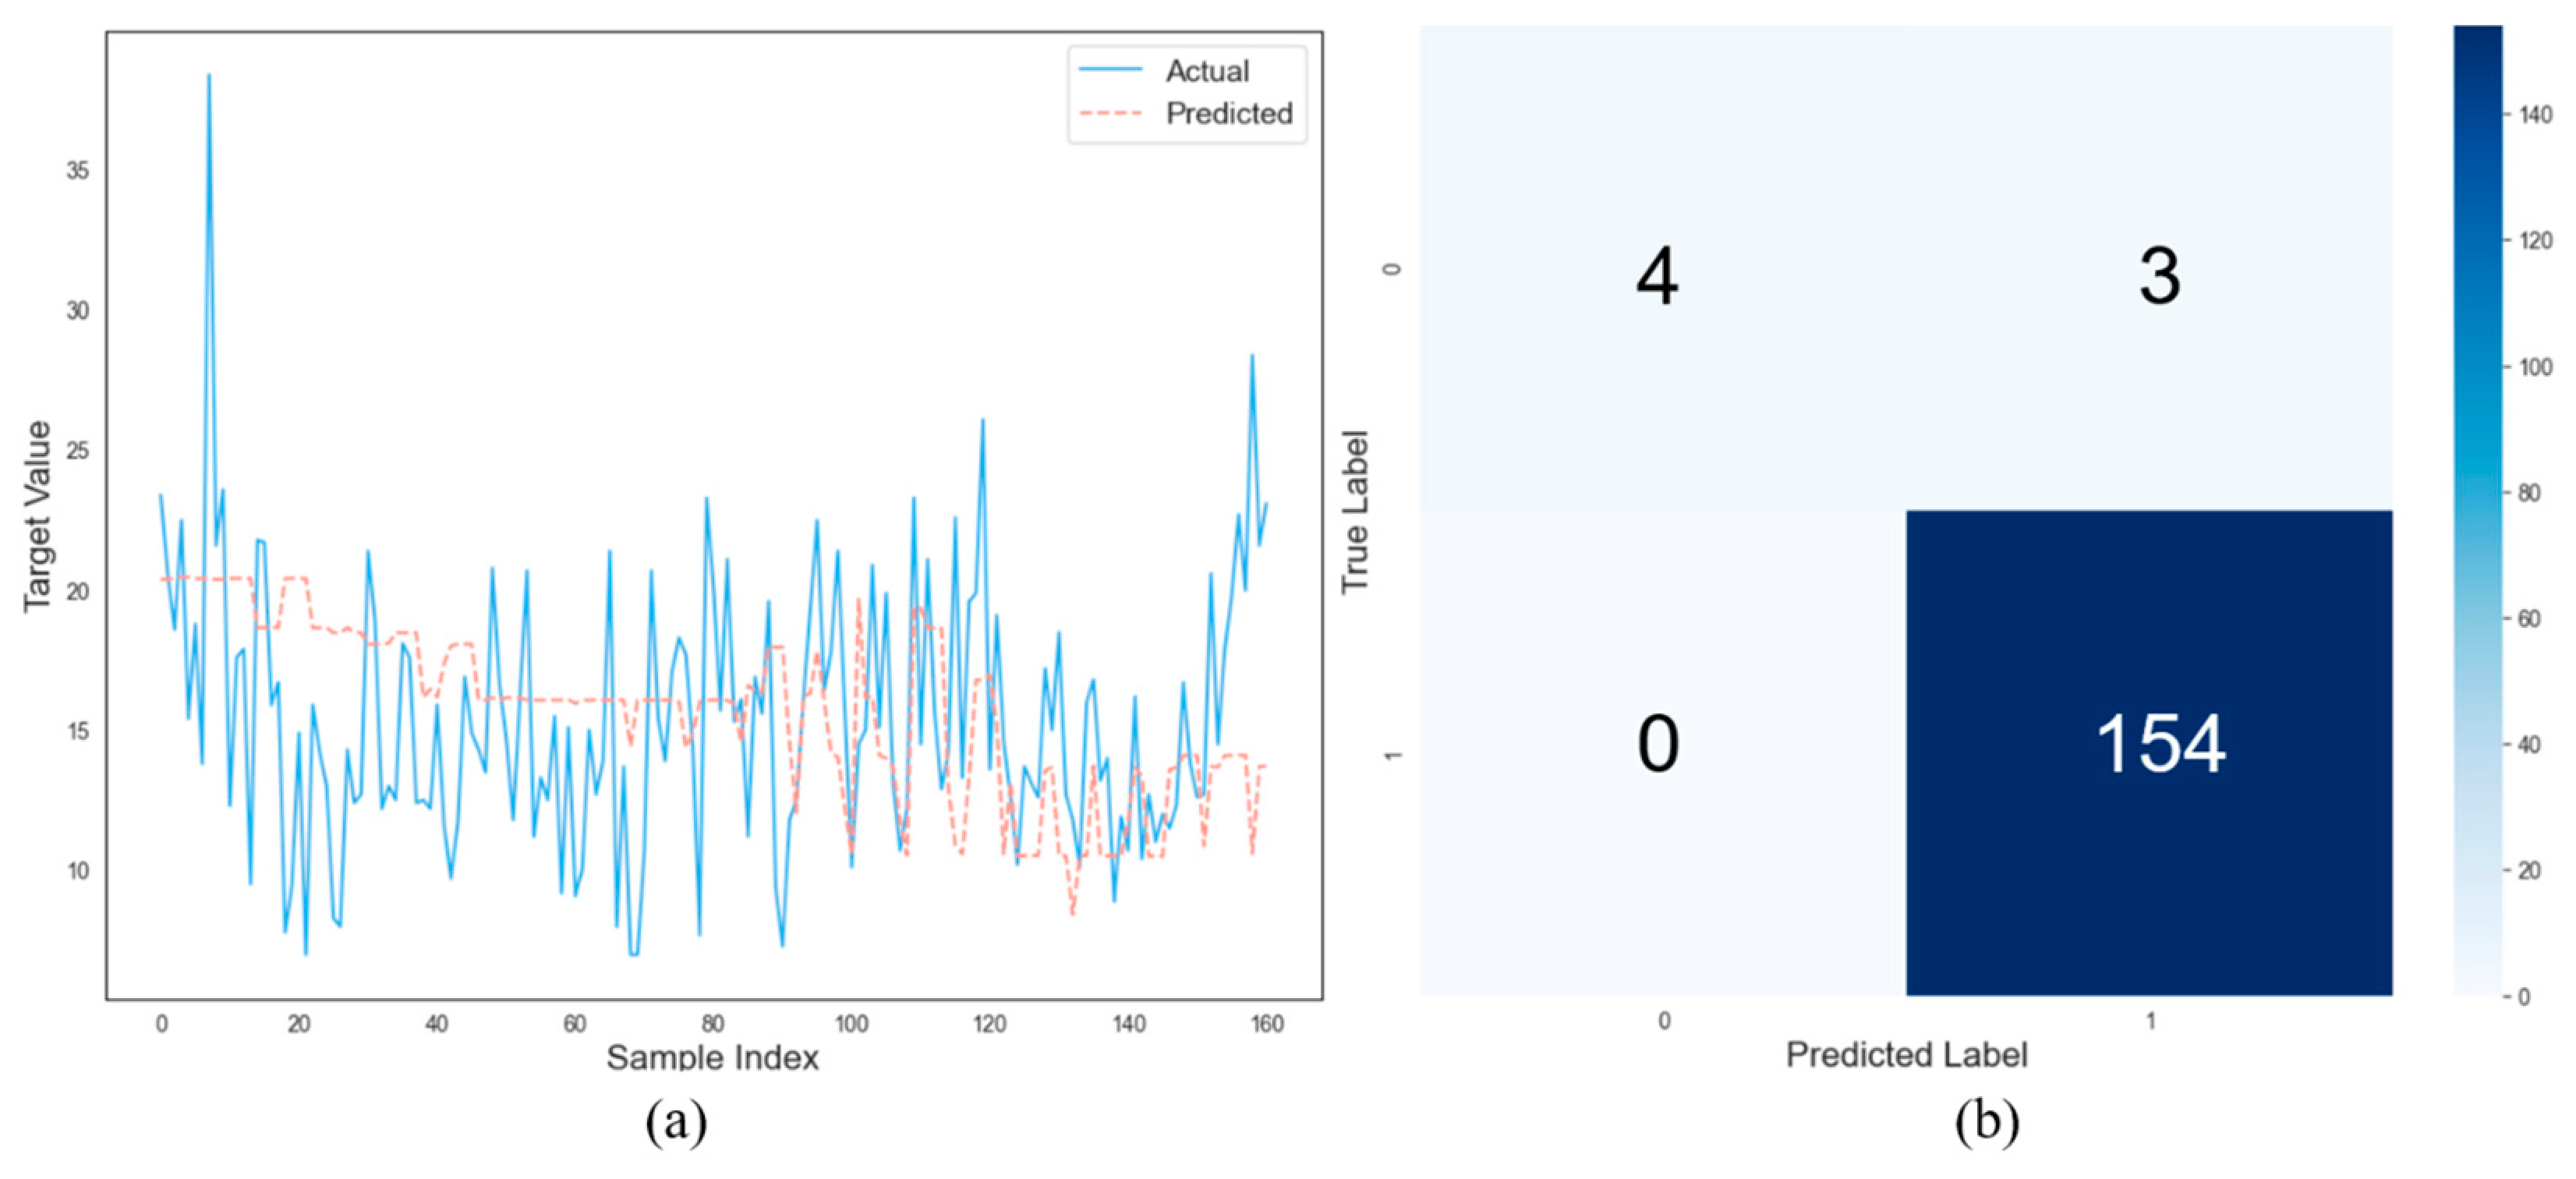
Based on the integrated process described above, the actual project coordinates were input into the intelligent computation framework, and the predicted pile length and diameter values were then compared with the corresponding design values in the project documents. The predicted three-dimensional rendering results are shown in Figure 22.
Table 8 presents representative comparison samples between the actual and predicted values. The results show that the pile diameter predictions are highly consistent with the actual design values, while the pile length predictions exhibit a certain degree of deviation at several locations. Figure 23 further summarizes the validation results for all pile coordinates. Only a small number of pile diameter predictions differ from the actual design values, indicating that the classification model performs well under the current engineering setting.
In contrast, the pile length results show a relatively conservative tendency in some cases. From an engineering viewpoint, such deviation should be interpreted with caution. On the one hand, this indicates that the prediction of continuous design parameters remains more difficult under heterogeneous geological conditions. On the other hand, the observed level of error suggests that the model still provides a useful reference for preliminary design automation, particularly when rapid generation of scheme-level design results is required. Therefore, the present validation supports the practical value of the proposed framework as an intelligent design assistance tool rather than as a substitute for final code-based engineering verification.
3.4. Limitations and Generalizability

The present study is based on a dataset derived from a single engineering project in southern China, which includes more than 160 pile-related samples. It should be emphasized that the primary purpose of this study is to develop and verify the feasibility of an integrated intelligent information framework for pile foundation design rather than to establish a universally applicable predictive model based on large-scale datasets. Within this context, the selected case serves as a representative engineering scenario to validate the overall workflow, including coordinate-driven parameter generation, intelligent design computation, and three-dimensional mapping. The results show that the proposed framework can effectively connect engineering condition input, implicit parameter generation, pile design computation, and three-dimensional visualization within a unified workflow. Therefore, the current case study mainly demonstrates the feasibility, operability, and engineering applicability of the proposed method under real project conditions. However, the adaptability of the framework to different geological settings, project scales, and pile foundation design scenarios still requires further investigation.
In addition, the current feature system mainly relies on design-related variables available from engineering survey records and project design documents, such as stratum thickness, bearing layer depth, bearing stratum category, vertical load, and platform elevation. More detailed geotechnical parameters, including laboratory-derived strength or stiffness indices, were not explicitly incorporated in the present model. Incorporating such parameters in future studies may further improve the descriptive ability of the model for complex subsurface conditions.
Future work will focus on applying the proposed framework to more engineering cases from different regions and geological backgrounds, expanding the dataset, and further optimizing the intelligent algorithms. Additional validation under diverse engineering conditions will be necessary to examine the broader applicability of the framework and to improve its robustness as an intelligent design support tool for pile foundation engineering.

4. Conclusions

This study explores methods to enhance the efficiency and objectivity of pile foundation design processes using machine learning techniques. By leveraging the principles of intelligent information design, a novel intelligent information model for pile foundation design is proposed. This model facilitates the intelligent generation of three-dimensional design drawings with reduced manual parameter input, thereby improving workflow efficiency by reducing repetitive manual design iterations. The proposed model maintains the accuracy and objectivity of the design while improving workflow efficiency by reducing repetitive manual design iterations, offering a promising new avenue for pile foundation design.
The core component of this information model is an intelligent computation model for pile foundation design, which embodies an integrated intelligent design and visualization approach for pile foundations. This study outlines the architecture of an intelligent computation model for pile foundations built using the random forest algorithm. Most model design computations yielded scores above 0.8, indicating excellent design performance. By leveraging an intelligently integrated design and visualization approach, this study implemented programming functionalities for the design condition input, design computation, and visualization output, incorporating them into a unified framework. To validate the effectiveness and feasibility of the methodological approach, the model was applied to a specific engineering project in southern China. Through a comparative analysis under equivalent conditions, the pile foundation parameter results at identical coordinates were examined. Among the 161 samples, the predicted pile lengths demonstrated conservatism, whereas only three instances of predicted errors were found in the pile diameters, indicating excellent predictive performance. This validation confirmed the feasibility and rationality of the intelligent information design approach proposed in this study.
The integrated intelligent information framework proposed in this study shows potential for extension to other geotechnical engineering design scenarios in which spatially distributed geological information, design parameters, and geometric representation need to be linked within one workflow. However, such an extension should be regarded as a future possibility rather than a conclusion established by the present case study. Further validation using broader datasets, different geological conditions, and additional engineering scenarios is required before the framework can be generalized beyond the current pile foundation application.

Author Contributions

Conceptualization, Z.L. and C.Z.; methodology, Z.T., J.Y. and W.H.; software, Z.T.; validation, Z.T., C.L. and W.H.; formal analysis, Z.T. and J.Y.; investigation, C.Z.; resources, Z.L.; data curation, Z.L.; writing—original draft preparation, Z.L.; writing—review and editing, Z.L. and Z.T.; visualization, Z.T. and J.Y.; supervision, Z.L.; project administration, C.Z. and Z.L.; funding acquisition, C.Z. All authors have read and agreed to the published version of the manuscript.

Funding

The work presented in this article was supported by the National Natural Science Foundation of China (NSFC) (Grant No. 42277131, 42293354, 42293351, 42293355, 42293350).

Data Availability Statement

The raw data supporting the conclusions of this article will be made available by the authors on request.

Conflicts of Interest

The authors declare no conflicts of interest.

References

  1. Xu, M.J.; Ni, P.P.; Mei, G.X.; Zhao, Y.L. Load-settlement behaviour of bored piles with loose sediments at the pile tip: Experimental, numerical and analytical study. Comput. Geotech. 2018, 102, 92–101. [Google Scholar] [CrossRef] [Scilit]
  2. Seo, S.; Kim, G.; Park, J.-B.; Kim, J.; Park, Y.-B.; Chung, M. Leveraging data-driven machine learning techniques to enhance bearing capacity estimation in prebored and precast piles. Expert Syst. Appl. 2025, 285, 128070. [Google Scholar] [CrossRef] [Scilit]
  3. Marzouk, M.; Ali, H. Modeling safety considerations and space limitations in piling operations using agent based simulation. Expert Syst. Appl. 2013, 40, 4848–4857. [Google Scholar] [CrossRef] [Scilit]
  4. Karan, E.P.; Asadi, S. Intelligent designer: A computational approach to automating design of windows in buildings. Autom. Constr. 2019, 102, 160–169. [Google Scholar] [CrossRef] [Scilit]
  5. Cherian, A. On-site and numerical analysis of bidirectional static load testing (BDSLT) on bored pile. Mater. Today Proc. 2023, 85, 51–54. [Google Scholar] [CrossRef] [Scilit]
  6. Liu, X.; Wu, W.; El Naggar, M.H.; Sun, J.; Tang, L. Theoretical analysis of dynamic performance of concrete-filled steel tube pile under vertical load. Comput. Geotech. 2024, 165, 105884. [Google Scholar] [CrossRef] [Scilit]
  7. Meyerhof, G.G. Bearing Capacity and Settlement of Pile Foundations. J. Geotech. Eng. Div. 1976, 102, 197–228. [Google Scholar] [CrossRef] [Scilit]
  8. Vesić, A.S. Expansion of Cavities in Infinite Soil Mass. J. Soil. Mech. Found. Div. 1972, 98, 265–290. [Google Scholar] [CrossRef] [Scilit]
  9. Wang, J.; Hou, X.; Deng, X.; Han, H.; Zhang, L. Application of BIM in Tunnel Design with Compaction Pile Reinforced Foundation Carrying Carbon Assessment Based on Advanced Dynamo Visual Programming: A Case Study in China. Sustainability 2022, 14, 16222. [Google Scholar] [CrossRef] [Scilit]
  10. Chowdhury, M.; Hosseini, M.R.; Edwards, D.J.; Martek, I.; Shuchi, S. Comprehensive analysis of BIM adoption: From narrow focus to holistic understanding. Autom. Constr. 2024, 160, 105301. [Google Scholar] [CrossRef] [Scilit]
  11. Li, L.; Liu, X.; Liu, H.; Wu, W.; Lehane, B.M.; Jiang, G.; Xu, M. Experimental and numerical study on the static lateral performance of monopile and hybrid pile foundation. Ocean Eng. 2022, 255, 111461. [Google Scholar] [CrossRef] [Scilit]
  12. Gao, Y.Z.; Tao, G.L. Application of the parametric drive in pile-supported wharf project by Revit software. J. Waterw. Harb. 2018, 39, 114–118. [Google Scholar]
  13. Li, M.; Ren, Q.; Li, M.; Kong, T.; Li, H.; Tian, H.; Liu, S. Digital twin-enabled collision early warning system for marine piling: Application to a wharf project in China. Adv. Eng. Inform. 2024, 59, 102269. [Google Scholar] [CrossRef] [Scilit]
  14. Liu, J.; Qiu, Z.; Wang, L.; Liu, P.; Cheng, G.; Chen, Y. Intelligent floor plan design of modular high-rise residential building based on graph-constrained generative adversarial networks. Autom. Constr. 2024, 159, 105264. [Google Scholar]
  15. Deng, Y.; Zhang, K.; Yao, Z.; Zhao, H.; Li, L. Parametric analysis and multi-objective optimization of the coupling beam pile structure foundation. Ocean Eng. 2023, 280, 114724. [Google Scholar] [CrossRef] [Scilit]
  16. Deng, Y.; Zhang, K.; Feng, Z.; Zhang, W.; Zou, X.; Zhao, H. Machine learning based prediction model for the pile bearing capacity of saline soils in cold regions. Structures 2024, 59, 105735. [Google Scholar]
  17. Cakiroglu, C.; Islam, K.; Bekdas, G.; Nehdi, M.L. Data-driven ensemble learning approach for optimal design of cantilever soldier pile retaining walls. Structures 2023, 51, 1268–1280. [Google Scholar] [CrossRef] [Scilit]
  18. Zhang, J.; Hu, J.; Li, X.; Li, J. Bayesian network based machine learning for design of pile foundations. Autom. Constr. 2020, 118, 103295. [Google Scholar] [CrossRef] [Scilit]
  19. Cui, S.; Maghoul, P. Guided wave and genetic algorithm-based inversion for characterization of pile foundations. Autom. Constr. 2023, 154, 104966. [Google Scholar] [CrossRef] [Scilit]
  20. Wong, P.K. Case studies of cost-effective foundation design in rock. In Proceedings of the 18th International Conference on Soil Mechanics and Geotechnical Engineering; Presses des Ponts: Paris, France, 2013; pp. 2901–2904. [Google Scholar]
  21. Löwen, M.; Tinteler, T.; Krumm, S.; Herrmann, R.A. Research on the load-bearing behaviour of bored piles with different enlarged bases. In Proceedings of the 18th International Conference on Soil Mechanics and Geotechnical Engineering; Presses des Ponts: Paris, France, 2013; pp. 2755–2758. [Google Scholar]
  22. Guo, L.; He, K.; Zhang, J.; Yang, H. Study on Influencing Factors and Evaluation Model of Hole-Wall Stability of Cast-in-Place Bored Pile in Complex Coastal Foundations. Buildings 2025, 15, 4479. [Google Scholar] [CrossRef] [Scilit]
  23. Lv, Y.; Liu, H.; Ng, C.W.W.; Ding, X.; Gunawan, A. Three-dimensional numerical analysis of the stress transfer mechanism of XCC piled raft foundation. Comput. Geotech. 2014, 55, 365–377. [Google Scholar] [CrossRef] [Scilit]
  24. Ni, P.; Mangalathu, S.; Mei, G.; Zhao, Y. Permeable piles: An alternative to improve the performance of driven piles. Comput. Geotech. 2017, 84, 78–87. [Google Scholar] [CrossRef] [Scilit]
  25. Ni, P.; Mei, G.; Zhao, Y. Numerical investigation of the uplift performance of prestressed fiber-reinforced polymer floating piles. Mar. Georesour. Geotechnol. 2017, 35, 829–839. [Google Scholar] [CrossRef] [Scilit]
  26. Hernández, H.; Toro, M.F.; López, S. Assessing Prefabricated Foundation Systems for Circular Industrialized Construction Through Manufacturing, Assembly, and Disassembly Principles. Buildings 2026, 16, 74. [Google Scholar] [CrossRef] [Scilit]
  27. Jeong, S.; Park, J.; Chang, D.-W. An approximate numerical analysis of rafts and piled-rafts foundation. Comput. Geotech. 2024, 168, 106108. [Google Scholar] [CrossRef] [Scilit]
  28. Momeni, E.; Maizir, H.; Gofar, N.; Nazir, R. Comparative study on prediction of axial bearing capacity of driven piles in granular materials. J. Teknol. 2013, 61, 15–20. [Google Scholar] [CrossRef] [Scilit]
  29. Lehtonen, J. Drilled pile technology in retaining wall construction and energy transfer. In Proceedings of the 18th International Conference on Soil Mechanics and Geotechnical Engineering; Presses des Ponts: Paris, France, 2013; pp. 2783–2786. [Google Scholar]
  30. Shehadeh, A.; Alshboul, O.; Al Mamlook, R.E.; Hamedat, O. Machine learning models for predicting the residual value of heavy construction equipment: An evaluation of modified decision tree, LightGBM, and XGBoost regression. Autom. Constr. 2021, 129, 103827. [Google Scholar] [CrossRef] [Scilit]
  31. Shen, T.; Peng, H.; Yuan, X.; Liang, Y.; Liu, S.; Wu, Z.; Leng, L.; Qin, P. Feature engineering for improved machine-learning-aided studying heavy metal adsorption on biochar. J. Hazard. Mater. 2024, 466, 133442. [Google Scholar] [CrossRef] [Scilit]
  32. Wang, Y.-Q.; Wang, H.-C.; Song, Y.-P.; Zhou, S.-Q.; Li, Q.-N.; Liang, B.; Liu, W.-Z.; Zhao, Y.-W.; Wang, A.-J. Machine learning framework for intelligent aeration control in wastewater treatment plants: Automatic feature engineering based on variation sliding layer. Water Res. 2023, 246, 120676. [Google Scholar] [CrossRef] [Scilit]
  33. Yang, J.; Zhou, C.; Liu, Z.; Zeng, L. Real-Time Rendering Closure Method for Continuous Cutting of Multilevel TIN Geological Models. Geotech. Geol. Eng. 2024, 42, 3269–3285. [Google Scholar] [CrossRef] [Scilit]
Figure 1. Principle of intelligent information model for pile foundation design.
Buildings 16 01926 g001
Figure 2. Schematic of conditional input algorithm.
Buildings 16 01926 g002
Figure 3. Intelligent calculation modeling of pile foundation.
Buildings 16 01926 g003
Figure 4. Composite design calculation of pile foundation models.
Buildings 16 01926 g004
Figure 5. Three-dimensional intelligent mapping process for pile foundations.
Buildings 16 01926 g005
Figure 6. Diagram of implementation steps.
Buildings 16 01926 g006
Figure 7. Project location.
Buildings 16 01926 g007
Figure 8. Actual design drawings.
Buildings 16 01926 g008
Figure 9. Thickness data of different strata.
Buildings 16 01926 g009
Figure 10. Visual analysis results of data.
Buildings 16 01926 g010
Figure 11. Pile length and diameter.
Buildings 16 01926 g011
Figure 12. The hyperparameter optimization process for the multi-parameter model: (a) random search; (b) grid search.
Buildings 16 01926 g012
Figure 13. The hyperparameter optimization process of the bearing layer depth model: (a) random search; (b) grid search.
Buildings 16 01926 g013
Figure 14. The hyperparameter optimization process of the bearing stratum category model: (a) random search; (b) grid search.
Buildings 16 01926 g014
Figure 15. The hyperparameter optimization process of the pile length prediction model: (a) random search; (b) grid search.
Buildings 16 01926 g015
Figure 16. The hyperparameter optimization process of the pile diameter classification model: (a) random search; (b) grid search.
Buildings 16 01926 g016
Figure 17. Coordinate visualization results.
Buildings 16 01926 g017
Figure 18. Three-dimensional design results: (a) group-pile result; (b) combined result.
Buildings 16 01926 g018
Figure 19. Prediction curves for strata thickness: (a) sandy soil layer; (b) karst cave; (c) 4-1 moderately weathered rock; (d) 4-2 slightly weathered rock.
Buildings 16 01926 g019
Figure 20. Parameter prediction curves: (a) vertical load; (b) bearing platform elevation; (c) burial depth of the bearing stratum; (d) pile length.
Buildings 16 01926 g020
Figure 21. Confusion matrix.
Buildings 16 01926 g021
Figure 22. Three-dimensional results.
Buildings 16 01926 g022
Figure 23. Validation analysis results: (a) comparison of pile length values; (b) pile diameter confusion matrix.
Buildings 16 01926 g023
Table 1. Data in pile foundation database.
NumberNameUnitType
1Coordinate xmContinuous numerical
2Coordinate ymContinuous numerical
3Thickness of each stratummContinuous numerical
4Bearing stratum category-Discrete categorical
5Depth of the top of the bearing stratummContinuous numerical
6Vertical loadkNContinuous numerical
7Elevation of bearing platform surfacemContinuous numerical
8Pile lengthmContinuous numerical
9Pile diametermmDiscrete categorical
Table 2. Feature set categories tested for pile length prediction models.
CategoryExperimental Characteristics
1Bearing stratum category, top burial depth of bearing layer, vertical load, elevation of bearing platform surface
2Bearing stratum category, top burial depth of bearing layer, vertical load, elevation of bearing platform surface, thickness of each stratum
3Bearing stratum category, top burial depth of bearing layer, vertical load, elevation of bearing platform surface, thickness of each stratum, coordinates
Table 3. Summary of optimal test results for pile length models.
Pile Length Algorithm ModelOptimal Experimental CategoryMSEMAER2
Pile Length Linear Regression14.7031.7740.344
Pile Length Lasso Regression22.6361.2040.632
Pile Length Ridge Regression22.4931.1890.652
Pile Length Decision Tree24.5461.0580.366
Pile Length Random Forest22.5411.0930.646
Pile Length K-Nearest Neighbors13.0391.2470.576
Pile Length Linear Regression14.7031.7740.344
Pile Length Lasso Regression22.6361.2040.632
Table 4. Feature set categories tested for pile diameter classification models.
CategoryExperimental Characteristics
1Bearing stratum category, top burial depth of bearing layer, vertical load, elevation of bearing platform surface
2Bearing stratum category, top burial depth of bearing layer, vertical load, elevation of bearing platform surface, coordinates
3Bearing stratum category, top burial depth of bearing layer, vertical load, elevation of bearing platform surface, thickness of each stratum, coordinates
Table 5. Summary of optimal test results for pile diameter models.
Pile Diameter Algorithm ModelOptimal Experimental CategoryAccuracyRecallPrecisionF1
Pile Diameter K-Nearest Neighbors Classification30.8330.8330.8330.822
Pile Diameter Naive Bayes Classification10.7330.7330.7330.733
Pile Diameter Decision Tree Classification20.9670.9670.9680.966
Pile Diameter Random Forest Classification20.9330.9330.9390.931
Pile Diameter Logistic Regression Classification30.80.80.7930.792
Pile Diameter K-Nearest Neighbors Classification30.8330.8330.8330.822
Pile Diameter Naive Bayes Classification10.7330.7330.7330.733
Pile Diameter Decision Tree Classification20.9670.9670.9680.966
Table 6. Optimal hyperparameters and validation metrics of the random forest regression models.
IndexMulti-Parameter ModelDepth of Bearing Layer ModelPile Length Model
n_estimators770370690
max_depth4118
min_samples_split675
min_samples_leaf211
MSE11.8481.3222.526
MAE4.4230.7590.933
R20.4030.9310.896
Table 7. Optimal hyperparameters and validation metrics of the random forest classification models.
IndexBearing Stratum Category ModelPile Diameter Model
n_estimators300550
max_depth33
min_samples_split32
precision0.831
F10.871
Table 8. Representative comparison between actual and predicted values of pile design parameters at selected coordinates.
XYPile LengthPile Diameter
Actual ValueDesign ValueActual ValueDesign Value
29,772.68357,842.17520.620.3913001300
29,788.3857,830.5616.718.6713001300
29,829.9457,765.7710.110.5513001300
29,807.8157,75115.114.1013001300
29,820.4457,754.0913.113.6713001300
29,836.5857,742.5912.613.1513001300
29,798.3857,686.9917.914.10800800
29,836.6157,696.3221.613.708001300
29,772.68357,842.17520.620.3913001300
Disclaimer/Publisher’s Note: The statements, opinions and data contained in all publications are solely those of the individual author(s) and contributor(s) and not of MDPI and/or the editor(s). MDPI and/or the editor(s) disclaim responsibility for any injury to people or property resulting from any ideas, methods, instructions or products referred to in the content.