1. Introduction
Architectural heritage embodies the cultural and historical narrative of societies and requires careful documentation to ensure its longevity under environmental and urban pressures. The ability to create accurate digital representations of existing historical structures is fundamental for conservation planning, restoration projects, and ongoing facility management [
1]. Heritage Building Information Modeling (HBIM) extends conventional Building Information Modeling (BIM) by embedding historical contexts, material degradations, and architectural intricacies into parametric digital models, offering a structured digital framework for documenting, analyzing, and managing built heritage with both semantic richness and geometric precision. Such integration enables not only geometric reconstruction but also the inclusion of heritage-specific metadata, facilitating long-term monitoring, preventive conservation, and interdisciplinary collaboration among architects, engineers, and heritage specialists, making conservation decision-making more informed. Similar patterns are seen in infrastructure research, including studies on historic transportation networks [
2], where systematic reviews show that accurate BIM implementation significantly enhances risk management and supports more sustainable decision-making across the full lifecycle [
3,
4].
Terrestrial Laser Scanning (TLS) and photogrammetry are widely utilized to capture geometric and radiometric properties with high precision, producing dense point clouds of remarkable detail [
5]. However, the direct utilization of these raw point clouds within BIM software, such as Autodesk Revit, remains a significant challenge. The conversion of point cloud data into semantically rich and geometrically accurate BIM models, often referred to as the Scan-to-HBIM process, is a laborious and time-consuming task [
6]. Although point cloud data can now be captured in days or even hours, transforming this massive, unstructured dataset into an intelligent, object-oriented BIM model remains disproportionately slow and manual. This temporal imbalance not only hinders efficiency but also limits the practical adoption of HBIM methodologies in large-scale heritage programs and routine documentation workflows. This imbalance between the speed of data acquisition and the effort required for model generation is particularly evident in heritage contexts, where complex and irregular architectural elements, such as ornate columns or non-orthogonal facades, demand a high degree of interpretive precision. Fully automated solutions, often based on geometric fitting, machine learning or even deep learning, promise faster results but frequently require advanced technical expertise and struggle with irregularities typical of heritage surfaces, including deformations, erosion, and asymmetry, leading to unreliable outcomes or significant manual post-processing [
7,
8,
9].
Addressing the gap between rapid 3D data capture and the slow production of usable HBIMs requires workflows that balance automation with expert control. Such approaches must accommodate diverse architectural typologies and material conditions while maintaining historical accuracy.
This paper positions itself in the middle ground, proposing a semi-automated, classification-driven workflow that improves both efficiency and interpretive control. The central idea is to use semantic pre-classification as a bridge between raw point clouds and structured HBIM elements, implemented through the integration of Rhino 8 and Revit 2024 environments. The primary objective is to develop and validate a practical and efficient methodology that utilizes the flexible modeling capabilities of Rhino alongside the seamless interoperability provided by Rhino.Inside.Revit. The workflow aims to reduce manual effort and improve modeling consistency, making advanced Scan-to-HBIM processes more accessible to heritage professionals without extensive technical expertise. A case study involving the exterior columns of a chapel demonstrates the workflow’s applicability and performance.
The remainder of this paper is structured as follows:
Section 2 provides a comprehensive review of existing literature on Scan-to-HBIM, point cloud processing, and the role of Rhino.Inside.Revit.
Section 3 introduces the proposed semi-automated workflow, detailing its classification-driven logic, mesh-based preprocessing, slice-guided reconstruction, and BIM integration.
Section 4 describes the heritage case study and the implementation of the workflow on an irregular chapel column.
Section 5 reports the results, including geometric accuracy and modeling efficiency.
Section 6 offers a discussion of the workflow’s strengths, limitations, and implications for HBIM practice.
Section 7 concludes the study and identifies directions for future development.
2. Literature Review
2.1. The Scan-to-HBIM
The conversion of 3D point cloud data into semantically rich digital models is a foundational process for the management of existing structures, known as Scan-to-BIM [
10]. This workflow is key for various applications, including renovation, facility management, and structural analysis of existing structures [
2]. For cultural heritage, the process goes beyond simple geometric representation to incorporate the semantic enrichment required for heritage documentation and preservation [
1,
11]. Through HBIM, models become repositories of historical construction knowledge, material characteristics, and patterns of decay, supporting conservation and restoration planning
However, the application of Scan-to-BIM in heritage contexts presents unique challenges. Historic structures often feature irregular geometries, complex ornamentation, and non-standardized elements, which are difficult to represent accurately and semantically within conventional BIM platforms [
12]. Additionally, point clouds often contain noise, occlusions, or incomplete data, particularly in reflective or deteriorated surfaces [
13]. These issues hinder automation and necessitate expert intervention. Consequently, the definition of clear standards and protocols for HBIM modeling and reconstruction remains an ongoing area of research [
12,
14,
15,
16]. A recent regional review in [
17] supports these observations in the Latin American context, noting that despite growing interest in Scan-to-HBIM workflows, adoption is still constrained by geometric complexity, the absence of standardized protocols, high implementation costs, and the need for specialized technical expertise.
So, while data acquisition can now be completed within hours or days, transforming this unstructured data into intelligent, object-oriented BIM remains disproportionately slow and manual. The modeling phase continues to be the primary bottleneck in the Scan-to-HBIM process [
10,
18]. Fully automated algorithms still struggle to address the irregularity, wear, and asymmetry typical of heritage structures, prompting the rise in semi-automated approaches that blend computational power with expert interpretation [
12,
19].
2.2. Scan-to-HBIM Categorization
The conversion of point cloud data into BIM models can be broadly categorized into three methodological groups, each with distinct advantages and limitations (
Table 1).
Manual modeling involves an operator tracing geometric features directly from the point cloud within BIM software like Revit. This approach offers the highest level of accuracy and allows for precise interpretation of complex architectural details, ensuring that the resulting BIM model faithfully represents the as-built condition [
6]. However, manual modeling is exceptionally time-consuming and labor-intensive, particularly for large or highly detailed heritage buildings. The repetitive nature of the task can also lead to inconsistencies and human errors, making it an inefficient solution for comprehensive HBIM projects [
6,
12].
To address these limitations, fully automated modeling has emerged as an alternative, aiming to automatically detect and reconstruct architectural elements from point clouds through algorithms, often supported by Machine Learning (ML) or Deep Learning (DL) techniques [
7,
8,
9]. These methods promise significant speed and efficiency gains by minimizing human intervention. Algorithms can identify primitive shapes (e.g., planes, cylinders) and fit them to point cloud segments [
20]. However, fully automated solutions face substantial limitations when applied to the irregular and unique geometries found in heritage architecture. They often require extensive training data, advanced programming knowledge, and may fail to accurately interpret complex or deteriorated elements, leading to simplified or inaccurate models that require considerable manual correction.
Between these two extremes lies the semi-automated workflow, a pragmatic balance that combines the efficiency of automation with the interpretive precision of human expertise. In such workflows, specific tasks like segmentation and initial geometry fitting are automated, while operations that depend on expert judgment, such as defining section planes or refining polylines, remain under human control [
21,
22]. Semi-automated façade reconstruction has been explored in earlier works such as [
23], demonstrating that hybrid approaches can effectively combine laser and image data to produce usable as-built BIM geometry. Tools like Visual Programming Languages (VPLs) such as Dynamo for Revit or Grasshopper for Rhino are commonly employed to create custom scripts that streamline repetitive tasks and facilitate the transfer of geometric information between platforms [
24,
25]. This hybrid approach significantly reduces modeling time and improves consistency compared to purely manual methods, while retaining the flexibility to handle the complexities of heritage structures that challenge fully automated systems [
26]. Ref. [
12] demonstrated the utility of such hybrid methods through the use of Dynamo for reconstructing classified point clouds, showing substantial time savings without compromising architectural fidelity. Similarly, ref. [
27] applied VPL-based semi-automation to streamline segmentation and geometric fitting for heritage masonry.
2.3. Role of Point Cloud Classification
Point cloud classification is a critical preliminary step that significantly enhances the efficiency and accuracy of Scan-to-BIM workflows. By segmenting and labeling point clouds into distinct architectural elements (e.g., walls, floors, columns), the modeling process becomes more manageable and targeted [
28]. Instead of processing a monolithic dataset, operators can focus on reconstructing specific element types, applying tailored modeling strategies. In heritage contexts, classification also facilitates semantic enrichment, enabling element-based organization within HBIM environments. Classification can be manual, semi-automated, or automated using ML and DL algorithms, with the latter increasingly used to identify heritage-specific features [
29,
30]. Deep learning approaches have advanced this field considerably. Foundational architectures such as PointNet [
31] introduced the first neural network capable of operating directly on unordered point sets without voxelization, enabling efficient classification and segmentation of large-scale 3D data. This breakthrough established the basis for many subsequent ML/DL algorithms now applied to point cloud interpretation, including those adapted for heritage-specific semantic segmentation.
2.4. Interoperability and the Role of Rhino.Inside.Revit
A persistent difficulty in heritage documentation is the interoperability between flexible geometric modeling tools and structured BIM environments. Traditional import/export workflows often cause data loss, limit parametric behavior, or fragment the modeling process. Recent innovations such as Rhino.Inside.Revit have revolutionized this domain by embedding Rhino and its visual programming environment, Grasshopper, directly within Autodesk Revit [
32,
33]. This integration allows for real-time interaction between free-form NURBS modeling and BIM parameterization, bridging two previously isolated domains.
Rhino’s powerful geometric modeling capabilities, especially for NURBS and mesh operations, make it particularly suited for reconstructing the complex, non-orthogonal forms typical of heritage architecture. Meanwhile, Revit provides the semantic and parametric structure necessary for HBIM management [
34]. The Rhino.Inside.Revit framework enables users to process point clouds in Rhino, generate or refine geometry using Grasshopper, and immediately instantiate corresponding BIM elements in Revit with assigned categories and parameters.
This approach effectively eliminates the need for intermediate, data-lossy conversions while improving consistency and efficiency. Studies by [
18,
35] demonstrated that Rhino-based modeling can preserve high geometric fidelity, while the Revit integration ensures structured information management. Subsequent developments have extended these workflows to multi-source data fusion [
36,
37], timber heritage reconstruction [
38], with recent work further expanding this area through the integration of TLS, UAV data, and structural analysis into an HBIM workflow for timber structures [
39], and to immersive visualization approaches such as Scan-to-HBIM-to-VR [
40].
In summary, the literature shows steady progress in Scan-to-HBIM, with significant efforts to automate segmentation, improve interoperability, and connect workflows through visual programming tools like Dynamo and Grasshopper. However, these advances are still scattered across different software and data formats, often missing a clear framework that supports both reproducibility and practical use.
Although multiple studies have explored semi-automated or algorithmic reconstruction methods, most are limited to specific tools or require advanced programming skills. Only a few have developed reproducible approaches that balance automation with human interpretation while enabling smooth exchange between Rhino and Revit. This research aims to fill that gap by proposing a structured PCML that combines classification-based data preparation, mesh-based sectioning, and BIM integration in a transparent and repeatable process, verified through quantitative deviation analysis.
3. Methodology
3.1. Overview of the Proposed Workflow
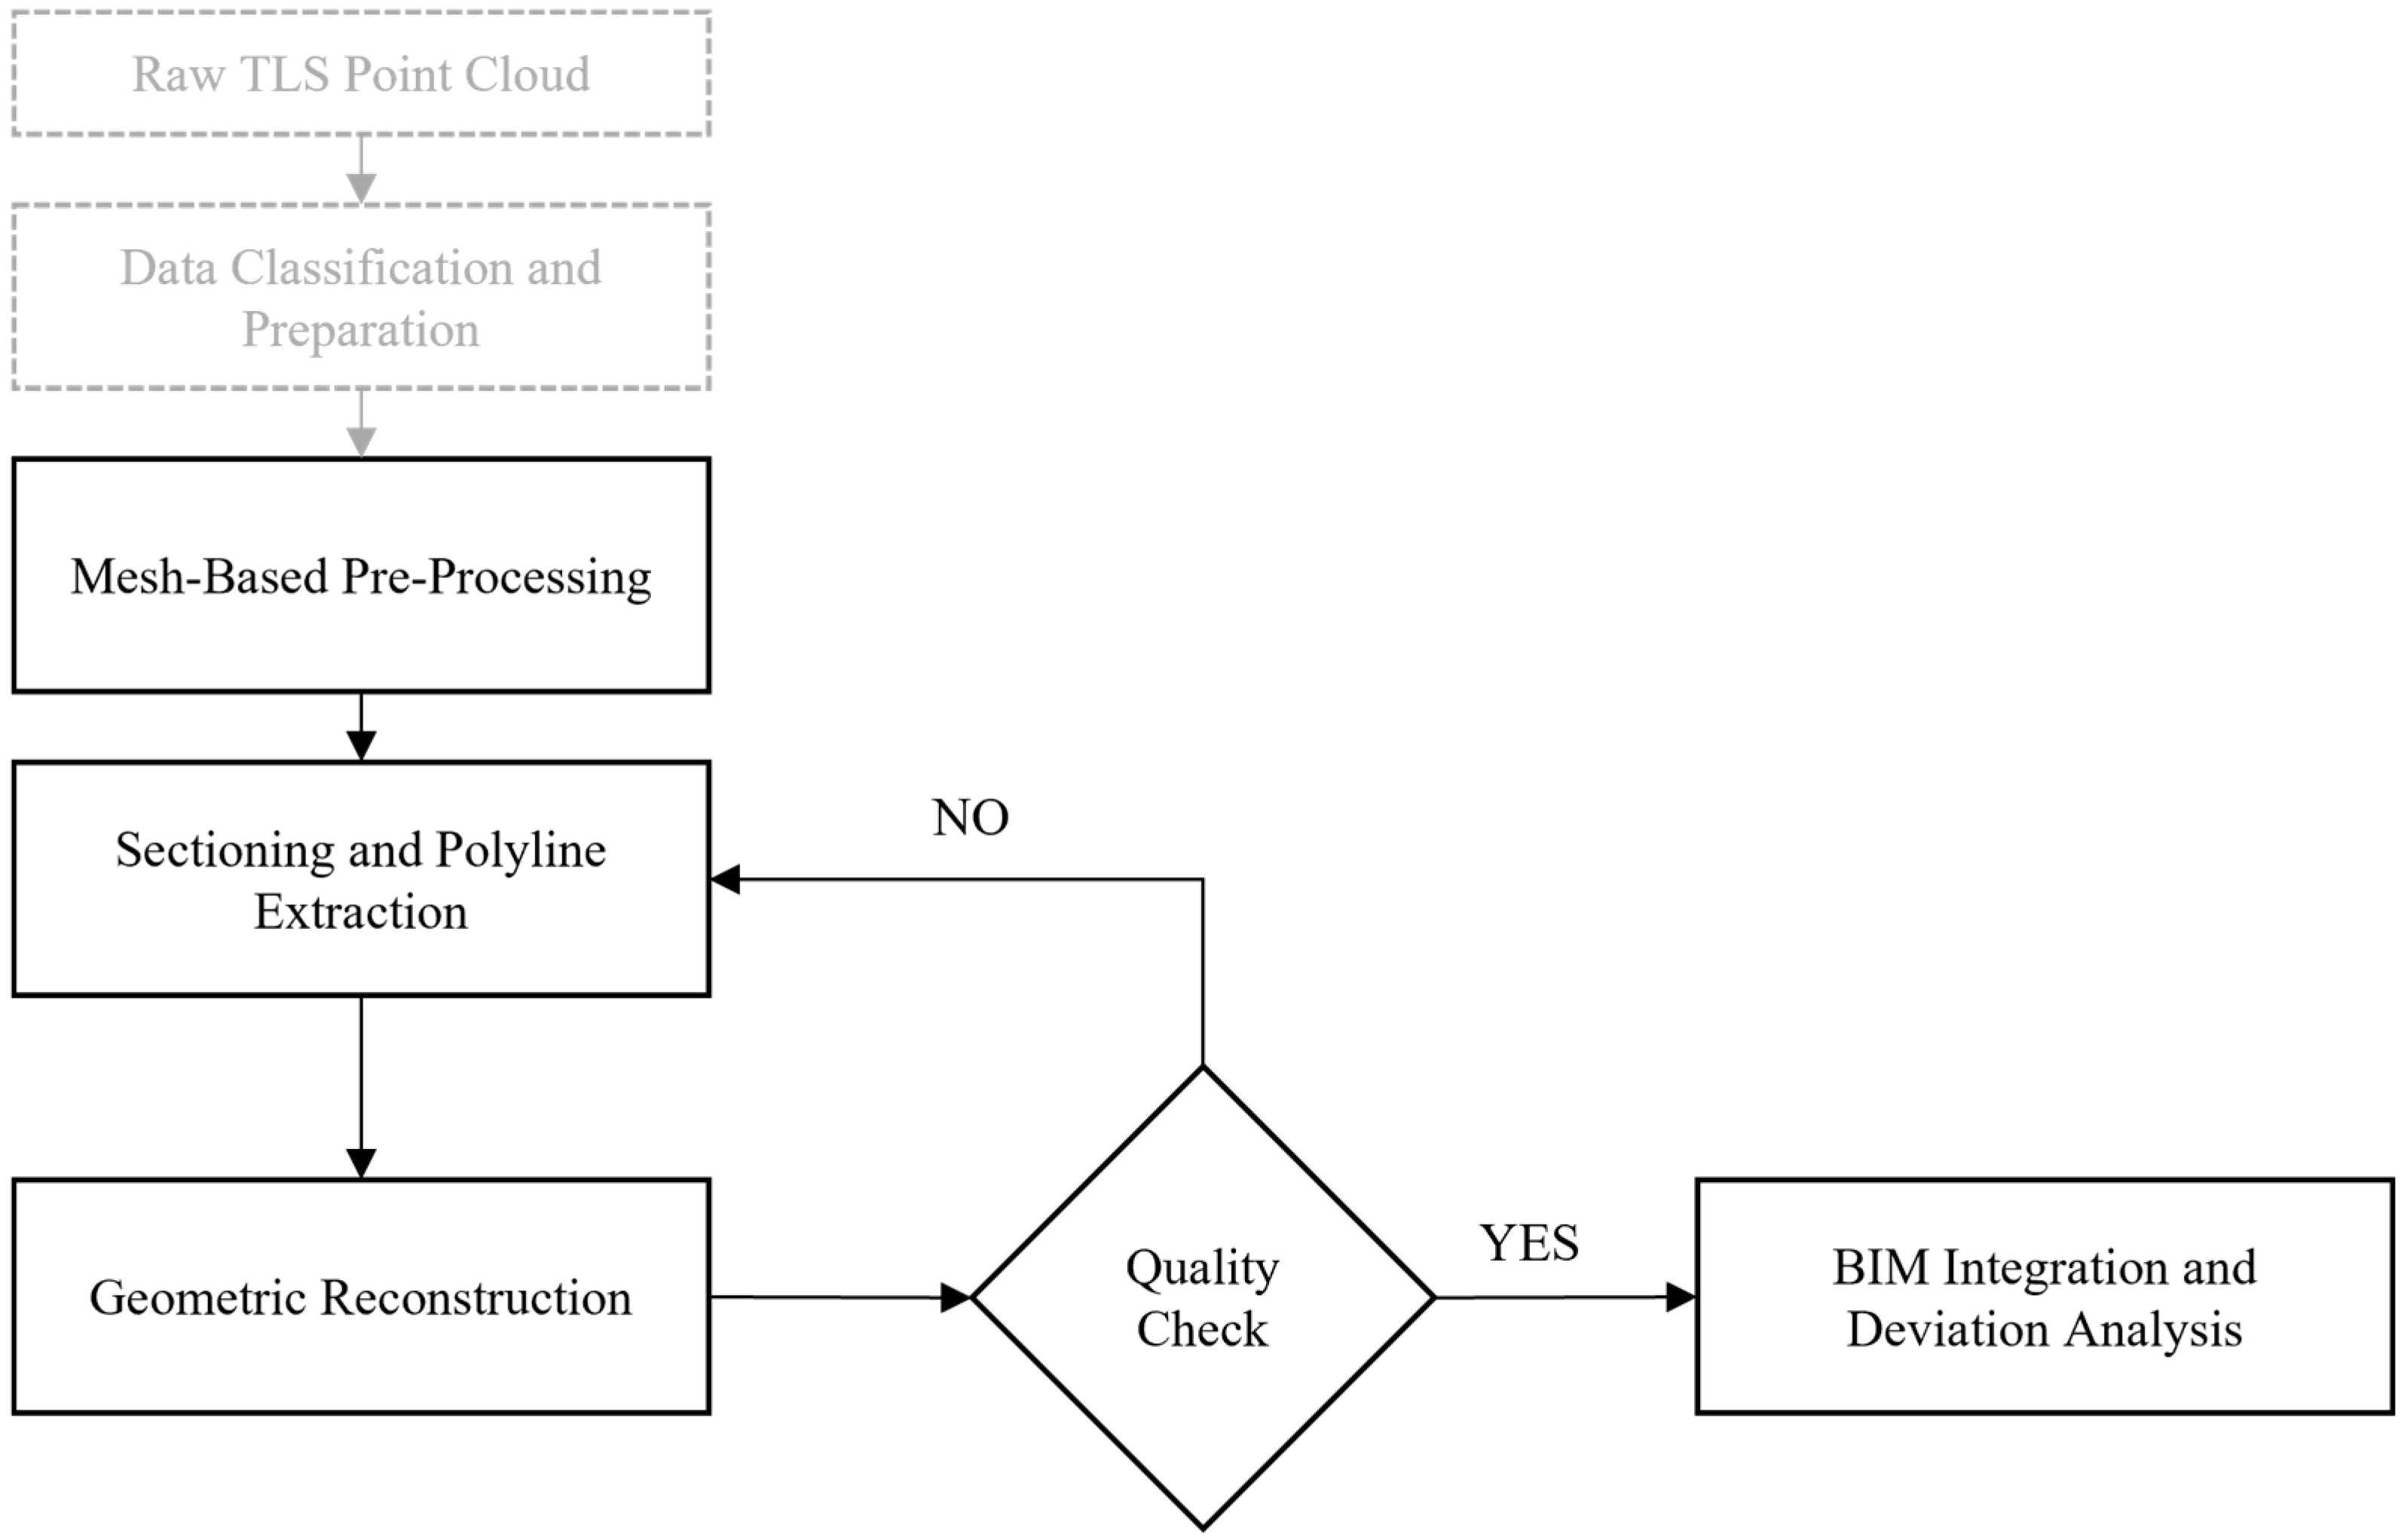
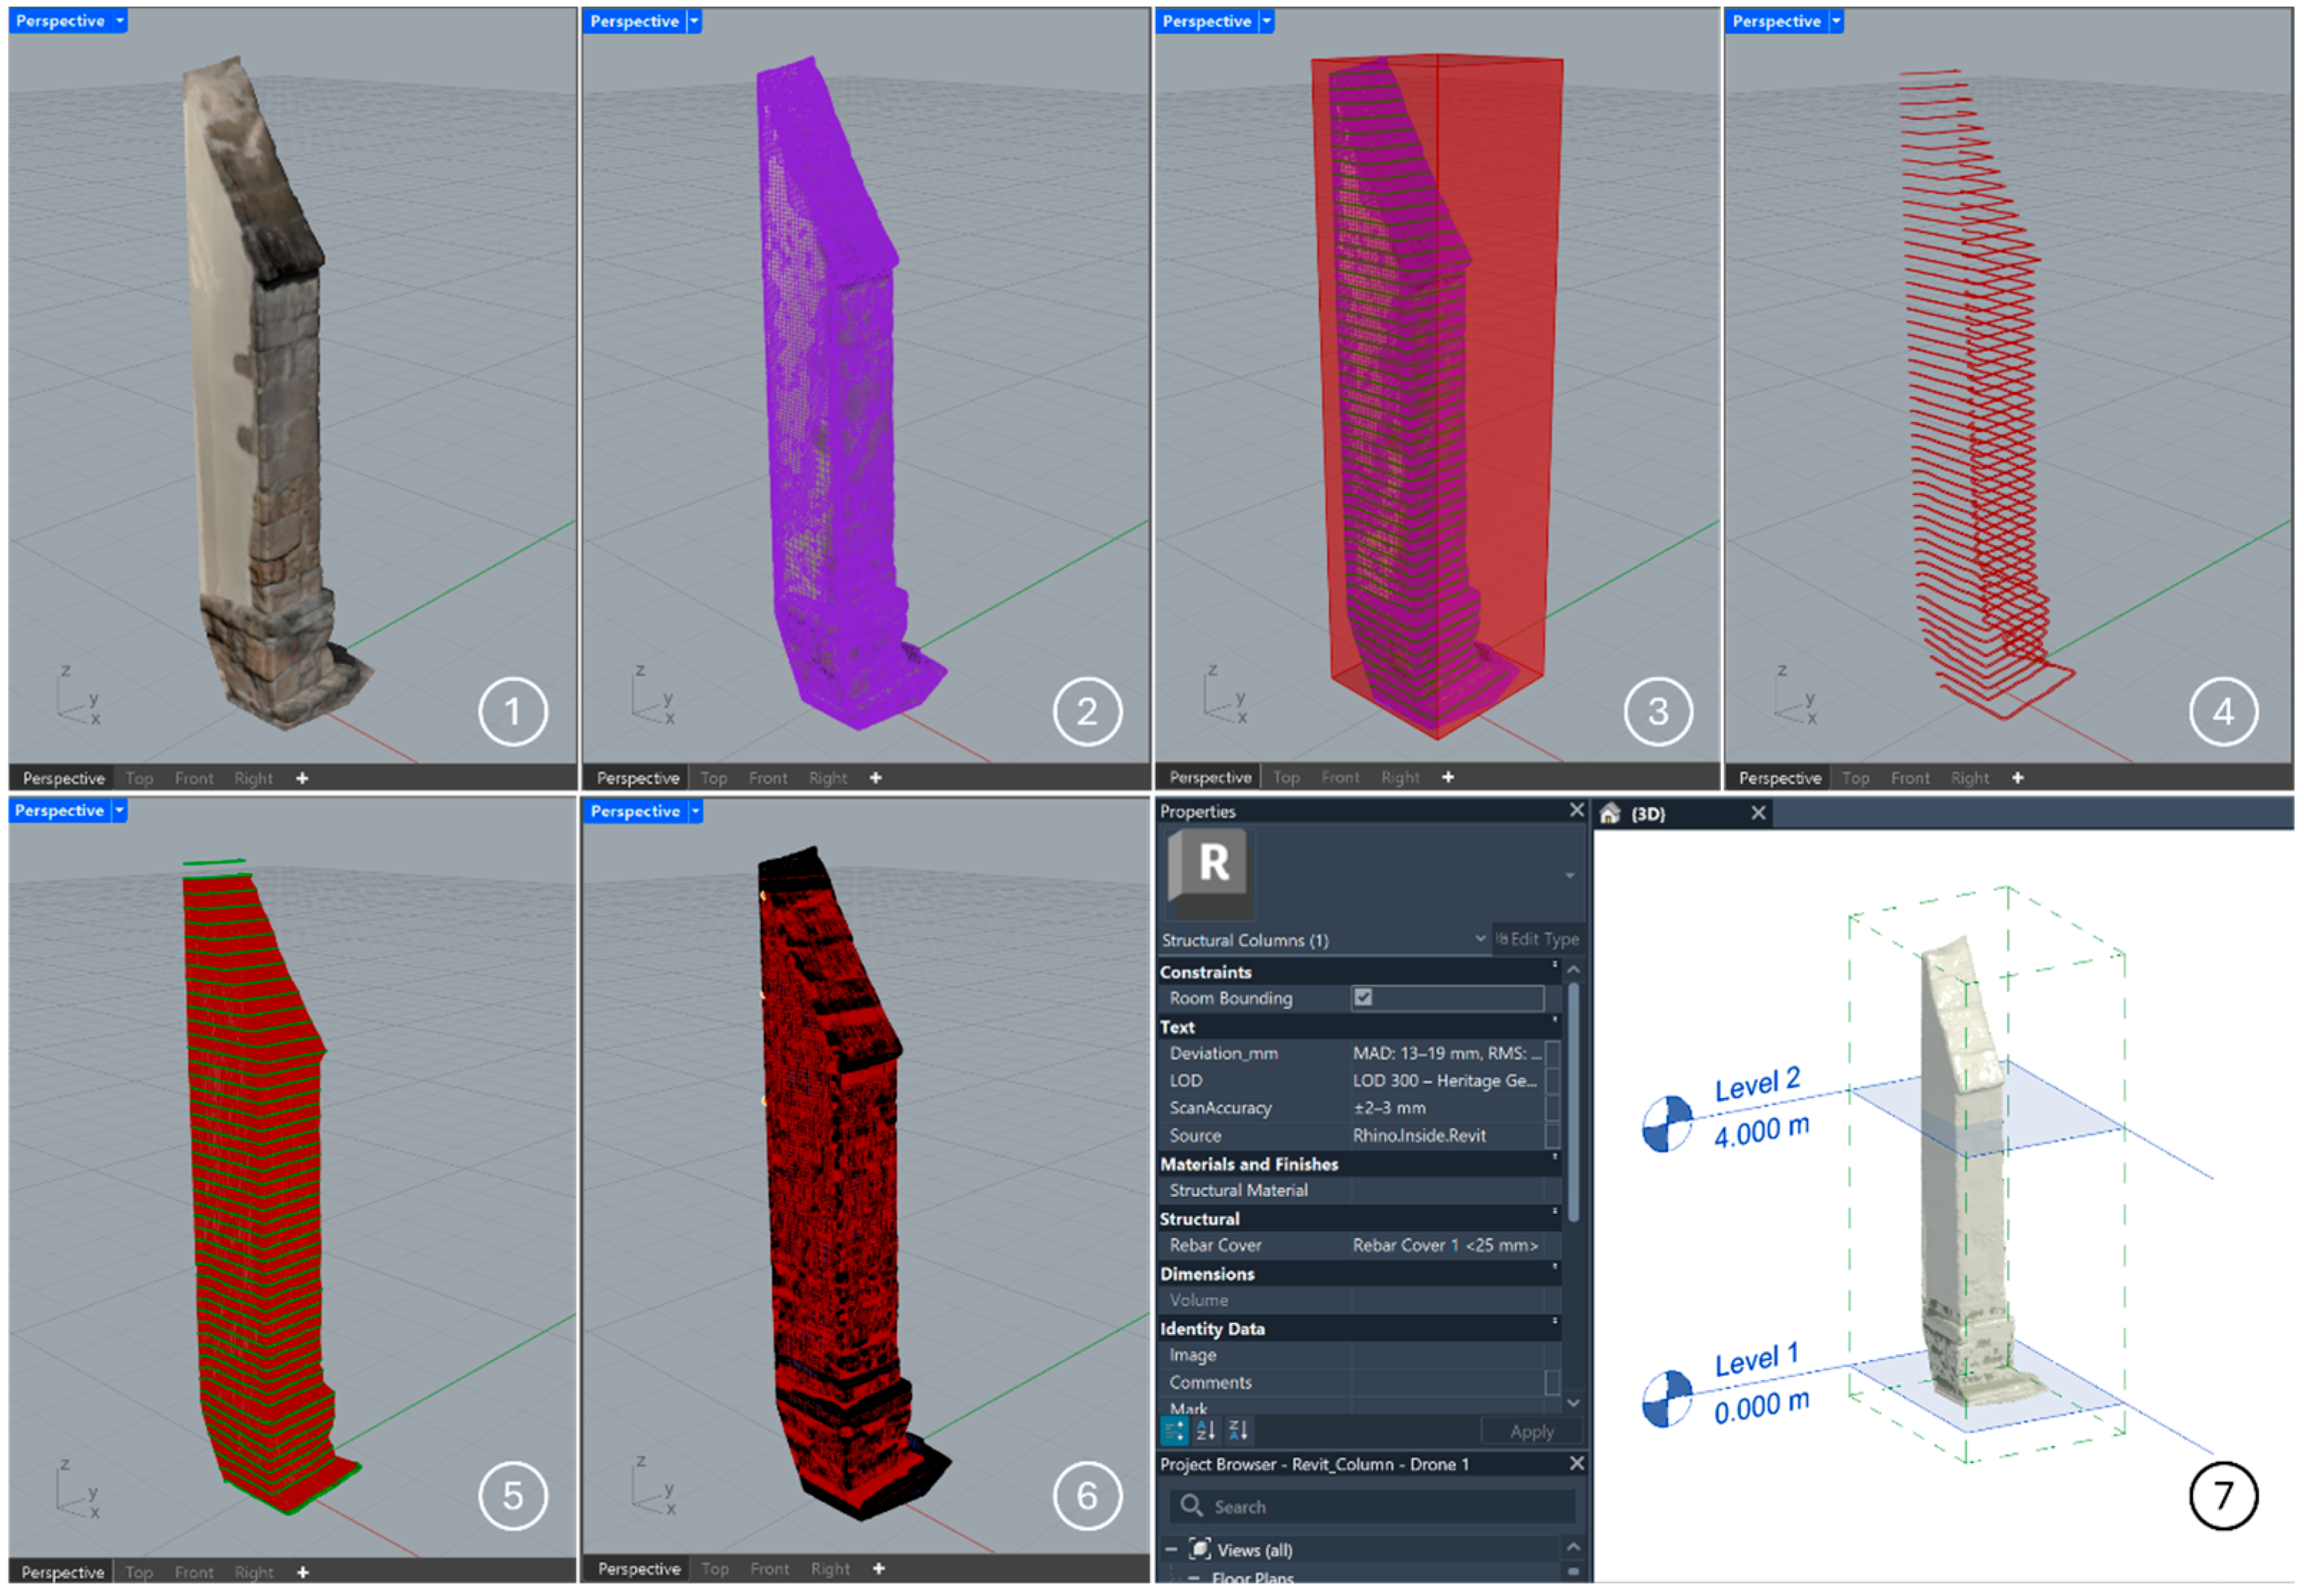
The proposed methodology introduces a semi-automated Scan-to-HBIM workflow designed to reconstruct architectural elements from classified point clouds into usable BIM geometry. It integrates the precision of point cloud processing, the geometric flexibility of Rhino, and the structured environment of Revit through Rhino.Inside.Revit. The process follows four main phases (
Figure 1).
At its core, the workflow follows the logic of Pre-Classified Modeling Logic (PCML), a structured, reusable reconstruction strategy that integrates automated geometric operations with targeted expert supervision. This combination reduces the effort associated with fully manual modeling while avoiding the instability often found in fully automated systems. A key feature of the workflow is the use of a mesh intermediary. By working with a shrinkwrapped mesh rather than millions of raw points, the workflow reduces computational load without compromising spatial accuracy, an important balance when documenting irregular historic geometries.
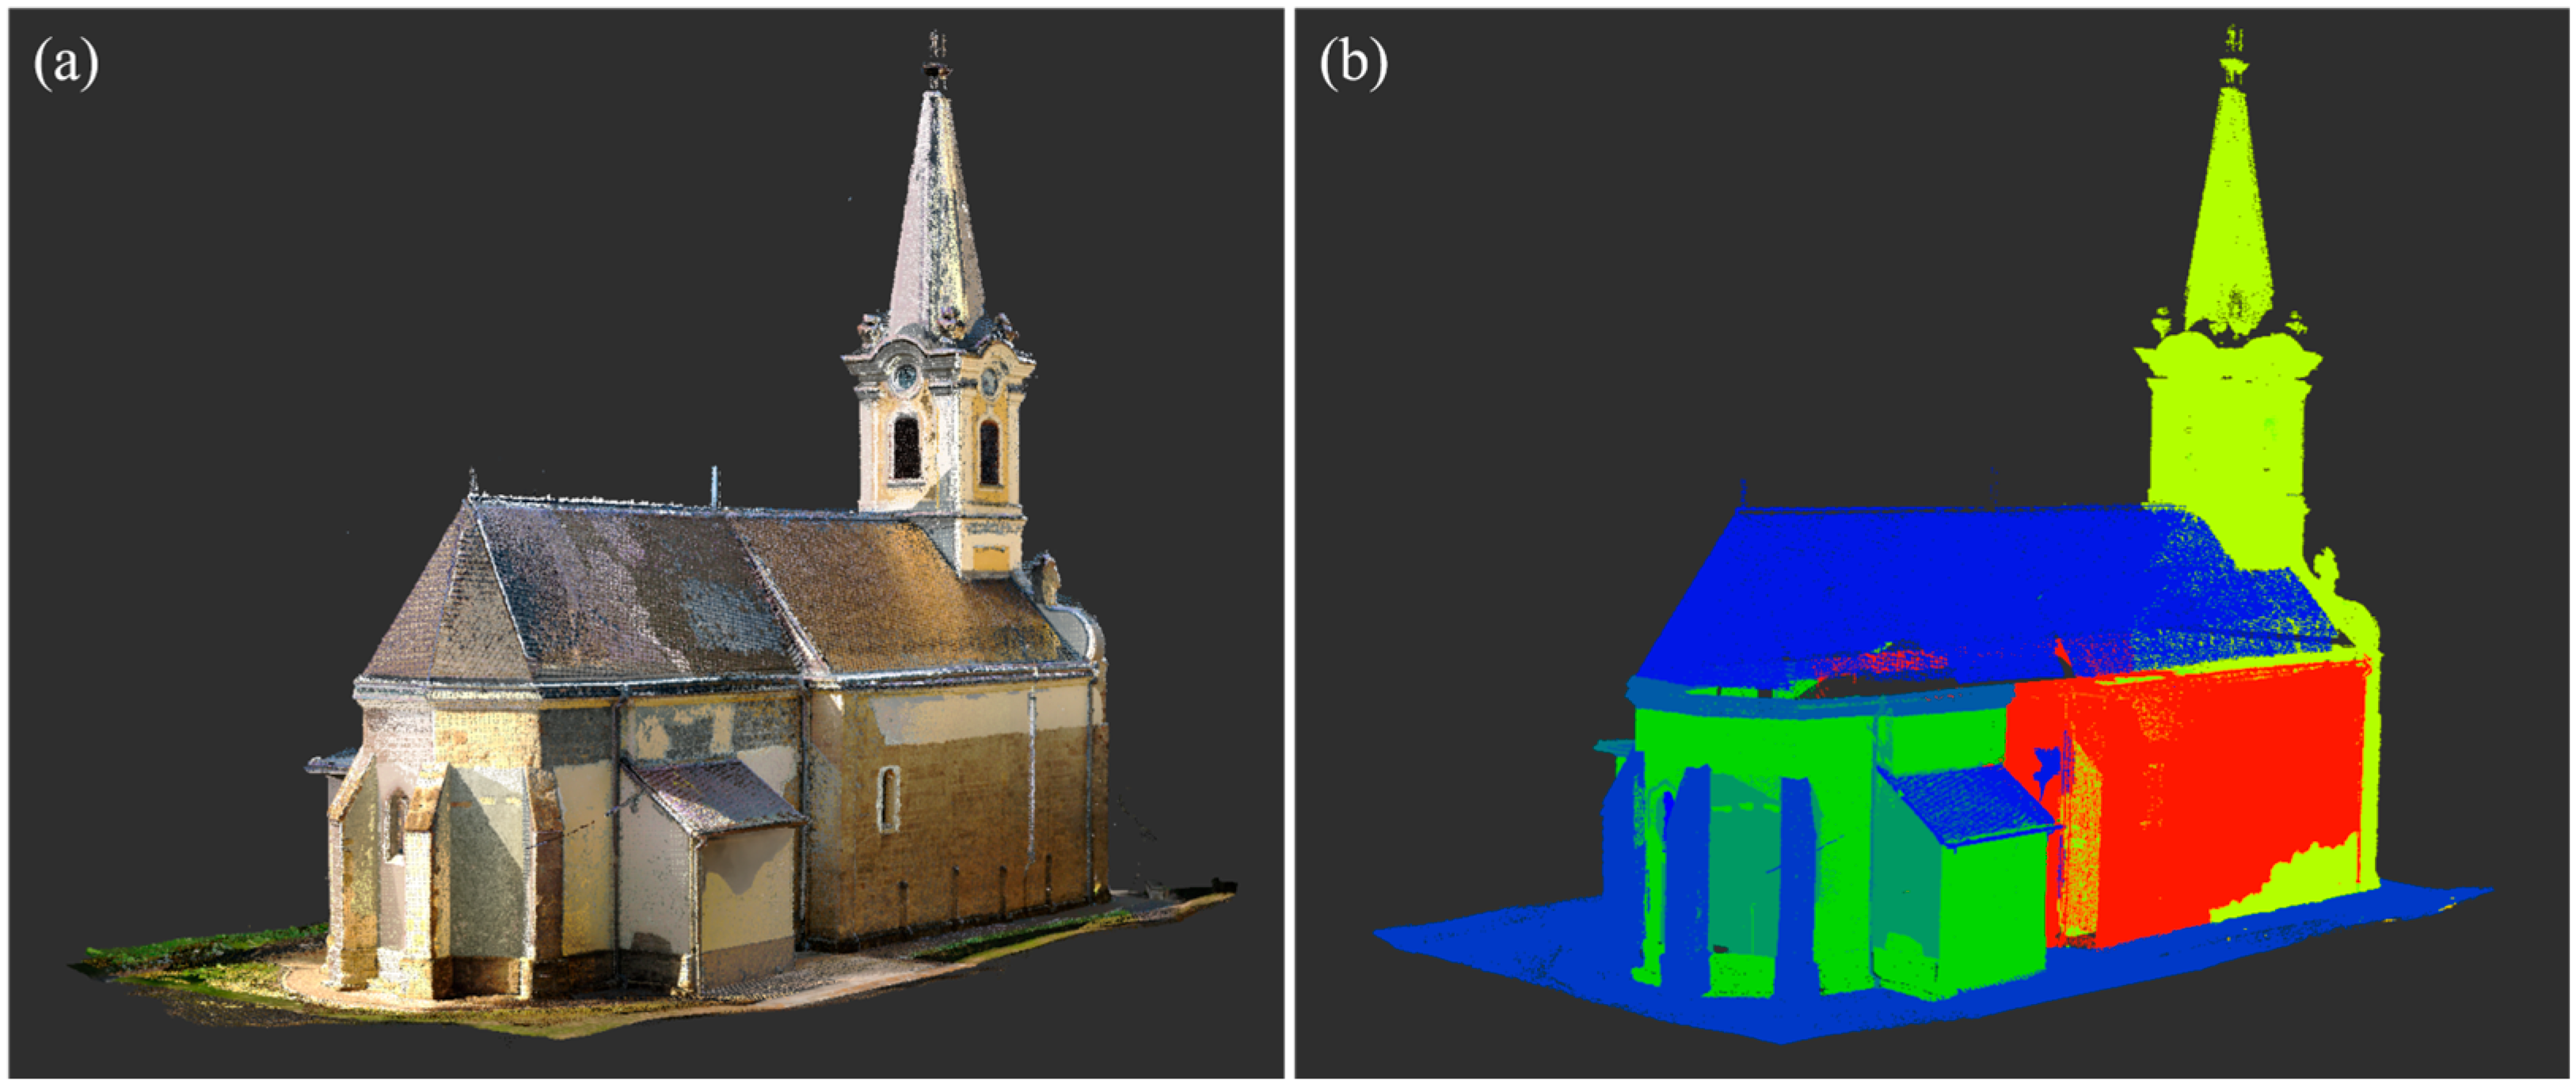
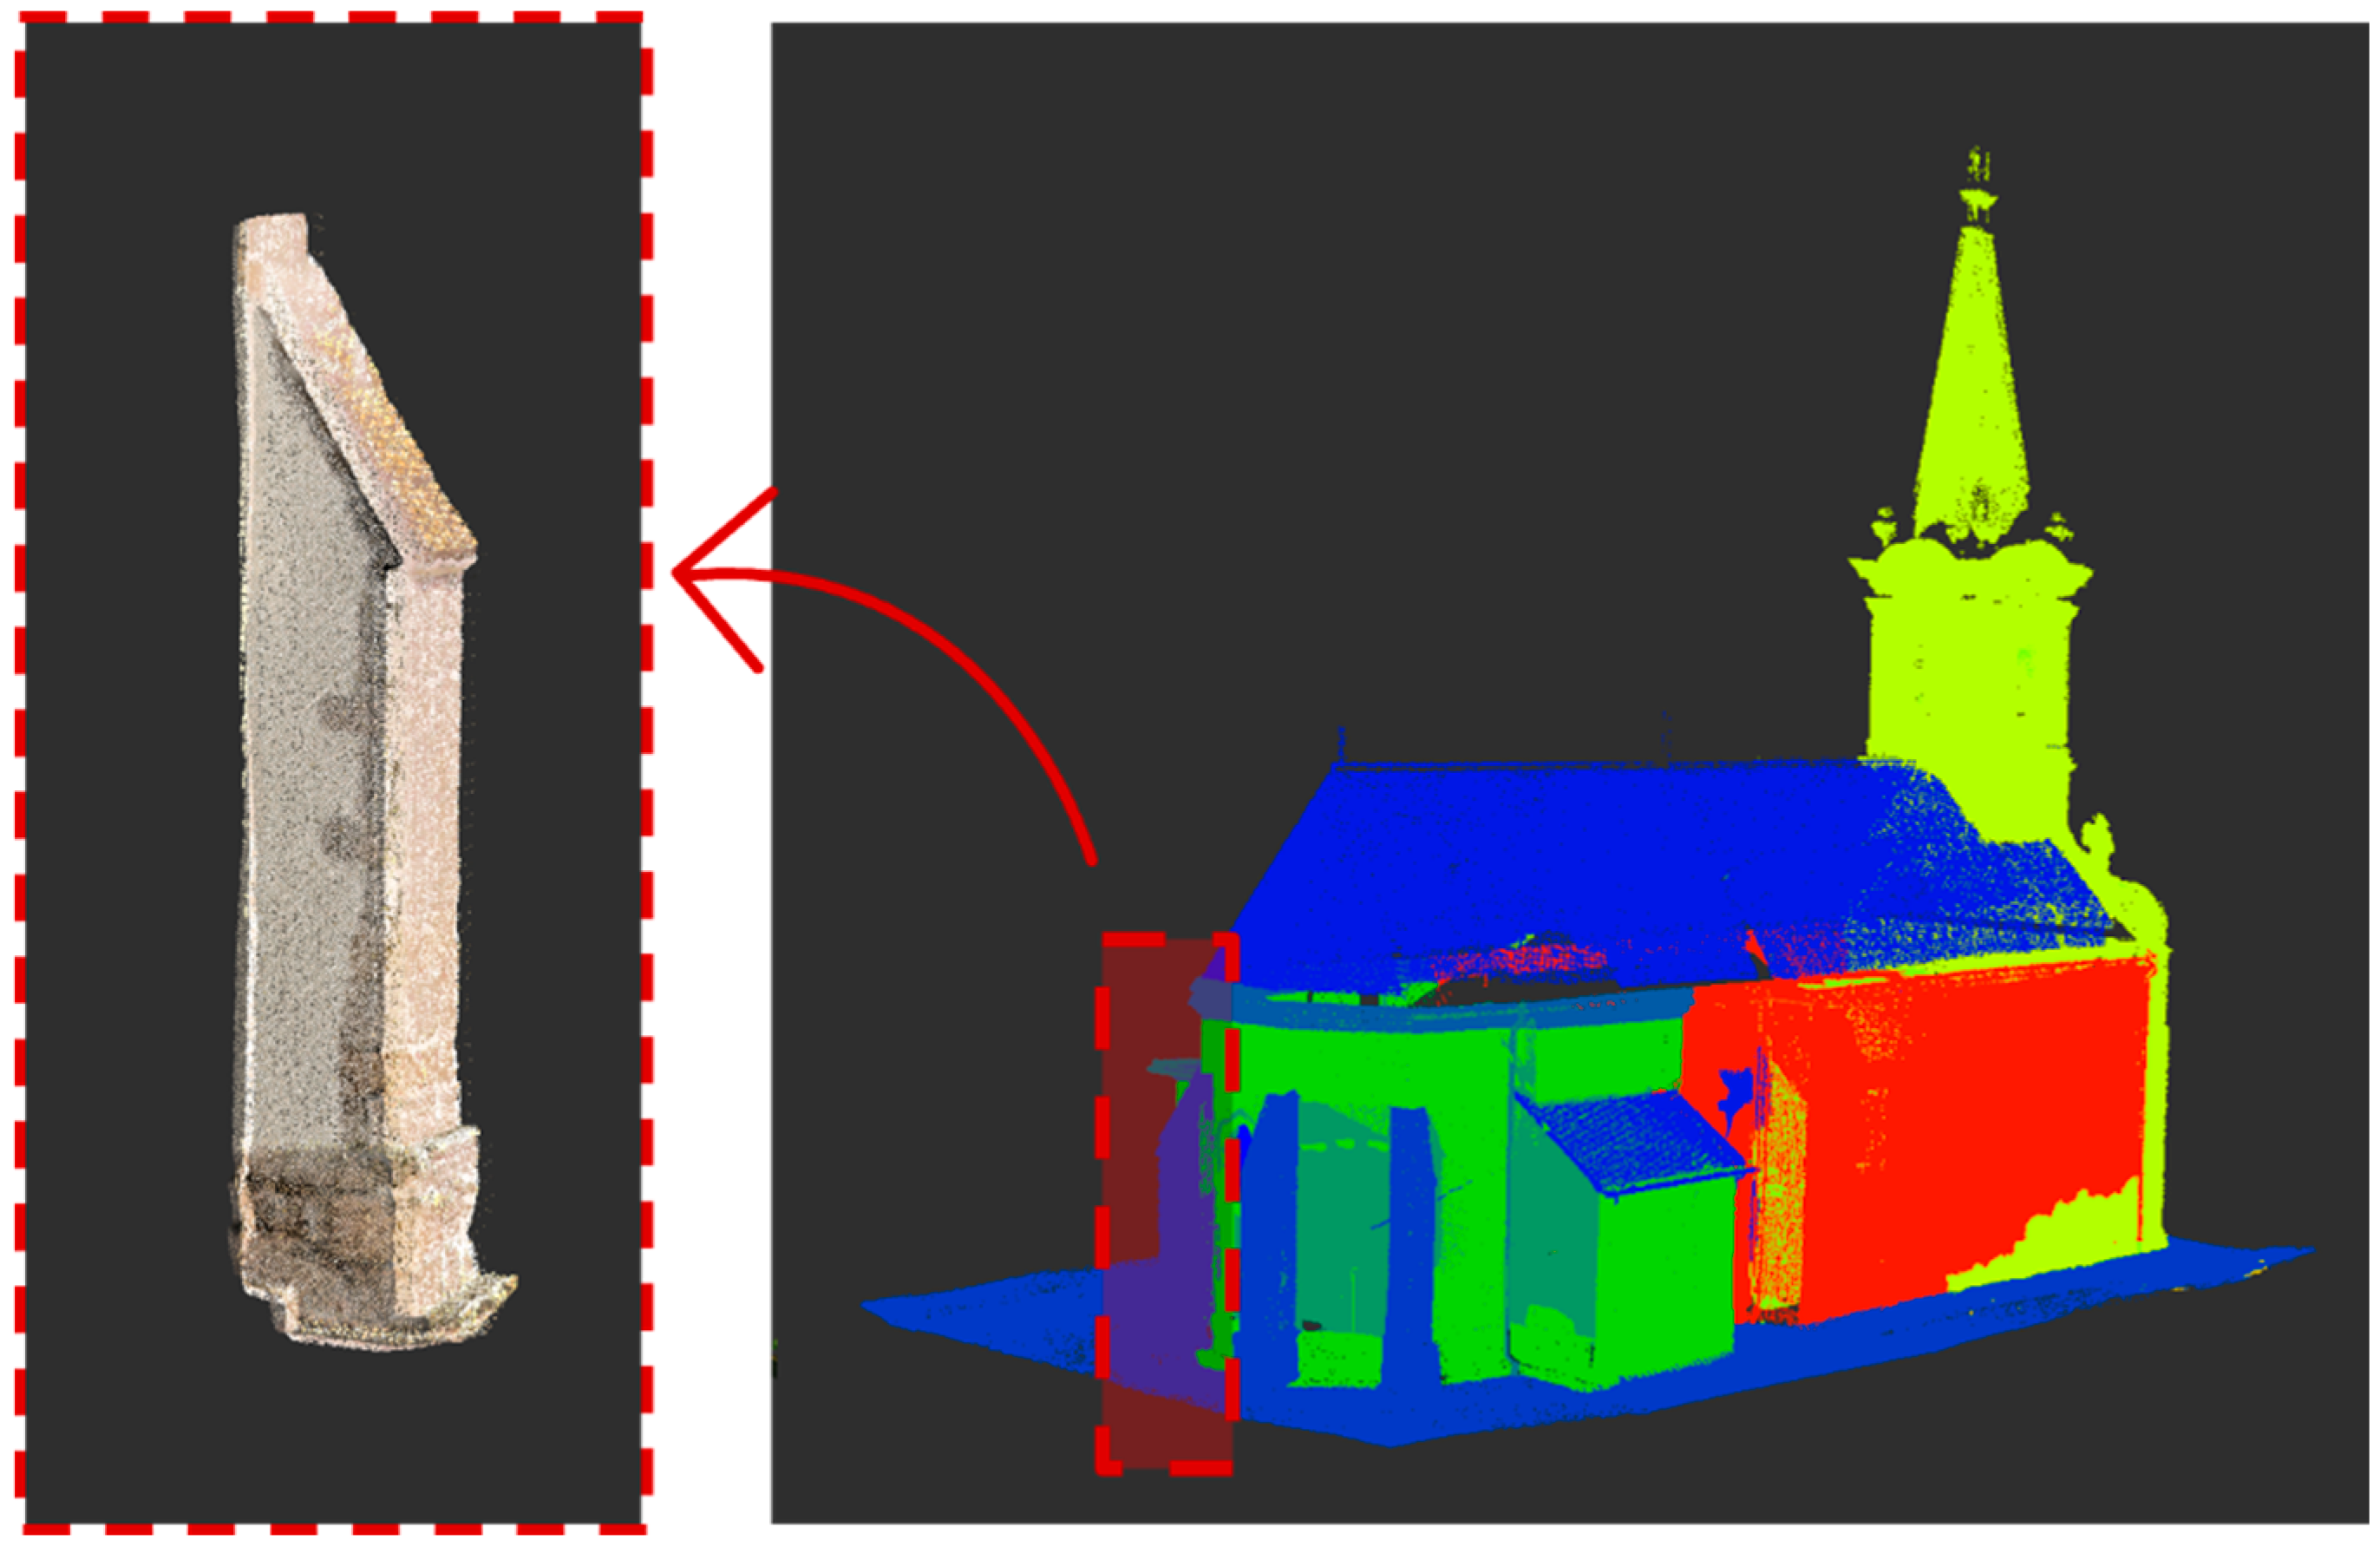
The workflow begins with pre-classified TLS point clouds, in which the raw scans have already been cleaned and segmented into architectural groups such as walls, columns, arches, and vaults. This pre-classification, carried out in CloudCompare 2.13.2 and refined manually, reduces noise and enables focused modeling of a single element by dividing the massive dataset into meaningful subsets. In this study, the point cloud dataset was already organized into element groups, enabling components such as the chapel’s columns to be handled separately and with higher efficiency (as shown in
Figure 2).
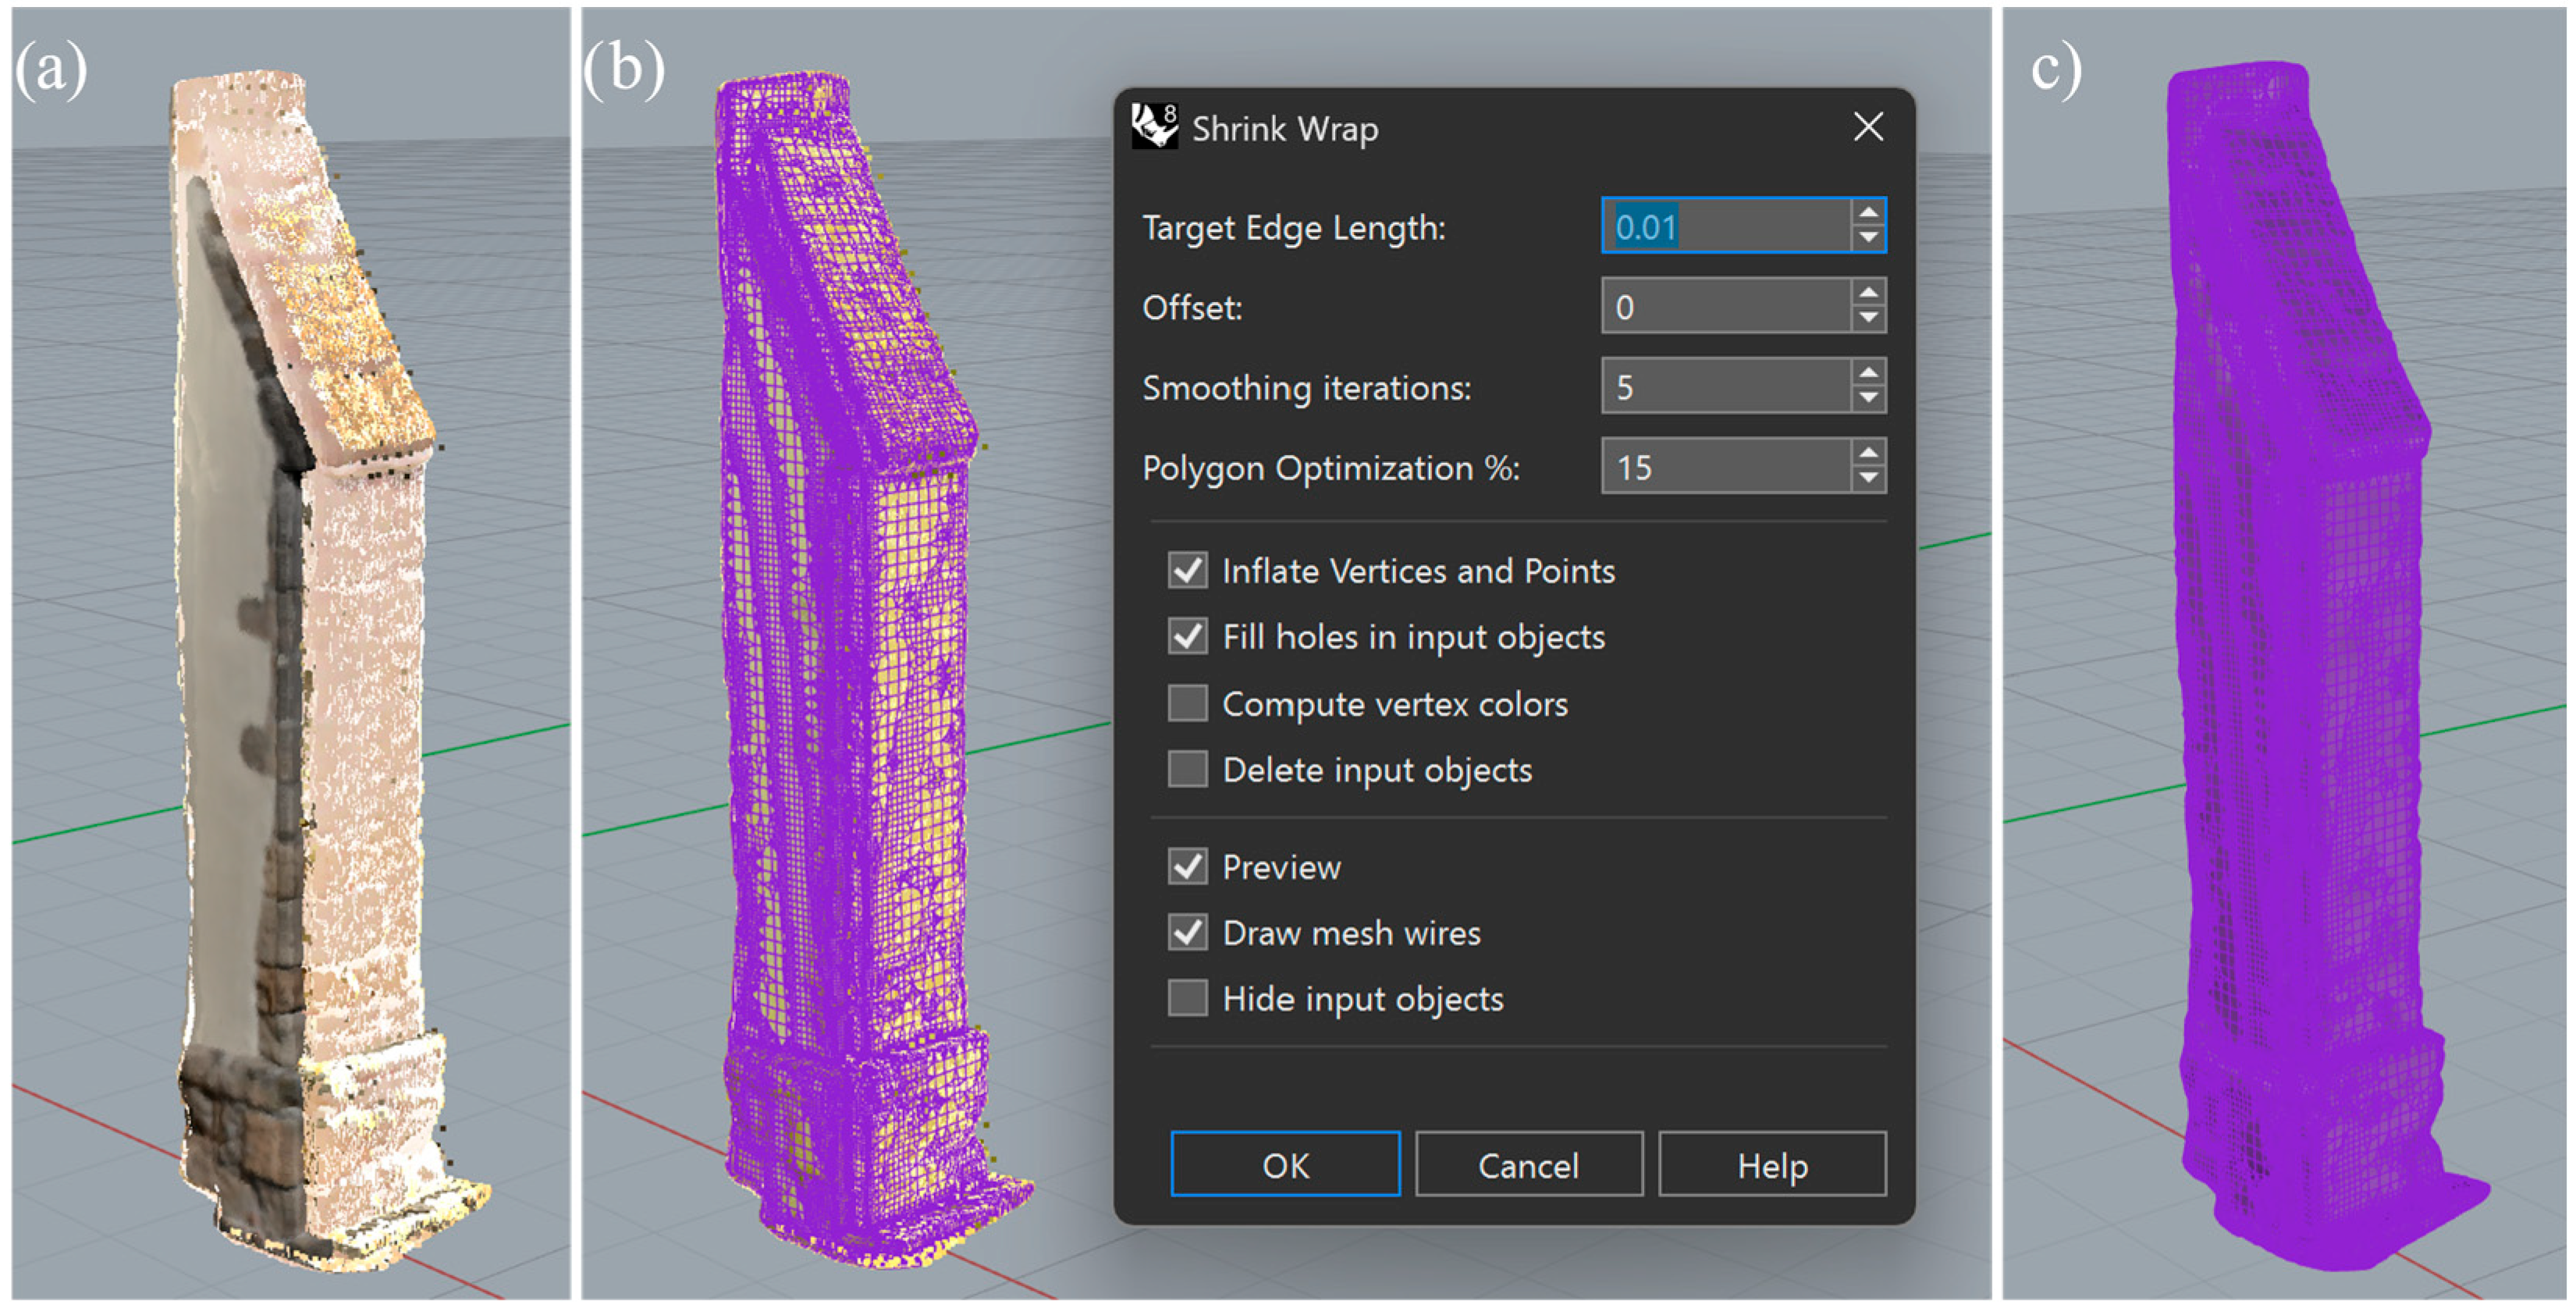
Once imported into Rhino, each classified element is converted into a mesh using the ShrinkWrap, producing a clean, watertight representation of the object. This mesh simplifies the underlying point distribution, drastically reduces vertex count, and provides a stable surface for sampling and slicing (
Figure 3). It also becomes one of the reference datasets used later in the Mesh-to-Mesh (M2M) deviation analysis, which evaluates how closely the reconstructed model matches the geometry it was built from.
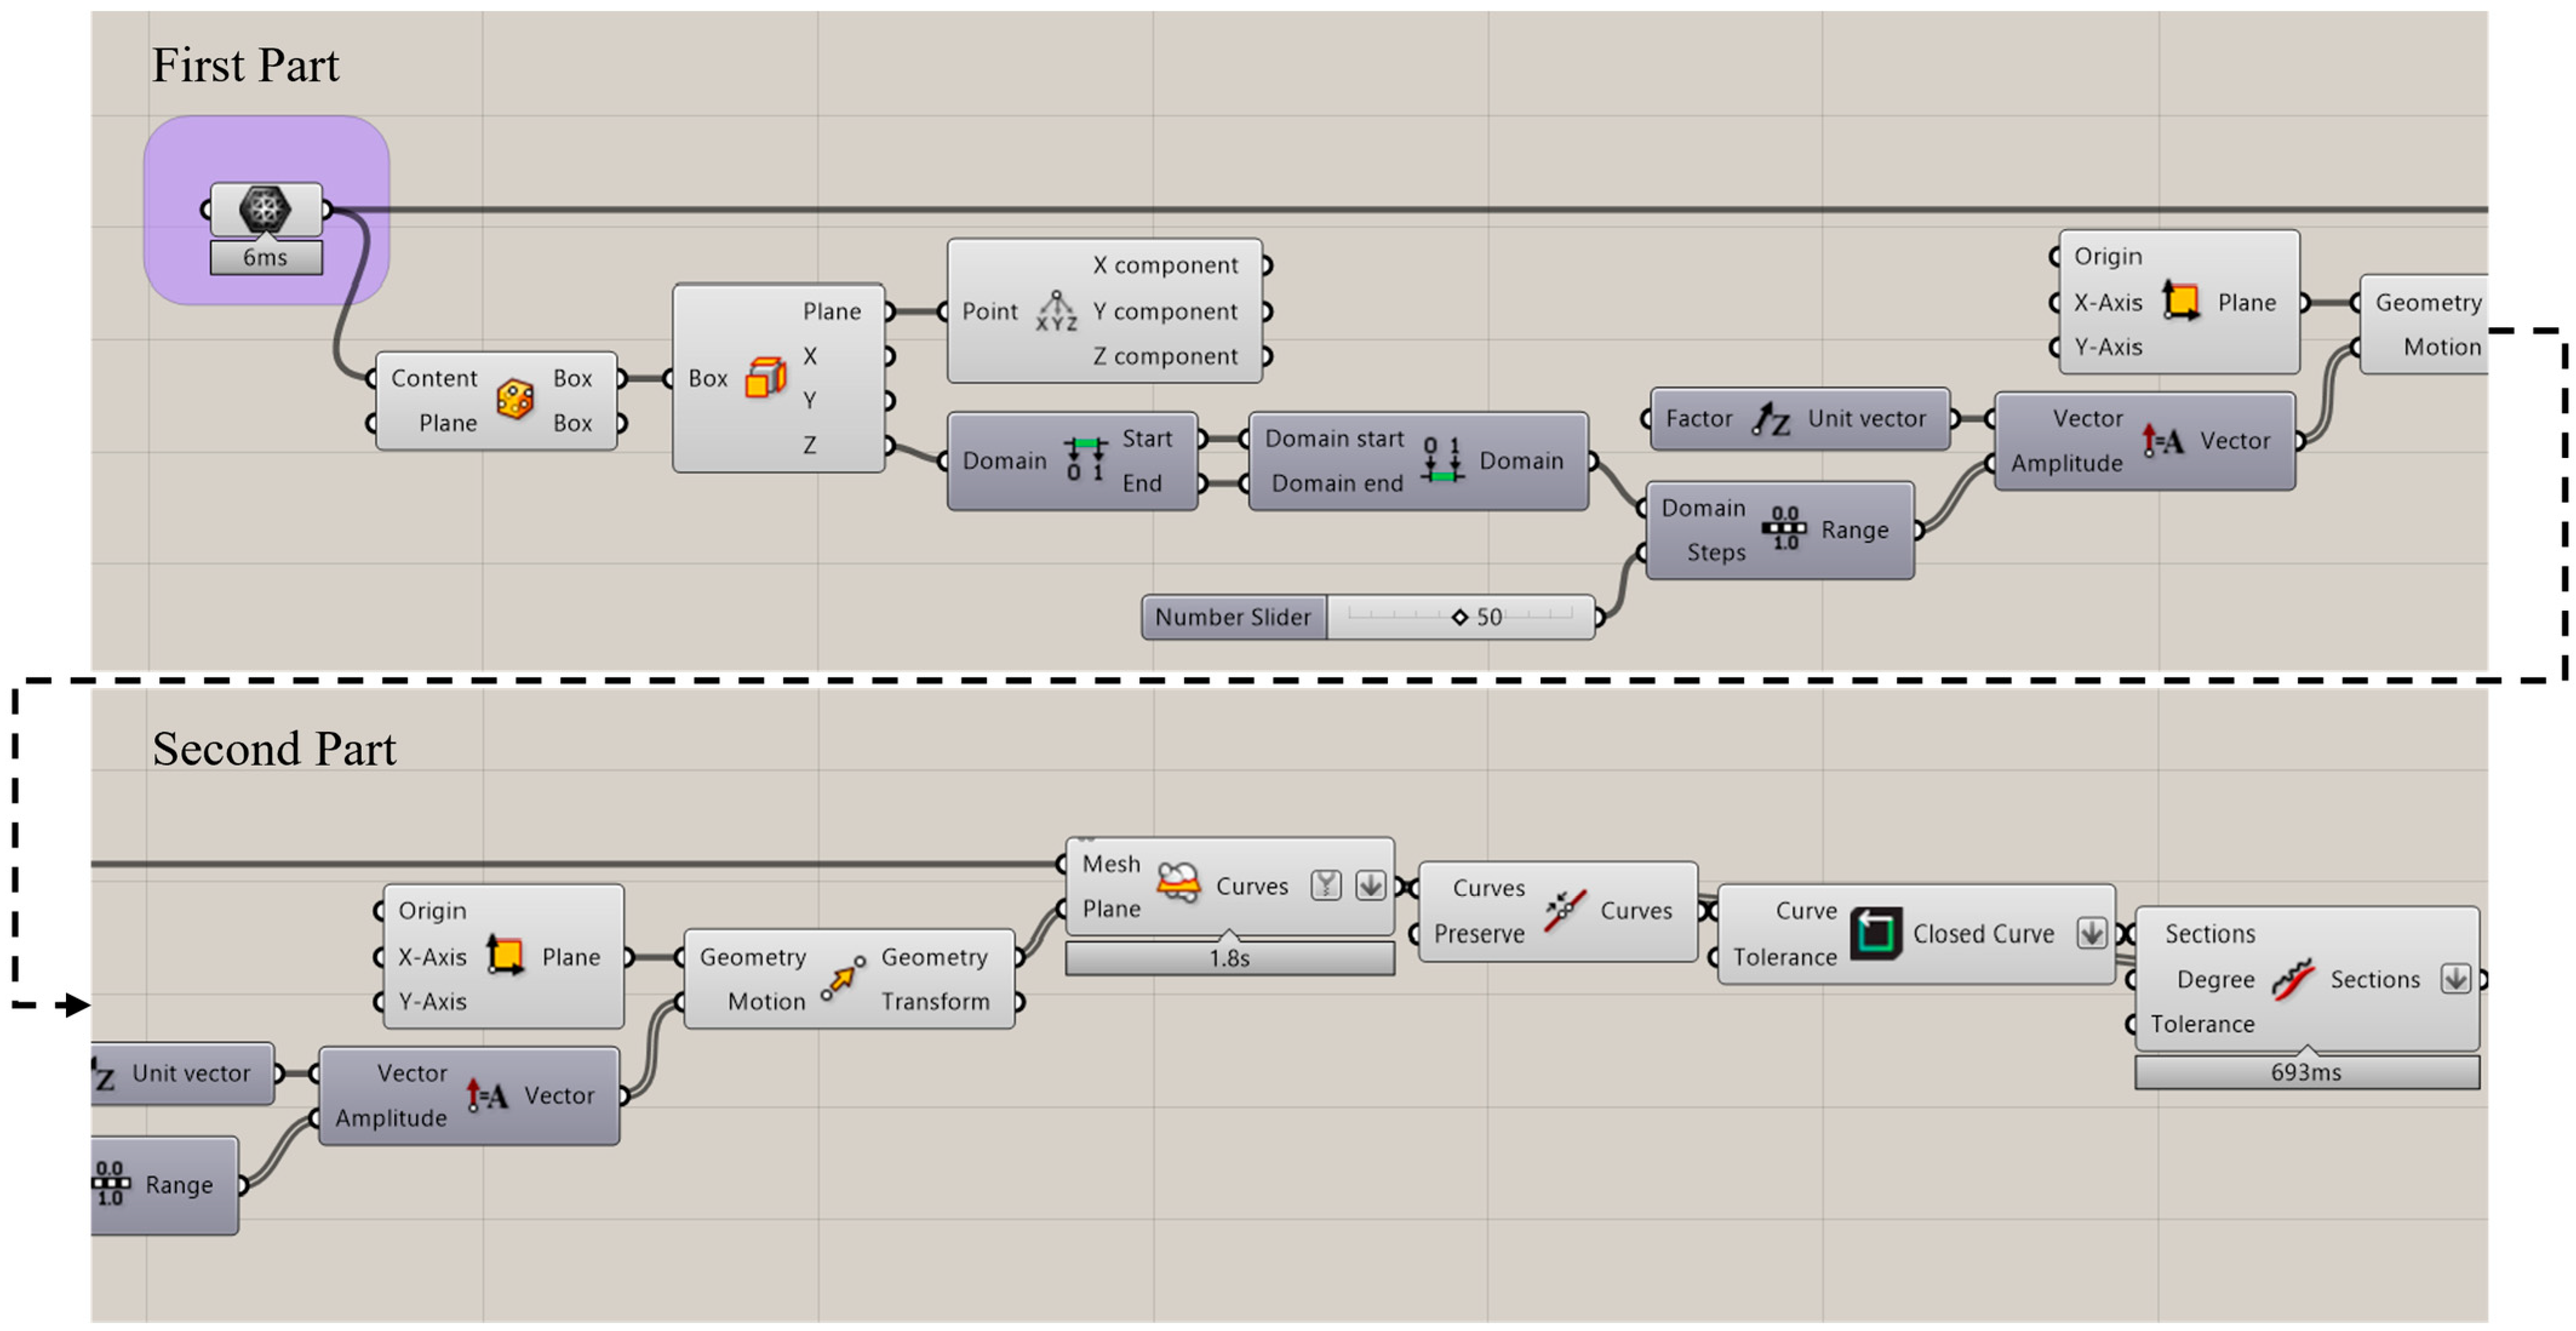
The mesh (of a single element) is then isolated with a bounding box and aligned along its local axis to establish a consistent reference system for slicing and modeling. Through Grasshopper scripts, a sequence of horizontal section planes is automatically generated to intersect the simplified mesh, with a numerical slider controlling the interval and initiating the slicing process. The definition of the sectioning interval is a guided decision, closely tied to the element’s geometric complexity and the required Level of Detail (LOD) for conservation documentation. For highly irregular elements, such as the eroded stone column in our case study, a denser interval (e.g., 10 cm) is selected to capture subtle, non-uniform variations in profile and surface erosion, features essential for accurate structural analysis and restoration planning. In contrast, more regular geometries can be represented with sparser intervals, optimizing computational efficiency while maintaining fidelity to the element’s historical form. As each section plane intersects the mesh, it extracts a contour polyline, generating a vertical sequence of cross-sections that describe the element’s evolving profile. These polylines are subsequently refined by enforcing closure, merging fragmented segments, and filtering out noise, resulting in clean, continuous outlines suitable for precise geometric reconstruction (
Figure 4).
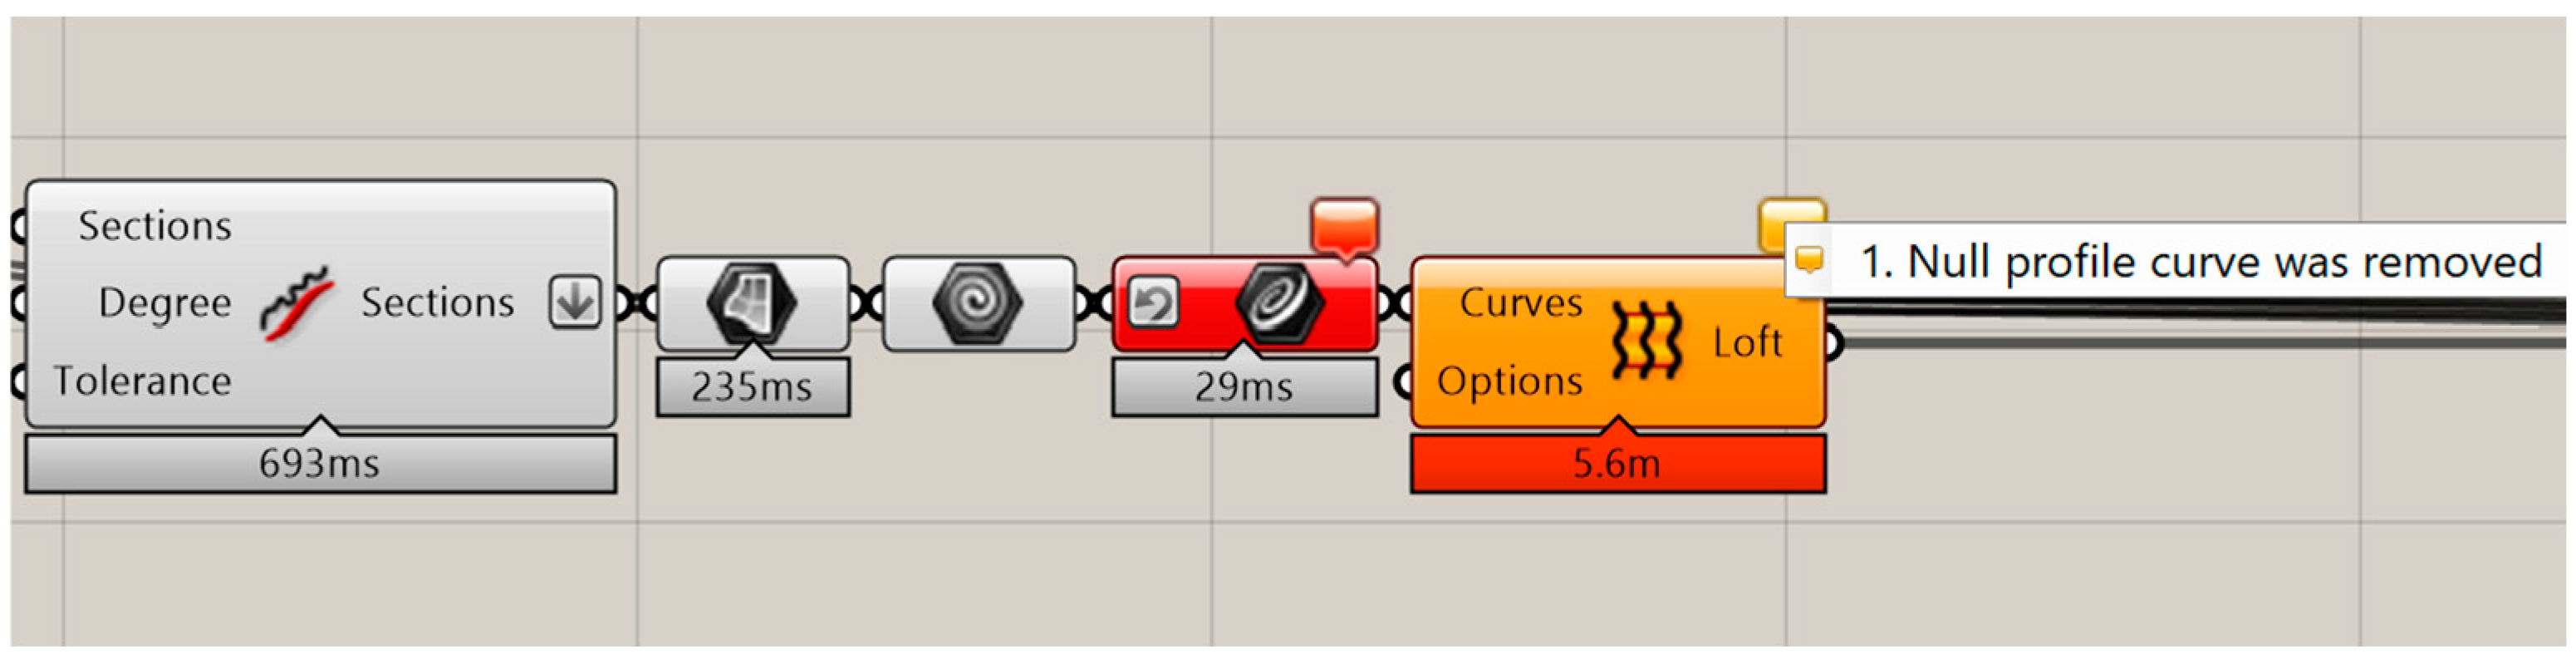
The resulting set of ordered polylines is then used to reconstruct the geometry Using Grasshopper’s Loft operation, the contours are transformed into a continuous surface that captures the main geometric character of the column, including irregularities caused by age and material erosion typical of heritage architecture. The lofted surface is solidified, joined, and meshed, which is then evaluated both visually and numerically against both the shrinkwrapped mesh (for M2M accuracy) and the original point cloud (for Cloud-to-Mesh (C2M) accuracy), ensuring that the simplification introduced during modeling remains within acceptable bounds (
Figure 5).
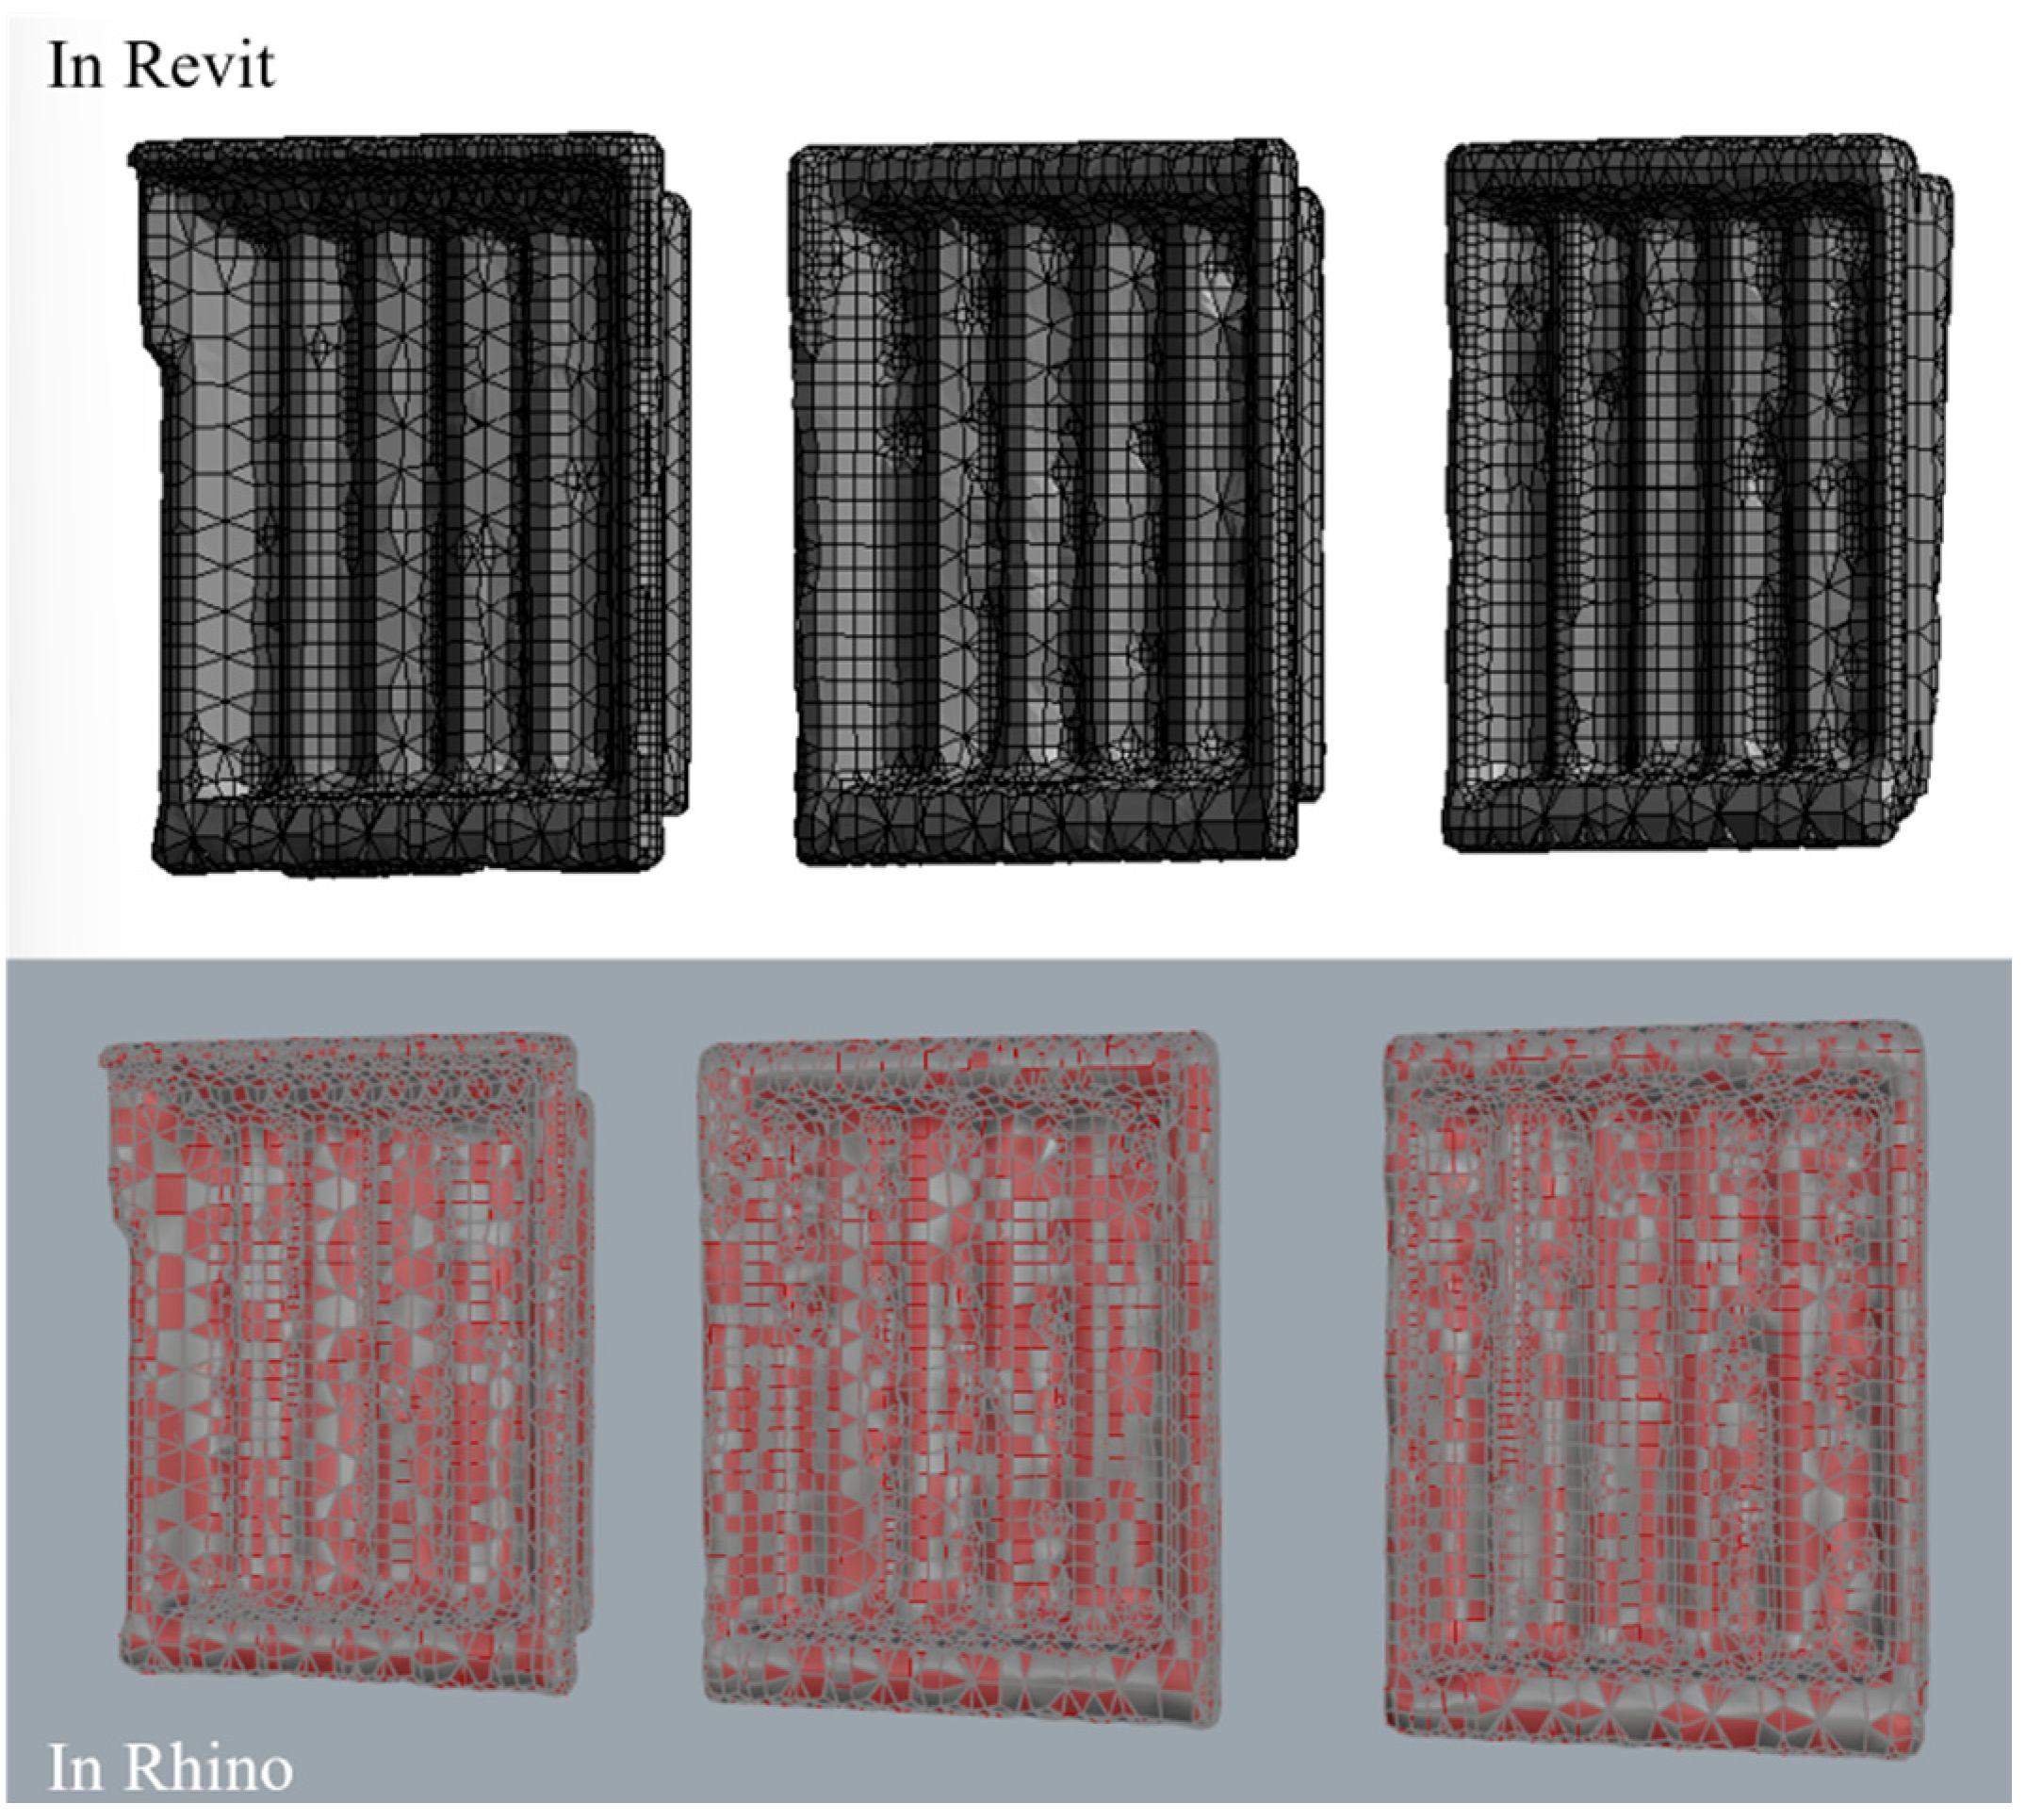
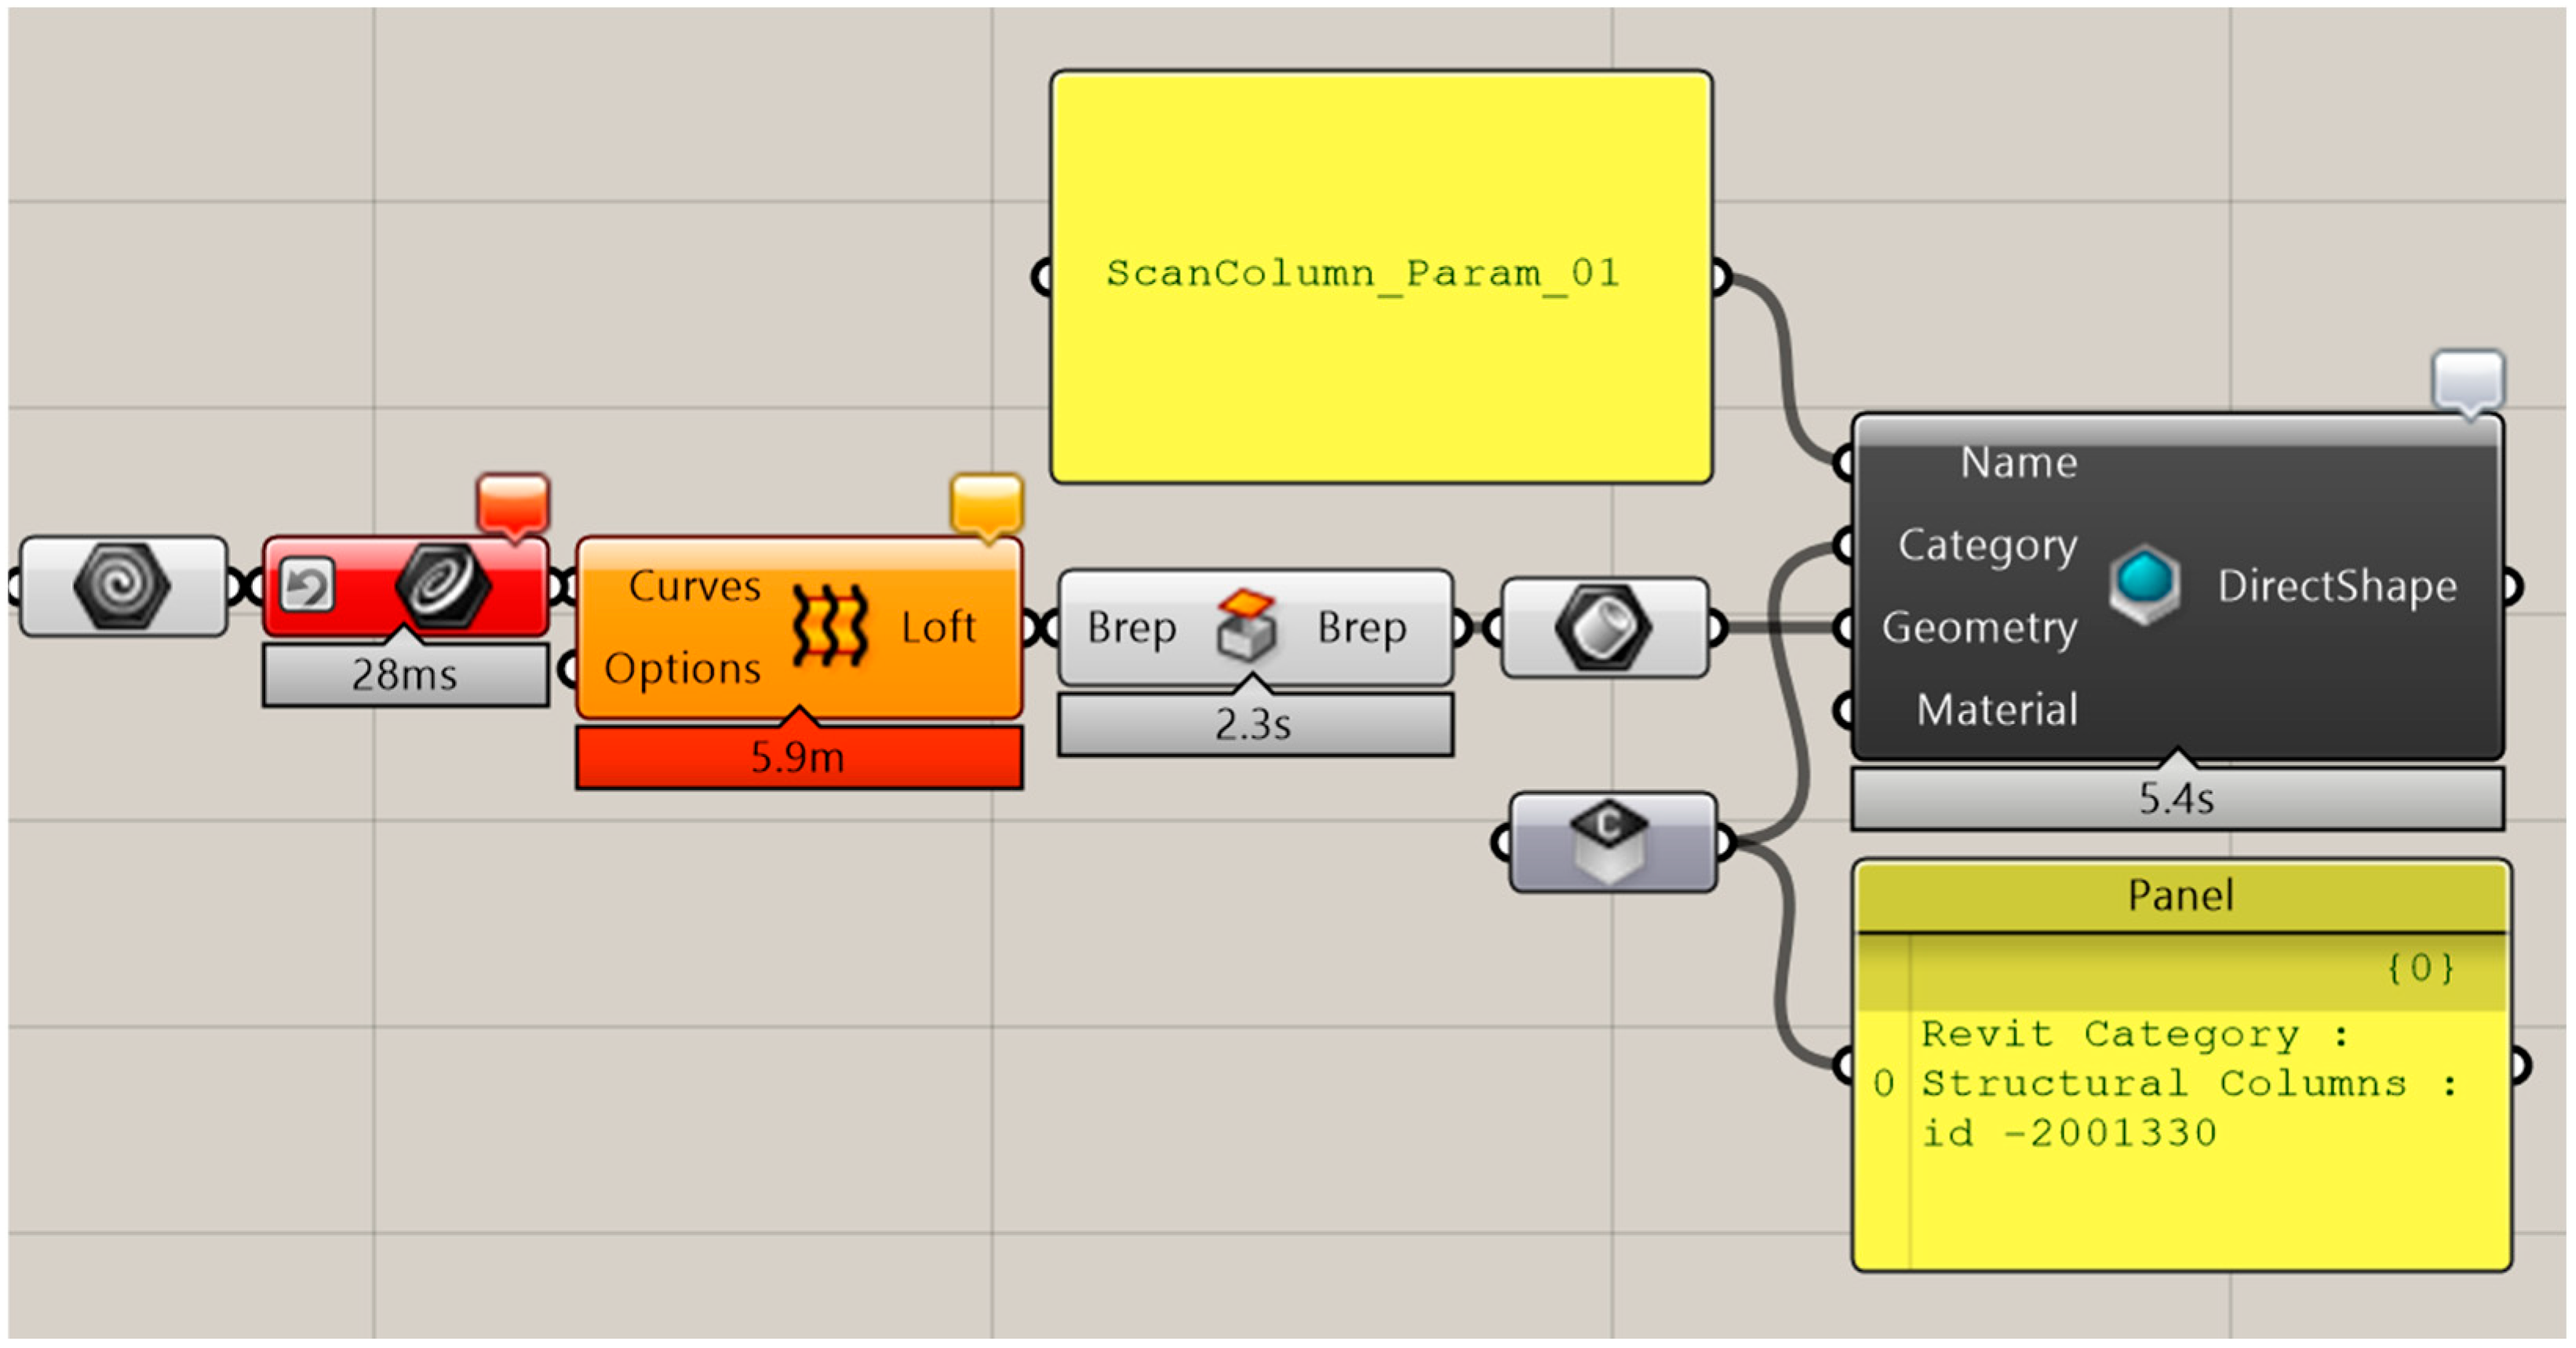
The finalized geometry is then transferred directly to Revit via the Rhino.Inside.Revit interface, which integrates Rhino and its visual scripting environment, Grasshopper, directly within Revit’s memory space. This ensures a lossless and real-time translation between geometric modeling and BIM structuring. The reconstructed element is imported as a native DirectShape element and assigned to the appropriate Revit category. Additional information, such as material type, construction era, and intended Level of Detail, can be attached to enrich the HBIM context (
Figure 6).
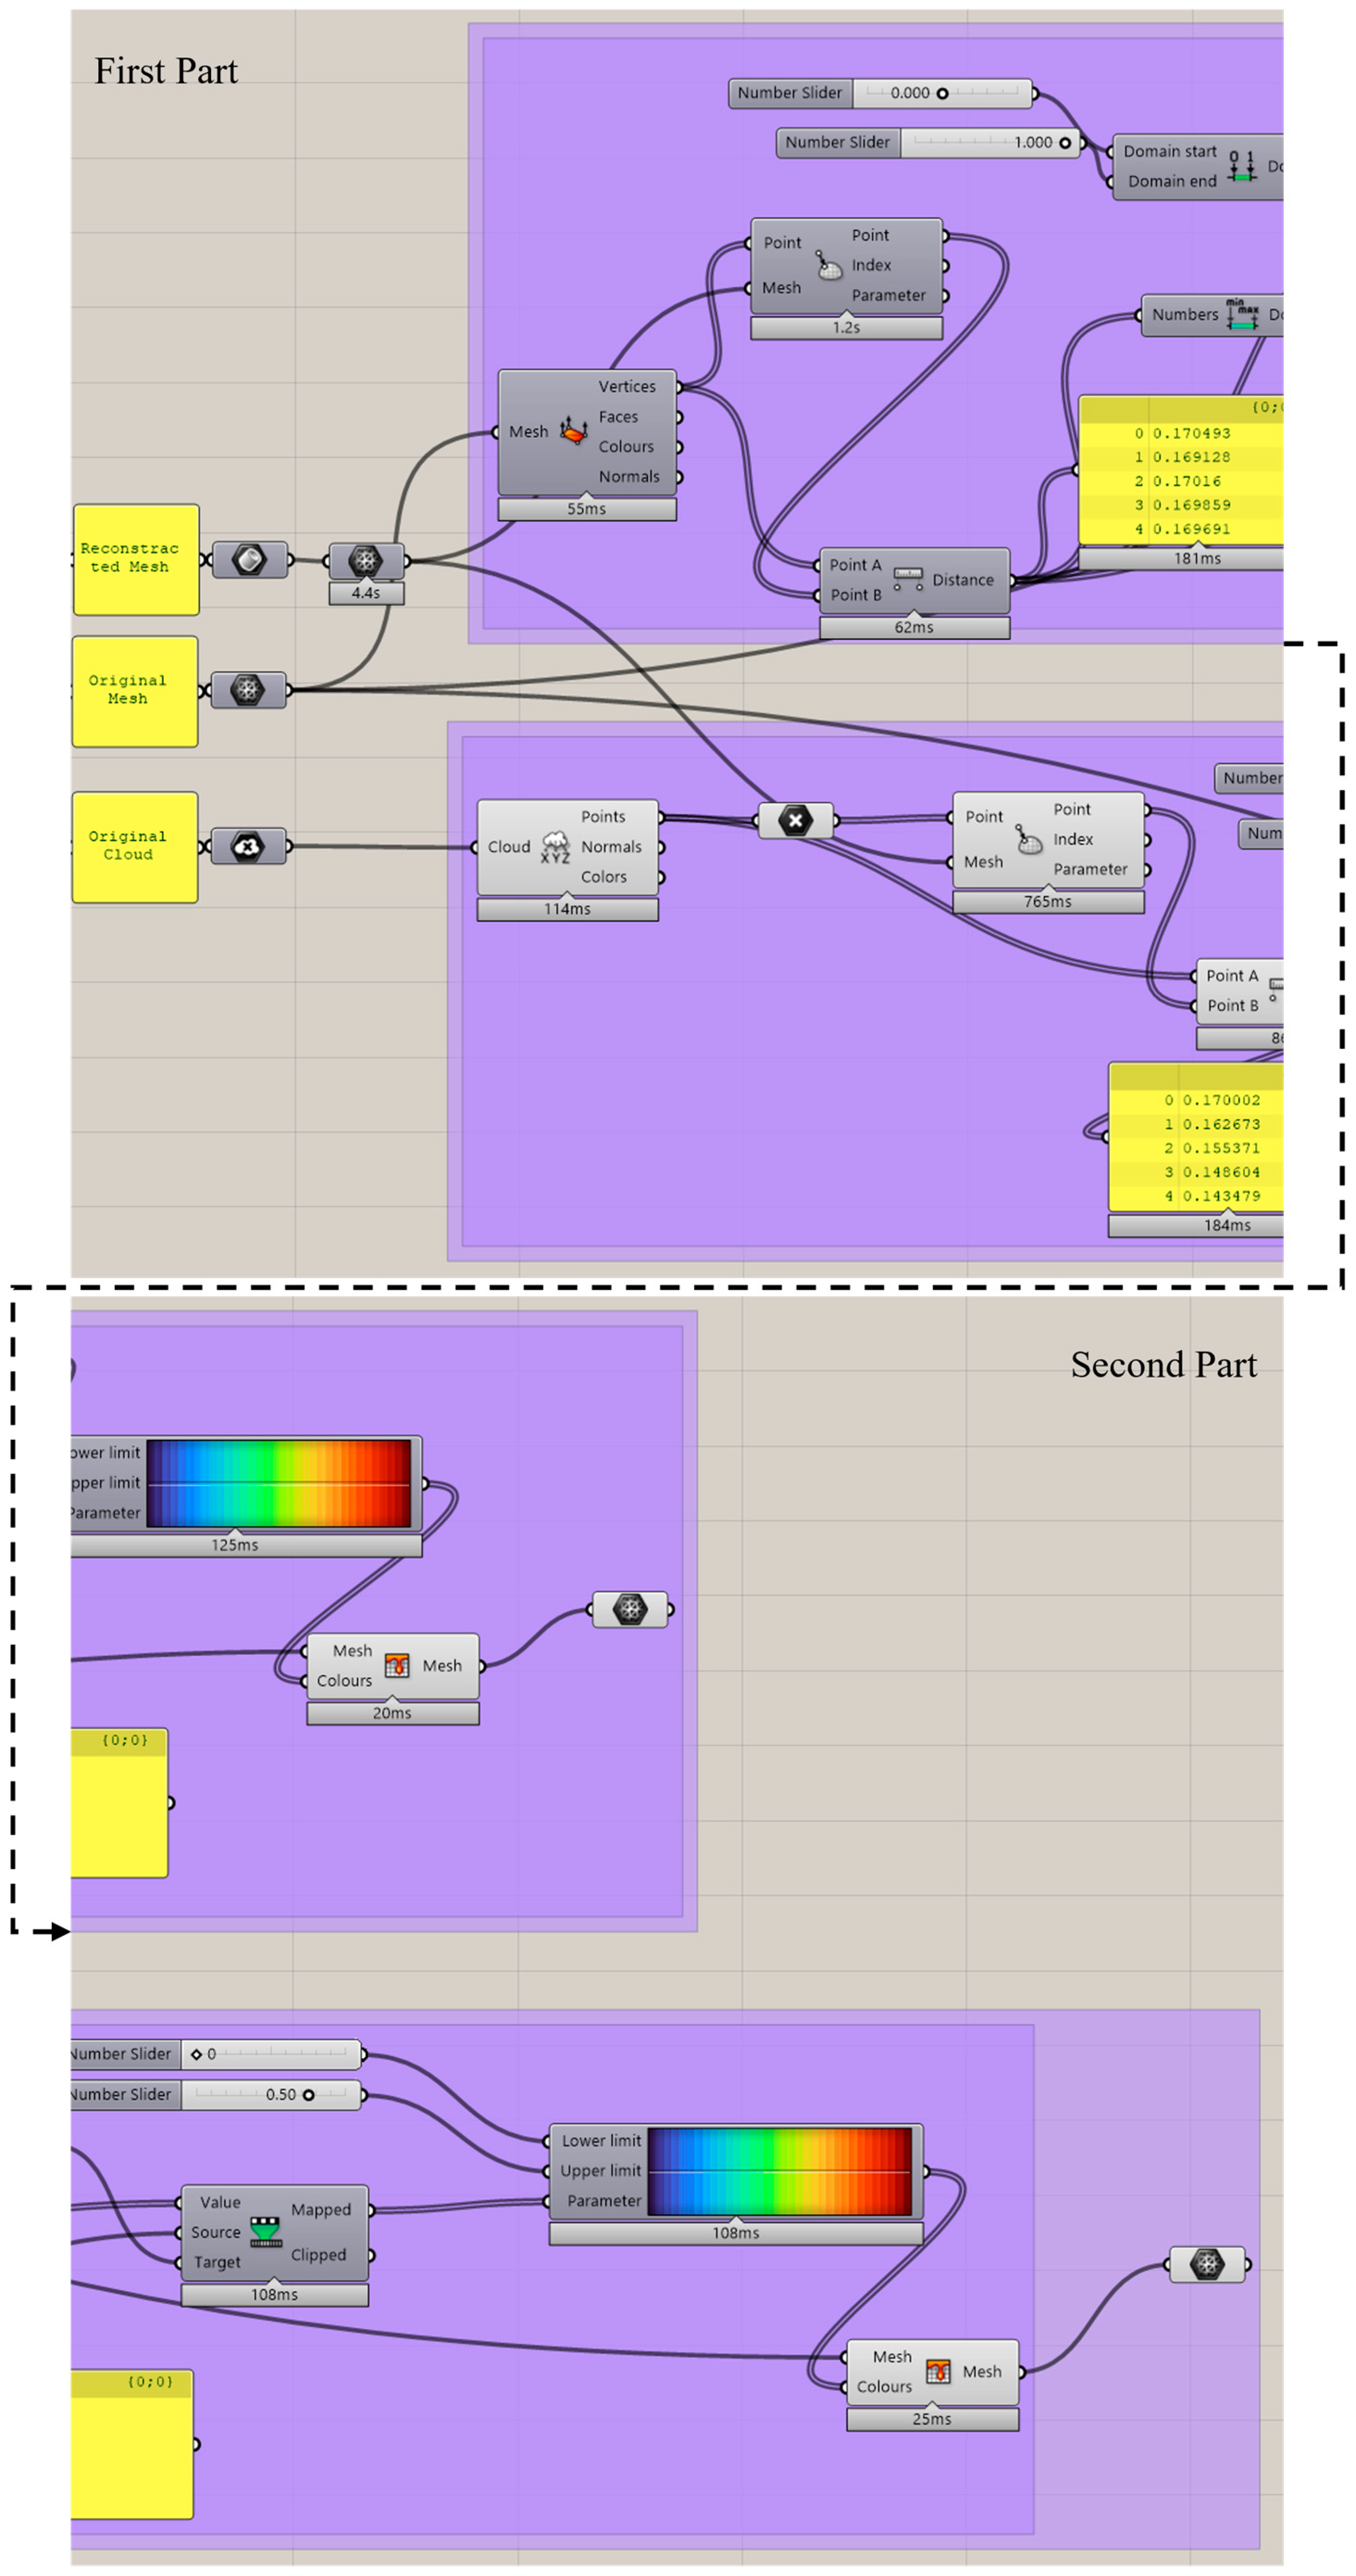
Finally, geometric validation is performed using M2M and C2M deviation analysis. The M2M comparison evaluates how closely the reconstructed geometry matches the shrinkwrapped mesh that served as the modeling intermediary, while the C2M comparison assesses agreement with the original TLS point cloud. Both analyses produce statistical indicators such as Mean Absolute Deviation (MAD), Root Mean Square Error (RMS), and Standard Deviation (σ). Together, these evaluations confirm whether the reconstruction remains within the acceptable tolerances required for heritage conservation-grade documentation (
Figure 7).
Overall, the combination of a mesh intermediary, structured PCML, and integrated deviation analysis creates a stable and repeatable workflow. Once the classified point clouds are simplified into reliable shrinkwrapped meshes, the sectioning, reconstruction, and BIM transfer follow a clear sequence that reduces manual intervention, avoids data destruction during export–import cycles, and ensures that accuracy can be consistently verified. This makes it a practical method for heritage professionals who need dependable models without relying on advanced programming skills, and supports broader objectives for accessible, sustainable digital documentation of historic architecture.
3.2. Evaluation Metrics and Deviation Analysis
The performance of the proposed workflow was assessed in terms of efficiency and geometric accuracy, two aspects that directly influence the usefulness of the approach in real heritage documentation scenarios. Efficiency measures the time required to reconstruct a single architectural element, from importing the classified point cloud, generating a shrinkwrapped mesh in Rhino, processing it in Grasshopper, and transferring it into Revit. Accuracy measures how closely the reconstructed geometry follows the real scanned surface and was examined through deviation analysis using both the mesh representation and the full point cloud.
Using two reference datasets allowed the evaluation to distinguish between (1) how well the reconstruction follows the simplified mesh used during modeling (M2M) and (2) how well it follows the original TLS point cloud (C2M). This dual assessment allows the workflow to be evaluated both on internal consistency and on real-world accuracy.
3.2.1. Deviation Analysis (M2M and C2M)
To assess the accuracy of the reconstructed geometry , two deviation analyses were carried out: M2M and C2M. Both analyses followed the same computational procedure, differing only in reference dataset used.
In M2M, corresponding to Distance 1, the shrinkwrapped mesh generated from the classified point cloud served as the reference.
In C2M, corresponding to Distance 2, the original TLS point cloud was used instead. This step evaluates how well the final reconstruction represents the actual scanned surface, including fine irregularities and weathered details that are not fully captured in the shrinkwrap.
For each point in reference cloud or mesh, the shortest distance to the surface of the reconstructed geometry was calculated. These distances represent the local difference between the reconstructed geometry and the reference, with positive values indicating areas where the scan lies outside the model surface and negative values indicating areas where the model exceeds the reference.
A color-coded deviation heatmap was generated in Grasshopper to visualize these differences. Using the Gradient component, with adjustable upper and lower limits to reduce the influence of minor scan noise. This visualization made it possible to identify where the lofted geometry followed the scanned profiles closely and where expected variations occurred due to surface wear or geometric irregularities.
By combining both M2M and C2M comparisons ensures that the evaluation captures not only how well the reconstruction matches its modeling reference but also how accurately it reflects the real scanned geometry.
3.2.2. Statistical Performance Indicators
To provide a numerical description of the deviations, four statistical indicators were computed for both M2M and C2M datasets. These indicators describe the magnitude, distribution, and direction of the deviations, which lead to understanding the general size of the differences, their spread, and whether the model shifts consistently in one direction.
Provides the average absolute distance between the reconstruction and the reference surface.
- 2.
Root Mean Square (RMS) Error
Gives a value influenced more strongly by larger deviations, Useful for identifying local geometric variances (e.g., erosion zones or irregular edges).
- 3.
Standard Deviation ()
Measures of how wide deviations are spread around the mean deviation, showing how consistent the reconstruction is across the entire element.
- 4.
Mean Deviation ()
Indicates whether the reconstructed geometry tends to be slightly undersized or oversized relative to the reference.
Together, these numerical metrics and the visual heatmap form a clear validation framework. They confirm whether the simplification introduced by shrinkwrapped meshing, slicing, and loft-based reconstruction remains within acceptable tolerances for heritage HBIM documentation. This combination of time measurement, numerical deviation metrics, and visual inspection creates a balanced and practical evaluation method. It demonstrates that the proposed workflow can produce reliable Scan-to-HBIM geometry while reducing the amount of manual effort normally required from the operator.
4. Case Study and Implementation: Chapel Column Reconstruction
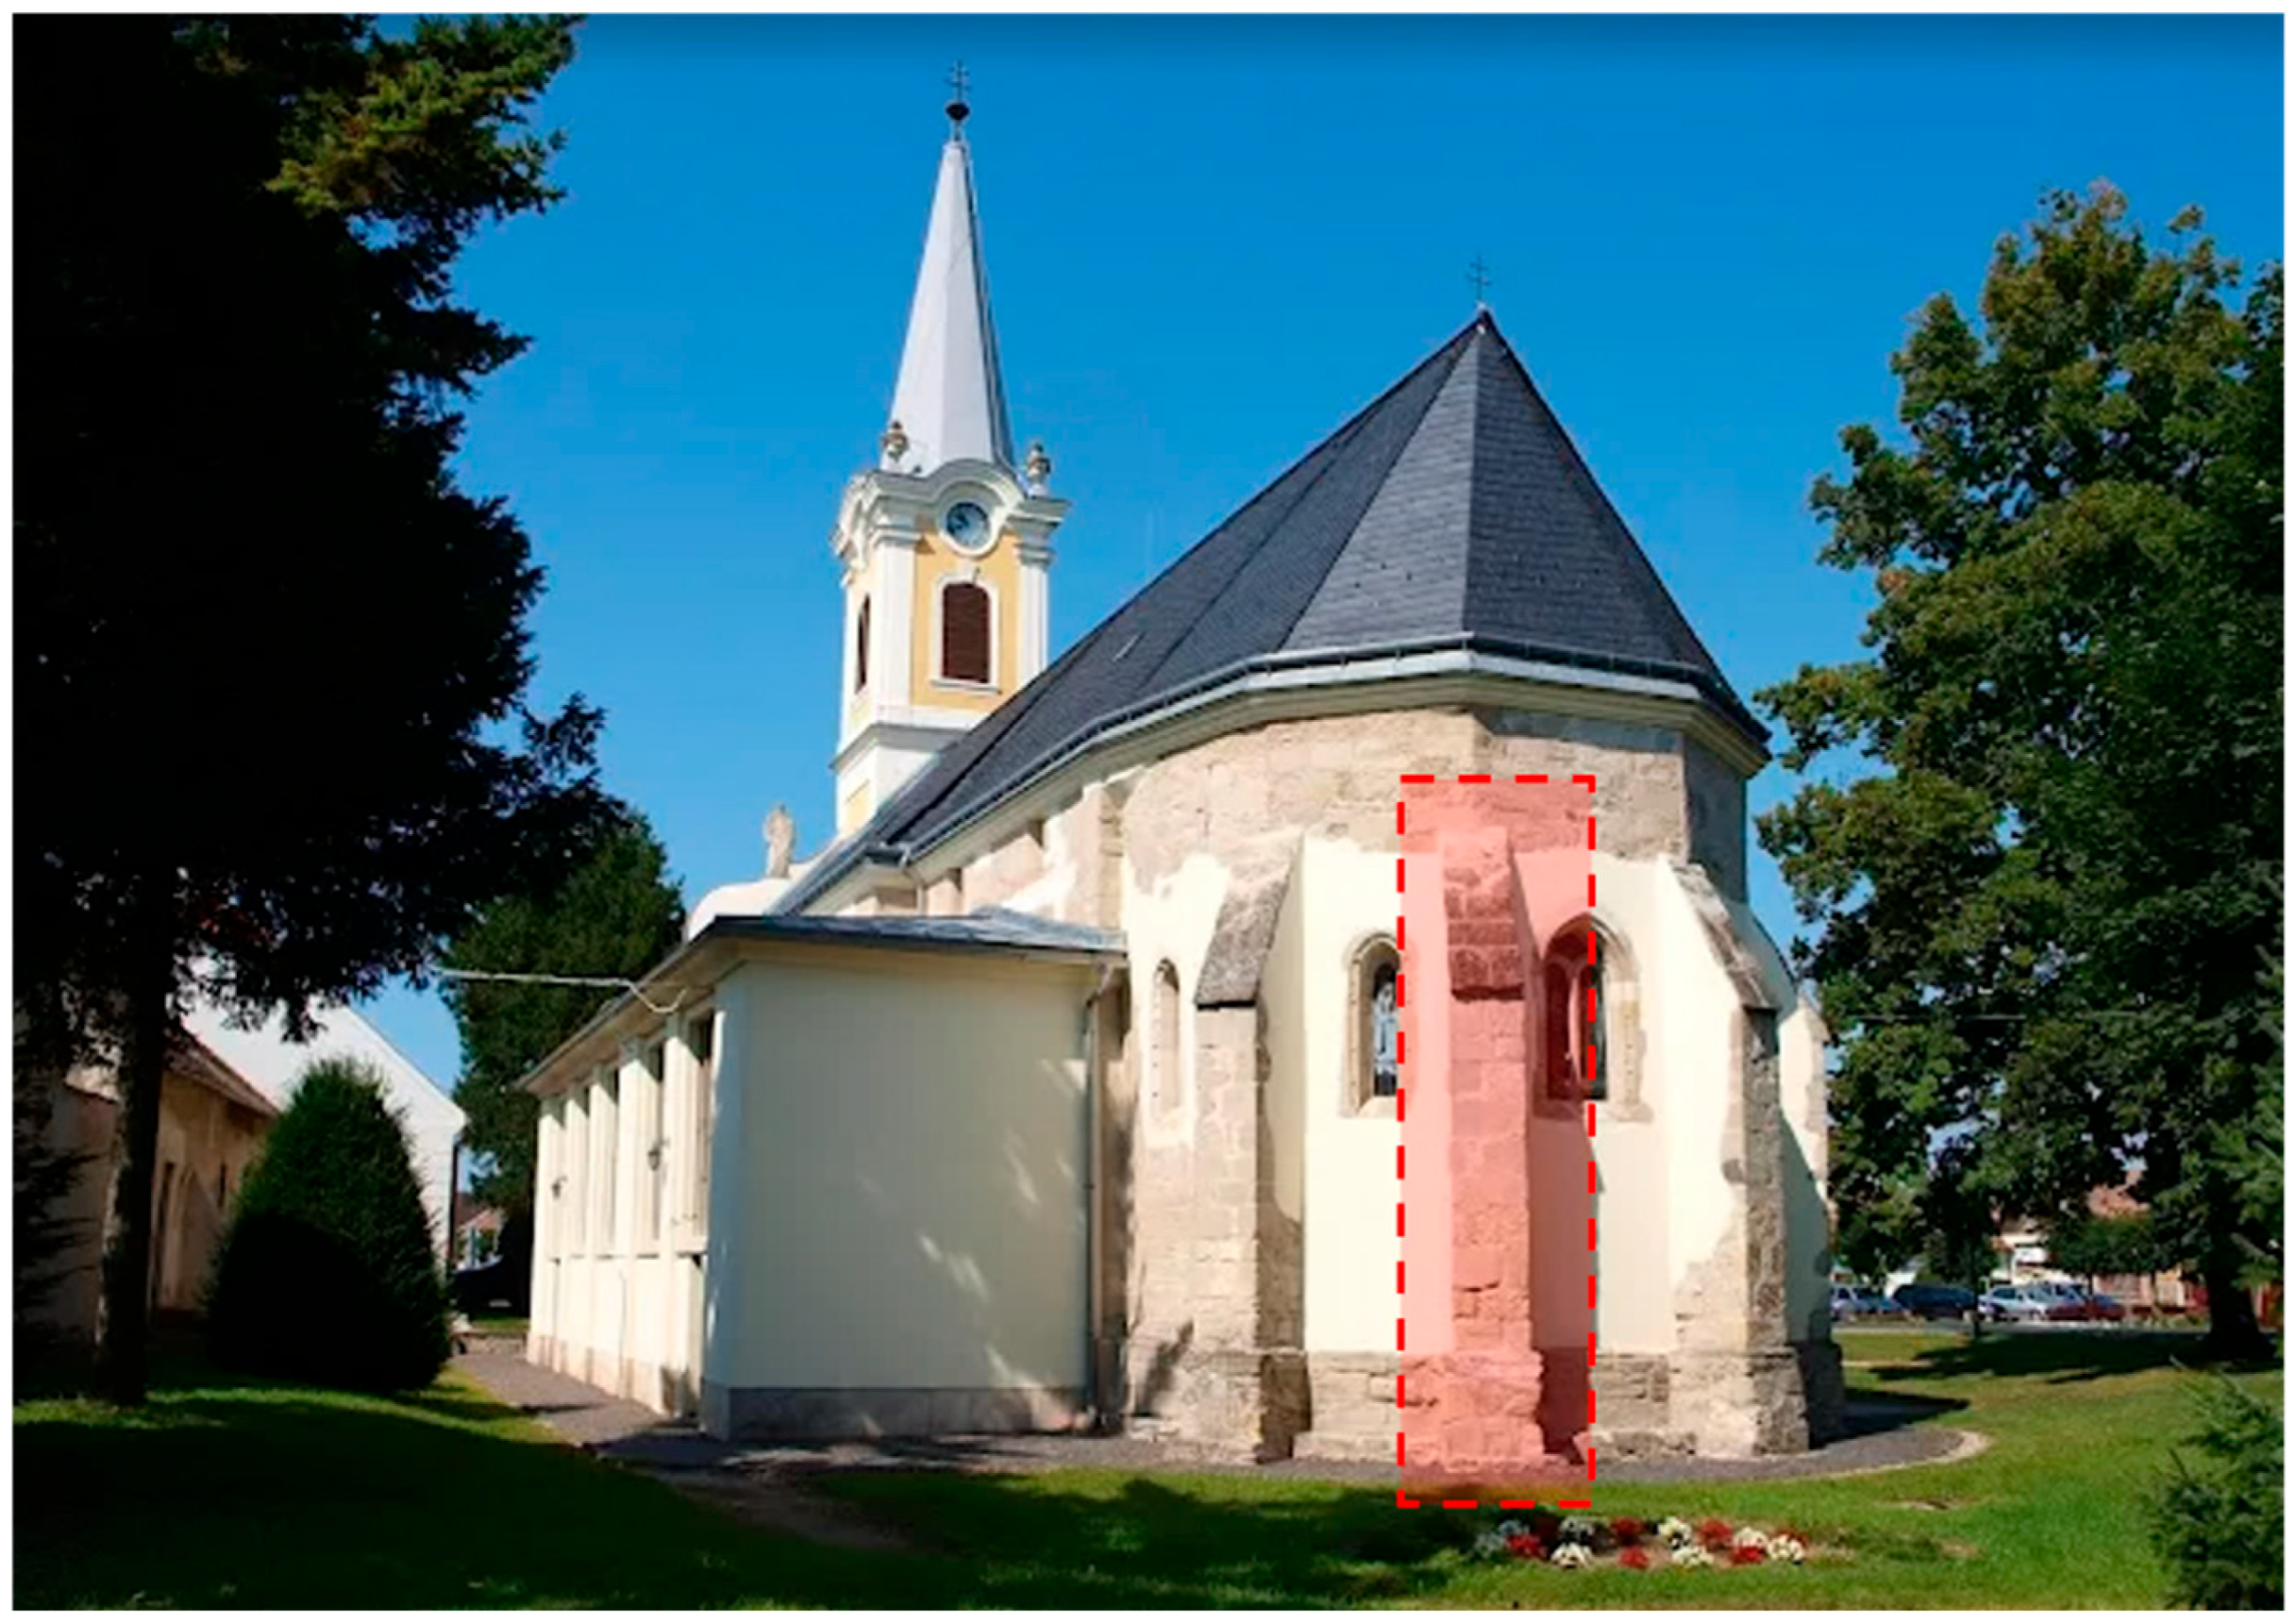
The proposed workflow was applied to a heritage case study involving an exterior stone column from the Church of St. Peter and Paul in Sopronhorpács, Hungary. The chapel has a long and layered architectural history, with origins in the Romanesque period and later Gothic and Baroque interventions. Its exterior elements show visible signs of aging, including surface erosion, irregular profiles, and slight deviations from verticality. These characteristics make the site an appropriate test environment for evaluating the workflow on elements that do not conform to standard geometric assumptions (
Figure 8).
4.1. Data and Element Selection
The chapel was documented using terrestrial laser scanning, producing a dense point cloud that captured both fine surface details and larger geometric variations. As part of the preprocessing stage, the dataset was classified into architectural groups, allowing individual elements to be isolated for focused reconstruction.
For this case study, one exterior column was selected due to its irregular shape and weathered surface. The element shows non-uniform cross-sections, accumulated material loss, and measurable deviations from vertical alignment. These qualities represent typical challenges in heritage environments, where centuries of environmental exposure and structural settlement produce forms that cannot be approximate by standard parametric models. The column therefore provided a realistic and demanding test case for the semi-automated workflow (
Figure 9).
4.2. Implementation
The classified column dataset was imported into Rhino, where a shrinkwrapped mesh was generated to provide a cleaner and more coherent surface for geometric operations. This mesh was simplified to reduce file size and computational load during processing, without compromising the conservation objectives of the project. The simplification ensures smoother performance in subsequent steps while maintaining geometric accuracy sufficient for conservation-grade modeling.
The simplified mesh served as the main input for the Grasshopper definition developed in this study. Using the Grasshopper workflow described in
Section 3, a series of horizontal section planes was created at uniform intervals along the height of the column. Each plane intersected the mesh to produce a contour curve representing the local profile. These curves were automatically refined into closed polylines to ensure continuous and clean inputs for modeling.
Using these polylines, the column was reconstructed in Rhino using Grasshopper by generating a smooth lofted surface that followed the scanned profiles. The resulting geometry preserved the overall character and irregularity of the original element while remaining manageable enough for integration into a BIM platform.
Once the geometry was reconstructed, it was transferred to Autodesk Revit using Rhino.Inside.Revit, where it was placed in the project as a Structural Column (DirectShape). This step allowed the column to participate fully in Revit’s environment, including scheduling, documentation, and metadata assignment (
Figure 10).
5. Results
The proposed workflow was tested on a single exterior stone column from the Sopronhorpács chapel. The evaluation focused on the quality of the reconstructed geometry, the deviation between the model and the scan data, and the time required to complete the process.
5.1. Reconstructed Column Geometry
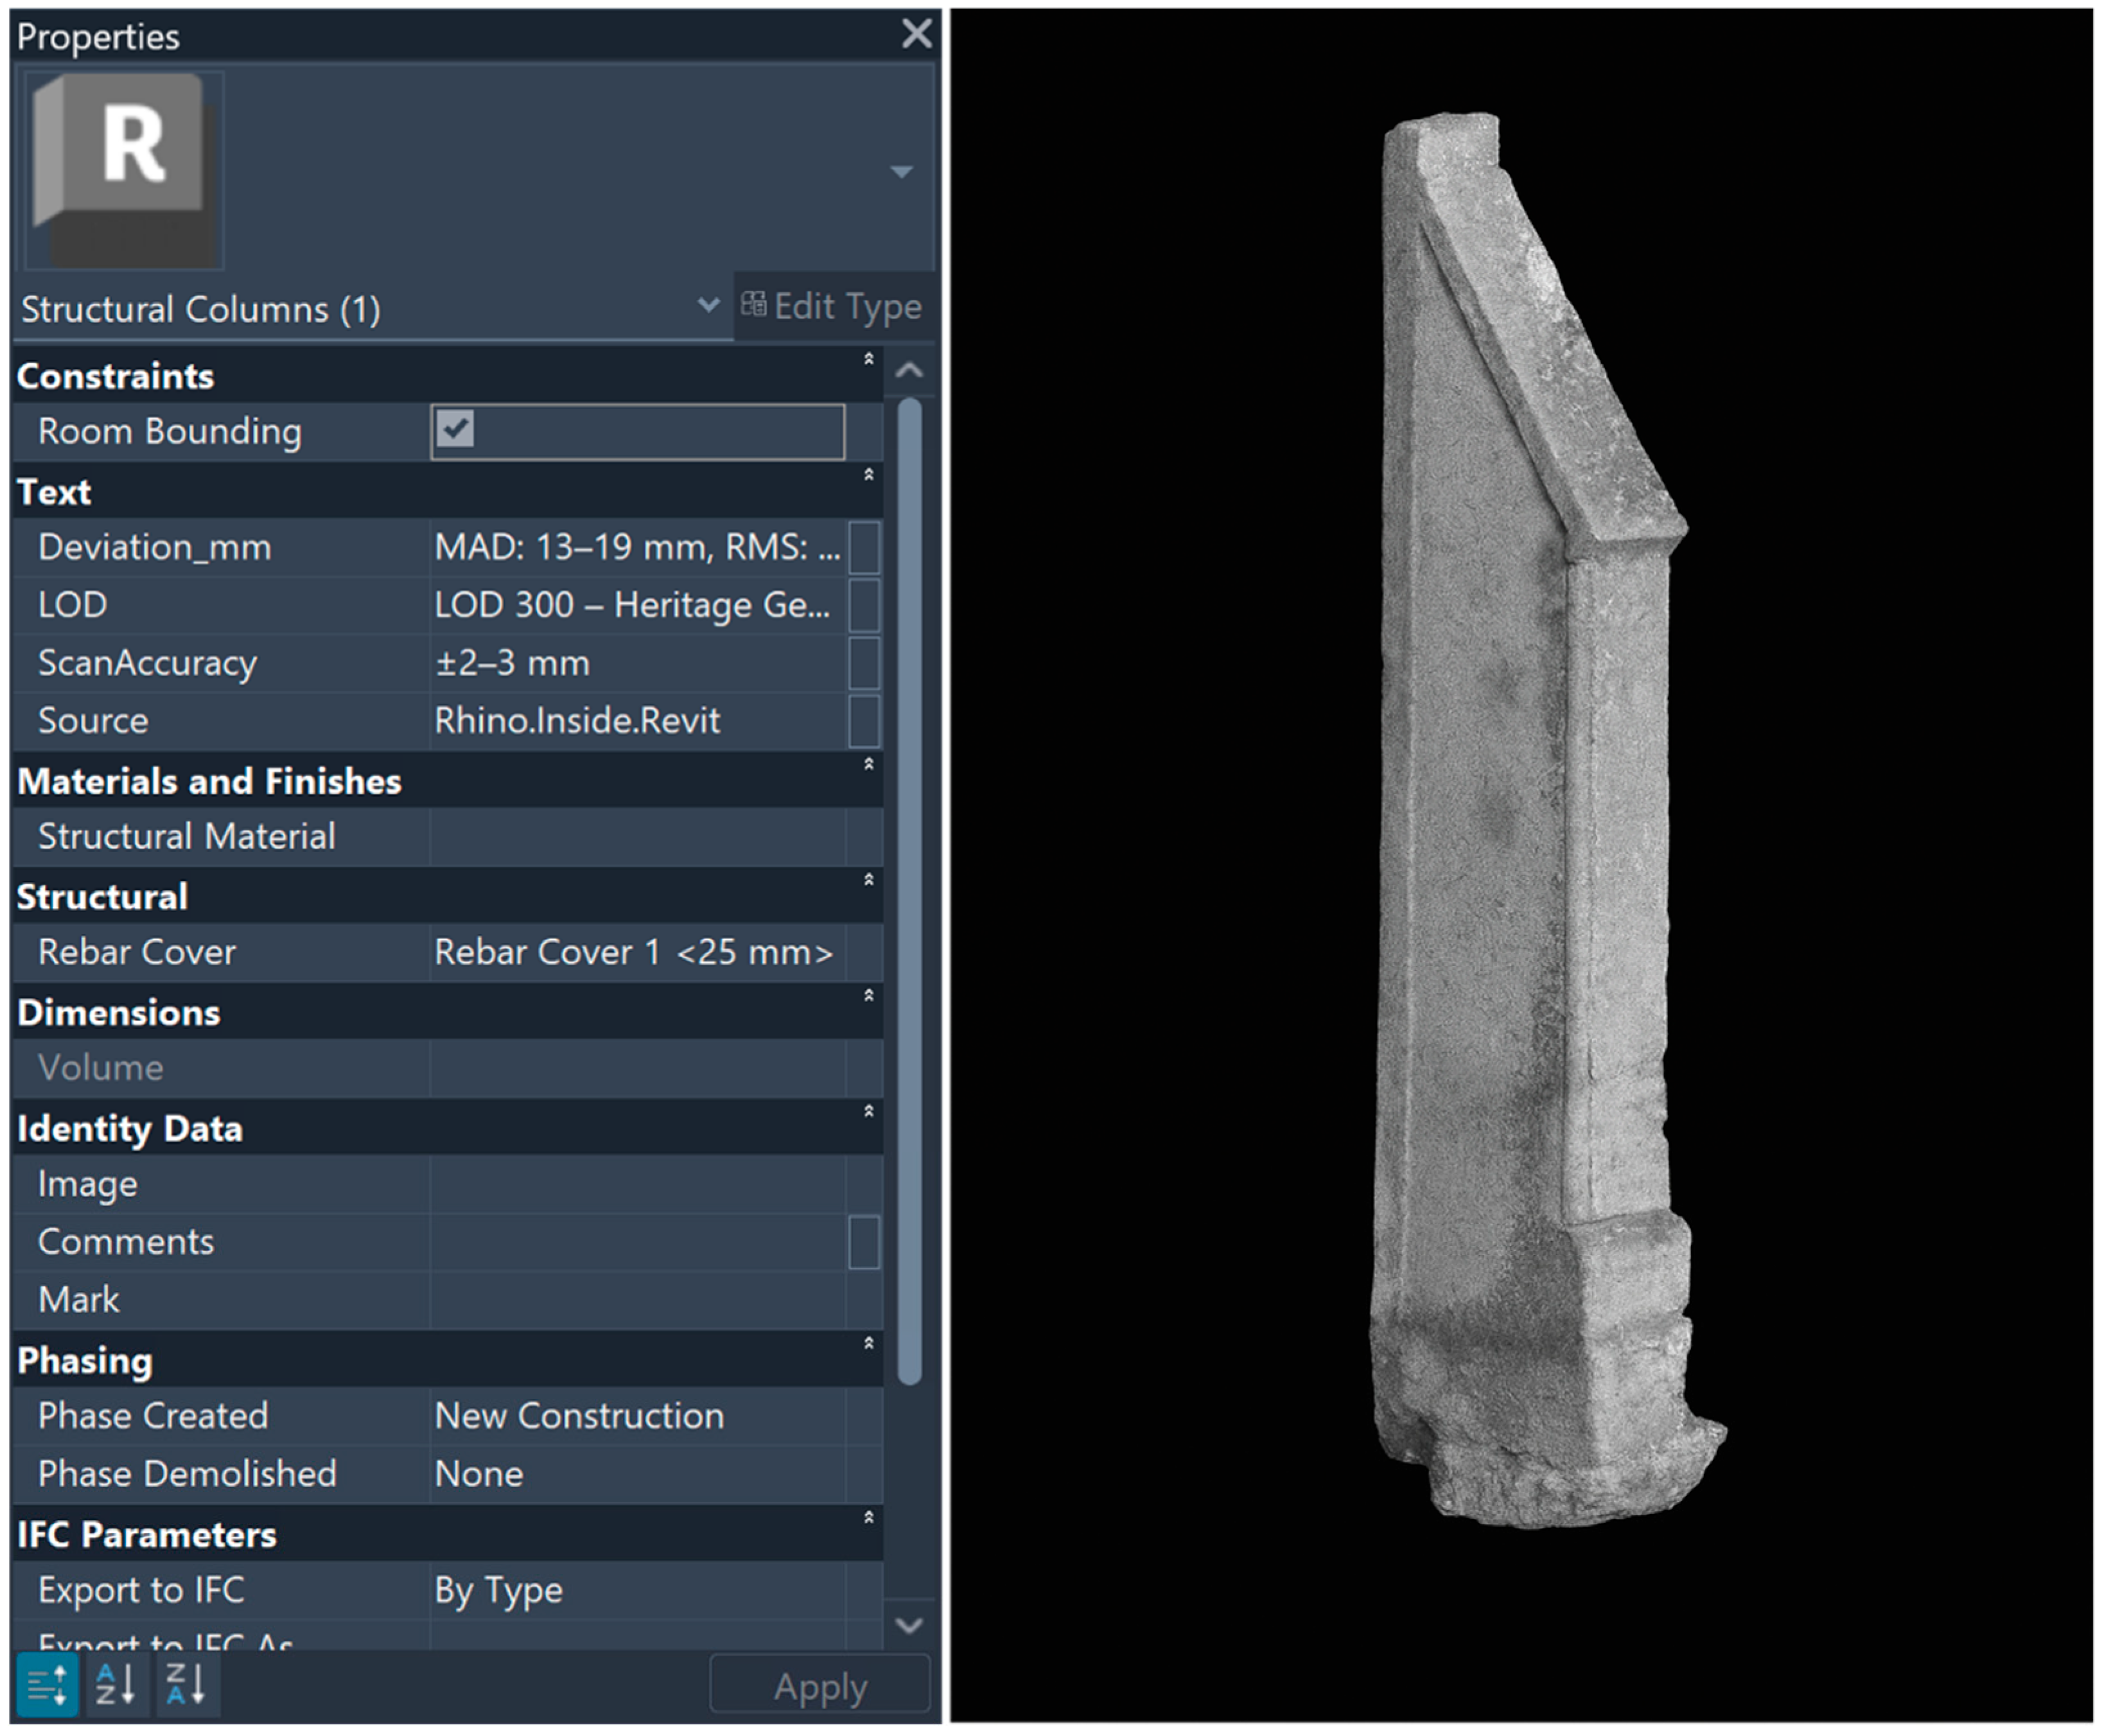
The workflow produced a continuous 3D column model that preserved the irregular features observed in the point cloud, such as the uneven curvature, localized erosion, and the slight vertical deviation of the shaft. The lofted form carried the changing profiles along the column’s height and produced a closed, well-defined solid ready for direct import into Revit as a Structural Column through a DirectShape definition.
Once in Revit, the element preserved the characteristic geometry of the historic stone column while operating as a conventional BIM object. Its DirectShape basis restricts full parametric manipulation, but it still supports the assignment of essential attributes such as material, level of detail (LOD), accuracy parameters, additional metadata, and proper alignment with project levels. These capabilities facilitate documentation and coordination workflows (
Figure 11).
5.2. Deviation Analysis
The geometric accuracy of the reconstructed column was evaluated using two reference datasets: the shrinkwrapped mesh (M2M) and the original TLS point cloud (C2M). Evaluating the reconstructed model against both allowed the analysis to differentiate between accuracy relative to the smoothed intermediary geometry and accuracy relative to the full resolution scanned surface (
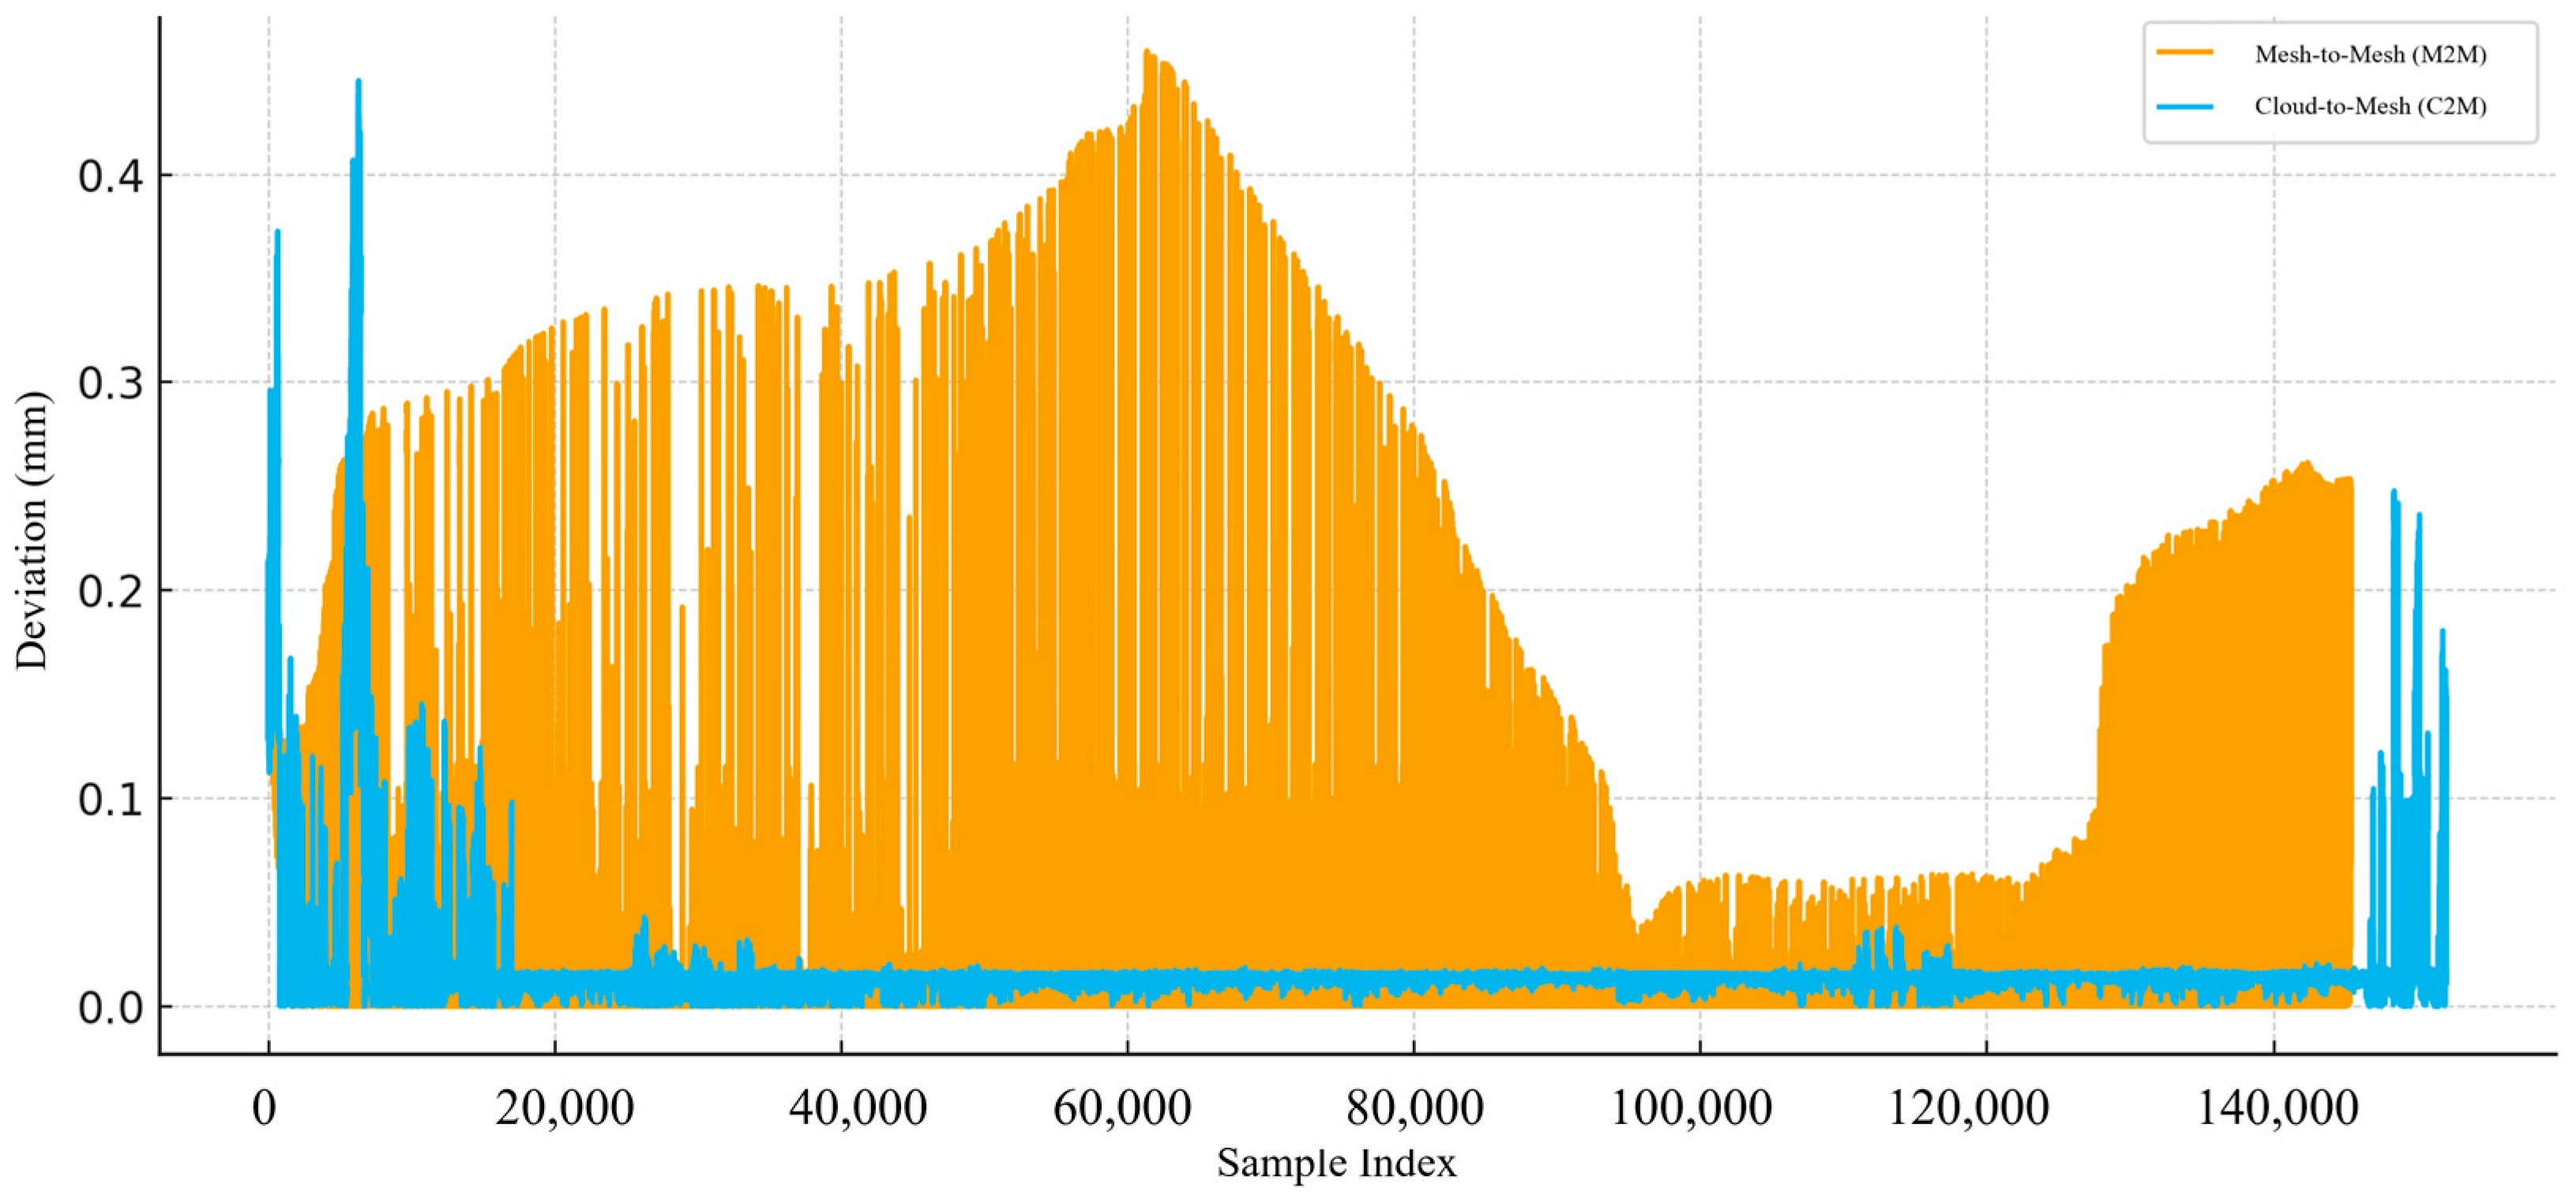
Figure 12).
As shown in
Figure 12, the reconstructed geometry follows the shrinkwrapped mesh closely, while the broader C2M curve reflects the natural surface roughness and erosion present only in the raw TLS data. This contrast highlights how the model behaves when assessed against a smoothed modeling surface versus the unfiltered reality of the scan.
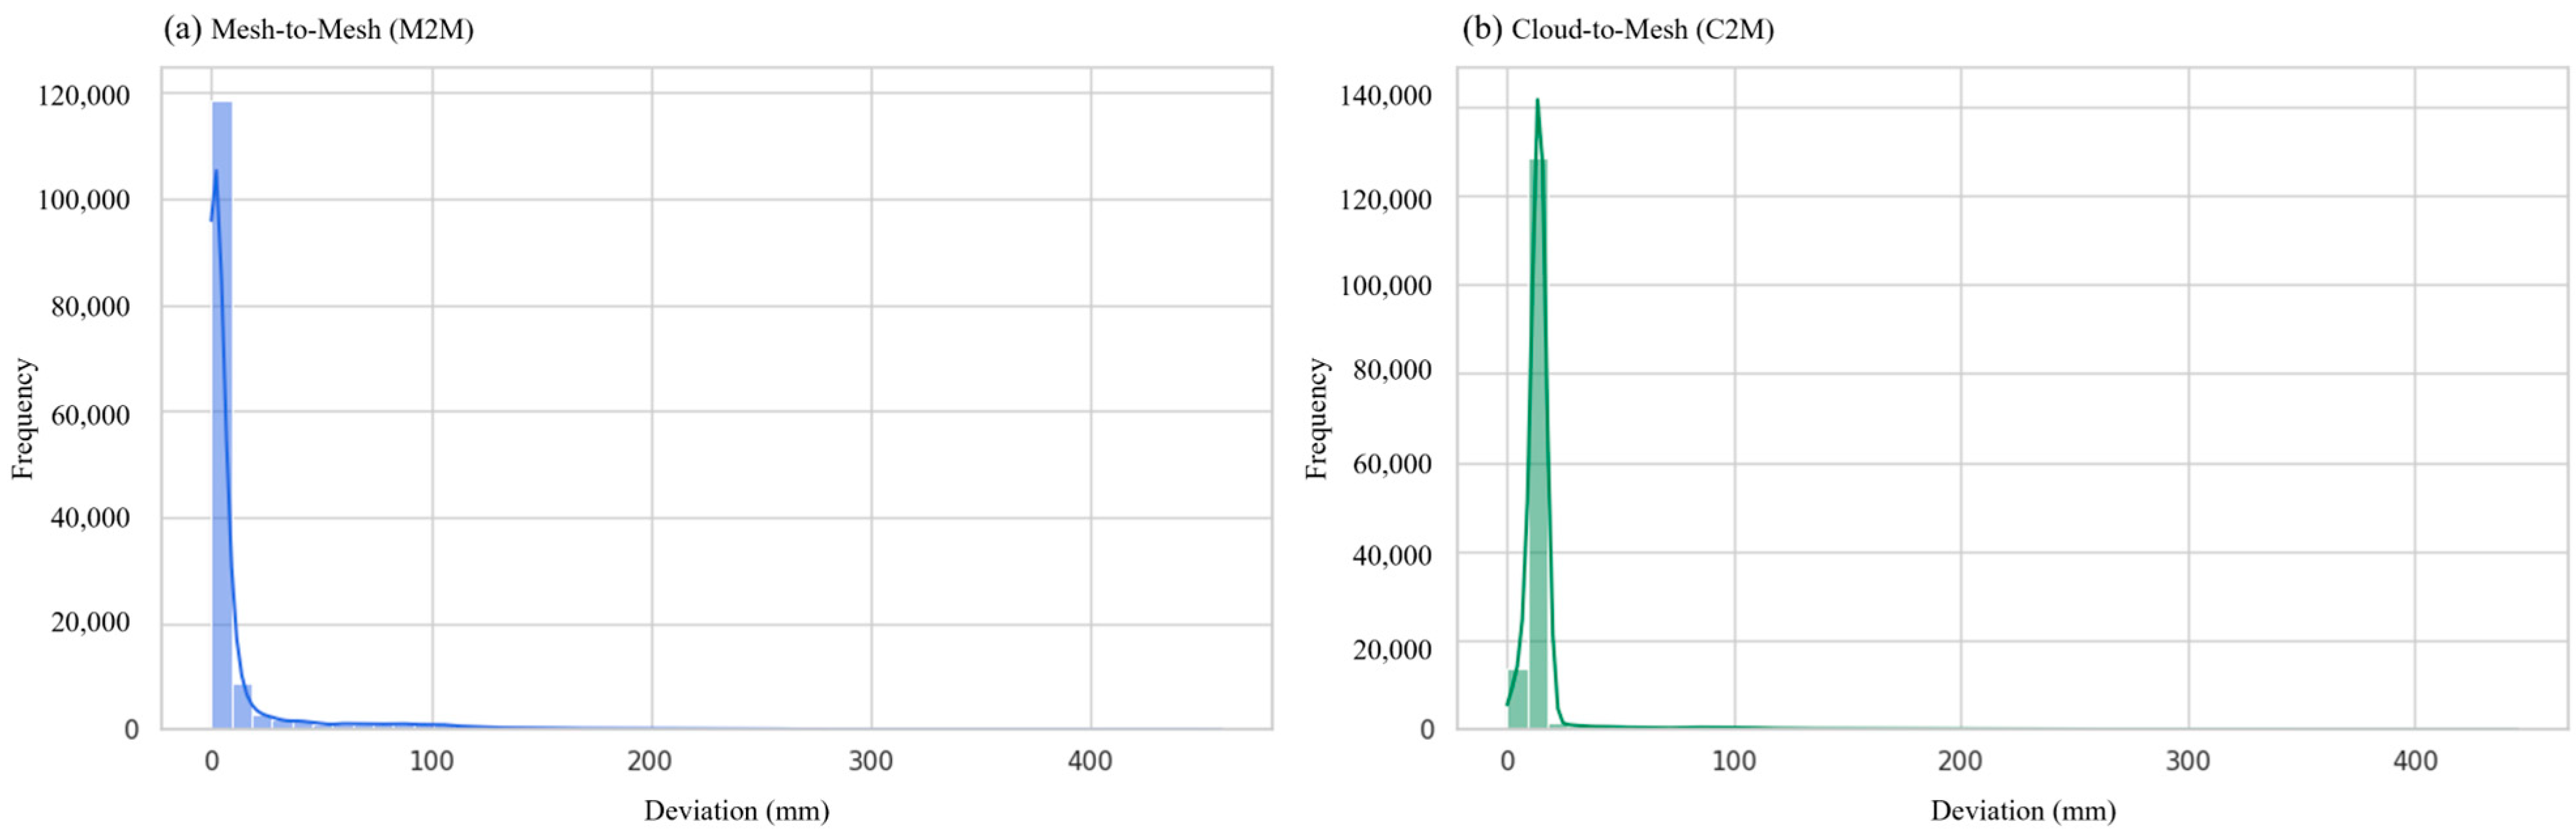
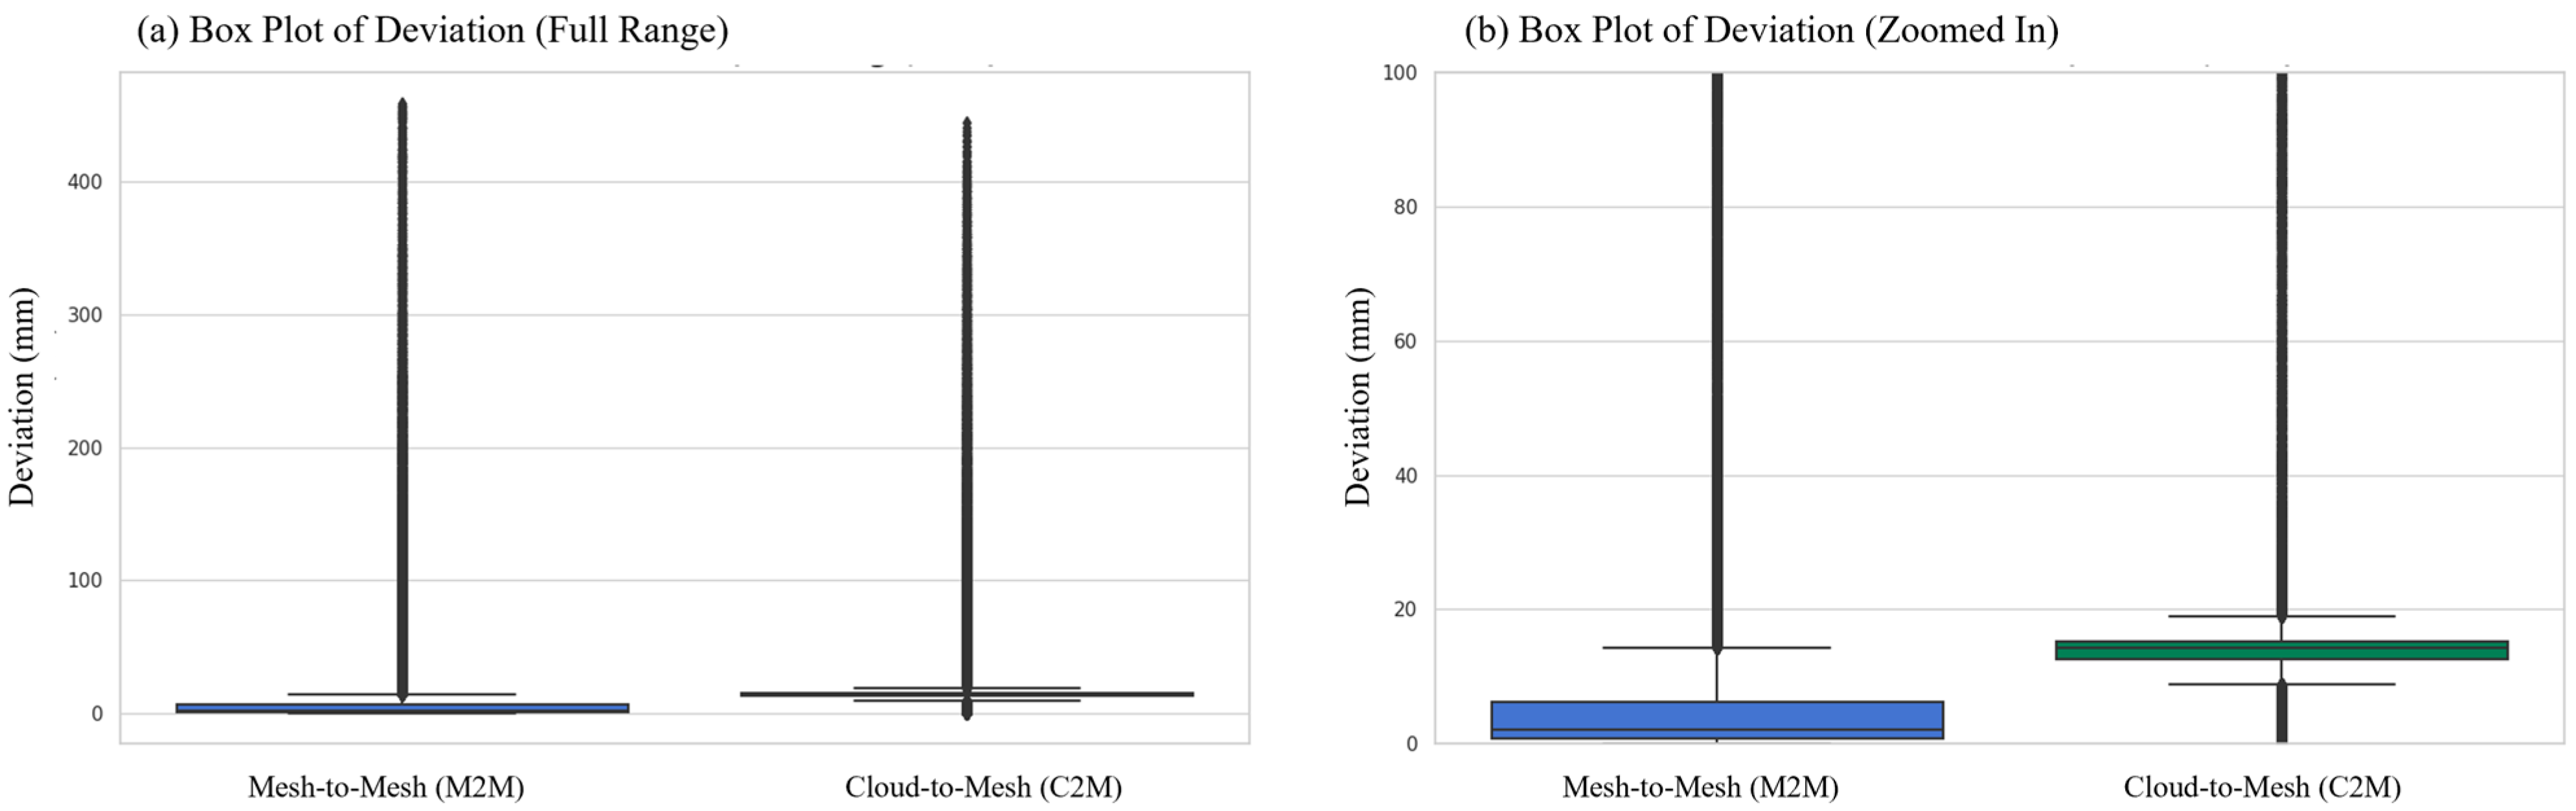
The M2M analysis was conducted on 145,397 points and the C2M analysis on 152,050 points. Summary statistics for both datasets are shown in
Table 2, and the distribution of these results are displayed in
Figure 13 and
Figure 14.
Figure 13 shows that most deviation values lie close to 0 mm, with a small number of points extending toward higher values. This explains the relatively large RMS and standard deviation values in
Table 2 both metrics are influenced by outliers, which are common in eroded or uneven stone surfaces.
Figure 14 emphasizes the central behavior of the datasets. The M2M median deviation is low (2.07 mm), while the C2M interquartile range is tightly clustered between 12.6 mm and 15.1 mm. These visuals support the statistical discussion that follows.
The M2M results reflect how well the reconstructed surface adheres to the shrinkwrapped mesh used as the modeling intermediary. The MAD of 13.45 mm and equal mean deviation indicates a consistent offset introduced by the loft-based reconstruction, which smooths surface irregularities and reduces the micro-variations present in the shrinkwrap. The larger RMS and σ values arise from isolated rough areas in the shrinkwrapped mesh rather than systematic modeling error.
The C2M results naturally show a broader deviation range when compared with the full-resolution TLS point cloud. The higher MAD (18.69 mm) reflects fine-scale erosion and roughness not reproduced in the simplified model. Interestingly, the C2M RMS (35.70 mm) is lower than the M2M RMS (40.67 mm), suggesting that certain localized deviations present in the shrinkwrapped mesh do not appear in the original scan. This indicates that the shrinkwrap introduced small geometric irregularities not inherent to the TLS data.
Across both analyses, more than 90% of deviation values fall within approximately ±15–20 mm. According to the USIBD Level of Accuracy (LOA) specifications [
41], these deviations fall within the LOA 20 (15–50 mm) to LOA 30 (5–15 mm) range. These ranges align with accepted tolerances for HBIM modeling of irregular stone elements in conservation-grade documentation [
41,
42,
43,
44,
45,
46]. For many detailed conservation records, a millimeter-level accuracy is considered sufficient for geometric documentation, particularly when representing elements that exhibit natural wear and asymmetry. While systematic errors at the centimeter level may be unsuitable for highly sensitive conservation work, the sub-centimeter accuracy achieved here is appropriate for the intended purposes of facility management, general visualization, and preliminary restoration planning. This level of accuracy is widely recognized as balancing geometric fidelity with model performance, and it meets the LOA requirements typically applied in detailed architectural and heritage documentation. Taken together, the dual-reference evaluation clarifies how the reconstructed geometry interacts with both filtered and unfiltered representations of the column, supporting the suitability of the proposed workflow for heritage documentation and reconstruction practices.
5.3. Modeling Time
The full reconstruction workflow, including mesh preparation, sectioning, polyline extraction, lofting, and importing the resulting solid into Revit, required roughly 1.5 h, combining both active user interaction and short processing pauses. A comparable manual reconstruction using standard Revit tools typically approaches 4 h for an element with similar irregular geometry. The corresponding reduction in modeling time is therefore about 62%.
To clarify how this reduction is distributed across the workflow stages,
Table 3 summarizes the time required for each task within the proposed PCML workflow and contrasts it with a fully manual Scan-to-BIM approach.
This improvement is measured on a single column, yet its practical weight becomes clearer when extended to an entire building. Historic structures rarely contain isolated irregular components; they consist of repeated families of columns, bases, capitals, arches, and carved surfaces. When the same workflow is applied across a full set of such elements, the time savings accumulate in a nearly proportional manner. What would normally require a lot of long detailed manual modeling can be condensed substantially, while maintaining a consistent level of geometric precision. The method offers efficiency not by simplifying the architecture, but by streamlining the way complex geometry is captured and translated into HBIM.
While these results highlight the workflow’s potential, the reported reduction in modeling time is based on a single controlled test performed by an operator proficient in both Rhino and Revit. Accordingly, the values should be regarded as indicative rather than statistically validated. They serve as proof of concept demonstrating the method’s capacity to reduce modeling time compared with traditional manual approaches. Further testing with multiple operators and repeated trials will be necessary to establish statistically supported measures of efficiency.
5.4. Consistency and Model Behavior
Although the workflow was applied to only one column for the formal evaluation, informal testing on additional columns showed a similar pattern of section extraction, loft continuity, and deviation behavior. This indicates that once the Grasshopper settings (section spacing, alignment method, and loft options) are adjusted for a given architectural component type, the workflow can be reused with minimal adjustments.
In Revit, the imported geometry behaved predictably:
The column aligned correctly with levels; the height was correct and matched the real height of the column.
It accepted HBIM parameters such as material, notes, and metadata,
It appeared cleanly in sections, elevations, and detail views.
The only limitation encountered was the display of deviation colors, which appeared as surface textures due to current constraints in Rhino.Inside.Revit. This affected appearance only, not the underlying deviation values.
6. Discussion
The results show that the proposed semi-automated workflow offers a practical and controlled middle ground between manual Scan-to-BIM workflows and fully automated reconstruction methods. By beginning with a pre-classified point cloud and introducing a mesh-based intermediary, the workflow establishes a clear and structured progression from raw TLS data to BIM-ready geometry, which is particularly valuable in heritage contexts where elements rarely follow regular or parametric forms.
The successful reconstruction of the Sopronhorpács chapel column demonstrates that the method can handle uneven surfaces, deformations, and non-uniform profiles without relying on the intensive manual tracing normally required in Revit. The deviation analyses, drawn from 145,397 M2M points and 152,050 C2M points, showed that most of the reconstructed surface remained within millimeter-scale differences from both the shrinkwrapped mesh and the original TLS cloud. The M2M deviations reflect how the reconstructed surface relates to the modeling intermediary, while the C2M values capture the broader irregularities of the real stone surface. Although the deviation magnitudes fall in the centimeter range rather than the millimeter scale expected for idealized geometries, the values remain in line with tolerances commonly applied to irregular masonry elements in HBIM documentation. Importantly, these deviations reflect the worn and eroded condition of the column rather than instability in the reconstruction process. At the same time, the modeling workflow reduced total reconstruction time by more than half, illustrating a meaningful narrowing of the long-standing gap between rapid point cloud acquisition and slow BIM creation.
A major reason for this improvement is the decision to use pre-classified point clouds. Working with isolated element groups reduces noise, stabilizes the slicing process, and ensures that section curves are derived from coherent surfaces rather than from dispersed raw points. Using a shrinkwrapped mesh as the slicing surface further improves curve quality, limiting the need for operator correction and producing more consistent lofted geometry. The Grasshopper definition formalizes these operations into a repeatable sequence that does not require programming knowledge, making the workflow accessible to practitioners who primarily work in design environments rather than coding environments. This structure helps maintain consistency across multiple elements of the same type, supporting scalable HBIM documentation.
Equally important is the integration stage through Rhino.Inside.Revit, which plays a central role in transforming the reconstructed geometry into a functional HBIM element. Importing the column as a native DirectShape categorizes it correctly, enables metadata assignment, and ensures participation in Revit’s broader documentation ecosystem. In this way, the workflow supports not only geometric reconstruction but also the information-management goals central to HBIM.
However, several limitations remain. The approach is sensitive to the quality of pre-classification. When architectural components are not segmented into meaningful subparts, such as windows lacking frame and glazing separation, this leads to simplified BIM outputs (
Figure 15). In addition, the workflow still requires some manual decisions, such as setting slicing ranges or verifying contour closure. These interventions are modest but reflect the reality that heritage modeling always requires a degree of human judgment.
Another limitation lies in the geometric simplification inherent to shrink-wrapped meshes and lofted surfaces. While effective for capturing overall form, this approach cannot fully reproduce fine ornamentation or deeply eroded textures, which may require hybrid modeling strategies or more detailed classification. Additionally, the resulting DirectShape geometry in Revit remains non-parametric, reducing flexibility when later modifications are needed.
Beyond these constraints, the validation on a single stone column also limits how broadly the findings can be applied. While it shows the workflow works well for irregular, rotationally symmetric elements, further testing is needed to confirm its performance across different architectural types. The PCML structure, however, is inherently adaptable. For planar or linear elements like walls or beams, the sectioning and lofting process can be adjusted to create controlled extrusions, potentially reducing processing time. The mesh-based approach can also handle elements with voids or negative spaces, such as window tracery or fragmented components, since sectioning precisely defines the material boundaries. In these more complex cases, the operator’s interpretation remains important, especially when reconstructing missing or worn features. Therefore, Future work will extend the workflow to multiple element types to evaluate the procedural adjustments needed to optimize PCML performance across diverse architectural forms, including masonry vaults, timber assemblies, and multi-element heritage sites. Overall, the workflow is not intended to replace expert judgment but to minimize repetitive manual effort while maintaining specialist control where it most influences model quality. The structured logic of PCML can be adapted to additional element types through adjustments to slicing and classification parameters. With continued development the method could evolve into a modular HBIM reconstruction system capable of supporting a much broader range of architectural features than the single column tested here.
7. Conclusions
In addressing the central research question, how a classification-driven, semi-automated workflow can bridge raw TLS data to usable HBIM geometry for irregular heritage elements, this study demonstrates a balanced approach that enhances efficiency while preserving interpretive control. The research confirmed that the proposed workflow can effectively translate dense point clouds into structured HBIM components, maintaining the geometric fidelity required for conservation-grade documentation.
By applying the method to an irregular exterior column from the Sopronhorpács chapel, the research showed that geometries shaped by erosion, uneven profiles, and long-term deformation can be reconstructed in a systematic and controlled manner without the need for extensive manual tracing or advanced programming.
The workflow builds upon three coordinated components: a pre-classified point cloud that isolates the target element, a mesh intermediary processed in Rhino and Grasshopper for sectioning and loft-based reconstruction, and a direct transfer into Revit using Rhino.Inside.Revit to produce categorized HBIM elements rather than passive geometric imports. Together, these components enabled the column to be reconstructed with considerable reductions in modeling time while maintaining a close geometric relationship to both the shrinkwrapped mesh and the original TLS dataset. The deviation analysis, based on over 145,000 M2M samples and more than 152,000 C2M samples, confirmed that the reconstructed surface followed the broader geometry of the original element with deviations appropriate for irregular stone components. The values reflect the worn condition of the material rather than deficiencies in the reconstruction, demonstrating that the workflow is suitable for heritage applications where geometric regularity cannot be assumed.
The workflow remains accessible to practitioners who work primarily in Rhino and Revit, as its operations are implemented entirely through visual scripting. It retains the level of expert supervision needed to interpret architectural irregularities while removing much of the repetitive work that slows down traditional Scan-to-HBIM practice.
Some limitations remain. The accuracy and completeness of the reconstruction depend strongly on the quality of the initial classification, and certain manual adjustments, such as setting the slicing domain or verifying polyline continuity, still influence the outcome. The resulting Revit elements remain non-parametric, limiting their adaptability, and the workflow simplifies highly ornate or deeply eroded details that lie beyond the representational capacity of shrinkwrapped meshes. Additionally, software dependency on Rhino/Revit and scaling challenges for highly ornamented or multi-element sites warrant consideration.
Future work will address these points through the development of parametric Revit families derived directly from extracted polylines, integrating real-time deviation feedback within Grasshopper, and extending the workflow to more complex heritage components such as vaults, capitals, and multi-layer window assemblies. It will also explore adapting the slicing logic, using vertical sections for timber beams or radial slicing for masonry vaults, to better capture structural characteristics. In broader regional contexts, the workflow could be tailored to local heritage typologies, including wooden churches and adobe ruins.
Overall, the PCML showed in this study offers a workable middle ground between manual modeling and full automation. It supports consistent, efficient, and accessible digital documentation of historic architecture and offers a practical step toward more sustainable HBIM workflows.