
The Optimal Cost Design of Reinforced Concrete Beams Using an Artificial Neural Network—The Effectiveness of Cost-Optimized Training Data


Abstract
1. Introduction
2. Theoretical Background
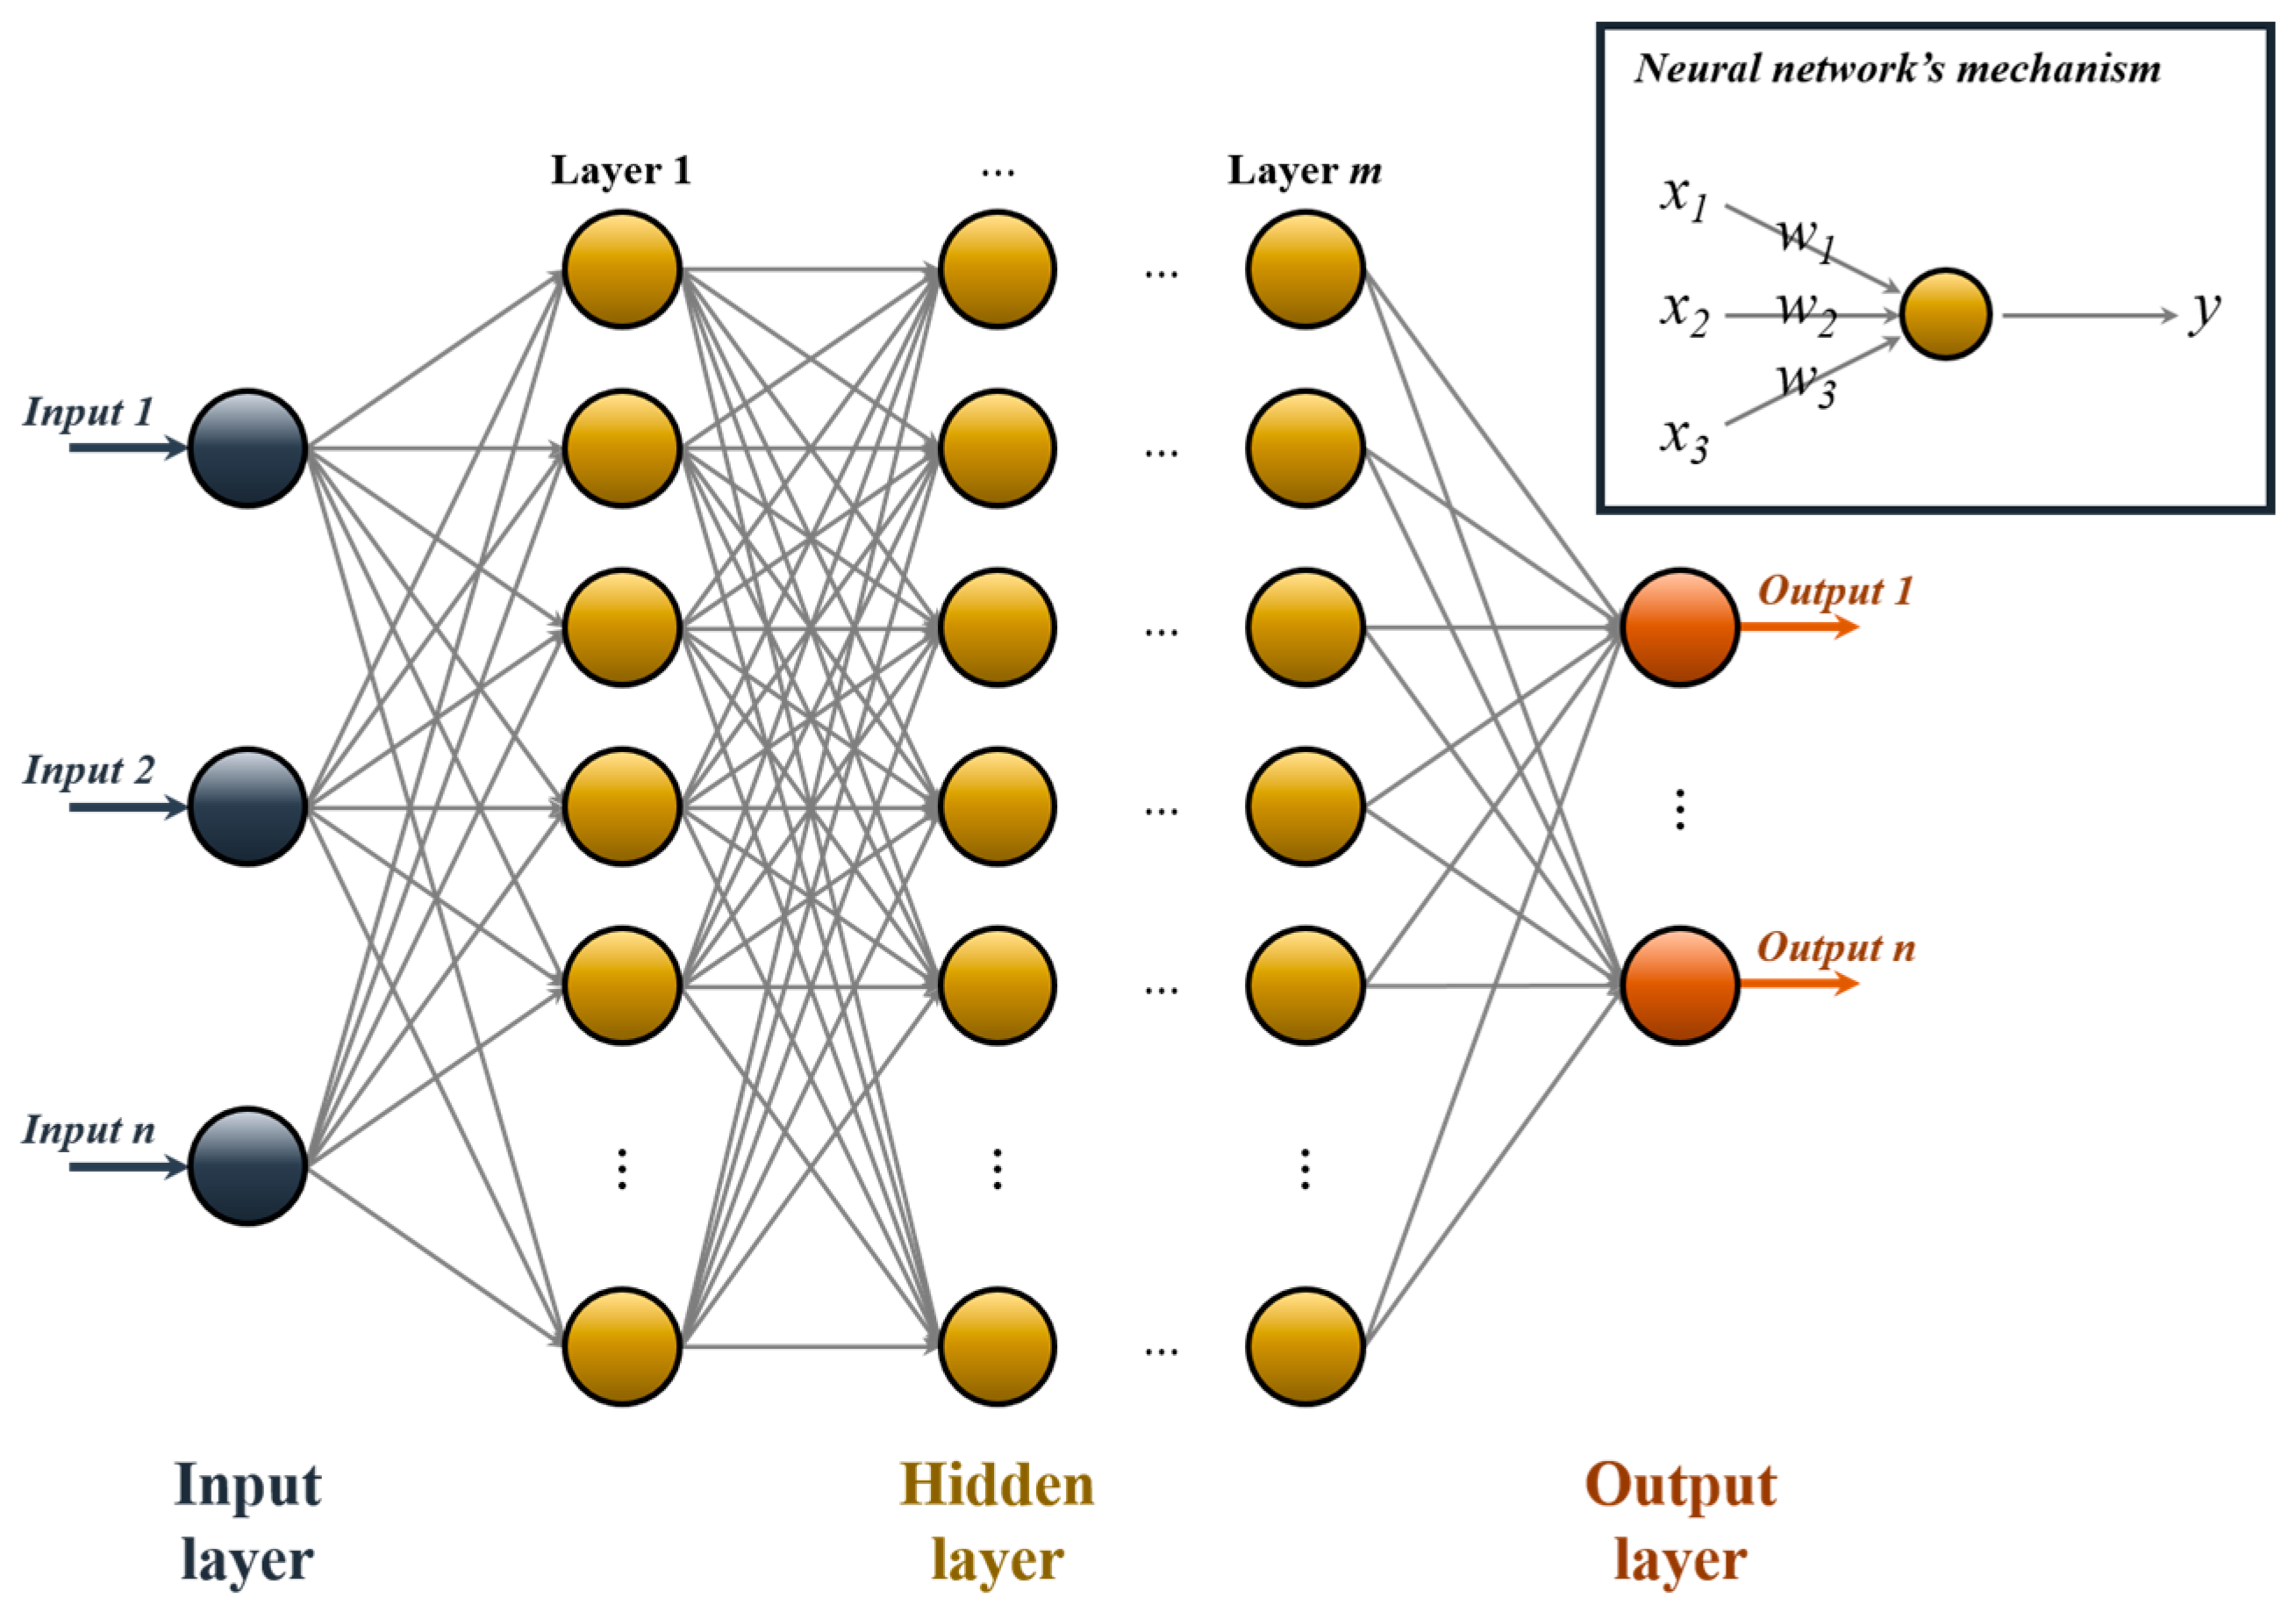
2.1. Artificial Neural Network
2.2. Metaheuristics and Crow Search Algorithm
| Algorithm 1. Pseudocode of the CSA [26] |
| Begin |
| Initialize the parameters: Awareness probability (AP), flight length (fl), Population size (N), Maximum number of iterations (MaxItr). Randomly initialize N crows in the search space. Evaluate the position of the crows. Initialize the memory of each crow. Choose the best global solution from all the crow’s memories. t = 1 While t < MaxItr t = t + 1 For i = 1:N Randomly select the chased crow j to do thievery. If APj(t) ≤ rj(t) else a random position. end if Check the feasibility range of . Evaluate the fitness value of . end for Update the memory of each crow. Update the best global solution and its fitness value. end While Show the results. End |
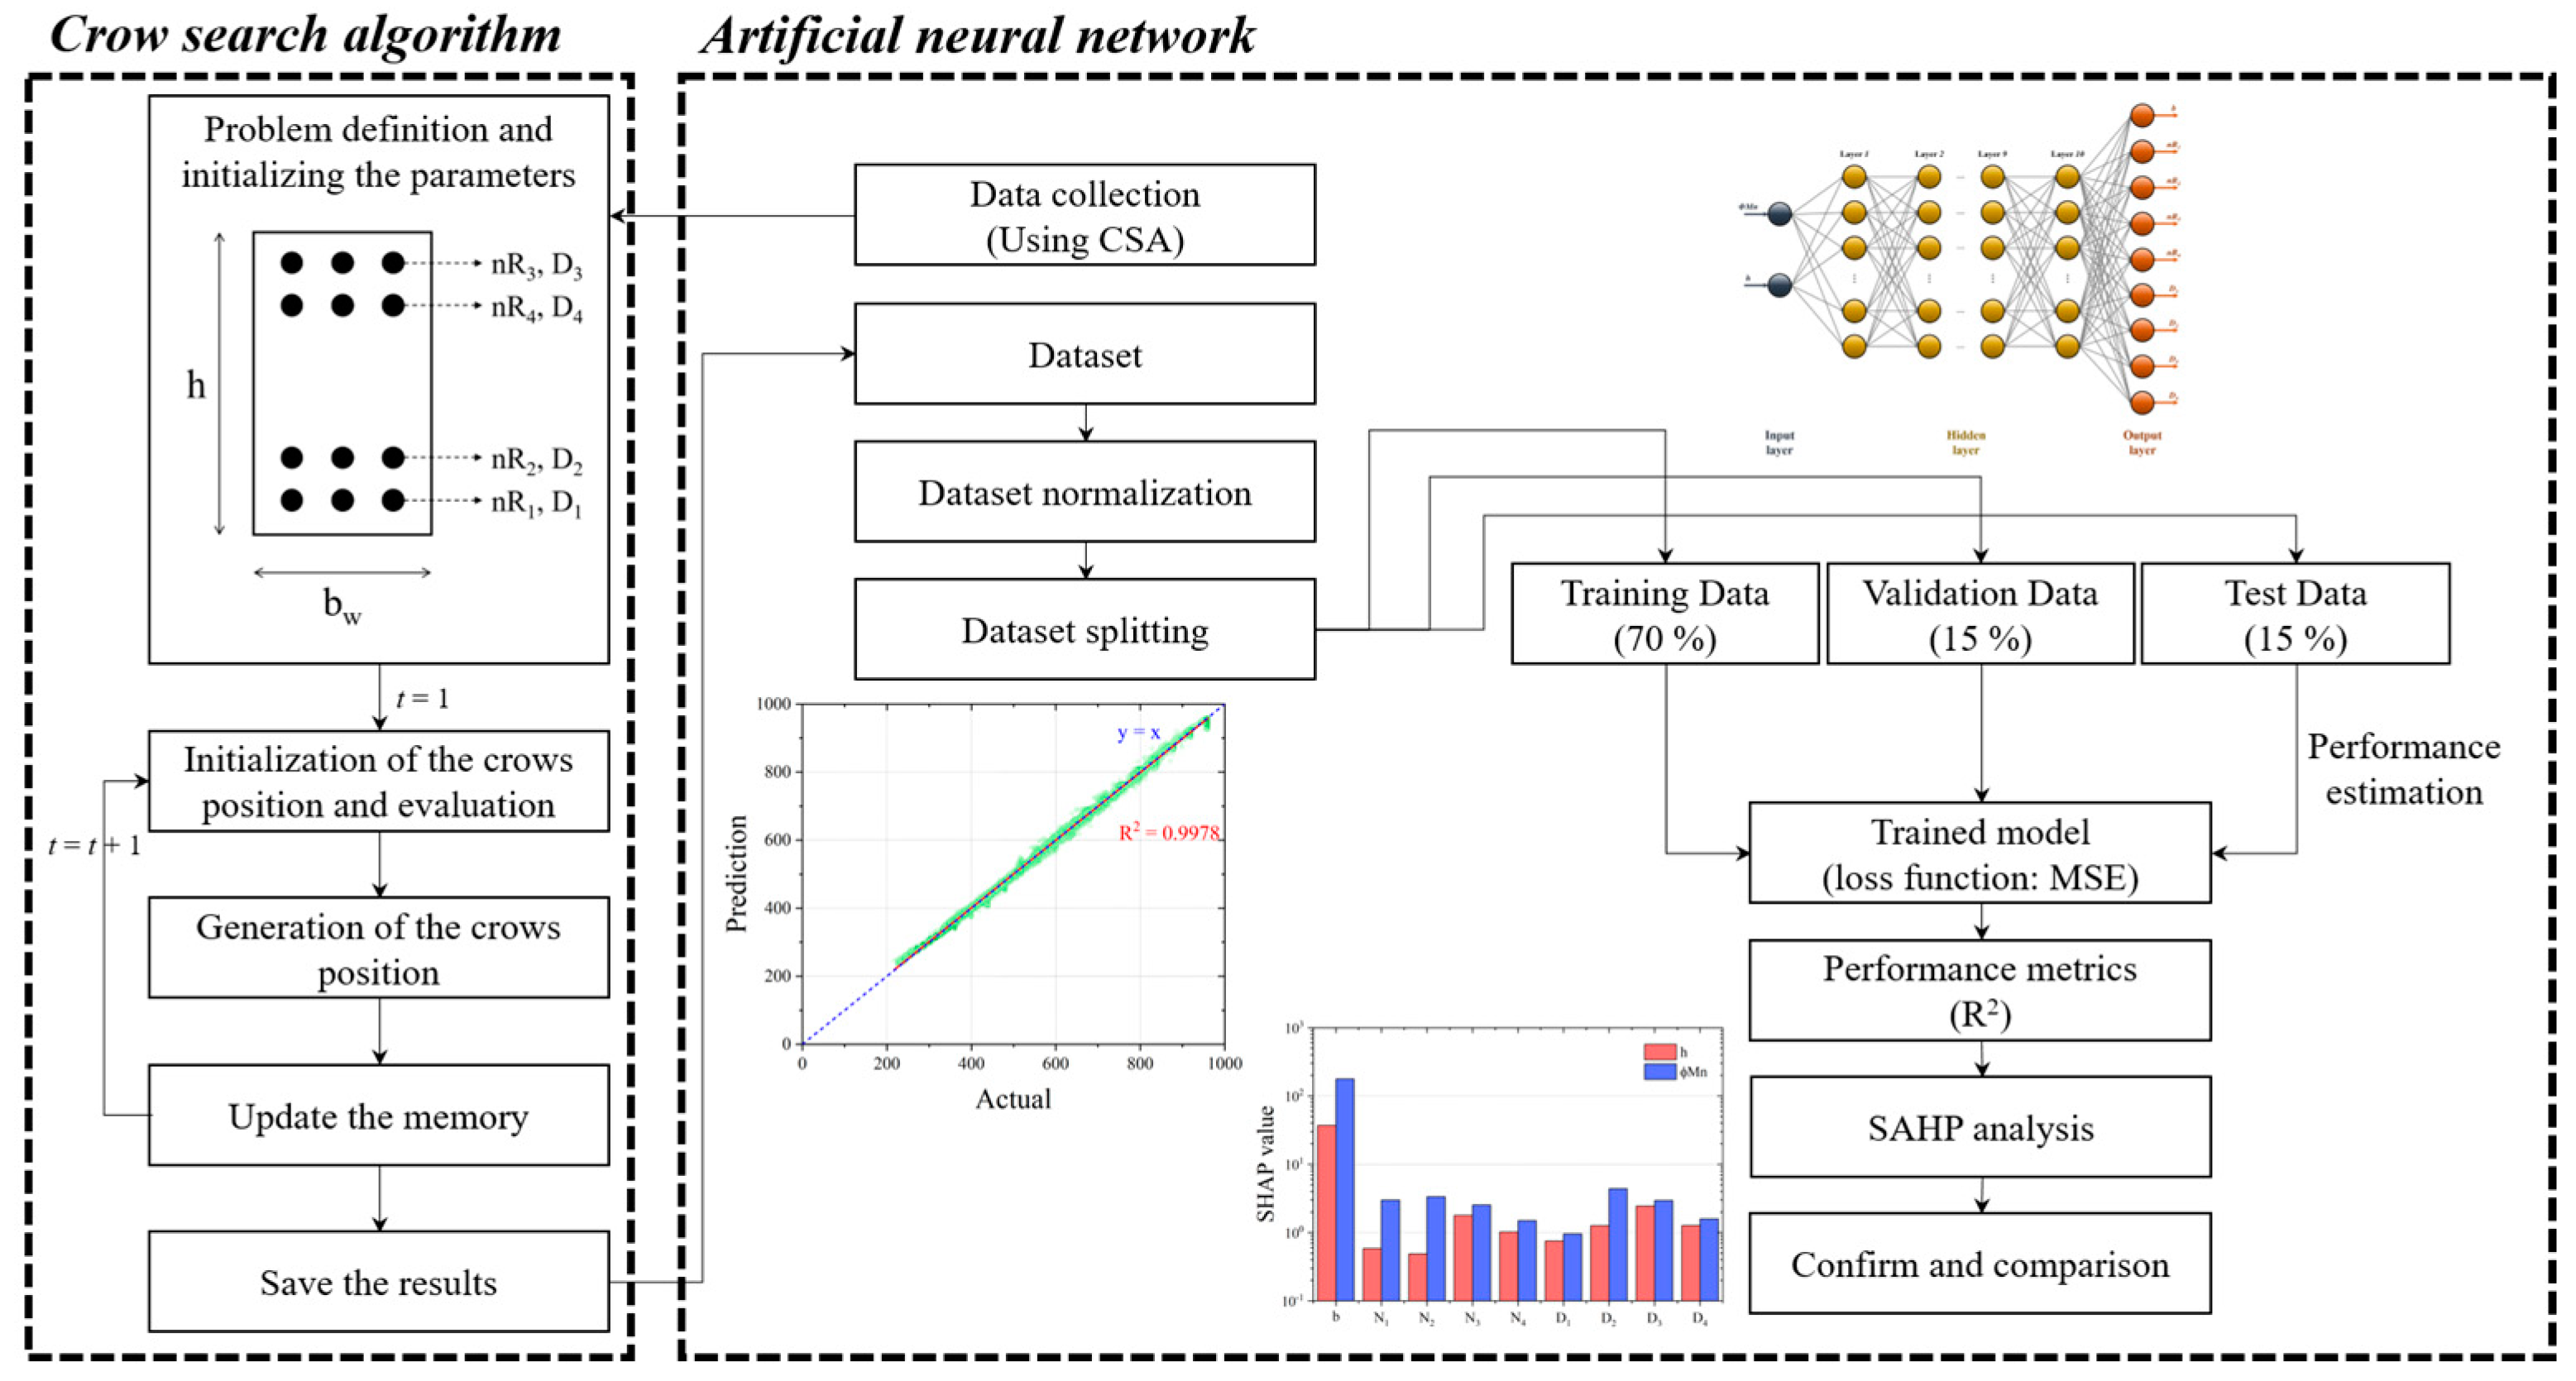
3. Methodology
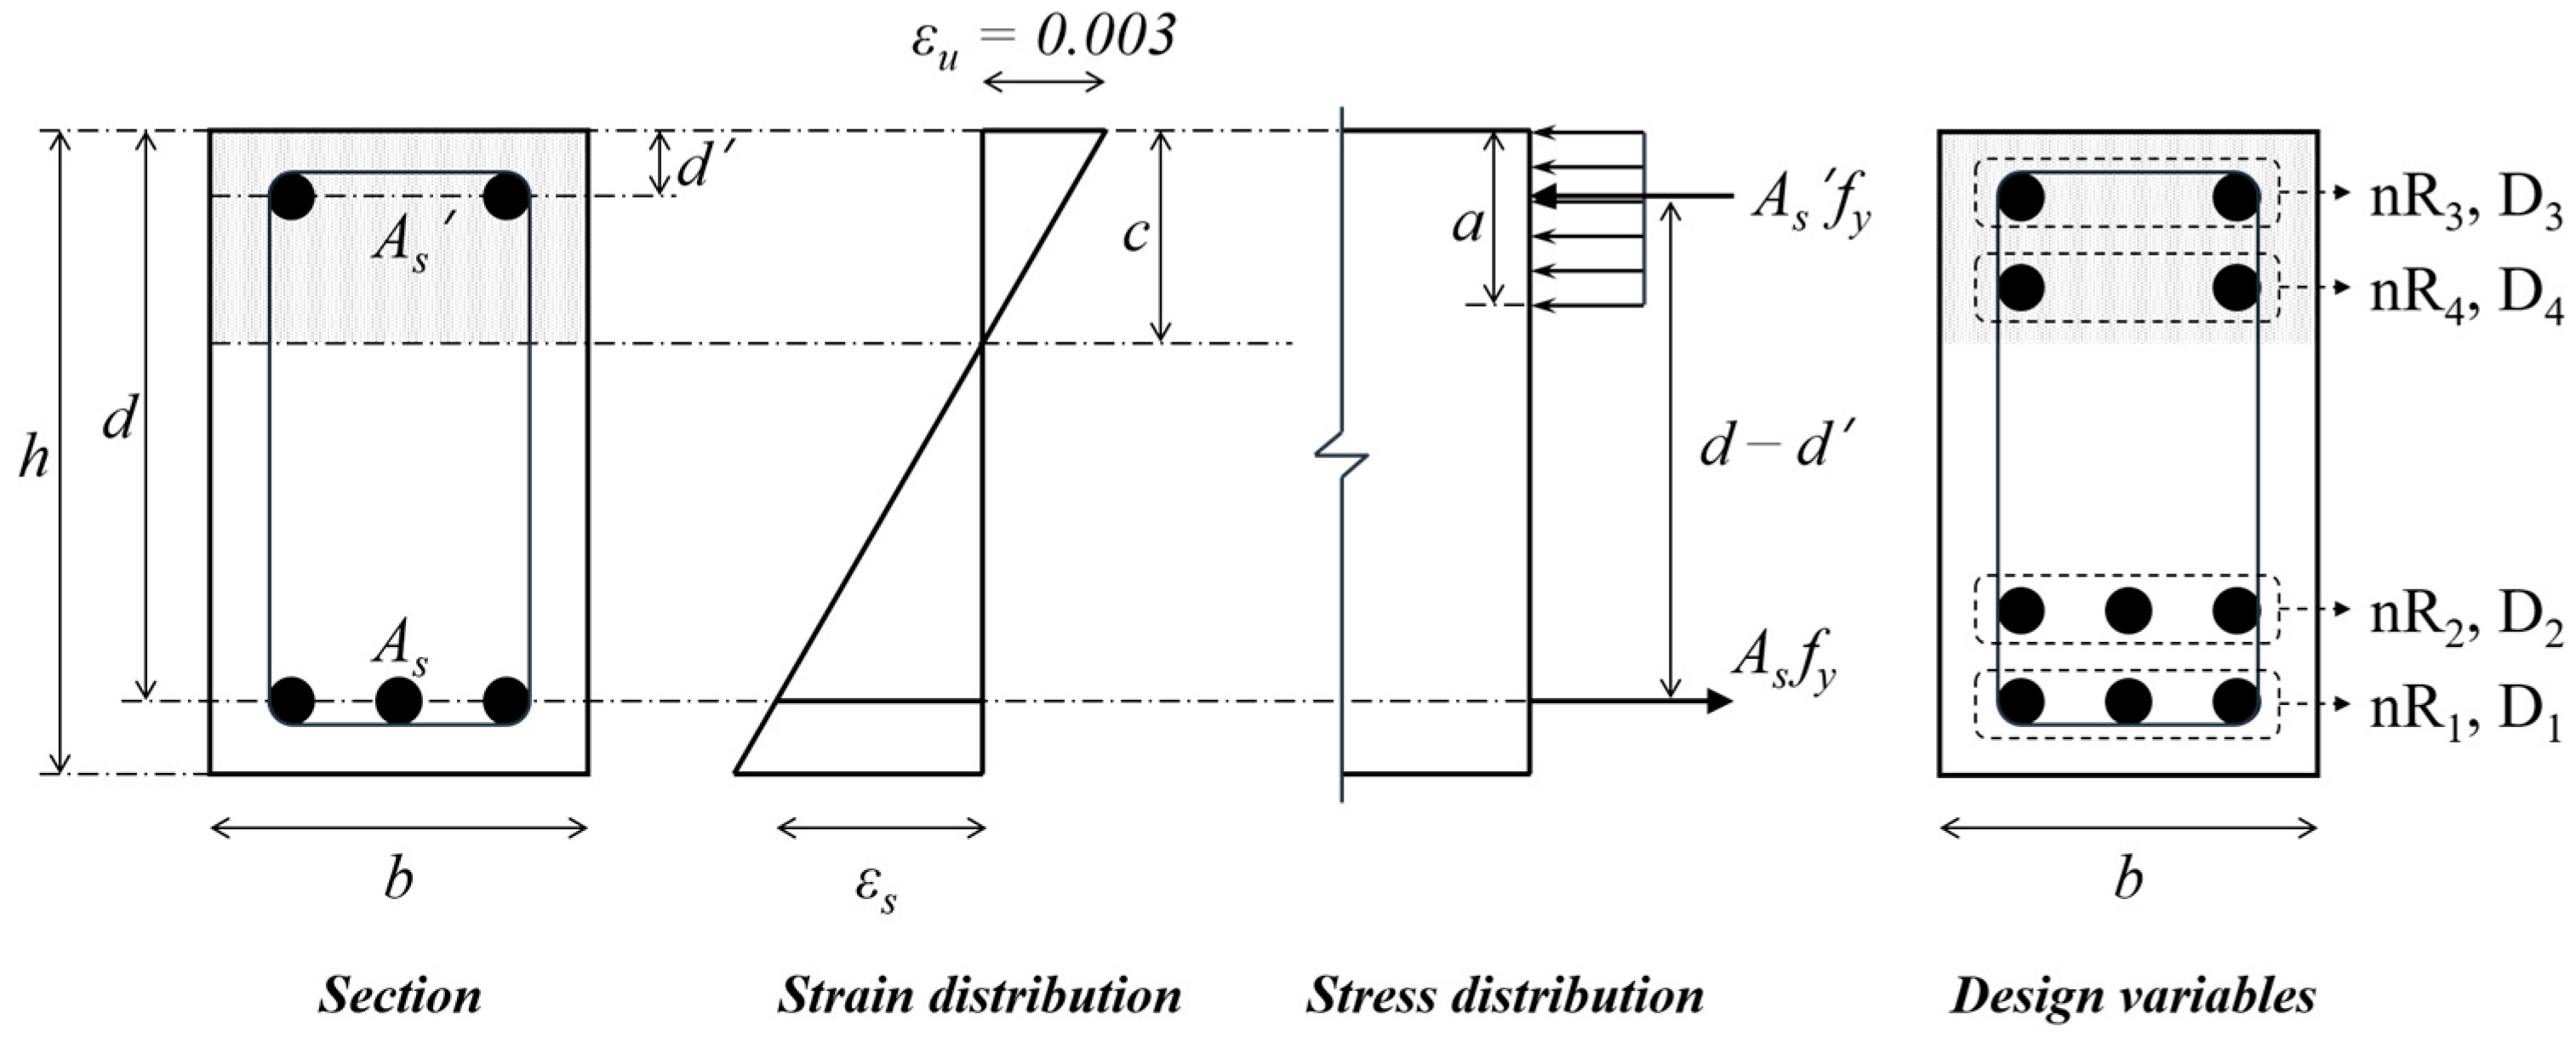
3.1. Dataset: Optimum Design of RC Beam
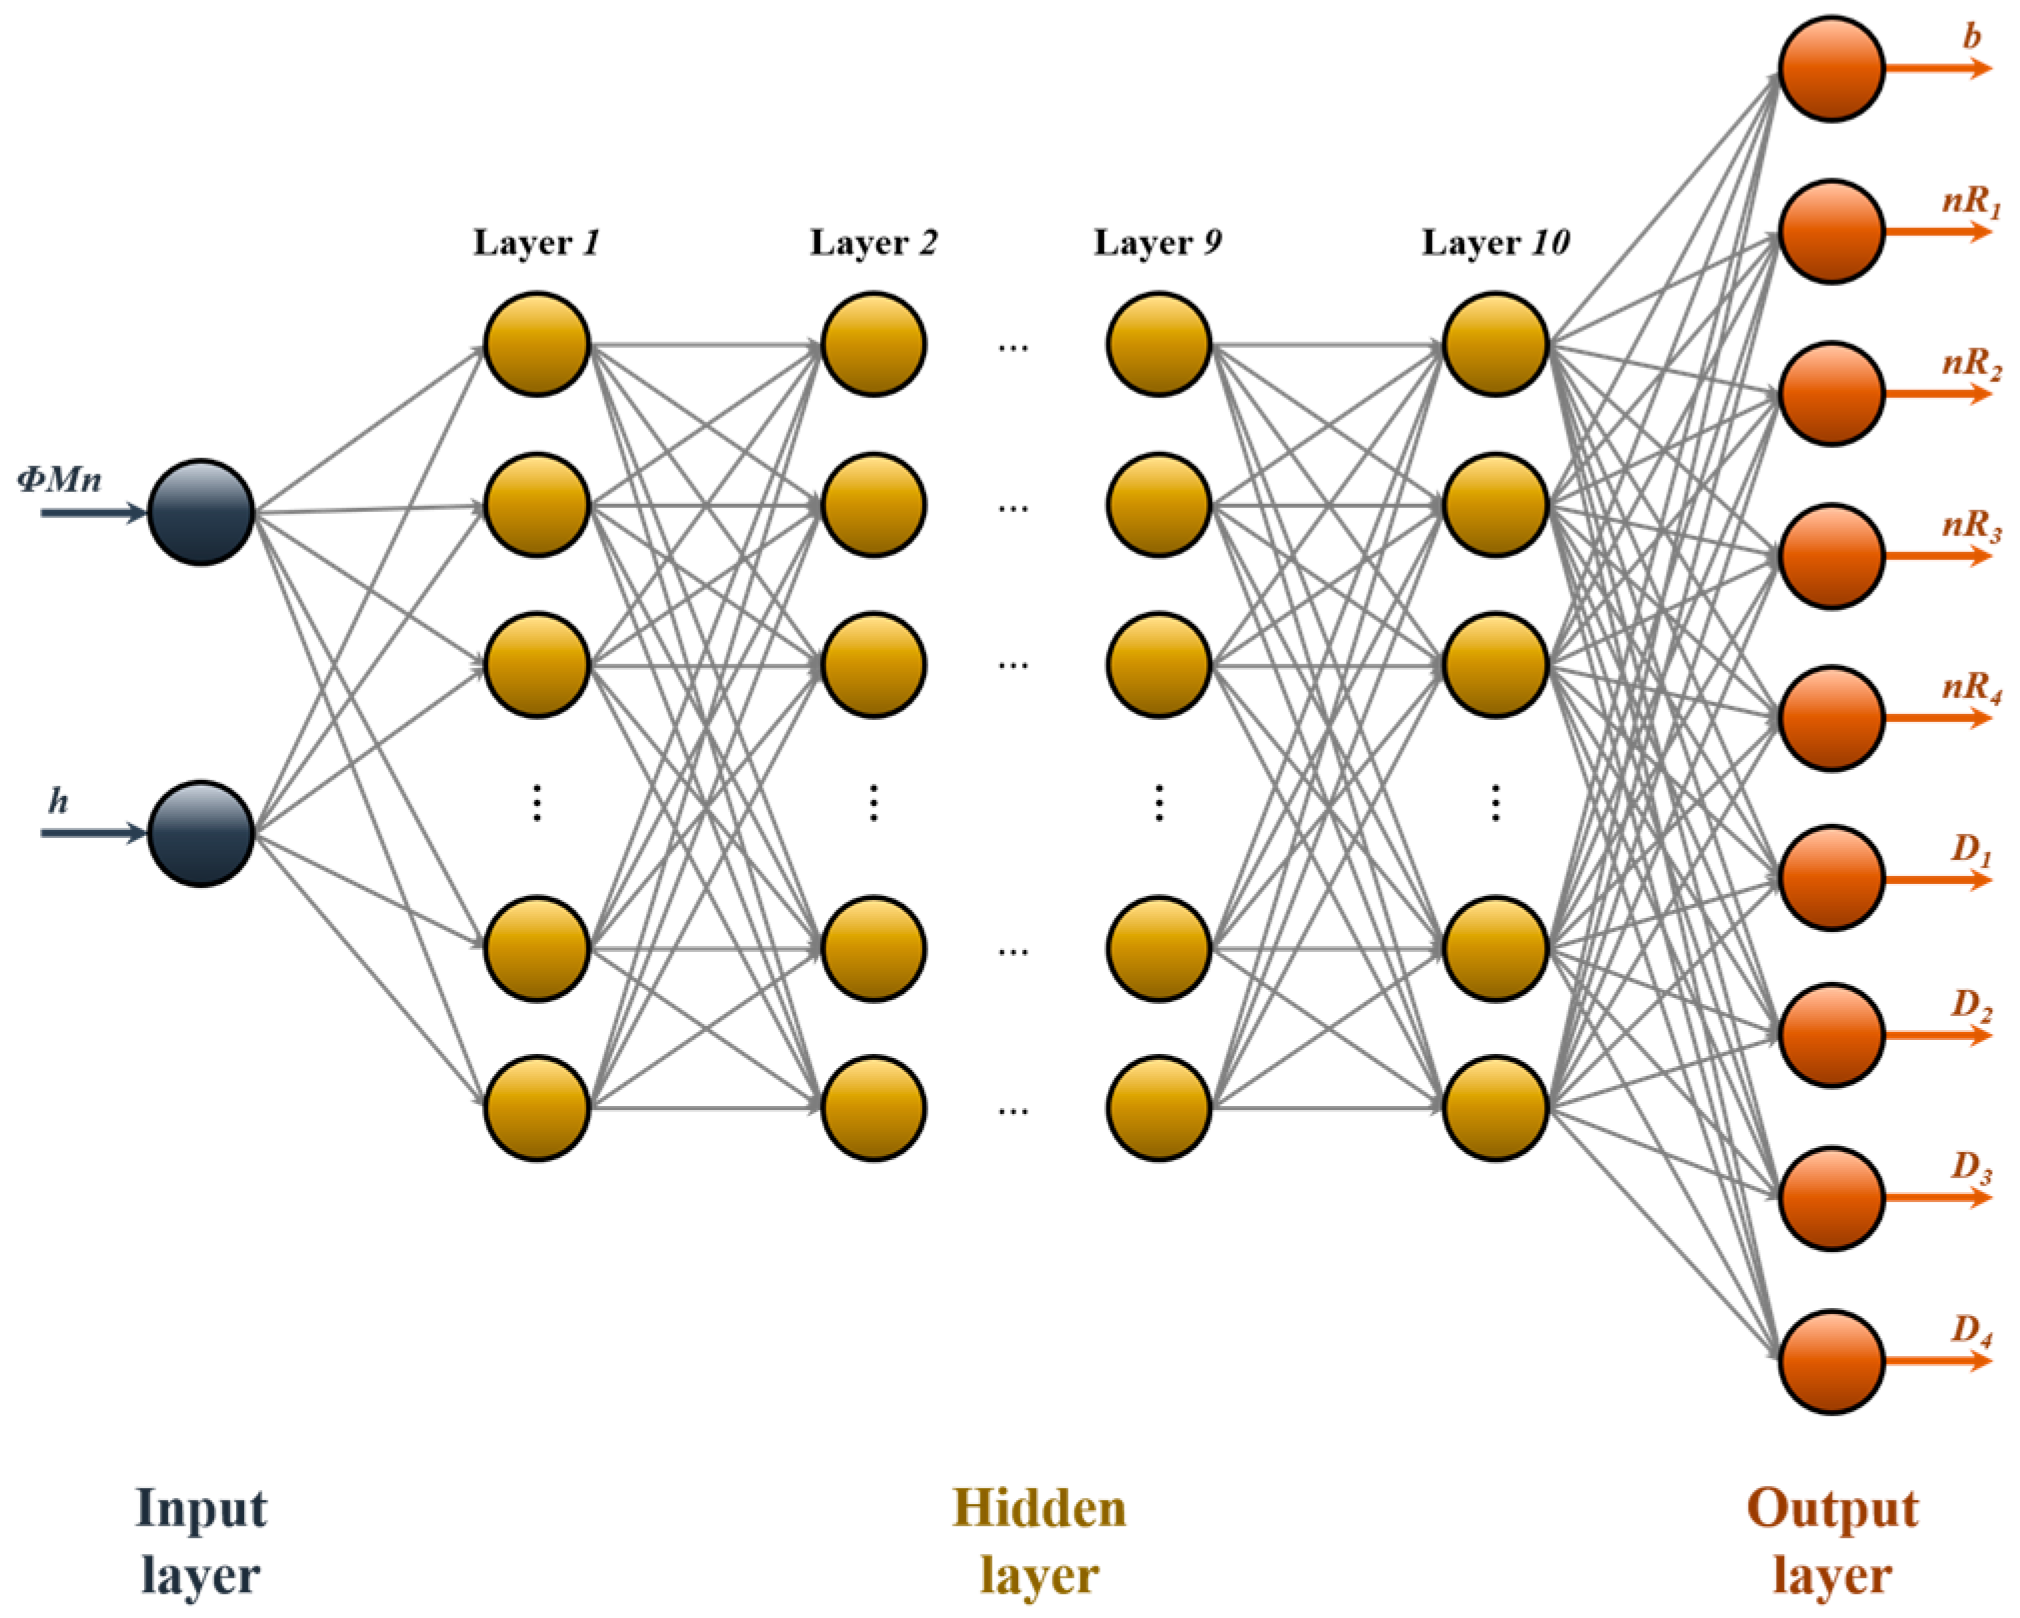
3.2. ANN Model Design and Train
4. Dataset
5. Results and Discussion
5.1. Prediction Results
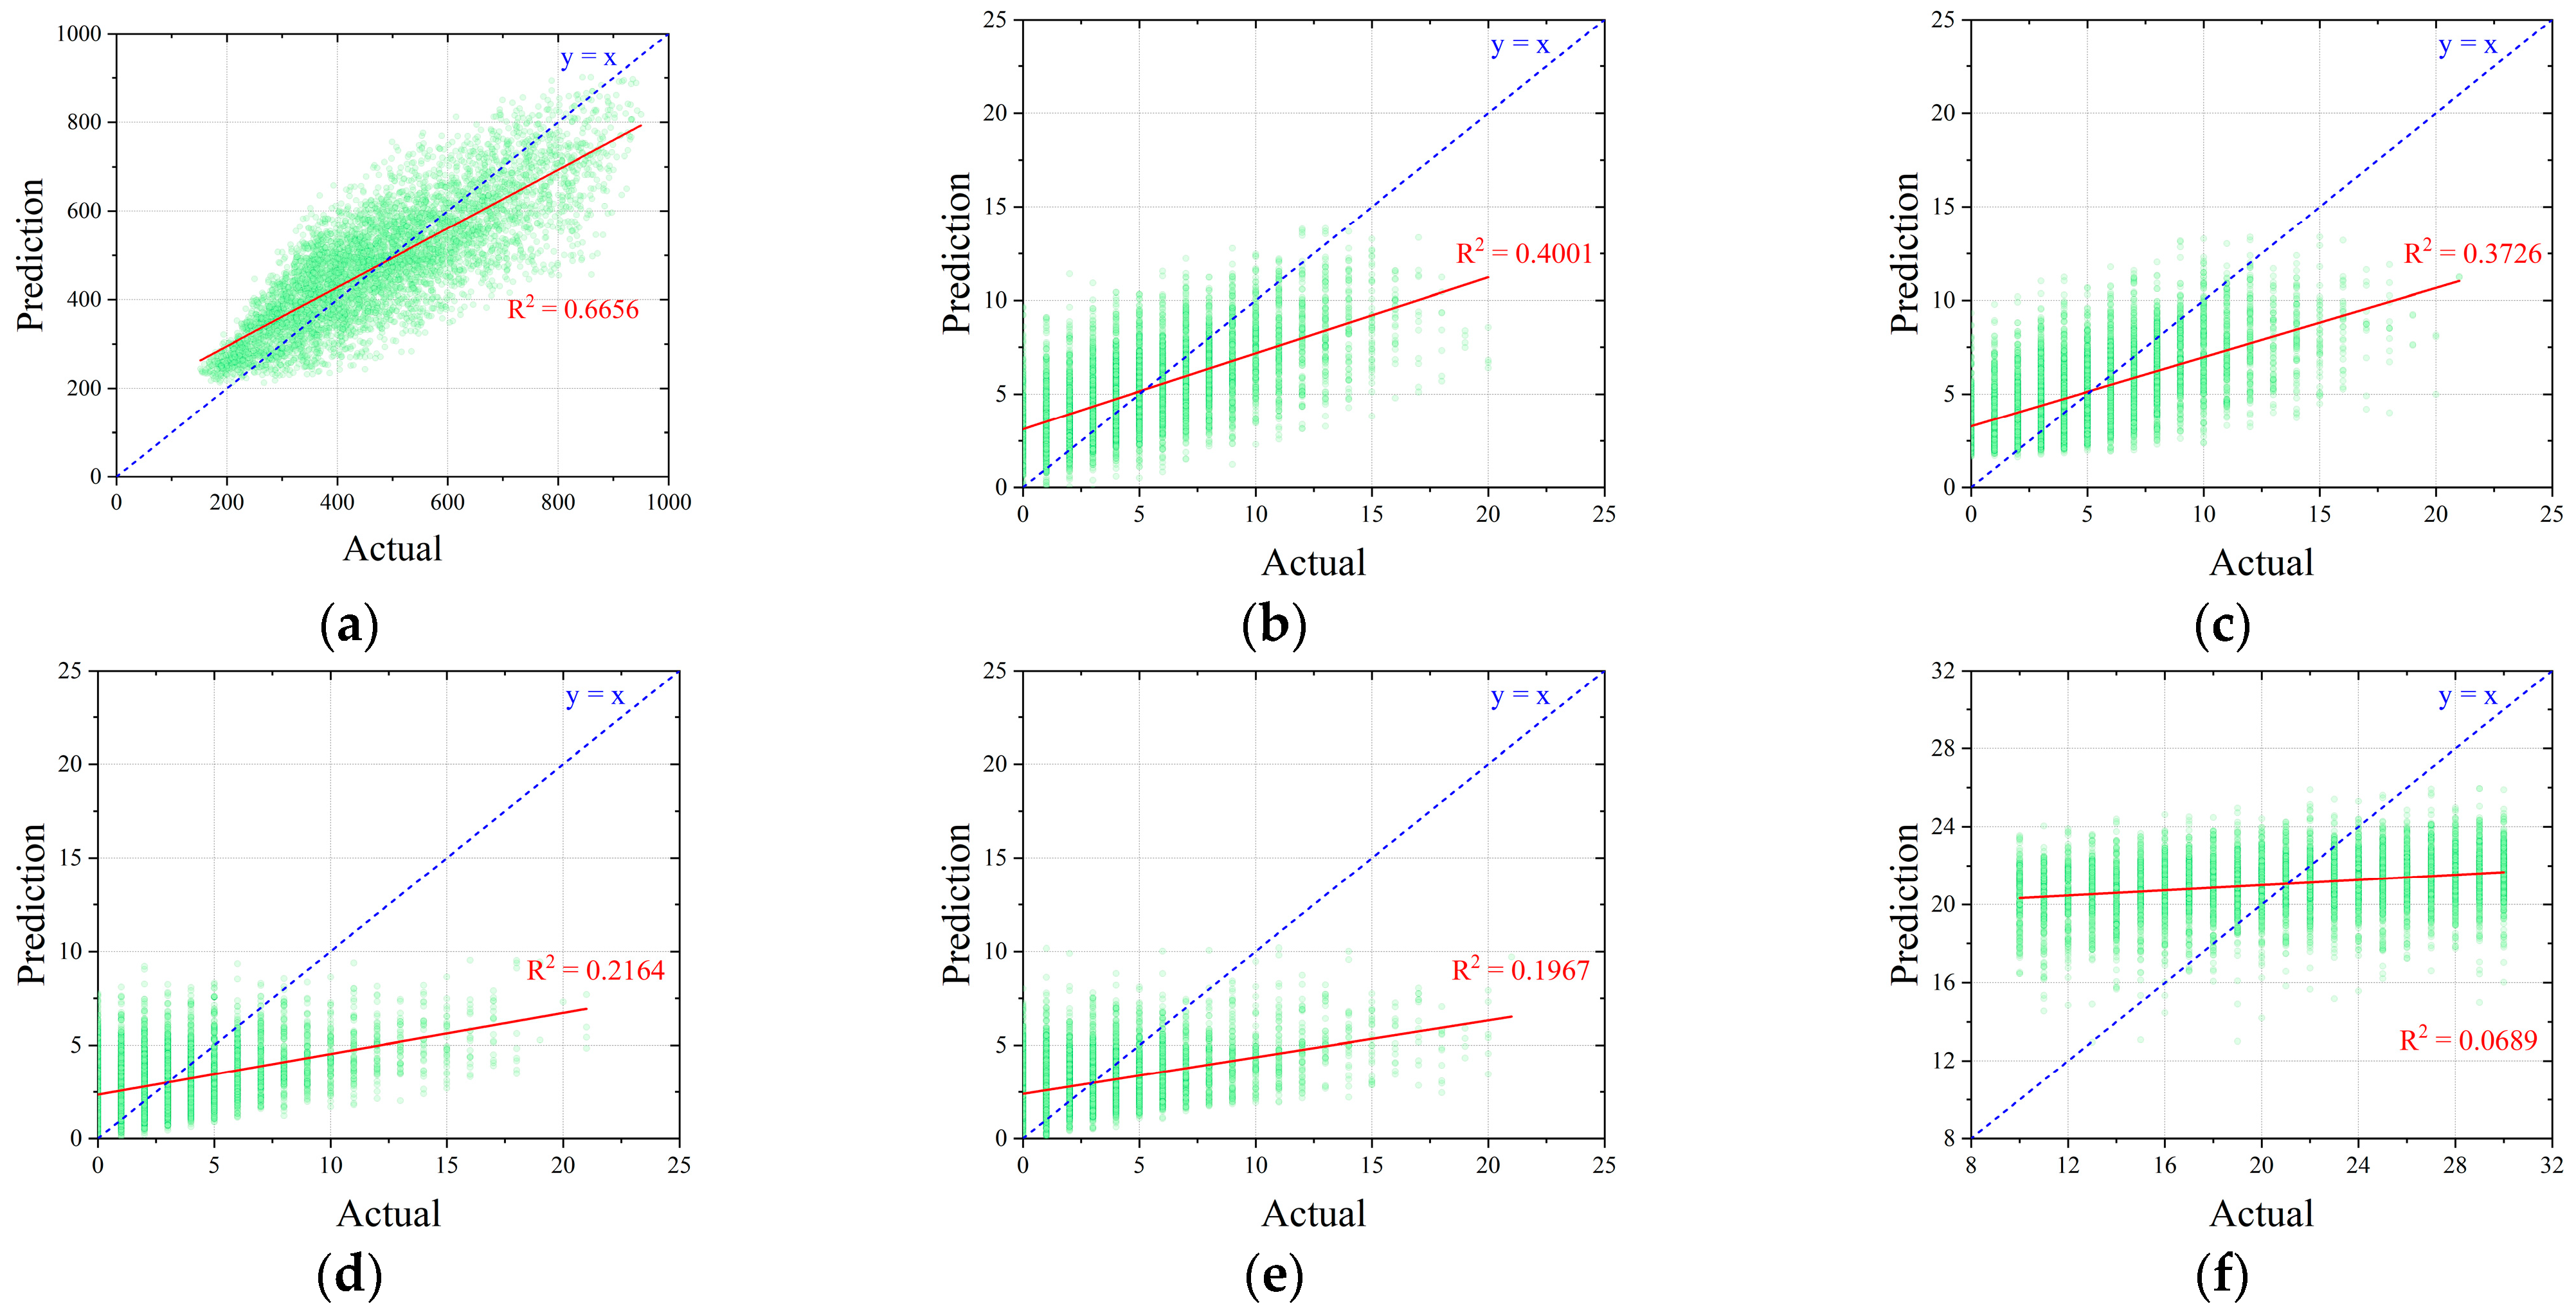
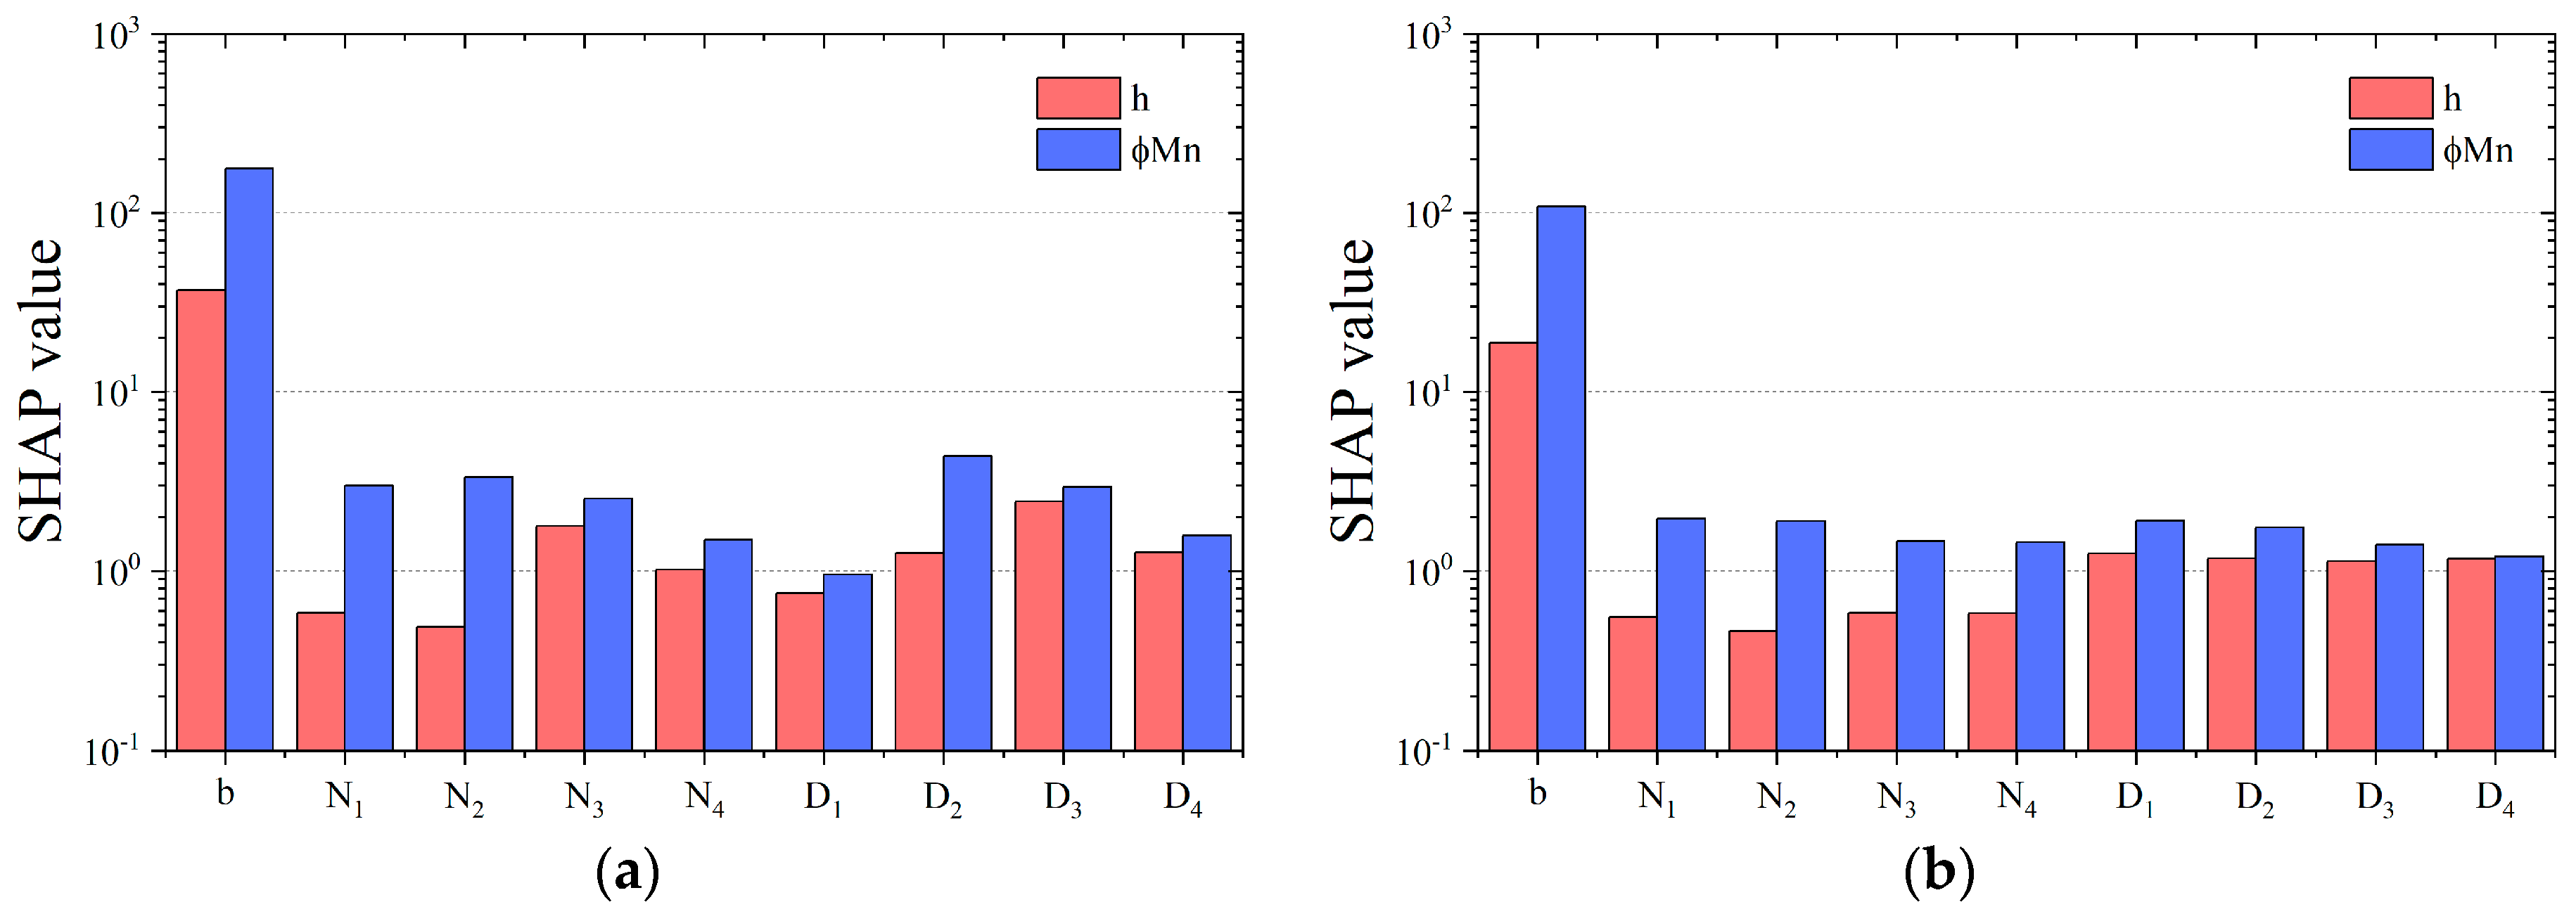
- In the two datasets, the coefficients of determination for b were 0.9978 and 0.6656, respectively, indicating the highest prediction accuracy among all the output variables. This result suggests that b has the most linear relationship with the input variables h and . In contrast, the R2 values for nR1–4 and D1–4 were relatively lower, indicating more nonlinear prediction behavior. This can be attributed to the fact that multiple combinations of nR and D can resist the same , illustrating the presence of diverse solution patterns in the design of RC beam cross-sections and the complex interactions among design variables.
- Among the R2 values for nR in both datasets, nR1 yielded the highest values, 0.9143 and 0.4001, respectively. A decreasing trend in R2 was observed from nR1 to nR4. This reflects the typical reinforcement pattern in RC beams, where tensile reinforcement is prioritized over compressive reinforcement under the loading conditions. In other words, tensile reinforcement exhibits a stronger linear relationship with the input variables than compressive reinforcement.
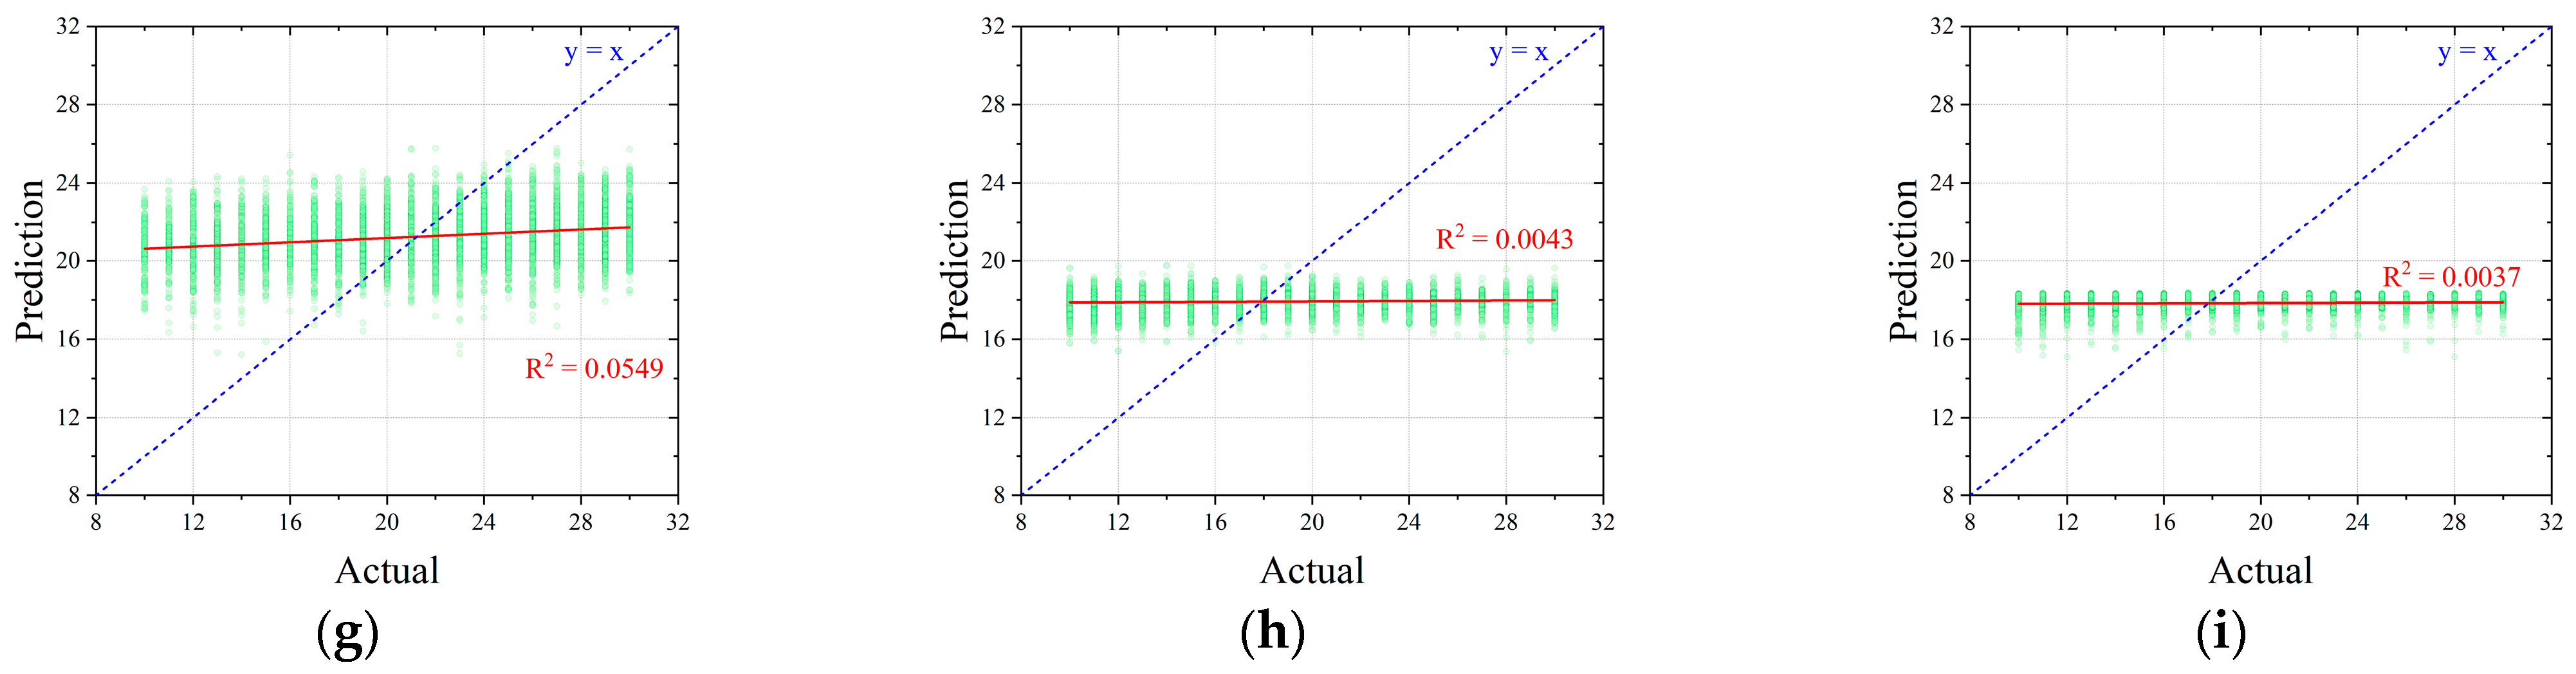
- The R2 values for D showed noticeable differences between the two datasets. In the CSA-based dataset, D2 had the highest R2 value of 0.6778, whereas in the randomly generated dataset, D1 showed the highest R2 value at only 0.0689. Additionally, D1 had the lowest R2 value of 0.2907 in the CSA dataset, while D4 had the lowest value of 0.0037 in the random dataset. The relatively low R2 value of D1 in the CSA dataset is likely due to the tendency of the cost optimization process to favor larger reinforcement bar diameters, depending on the values of h and , rather than producing a wide distribution of diameters.
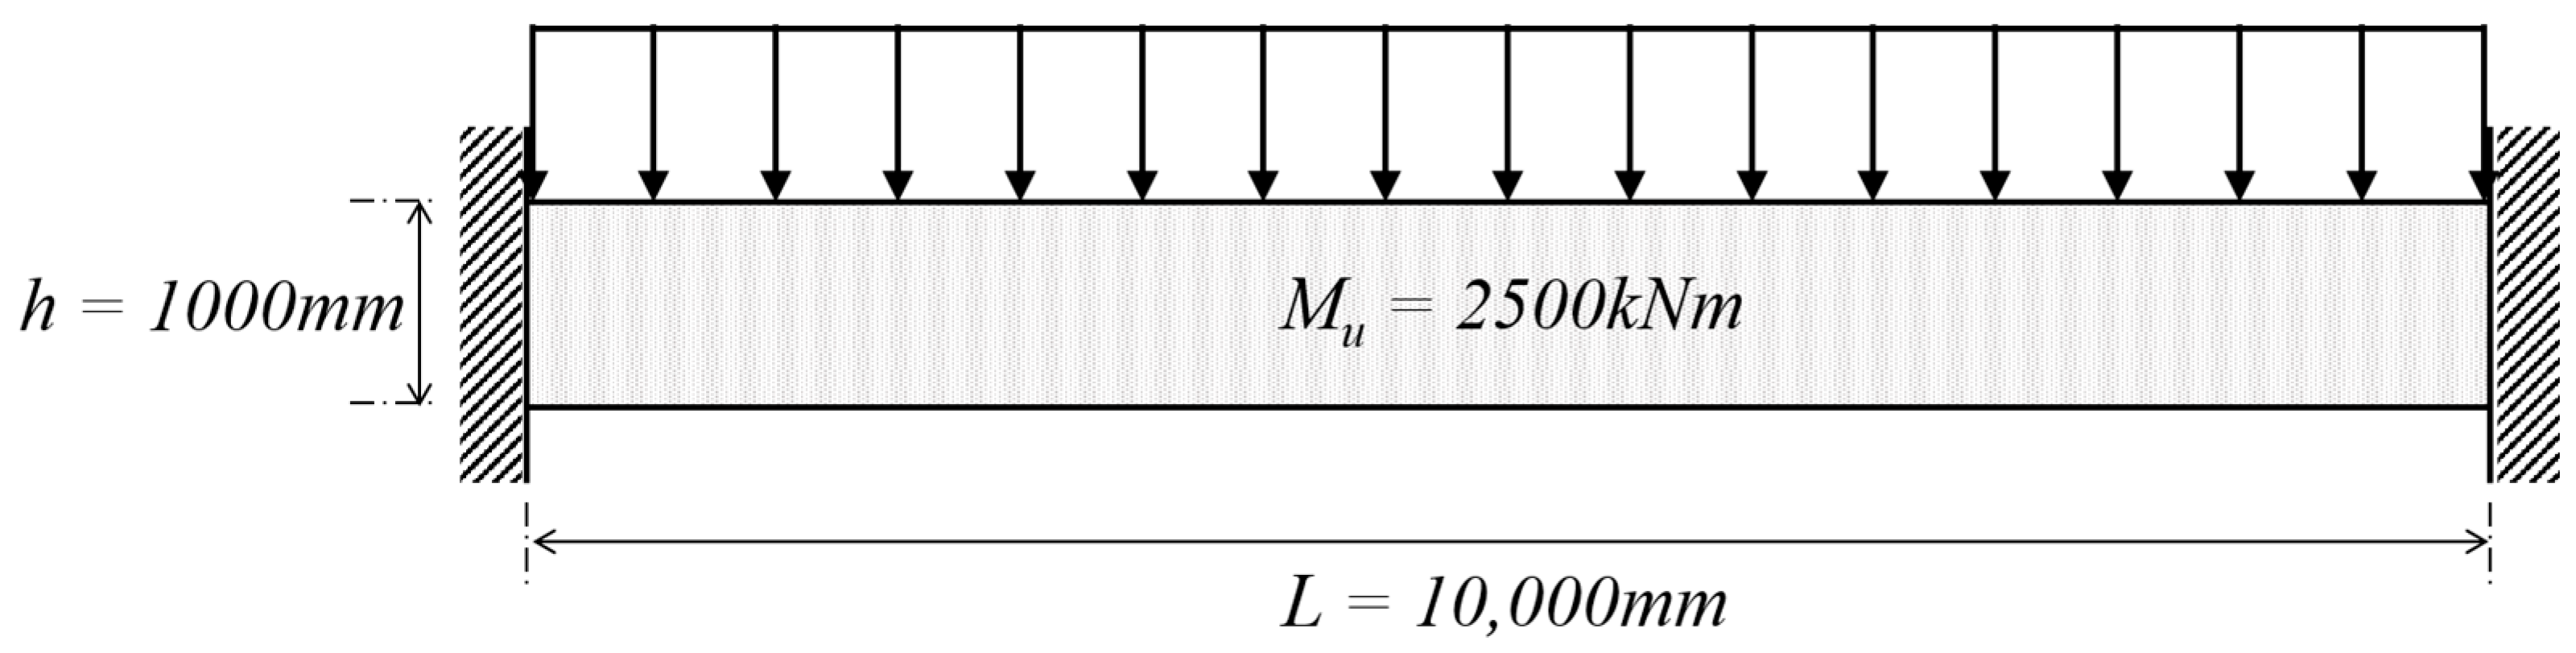
5.2. RC Beam Design Scenario
6. Conclusions and Future Work
Author Contributions
Funding
Data Availability Statement
Conflicts of Interest
References
- Yadav, U.; Shrawankar, U. Artificial Intelligence Across Industries: A Comprehensive Review with a Focus on Education. In AI Applications and Strategies in Teacher Education; Krista, L.K., Ed.; IGI Global: Hershey, PA, USA, 2025; pp. 275–320. [Google Scholar]
- Bhatta, S.; Dang, J. Seismic damage prediction of RC buildings using machine learning. Earthq. Eng. Struct. Dyn. 2023, 52, 3504–3527. [Google Scholar] [CrossRef]
- Hariharan, S.; Karnan, H.; Maheswari, D.U. Automated mechanical ventilator design and analysis using neural network. Sci. Rep. 2025, 15, 3212. [Google Scholar] [CrossRef] [PubMed]
- Aderibigbe, A.A.; Ogunsola, A.D.; Fadiji, E.A.; Adeyi, O.; Adeyi, A.J.; Owoo, E.A. Performance Prediction for Spark Ignition Engines Using Artificial Neural Networks: Model Design and Validation. Asian J. Adv. Res. Rep. 2025, 19, 201–212. [Google Scholar] [CrossRef]
- Zhang, X. Design optimization of irregularity RC structure based on ANN-PSO. Heliyon 2024, 10, e27179. [Google Scholar] [CrossRef]
- Rajput, A. Predictive Modeling of Structural Performance Using Machine Learning: A Comprehensive Review. Int. J. Adv. Eng. AI Robot. Autom. 2024, 1, 34–37. [Google Scholar]
- Alhusban, M.; Alhusban, M.; Alkhawaldeh, A.A. The efficiency of using machine learning techniques in fiber-reinforced-polymer applications in structural engineering. Sustainability 2024, 16, 11. [Google Scholar] [CrossRef]
- Yücel, M.; Bekdaş, G.; Nigdeli, S.M. Evaluation of performance of different machine learning techniques for structural models. In Proceedings of the International Conference on Intelligent Computing & Optimization, Hua Hin, Thailand, 27–28 April 2023. [Google Scholar]
- Kong, X.; Wu, Y.; Zhu, P.; Zhi, P.; Yang, Q. Novel Artificial Neural Network Aided Structural Topology Optimization. Appl. Sci. 2024, 14, 11416. [Google Scholar] [CrossRef]
- Kang, I.S.; Moon, J.W.; Park, J.C. Recent research trends of artificial intelligent machine learning in architectural field-review of domestic and international journal papers. J. Archit. Inst. Korea Struct. Constr. 2017, 33, 63–68. [Google Scholar] [CrossRef]
- Thai, H.T. Machine learning for structural engineering: A state-of-the-art review. Structures 2022, 38, 448–491. [Google Scholar] [CrossRef]
- Negrin, I.; Kripka, M.; Yepes, V. Metamodel-assisted design optimization in the field of structural engineering: A literature review. Structures 2023, 52, 609–631. [Google Scholar] [CrossRef]
- Armaghani, D.J.; Hatzigeorgiou, G.D.; Karamani, C.; Skentou, A.D.; Zoumpoulaki, I.; Asteris, P.G. Soft computing-based techniques for concrete beams shear strength. Procedia Struct. Integr. 2019, 17, 924–933. [Google Scholar] [CrossRef]
- Abambres, M.; Lantsoght, E.O. Neural network-based formula for shear capacity prediction of one-way slabs under concentrated loads. Eng. Struct. 2020, 211, 110501. [Google Scholar] [CrossRef]
- Tran, V.L.; Kim, S.E. A practical ANN model for predicting the PSS of two-way reinforced concrete slabs. Eng. Comput. 2021, 37, 2303–2327. [Google Scholar] [CrossRef]
- Hong, W.K.; Nguyen, V.T.; Nguyen, M.C. Artificial intelligence-based novel design charts for doubly reinforced concrete beams. J. Asian Archit. Build. Eng. 2022, 21, 1497–1519. [Google Scholar] [CrossRef]
- Hong, W.K.; Nguyen, M.C.; Pham, T.D. Optimized Interaction PM diagram for Rectangular Reinforced Concrete Column based on Artificial Neural Networks. J. Asian Archit. Build. Eng. 2023, 22, 201–225. [Google Scholar] [CrossRef]
- Das, S.; Datta, A.K.; Topdar, P.; Pal, A. Innovative approaches to concrete health monitoring: Wavelet transform and artificial intelligence models. Asian J. Civ. Eng. 2024, 26, 107–120. [Google Scholar] [CrossRef]
- Hong, W.K.; Nguyen, M.C.; Pham, T.D. Pre-tensioned concrete beams optimized with a unified function of objective (UFO) using ANN-based Hong-Lagrange method. J. Asian Archit. Build. Eng. 2024, 23, 1573–1595. [Google Scholar] [CrossRef]
- Kim, J.; Lee, D.; Ubysz, A. Comparative analysis of cement grade and cement strength as input features for machine learning-based concrete strength prediction. Case Stud. Constr. Mater. 2024, 21, e03557. [Google Scholar] [CrossRef]
- Afzal, M.; Liu, Y.; Cheng, J.C.; Gan, V.J. Reinforced concrete structural design optimization: A critical review. J. Clean. Prod. 2020, 260, 120623. [Google Scholar] [CrossRef]
- Toklu, Y.C.; Bekdas, G.; Nigdeli, S.M. Metaheuristics for Structural Design and Analysis, 3rd ed.; John Wiley & Sons: Hoboken, NJ, USA, 2021. [Google Scholar]
- Coello, C.C.; Hernández, F.S.; Farrera, F.A. Optimal design of reinforced concrete beams using genetic algorithms. Expert Syst. Appl. 1997, 12, 101–108. [Google Scholar] [CrossRef]
- Koumousis, V.K.; Arsenis, S.J. Genetic algorithms in optimal detailed design of reinforced concrete members. Comput.-Aided Civ. Infrastruct. Eng. 1998, 13, 43–52. [Google Scholar] [CrossRef]
- Bekdaş, G.; Nigdeli, S.M. Optimum design of reinforced concrete beams using teaching-learning-based optimization. In Proceedings of the 3rd International Conference on Optimization Techniques in Engineering (OTENG’15), Rome, Italy, 7–9 November 2015. [Google Scholar]
- Amaral, R.R.; Barazzutti, L.F.; Gomes, H.M. Optimization of reinforced concrete structures using population-based metaheuristic algorithms. Ciência Nat. 2023, 45, e74927. [Google Scholar] [CrossRef]
- Duysak, Y.; Nigdeli, S.M.; Bekdaş, G. Optimum design of reinforced concrete beam sections with JAYA algorithm. Chall. J. Concr. Res. Lett. 2024, 15, 134–141. [Google Scholar] [CrossRef]
- Gupta, D.; Sundaram, S.; Khanna, A.; Ella Hassanien, A.; de Albuquerque, V.H.C. Improved diagnosis of Parkinson’s disease using optimized crow search algorithm. Comput. Electr. Eng. 2018, 68, 412–424. [Google Scholar] [CrossRef]
- Hussien, A.G.; Amin, M.; Wang, M.; Liang, G.; Alsanad, A.; Gumaei, A.; Chen, H. Crow search algorithm: Theory, recent advances, and applications. IEEE Access 2020, 8, 173548–173565. [Google Scholar] [CrossRef]
- Meraihi, Y.; Gabis, A.; Ramdane-Cherif, A.; Acheli, D. A comprehensive survey of Crow Search Algorithm and its applications. Artif. Intell. Rev. 2021, 54, 2669–2716. [Google Scholar] [CrossRef]
- McCulloch, W.S.; Pitts, W.A. logical calculus of the ideas immanent in nervous activity. Bull. Math. Biophys. 1943, 5, 115–133. [Google Scholar] [CrossRef]
- Kim, P. MATLAB Deep Learning, 1st ed.; Apress: Berkeley, CA, USA, 2017; p. 151. [Google Scholar]
- Li, G.; Zhang, T.; Tsai, C.Y.; Yao, L.; Lu, Y.; Tang, J. Review of the metaheuristic algorithms in applications: Visual analysis based on bibliometrics (1994–2023). Expert Syst. Appl. 2024, 255, 124857. [Google Scholar] [CrossRef]
- Ikotun, A.M.; Ezugwu, A.E.; Abualigah, L.; Abuhaija, B.; Heming, J.K. means clustering algorithms: A comprehensive review, variants analysis, and advances in the era of big data. Inf. Sci. 2023, 622, 178–210. [Google Scholar] [CrossRef]
- Lee, D.; Kim, J.; Shon, S.; Lee, S. An Advanced Crow Search Algorithm for Solving Global Optimization Problem. Appl. Sci. 2023, 13, 6628. [Google Scholar] [CrossRef]
- Lee, D.; Kim, H.; Kim, J.; Lee, S. Improved convergence performance of advanced crow search algorithm and application to optimal design of large-scale truss dome structures. J. Asian Archit. Build. Eng. 2024, 1–16. [Google Scholar] [CrossRef]
- Sekar, K.R. Metaheuristic Algorithms in Optimizing Structural Design of Bridges: A Review. Metaheuristic Optim. Rev. 2025, 3, 11–20. [Google Scholar] [CrossRef]
- Askarzadeh, A. A novel metaheuristic method for solving constrained engineering optimization problems: Crow search algorithm. Comput. Struct. 2016, 169, 1–12. [Google Scholar] [CrossRef]
- Zamani, H.; Nadimi-Shahraki, M.H. An evolutionary crow search algorithm equipped with interactive memory mechanism to optimize artificial neural network for disease diagnosis. Biomed. Signal Process. Control 2024, 90, 105879. [Google Scholar] [CrossRef]
- Kaklauskas, G.; Sokolov, A.A. peculiar value of M to Mcr ratio: Reconsidering assumptions of curvature analysis of reinforced concrete beams. Appl. Eng. Sci. 2021, 7, 100053. [Google Scholar]
- ACI CODE-318-14; Building Code Requirements for Structural Concrete and Commentary. American Concrete Institute: Farmington Hills, MI, USA, 2014; p. 411.
- Nu, Q.; Smith, S.M. Direct Differentiation Based Hessian Formulation for Training Multilayer Feed forward Neural Networks using the LM Algorithm-Performance Comparison with Conventional Jacobian-Based Learning. Glob. J. Technol. Optim. 2018, 9, 223. [Google Scholar]
- Xue, Y. An Overview of Overfitting and its Solutions. J. Phys. Conf. Ser. 2019, 1168, 022022. [Google Scholar]
- Greenwood, G.W.; Abbass, H.; Hussein, A. Interpretation of Neural Network Players for a Generalized Divide the Dollar Game Using SHAP Values. In Proceedings of the 2023 IEEE Symposium Series on Computational Intelligence (SSCI), Mexico City, Mexico, 5–8 December 2023. [Google Scholar]


| CAmax | Ccover | Dstirrup |
|---|---|---|
| 16 mm | 35 mm | 10 mm |
| N | MaxItr | fl | AP |
|---|---|---|---|
| 500 | 5000 | 2 | 0.1 |
| Index | Results of CSA Dataset | Results of Random Dataset | |
|---|---|---|---|
| Shape | 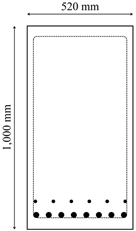 | 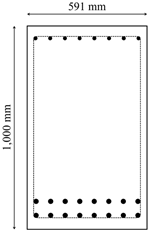 | |
| Top reinforcement | 3 layer | - | 4-HD15 |
| 4 layer | - | - | |
| Bottom reinforcement | 2 layer | 6-HD15 | 7-HD22 |
| 1 layer | 8-HD28 | 7-HD23 | |
| 2575.73 kN·m | 2516.87 kN·m | ||
| Cost | KRW 947,429.70 | KRW 1,145,314.83 | |
Disclaimer/Publisher’s Note: The statements, opinions and data contained in all publications are solely those of the individual author(s) and contributor(s) and not of MDPI and/or the editor(s). MDPI and/or the editor(s) disclaim responsibility for any injury to people or property resulting from any ideas, methods, instructions or products referred to in the content. |
© 2025 by the authors. Licensee MDPI, Basel, Switzerland. This article is an open access article distributed under the terms and conditions of the Creative Commons Attribution (CC BY) license (https://creativecommons.org/licenses/by/4.0/).
Share and Cite
So, J.; Lee, S.; Seong, J.; Lee, D. The Optimal Cost Design of Reinforced Concrete Beams Using an Artificial Neural Network—The Effectiveness of Cost-Optimized Training Data. Buildings 2025, 15, 1577. https://doi.org/10.3390/buildings15091577
So J, Lee S, Seong J, Lee D. The Optimal Cost Design of Reinforced Concrete Beams Using an Artificial Neural Network—The Effectiveness of Cost-Optimized Training Data. Buildings. 2025; 15(9):1577. https://doi.org/10.3390/buildings15091577
Chicago/Turabian StyleSo, Jaemin, Seungjae Lee, Jonghyeok Seong, and Donwoo Lee. 2025. "The Optimal Cost Design of Reinforced Concrete Beams Using an Artificial Neural Network—The Effectiveness of Cost-Optimized Training Data" Buildings 15, no. 9: 1577. https://doi.org/10.3390/buildings15091577
APA StyleSo, J., Lee, S., Seong, J., & Lee, D. (2025). The Optimal Cost Design of Reinforced Concrete Beams Using an Artificial Neural Network—The Effectiveness of Cost-Optimized Training Data. Buildings, 15(9), 1577. https://doi.org/10.3390/buildings15091577