

Visual Perception of Environmental Elements Analysis in Historical District Based on Eye-Tracking and Semi-Structured Interview: A Case Study in Xining, Taishan

Abstract
1. Introduction
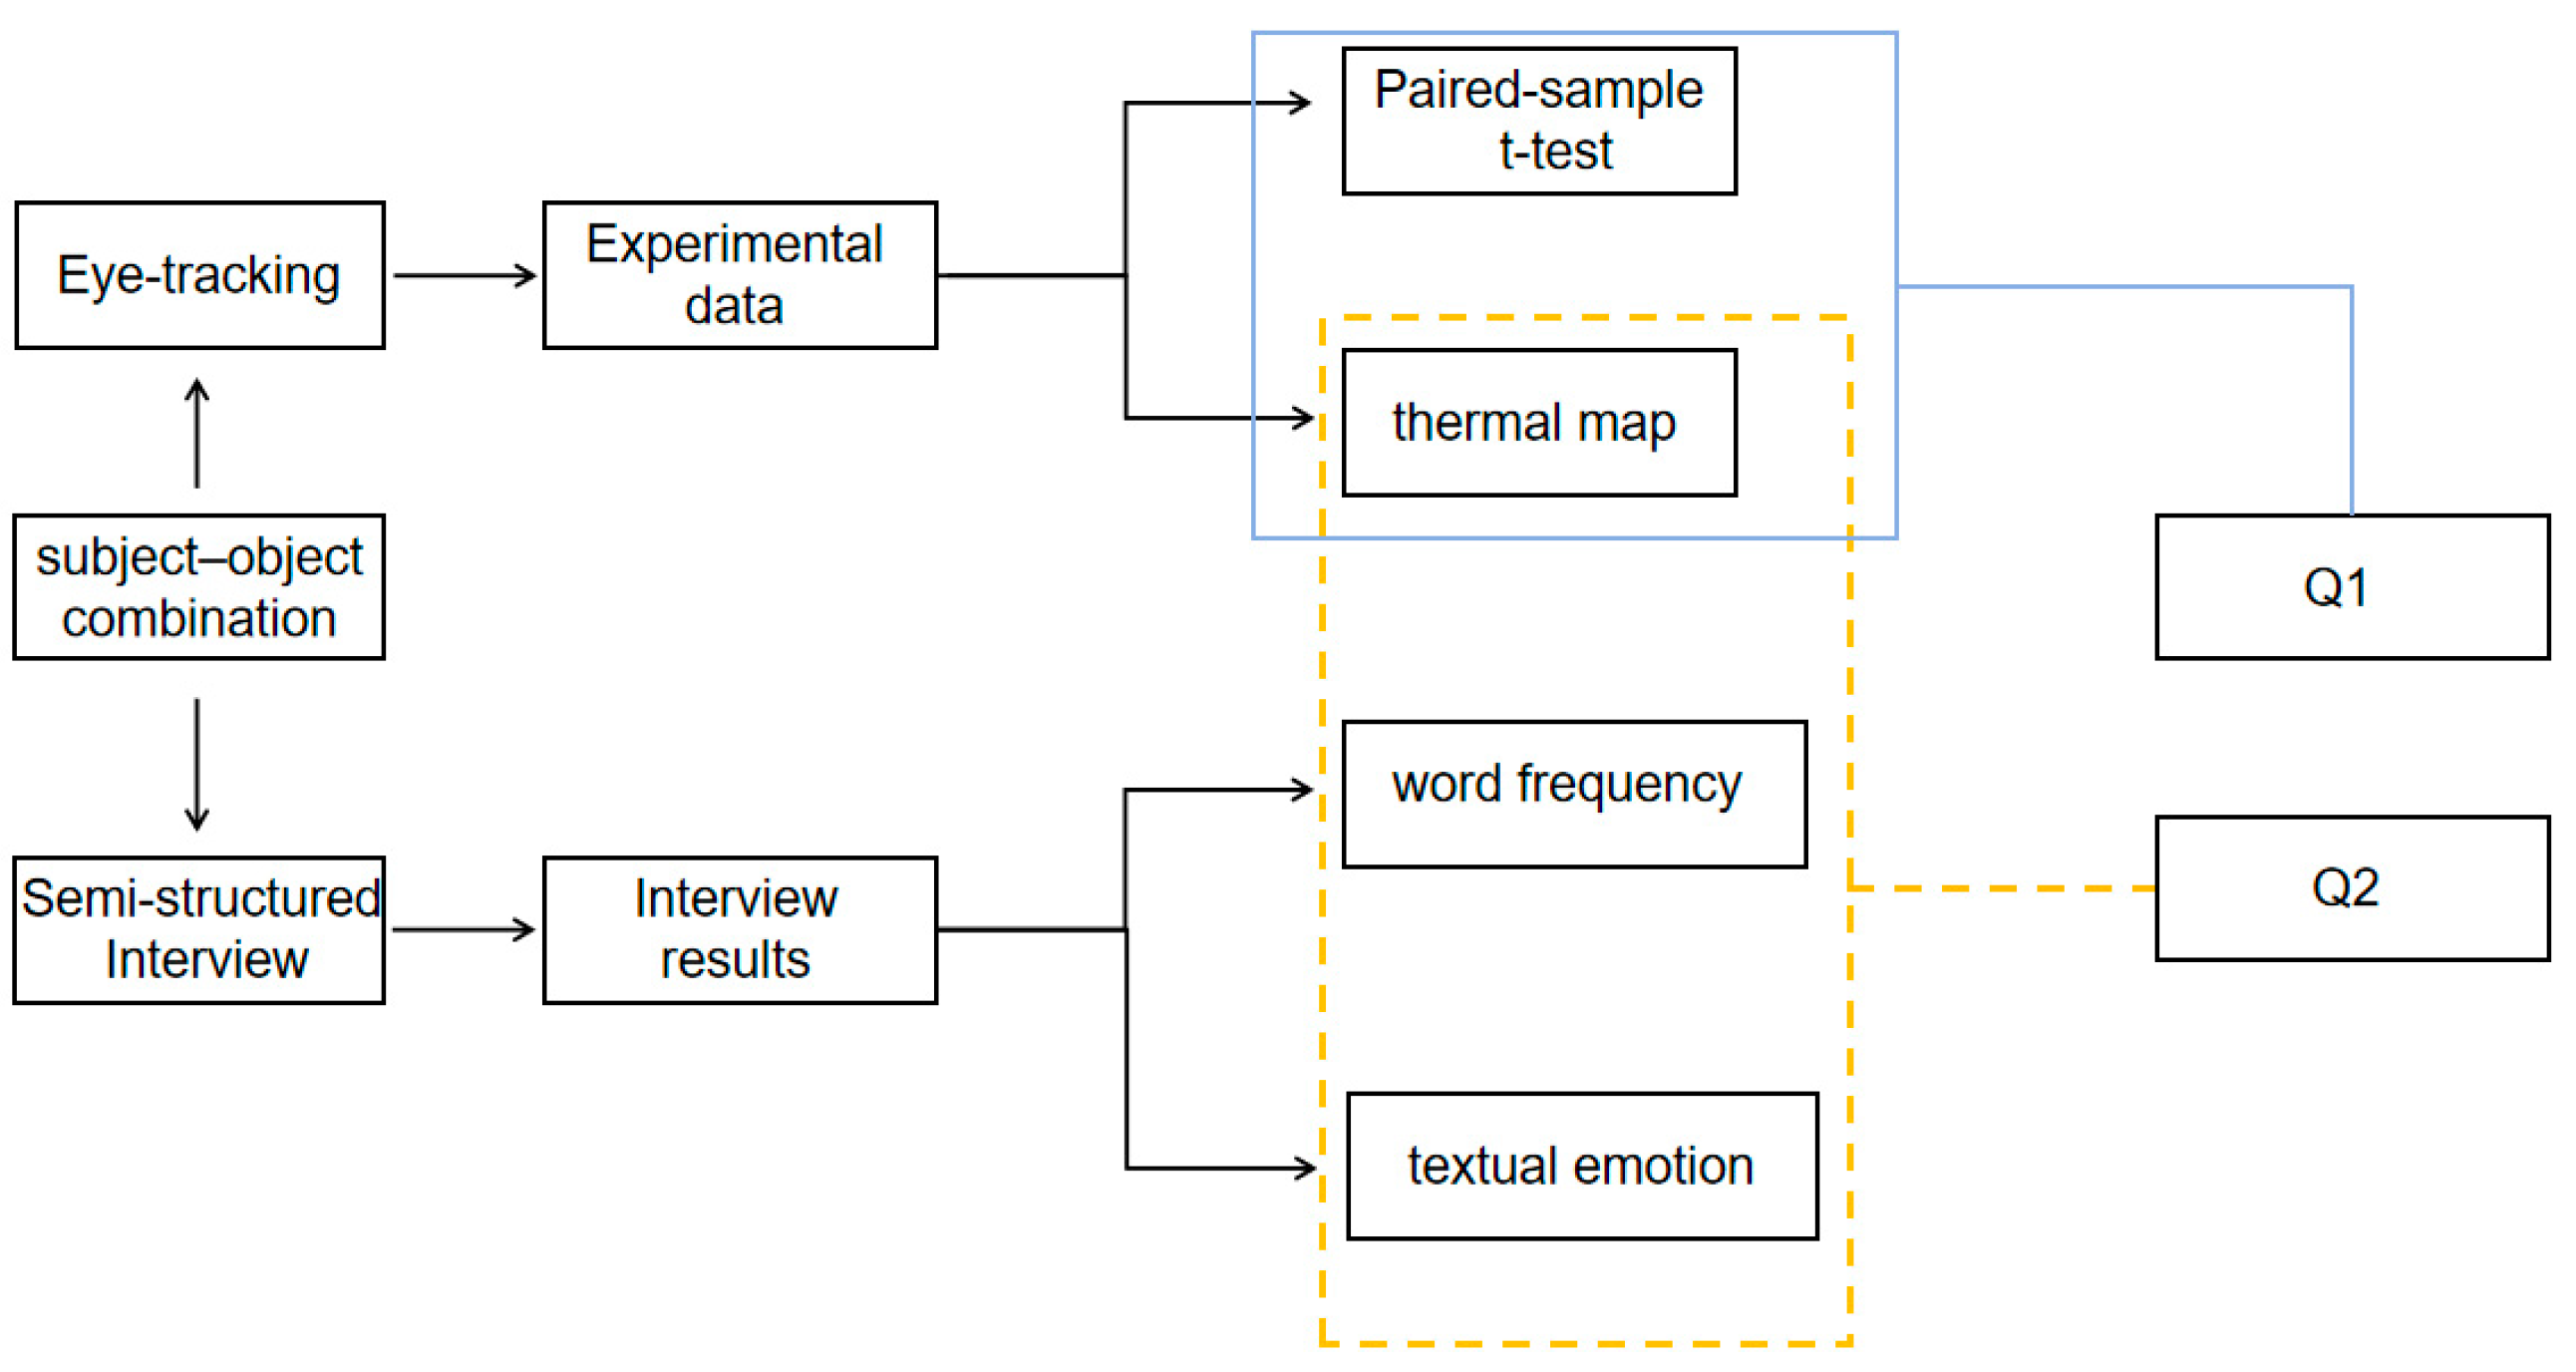
- Q1:
- What are the visual cognitive patterns and distribution characteristics when people observe different types of environmental elements in historical and cultural districts?
- Q2:
- Are there discrepancies or correlations between subjective interview data and objective eye-tracking metrics regarding visual cognition across different types of environmental elements in historic and cultural districts?
2. Materials and Methods
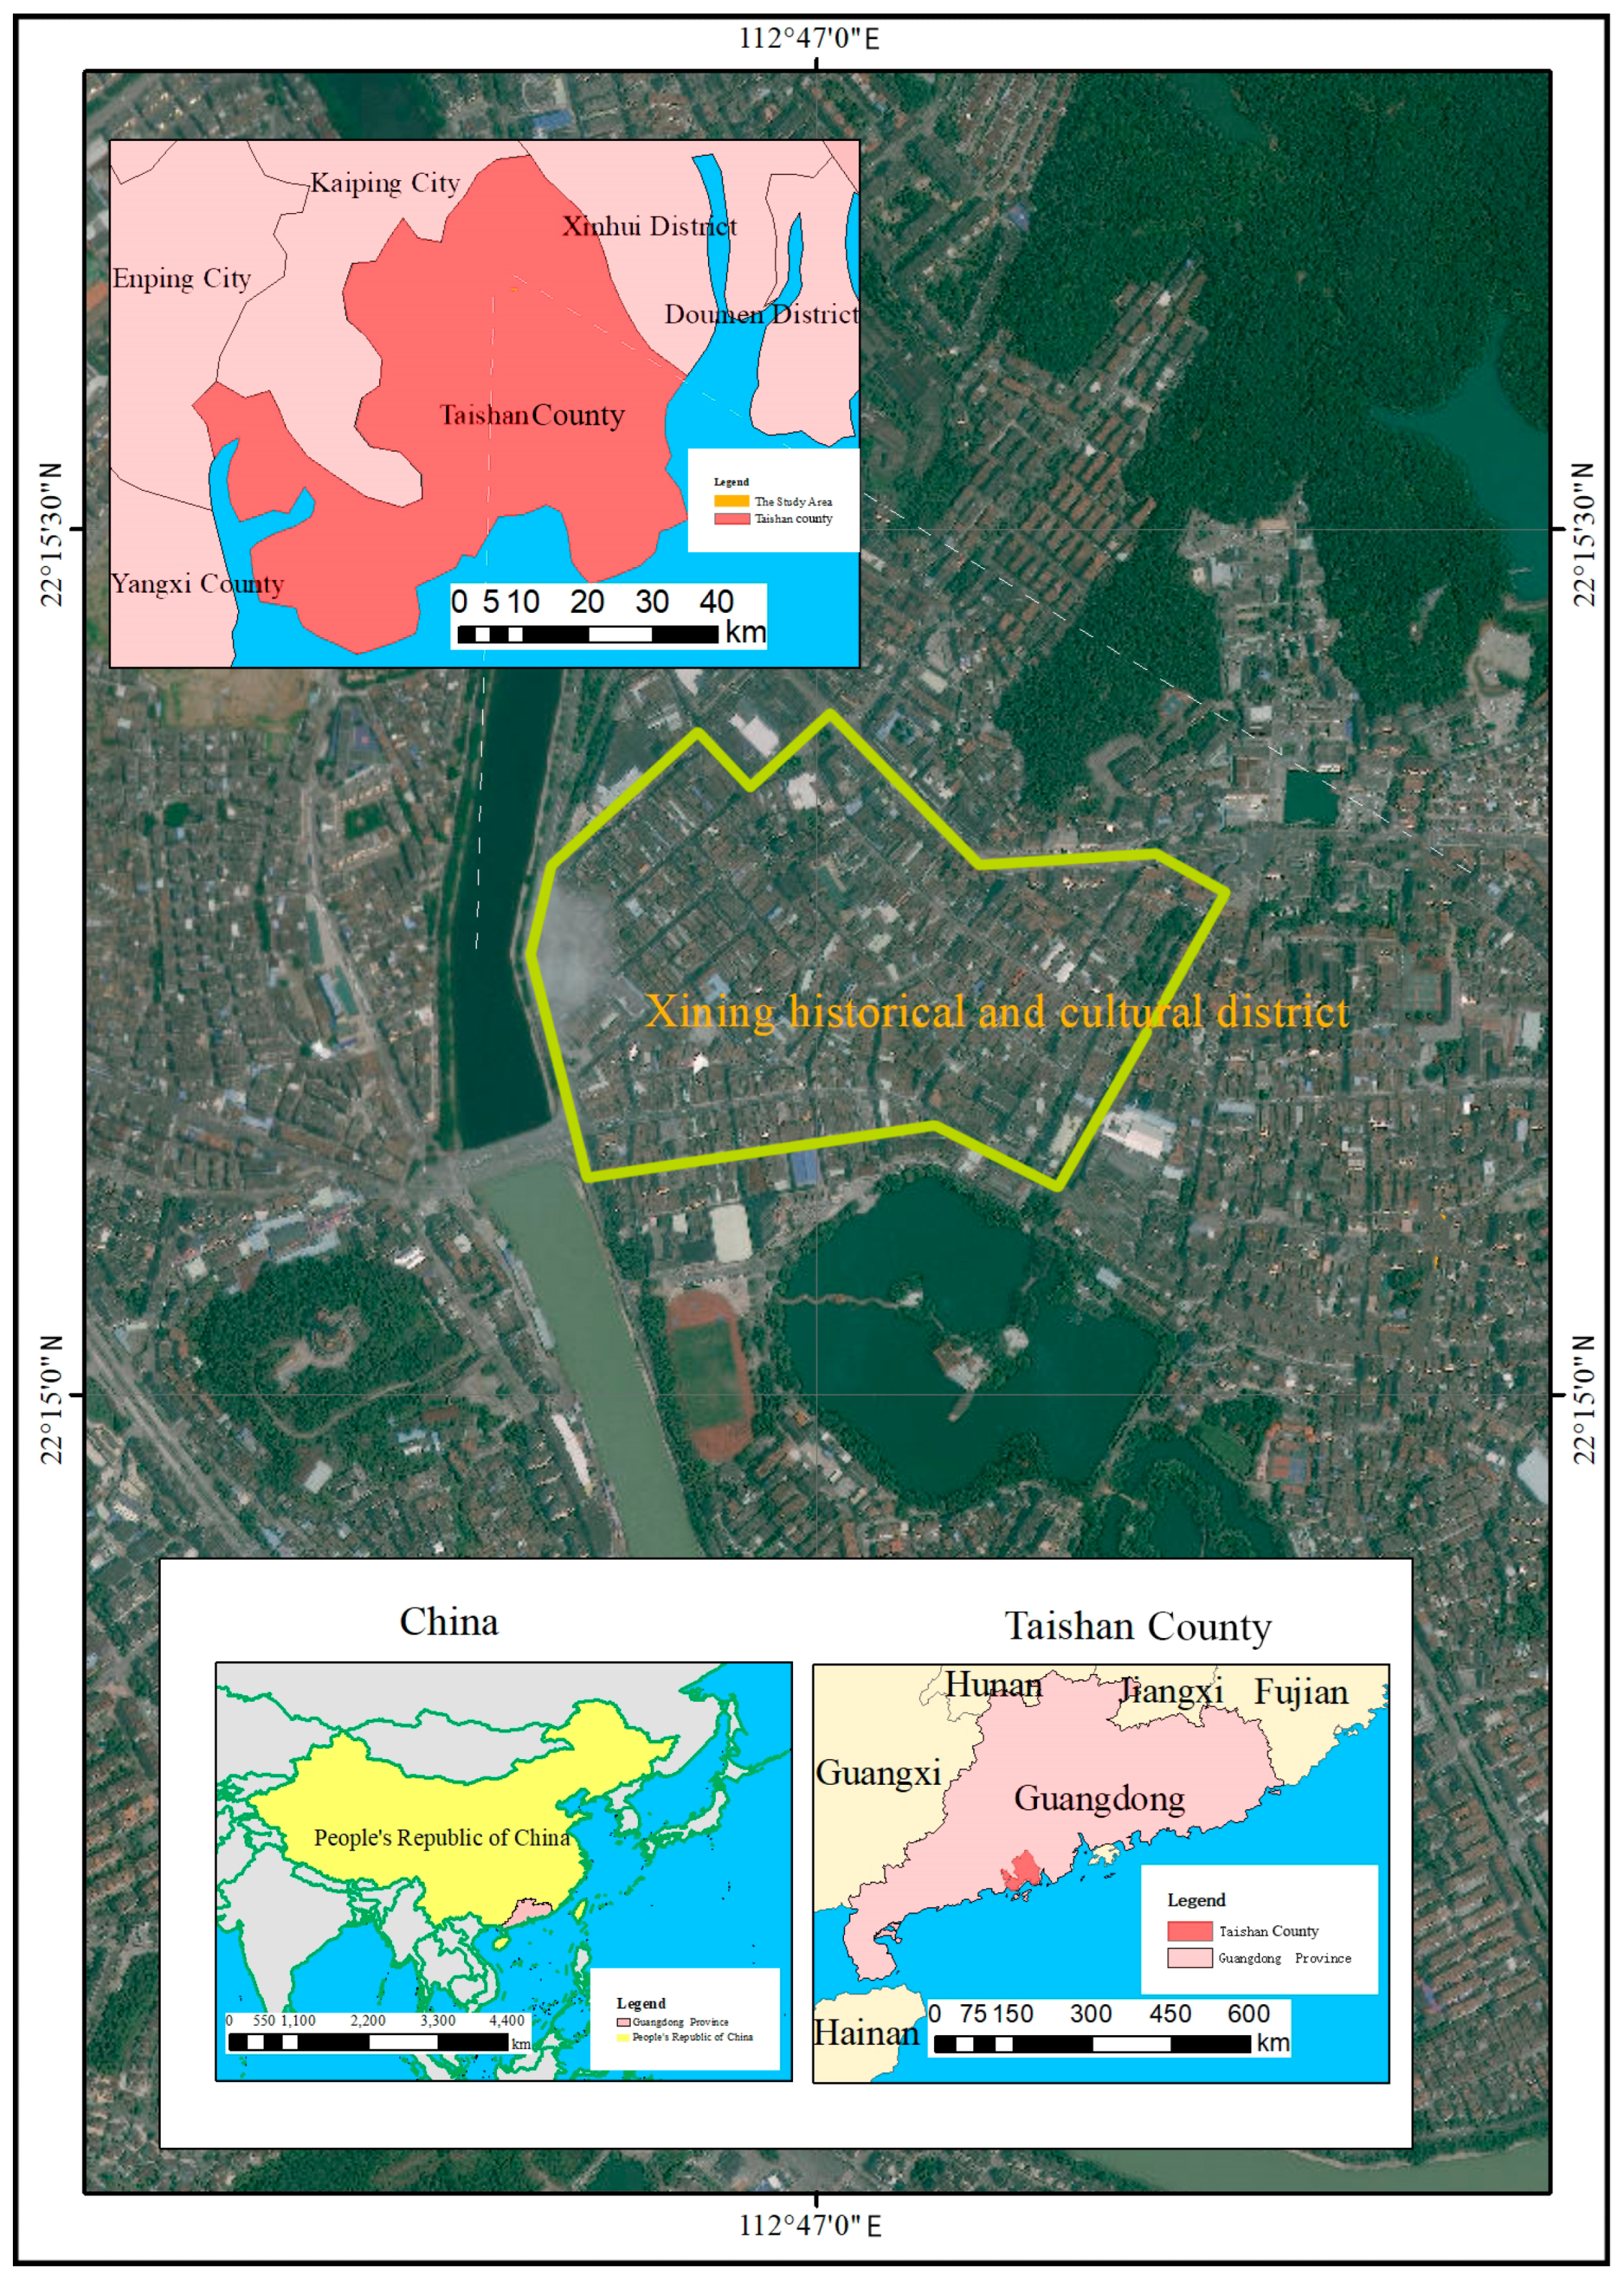
2.1. Study Area
2.2. Experiment Preparation
2.2.1. Photograph Selection
2.2.2. Participants
2.3. Procedure
2.4. Data Analysis
2.4.1. Eye-Tracking Metrics Selection
2.4.2. Semi-Structured Interview Data Analysis
3. Results
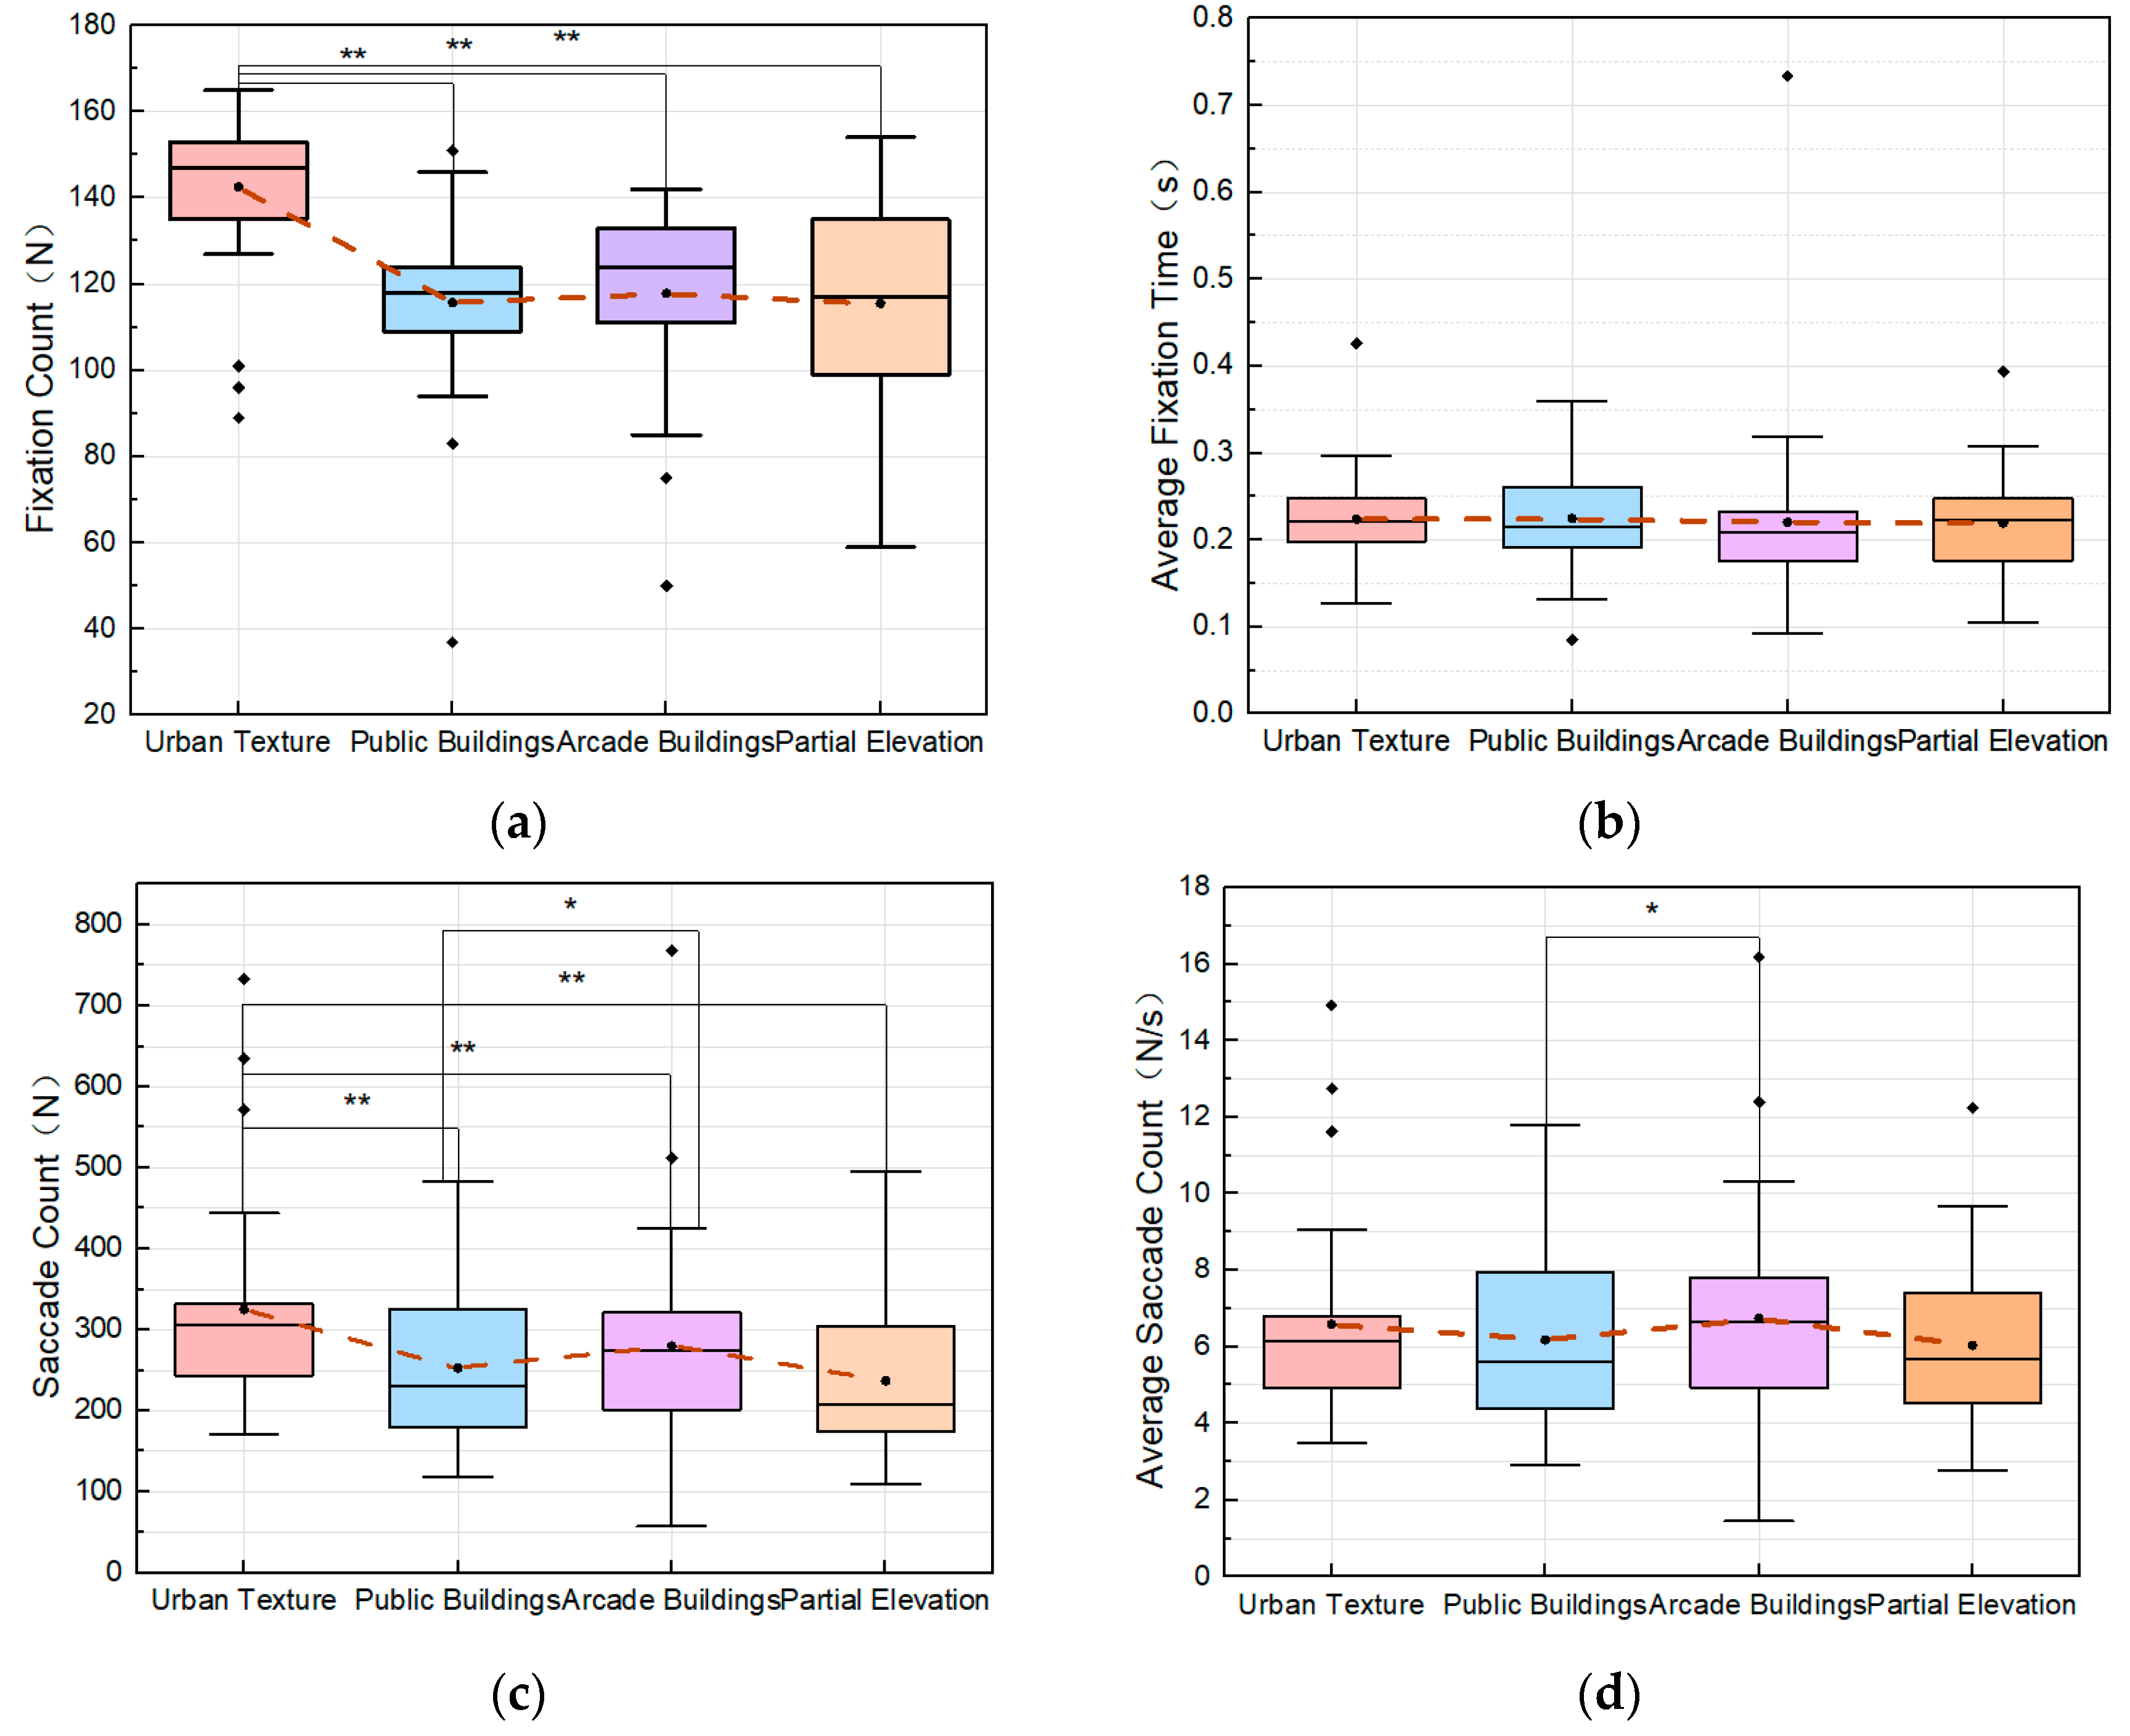
3.1. Analysis of Eye-Tracking Data
3.2. Analysis of Eye-Tracking Heatmaps
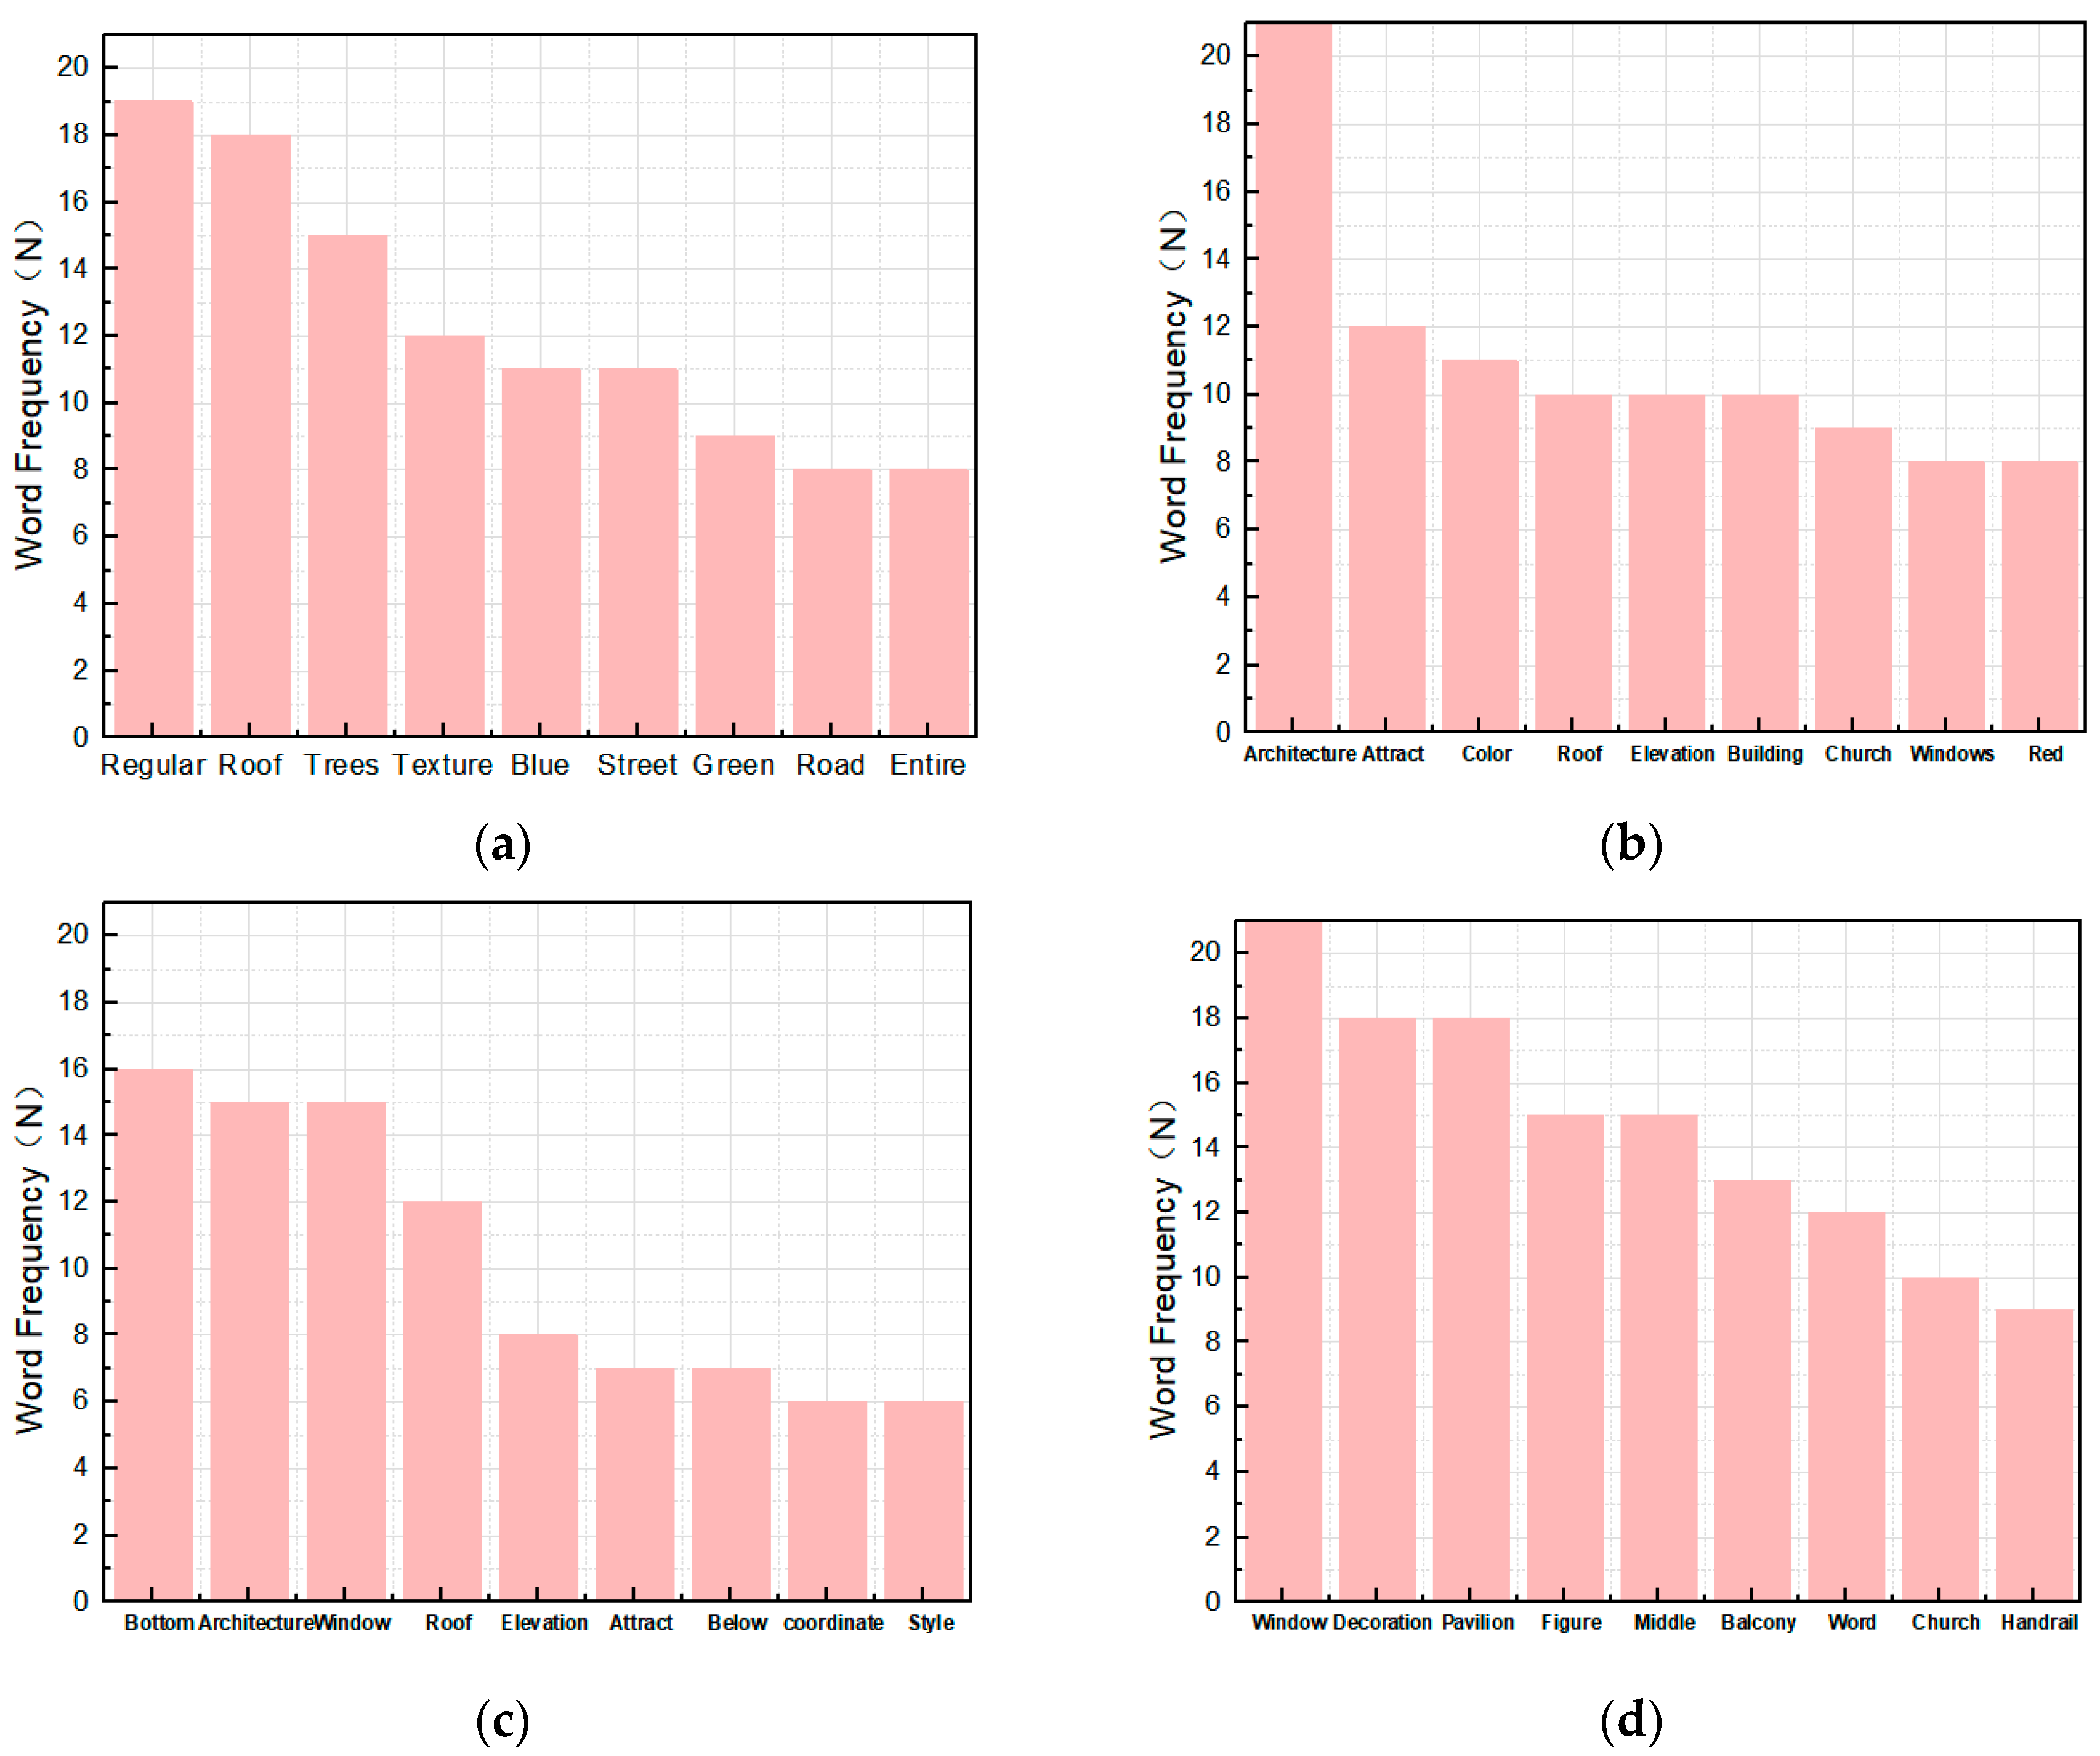
3.3. Analysis of Word Frequency
3.4. Analysis of Emotion Degree
4. Discussion
5. Conclusions
Author Contributions
Funding
Institutional Review Board Statement
Informed Consent Statement
Data Availability Statement
Conflicts of Interest
References
- Liu, J.; Yang, L.; Xiong, Y.; Yang, Y. Effects of Soundscape Perception on Visiting Experience in a Renovated Historical Block. Build. Environ. 2019, 165, 106375. [Google Scholar] [CrossRef]
- Zamani-Farahani, H.; Musa, G. Residents’ Attitudes and Perception towards Tourism Development: A Case Study of Masooleh, Iran. Tour. Manag. 2008, 29, 1233–1236. [Google Scholar] [CrossRef]
- Wang, Z.; Shen, M.; Huang, Y. Exploring the Impact of Facade Color Elements on Visual Comfort in Old Residential Buildings in Shanghai: Insights from Eye-Tracking Technology. Buildings 2024, 14, 1758. [Google Scholar] [CrossRef]
- Liu, M.; Nijhuis, S. Mapping Landscape Spaces: Methods for Understanding Spatial-Visual Characteristics in Landscape Design. Environ. Impact Assess. Rev. 2020, 82, 106376. [Google Scholar] [CrossRef]
- Urry, J.; Larsen, J. The Tourist Gaze 3.0; SAGE: Newcastle upon Tyne, UK, 2011. [Google Scholar]
- Zheng, C.; Jing, Q.; Hyeon, N.K. Research on Tourist Perception of Grand Canal Cultural Heritage Based on Network Text Analysis: The Pingjiang Historical and Cultural District of Suzhou City as an example. J. Intell. Inf. Syst. 2023, 29, 215–231. [Google Scholar]
- Snowden, R.J.; Thompson, P.; Troscianko, T. Basic Vision: An Introduction to Visual Perception; Oxford University Press: Oxford, UK, 2012; pp. 206–207. [Google Scholar]
- Katahenggam, N. Tourist Perceptions and Preferences of Authenticity in Heritage Tourism: Visual Comparative Study of George Town and Singapore. J. Tour. Cult. Change 2019, 18, 1–15. [Google Scholar] [CrossRef]
- Golkar, K. Conceptual Evolution of Urban Visual Environment; from Cosmetic Approach through to Sustainable Approach. Environ. Sci. 2008, 5, 95–113. [Google Scholar]
- Jin, T.; Lu, J.; Shao, Y. Exploring the Impact of Visual and Aural Elements in Urban Parks on Human Behavior and Emotional Responses. Land 2024, 13, 1468. [Google Scholar] [CrossRef]
- Meso, A.I.; Fletcher, K.; Barton, J.J.S. Review: Eye Tracking: A Comprehensive Guide to Methods and Measures, Vision Rehabilitation: Multidisciplinary Care of the Patient Following Brain Injury. Perception 2012, 41, 1286–1288. [Google Scholar] [CrossRef]
- Duchowski, A.T. Eye Tracking Methodology: Theory and Practice; Springer: London, UK, 2003. [Google Scholar]
- Rayner, K. Eye Movements and Attention in Reading, Scene Perception, and Visual Search. Q. J. Exp. Psychol. 2009, 62, 1457–1506. [Google Scholar] [CrossRef]
- Nikolov, T.Y.; Klein, C.; Ettinger, U. (Eds.) Eye Movement Research: An Introduction to Its Scientific Foundations and Applications. Perception 2020, 49, 994–995. [Google Scholar] [CrossRef]
- Laxton, V.; Maratos, F.A.; Hewson, D.W.; Baird, A.; Stupple, E.J.N. Standardised Colour-Coded Compartmentalised Syringe Trays Improve Anaesthetic Medication Visual Search and Mitigate Cognitive Load. Br. J. Anaesth. 2023, 130, 343–350. [Google Scholar] [CrossRef] [PubMed]
- Grewal, D.; Ahlbom, C.-P.; Beitelspacher, L.; Noble, S.M.; Nordfält, J. In-Store Mobile Phone Use and Customer Shopping Behavior: Evidence from the Field. J. Mark. 2018, 82, 102–126. [Google Scholar] [CrossRef]
- Yin, Y.; Shao, Y.; Xue, Z.; Thwaites, K.; Zhang, K. An Explorative Study on the Identification and Evaluation of Restorative Streetscape Elements. Landsc. Archit. Front. 2020, 8, 76–90. [Google Scholar] [CrossRef]
- Fu, H.; Wang, P.; Zhou, J.; Zhang, S.; Li, Y. Investigating Influence of Visual Elements of Arcade Buildings and Streetscapes on Place Identity Using Eye-Tracking and Semantic Differential Methods. Buildings 2023, 13, 1580. [Google Scholar] [CrossRef]
- Lisińska-Kuśnierz, M.; Krupa, M. Suitability of Eye Tracking in Assessing the Visual Perception of Architecture—a Case Study Concerning Selected Projects Located in Cologne. Buildings 2020, 10, 20. [Google Scholar] [CrossRef]
- Li, N.; Zhang, S.; Xia, L.; Wu, Y. Investigating the Visual Behavior Characteristics of Architectural Heritage Using Eye-Tracking. Buildings 2022, 12, 1058. [Google Scholar] [CrossRef]
- Deng, J.; Chen, J.; Lei, Y. A Study on the Visual Perception of Cultural Value Characteristics of Traditional Southern Fujian Architecture Based on Eye Tracking. Buildings 2024, 14, 3529. [Google Scholar] [CrossRef]
- Birer, E.; Çalışır Adem, P. Role of Public Space Design on the Perception of Historical Environment: A Pilot Study in Amasya. Front. Archit. Res. 2021, 11, 13–30. [Google Scholar] [CrossRef]
- Zheng, S.; Zhang, J.; Zu, R.; Li, Y. Visual Perception Differences and Spatiotemporal Analysis in Commercialized Historic Streets Based on Mobile Eye Tracking: A Case Study in Nanchang Wanshou Palace, China. Buildings 2024, 14, 1899. [Google Scholar] [CrossRef]
- Ma, L.; Xu, Y.; He, S.; Tang, Z.; Li, T.Z. Exploring Cognition Differences in the Traditional Village Landscape Based on Eye-tracking Experiment. Mod. Urban Res. 2023, 2, 86–94. (In Chinese) [Google Scholar]
- Xu, K.; Kong, C.; Li, J.; Zhang, L.; Wu, C. Suitability Evaluation of Urban Construction Land Based on Geo-Environmental Factors of Hangzhou, China. Comput. Geosci. 2011, 37, 992–1002. [Google Scholar] [CrossRef]
- Kalivoda, O.; Vojar, J.; Skřivanová, Z.; Zahradník, D. Consensus in Landscape Preference Judgments: The Effects of Landscape Visual Aesthetic Quality and Respondents’ Characteristics. J. Environ. Manag. 2014, 137, 36–44. [Google Scholar] [CrossRef]
- Nowacki, M. Heritage Interpretation and Sustainable Development: A Systematic Literature Review. Sustainability 2021, 13, 4383. [Google Scholar] [CrossRef]
- Fang, L.; Yong, J. ROST data mining system analysis of the text of the accrediting management policy of inclusive private kindergartens in China. Rev. Educ. Econ. 2019, 4, 108–121. (In Chinese) [Google Scholar]
- Zhang, X. Hohhot city image enhancement strategy: Network content analysis based on ROST CM6 software. Inn. Mong. Sci. Technol. Econ. 2022, 16, 23–25. (In Chinese) [Google Scholar]
- Yuan, X.; Liang, H.; Xie, C. Research on public space image perception of Haizhu Square in Guangzhou based on online evaluation text. Guangdong J. Landsc. Archit. 2023, 45, 59–62. (In Chinese) [Google Scholar]
- Dupont, L.; Ooms, K.; Duchowski, A.T.; Antrop, M.; Van Eetvelde, V. Investigating the Visual Exploration of the Rural-Urban Gradient Using Eye-Tracking. Spat. Cogn. Comput. 2016, 17, 65–88. [Google Scholar] [CrossRef]
- Liu, Y.; Li, Z.; Tian, Y.; Gao, B.; Wang, S.; Qi, Y.; Zou, Z.; Li, X.; Wang, R. A Study on Identifying the Spatial Characteristic Factors of Traditional Streets Based on Visitor Perception: Yuanjia Village, Shaanxi Province. Buildings 2024, 14, 1815. [Google Scholar] [CrossRef]
- Sadeghifar, M.; Pazhouhanfar, M.; Farrokhzad, M. An Exploration of the Relationships between Urban Building Façade Visual Elements and People’s Preferences in the City of Gorgan, Iran. Archit. Eng. Des. Manag. 2018, 15, 445–458. [Google Scholar] [CrossRef]
- Li, X.; Wang, P.; Li, L.; Liu, J. The Influence of Architectural Heritage and Tourists’ Positive Emotions on Behavioral Intentions Using Eye-Tracking Study. Sci. Rep. 2025, 15, 1447. [Google Scholar] [CrossRef] [PubMed]
- Liu, R.; Neisch, P. Measuring the Effectiveness of Street Renewal Design: Insights from Visual Preference Surveys, Deep-Learning Technology, and Eye-Tracking Simulation Software. Landsc. Urban Plan. 2025, 256, 105291. [Google Scholar] [CrossRef]
- Doğan, H.A. Implementation of Eye Tracking Technology on Cultural Heritage Research and Practice. Igra Ustvarjalnosti-Creativity Game 2019, 7, 16–21. [Google Scholar] [CrossRef]
- Amati, M.; Ghanbari Parmehr, E.; McCarthy, C.; Sita, J. How Eye-Catching Are Natural Features When Walking through a Park? Eye-Tracking Responses to Videos of Walks. Urban For. Urban Green. 2018, 31, 67–78. [Google Scholar] [CrossRef]
- Wang, Z.; Shen, M.; Huang, Y. Combining Eye-Tracking Technology and Subjective Evaluation to Determine Building Facade Color Combinations and Visual Quality. Appl. Sci. 2024, 14, 8227. [Google Scholar] [CrossRef]
- Askari, A.H.; Soltani, S. Contribution of Building Façades to Attractive Streetscapes: Study of Two Main Streets in Kuala Lumpur City. J. Des. Built Environ. 2018, 18, 29–40. [Google Scholar] [CrossRef]
- Wang, M.; Zhao, M.; Lin, M.; Cao, W.; Zhu, H.; An, N. Seeking lost memories: Application of a new visual methodology for heritage protection. Geogr. Rev. 2020, 110, 556–574. [Google Scholar] [CrossRef]
- Meng, Y.; Lyu, M.; Sun, D.; Shi, J.; Fukuda, H. Evaluating and Diagnosing Urban Function and Perceived Quality Based on Multi-Source Data and Deep Learning Using Dalian as an Example. Buildings 2025, 15, 998. [Google Scholar] [CrossRef]
- Chan, E.T.H.; Schwanen, T.; Banister, D. The Role of Perceived Environment, Neighbourhood Characteristics, and Attitudes in Walking Behaviour: Evidence from a Rapidly Developing City in China. Transportation 2019, 48, 431–454. [Google Scholar] [CrossRef]
- Xing, Y.; Leng, J. Evaluation of Public Space in Traditional Villages Based on Eye Tracking Technology. J. Asian Archit. Build. Eng. 2023, 23, 125–139. [Google Scholar] [CrossRef]
- Rusnak, M.A. Eye tracker as a pro-social tool of managing urbanistic and architectural heritage. Prot. Cult. Herit. 2020, 9, 97–115. [Google Scholar] [CrossRef]
- Rusnak, M.; Szmigiel, M.; Geniusz, M.; Koszewicz, Z.; Magdziak-Tokłowicz, M. Exploring the Impact of Cultural Context on Eye-Tracking Studies of Architectural Monuments in Selected European Cities: Sustainable Heritage Management. J. Cult. Herit. 2024, 66, 326–342. [Google Scholar] [CrossRef]
- Jeon, J.Y.; Jo, H.I.; Lee, K. Psycho-Physiological Restoration with Audio-Visual Interactions through Virtual Reality Simulations of Soundscape and Landscape Experiences in Urban, Waterfront, and Green Environments. Sustain. Cities Soc. 2023, 99, 104929. [Google Scholar] [CrossRef]
- Chynał, P.; Sobecki, J.; Rymarz, M.; Kilijańska, B. Shopping Behaviour Analysis Using Eyetracking and EEG. In Proceedings of the 2016 9th International Conference on Human System Interactions (HSI), Portsmouth, UK, 6–8 July 2016. [Google Scholar]


| Metrics | Abbreviation | Basic Significance |
|---|---|---|
| Fixation Count (N) | FC | The fixation count refers to the number of all fixation points during fixation. A higher number means that the amount of information is too large, and it is difficult to identify all of them in a short time. |
| Average Fixation Time (s) | AFT | The average fixation time is the average duration of all fixation points during fixation. The longer the average fixation duration, the more difficult the information processing is. |
| Saccade Count (N) | SC | Saccade count refers to the number of saccades in the staring process. The more the number of saccades, the more information in the area, and the difficulty in identification. |
| Average Saccade Count (N/s) | ASC | The average saccade count is the average saccade count per second. The higher the number, the more the factors are affected when searching for the next fixation point, and the more information in the region is reflected. |
| Metrics | Correlation Coefficient t-Value/Significance Level p-Value | |||
|---|---|---|---|---|
| Group | Urban texture | Public buildings | Arcade buildings | Partial elevation |
| Urban texture | 1 | 8.649/0.000 (**) | 7.602/0.000 (**) | 5.722/0.000 (**) |
| Public buildings | 1 | −0.658/0.516 | 0.671/0.508 | |
| Arcade buildings | 1 | 0.940/0.355 | ||
| Partial elevation | 1 | |||
| Metrics | Correlation Coefficient t-Value/Significance Level p-Value | |||
|---|---|---|---|---|
| Group | Urban texture | Public buildings | Arcade buildings | Partial elevation |
| Urban texture | 1 | −0.203/0.841 | 0.247/0.807 | −0.384/0.704 |
| Public buildings | 1 | 0.423/0.675 | 0.492/0.626 | |
| Arcade buildings | 1 | 0.046/0.964 | ||
| Partial elevation | 1 | |||
| Metrics | Correlation Coefficient t-Value/Significance Level p-Value | |||
|---|---|---|---|---|
| Group | Urban texture | Public buildings | Arcade buildings | Partial elevation |
| Urban texture | 1 | 5.336/0.000 (**) | 3.079/0.005 (**) | 3.741/0.001 (**) |
| Public buildings | 1 | −2.140/0.041 (*) | 0.820/0.419 | |
| Arcade buildings | 1 | 1.735/0.090 | ||
| Partial elevation | 1 | |||
| Metrics | Correlation Coefficient t-Value/Significance Level p-Value | |||
|---|---|---|---|---|
| Group | Urban texture | Public buildings | Arcade buildings | Partial elevation |
| Urban texture | 1 | 1.672/0.105 | −0.334/0.741 | 1.231/0.228 |
| Public buildings | 1 | −2.065/0.048 (*) | 0.317/0.753 | |
| Arcade buildings | 1 | 1.289/0.208 | ||
| Partial elevation | 1 | |||
| Group | Heatmaps | |||
|---|---|---|---|---|
| Urban texture | 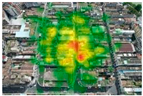 | 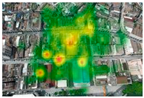 | 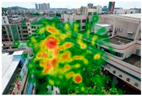 | 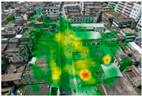 |
| Public buildings | 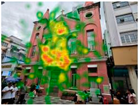 | 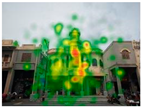 | 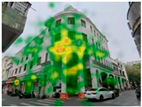 | 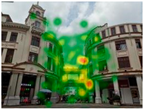 |
| Arcade buildings | 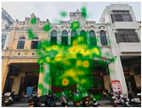 | 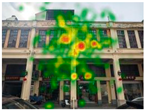 | 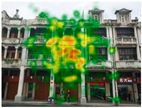 | 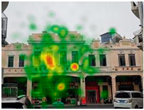 |
| Partial elevation |  | 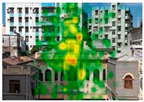 | 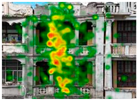 |  |
| Emotional Type | Number of Evaluations | Proportion (%) | Emotional Intensity Level | Positive (N) | Negative (N) |
|---|---|---|---|---|---|
| Positive | 17 | 56.67 | Low (5, 15], [−15, 5) | 11 | 12 |
| Neutral | 0 | 0 | Moderate (15, 25], [−25, −15) | 4 | 1 |
| Negative | 13 | 43.33 | High (25, +∞), (−∞, −25) | 2 | 0 |
| Emotional Type | Number of Evaluations | Proportion (%) | Emotional Intensity Level | Positive (N) | Negative (N) |
|---|---|---|---|---|---|
| Positive | 24 | 80.00 | Low (5, 15], [−15, 5) | 15 | 4 |
| Neutral | 0 | 0 | Moderate (15, 25], [−25, −15) | 7 | 0 |
| Negative | 6 | 20.00 | High (25, +∞), (−∞, −25) | 2 | 2 |
| Emotional Type | Number of Evaluations | Proportion (%) | Emotional Intensity Level | Positive (N) | Negative (N) |
|---|---|---|---|---|---|
| Positive | 17 | 56.67 | Low (5, 15], [−15, 5) | 6 | 11 |
| Neutral | 0 | 0 | Moderate (15, 25], [−25, −15) | 7 | 1 |
| Negative | 13 | 43.33 | High (25, +∞), (-∞, −25) | 4 | 1 |
| Emotional Type | Number of Evaluations | Proportion (%) | Emotional Intensity Level | Positive (N) | Negative (N) |
|---|---|---|---|---|---|
| Positive | 29 | 96.77 | Low (5, 15], [−15, 5) | 7 | 1 |
| Neutral | 0 | 0 | Moderate (15, 25], [−25, −15) | 15 | 0 |
| Negative | 1 | 3.23 | High (25, +∞), (−∞, −25) | 7 | 0 |
Disclaimer/Publisher’s Note: The statements, opinions and data contained in all publications are solely those of the individual author(s) and contributor(s) and not of MDPI and/or the editor(s). MDPI and/or the editor(s) disclaim responsibility for any injury to people or property resulting from any ideas, methods, instructions or products referred to in the content. |
© 2025 by the authors. Licensee MDPI, Basel, Switzerland. This article is an open access article distributed under the terms and conditions of the Creative Commons Attribution (CC BY) license (https://creativecommons.org/licenses/by/4.0/).
Share and Cite
Jiang, X.; Wu, X.; Chen, F.; Chen, Z.; Li, Z. Visual Perception of Environmental Elements Analysis in Historical District Based on Eye-Tracking and Semi-Structured Interview: A Case Study in Xining, Taishan. Buildings 2025, 15, 1554. https://doi.org/10.3390/buildings15091554
Jiang X, Wu X, Chen F, Chen Z, Li Z. Visual Perception of Environmental Elements Analysis in Historical District Based on Eye-Tracking and Semi-Structured Interview: A Case Study in Xining, Taishan. Buildings. 2025; 15(9):1554. https://doi.org/10.3390/buildings15091554
Chicago/Turabian StyleJiang, Xing, Xinxiang Wu, Fangting Chen, Zonghan Chen, and Ziang Li. 2025. "Visual Perception of Environmental Elements Analysis in Historical District Based on Eye-Tracking and Semi-Structured Interview: A Case Study in Xining, Taishan" Buildings 15, no. 9: 1554. https://doi.org/10.3390/buildings15091554
APA StyleJiang, X., Wu, X., Chen, F., Chen, Z., & Li, Z. (2025). Visual Perception of Environmental Elements Analysis in Historical District Based on Eye-Tracking and Semi-Structured Interview: A Case Study in Xining, Taishan. Buildings, 15(9), 1554. https://doi.org/10.3390/buildings15091554