


Subjective Evaluation of Place Environmental Quality in Conference and Exhibition Buildings in Small- and Medium-Sized Cities: An Empirical Case Study


Abstract
1. Introduction
2. Research Design
2.1. Conceptual Definition
2.2. Research Methods
2.3. Research Content
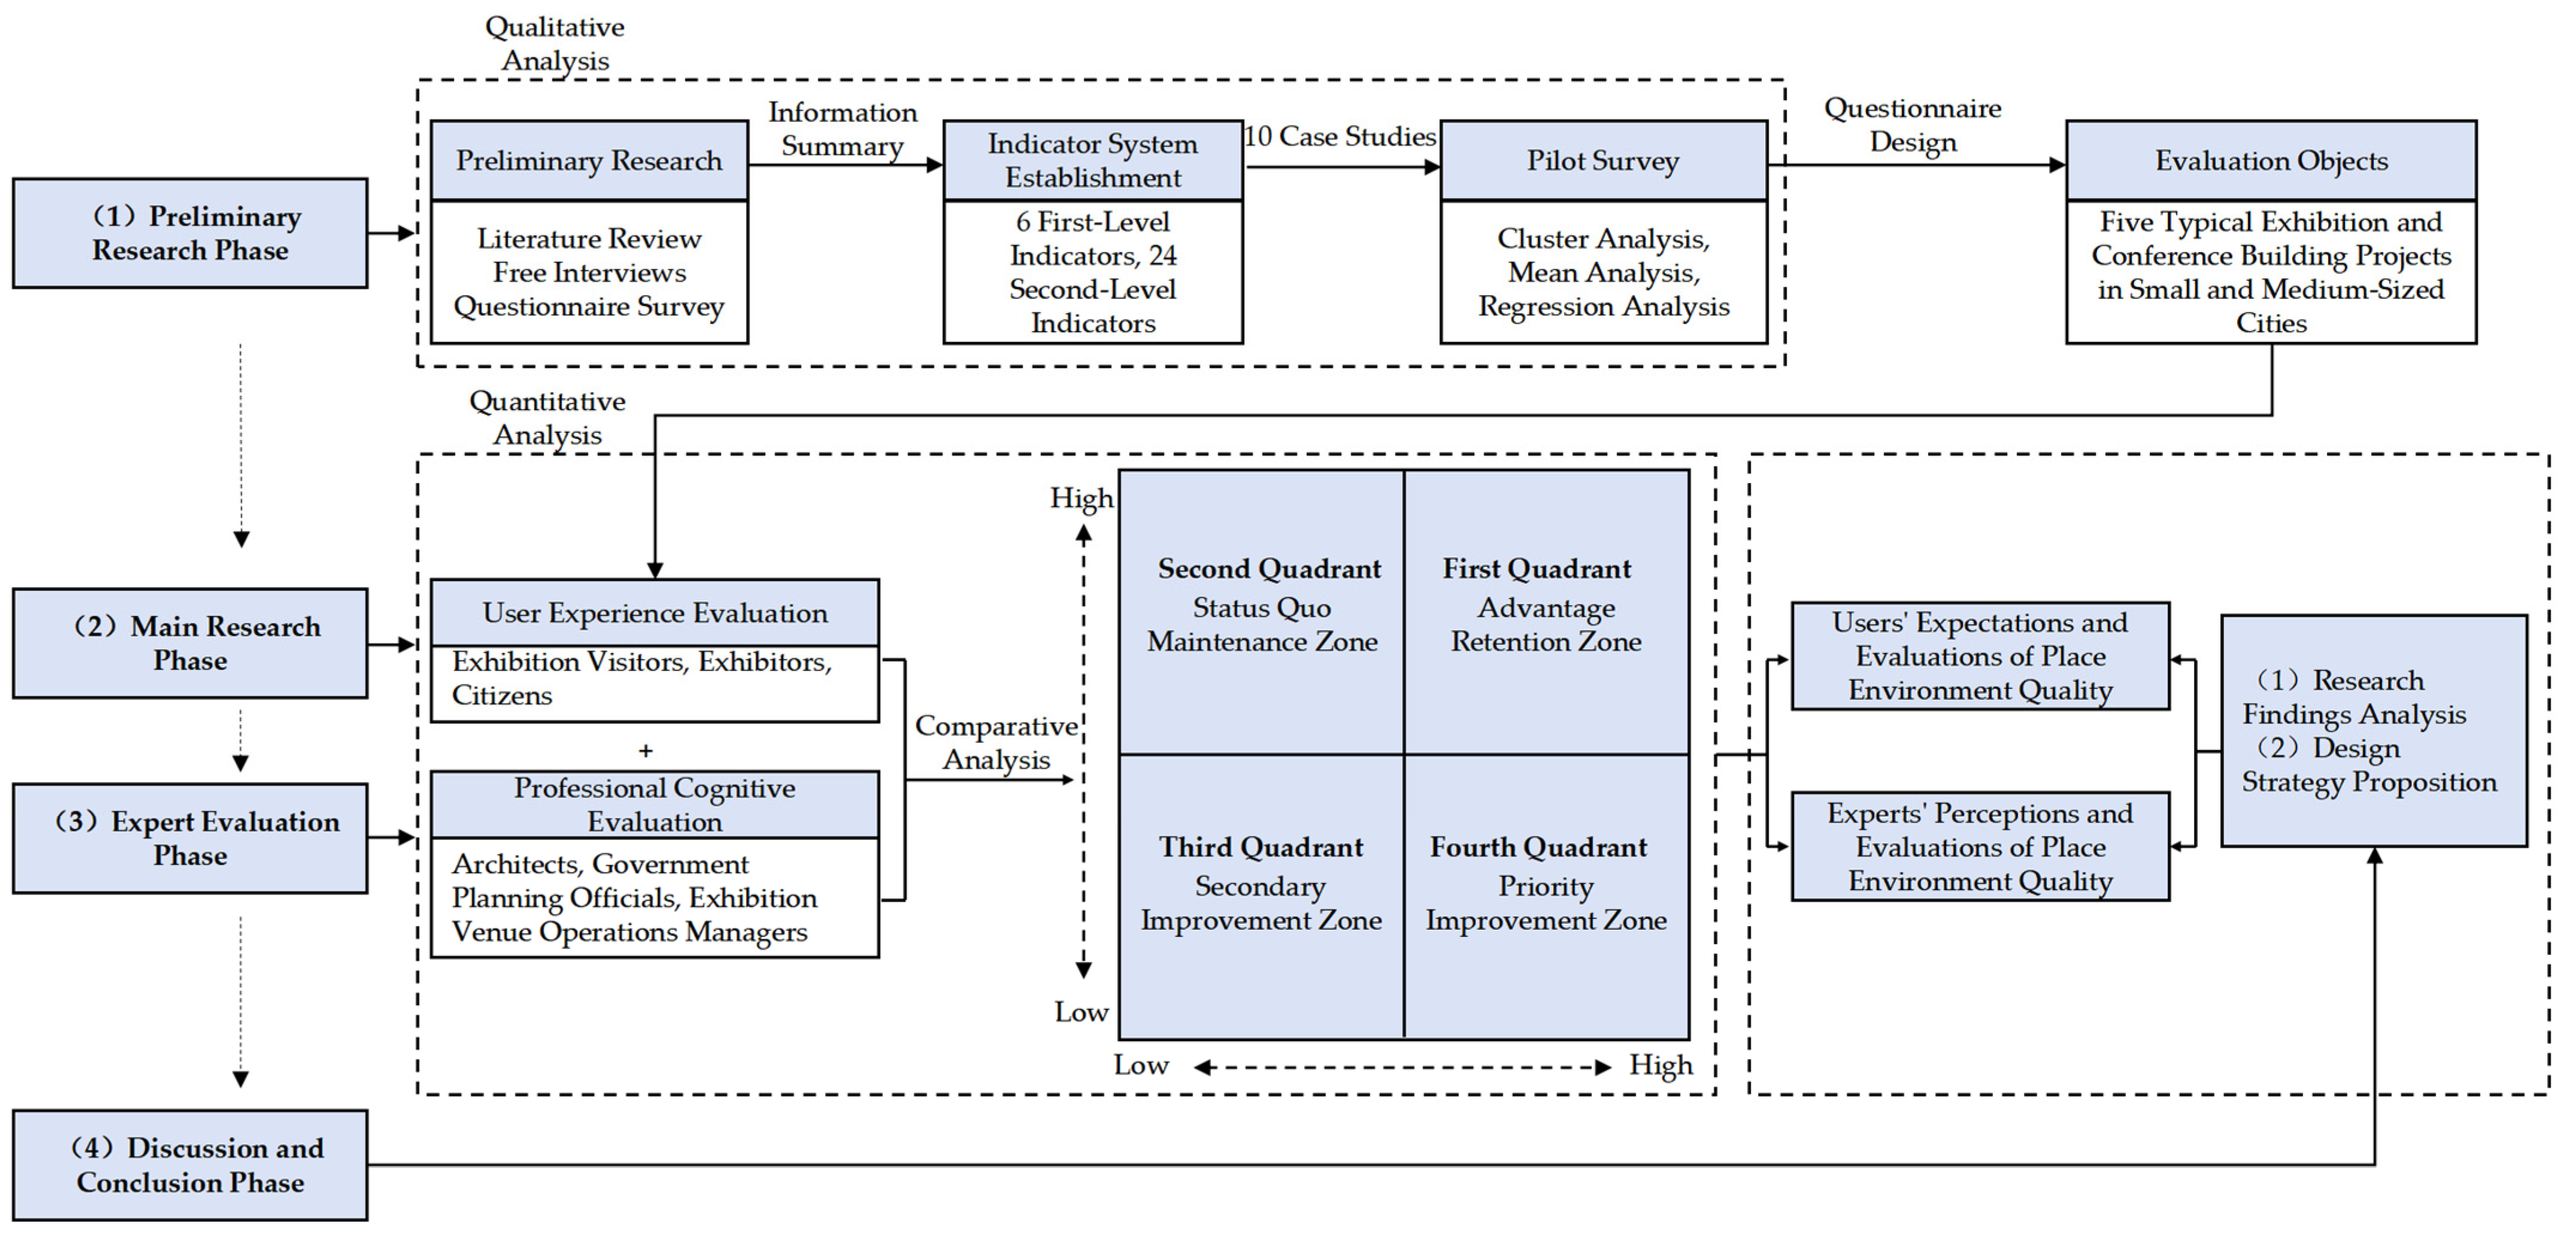
- (1)
- Preliminary research phase: This phase utilizes literature reviews, interviews, and open-ended questionnaire surveys to explore users’ cognitive characteristics and behavioral patterns related to place environmental quality. This section reviews relevant literature on the evaluation of the built environment in conference and exhibition buildings. Using qualitative research methods, this study gathers key insights into users’ functional needs, aesthetic preferences, and usage tendencies. These findings provide an empirical foundation for defining the focus of subsequent research.
- (2)
- Main research phase: This phase focuses on typical case studies to develop a quality evaluation model for place environmental quality from the user’s perspective. Centered on users’ phenomenological experiences throughout the entire exhibition activity cycle, this research constructs a dynamic assessment model that challenges the traditional, physical-environment-dominated evaluation approach. It advances a humanistic design paradigm grounded in participatory observation and embodied cognition theories. By establishing an IPA model, the study systematically identifies the strengths and areas for improvement in the place environments of conference and exhibition buildings in small- and medium-sized cities. According to the varying characteristics of different evaluation samples, targeted recommendations for environmental optimization are proposed.
- (3)
- Expert evaluation phase: A professional team was assembled to conduct a systematic assessment of the research samples. Utilizing techniques such as drone aerial photography, on-site surveys, and spatial analysis mapping, an IPA model of place environmental quality is developed from the expert perspective. By comparing and analyzing the evaluation results of both users and experts, this study provides scientific evidence for the continuous improvement of place environmental quality and offers professional guidance for relevant management decisions.
- (4)
- Discussion and conclusion phase: The comparative analysis of users’ experiential perceptions and experts’ professional evaluations highlights significant disparities between subjective user experiences (such as spatial preferences and behavioral comfort) and objective expert criteria (such as daylighting, ventilation standards, floor plan design, and parking specifications). This approach corrects the previous tendency in research to prioritize technical expertise at the expense of user-centered perspectives. It advances the application of human-centered design theory in small- to medium-sized cities and provides practical design strategies.
3. Preliminary Research
3.1. Literature Review and Free Interviews
3.2. Questionnaire Survey
- (1)
- Initial screening framework:
- (2)
- Comprehensive data collection:
- (3)
- Stratified sampling process:
- (4)
- Final case determination:
3.2.1. Indicator Selection and Questionnaire Design
3.2.2. Data Analysis
4. User Evaluation of Place Environmental Quality in Five Case Studies
4.1. Questionnaire Data Analysis
4.2. Construction and Analysis of the Overall IPA Model
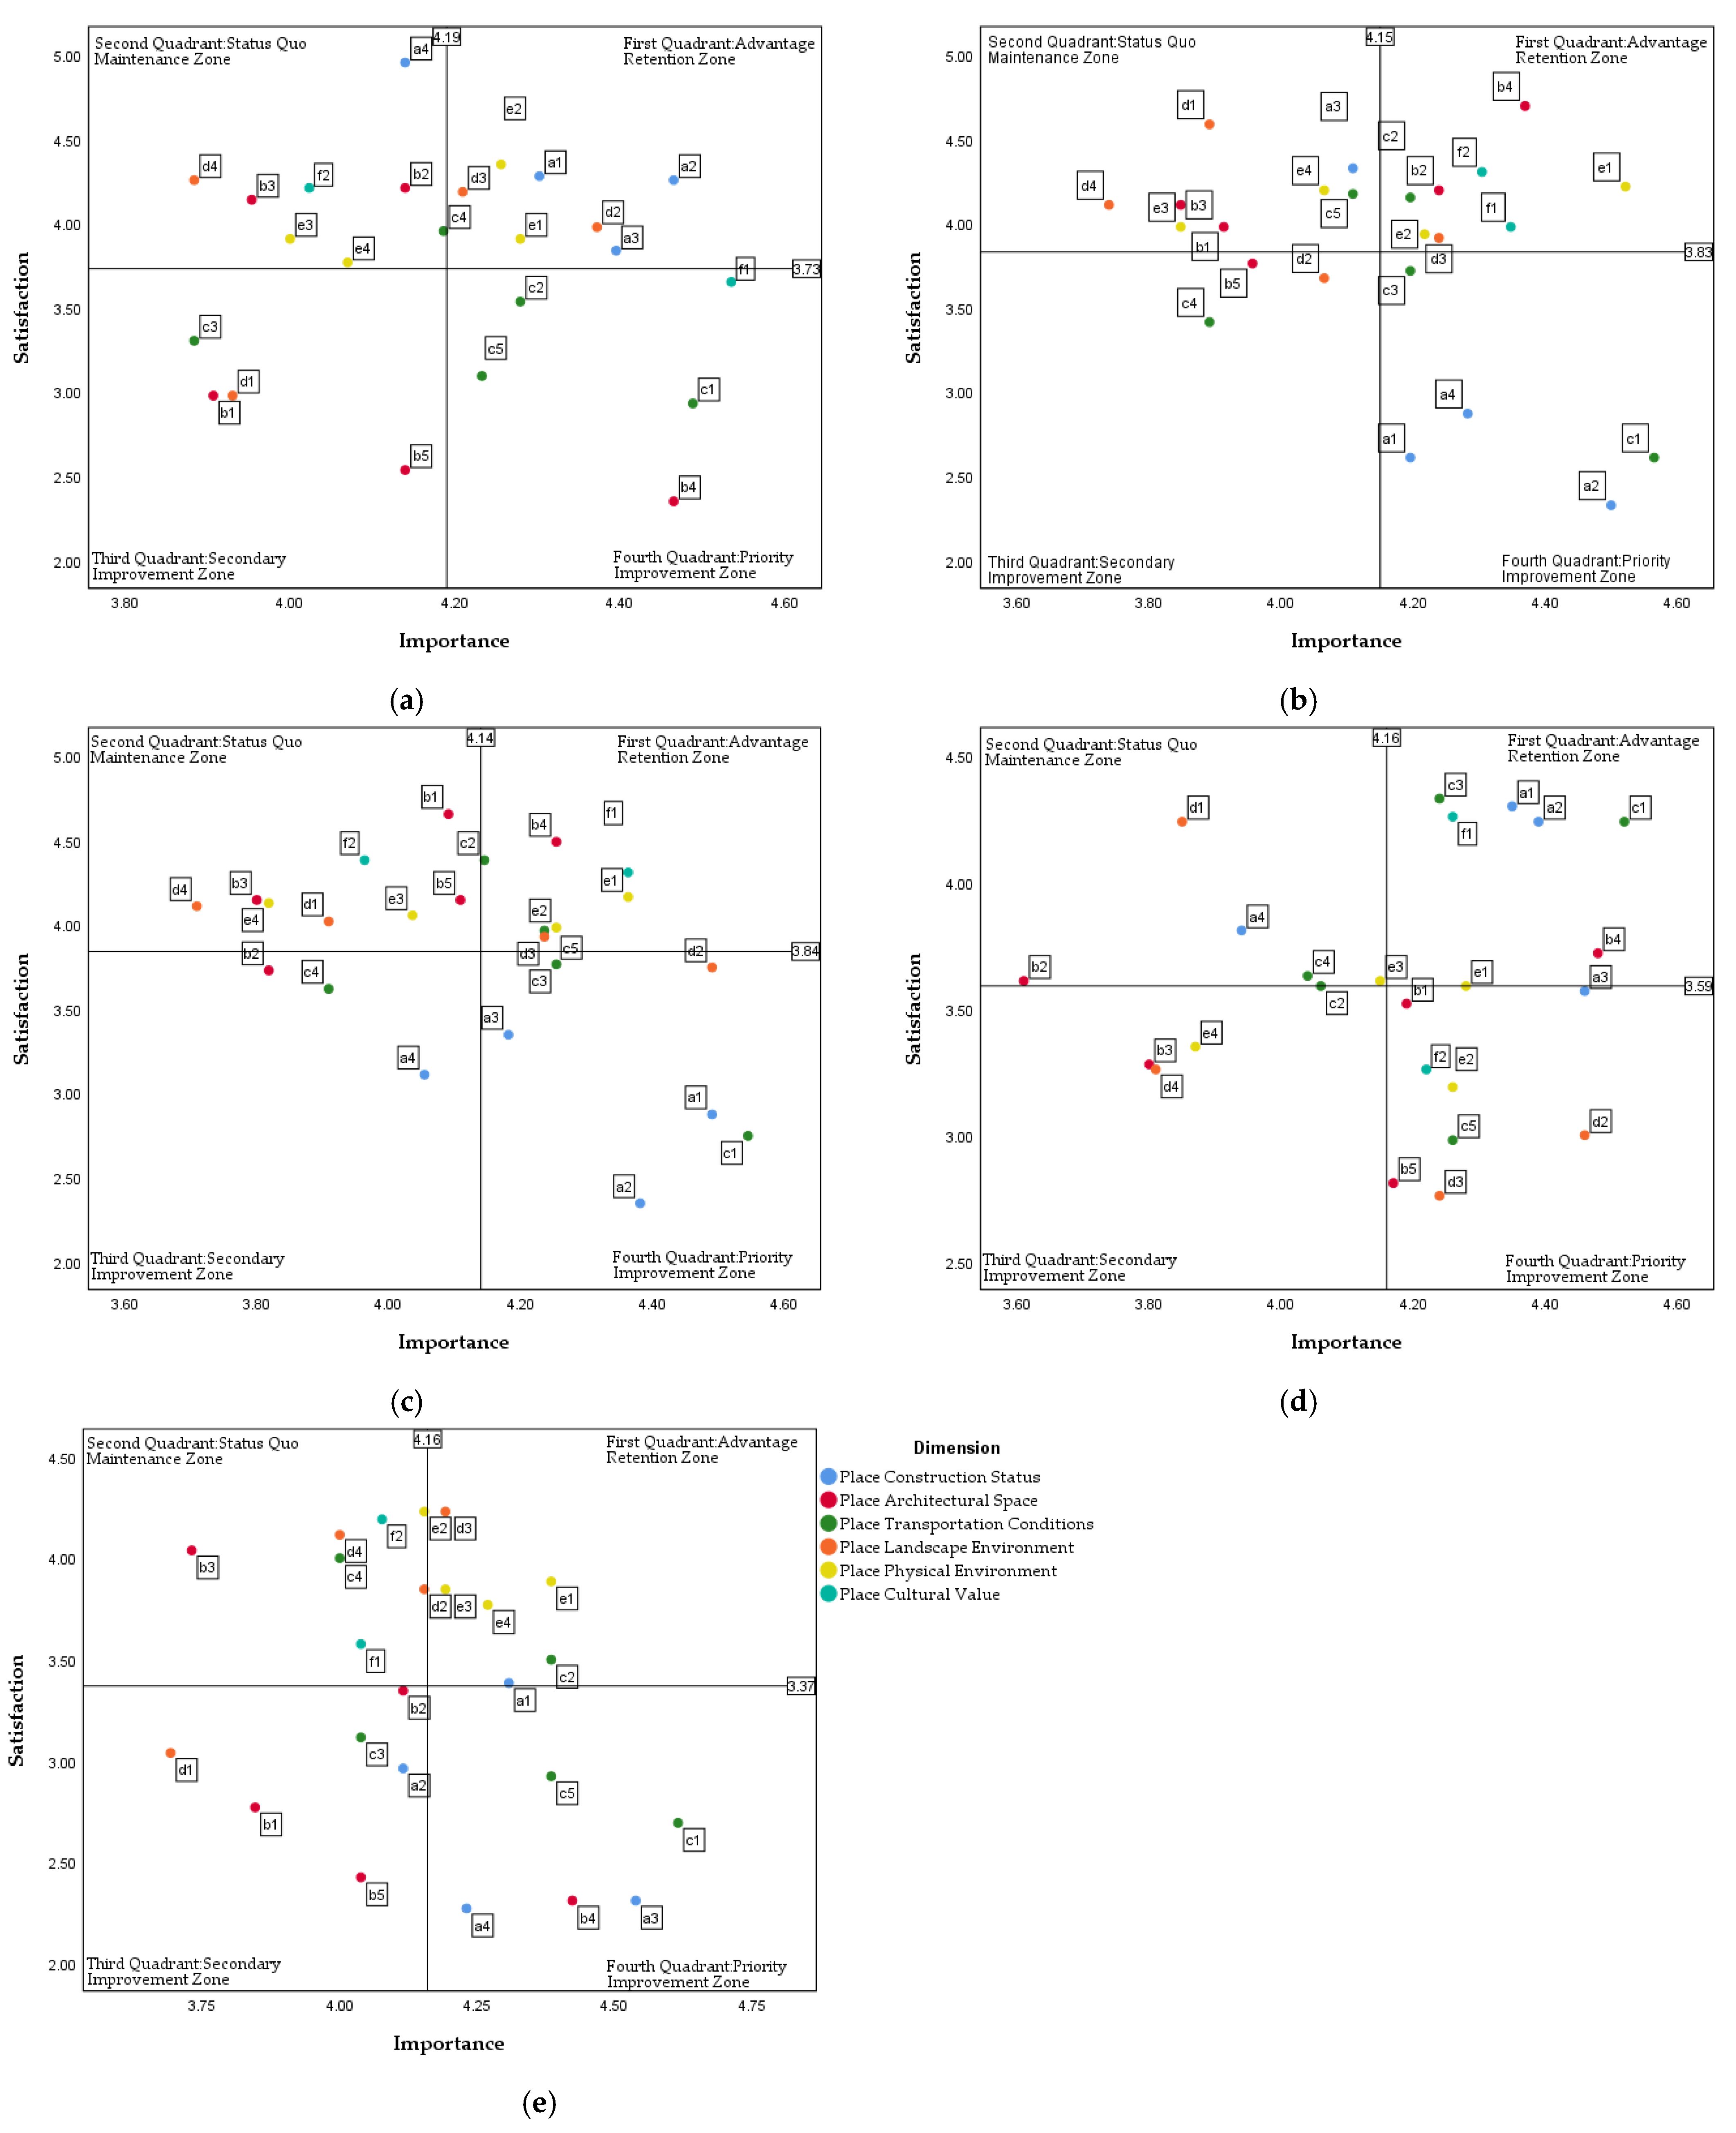
4.3. Comparative Analysis of IPA Models for Five Case Studies
- (1)
- Construction quality:
- (2)
- Spatial organization:
- (3)
- Transportation conditions:
- (4)
- Facility equipment:
5. Experts’ Cognitive Evaluation of Place Environmental Quality in Five Case Studies
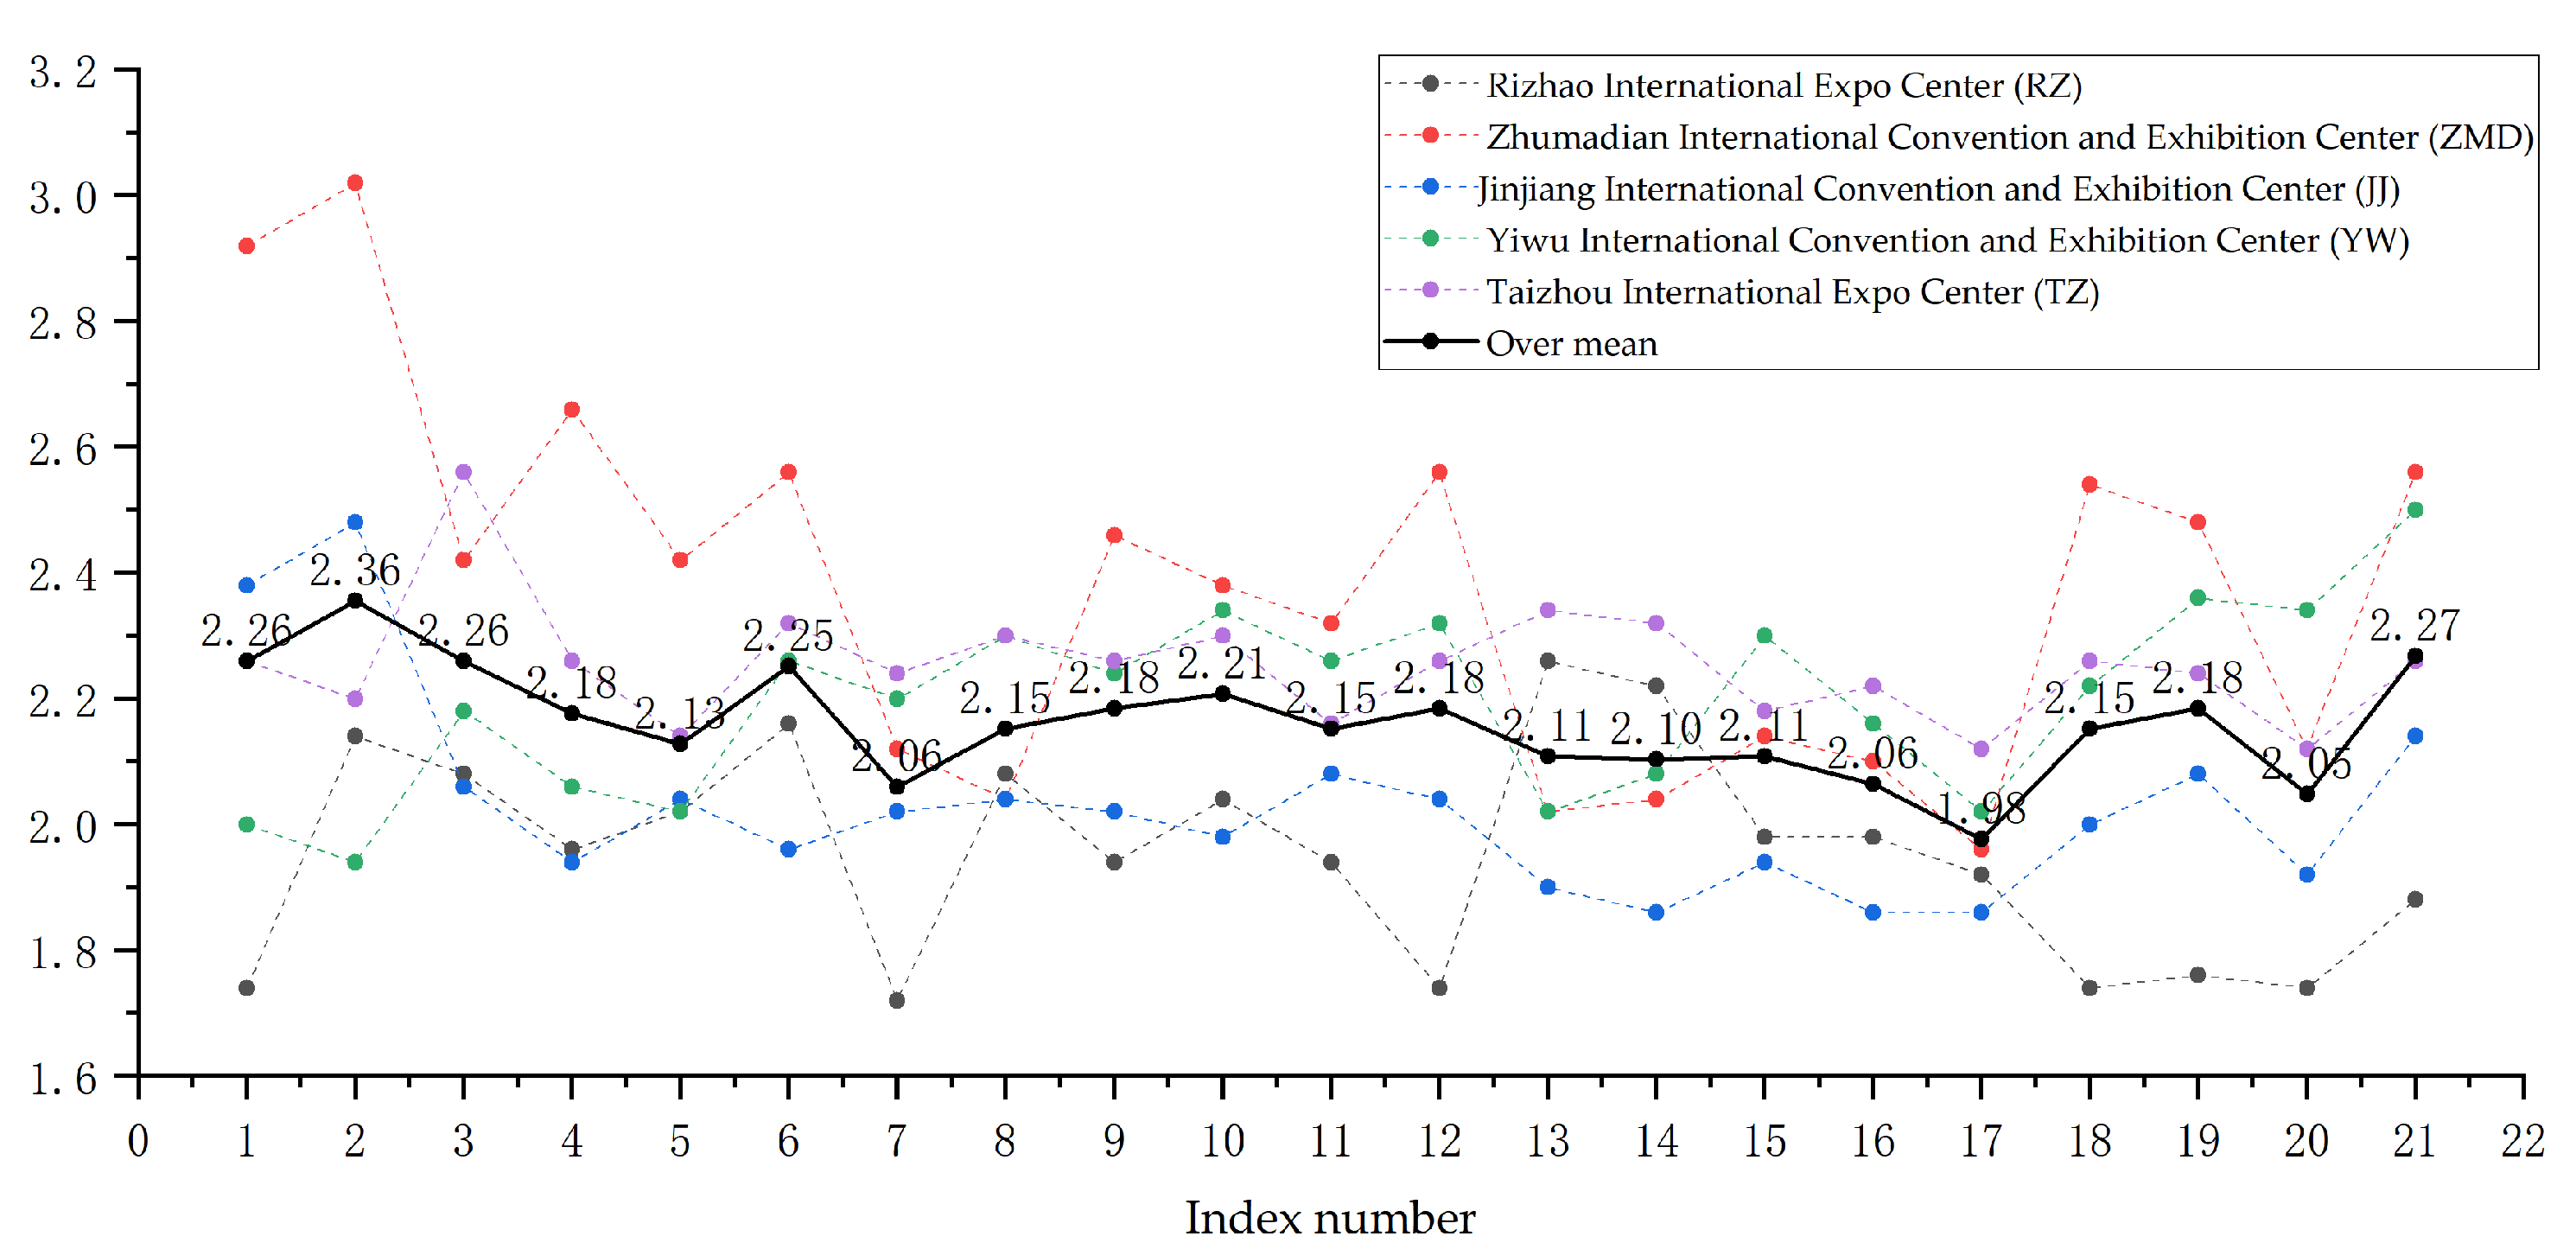
5.1. Questionnaire Data Analysis
- (1)
- Mean and Variance Analysis
- (2)
- Factor Analysis
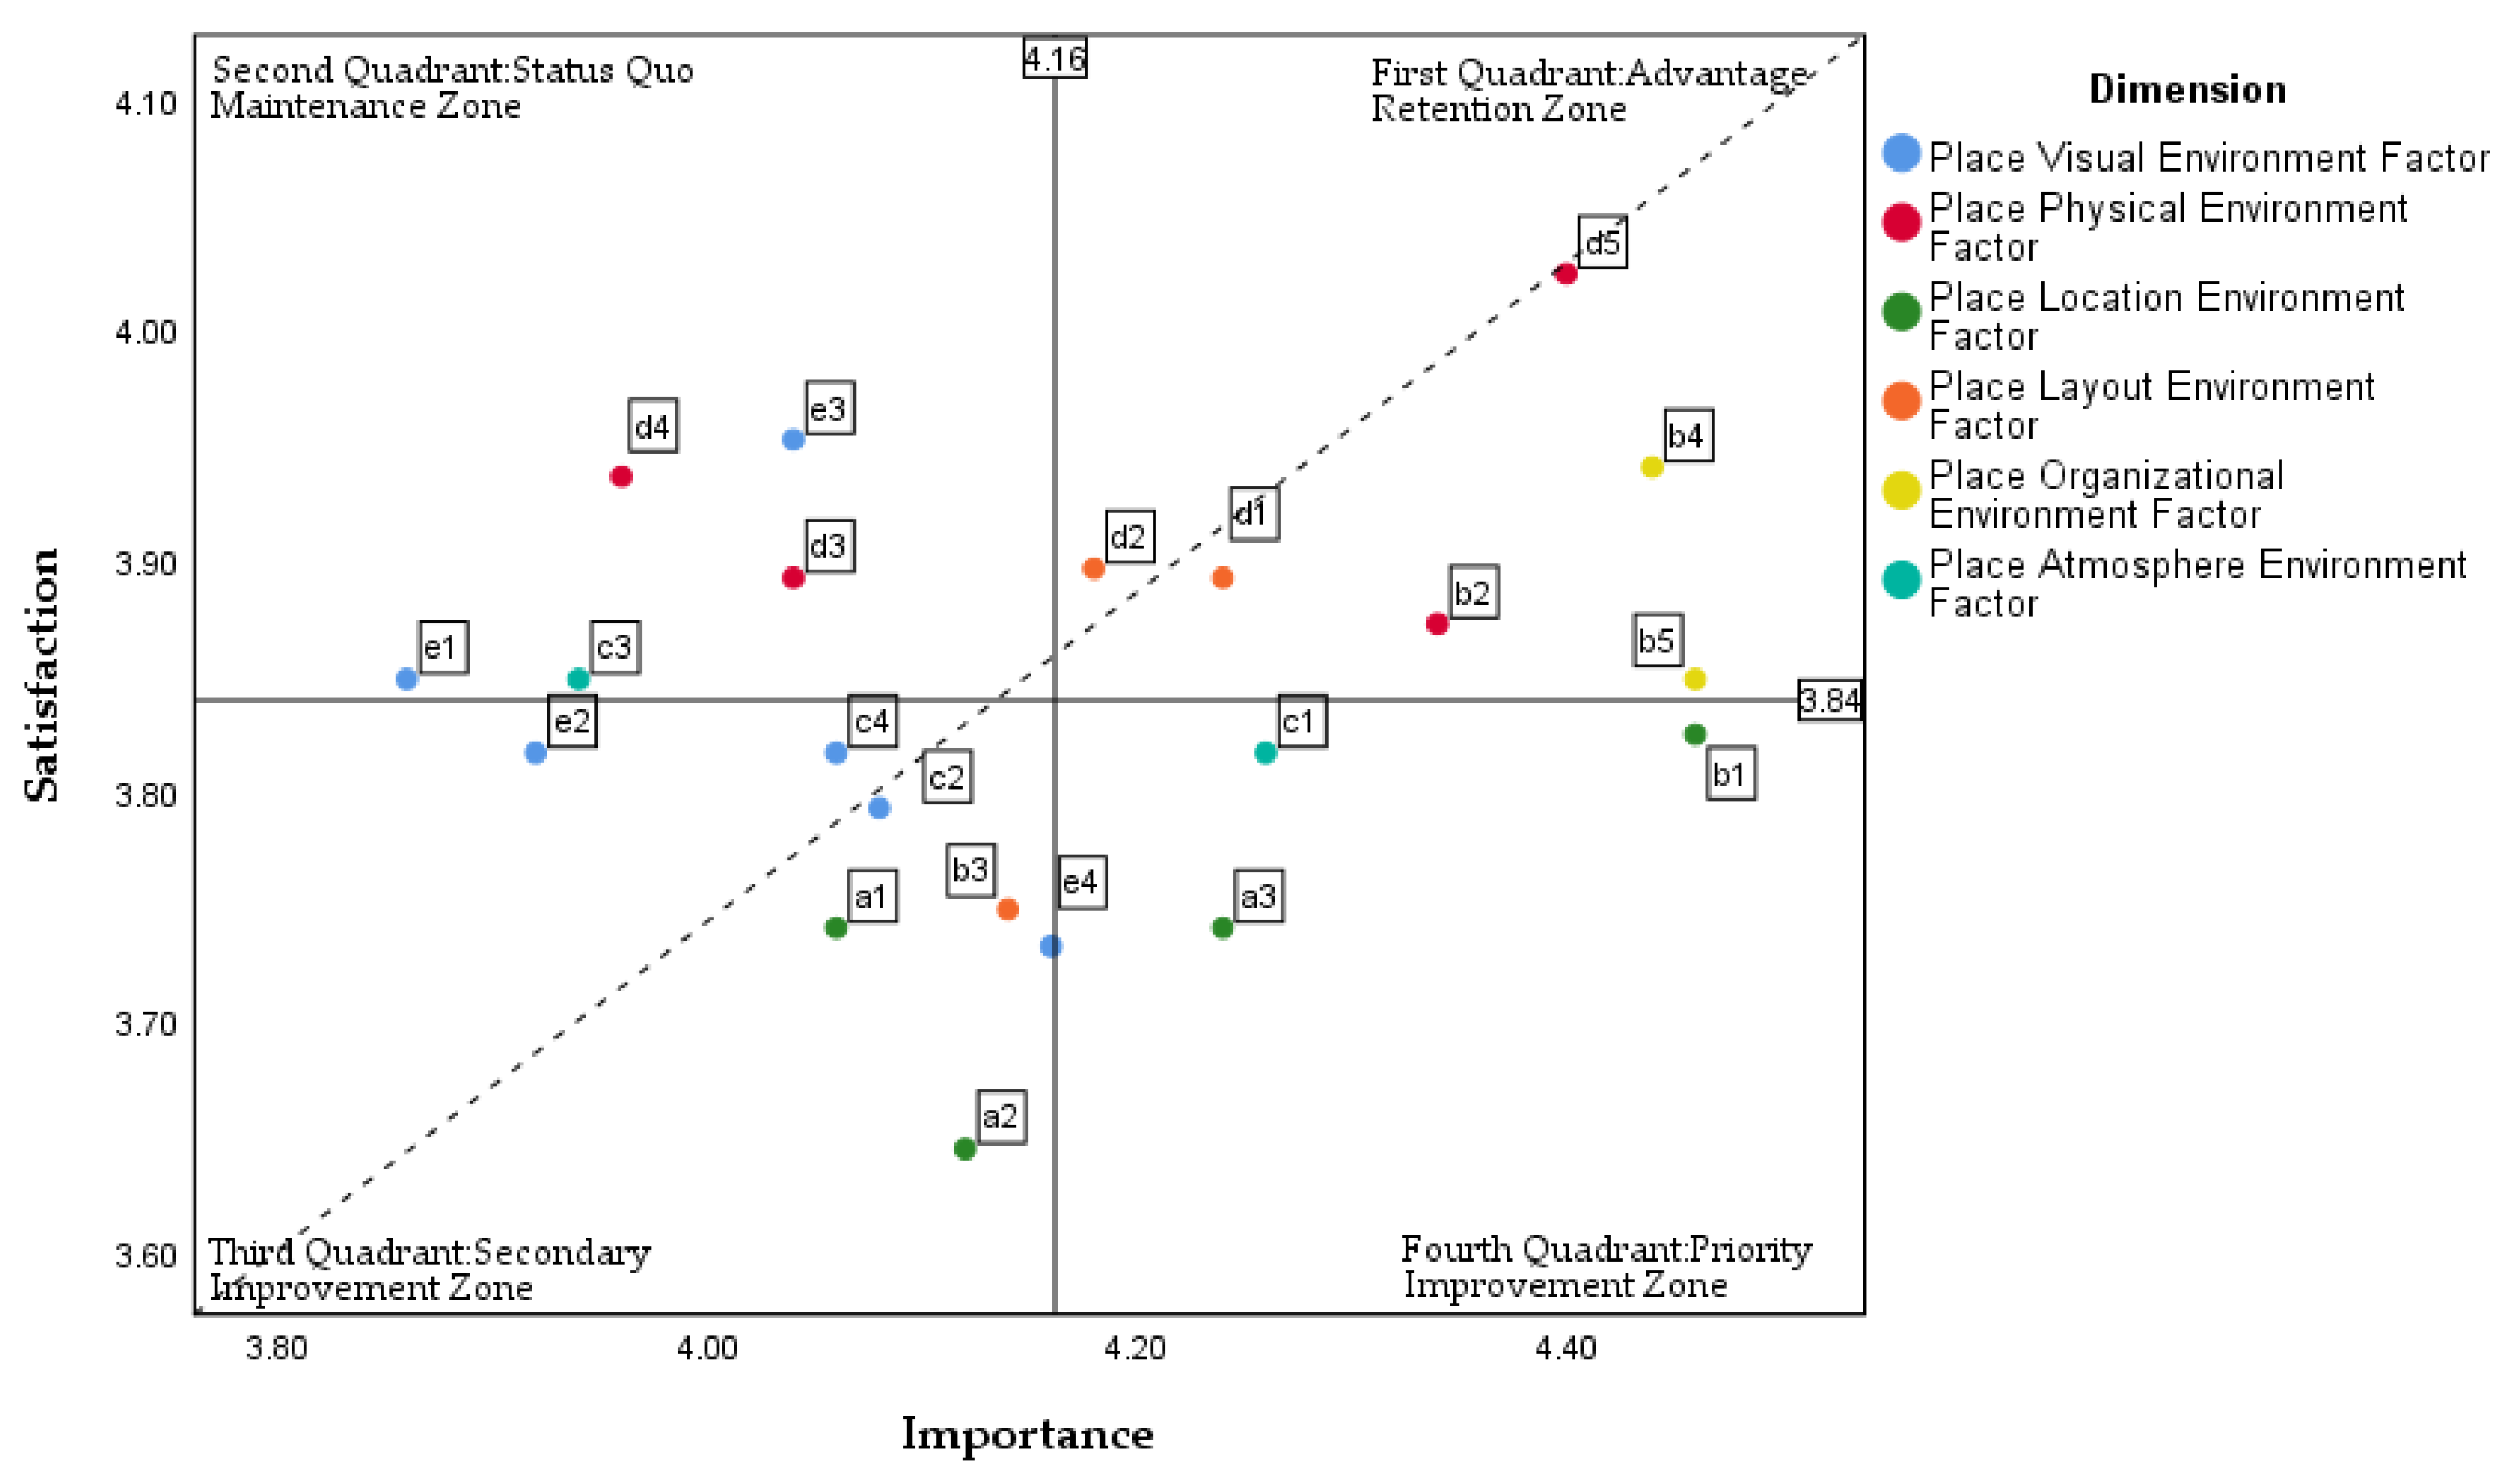
5.2. Construction and Analysis of the Overall IPA Model
5.3. Analysis of Differences in Evaluations Among Experts
6. Discussion and Conclusions
6.1. Analysis of Similarities and Differences in the Evaluation of Environmental Quality of Exhibition and Convention Buildings in Small- and Medium-Sized Cities by Users and Experts
6.2. Proposed Design Strategies for Enhancing the Environmental Quality of Exhibition and Convention Buildings in Small- and Medium-Sized Cities
6.2.1. “Adaptation”: Selecting Ideal Locations Based on Diverse Needs
6.2.2. “Attraction”: Creating a Vibrant Urban Environment with an Interactive Atmosphere
6.2.3. “Quality Improvement”: Creating Comfortable Public Environments with Inclusive Design
6.3. Limitations of the Study
Author Contributions
Funding
Data Availability Statement
Acknowledgments
Conflicts of Interest
Appendix A
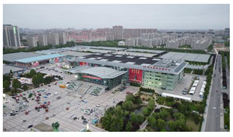
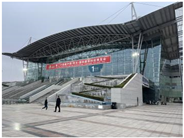
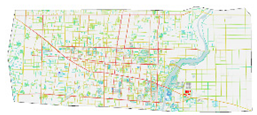
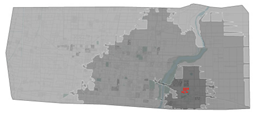
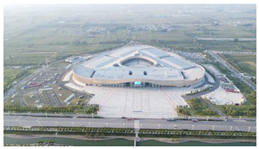
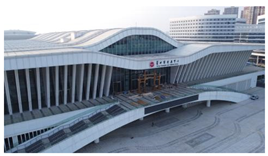
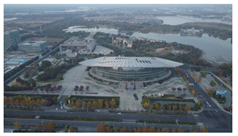
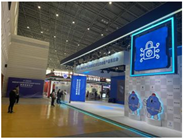
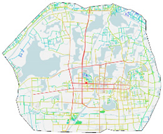
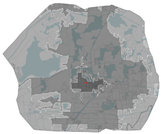
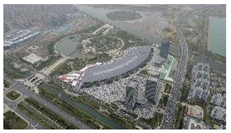
| Rizhao International Expo Center (RZ) | |||||||||||||
| Year | 2019 | City GDP (2023) (Billion CNY) | 239.086 | Floor Area | 399,000 m2 | Total Land Area | 449,500 m2 | Function | Convention, Exhibition, Hotel, Theater | Design Organization | China Architecture Design & Research Group (Beijing, China) | ||
| City | Rizhao, Shandong | Total Investment (Billion CNY) | 3.8 | Urban Location | City Center | Parking Spaces | 3406 | Layout Characteristics | Decentralized layout with exhibition halls, theater, and hotel arranged separately. | ||||
| Exhibition Space Indicators | Meeting Space Indicators | ||||||||||||
| Indoor Exhibition Area | 2390.86 m2 | Hall Clear Height | 20 m | Number of Halls | 6 | Meeting Area | 2000 m2 | A 2000 m2 Multi-function Hall. | |||||
| Outdoor Exhibition Area | 0 | Main Hall Area | 5500 m2 | Number of Booths | 438 | Number of Meeting Rooms | 1 | ||||||
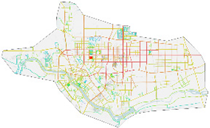
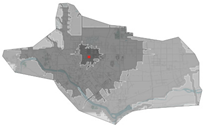
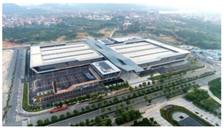
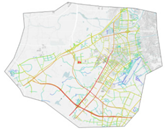
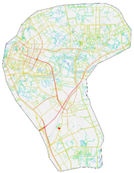
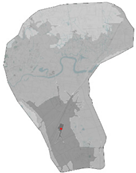
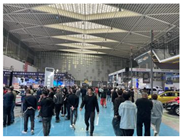
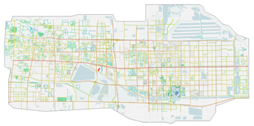
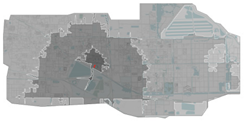
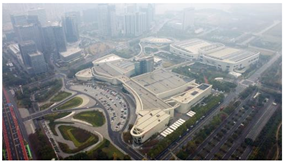
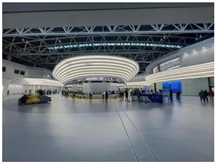
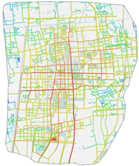
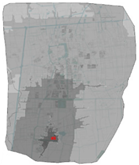
| Research Photos | Global Integration | Time Accessibility | |||||||||||
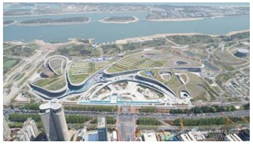 | 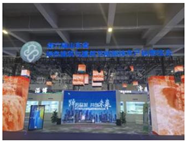 | 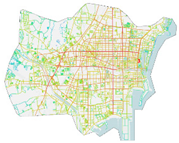 | 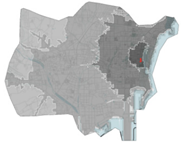 | ||||||||||
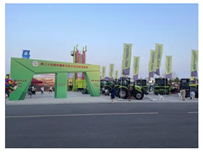
| Shouguang International Convention and Exhibition Center (SG) | |||||||||||||
| Year | 2000 | City GDP (2023) (Billion CNY) | 102.87 | Floor Area | 70,000 m2 | Total Land Area | 150,000 m2 | Function | Convention, Exhibition | Design Organization | - | ||
| City | Shouguang, Shandong | Total Investment (Billion CNY) | 1.35 | Urban Location | City Center | Parking Spaces | 1275 | Layout Characteristics | Decentralized layout with exhibition halls developed in multiple phases. | ||||
| Exhibition Space Indicators | Meeting Space Indicators | ||||||||||||
| Indoor Exhibition Area | 70,000 m2 | Hall Clear Height | 10 m | Number of Halls | 8 | Meeting Area | 1000 m2 | Approximately 500 m2 for public space, about 50 m2, and a 35 m2 meeting room. | |||||
| Outdoor Exhibition Area | 15,000 m2 | Main Hall Area | 5500 m2 | Number of Booths | 1200 | Number of Meeting Rooms | 3 | ||||||
| Research Photos | Global Integration | Time Accessibility | |||||||||||
 |  |  |  | ||||||||||
| Zhumadian International Convention and Exhibition Center (ZMD) | |||||||||||||
| Year | 2019 | City GDP (2023) (Billion CNY) | 309.72 | Floor Area | 167,000 m2 | Total Land Area | 333,000 m2 | Function | Convention, Exhibition, Theater | Design Organization | COSPACE DESIGN GROUP (Shanghai, China) | ||
| City | Zhumadian, Henan | Total Investment (Billion CNY) | 2.0 | Urban Location | Suburban | Parking Spaces | 1093 | Layout Characteristics | Enclosed layout featuring exhibition halls, a conference center, and a performance center arranged around a central space. | ||||
| Exhibition Space Indicators | Meeting Space Indicators | ||||||||||||
| Indoor Exhibition Area | 54,000 m2 | Hall Clear Height | 15.6 m | Number of Halls | 7 | Meeting Area | 19,200 m2 | A 3000 m2 multi-function hall, a 1600 m2 large meeting room, two 800 m2 medium-sized meeting rooms, eight VIP rooms, and a 22,300 m2 performing arts center. | |||||
| Outdoor Exhibition Area | 4000 | Main Hall Area | 8200 m2 | Number of Booths | 3000 | Number of Meeting Rooms | 4 | ||||||
| Research Photos | Global Integration | Time Accessibility | |||||||||||
 |  |  |  | ||||||||||
| Xinyang Baihua Convention and Exhibition Center (XY) | |||||||||||||
| Year | 2011 | City GDP (2023) (Billion CNY) | 102.87 | Floor Area | 78,000 m2 | Total Land Area | 78,000 m2 | Function | Convention, Exhibition | Design Organization | - | ||
| City | Xinyang, Henan | Total Investment (Billion CNY) | 0.7 | Urban Location | City Center | Parking Spaces | 660 | Layout Characteristics | Comb-shaped: exhibition halls are located on both sides of an indoor corridor. | ||||
| Exhibition Space Indicators | Meeting Space Indicators | ||||||||||||
| Indoor Exhibition Area | 21,000 m2 | Hall Clear Height | 20 m | Number of Halls | 4 | Meeting Area | 1200 m2 | A 1200 m2 Conference Hall | |||||
| Outdoor Exhibition Area | 30,000 m2 | Main Hall Area | 4100 m2 | Number of Booths | 824 | Number of Meeting Rooms | 1 | ||||||
| Research Photos | Global Integration | Time Accessibility | |||||||||||
 | 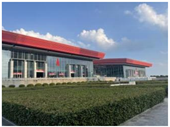 |  |  | ||||||||||
| Jinjiang International Convention and Exhibition Center (YW) | |||||||||||||
| Year | 2020 | City GDP (2023) (Billion CNY) | 336.35 | Floor Area | 99,500 m2 | Total Land Area | 120,500 m2 | Function | Convention, Exhibition | Design Organization | Architectural Design & Research Institute of SCUT Co., Ltd.(Guangzhou, Guangdong, China) | ||
| City | Jinjiang, Fujian | Total Investment (Billion CNY) | 0.98 | Urban Location | Suburban | Parking Spaces | 1246 | Layout Characteristics | Comb-shaped: exhibition halls are located on both sides of an outdoor corridor. | ||||
| Exhibition Space Indicators | Meeting Space Indicators | ||||||||||||
| Indoor Exhibition Area | 48,000 m2 | Hall Clear Height | 12 m | Number of Halls | 4 | Meeting Area | 2412 m2 | A 722 m2 meeting room, a 1209 m2 banquet hall, a 481 m2 meeting room, and a first-floor meeting room that can be divided into four smaller rooms using movable partitions. | |||||
| Outdoor Exhibition Area | 5600 | Main Hall Area | 8100 m2 | Number of Booths | 2016 | Number of Meeting Rooms | 4 | ||||||
| Research Photos | Global Integration | Time Accessibility | |||||||||||
 |  |  | 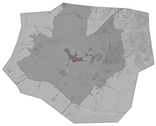 | ||||||||||
| Yiwu International Convention and Exhibition Center (YW) | |||||||||||||
| Year | 2009 | City GDP (2023) (Billion CNY) | 205.562 | Floor Area | 240,000 m | Total Land Area | 146,000 | Function | Convention, Exhibition, Hotel, Business | Design Organization | - | ||
| City | Yiwu, Zhejiang | Total Investment (Billion CNY) | 1.8 | Urban Location | City Center | Parking Spaces | 700 | Layout Characteristics | Comb-shaped: exhibition halls are connected by corridors, each spanning two floors. | ||||
| Exhibition Space Indicators | Meeting Space Indicators | ||||||||||||
| Indoor Exhibition Area | 100,000 m2 | Hall Clear Height | 11 m | Number of Halls | 14 | Meeting Area | 1000 m2 | A 7600 m2 hall, a 1000 m2 conference room, and multiple 27 m2 meeting rooms | |||||
| Outdoor Exhibition Area | 0 | Main Hall Area | 7600 m2 | Number of Booths | 5300 | Number of Meeting Rooms | 4 | ||||||
| Research Photos | Global Integration | Time Accessibility | |||||||||||
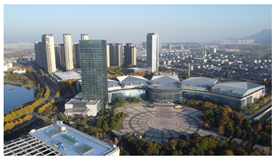 |  | 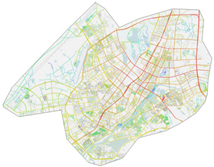 | 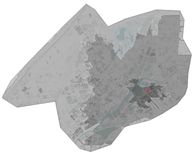 | ||||||||||
| Putian Convention and Exhibition Center (PT) | |||||||||||||
| Year | 2018 | City GDP (2023) (Billion CNY) | 307.07 | Floor Area | 109,000 m2 | Total Land Area | 52,300 m2 | Function | Convention, Exhibition | Design Organization | Xiamen China Northeast Architectural Design & Research Institute Co., Ltd.(Xiamen, Fujian, China) | ||
| City | Putian, Fujian | Total Investment (Billion CNY) | 0.9 | Urban Location | Suburban | Parking Spaces | 940 | Layout Characteristics | Independent: exhibition halls and conference rooms are distributed vertically across two floors. | ||||
| Exhibition Space Indicators | Meeting Space Indicators | ||||||||||||
| Indoor Exhibition Area | 20,000 m2 | Hall Clear Height | 5 m | Number of Halls | 2 | Meeting Area | 9289 m2 | A 3480 m2 multi-function hall, a 3280 m2 banquet hall, five VIP rooms ranging from 64.74 m2 to 270.1 m2, three meeting rooms ranging from 159.3 m2 to 262.08 m2, a 616 m2 press center, four VIP lounges ranging from 66 m2 to 93 m2, and four negotiation rooms ranging from 76 m2 to 107 m2. | |||||
| Outdoor Exhibition Area | 8000 m2 | Main Hall Area | 5724 m2 | Number of Booths | 600 | Number of Meeting Rooms | 19 | ||||||
| Research Photos | Global Integration | Time Accessibility | |||||||||||
 |  |  |  | ||||||||||
| Shengze International Convention and Exhibition Center (SZ) | |||||||||||||
| Year | 2014 | City GDP (2023) (Billion CNY) | 336.35 | Floor Area | 38,657 m2 | Total Land Area | 51,660 m2 | Function | Exhibition | Design Organization | Shandong Provincial Architectural Design & Research Institute Co., Ltd.(Jinan, Shandong, China) | ||
| City | Shengze, Jiangsu | Total Investment(Billion CNY) | 0.98 | Urban Location | City Center | Parking Spaces | 270 | Layout Characteristics | Independent: parking on the first floor, exhibition halls on the second floor. | ||||
| Exhibition Space Indicators | Meeting Space Indicators | ||||||||||||
| Indoor Exhibition Area (m2) | 10,000 m2 | Hall Clear Height | 15 m | Number of Halls | 1 | Meeting Area | 2000 m2 | The venue includes a 1000 m2 meeting room, a 500 m2 meeting room, a 300 m2 meeting room, and a 200 m2 meeting room. | |||||
| Outdoor Exhibition Area (m2) | 0 | Main Hall Area (m2) | 10,000 m2 | Number of Booths | 300 | Number of Meeting Rooms | 4 | ||||||
| Research Photos | Global Integration | Time Accessibility | |||||||||||
 |  |  |  | ||||||||||
| Dongying International Convention and Exhibition Center (DY) | |||||||||||||
| Year | 2009 | City GDP (2023) (Billion CNY) | 389.91 | Floor Area | 37,000 m2 | Total Land Area | 176,600 m2 | Function | Convention, Huatai groupon | Design Organization | Huatai group (Dongying, Shandong, China) | ||
| City | Dongying, Shandong | Total Investment (Billion CNY) | 1.26 | Urban Location | Suburban | Parking Spaces | 2000 | Layout Characteristics | Independent: exhibition halls are connected in the center, with a public corridor on one side and a cargo entrance on the other. | ||||
| Exhibition Space Indicators | Meeting Space Indicators | ||||||||||||
| Indoor Exhibition Area (m2) | 23,679 m2 | Hall Clear Height | 23 m | Number of Halls | 3 | Meeting Area | 5153 m2 | The venue includes a 1920 m2 meeting room, a 1300 m2 meeting room, a 530 m2 meeting room, a 700 m2 meeting room, a 289 m2 meeting room, and two 450 m2 meeting rooms. | |||||
| Outdoor Exhibition Area (m2) | 0 | Main Hall Area (m2) | 6000 m2 | Number of Booths | 836 | Number of Meeting Rooms | 16 | ||||||
| Research Photos | Global Integration | Time Accessibility | |||||||||||
 |  |  |  | ||||||||||
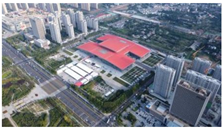
| Taizhou International Expo Center (TZ) | |||||||||||||
| Year | 2010 | City GDP (2023) (Billion CNY) | 673.17 | Floor Area | 160,000 m2 | Total Land Area | 126,700 m2 | Function | Convention, Exhibition | Design Organization | Tus-Design Group Co., Ltd.(Suzhou, Jiangsu, China) | ||
| City | Taizhou, Jiangsu | Total Investment (Billion CNY) | 2.6 | Urban Location | City Center | Parking Spaces | 548 | Layout Characteristics | 42 meeting rooms, each approximately 100 m2, dozens of 30 m2 negotiation rooms, a 3000 m2 main conference hall, and a dining center featuring a 3000 m2 hall along with 8 private dining rooms. | ||||
| Exhibition Space Indicators | Meeting Space Indicators | ||||||||||||
| Indoor Exhibition Area (m2) | 60,000 m2 | Hall Clear Height | 16 m | Number of Halls | 8 | Meeting Area | 5565 m2 | 42 meeting rooms, each approximately 100 m2, dozens of 30 m2 negotiation rooms, a 3000 m2 main conference hall, and a dining center with a 3000 m2 hall and 8 private dining rooms. | |||||
| Outdoor Exhibition Area (m2) | 10,000 m2 | Main Hall Area (m2) | 11,880 m2 | Number of Booths | 2000 | Number of Meeting Rooms | 42 | ||||||
| Research Photos | Global Integration | Time Accessibility | |||||||||||
 |  |  |  | ||||||||||
References
- Chenhao, F.; Zhao, M. China”s New Corresponding “Dual Circulation Economy”: Trend of Urban Development and Planning Strategies. Urban Plan. J. 2022, 1, 18–26. [Google Scholar]
- Xie, Y. Research on the Architectural Programming Elements of Conference and Exhibition Buildings in Small and Medium-Sized Cities; South China University of Technology: Guangzhou, China, 2024. [Google Scholar]
- Kusch, K. Conference and Exhibition Buildings Design and Construction Manual; Huazhong University of Science and Technology Press: Wuhan, China, 2014. [Google Scholar]
- Ni, Y. Introduction to the Types of Conference and Exhibition Buildings; South China University of Technology Press: Guangzhou, China, 2019. [Google Scholar]
- Zhu, F. Exploration and Practice of the Development of the Conference and Exhibition Industry in Small and Medium-Sized Cities; Huazhong University of Science and Technology Press: Huazhong, China, 2022. [Google Scholar]
- Crouch, G.I.; Louviere, J.J. The Determinants of Convention Site Selection: A Logistic Choice Model from Experimental Data. J. Travel Res. 2004, 43, 118–130. [Google Scholar] [CrossRef]
- Fortin, P.-A.; Ritchie, J.-R.-R.; Arsenault, J. A Study of the Decision Process of North American Associations Concerning the Choice of a Convention Site; Quebec Planning and Development Council: Quebec City, QC, Canada, 1976. [Google Scholar]
- Xu, M.; Zhang, Y.; Wang, X. The Mode of Site Selection and Facility Planning for Exhibition Centers in Germany. Urban Plan. 2003, 27, 32–39,48. [Google Scholar]
- Zhao, J. Exploring of Generalized Regional Characteristics To the Conference and Exhibition Architecture; Southwest Jiaotong University: Chengdu, China, 2005. [Google Scholar]
- Hou, X. Research on Conference and Exhibition Complex Design Based on Symbiosis Theory; South China University of Technology: Guangzhou, China, 2019. [Google Scholar]
- Tian, Y.; Wang, W. Research on Adaptive Design of Exhibition Builduigs in Small and Mechum-Sized Cities:A Case of Yibin International Convention and Exhibition Center Phase II Project. Urban Archit. 2021, 18, 93–95. [Google Scholar]
- Qin, Q. Thoughts on the Development of the Exhibition Economy in Small and Medium-Sized Cities Based on the “Long Tail Theory”. Jiangsu Bus. Rev. 2010, 5, 110–112. [Google Scholar]
- Lu, X. Analysis of the Design of Small and Medium-Sized Conference and Exhibition Buildings—The Architectural Design of Tai’an Exhibition Center and Liaocheng Exhibition Center. Urban Archit. 2014, 18, 10–11. [Google Scholar]
- Zhang, J. On the Sustainable Development of Conference and Exhibition Complexes in Small and Medium-Sized Cities. Bus. Cult. 2012, 7, 212–213. [Google Scholar]
- Wang, P.; Cai, M.; Peng, P. Research on the Development Path of the Conference and Exhibition Industry in Small and Medium-Sized Cities—Taking Chenzhou as an Example. Hunan Soc. Sci. 2018, 4, 152–158. [Google Scholar]
- Su, Z. Study on Compound Design Strategy of Small and Medium-Sized Conference and Exhibition Building; Kunming University of Science and Technology: Kunming, China, 2016. [Google Scholar]
- Zeng, L.; Qiu, M. Research on the Development of Exhibition Tourism in Small and Medium-Sized Cities in China:Taking Langfang City as an Example. Chin. Foreign Entrep. 2020, 2, 242. [Google Scholar]
- Song, Q. The Path Analysis of Chinese Small and Medium-Sized Cities Exhibition Economy Development. Econ. J. 2015, 5, 54. [Google Scholar]
- Gao, J.; Zhu, H.; Chen, J. A Preliminary Study into the Development Conditions and Driving Force Systemof MICE Industry. Tour. Sci. 2003, 1, 24–27. [Google Scholar]
- Amos Rapoport. The Meaning of the Built Environment; China Architecture & Building Press: Beijing, China, 1992. [Google Scholar]
- Zhu, X. Research on the Subjective Evaluation Method of the Built Environment; Southeast University Press: Beijing, China, 2005. [Google Scholar]
- Bai, J. Research on the External Traffic Space Environment Evaluation of Mixed-Use High-Rise Buildings Based on the SD Method; South China University of Technology: Guangzhou, China, 2022. [Google Scholar]
- Bell, P.A.; Greene, T.C.; Fisher, J.D.; Baum, A. Environmental Psychology—Principles and Practice; Allyn and Bacon, Inc.: Boston, MA, USA, 1987. [Google Scholar]
- Zube, E.H. Environmental Evaluation: Perception and Public Policy; Cambridge University Press: New York, NY, USA, 1984. [Google Scholar]
- Zhuang, W. Architectural Programming and Design; China Architecture & Building Press: Beijing, China, 2016. [Google Scholar]
- Hu, Z. Environmental Psychology: Environment-Behavior Research and Its Design Applications; China Architecture & Building Press: Beijing, China, 2018. [Google Scholar]
- Lin, Y. Environmental Psychology; China Architecture & Building Press: Beijing, China, 2006. [Google Scholar]
- Zhu, X. Application of Index Evaluation Method: An Interior Integrated Evaluation to Business Halls of China Construction Bank in Shenzhen. J. Chongqing Univ. Archit. 2005, 4, 28–32. [Google Scholar]
- Yang, G.; Xu, L. Evaluation of Residential Environment in Shanghai. J. Tongji Univ. (Nat. Sci. Ed.) 1996, 5, 546–551. [Google Scholar]
- Guo, H.; Zhu, J. Establishment of Evaluation Index System for Urban Human Settlement Comfort and Its Application: A Case Study of Tai’an City. Yunnan Geogr. Environ. Res. 2005, 4, 39–42. [Google Scholar]
- Yin, C. Post-Occupancy Evaluation and Space Design Model of Basic Residential Units in the Pearl River Delta; South China University of Technology: Guangzhou, China, 2006. [Google Scholar]
- Kang, Z.; Bao, Y. Study on Key Elements for the Exhibition Complex. Urban Archit. 2022, 19, 91–97. [Google Scholar]
- Hong, F. Analysis of the Planning and Design Principles of Emerging Exhibition Centers. Anhui Archit. 2022, 29, 12–13. [Google Scholar]
- Liu, Z. Research on Site Selection and Layout Design Strategy of China’s Especially Large Conference and Exhibition Center Based on Accessibility Analysis; South China University of Technology: Guangzhou, China, 2019. [Google Scholar]
- Ren, G. The Agglomeration Characteristics and Influencing Factors of Exhibition Venues in Yangtze River Delta. Econ. Geogr. 2014, 34, 86–92. [Google Scholar]
- Ali-Murat, T.; Pembegül, T. Post Occupancy Evaluation in the Practice of Architecture: A Case Study of Lütfi Kırdar Convention and Exhibition Centre. METU J. Fac. Archit. 2010, 27, 241–265. [Google Scholar]
- Zhou, Z. The Exploration of Development Trends of Contemporary Conference and Exhibition Center; Tongji University: Shanghai, China, 2008. [Google Scholar]
- Zhao, G.; Wan, H.; Li, H. Function and Scale Analysis of Exhibition Buildings. Constr. Technol. 2020, 21, 119–121. [Google Scholar]
- Wang, L.; Wang, F. Site Selection of Mega-Event and Urban Spatial Forms. Urban Plan. 2010, 11, 93–96. [Google Scholar]
- Li, X. Comprehensive Traffic Impact Analysis for the National Convention and Exhibition Centers; Hebei University of Technology: Hebei, China, 2014. [Google Scholar]
- Wan, Z.; Zhou, T.; Luo, N. Effect of Layout of Exhibition Hall on the Evacuation Efficiency in Exhibition and Convention Center. Saf. Environ. Eng. 2020, 27, 106–115. [Google Scholar]
- Yu, H. Study on Traffic Spaces Design of Contemporary Compound Exhibition Buildings; Qingdao University of Technology: Qingdao, China, 2011. [Google Scholar]
- Wang, X.; Yang, L.; Yan, Z.; Cheng, H. Subjective evaluation of acoustic environment of conference andexhibition building. J. Xi’an Univ. Archit. Technol. (Nat. Sci. Ed. ) 2020, 52, 647–652,751. [Google Scholar]
- Zhang, X.; Xu, H.; Li, B. Air Conditioning Design for Wuhan International Exhibition Center. In Proceedings of the National Academic Annual Conference on Heating, Ventilation, Air Conditioning, and Refrigeration(2002), Guangzhou, China, 22 June 2002; pp. 679–682. [Google Scholar]
- Wang, L. Discussion on Electrical Facilities Design of Exhibition Area of Large Exhibition Building. Intell. Build. Electr. Technol. 2020, 14, 11–15. [Google Scholar]
- Wang, L. Application of Intelligent Distribution System in Exhibition Building. Intell. Build. Electr. Technol. 2021, 15, 9–12. [Google Scholar]
- Chen, X. Study on Renewable Landscape Strategy for the Aged in Old Communities Based on IPA Analysis Method: Taking Chengdu as an Example; Southwest Jiaotong University: Chengdu, China, 2020. [Google Scholar]
- Zhang, R. Research on Comprehensive Park Tourist Satisfaction Evaluation Based on LDA and Fuzzy Comprehensive Evaluation Method: Take the Six Districts of Beijing as an Example; Beijing Forestry University: Beijing, China, 2022. [Google Scholar]
- Feng, Z. Research on the Aging Adaptability Transformation of Old Communities Public Spaces in Chengdu Based on IPA Analysis Method; Sichuan Agricultural University: Ya’an, China, 2023. [Google Scholar]


| Comparison Dimension | Convention and Exhibition Buildings in Large Cities | Convention and Exhibition Buildings in Small-Medium Cities | Representative Cases | Key Differences |
|---|---|---|---|---|
| Functional Positioning | International and comprehensive, hosting global and national exhibitions (e.g., China International Import Expo and Canton Fair) | Regional and specialized, serving local industries or characteristic economies (e.g., agricultural expos and New Year goods fairs) | Large cities: National Exhibition and Convention Center (Shanghai) Small- and medium-sized cities: Yiwu International Expo Center | Large cities: global platform Small- and medium-sized cities: industry and livelihood |
| Spatial Organization | Large-scale (100,000+ m2), centralized layout with strict separation of pedestrian and logistics flows | Smaller-scale (20,000–50,000 m2), flexible, combinable spaces with multifunctional conversion | Large cities: Guangzhou Pazhou Complex (fishbone layout) Small- and medium-sized cities: Jinjiang International Convention and Exhibition Center (modular, divisible halls) | Large cities: high efficiency and intensity Small- and medium-sized cities: flexibility and versatility |
| Operational Model | Government–market joint operation, high booth rental fees, and profit from supporting services | Primarily government-subsidized, with low rental fees to attract local enterprises and foster industrial linkage | Large cities: China National Convention Center (Beijing) (“exhibition-driven-by-convention” model) Small- and medium-sized cities: Shouguang International Convention and Exhibition Center (agricultural expos + government subsidies) | Large cities: market oriented Small- and medium-sized cities: government led |
| Site Environment | Urban core areas or emerging business districts integrated with high-end commerce and transportation hubs | Urban centers, suburbs, or industrial parks with cost savings due to proximity to scenic spots and transportation nodes | Large cities: Hangzhou International Expo Center (G20 venue and Olympic Sports Center) Small- and medium-sized cities: Huangshan International Convention and Exhibition Center (adjacent to AAAAA scenic area) | Large cities: hub integration Small- and medium-sized cities: context adaptive |
| Project | Sample Attribute | ||||||
|---|---|---|---|---|---|---|---|
| Completion Year/City | Total Land Area/Floor Area | Total Investment (Billion CNY) | Urban Location | Resources Advantages | Functional Type | Layout Characteristics | |
| Rizhao International Expo Center (RZ) | 2019 | 449,500 m2 | 3.8 | City center | Natural environment resources | Mixed functions | Decentralized—exhibition halls, theater, and hotel are separately arranged. |
| Rizhao, Shandong | 399,000 m2 | ||||||
| Shouguang International Convention and Exhibition Center (SG) | 2000 | 150,000 m2 | 1.35 | City center | Urban industrial resources | Exhibition functions | Decentralized—exhibition halls constructed in phases. |
| Shouguang, Shandong | 70,000 m2 | ||||||
| Zhumadian International Convention and Exhibition Center (ZMD) | 2019 | 333,000 m2 | 2.0 | Suburban | Urban development direction | Mixed functions | Enclosed—exhibition halls, conference center, and performance center arranged around a central space. |
| Zhumadian, Henan | 167,000 m2 | ||||||
| Xinyang Baihua Convention and Exhibition Center (XY) | 2011 | 78,000 m2 | 0.7 | City center | Urban central resources | Conference and exhibition functions | Comb-shaped—exhibition halls are distributed on both sides of an indoor corridor. |
| Xinyang, Henan | 170,000 m2 | ||||||
| Jinjiang International Convention and Exhibition Center (JJ) | 2020 | 120,500 m2 | 0.98 | Suburban | Urban industrial resources | Conference and exhibition functions | Comb-shaped—exhibition halls are distributed on both sides of an outdoor corridor. |
| Jinjiang, Fujian | 99,500 m2 | ||||||
| Yiwu International Convention and Exhibition Center (YW) | 2009 | 146,000 m2 | 1.8 | City center | Urban industrial resources | Mixed functions | Comb-shaped—exhibition halls are connected by corridors, each spanning two floors. |
| Yiwu, Zhejiang | 240,000 m2 | ||||||
| Putian Convention and Exhibition Center (PT) | 2018 | 52,300 m2 | 0.9 | Suburban | Transportation hub resources | Conference and exhibition functions | Independent—exhibition halls and conference rooms are distributed vertically across two floors. |
| Putian, Fujian | 109,000 m2 | ||||||
| Shengze International Convention and Exhibition Center (SZ) | 2014 | 51,660 m2 | 0.14 | City center | Urban industrial resources | Exhibition functions | Independent—parking on the first floor, exhibition halls on the second floor. |
| Shengze, Jiangsu | 38,657 m2 | ||||||
| Dongying International Convention and Exhibition Center (DY) | 2009 | 176,600 m2 | 1.26 | Suburban | Urban development direction | Conference and exhibition functions | Independent—exhibition halls are connected in the middle, featuring a public corridor on one side and a cargo entrance on the other. |
| Dongying, Shandong | 37,000 m2 | ||||||
| Taizhou International Expo Center (TZ) | 2010 | 126,700 m2 | 2.6 | City Center | Urban industrial resources | Mixed functions | Decentralized—Phase I and Phase II were constructed independently, with the conference center arranged separately. |
| Taizhou, Jiangsu | 160,000 m2 | ||||||
| First-Level Indicators | Second-Level Indicators | Indicator Description |
|---|---|---|
| A. Site construction status | a1. Surrounding urban construction status | Assesses the urban planning and development conditions surrounding the site, including building density, population density, and employment density, to ensure a supportive environment for successful exhibition events. |
| a2. Surrounding commercial atmosphere | Evaluates the availability and attractiveness of commercial amenities in the vicinity of the exhibition building. | |
| a3. Distance to transportation hubs (airport and high-speed rail station) | Measures the proximity of the exhibition building to major transportation hubs. | |
| a4. Surrounding natural resources | Examines the diversity of the natural environment surrounding the exhibition building and its influence on exhibition activities. | |
| B. Architectural space | b1. Sense of orientation and signage system | Assesses the quality and effectiveness of the signage system in the surrounding environment, highlighting its role in organizing exhibition activities and enhancing participant experience. |
| b2. Building volume and relationship with surrounding buildings | Evaluates the size, form, and relationship of the exhibition building with surrounding structures, reflecting its volume characteristics and integration with the urban landscape. | |
| b3. Relationship between building and site topography | Examines the interaction between the exhibition building and the surrounding terrain, emphasizing harmony with the natural environment and alignment with sustainability goals. | |
| b4. Entrance and exit design | Determines whether the entrance and exit design of the exhibition building meets safety, convenience, and accessibility standards, ensuring a positive participant experience and efficient operations. | |
| b5. Organization and connection of functional spaces | Assesses whether the internal functional spaces of the exhibition building align with participants’ needs and activity flows, reflecting usage efficiency and overall experience. | |
| C. Transportation conditions | c1. Site accessibility | Evaluates the convenience of transportation to the exhibition building and the ease of access for participants, ensuring comfort and accessibility. |
| c2. Walking distance to the entrance | Measures the walking distance from parking areas or public transportation to the building entrance, considering convenience, safety, and comfort. | |
| c3. Road accessibility | Examines the openness of the surrounding road network and site circulation, ensuring smooth participant movement. | |
| c4. Drop-off space for exhibition activities | Assesses the adequacy of designated spaces for participants to alight, receive, and board vehicles during exhibition activities, emphasizing convenience and safety. | |
| c5. Parking space availability | Determines whether the number of parking spaces around the exhibition building sufficiently meets the needs of participants and visitors. | |
| D. Landscape environment | d1. The scale of assembly plaza | Evaluates the crowding level of outdoor assembly plazas, ensuring adequate space for rest, interaction, and activities, thereby enhancing participant satisfaction. |
| d2. Outdoor greenery | Assesses the quality of outdoor greenery, reflecting the environmental ambiance and its impact on participants’ experiences. | |
| d3. Landscape features and landmarks | Evaluates the design of landscape decorations and signage, considering their artistic, functional, and branding significance in the outdoor environment. | |
| d4. Ground material effects | Examines the selection and effectiveness of ground paving materials around the exhibition building, ensuring aesthetic appeal, functionality, and safety. | |
| E. Physical environment | e1. Indoor temperature conditions | Assesses the effectiveness of temperature control inside the exhibition building, ensuring a comfortable environment for participants. |
| e2. Indoor air quality | Assesses the cleanliness and overall air quality inside the exhibition building, ensuring a healthy indoor environment. | |
| e3. Sound system and acoustics | Evaluates the effectiveness of the sound system and acoustic conditions, enhancing sound quality and participant experience. | |
| e4. Lighting effects | Examines the lighting system and overall illumination, considering its impact on participant comfort and event effectiveness. | |
| F. Cultural value | f1. Advertising and promotional atmosphere | Analyzes the atmosphere and effectiveness of advertising and promotional designs during exhibition activities, reflecting the role of promotional facilities in enhancing participant engagement. |
| f2. Iconic representation | Assesses the landmark status and uniqueness of the exhibition building, highlighting its branding, cultural significance, and contribution to the city’s image. |
| Evaluation Object | Number of Questionnaires | Gender | Importance of Cronbach’s Alpha | Satisfaction Cronbach’s Alpha | |||
|---|---|---|---|---|---|---|---|
| Questionnaires Distributed | Questionnaires Collected | Valid Questionnaires | Male | Female | |||
| RZ | 44 | 43 | 43 | 20 | 23 | 0.727 | 0.788 |
| SG | 56 | 55 | 55 | 25 | 30 | 0.808 | 0.781 |
| ZMD | 48 | 46 | 46 | 18 | 28 | 0.726 | 0.860 |
| XY | 62 | 59 | 56 | 40 | 16 | 0.818 | 0.793 |
| JJ | 56 | 56 | 55 | 33 | 22 | 0.920 | 0.775 |
| YW | 56 | 56 | 54 | 30 | 24 | 0.911 | 0.797 |
| PT | 36 | 36 | 35 | 25 | 10 | 0.703 | 0.714 |
| SZ | 39 | 36 | 36 | 20 | 16 | 0.668 | 0.692 |
| DY | 35 | 33 | 33 | 18 | 15 | 0.788 | 0.740 |
| TZ | 28 | 27 | 26 | 14 | 12 | 0.802 | 0.736 |
| Total/Total Scale | 460 | 447 | 439 | 172 | 83 | 0.843 | 0.776 |
| Dimensions | Specific Indicators | Importance | Satisfaction | I-P Mean Difference | t | Sig. (2-Tailed) | ||||||
|---|---|---|---|---|---|---|---|---|---|---|---|---|
| Average | Variance | Rank | Average | Variance | Rank | |||||||
| A. Site construction status | a1. Surrounding urban construction status | 4.26 | 4.29 | 0.32 | 8 | 3.17 | 3.12 | 0.68 | 21 | 0.68 | 13.80 | 0.00 |
| a2. Surrounding commercial atmosphere | 4.37 | 0.27 | 3 | 3.23 | 0.93 | 17 | 0.93 | 18.14 | 0.00 | |||
| a3. Distance to transportation hubs (airport and high-speed rail station) | 4.30 | 0.27 | 7 | 3.32 | 0.53 | 14 | 0.55 | 12.23 | 0.00 | |||
| a4. Surrounding natural resources | 4.08 | 0.17 | 15 | 3.02 | 0.67 | 22 | 0.43 | 9.82 | 0.00 | |||
| B. Architectural space | b1. Sense of orientation and signage system | 4.05 | 4.00 | 0.21 | 19 | 3.41 | 3.67 | 0.71 | 6 | 0.15 | 3.27 | 0.00 |
| b2. Building volume and relationship with surrounding buildings | 3.99 | 0.23 | 21 | 3.23 | 0.39 | 18 | 0.40 | 10.19 | 0.00 | |||
| b3. Relationship between building and site topography | 3.82 | 0.16 | 24 | 3.3 | 0.47 | 15 | 0.20 | 5.41 | 0.00 | |||
| b4. Entrance and exit design | 4.38 | 0.29 | 2 | 3.62 | 0.92 | 9 | 0.70 | 12.84 | 0.00 | |||
| b5. Organization and connection of functional spaces | 4.08 | 0.11 | 16 | 3.23 | 1.06 | 19 | 0.87 | 16.78 | 0.00 | |||
| C. Transportation conditions | c1. Site accessibility | 4.21 | 4.52 | 0.25 | 1 | 3.55 | 3.83 | 0.76 | 5 | 1.18 | 24.08 | 0.00 |
| c2. Walking distance to entrance | 4.16 | 0.18 | 12 | 3.84 | 0.44 | 4 | 0.20 | 5.16 | 0.00 | |||
| c3. Road accessibility | 4.13 | 0.17 | 14 | 3.63 | 0.47 | 8 | 0.26 | 6.85 | 0.00 | |||
| c4. Drop-off space for exhibition activities | 4.02 | 0.14 | 17 | 3.27 | 0.26 | 16 | 0.20 | 7.03 | 0.00 | |||
| c5. Parking space availability | 4.23 | 0.25 | 9 | 3.18 | 0.51 | 20 | 0.80 | 18.40 | 0.00 | |||
| D. Landscape environment | d1. Scale of assembly plaza | 4.06 | 3.86 | 0.12 | 22 | 3.37 | 3.86 | 0.61 | 3 | −0.08 | −2.00 | 0.05 |
| d2. Outdoor greenery | 4.33 | 0.29 | 5 | 3.9 | 0.58 | 2 | 0.97 | 22.47 | 0.00 | |||
| d3. Landscape features and landmarks | 4.22 | 0.18 | 10 | 2.97 | 0.60 | 23 | 0.82 | 19.29 | 0.00 | |||
| d4. Ground material effects | 3.83 | 0.19 | 23 | 2.76 | 0.52 | 24 | 0.06 | 1.40 | 0.16 | |||
| E. Physical environment | e1. Indoor temperature conditions | 4.15 | 4.35 | 0.23 | 4 | 3.71 | 3.58 | 0.26 | 12 | 0.50 | 14.83 | 0.00 |
| e2. Indoor air quality | 4.22 | 0.17 | 11 | 3.61 | 0.52 | 11 | 0.51 | 12.69 | 0.00 | |||
| e3. Sound system and acoustics | 4.02 | 0.18 | 18 | 3.62 | 0.25 | 10 | 0.24 | 7.91 | 0.00 | |||
| e4. Lighting effects | 4.00 | 0.30 | 20 | 4.03 | 0.32 | 1 | 0.30 | 8.02 | 0.00 | |||
| F. Cultural value | f1. Advertising and promotional atmosphere | 4.23 | 4.31 | 0.28 | 6 | 3.52 | 3.38 | 0.38 | 13 | 0.40 | 10.93 | 0.00 |
| f2. Iconic representation | 4.14 | 0.43 | 13 | 3.65 | 0.55 | 7 | 0.39 | 8.05 | 0.00 | |||
| Evaluation Factors | Mean | One-Way ANOVA | ||||||
|---|---|---|---|---|---|---|---|---|
| RZ | ZMD | JJ | YW | TZ | Overall | F | Sig | |
| a1. Surrounding urban construction Status | 1.74 | 2.92 | 2.38 | 2 | 2.26 | 2.26 | 17.444 | 0.000 |
| a2. Surrounding commercial atmosphere | 2.14 | 3.02 | 2.48 | 1.94 | 2.2 | 2.356 | 20.353 | 0.000 |
| a3. Comprehensive distance to transportation hubs | 2.08 | 2.42 | 2.06 | 2.18 | 2.56 | 2.26 | 30.862 | 0.000 |
| b1. Site accessibility | 1.96 | 2.66 | 1.94 | 2.06 | 2.26 | 2.176 | 32.160 | 0.000 |
| b2. Road accessibility of the site | 2.02 | 2.42 | 2.04 | 2.02 | 2.14 | 2.128 | 24.928 | 0.000 |
| b3. Walking distance to the entrance | 2.16 | 2.56 | 1.96 | 2.26 | 2.32 | 2.252 | 33.237 | 0.000 |
| b4. Drop-off space for exhibition activities | 1.72 | 2.12 | 2.02 | 2.2 | 2.24 | 2.06 | 24.439 | 0.000 |
| b5. Parking space availability | 2.08 | 2.04 | 2.04 | 2.3 | 2.3 | 2.152 | 28.368 | 0.000 |
| c1. Atmosphere of public spaces | 1.94 | 2.46 | 2.02 | 2.24 | 2.26 | 2.184 | 36.932 | 0.000 |
| c2. Sense of orientation in site spaces | 2.04 | 2.38 | 1.98 | 2.34 | 2.3 | 2.208 | 25.449 | 0.000 |
| c3. Scale of assembly plaza | 1.94 | 2.32 | 2.08 | 2.26 | 2.16 | 2.152 | 32.561 | 0.000 |
| c4. Outdoor greenery | 1.74 | 2.56 | 2.04 | 2.32 | 2.26 | 2.184 | 26.333 | 0.000 |
| d1. Applicability of building layout | 2.26 | 2.02 | 1.9 | 2.02 | 2.34 | 2.108 | 30.857 | 0.000 |
| d2. Organization of functional spaces | 2.22 | 2.04 | 1.86 | 2.08 | 2.32 | 2.104 | 44.119 | 0.000 |
| d3. Natural ventilation effect of building layout | 1.98 | 2.14 | 1.94 | 2.3 | 2.18 | 2.108 | 31.145 | 0.000 |
| d4. Lighting effect of building layout | 1.98 | 2.1 | 1.86 | 2.16 | 2.22 | 2.064 | 22.218 | 0.000 |
| d5. Crowd evacuation effect of building layout | 1.92 | 1.96 | 1.86 | 2.02 | 2.12 | 1.976 | 22.765 | 0.000 |
| e1. Relationship between building volume and surrounding buildings | 1.74 | 2.54 | 2 | 2.22 | 2.26 | 2.152 | 22.089 | 0.000 |
| e2. Relationship between building and site topography | 1.76 | 2.48 | 2.08 | 2.36 | 2.24 | 2.184 | 38.621 | 0.000 |
| e3. Iconic nature of the building | 1.74 | 2.12 | 1.92 | 2.34 | 2.12 | 2.048 | 17.559 | 0.000 |
| e4. Cultural significance of the building | 1.88 | 2.56 | 2.14 | 2.5 | 2.26 | 2.268 | 15.874 | 0.000 |
| Common Factor Names | Variable | Common Factor | ||||||
|---|---|---|---|---|---|---|---|---|
| 1 | 2 | 3 | 4 | 5 | 6 | |||
| 1 | A. Place visual environment factor | e4. Cultural significance of the architecture | 0.797 | 0.134 | 0.314 | 0.228 | 0.176 | 0.108 |
| e3. Iconic nature of the architecture | 0.770 | 0.308 | 0.229 | 0.252 | 0.165 | 0.088 | ||
| e2. Relationship between the architecture and the site’s topography and landforms | 0.691 | 0.372 | 0.259 | 0.143 | 0.266 | 0.251 | ||
| e1. Relationship between the building’s volume and the surrounding buildings | 0.680 | 0.389 | 0.359 | 0.076 | 0.187 | 0.223 | ||
| c2. Spatial orientation within the site | 0.610 | 0.334 | 0.211 | 0.266 | 0.038 | 0.430 | ||
| c4. Outdoor green landscaping | 0.603 | 0.279 | 0.340 | 0.131 | 0.311 | 0.403 | ||
| 2 | B. Place physical environment factor | d4. Daylighting efficiency of the building’s floor plan | 0.309 | 0.763 | 0.175 | 0.215 | 0.246 | 0.217 |
| d5. Evacuation efficiency of the building’s floor plan | 0.380 | 0.732 | 0.218 | 0.263 | 0.274 | 0.089 | ||
| d3. Natural ventilation efficiency of the building’s floor plan | 0.394 | 0.683 | 0.134 | 0.337 | 0.159 | 0.213 | ||
| b2. On-site road accessibility | 0.117 | 0.611 | 0.554 | 0.213 | 0.247 | 0.147 | ||
| 3 | C. Place location environment factor | a2. Surrounding commercial atmosphere | 0.371 | 0.052 | 0.817 | 0.225 | 0.024 | 0.050 |
| a1. Surrounding urban development conditions | 0.390 | 0.185 | 0.800 | 0.056 | 0.164 | 0.134 | ||
| b1. Site accessibility | 0.151 | 0.461 | 0.635 | 0.238 | 0.147 | 0.401 | ||
| a3. Overall distance to transportation hubs (airport and high-speed rail station) | 0.112 | 0.244 | 0.643 | 0.443 | 0.233 | 0.228 | ||
| 4 | D. Place layout environment factor | d1. Suitability of the building’s floor plan | 0.287 | 0.489 | 0.116 | 0.673 | 0.159 | 0.174 |
| d2. Organizational relationship between functional spaces | 0.397 | 0.512 | 0.108 | 0.578 | 0.184 | 0.164 | ||
| b3. Walking distance to the entrance | 0.451 | 0.207 | 0.403 | 0.503 | 0.280 | 0.136 | ||
| 5 | E. Place organizational environment factor | b5. Adequacy of parking spaces | 0.218 | 0.369 | 0.077 | 0.181 | 0.735 | 0.345 |
| b4. Drop-off space for exhibition events | 0.397 | 0.283 | 0.302 | 0.324 | 0.678 | 0.009 | ||
| 6 | F. Place atmosphere environment factor | c3. Size of the gathering plaza | 0.417 | 0.262 | 0.185 | 0.282 | 0.313 | 0.627 |
| c1. Atmosphere of the public space | 0.491 | 0.272 | 0.378 | 0.283 | 0.188 | 0.524 | ||
| Eigenvalue Percentage of variance explained Cumulative percentage of variance explained | 4.699 | 3.762 | 3.278 | 2.365 | 1.859 | 1.696 | ||
| 22.377 | 17.915 | 15.608 | 11.260 | 8.851 | 8.076 | |||
| 22.377 | 40.292 | 55.900 | 67.160 | 76.011 | 84.087 | |||
| Identity | Analysis | Importance–Performance Analysis (IPA) Model |
|---|---|---|
| Architect | When assessing the environmental quality of exhibition building sites in small- and medium-sized cities, architects place particular emphasis on improving surrounding urban development conditions (a1) and the atmosphere of public spaces (c1). They believe that the quality of urban development directly influences the overall image and environmental perception of the building, while a well-designed public space atmosphere is crucial for creating a comfortable and inviting environment. Additionally, architects focus on factors such as the surrounding commercial atmosphere (a2), distance to transportation hubs (a3), walking distance to the entrance (b3), sense of spatial orientation (c2), green landscaping (c4), and the cultural significance of the architecture (e4). These elements collectively impact the building’s functionality, aesthetic appeal, and cultural depth. | 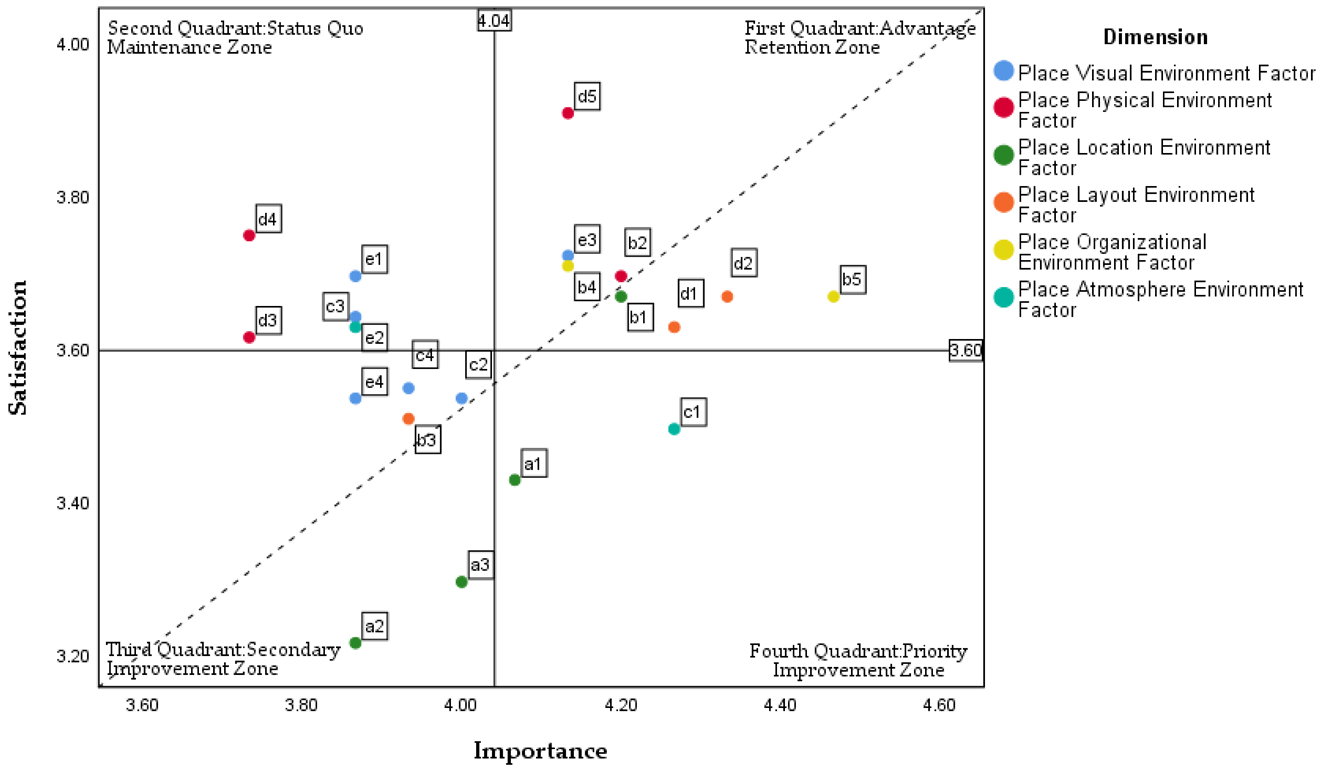 |
| Government official | Government officials prioritize factors such as distance to transportation hubs (a3), site accessibility (b1), road accessibility (b2), adequacy of parking spaces (b5), and the cultural significance of the architecture (e4). They view efficient transportation and accessibility as essential for the functionality and appeal of conference and exhibition buildings. Additionally, they emphasize the importance of sufficient parking (b5) and architectural cultural significance (e4) in enhancing user experience and the building’s overall image. Other key considerations for government officials include surrounding urban development conditions (a1), commercial atmosphere (a2), sense of spatial orientation (c2), and the relationship between the building’s volume and its surrounding structures (e1). | 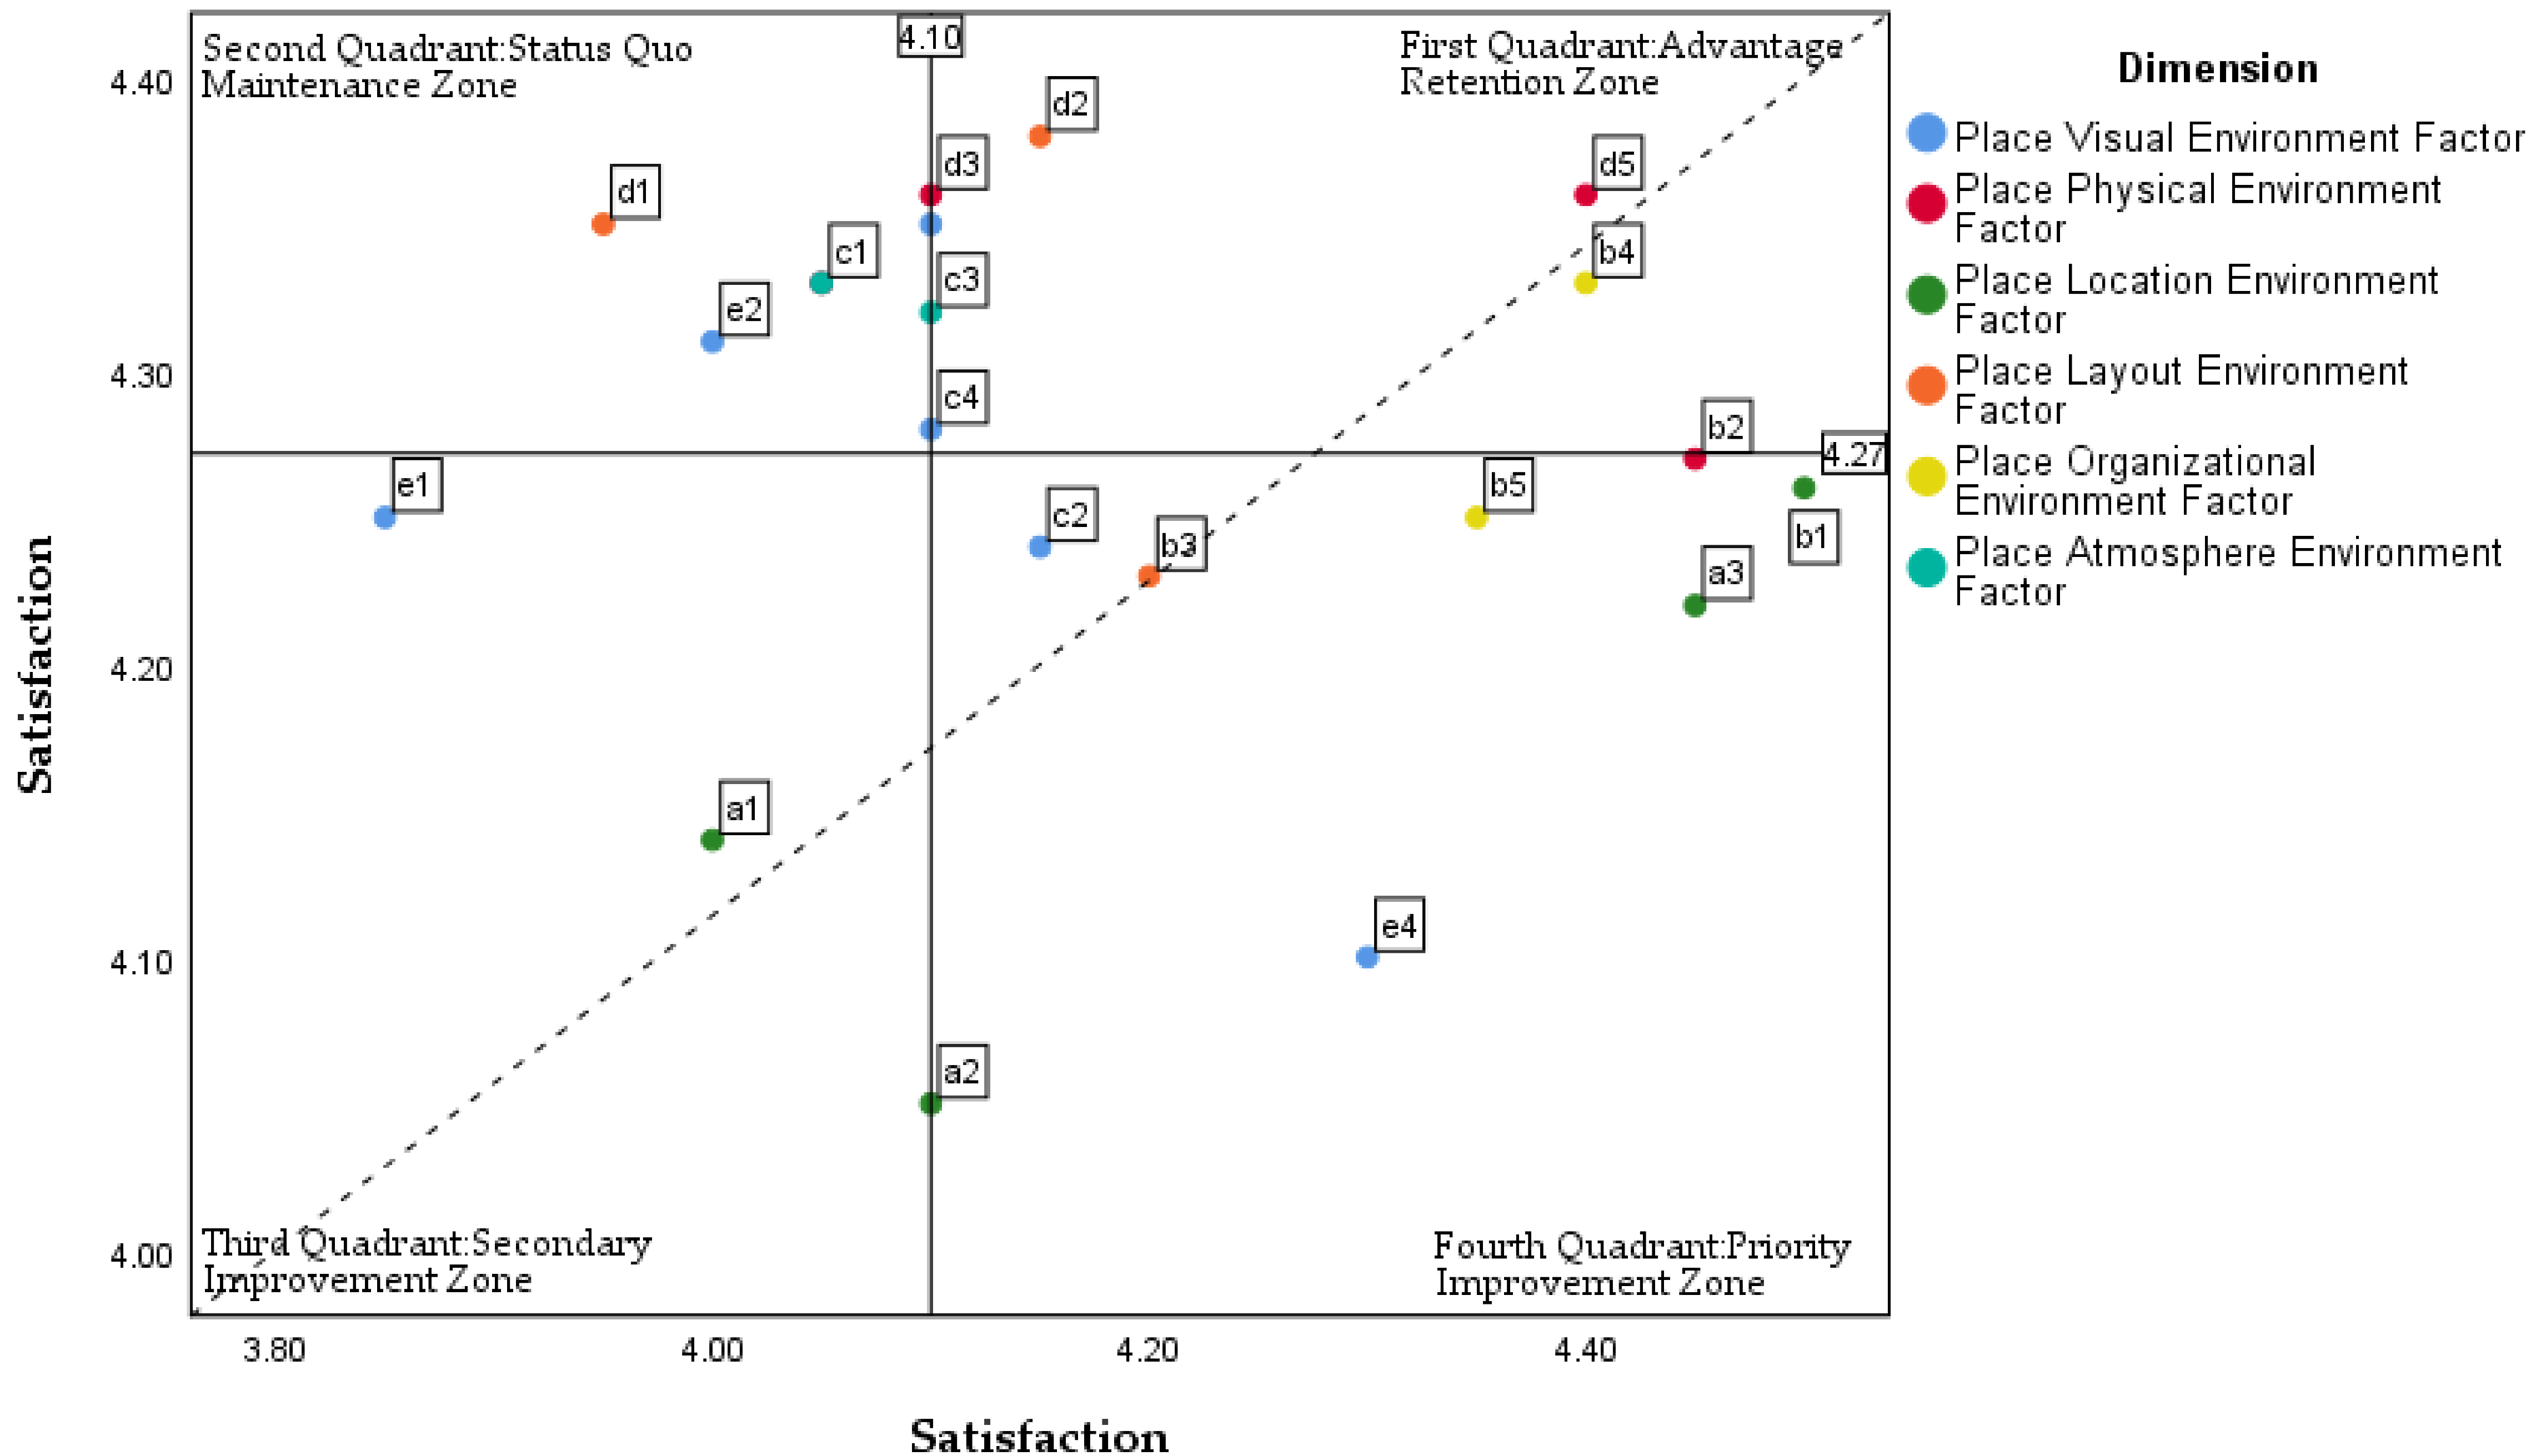 |
| Exhibition operations manager | Exhibition operations managers prioritize site accessibility (b1), walking distance to the entrance (b3), adequacy of parking spaces (b5), an atmosphere of public spaces (c1), and the cultural significance of the architecture (e4). They consider accessibility and parking convenience essential for enhancing the appeal and operational efficiency of conference and exhibition buildings. Additionally, they highlight the role of public space ambiance and architectural cultural significance in improving user experience and strengthening the building’s image. Other key factors they consider include a sense of spatial orientation (c2), the scale of the gathering plaza (c3), green landscaping (c4), the organizational relationship between functional spaces (d2), the relationship between the building’s volume and surrounding structures (e1), and the relationship between the architecture and the site’s topography and landforms (e2). These elements contribute to the functionality, comfort, and overall operational effectiveness of the exhibition place. |  |
Disclaimer/Publisher’s Note: The statements, opinions and data contained in all publications are solely those of the individual author(s) and contributor(s) and not of MDPI and/or the editor(s). MDPI and/or the editor(s) disclaim responsibility for any injury to people or property resulting from any ideas, methods, instructions or products referred to in the content. |
© 2025 by the authors. Licensee MDPI, Basel, Switzerland. This article is an open access article distributed under the terms and conditions of the Creative Commons Attribution (CC BY) license (https://creativecommons.org/licenses/by/4.0/).
Share and Cite
Xie, Y.; Luo, J.; Du, P. Subjective Evaluation of Place Environmental Quality in Conference and Exhibition Buildings in Small- and Medium-Sized Cities: An Empirical Case Study. Buildings 2025, 15, 1553. https://doi.org/10.3390/buildings15091553
Xie Y, Luo J, Du P. Subjective Evaluation of Place Environmental Quality in Conference and Exhibition Buildings in Small- and Medium-Sized Cities: An Empirical Case Study. Buildings. 2025; 15(9):1553. https://doi.org/10.3390/buildings15091553
Chicago/Turabian StyleXie, Yuchen, Jianhe Luo, and Peng Du. 2025. "Subjective Evaluation of Place Environmental Quality in Conference and Exhibition Buildings in Small- and Medium-Sized Cities: An Empirical Case Study" Buildings 15, no. 9: 1553. https://doi.org/10.3390/buildings15091553
APA StyleXie, Y., Luo, J., & Du, P. (2025). Subjective Evaluation of Place Environmental Quality in Conference and Exhibition Buildings in Small- and Medium-Sized Cities: An Empirical Case Study. Buildings, 15(9), 1553. https://doi.org/10.3390/buildings15091553