
Identification and Diagnosis of Wind Health-Vulnerable Spaces in High-Rise Residential Areas of Xi’an


Abstract
1. Introduction
1.1. Background and Literature Review
1.2. Research Gap and Significance
- Methodological limitations: Studies typically rely on either computational models or field measurements in isolation, rather than validating simulations with empirical data [27].
1.3. Theoretical Framework
- Wind environment dynamics (low wind speed, turbulence, abnormal pressure).
- Pollutant dispersion (localized pollution due to poor airflow).
- Human activity exposure (spatial coincidence of dense activity with pollutant-prone zones).

- 1.
- Spatial Vulnerability Theory
- 2.
- Building Environmental Dynamics
- 3.
- Environmental Health Exposure Theory

| Theoretical Framework | Core Focus | Role in WHVS | Logical Relationship with Other Theories |
|---|---|---|---|
| Spatial Vulnerability Theory | Susceptibility of spatial units to risks based on population, environment, and structure | Basis for identifying vulnerable spaces via exposure, sensitivity, and adaptability | Provides socio-spatial context for exposure; combines with dynamics to locate environmental risk zones |
| Built Environment Dynamics Theory | Impact of urban form on airflow, heat, and pollutant dispersion | Explains spatial mechanisms of WHVS through CFD simulation | Defines physical exposure patterns; complements vulnerability theory to locate risk-prone areas |
| Environmental Health Exposure Theory | Exposure level and duration in space and time | Links wind and pollution exposure to potential health effects | Adds health risk dimension by overlaying exposure onto socially and physically vulnerable spaces |
1.4. Research Objectives
- Develop and validate a multidimensional framework for identifying WHVSs in high-rise residential areas.
- Analyze the formation mechanisms of Wind Health-Vulnerable Spaces in two contrasting urban layouts.
- Establish evidence-based recommendations for health-oriented urban planning and building layout optimization.
2. Materials and Methods
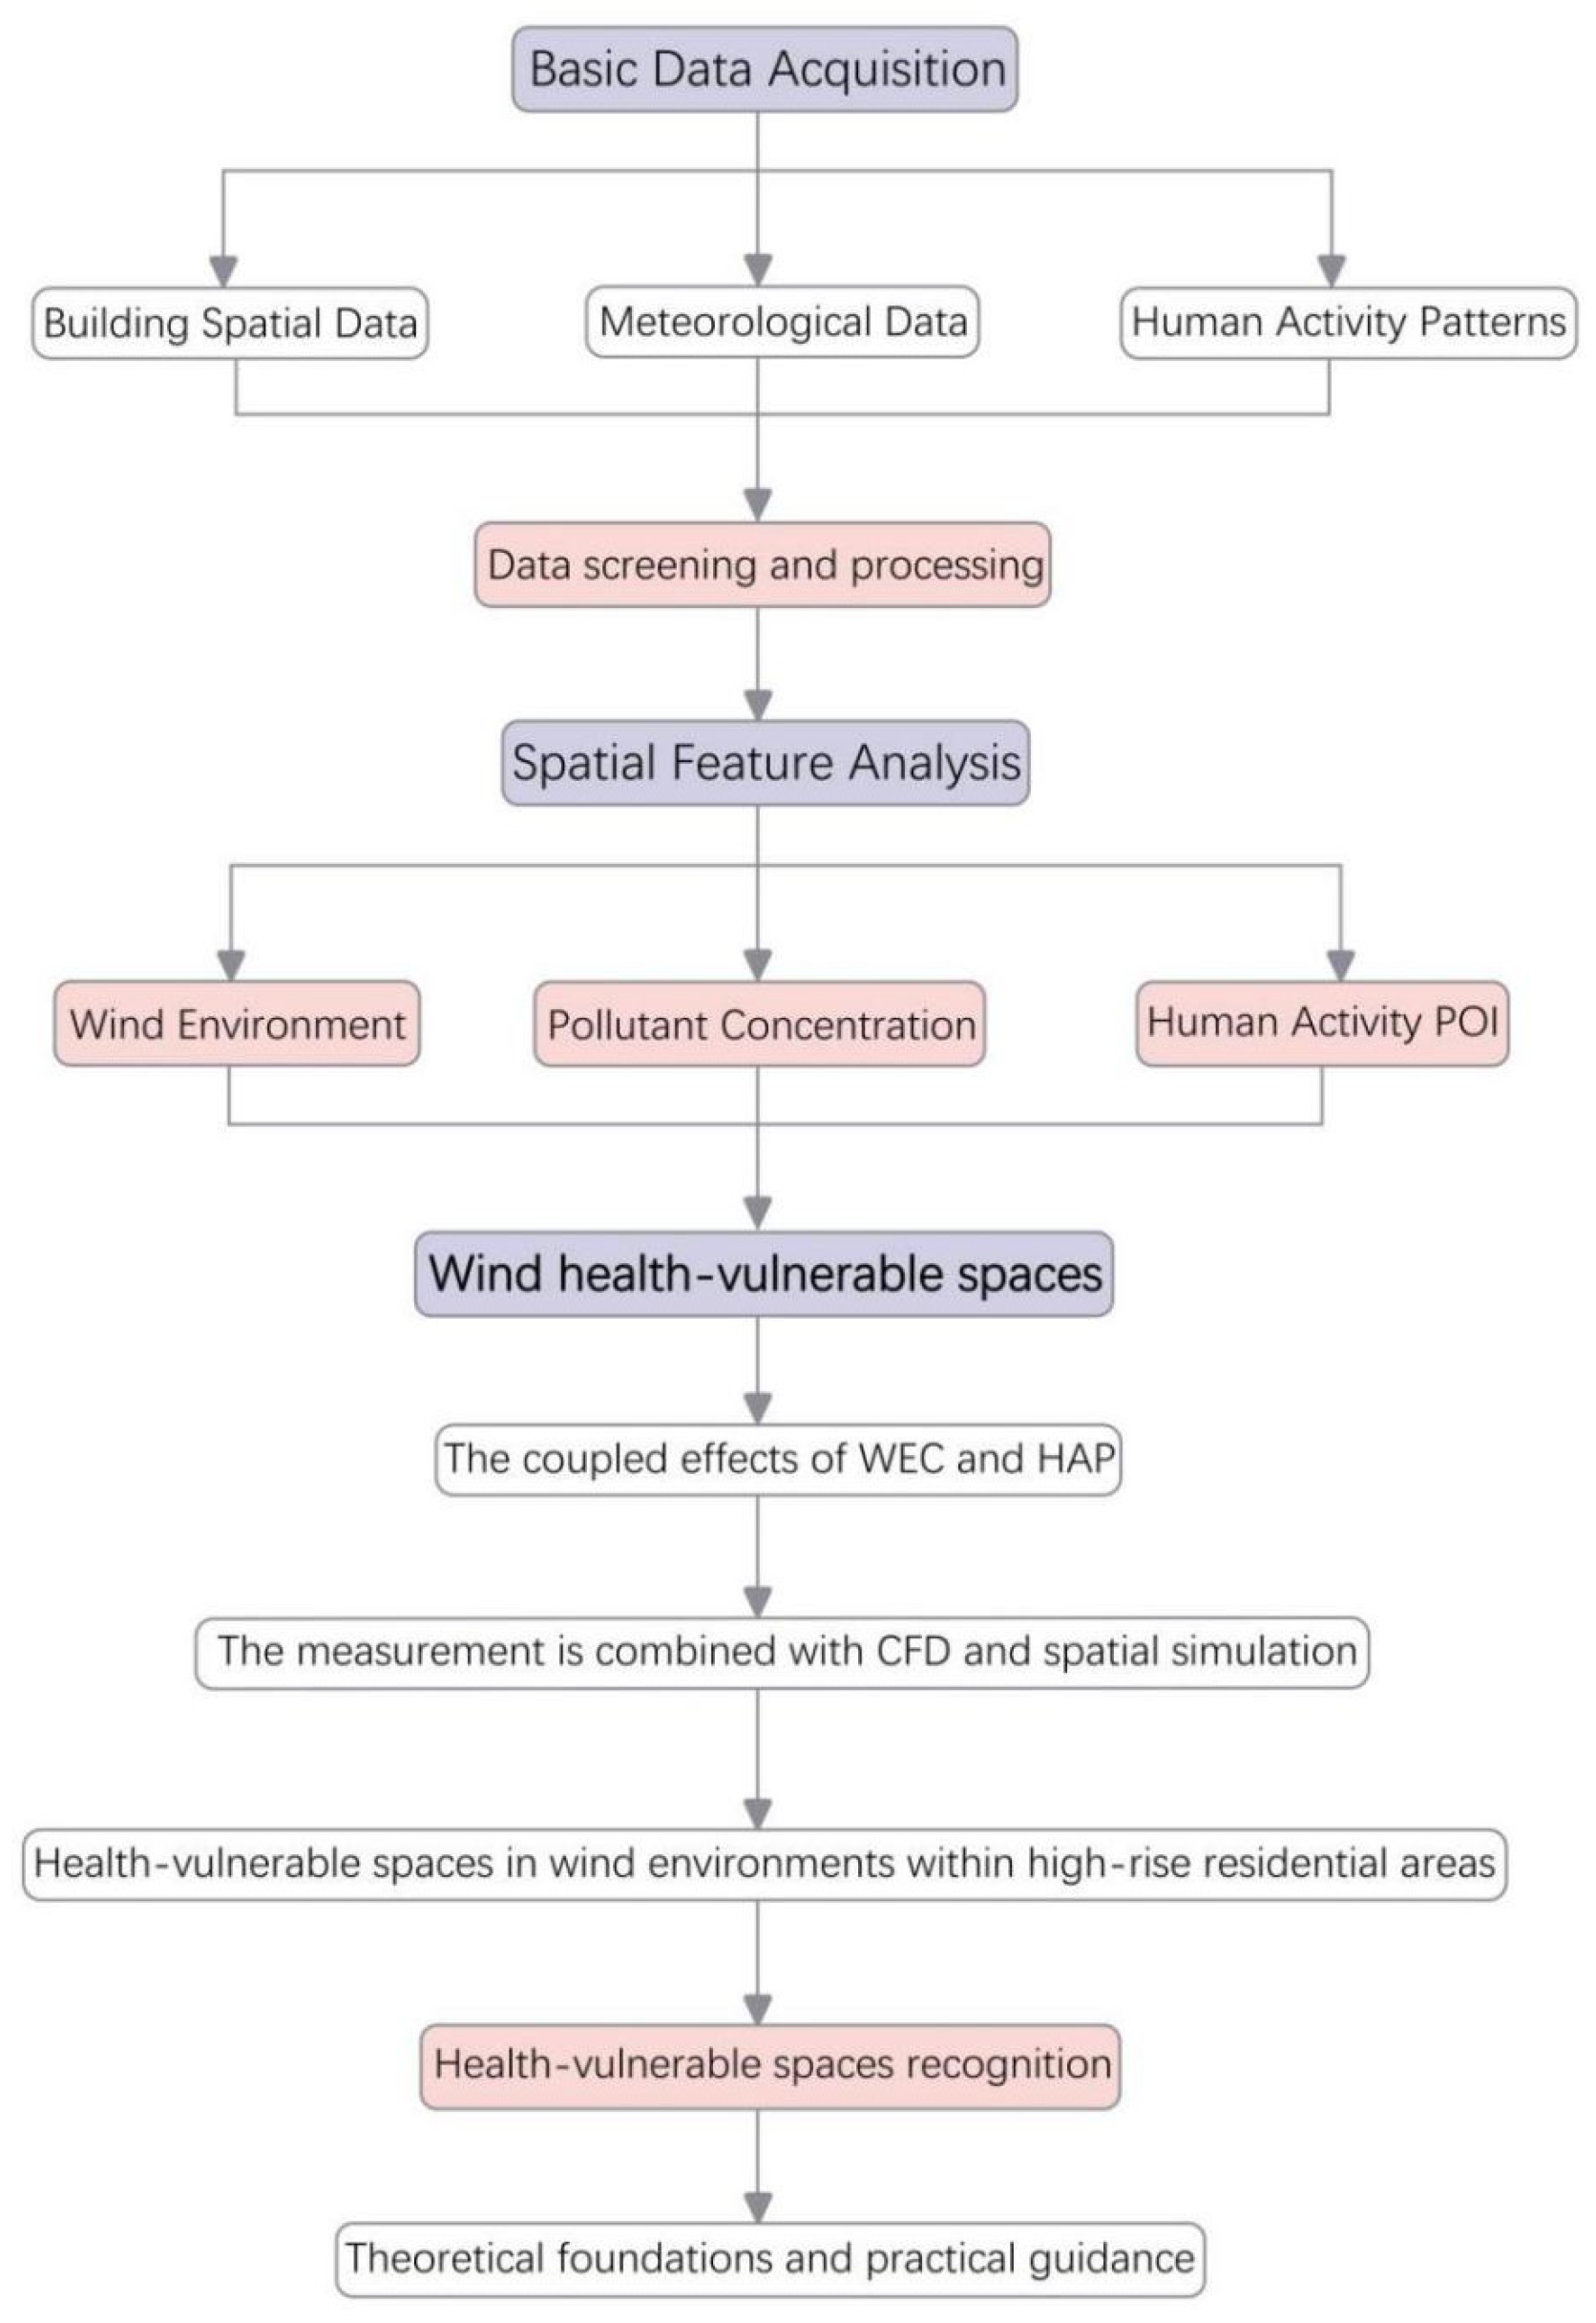
2.1. Research Framework
- (1)
- Geometric Modeling: Constructing 3D building models of the study areas using ArcGIS 10.8 software to prepare for wind environment simulation and spatial analysis.
- (2)
- Wind Environment Simulation: Conducting computational fluid dynamics (CFD) simulations to analyze wind speed, wind pressure, and pollutant dispersion characteristics.
- (3)
- Spatial Analysis: Using POI data to identify human activity hotspots and assess their spatial overlap with adverse wind environments.
- (4)
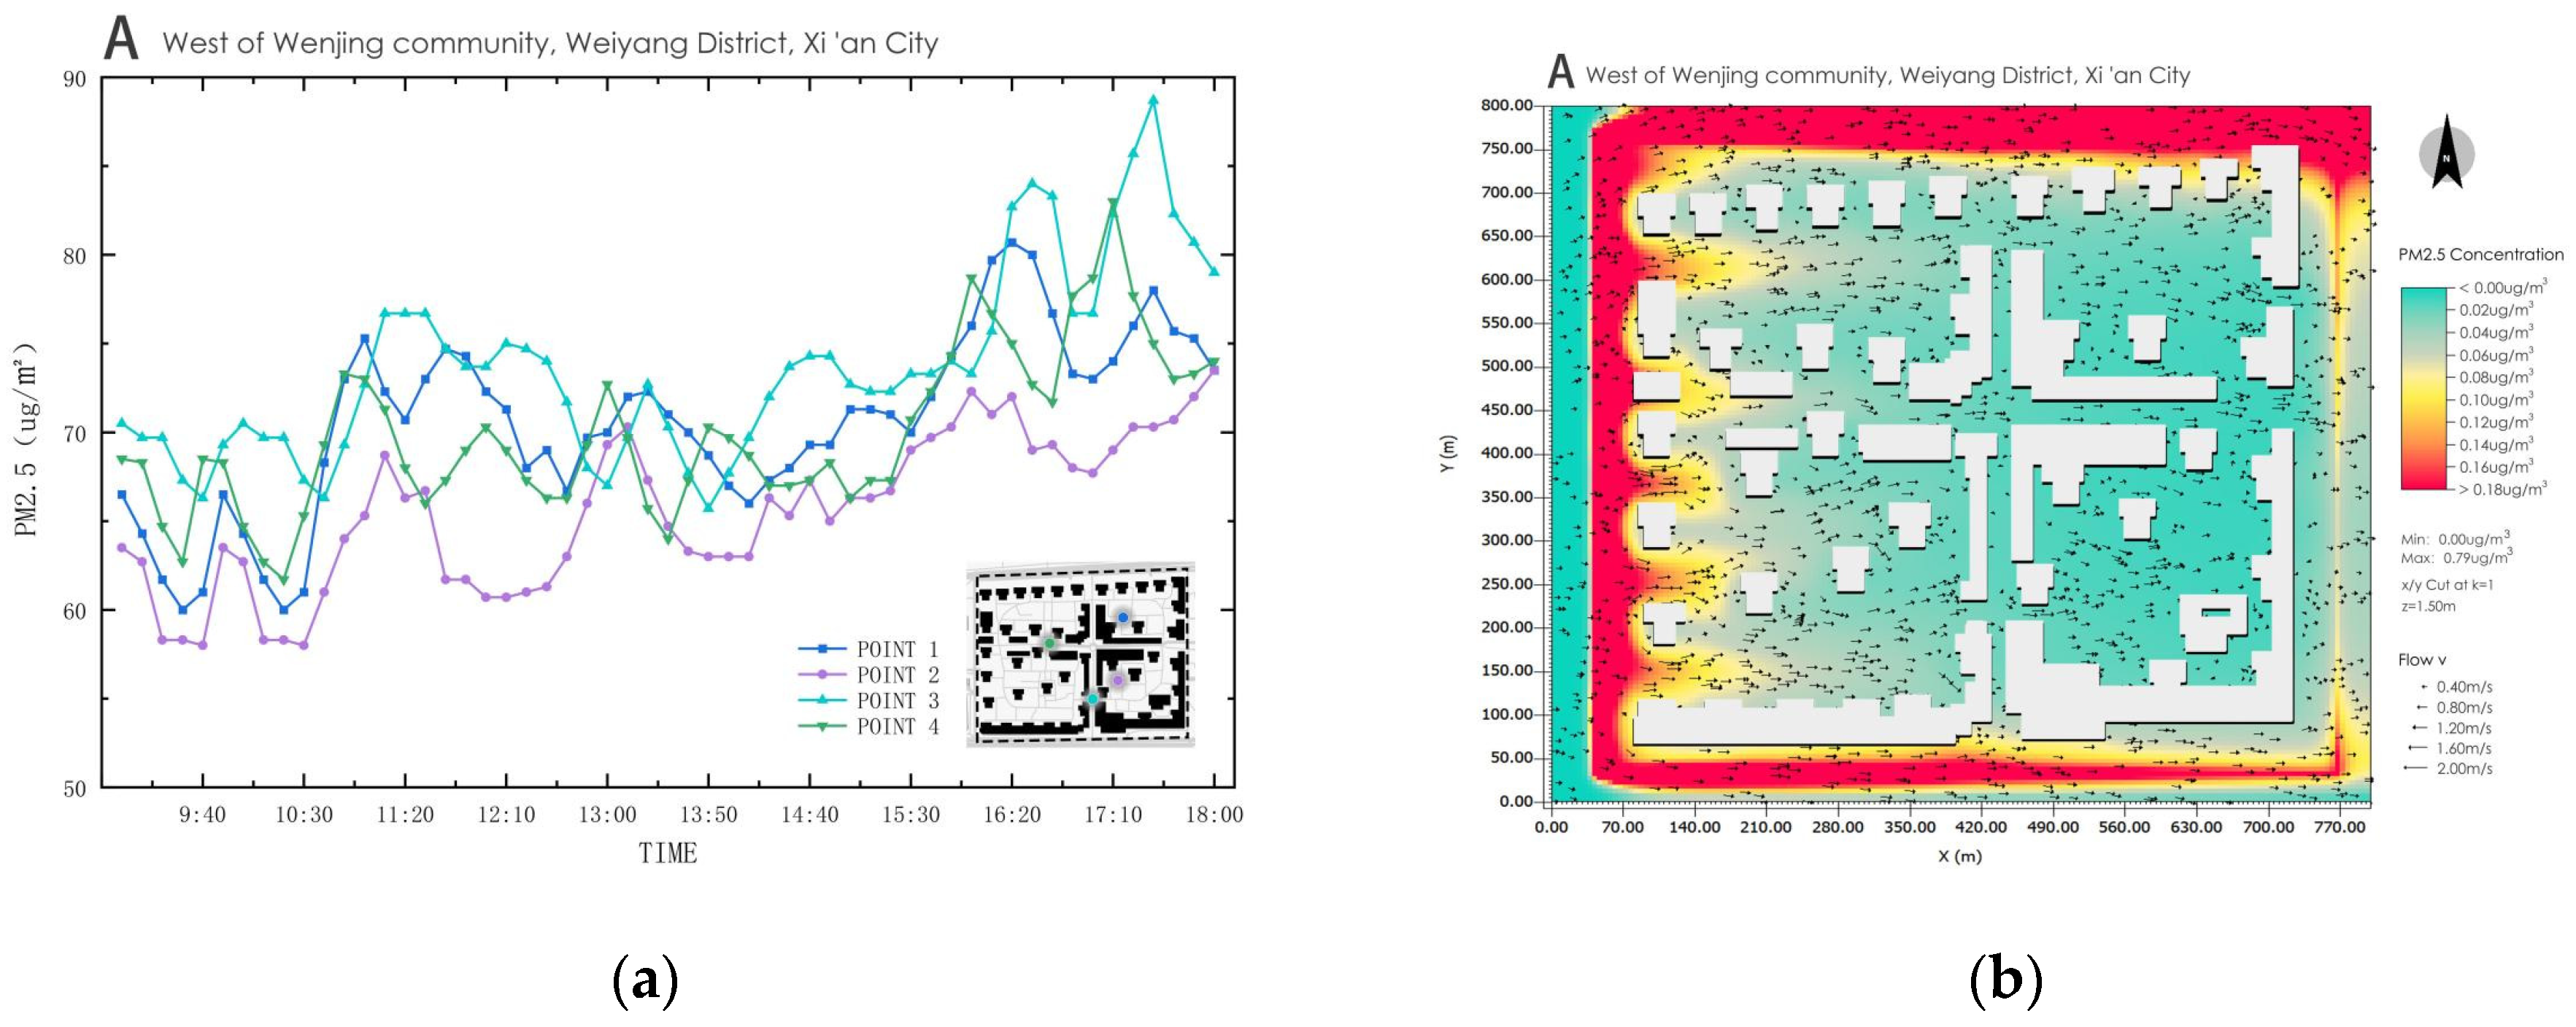
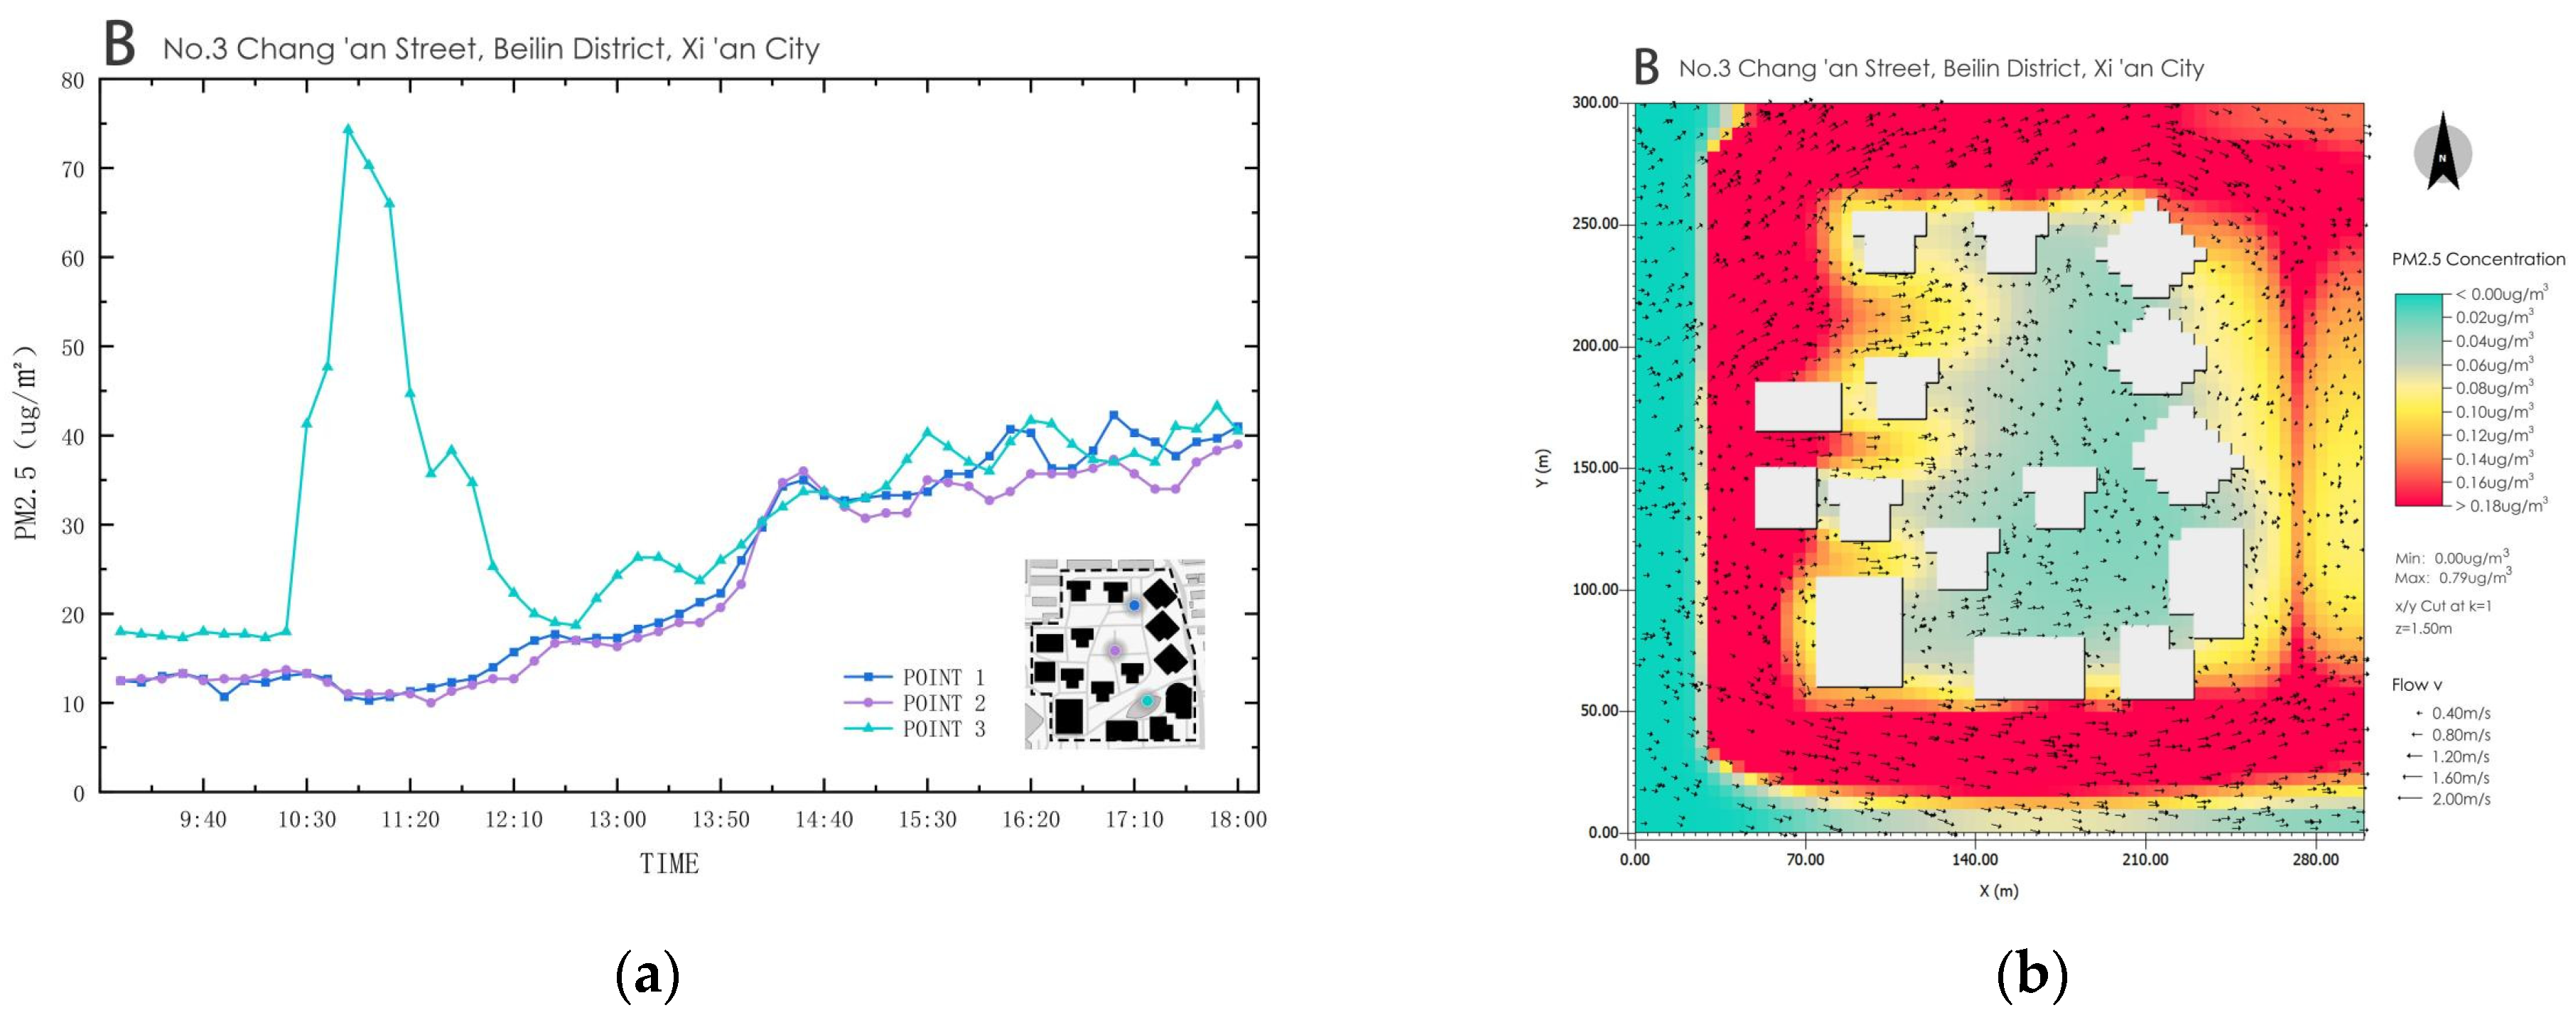
- Field Monitoring: Measuring PM2.5 concentrations at multiple monitoring points to validate the simulation results and assess air quality conditions.
- (5)
- Integrated Assessment: Combining wind environment characteristics, pollutant dispersion patterns, and human activity data to identify and diagnose WHVSs.
2.2. Data Collection and Processing
2.3. Numerical Simulation of Wind Environment
2.3.1. CFD Parameter Settings and Boundary Conditions
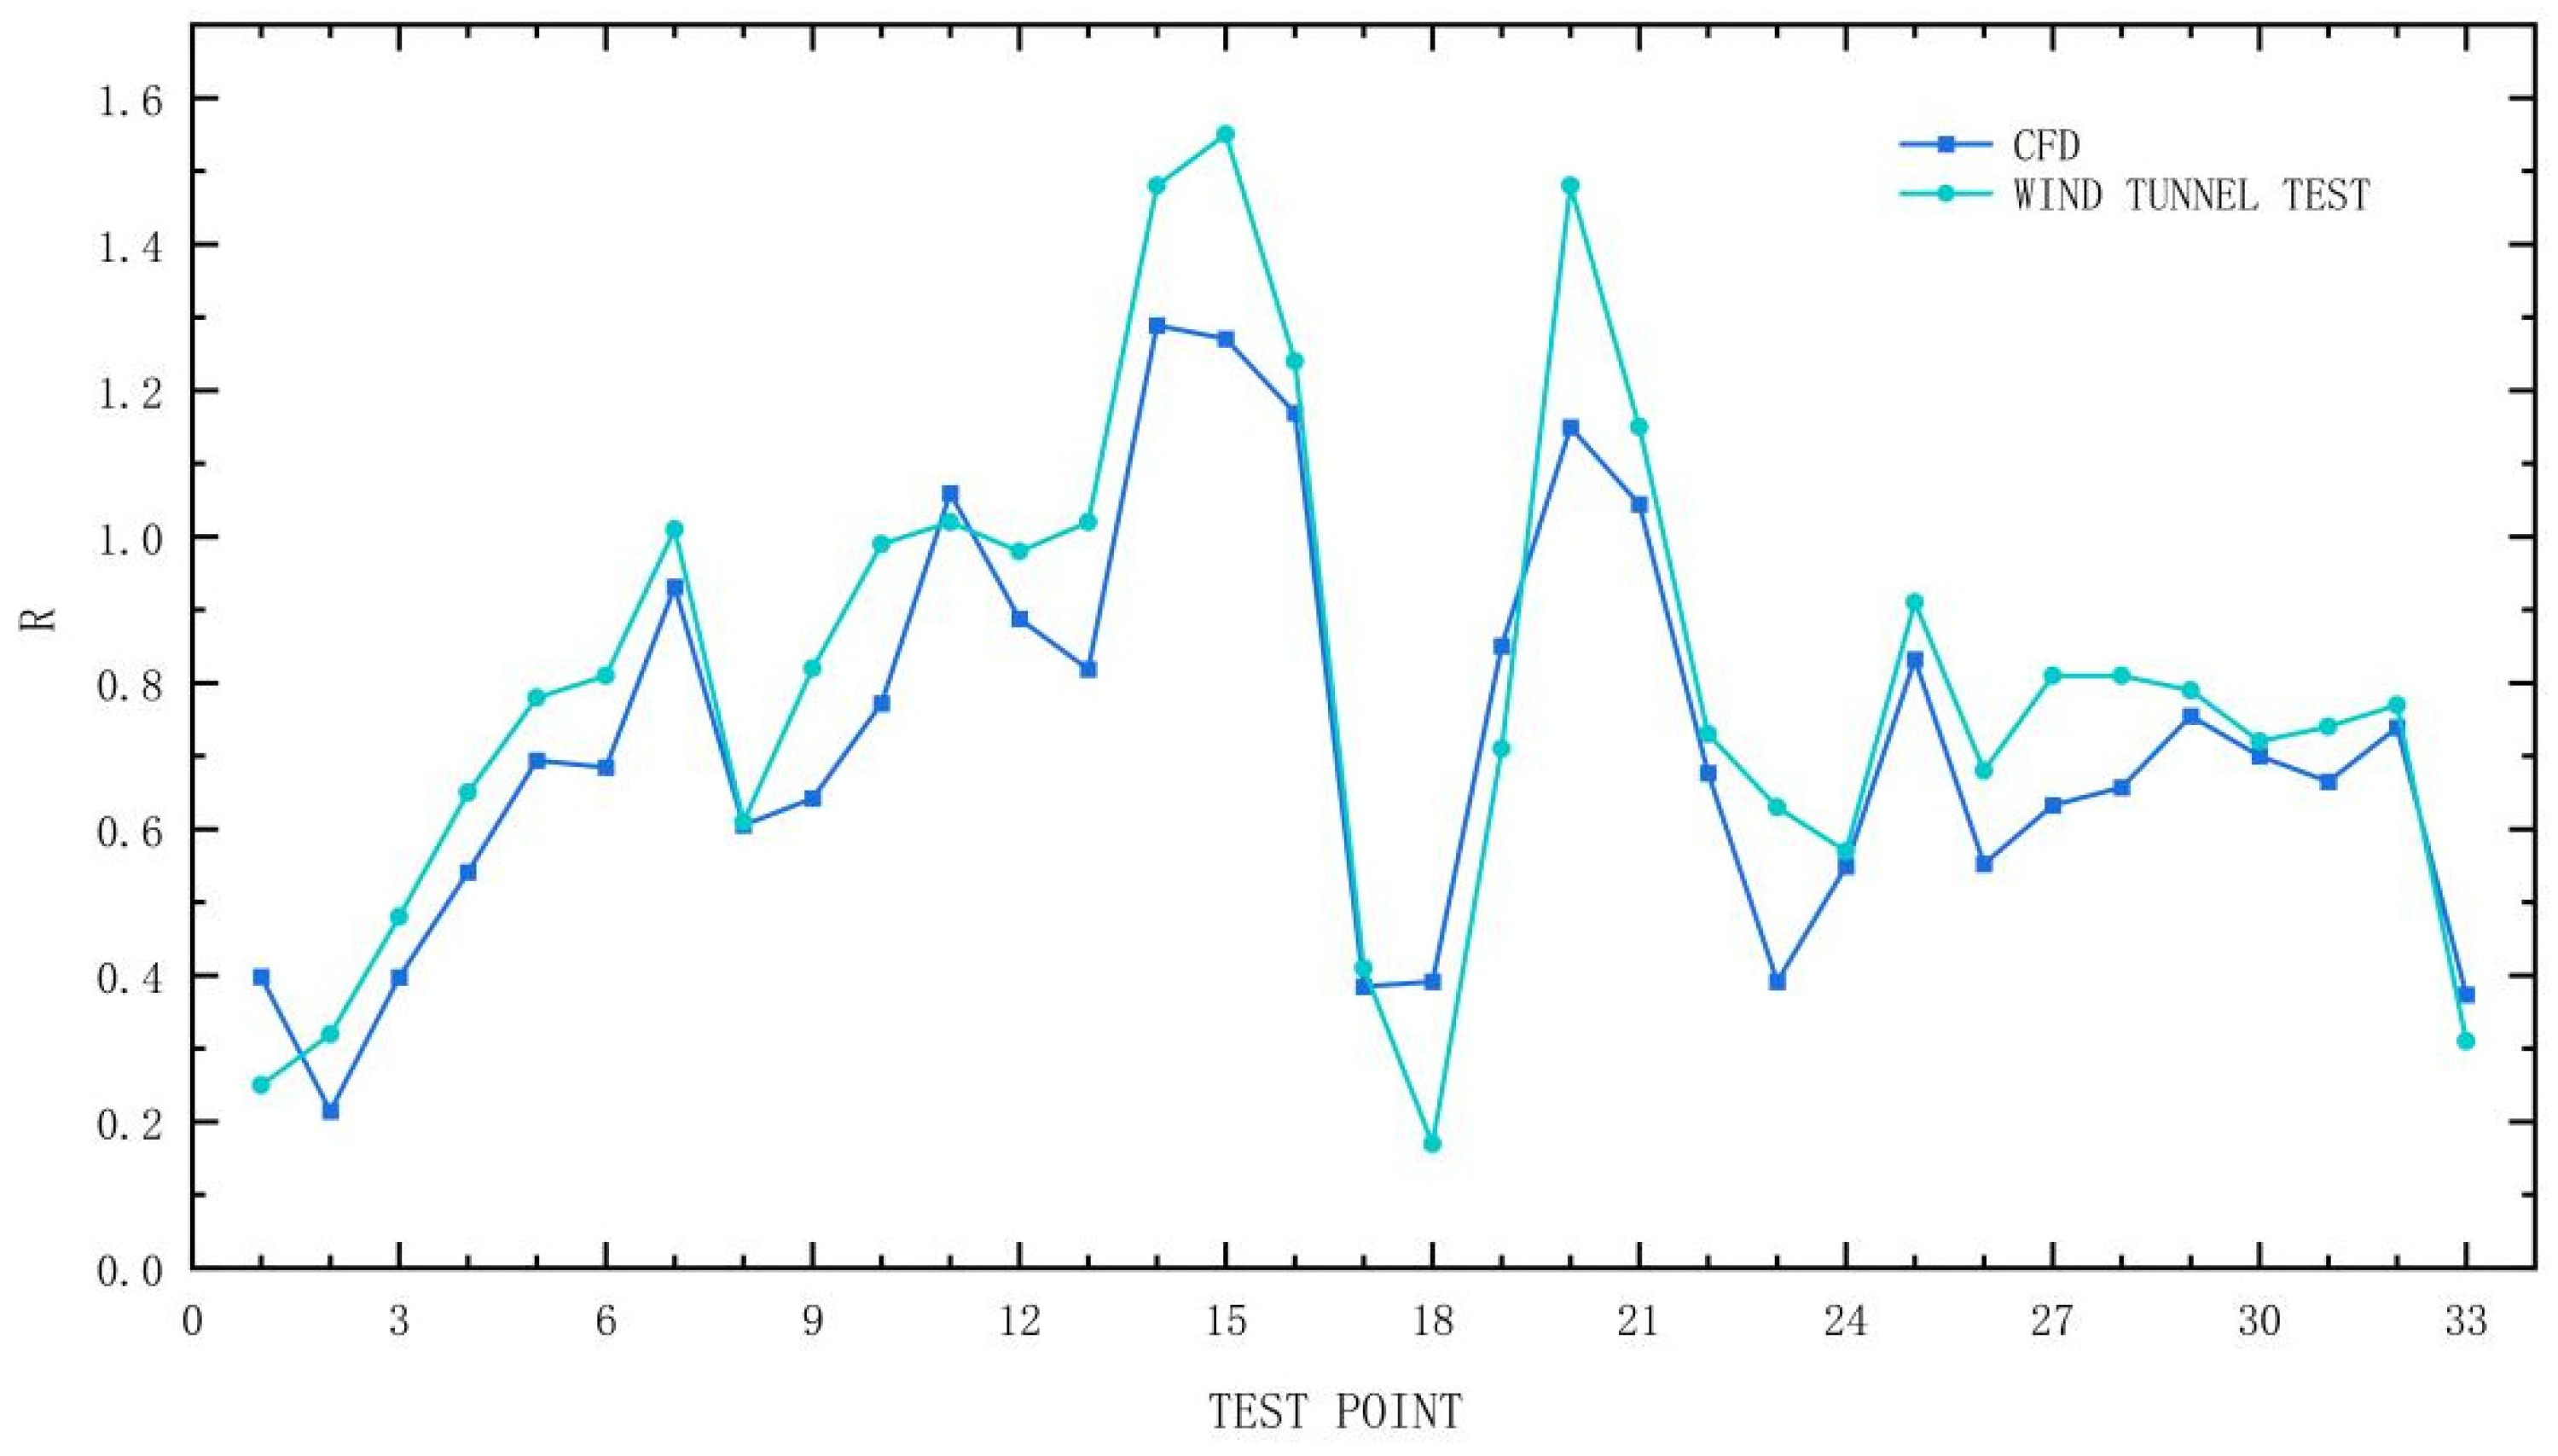
- Spatial resolution: Unlike wind tunnel tests, CFD provides comprehensive data for every point in the computational domain, allowing for detailed analysis of complex flow patterns between buildings [5].
- Cost efficiency: CFD simulations are more economical for parametric studies comparing multiple urban configurations.
- Visualization capabilities: Advanced 3D visualization of flow fields enables better identification of problematic areas.
- Integration potential: CFD results can be directly coupled with pollutant dispersion models and spatial analysis tools.
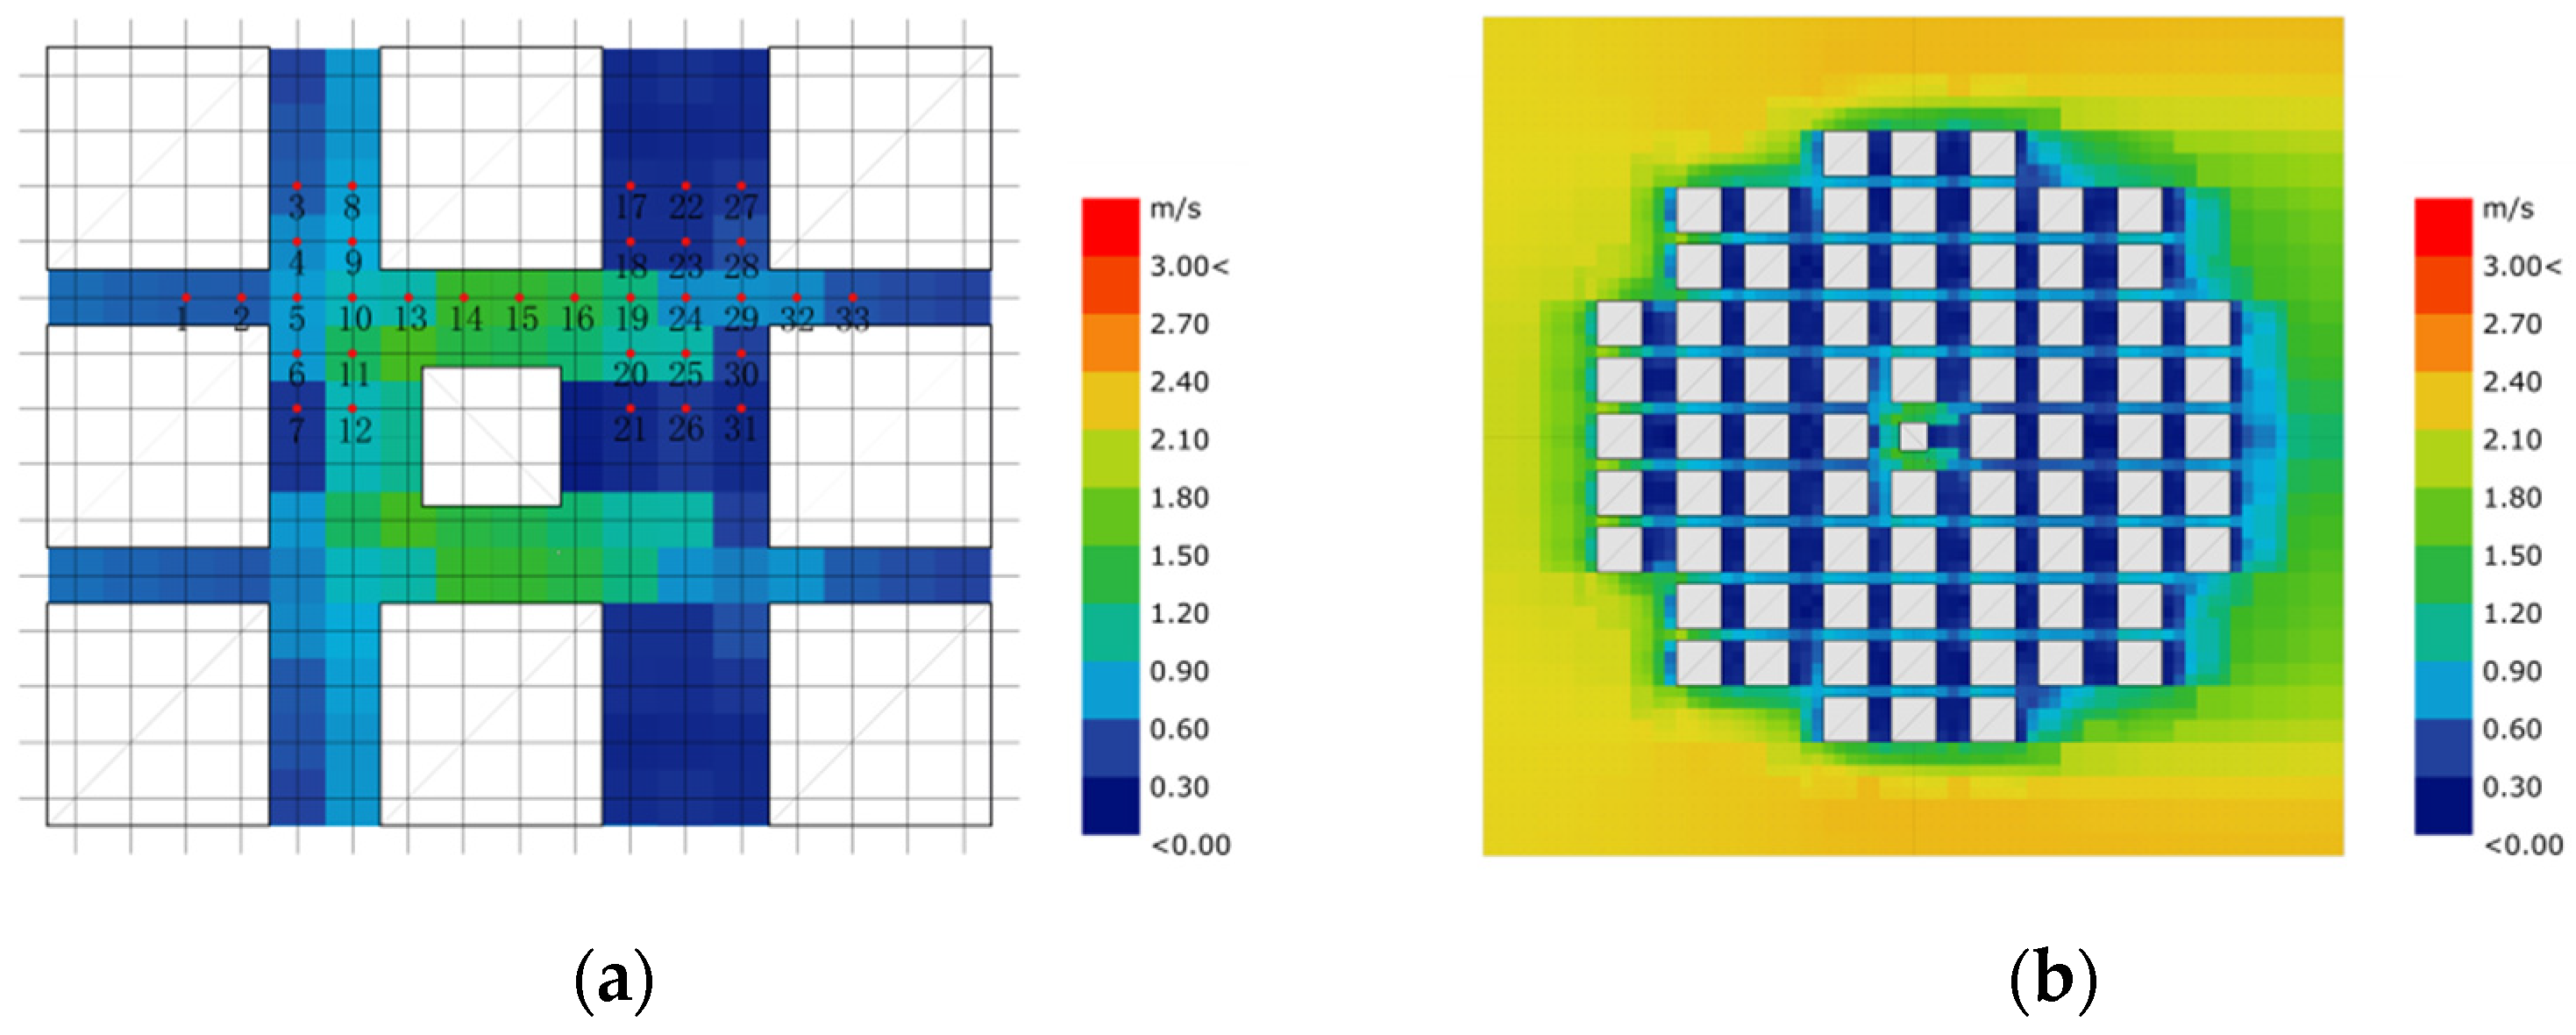
2.3.2. Verification
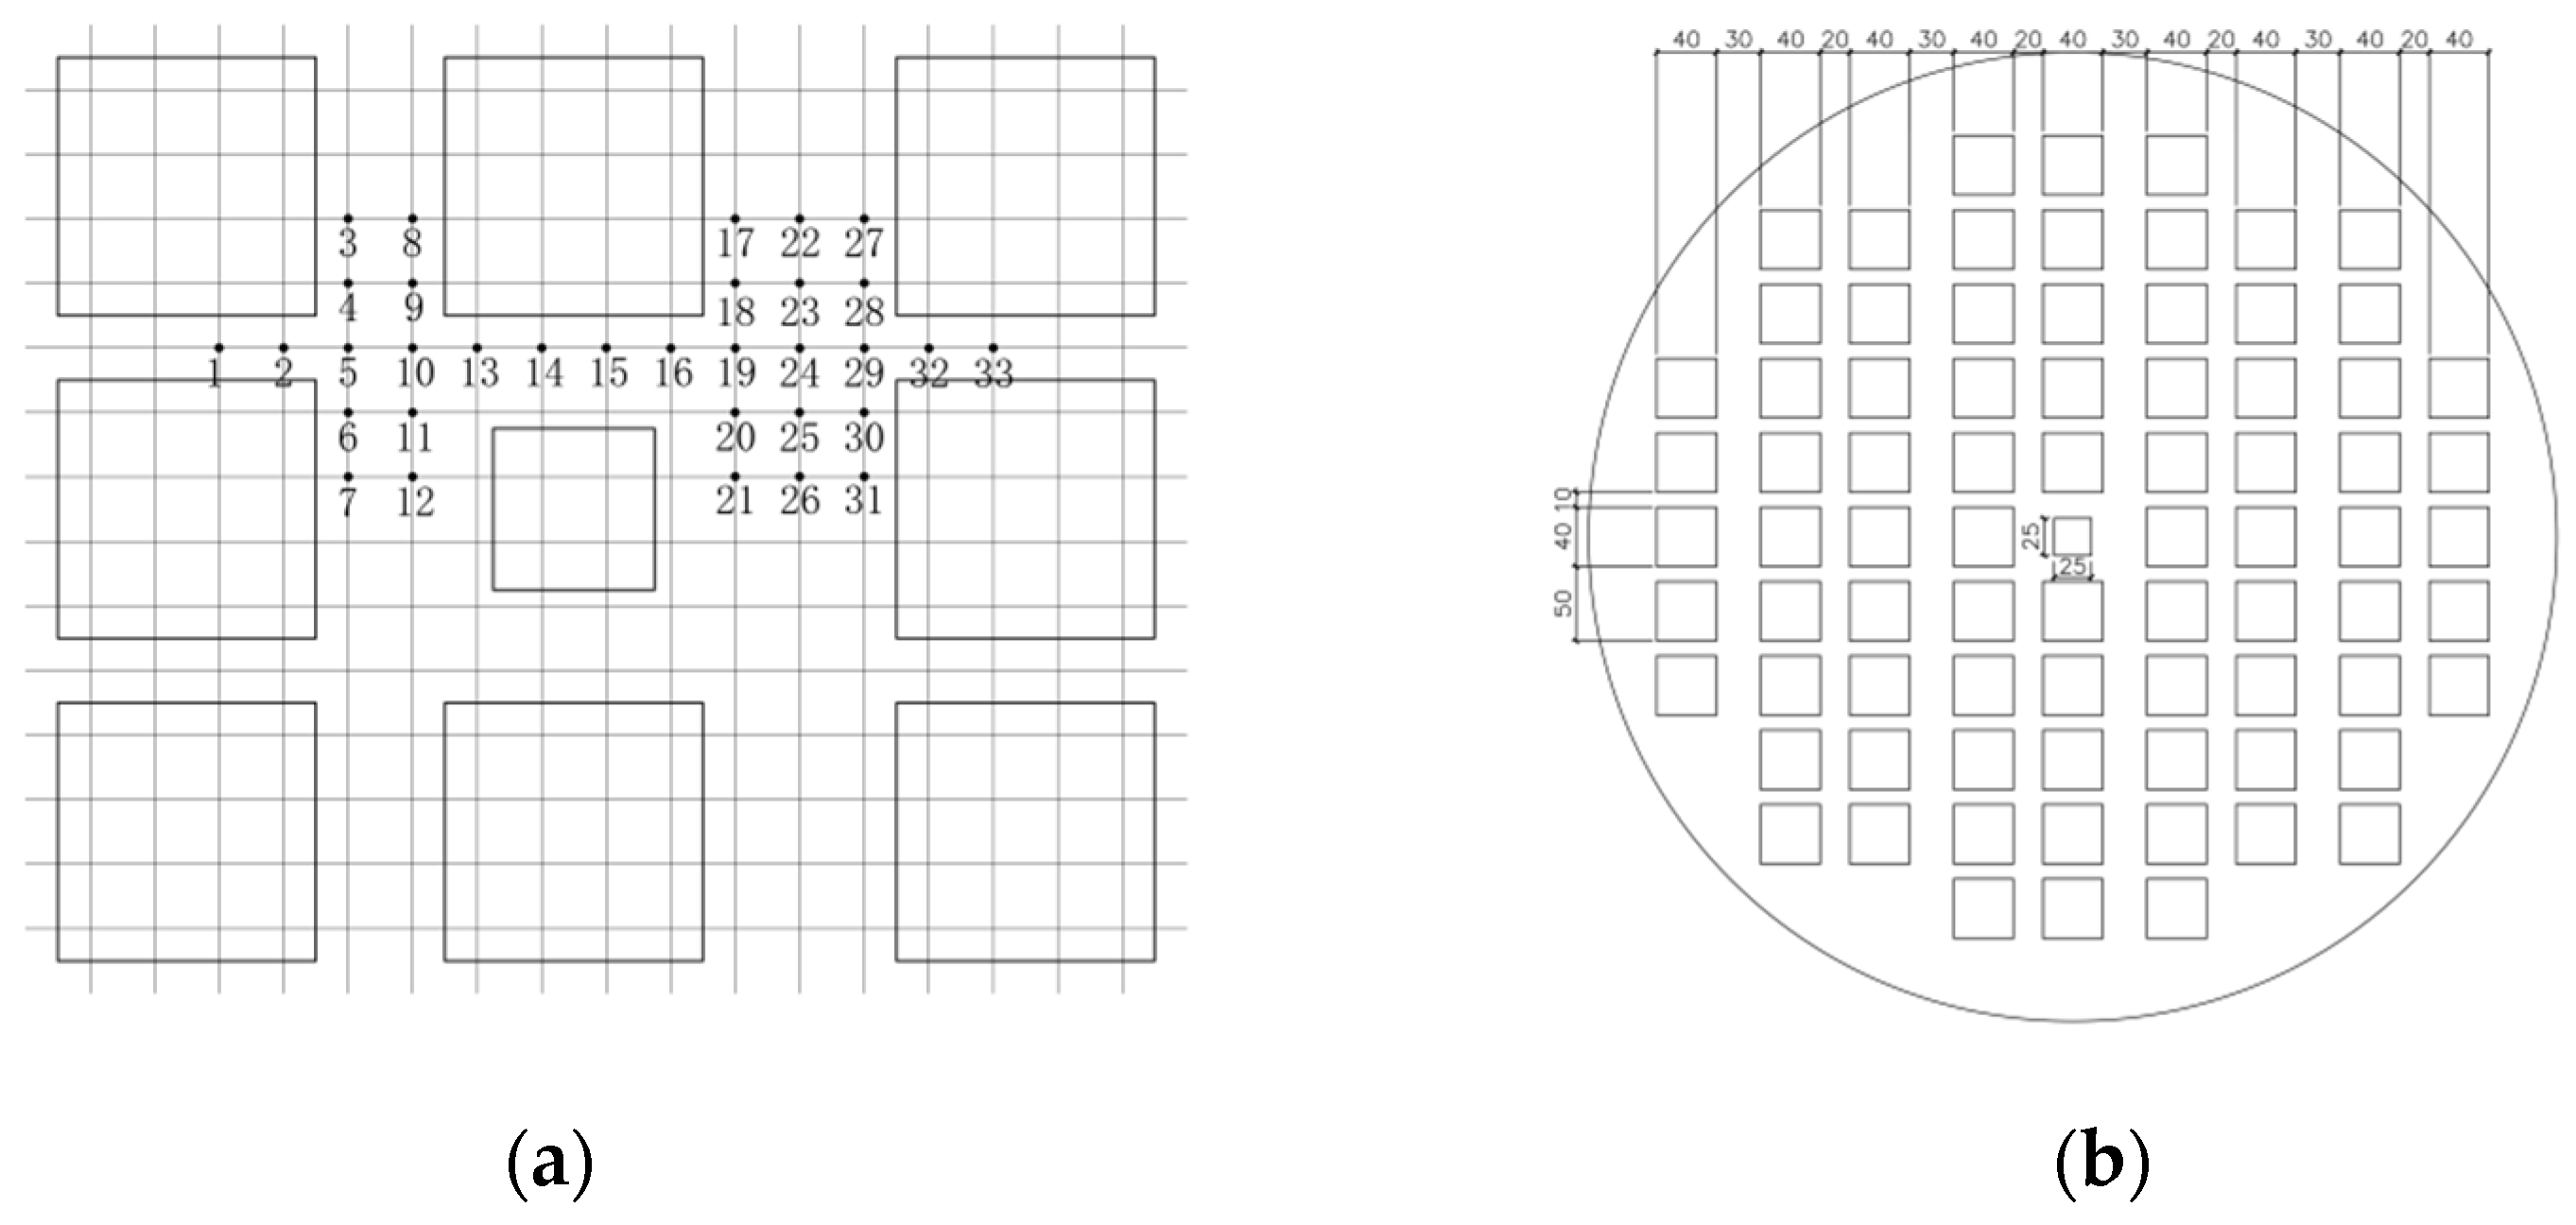
2.4. Field Monitoring Method
2.5. Integrated Assessment Approach
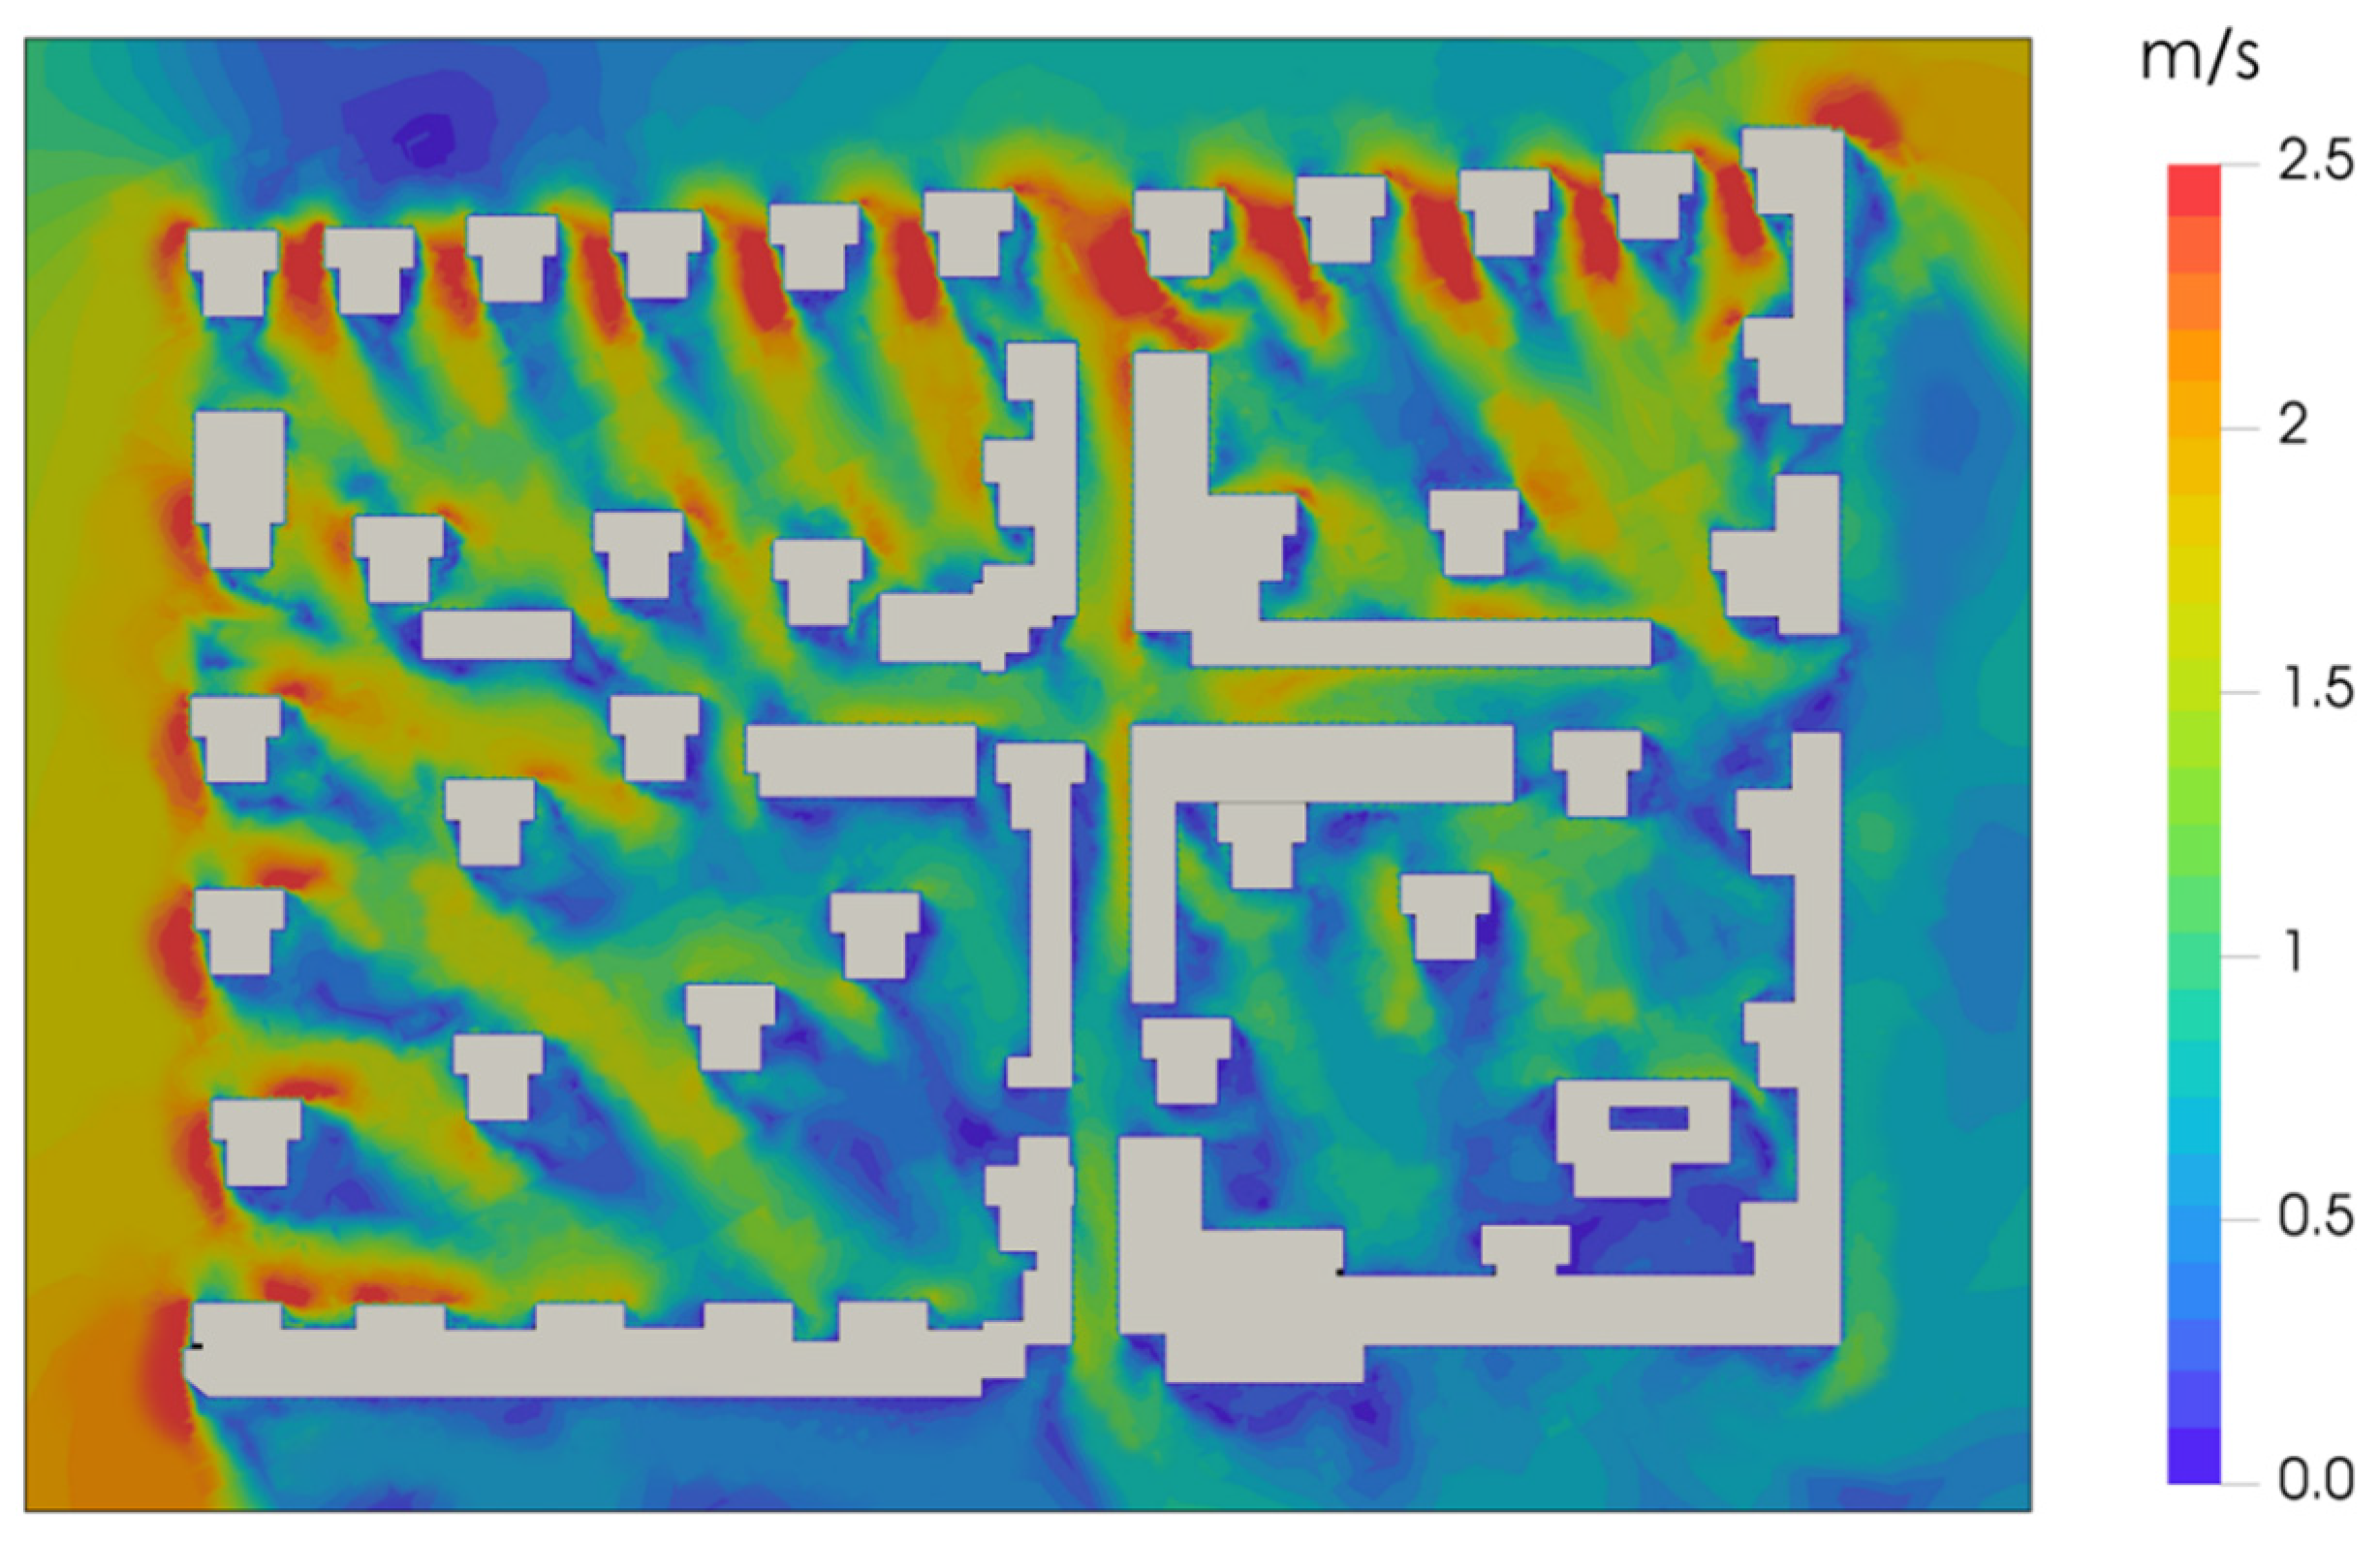
- Wind field analysis: Characterizing areas with wind speeds below 0.5 m/s and adverse pressure conditions.
- Human exposure assessment: Overlaying activity density data with environmental risk factors.
- Pollution potential mapping: Identifying zones where PM2.5 accumulation is likely based on CFD simulations and field measurements.
3. Results
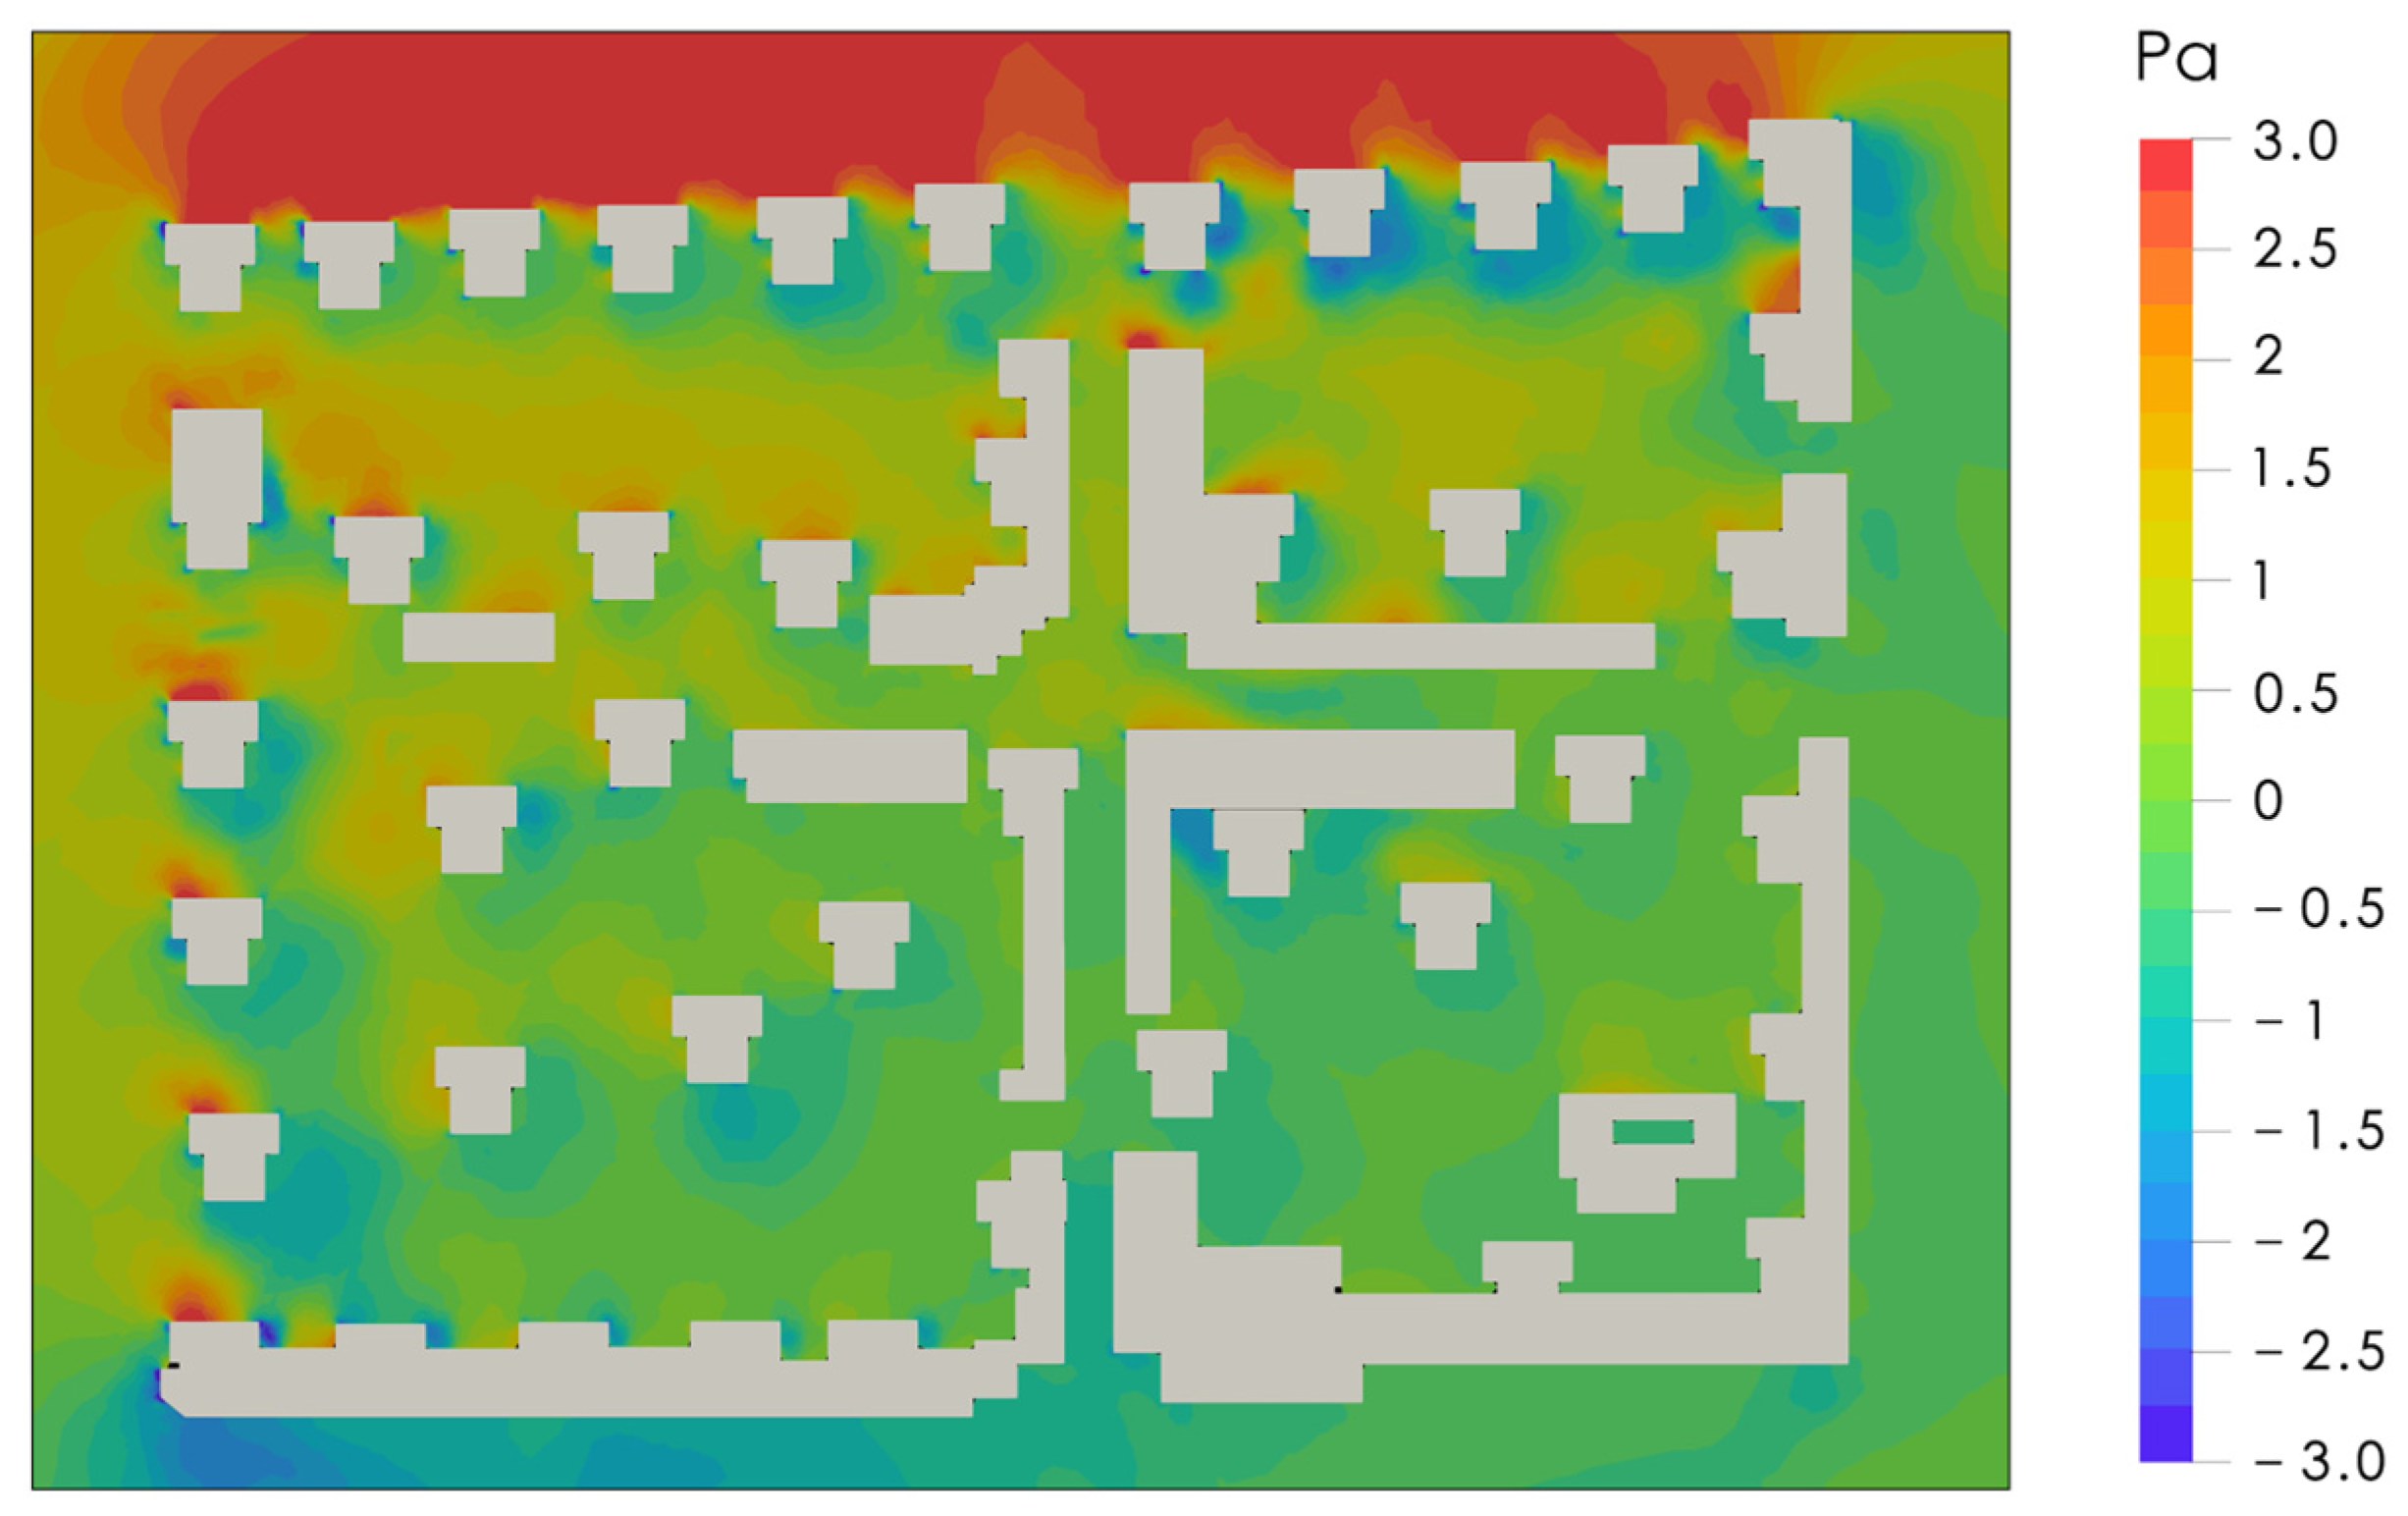
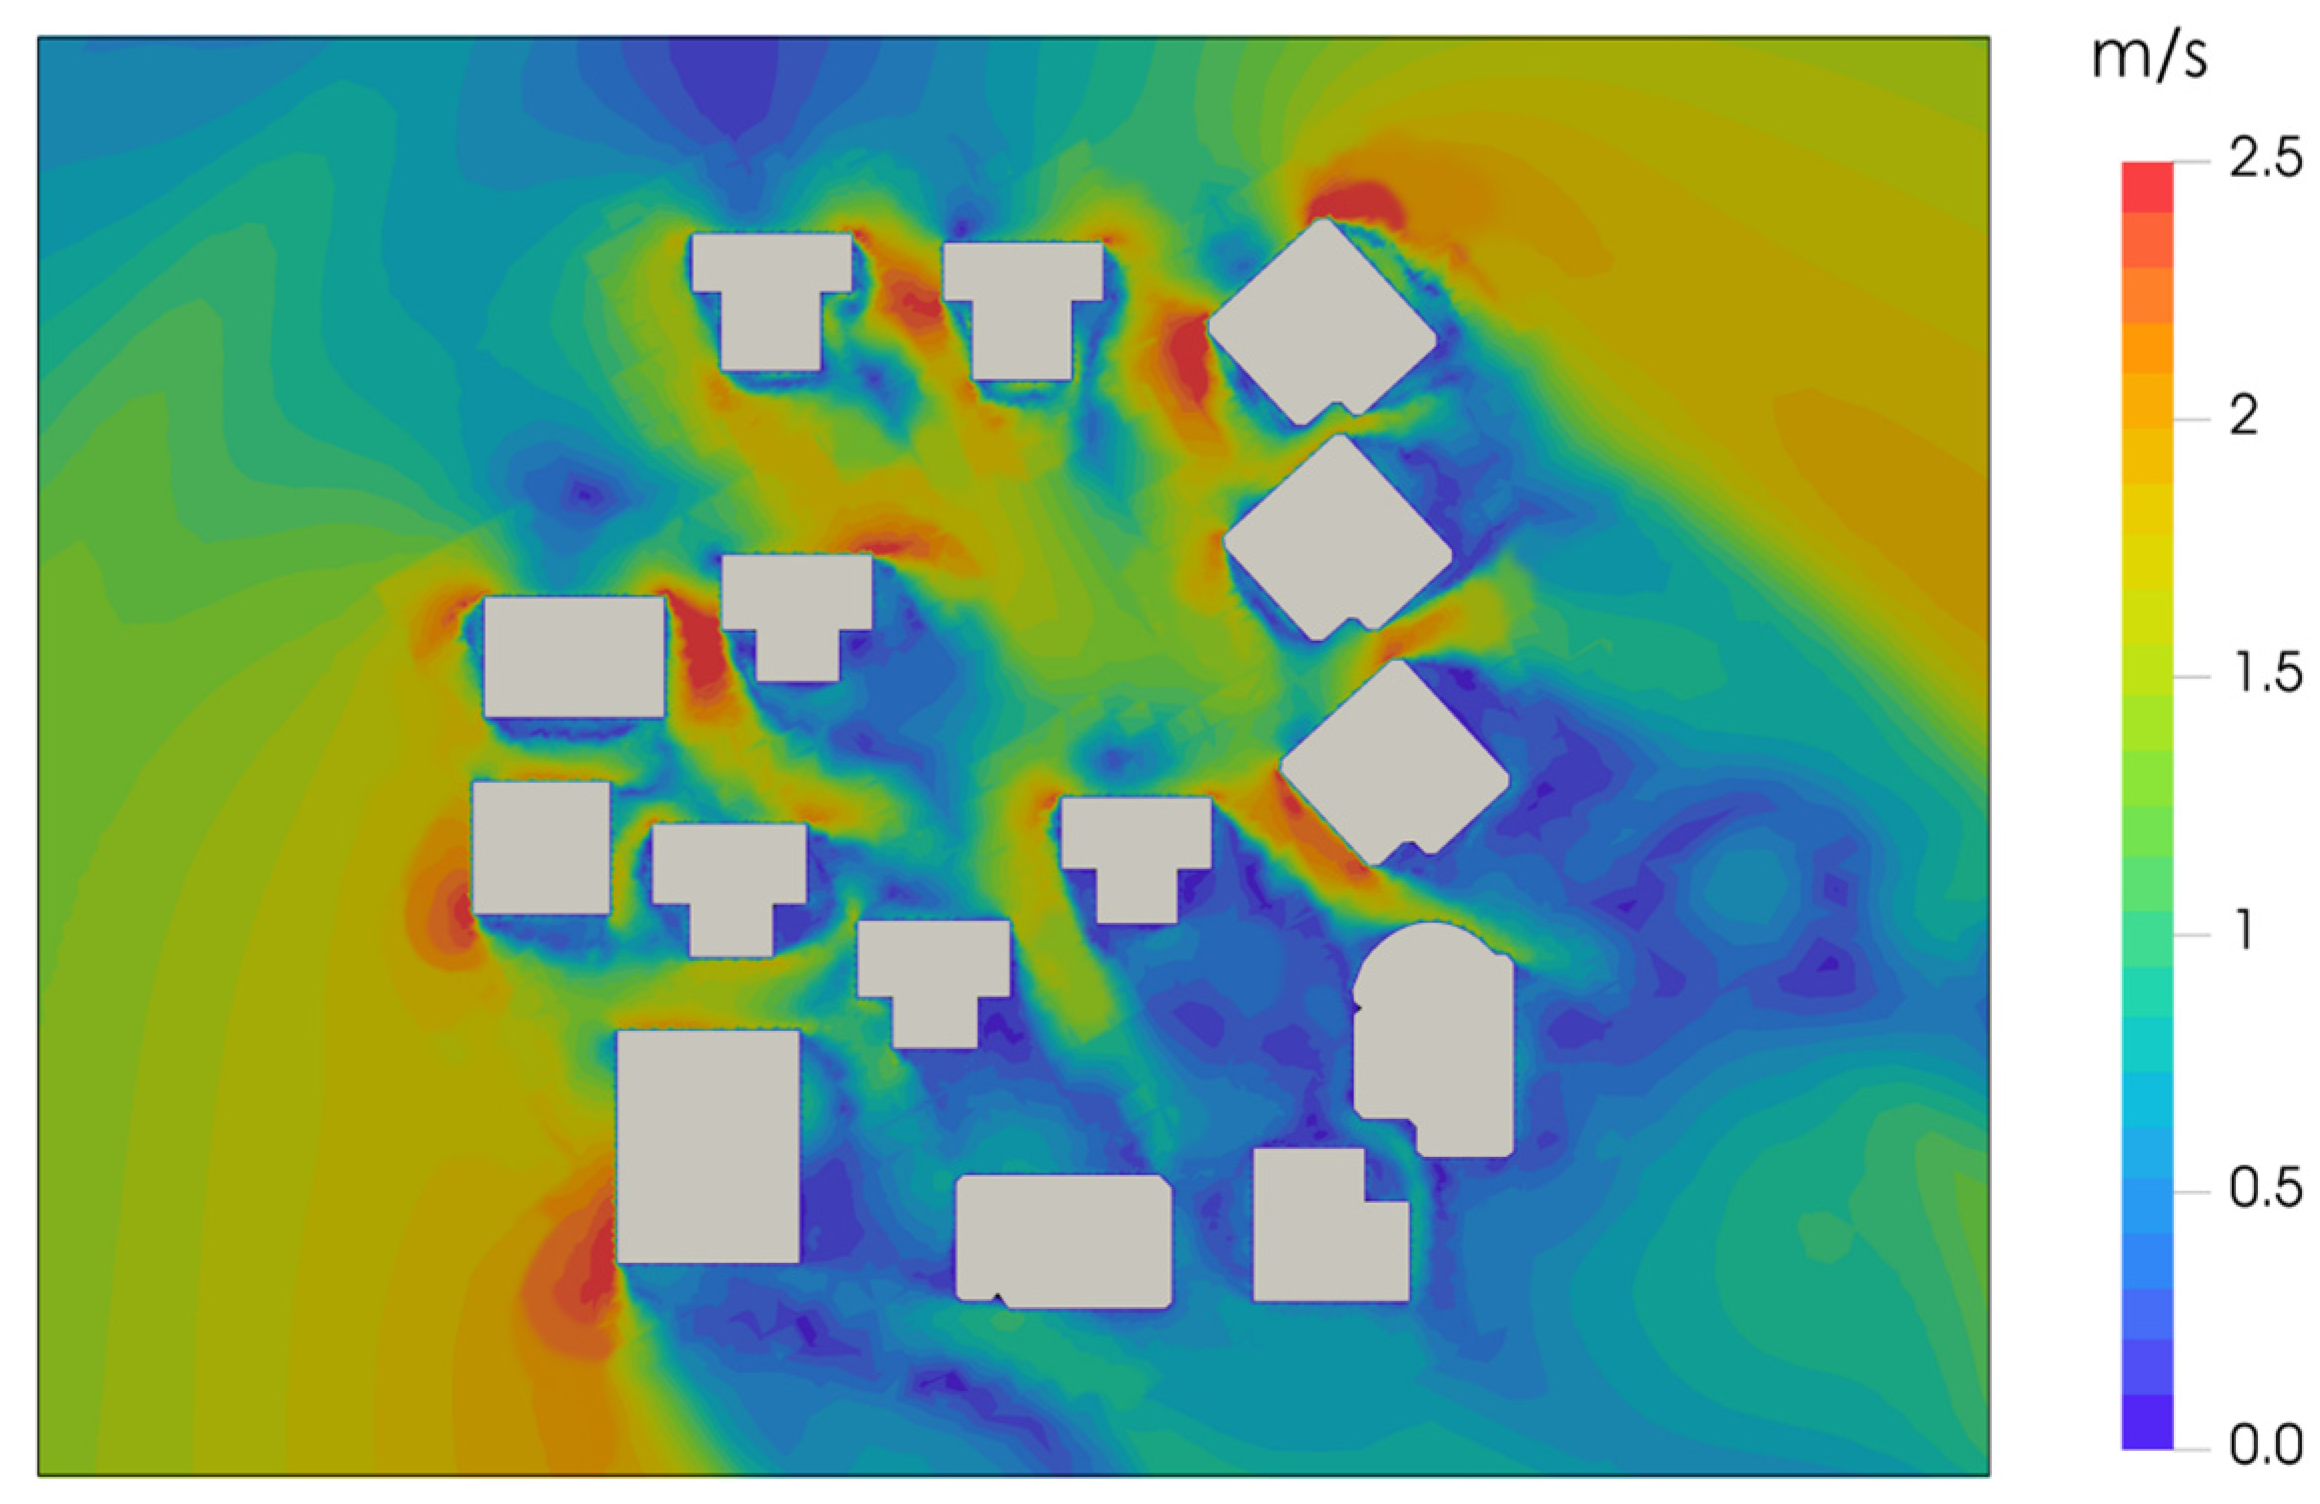
3.1. Characteristics of Wind Environment
- 1.
- CASE A: West of Wenjing Community
- 2.
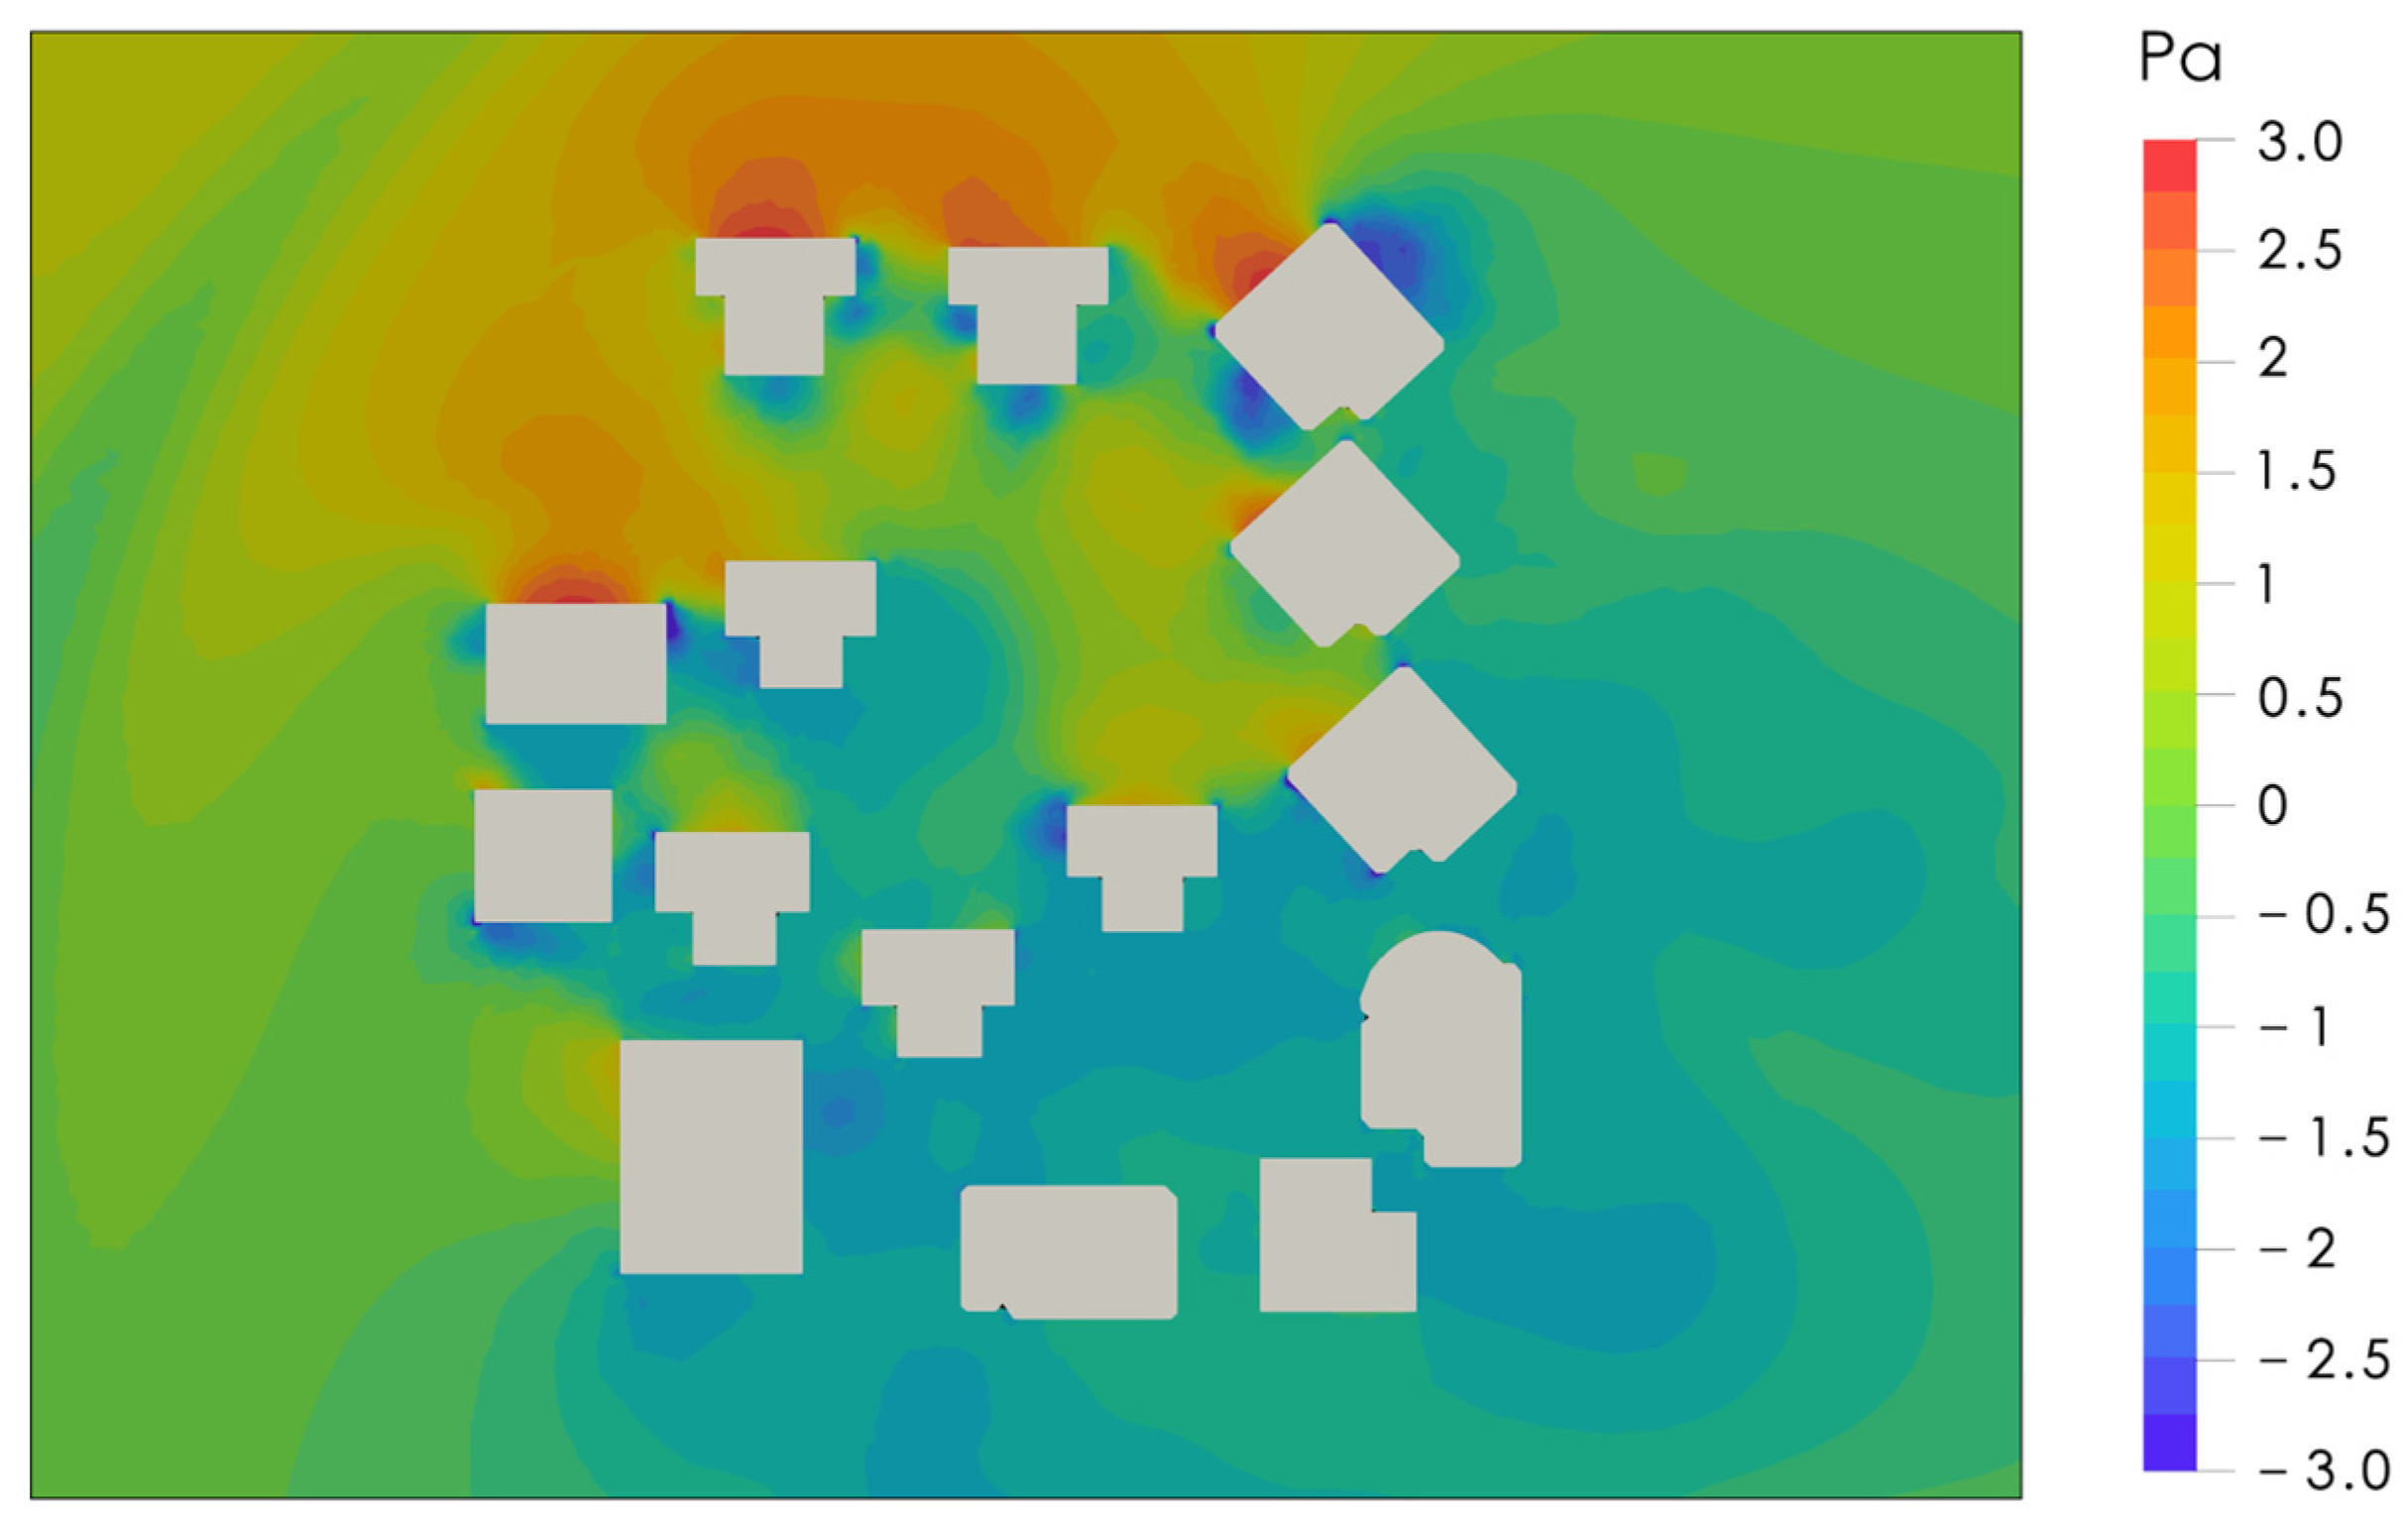
- CASE B: No. 3 Chang’an Street
3.2. Characteristics of Human Activities
- 1.
- CASE A: West of Wenjing Community
- 2.
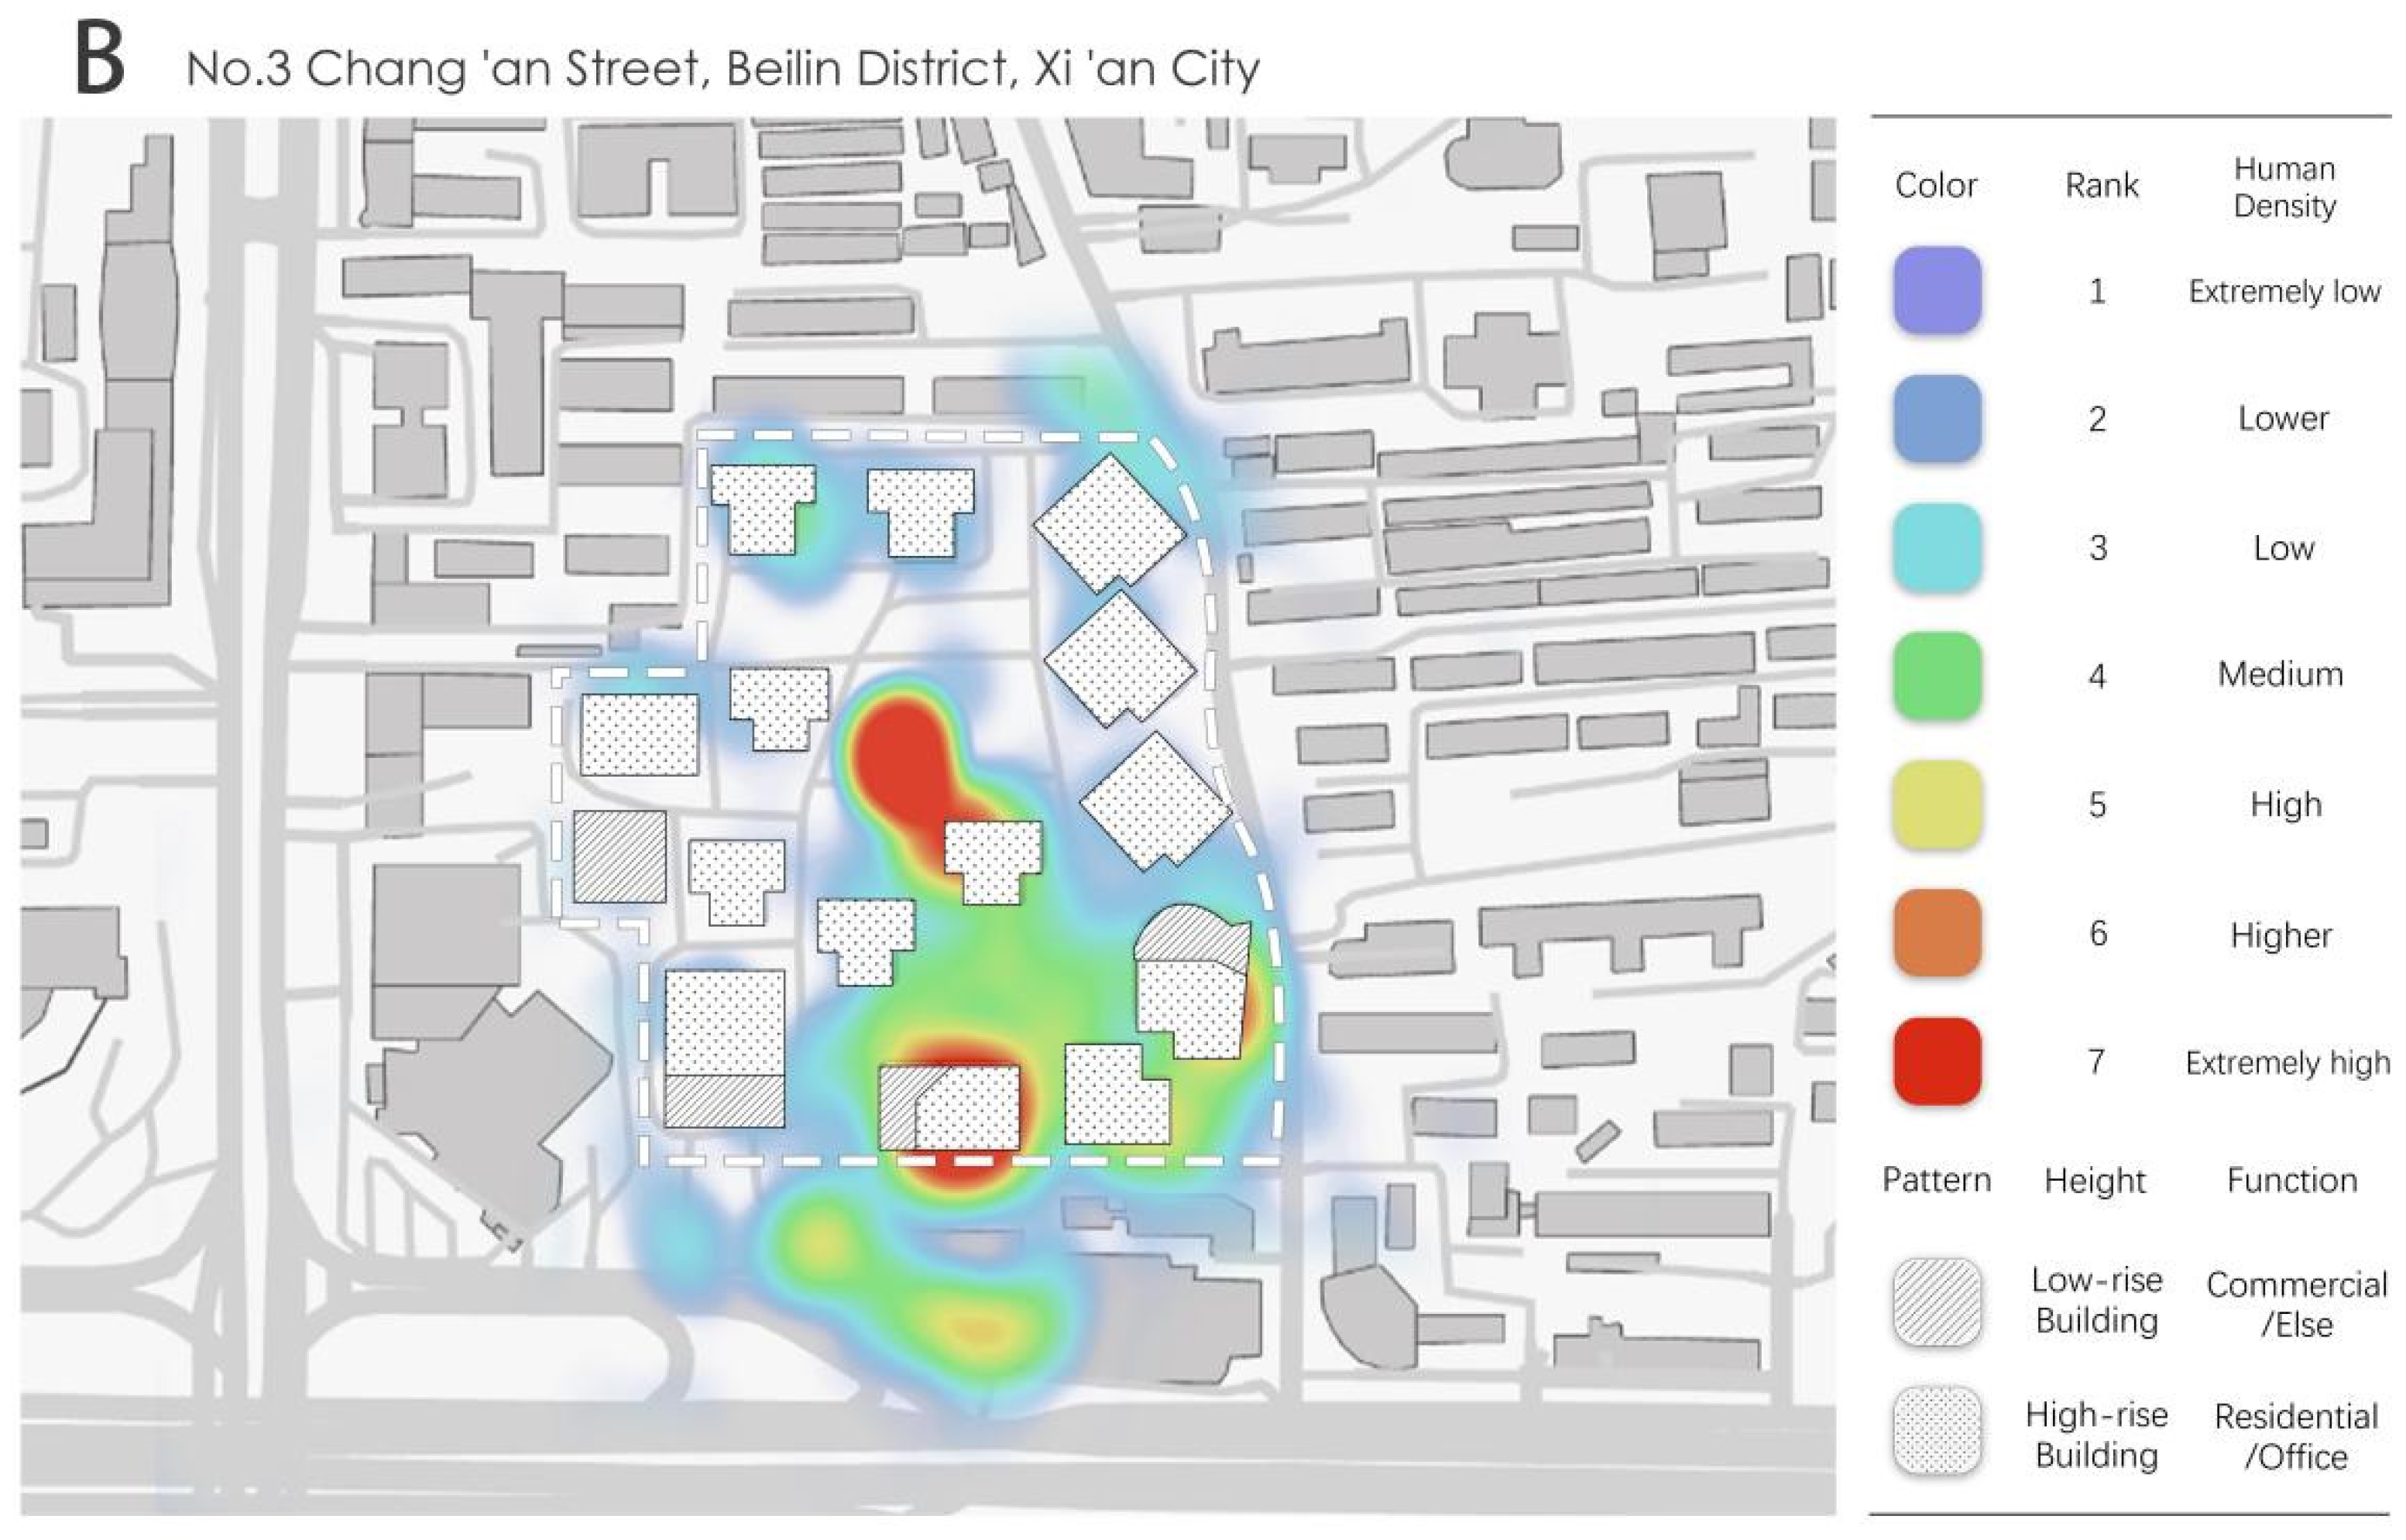
- CASE B: No. 3 Chang’an Street
3.3. Identification of WHVS in Cases
- 1.
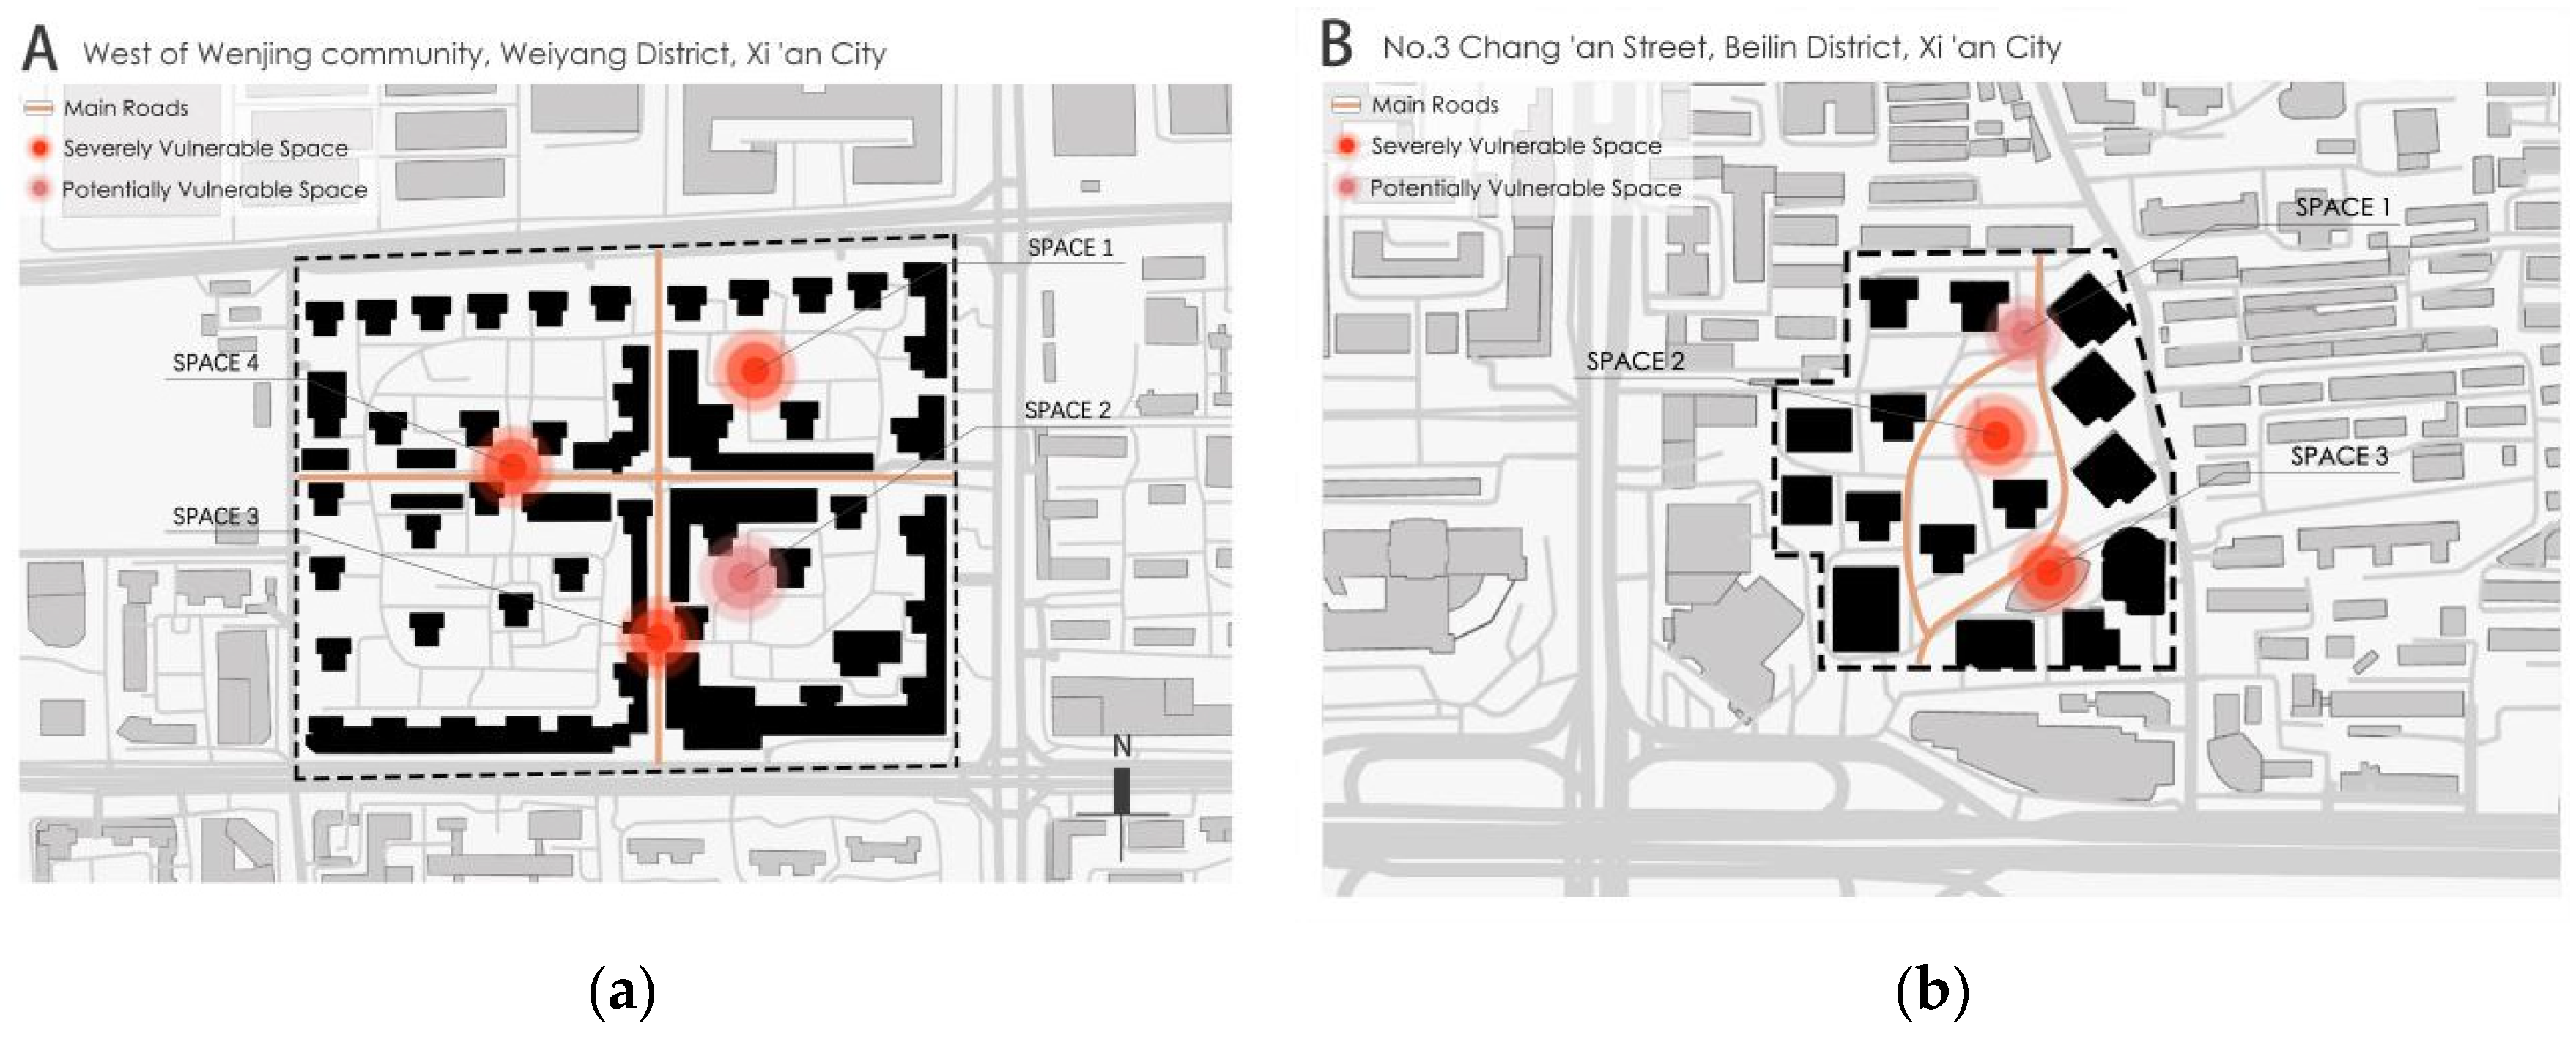
- CASE A: West of Wenjing Community
- 2.
- CASE B: No. 3 Chang’an Street
3.4. Validation of WHVS Identification
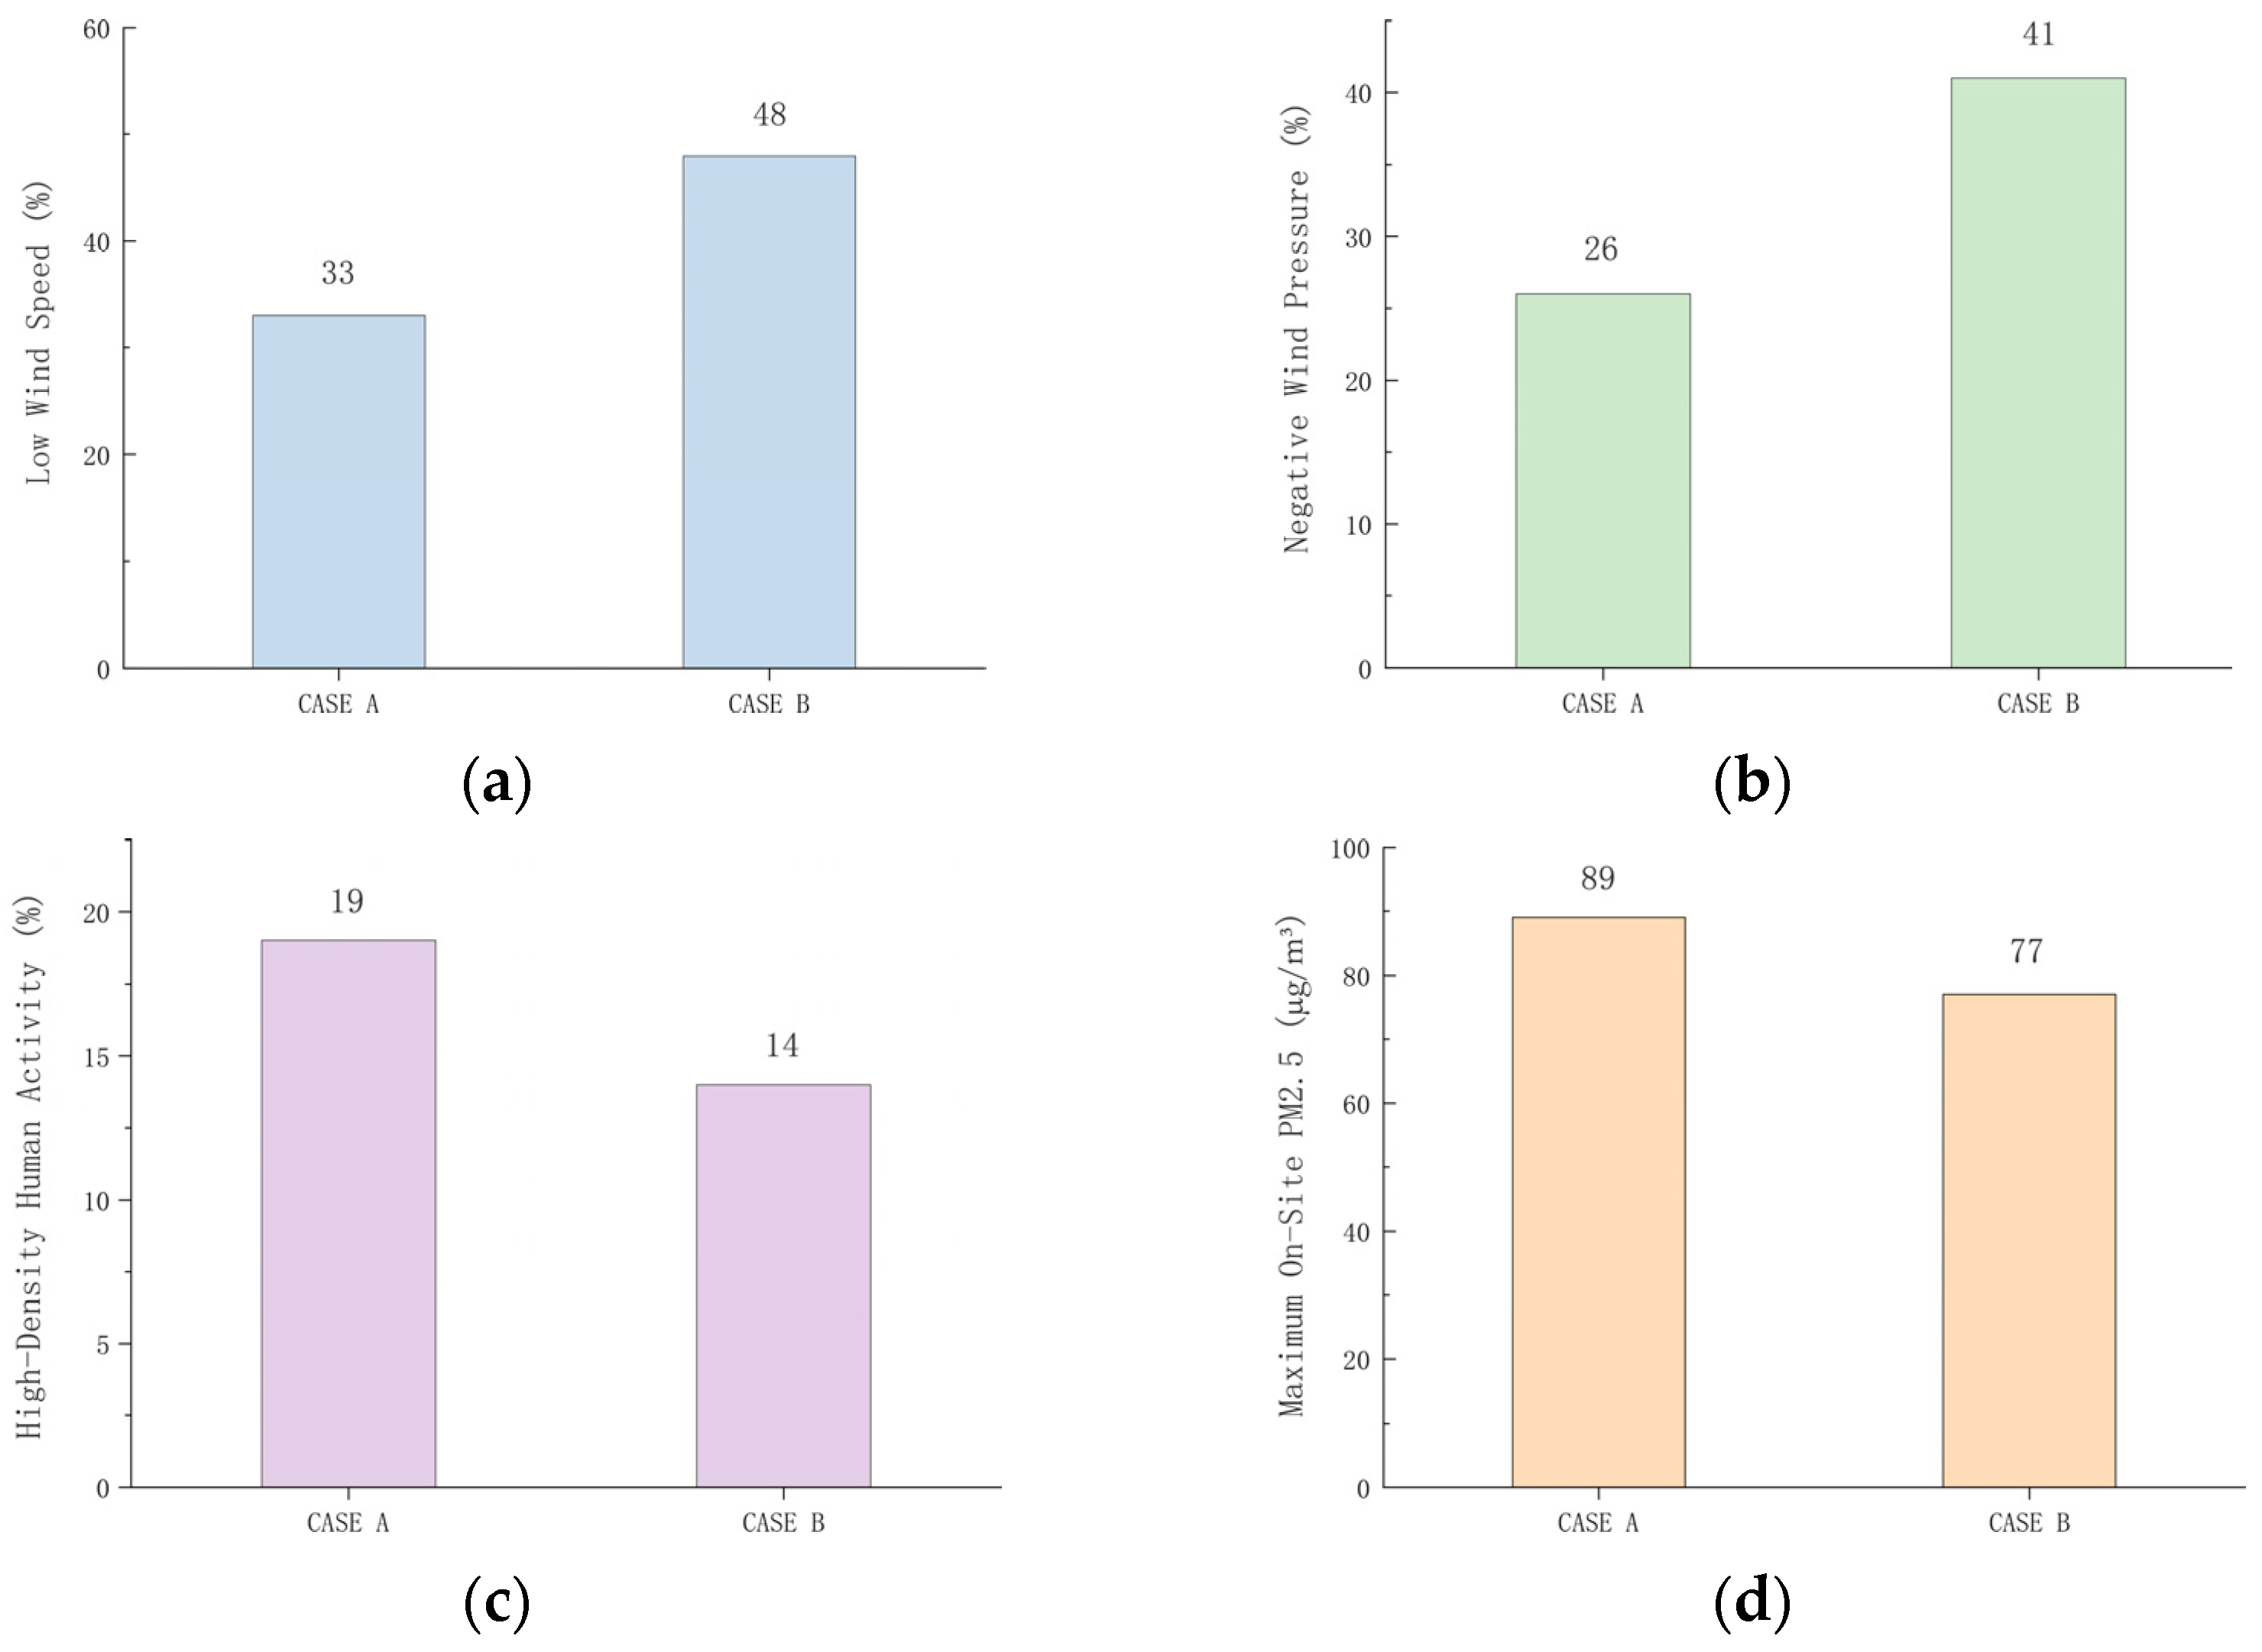
3.4.1. Validation Method and Results
3.4.2. Health Implications and Framework Outlook
3.4.3. Graphical Comparison of WHVS-Related Indicators
4. Discussion
4.1. Main Research Findings
- 1.
- Wind Environment Distribution Patterns
- 2.
- Vulnerable Space Characteristics
- 3.
- Formation Mechanism
4.2. Innovation and Contribution
4.3. Limitations
5. Conclusions
Supplementary Materials
Author Contributions
Funding
Data Availability Statement
Conflicts of Interest
Appendix A
| Researchers (Year) | Research Scale | Key Findings | Methodology |
|---|---|---|---|
| Bai et al. (2006) [20] | Urban Residential Clusters | Revealed densification and functional change in Xi’an’s residential space from 2006 to 2022, driven by policy and market forces. | GIS and temporal analysis of housing data. |
| Kubota et al. (2008) [6] | Residential Neighborhoods | Identified correlations between building density and pedestrian wind speed; proposed design guidelines for comfortable wind environments. | Wind tunnel experiments on varied density scenarios. |
| Brook et al. (2010) [8] | Human Health | Confirmed strong associations between PM exposure and cardiovascular diseases; emphasized both short- and long-term risks. | Scientific statement based on epidemiological and clinical evidence review. |
| Tominaga et al. (2011) [12] | Street Canyon | Compared LES and RANS for street canyon pollutant dispersion; found LES provides better detail but at higher computational cost. | CFD simulations comparing LES and RANS models. |
| Ramponi et al. (2012) [15] | Single Isolated Building | Evaluated how different CFD parameters such as turbulence models and mesh resolution influence cross-ventilation accuracy. Emphasized the importance of parameter selection in reliable simulation. | Parametric CFD simulations on a simplified building. |
| Zhao et al. (2013) [19] | National (China-wide) | Tracked national trends of PM2.5 and ozone pollution from 2013 to 2020 and quantified the associated health burden. Highlighted spatial differences and the effectiveness of policy measures. | Multi-source emission data analysis and health impact modeling. |
| Ai et al. (2013) [7] | Single Building | Investigated how inhomogeneous atmospheric boundary layers and near-wall treatments affect flow and pollutant dispersion. Demonstrated that ABL profiles significantly influence simulation accuracy. | CFD simulations with varied ABL and wall treatments. |
| Aflaki et al. (2015) [16] | Building-Scale | Reviewed natural ventilation strategies using façade elements in tropical climates. Highlighted key design factors affecting ventilation performance. | Systematic literature review on natural ventilation design. |
| Kim et al. (2015) [9] | Human Health | Summarized epidemiological evidence linking particulate matter exposure to cardiovascular, respiratory, and neurological diseases; emphasized the vulnerability of children and the elderly. | Comprehensive review of clinical and population-based studies on PM health effects. |
| Li et al. (2015) [13] | Building Passageways | Reassessed the Venturi effect in passage ventilation between non-parallel buildings; showed that shape and angle strongly influence airflow acceleration and ventilation efficiency. | CFD simulations analyzing geometric configurations and flow behavior. |
| Blocken et al. (2016) [4] | Pedestrian-Level (Building Surroundings) | Reviewed wind tunnel and CFD approaches for assessing pedestrian wind comfort; compared accuracy, limitations, and recommended best practices for reliable evaluations. | Comparative review of experimental and numerical methods in wind comfort research. |
| Tong et al. (2016) [3] | Naturally Ventilated Building | Quantified how outdoor traffic-related air pollution infiltrates indoor spaces through natural ventilation; revealed significant indoor exposure to PM and black carbon. | Field measurements and statistical analysis of pollutant infiltration patterns. |
| Mittal et al. (2018) [5] | Pedestrian-Level (Urban Buildings) | Reviewed key parameters influencing pedestrian-level wind around buildings, including layout, height, and orientation; emphasized simulation and experimental techniques. | Literature review of CFD, wind tunnel, and empirical studies. |
| Ai et al. (2018) [14] | Building Adjacent to Street Canyon | Analyzed how street canyon geometry and façade design affect wind-driven single-sided ventilation; identified configurations that enhance indoor airflow. | CFD simulations assessing various street layouts and envelope designs. |
| Liu et al. (2019) [10] | Global (652 Cities) | Found a significant association between short-term PM2.5 exposure and increased daily mortality across diverse climatic and economic contexts. | Multi-country time-series analysis using standardized epidemiological models. |
| Ma et al. (2019) [2] | National (China) | Analyzed spatial coupling between regional economic growth and urbanization; revealed strong spatial heterogeneity and identified leading industrial sectors in coordinated regions. | Spatial statistical analysis using coupling coordination models and industrial structure evaluation. |
| United et al. (2020) [1] | Global Urban Trends | Projected that by 2050, 68% of the global population will live in cities, with the fastest growth in Asia; emphasized sustainable urbanization as key to equitable development. | Global urban data synthesis and policy-oriented analysis. |
| Huang et al. (2021) [11] | High-Rise Urban Area | Demonstrated that high-rise buildings significantly alter wind fields and pollutant dispersion, with effects varying under different atmospheric temperature stratifications. | CFD simulations under multiple thermal stratification scenarios. |
| Chen et al. (2023) [17] | Building Form Effects | Podium-connected towers reduced dispersion efficiency in winter. | 3D CFD under thermal stratification. |
| Li et al. (2024) [18] | Multi-city Risk Assessment | Developed and validated a Wind Health Risk Index. | Integrated CFD–GIS modeling with health risk assessment. |
| Huo et al. (2025) [21] | Urban Residential Clusters | Analyzed long-term urban structure changes in Xi’an from 2000 to 2020; revealed that increasing building density and spatial infill significantly elevated urban heat stress levels in high-density residential areas. | Remote sensing-based urban form tracking and spatial correlation analysis between morphological metrics and heat stress indicators. |
References
- United Nations Human Settlements Programme. World Cities Report 2020: The Value of Sustainable Urbanization; UN-Habitat: Nairobi, Kenya, 2020; Available online: https://unhabitat.org/world-cities-report-2020-the-value-of-sustainable-urbanization (accessed on 16 April 2025).
- Ma, L.; Jin, F. Spatial Pattern and Industrial Sector Structure Analysis on the Coupling and Coordinating Degree of Regional Economic Development and Environmental Pollution in China. Acta Geogr. Sin. 2012, 67, 1299–1307. [Google Scholar]
- Tong, Z.; Chen, Y.; Malkawi, A.; Adamkiewicz, G.; Spengler, J. Quantifying the impact of traffic-related air pollution on the indoor air quality of a naturally ventilated building. Environ. Int. 2016, 89, 138–146. [Google Scholar] [CrossRef] [PubMed]
- Blocken, B.; Stathopoulos, T.; van Beeck, J. Pedestrian-level wind conditions around buildings: Review of wind-tunnel and CFD techniques and their accuracy for wind comfort assessment. Build. Environ. 2016, 100, 50–81. [Google Scholar] [CrossRef]
- Mittal, H.; Sharma, A.; Gairola, A. A review on the study of urban wind at the pedestrian level around buildings. J. Build. Eng. 2018, 18, 154–163. [Google Scholar] [CrossRef]
- Kubota, T.; Miura, M.; Tominaga, Y.; Mochida, A. Wind tunnel tests on the relationship between building density and pedestrian-level wind velocity: Development of guidelines for realizing acceptable wind environment in residential neighborhoods. Build. Environ. 2008, 43, 1699–1708. [Google Scholar] [CrossRef]
- Ai, Z.T.; Mak, C.M. CFD Simulation of Flow and Dispersion around an Isolated Building: Effect of Inhomogeneous ABL and Near-Wall Treatment. Atmos. Environ. 2013, 77, 568–578. [Google Scholar] [CrossRef]
- Brook, R.D.; Rajagopalan, S.; Pope, C.A., III; Brook, J.R.; Bhatnagar, A.; Diez-Roux, A.V.; Holguin, F.; Hong, Y.; Luepker, R.V.; Mittleman, M.A.; et al. Particulate matter air pollution and cardiovascular disease: An update to the scientific statement from the American Heart Association. Circulation 2010, 121, 2331–2378. [Google Scholar] [CrossRef] [PubMed]
- Kim, K.-H.; Kabir, E.; Kabir, S. A review on the human health impact of airborne particulate matter. Environ. Int. 2015, 74, 136–143. [Google Scholar] [CrossRef]
- Liu, C.; Chen, R.; Sera, F.; Vicedo-Cabrera, A.M.; Guo, Y.; Tong, S.; Coelho, M.S.Z.S.; Saldiva, P.H.N.; Lavigne, E.; Matus, P.; et al. Ambient particulate air pollution and daily mortality in 652 cities. N. Engl. J. Med. 2019, 381, 705–715. [Google Scholar] [CrossRef]
- Huang, X.; Gao, L.; Gu, D.; Yao, R. Impacts of High-Rise Building on Urban Airflows and Pollutant Dispersion under Different Temperature Stratifications: Numerical Investigations. Atmos. Pollut. Res. 2021, 12, 138–146. [Google Scholar] [CrossRef]
- Tominaga, Y.; Stathopoulos, T. CFD Modeling of Pollution Dispersion in a Street Canyon: Comparison between LES and RANS. J. Wind Eng. Ind. Aerodyn. 2011, 99, 340–348. [Google Scholar] [CrossRef]
- Li, B.; Luo, Z.; Sandberg, M.; Liu, J. Revisiting the ‘Venturi Effect’ in Passage Ventilation between Two Non-Parallel Buildings. Build. Environ. 2015, 94, 714–722. [Google Scholar] [CrossRef]
- Ai, Z.T.; Mak, C.M. Wind-Induced Single-Sided Natural Ventilation in Buildings Near a Long Street Canyon: CFD Evaluation of Street Configuration and Envelope Design. J. Wind Eng. Ind. Aerodyn. 2018, 172, 96–106. [Google Scholar] [CrossRef]
- Ramponi, R.; Blocken, B. CFD Simulation of Cross-Ventilation for a Generic Isolated Building: Impact of Computational Parameters. Build. Environ. 2012, 53, 34–48. [Google Scholar] [CrossRef]
- Aflaki, A.; Mahyuddin, N.; Al-Cheikh Mahmoud, Z.; Baharum, M.R. A Review on Natural Ventilation Applications through Building Façade Components and Ventilation Openings in Tropical Climates. Energy Build. 2015, 101, 153–162. [Google Scholar] [CrossRef]
- Chen, Y.; Pathirana, A.; De Silva, C.S.; Bandara, C. Air Pollutant Dispersion around High-Rise Building Cluster Forms: The Case of Port City Colombo, Sri Lanka. Build. Environ. 2023, 237, 110315. [Google Scholar] [CrossRef]
- Back, Y.; Kumar, P.; Bach, P.M.; Rauch, W.; Kleidorfer, M. Integrating CFD-GIS Modelling to Refine Urban Heat and Thermal Comfort Assessment. Sci. Total Environ. 2023, 858 Pt 1, 159729. [Google Scholar] [CrossRef]
- Xiao, Q.; Geng, G.; Xue, T.; Liu, S.; Cai, C.; He, K.; Zhang, Q. Tracking PM2.5 and O3 Pollution and the Related Health Burden in China from 2013 to 2020. Environ. Sci. Technol. 2021, 56, 6922–6932. [Google Scholar] [CrossRef]
- Bai, X.; Wu, W.; Liu, L.; Shang, W.; Dong, H. Spatio-Temporal Evolution and Implications of Urban Residential Space Based on the New Commercial Housing in Xi’an, China, 2006–2022. Sustainability 2024, 16, 8495. [Google Scholar] [CrossRef]
- Huo, K.; Qin, R.; Zhao, J.; Wang, Y.; Liu, M. Long-Term Tracking of Urban Structure and Analysis of Its Impact on Urban Heat Stress: A Case Study of Xi’an, China. Ecol. Indic. 2025, 174, 113418. Available online: https://www.sciencedirect.com/science/article/pii/S1470160X25003486 (accessed on 16 April 2025). [CrossRef]
- Yuan, C.; Ng, E.; Norford, L.K. Improving Air Quality in High-Density Cities by Understanding the Relationship between Air Pollutant Dispersion and Urban Morphologies. Build. Environ. 2014, 71, 245–258. [Google Scholar] [CrossRef]
- Lateb, M.; Meroney, R.N.; Yataghene, M.; Fellouah, H.; Saleh, F.; Boufadel, M.C. On the Use of Numerical Modelling for Near-Field Pollutant Dispersion in Urban Environments—A Review. Environ. Pollut. 2016, 208, 271–283. [Google Scholar] [CrossRef]
- Yang, J.; Shi, B.; Zheng, Y.; Shi, Y.; Xia, G. Urban Form and Air Pollution Disperse: Key Indexes and Mitigation Strategies. Sustain. Cities Soc. 2020, 57, 101955. [Google Scholar] [CrossRef]
- Jin, Y.; Andersson, H.; Zhang, S. Air Pollution Control Policies in China: A Retrospective and Prospects. Int. J. Environ. Res. Public Health 2016, 13, 1219. [Google Scholar] [CrossRef]
- Jiao, W.; Hagler, G.; Williams, R.; Sharpe, R.; Brown, R.; Garver, D.; Judge, R.; Caudill, M.; Rickard, J.; Davis, M.; et al. Community Air Sensor Network (CAIRSENSE) Project: Evaluation of Low-Cost Sensor Performance in a Suburban Environment in the Southeastern United States. Atmos. Meas. Tech. 2016, 9, 5281–5292. [Google Scholar] [CrossRef]
- Blocken, B. Computational Fluid Dynamics for Urban Physics: Importance, Scales, Possibilities, Limitations and Ten Tips and Tricks towards Accurate and Reliable Simulations. Build. Environ. 2015, 91, 219–245. [Google Scholar] [CrossRef]
- Di Sabatino, S.; Buccolieri, R.; Pulvirenti, B.; Britter, R. Simulations of Pollutant Dispersion within Idealised Urban-Type Geometries with CFD and Integral Models. Atmos. Environ. 2007, 41, 8316–8329. [Google Scholar] [CrossRef]
- Ng, E.; Yuan, C.; Chen, L.; Ren, C.; Fung, J.C.H. Improving the Wind Environment in High-Density Cities by Understanding Urban Morphology and Surface Roughness: A Study in Hong Kong. Landsc. Urban Plan. 2011, 101, 59–74. [Google Scholar] [CrossRef]
- Turner, B.L.; Kasperson, R.E.; Matson, P.A.; McCarthy, J.J.; Corell, R.W.; Christensen, L.; Eckley, N.; Kasperson, J.X.; Luers, A.; Martello, M.L.; et al. A Framework for Vulnerability Analysis in Sustainability Science. Proc. Natl. Acad. Sci. USA 2003, 100, 8074–8079. [Google Scholar] [CrossRef]
- Jiang, G.; Wu, M.; Hu, T. Turbulence and Pollutant Statistics around a High-Rise Building with and without Overhangs. Atmosphere 2023, 14, 1771. [Google Scholar] [CrossRef]
- Toparlar, Y.; Blocken, B.; Maiheu, B.; van Heijst, G.J.F. A review on the CFD analysis of urban microclimate. Renew. Sustain. Energy Rev. 2017, 80, 1613–1640. [Google Scholar] [CrossRef]
- Zheng, C.; Li, Y.; Wu, Y. Pedestrian-level wind environment on outdoor platforms of a thousand-meter-scale megatall building: Sub-configuration studies of wind comfort based on thermal environment considerations. Build. Environ. 2016, 106, 82–101. [Google Scholar] [CrossRef]
- Tominaga, Y.; Mochida, A.; Yoshie, R.; Kataoka, H.; Nozu, T.; Yoshikawa, M.; Shirasawa, T. AIJ guidelines for practical applications of CFD to pedestrian wind environment around buildings. J. Wind Eng. Ind. Aerodyn. 2008, 96, 1749–1761. [Google Scholar] [CrossRef]
- Tsang, C.W.; Kwok, K.C.S.; Hitchcock, P.A. Wind tunnel study of pedestrian level wind environment around tall buildings: Effects of building dimensions, separation and podium. Build. Environ. 2012, 49, 167–181. [Google Scholar] [CrossRef]
- Liu, Q.; Zhang, Y.; Ma, W.; Ren, J. Application of an architect-friendly digital design approach to the wind environment of campus dormitory buildings. Sustainability 2023, 15, 9168. [Google Scholar] [CrossRef]
- Chen, Z.; Wang, J.; Ma, G.; Zhang, Y. Understanding Meteorological Influences on PM2.5 Concentrations across China: A Temporal and Spatial Perspective. Atmos. Chem. Phys. 2018, 18, 5343–5358. [Google Scholar] [CrossRef]
- Oke, T.R. Street Design and Urban Canopy Layer Climate. Energy Build. 1988, 11, 103–113. [Google Scholar] [CrossRef]
- Zhang, Q.; Zhou, D.; Xu, D.; Rogora, A. Association between Wind Environment and Spatial Characteristics of High-Rise Residential Buildings in Cold Regions through Field Measurements in Xi’an. Buildings 2023, 13, 2007. [Google Scholar] [CrossRef]
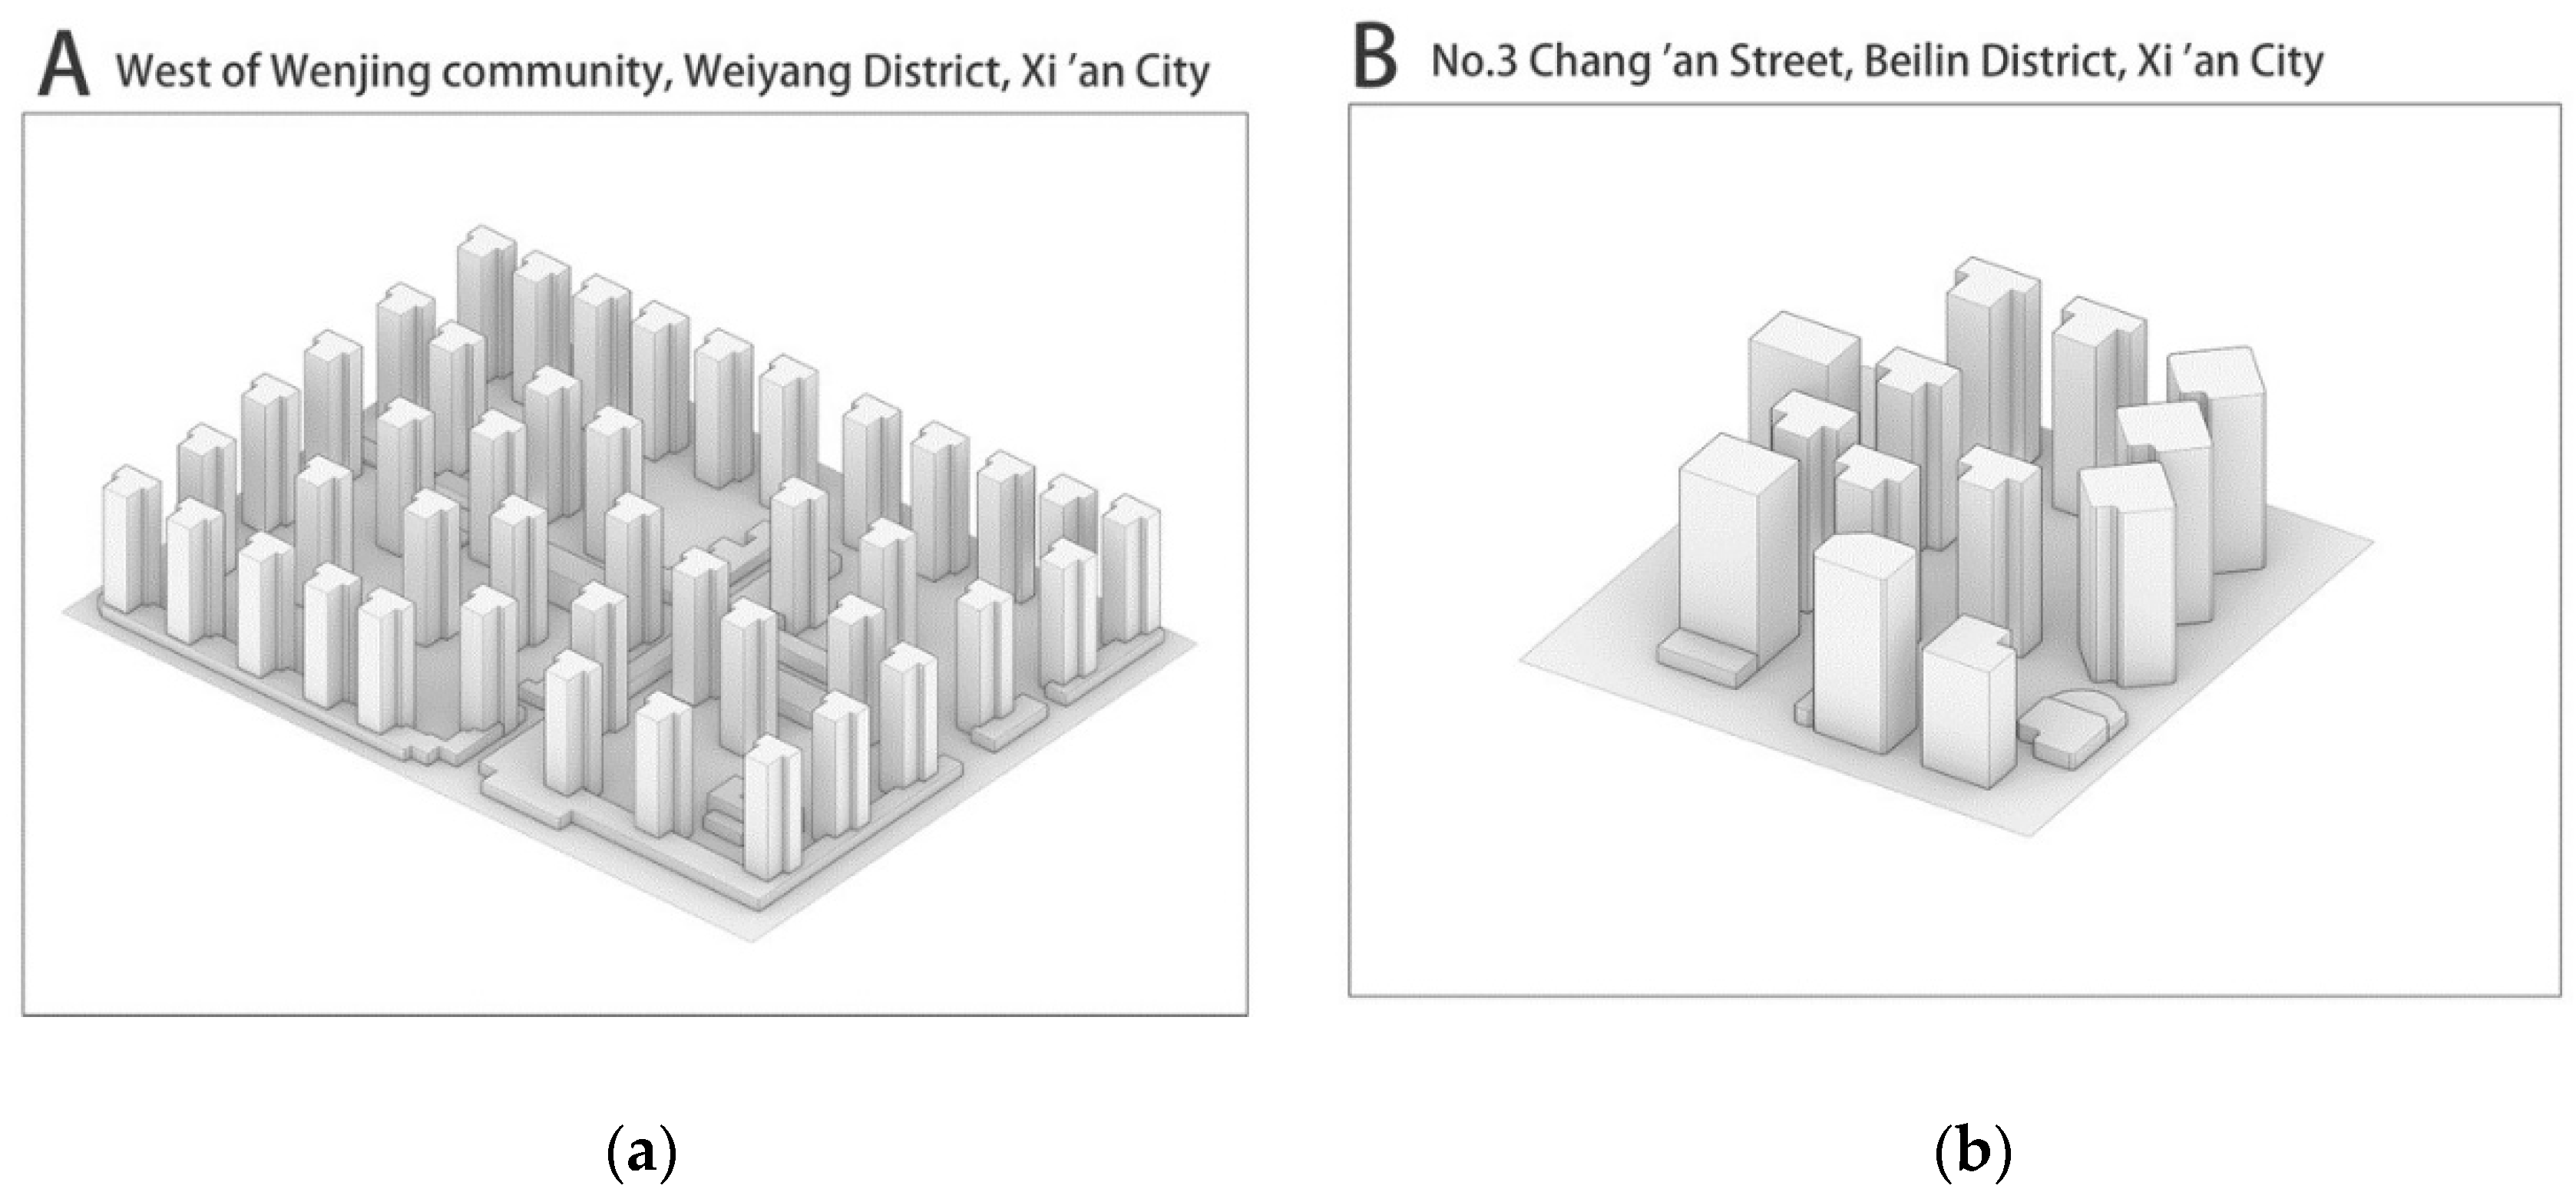


| Characteristics | CASE A | CASE B |
|---|---|---|
| Location of Low Wind Speed Areas | Gaps between buildings on the northwest side | Leeward areas of buildings on the southeast side and internal courtyards |
| Extent of Low Wind Speed Areas | Localized regions | Large-scale areas |
| Wind Speed Feature | <0.5 m/s | <0.5 m/s |
| Characteristics of Wind Pressure | −0.5 to 3 Pa (the negative pressure zone is concentrated in the shaded regions of the buildings) | −1 to −2 Pa (the negative pressure zone is concentrated in the leeward areas) |
| Formation Mechanism | The dense arrangement of buildings causes airflow separation and vortex formation | The closed arrangement of buildings results in wind shadow effects and recirculation patterns |
| Main Effect | Low ventilation efficiency leads to the accumulation of pollutants | Poor ventilation conditions result in the accumulation of pollutants within the courtyard |
| Extent of Low Wind Speed Areas | Localized regions | Large-scale areas |
Disclaimer/Publisher’s Note: The statements, opinions and data contained in all publications are solely those of the individual author(s) and contributor(s) and not of MDPI and/or the editor(s). MDPI and/or the editor(s) disclaim responsibility for any injury to people or property resulting from any ideas, methods, instructions or products referred to in the content. |
© 2025 by the authors. Licensee MDPI, Basel, Switzerland. This article is an open access article distributed under the terms and conditions of the Creative Commons Attribution (CC BY) license (https://creativecommons.org/licenses/by/4.0/).
Share and Cite
Chen, J.; Ma, S.; Meng, Y.; Liu, Y.; Ren, J. Identification and Diagnosis of Wind Health-Vulnerable Spaces in High-Rise Residential Areas of Xi’an. Buildings 2025, 15, 1538. https://doi.org/10.3390/buildings15091538
Chen J, Ma S, Meng Y, Liu Y, Ren J. Identification and Diagnosis of Wind Health-Vulnerable Spaces in High-Rise Residential Areas of Xi’an. Buildings. 2025; 15(9):1538. https://doi.org/10.3390/buildings15091538
Chicago/Turabian StyleChen, Jiewen, Siqing Ma, Yuan Meng, Yu Liu, and Juan Ren. 2025. "Identification and Diagnosis of Wind Health-Vulnerable Spaces in High-Rise Residential Areas of Xi’an" Buildings 15, no. 9: 1538. https://doi.org/10.3390/buildings15091538
APA StyleChen, J., Ma, S., Meng, Y., Liu, Y., & Ren, J. (2025). Identification and Diagnosis of Wind Health-Vulnerable Spaces in High-Rise Residential Areas of Xi’an. Buildings, 15(9), 1538. https://doi.org/10.3390/buildings15091538