1. Introduction
China is a country dominated by carbonate karst. The total area of karst areas is 3.46 million km
2, accounting for one-third of the country’s land area. It is most widely distributed in Guangxi, Guizhou, and eastern Yunnan, making it one of the countries with the most extensive karst development in the world [
1,
2,
3]. With the rapid development of the country’s infrastructure, more projects such as bridges and roads may pass through complex karst areas. Pile foundations are widely used in karst projects due to their strong construction adaptability [
4,
5,
6,
7,
8,
9,
10,
11,
12,
13,
14,
15,
16]. However, due to the complexity and variability of karst geology, the existence of cavities will affect the bearing capacity and stability of pile foundations to varying degrees [
17]. Therefore, it is particularly important to study the vertical bearing characteristics of single-pile foundations in karst areas.
At present, many scholars have conducted in-depth research on the bearing characteristics of pile foundations in karst areas by means of experiments and theoretical analysis, and they have achieved fruitful results. In terms of experiments, Sheng et al. [
18] studied the influence of the height and span of the cavity on the bearing capacity of the pile foundation, discussed the destruction process of the rock mass at the top of the cavity, and conducted comparative verification with the help of numerical simulation; Zhang [
19] studied the bearing mechanism and destruction law of the pile foundation in the hidden cavity area with an inclined roof based on the model test and combined with the ABAQUS software platform subroutines UMAT and FRIC, and the author carried out a calculation method of the ultimate bearing capacity of an inclined cavity roof based on the Serrano calculation theory [
20,
21]; Lei et al. [
22] revealed the law of the change of the ultimate bearing capacity of the pile foundation with the height of the cavity and the destruction mode of the roof, and they concluded that bending of the pile foundation in the cavity type occurs. The minimum cavity height of the curve was 6 d, and the stability coefficient φ of the pile body under different cavity heights was given; Feng et al. [
23,
24] analyzed the influence trend of the geometric parameters of the underlying cavity on the ultimate bearing capacity of the bridge pile foundation in karst areas through numerical simulation, and on this basis, the metabolic GM (1,1) model was used to derive a high-precision prediction formula for the bearing capacity of the pile foundation; Wang et al. [
25] studied the influence of the cavity height and cavity length of the underlying cavity on the bearing size of a super-long pile foundation; Zhang et al. [
26] simulated working conditions such as different cavity radii, and they found that the calculated values of the Boxlucas1 model fit well with the test results and were suitable as a load transfer model for calculating the settlement of a single pile when traversing an unfilled cavity. In terms of theoretical analysis, N. Z. Gotman et al. [
27] proposed a method for calculating the bearing capacity of pile foundation acting on karst cavities, taking into account the deformation of the underlying roof. Zhang et al. [
28] simplified underlying roof structures into parabolic arch, circular arch, fixed beam, fixed bidirectional plate, and shell models; they proposed calculation methods for the minimum safe bending thickness of the roof model and discussed the influence of the spatial form of the karst cavity and the tensile strength of limestone on the failure mode and minimum safe thickness of the roof. Zhao et al. [
29] derived the limiting conditions for the karst cavity to be free of failure, roof collapse, and shear failure based on the pile end failure mode and the positional relationship between the pile and the cavity, and they derived the calculation formulas for the ultimate bearing capacity of the pile end under the three conditions. Hu et al. [
30] established a load transfer model for the pile side and pile end for pile foundations with underlying karst cavities, taking into account the hardening or softening characteristics of the rock mass on the pile side and the influence of the sediment at the pile bottom on the bearing capacity, and they derived the settlement–load relationship that can determine the vertical bearing capacity of the pile foundation according to the settlement of the pile top.
In summary, the current research on the bearing characteristics of pile foundations in karst areas is all aimed at underlying or crossing cavities, and there are few studies on the coexistence of underlying cavities and beaded cavities. In addition, the cavities and piles are considered coaxial, and the influence of the underlying eccentric cavities on the bearing of pile foundations has not been considered. The load transfer law of pile foundations in relation to working conditions is still unclear. In view of this, this paper selects appropriate simulation materials based on similarity theory, truly restores the actual working conditions, and carries out model tests on the vertical bearing characteristics of single-pile foundations in karst areas. The load–settlement curves, pile axial forces, and average side friction resistance distribution diagrams of pile foundations under three working conditions are examined: underlying caves, underlying eccentric caves (eccentricity of 2.5 d), and the coexistence of beads and underlying caves are studied in depth. With the help of the finite element analysis software ABAQUS and relevant parameters of the model test, a numerical model is established to expand the study on the sensitivity of the ultimate bearing capacity of the pile foundation to the eccentricity of the underlying cave, and the influence of the backfilling of the underlying caves and beaded caves on the ultimate bearing capacity of the pile foundation, pile settlement, and pile lateral friction resistance is discussed in order to provide a reference for the design of karst pile foundations and a reference for the actual stress conditions of pile foundations under complex karst geology.
2. Indoor Model Test
2.1. Test Plan Design
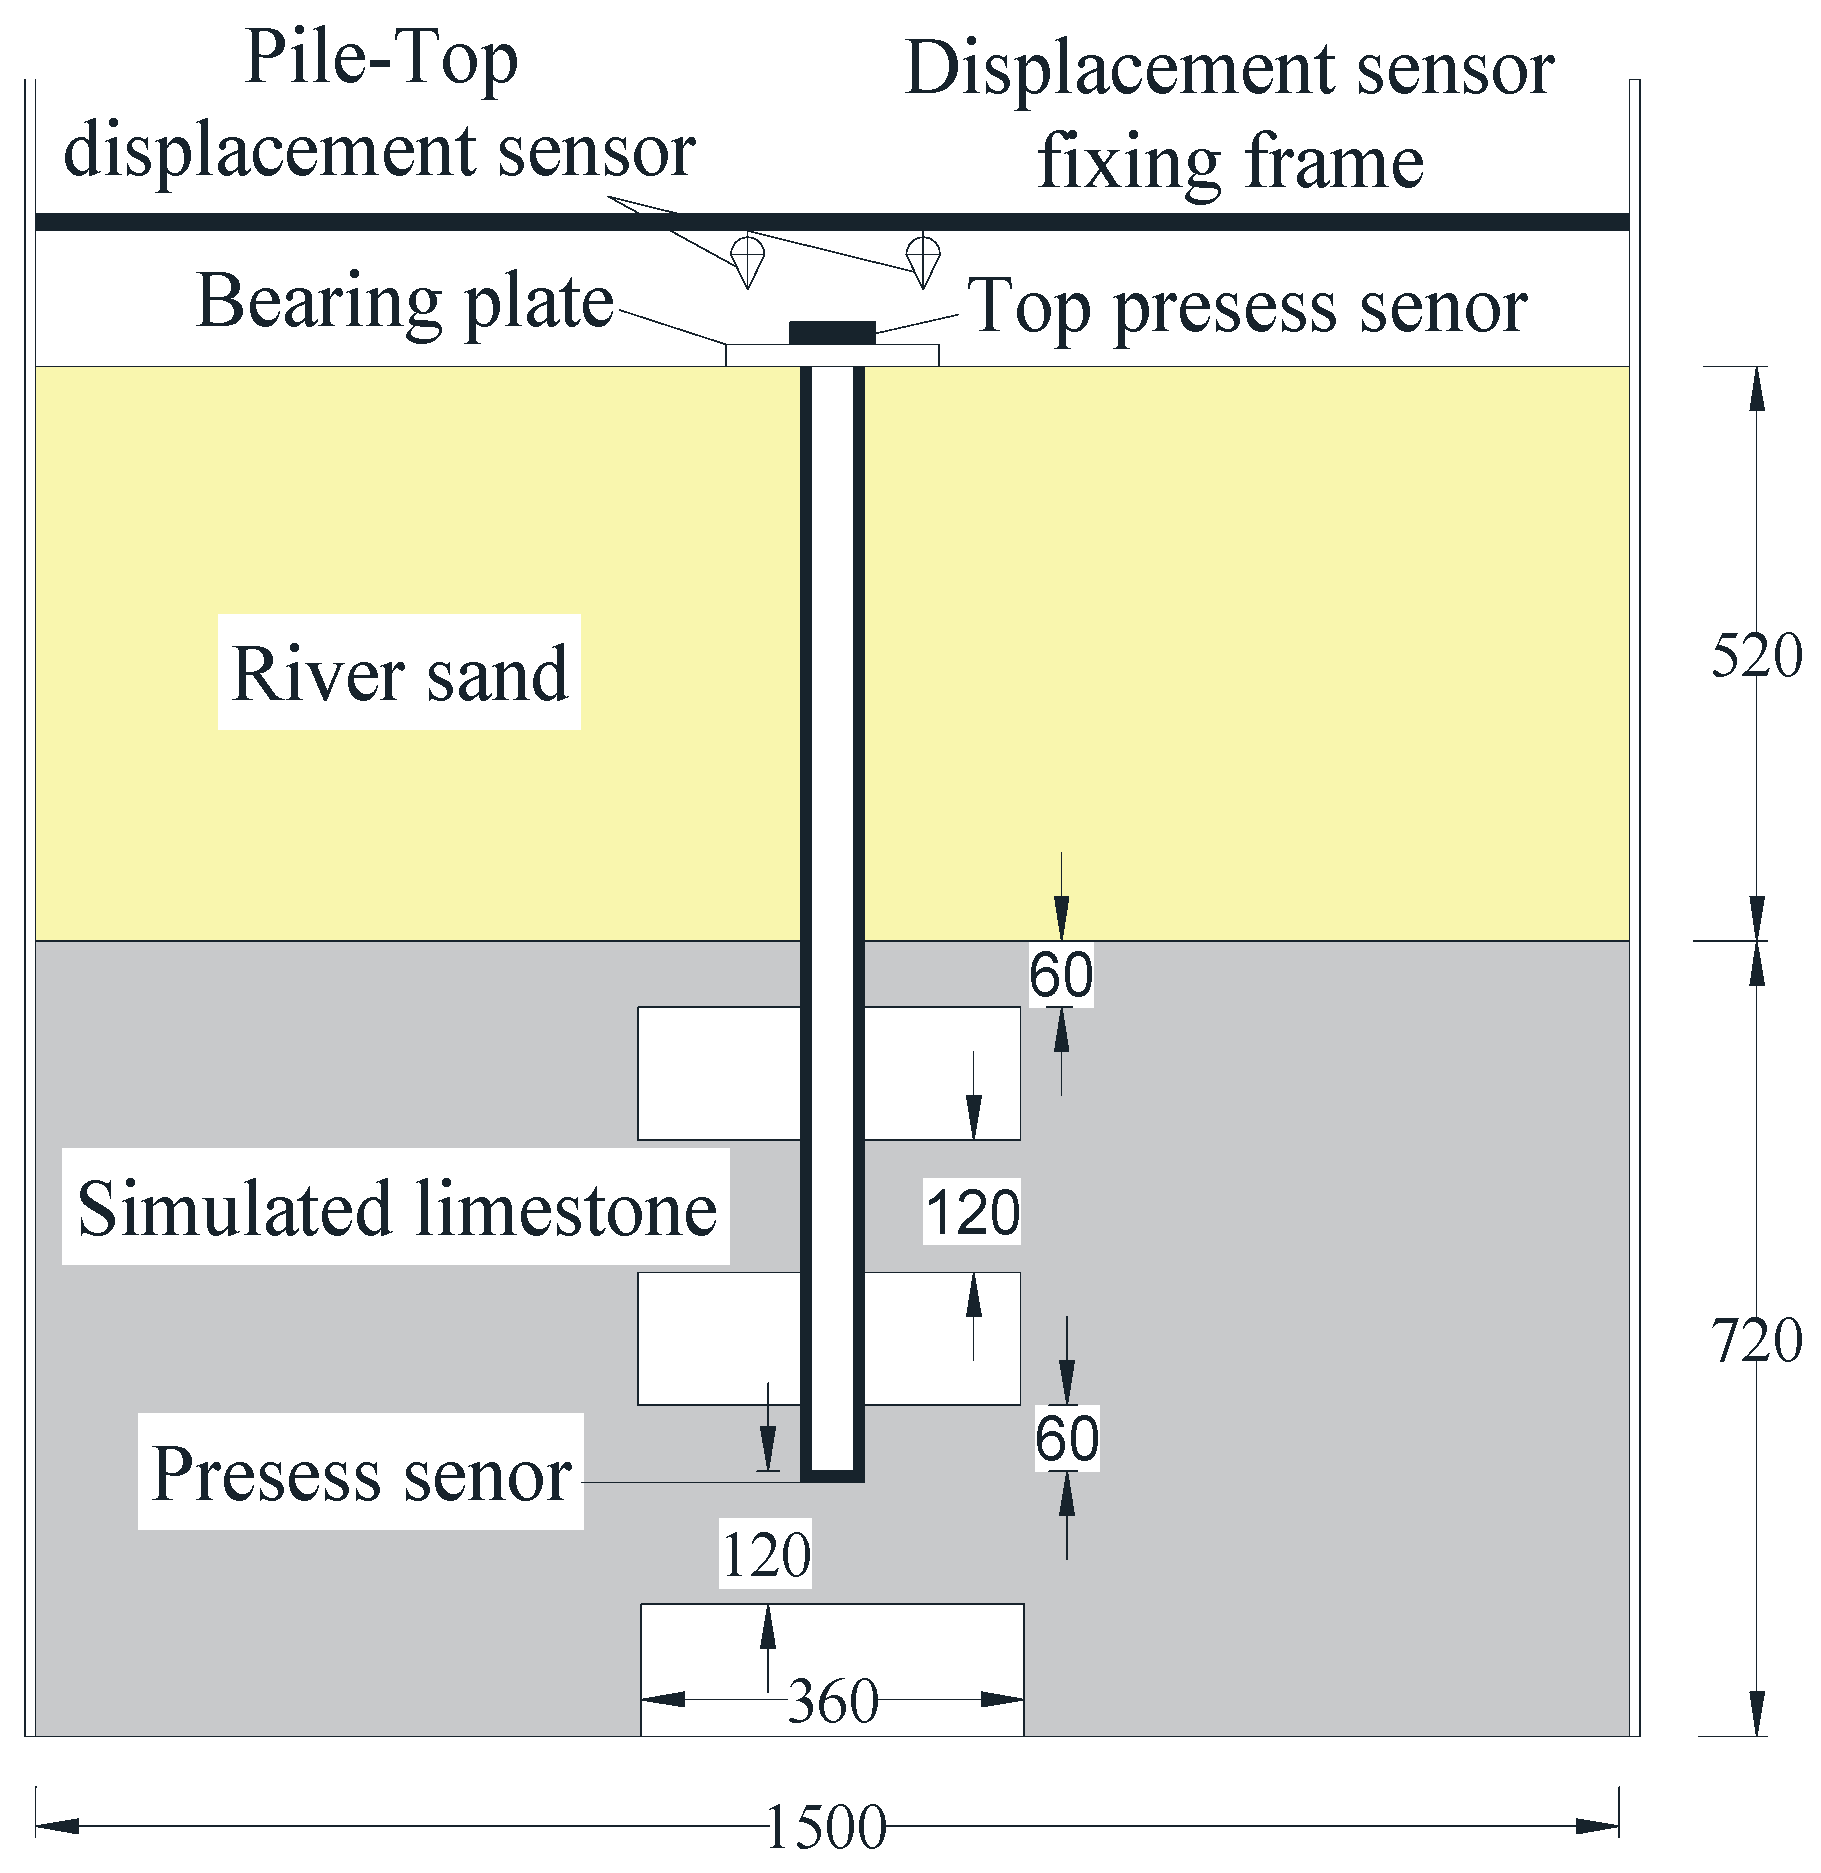
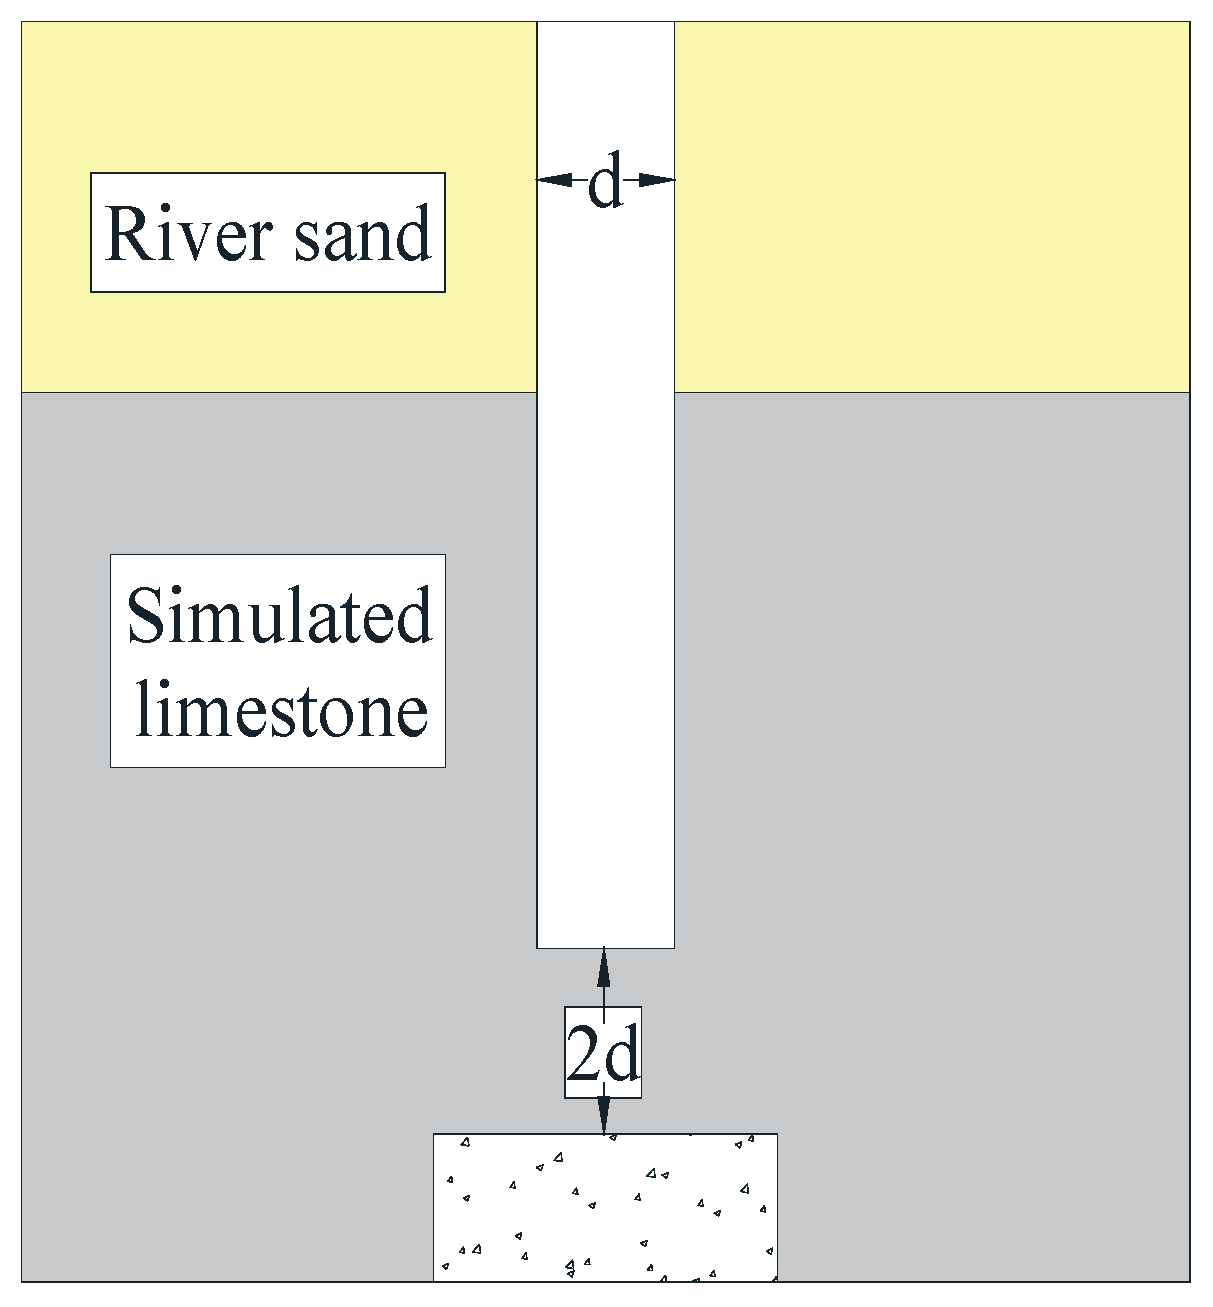
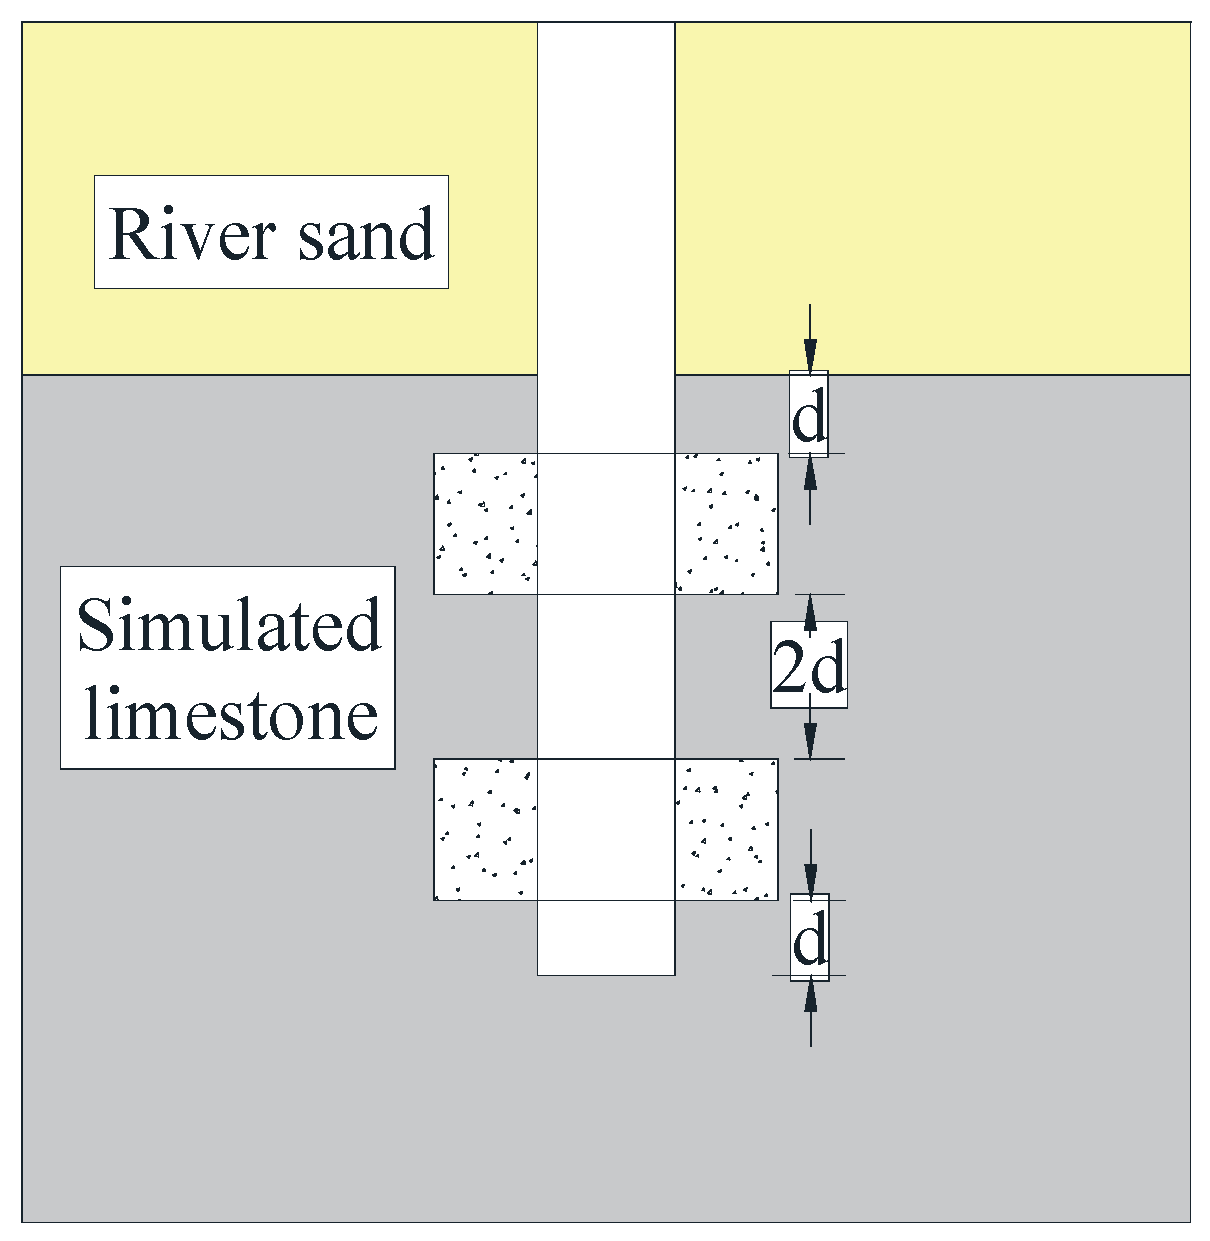
The size of the model box used in the test was 1.5 m × 1.5 m × 1.5 m. According to the similarity theory and the size of the model box, the geometric similarity ratio was selected as 1:20. The diameter d of the model pile was 60 mm, and the length L was 1 m; the depth of the simulated stratum overburden was 0.52 m, and the depth of the simulated limestone was 0.72 m; the height of the underlying cavity was 2 d (120 mm), the diameter was 6 d (360 mm), the distance between the pile end and the cavity top was 120 mm, that is, the thickness of the underlying roof was 2 d, and the eccentricity of the eccentric cavity (the distance between the pile center and the cavity center) was 2.5 d (150 mm).
2.1.1. Model Pile Design
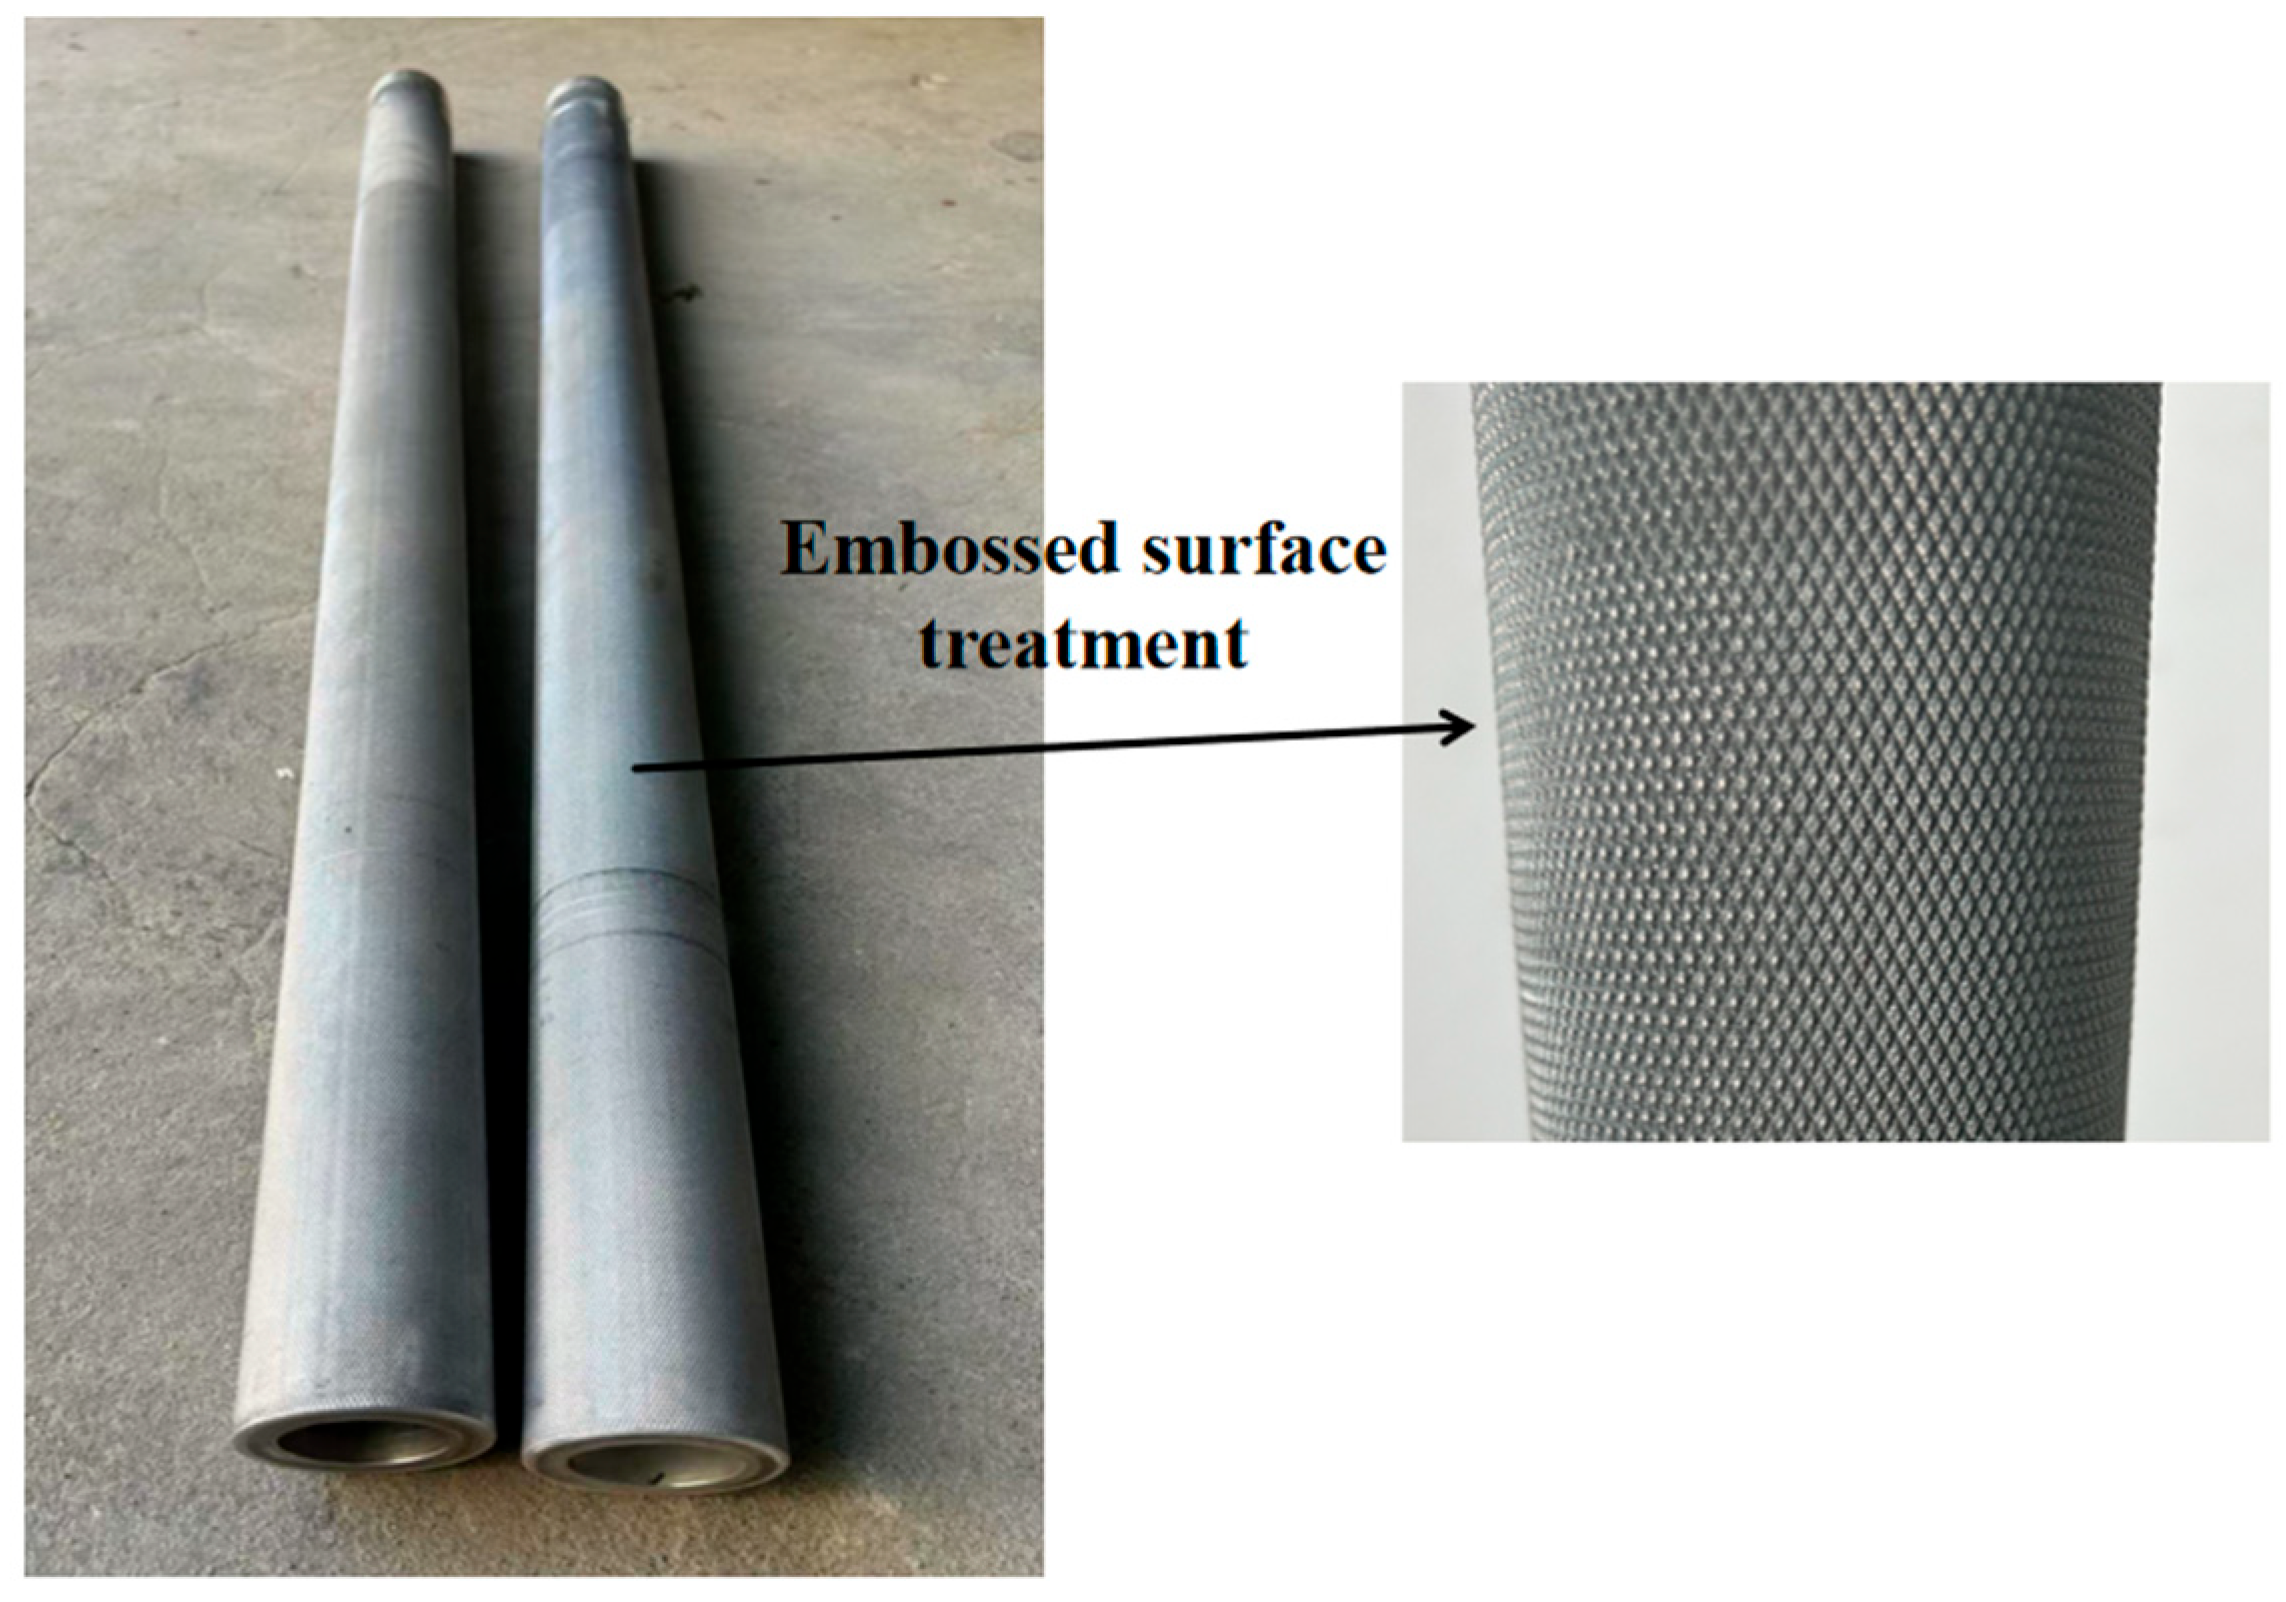
The model pile was simulated by an aluminum–magnesium alloy tube with an elastic modulus of 40 GPa and a wall thickness of 2 mm. In order to better restore the vertical load transfer process of the pile foundation in actual working conditions, the surface of the aluminum–magnesium alloy tube was embossed to increase the friction, as shown in
Figure 1.
2.1.2. Simulated Geotechnical Layer Design
Since there are many types of overlying soil layers in actual engineering, but the friction that the soil can provide is very limited, in order to improve the convenience of the test, the multiple soil layers were simplified into one layer, and the parameters of the soil layers were processed using the weighted average method. Finally, fine river sand was selected for simulation based on similar proportions. For the simulated limestone, after comparing the literature and combining with the actual situation, different proportions of water, fine sand, cement, plaster of Paris, and light calcium carbonate were selected for preparation. The specific mix ratio was fine sand:cement:plaster of Paris:light calcium carbonate = 1:0.15:0.1:0.08, and the water content was 25%.
2.1.3. Simulated Cavity Design
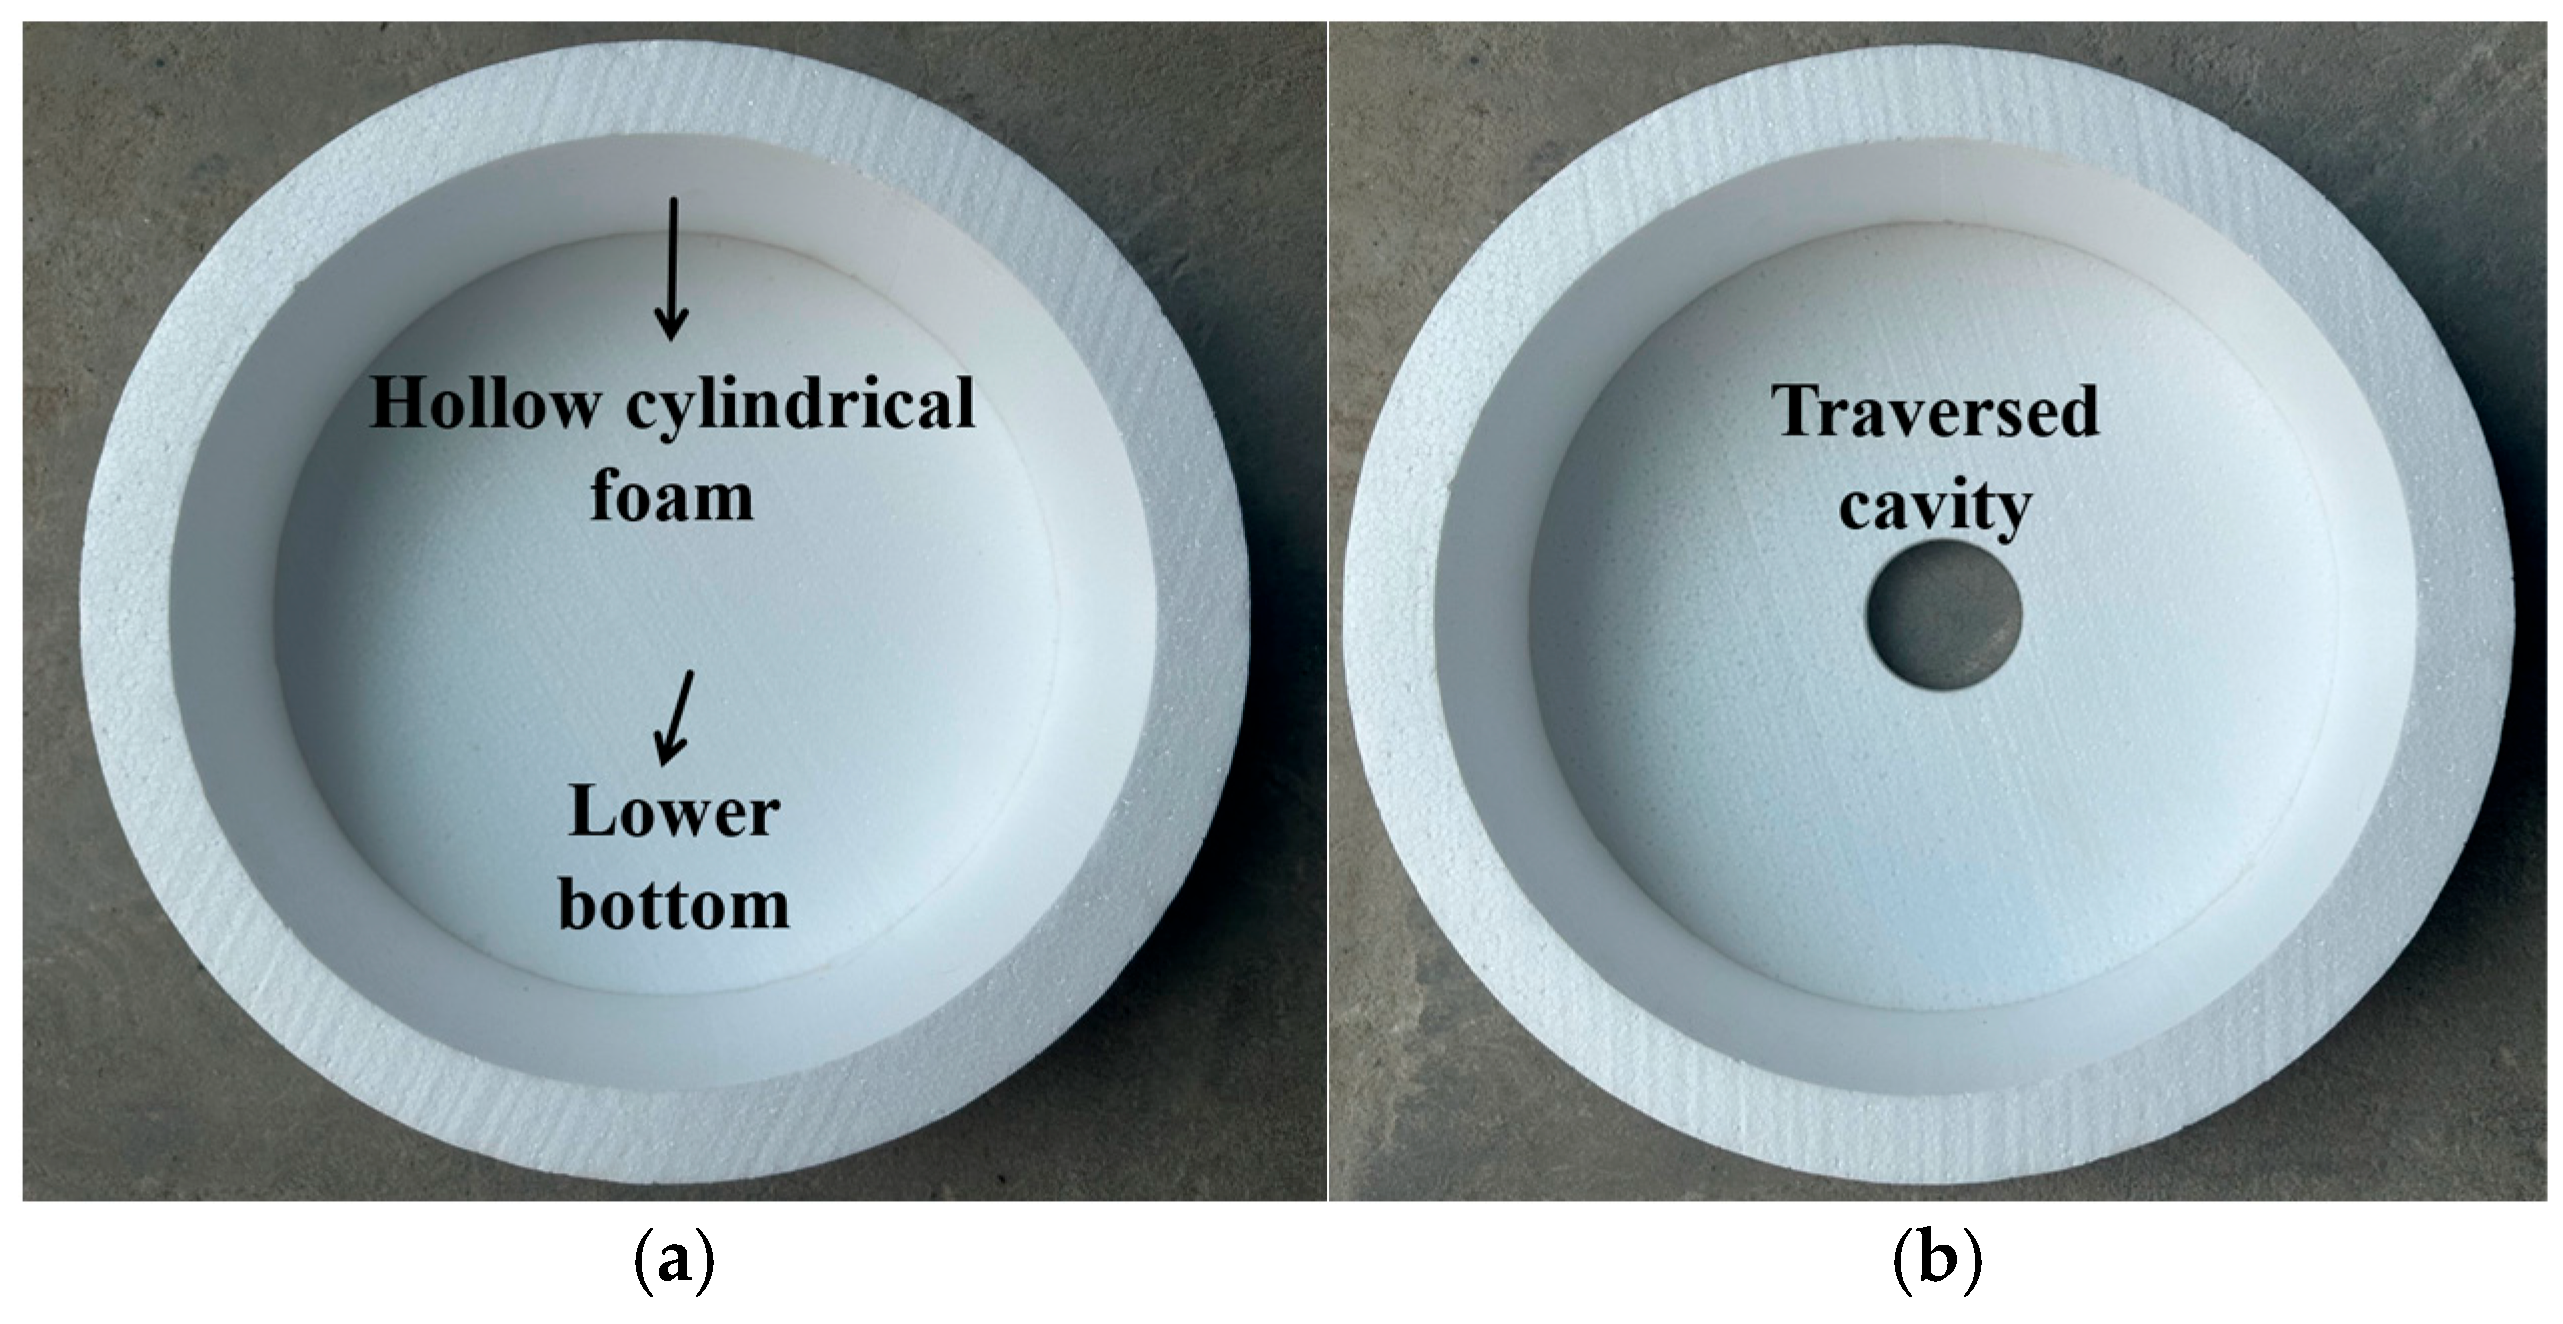
High-density EPS foam was selected to simulate the cave, which was in the form of a regular hollow cylinder. The strength of the foam could be ignored compared to the bedrock, that is, the cave area was regarded as a complete cavity. It was divided into an upper bottom, a lower bottom, and a hollow part. When in use, it can be glued with foam glue and placed in the corresponding position; for the traversed karst cavity, a 60 mm hole was reserved in the center of the upper and lower bottoms of the foam to facilitate the passage of the pile foundation. The internal diagram is shown in
Figure 2.
2.2. Loading and Testing the System
2.2.1. Test Loading System
A fully automated servo control system was used for loading in the model tests. The system includes a control box, a hydraulic station, and 10 t jack and oil pipes. The maximum pulling pressure of the jack is 100 kN, and the loading stroke is 200 mm.
2.2.2. Pile Top (End) Load Measurement
A pressure sensor was placed between the hydraulic jack and the pile top pressure plate to measure the pile top load; the pile end reaction force was measured by a spoke-type pressure sensor embedded in the pile end. The sensor is in the shape of a round pancake with a diameter of 60 mm, which is exactly the same as the pile diameter. Both sensors have a range of 30 kN and an accuracy of 0.01 kN and are equipped with a digital display to read the value in real time.
2.2.3. Pile Top Settlement Measurement
The pile top settlement was measured by a BL-100NMZ laser displacement sensor (Zhejiang Jiou Technology Co., Ltd., Hangzhou, China) with a measuring range of 100 mm. It was symmetrically arranged on both sides of the pile top pressure plate and reliably connected to the crossbeam through a movable table seat. It could be moved as required. The overall layout of the test is shown in
Figure 3.
2.2.4. Axial Force and Side Friction Measurement
The bearing capacity of a pile foundation is composed of the side friction of the pile and the pile end resistance [
31]. The strain at the pile foundation cross-section measured by the resistance strain gauge (BX120-10AA resistance strain gauge (Chengdu DianCe Sensor Technology Co., Ltd., Chengdu, China)) arranged on the pile body can be used to calculate the axial force at the cross section through Formula (1). The average side friction resistance of a pile unit can be calculated from the axial forces at both ends of the unit through Formula (2).
where
is the axial force at section i;
E is the elastic modulus of the pile;
is the average strain value measured at two symmetrical points at section i; and A is the cross-sectional area of the pile.
where
is the average side friction of the unit;
and
are the axial forces of two adjacent sections;
d is the pile diameter; and
is the distance between the two sections.
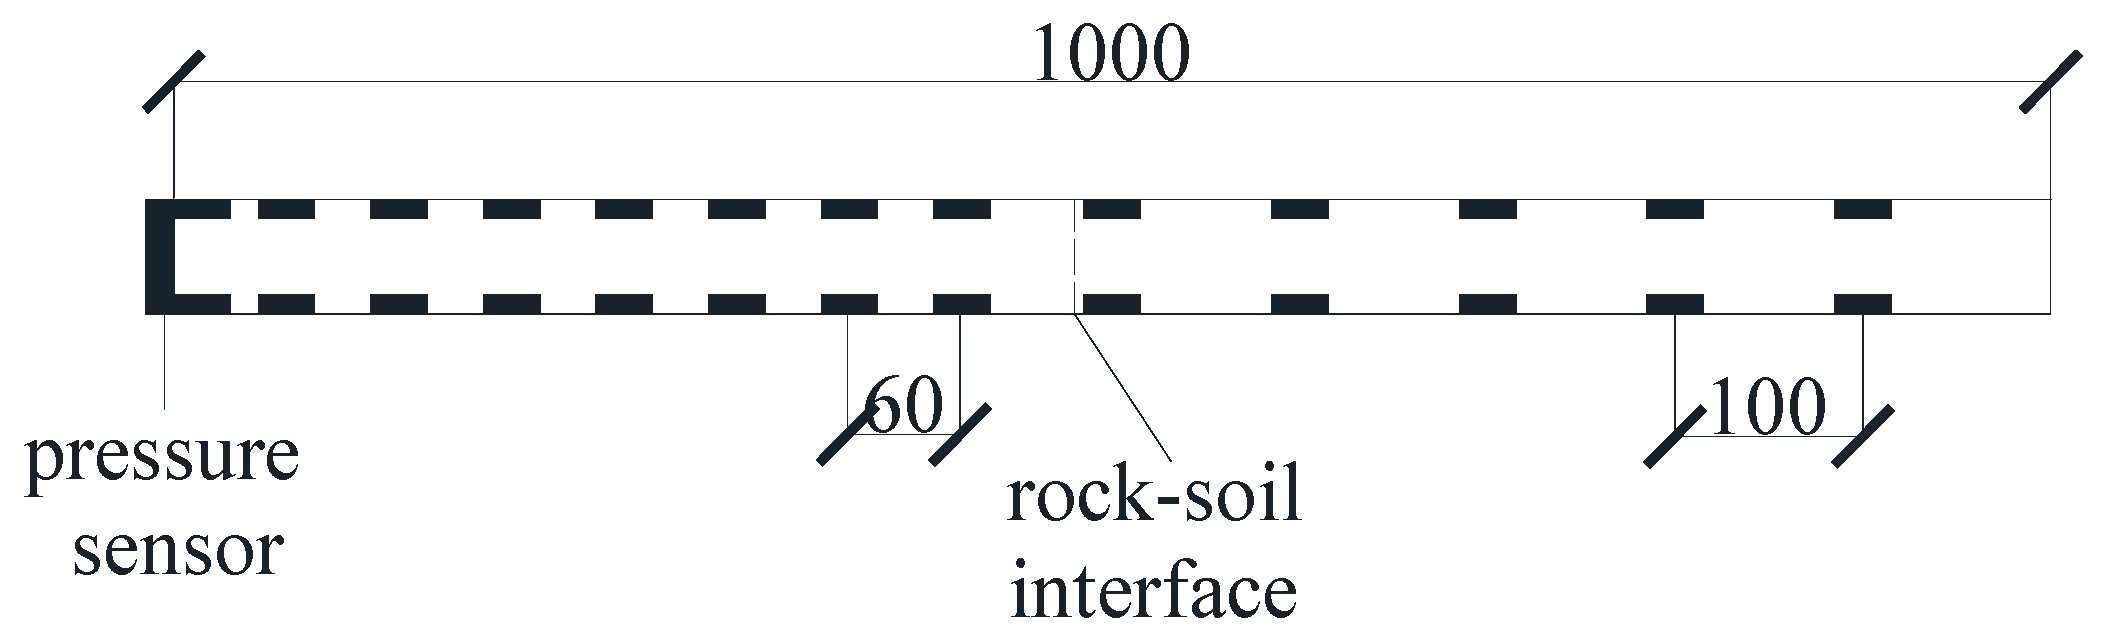
The arrangement of strain gauge measuring points is shown in
Figure 4. The rock layer strain gauges were symmetrically posted every 6 cm and the sand layer every 10 cm. The pile body layout is shown in
Figure 5.
2.3. Test Loading Scheme
Referring to the Technical Specification for Building Foundation Pile Testing (JGJ 106-2014) [
32], the slow-maintained load method was used to load the piles in 14 levels. Before loading, numerical simulation was used to estimate the ultimate bearing capacity of the pile top under each working condition. Each level of load was set at 1–2 kN. The displacement sensor was read every 5 min. When the displacement change of the pile top under each level of load was less than 0.01 mm/5 min or the cumulative change did not exceed 0.1 mm/h, the next level of loading could be performed. The loading termination condition was the sudden destruction of the top plate, that is, when the pile foundation sank rapidly, and the loading system suddenly unloaded.
2.4. Results and Analysis
2.4.1. Load–Settlement Curve
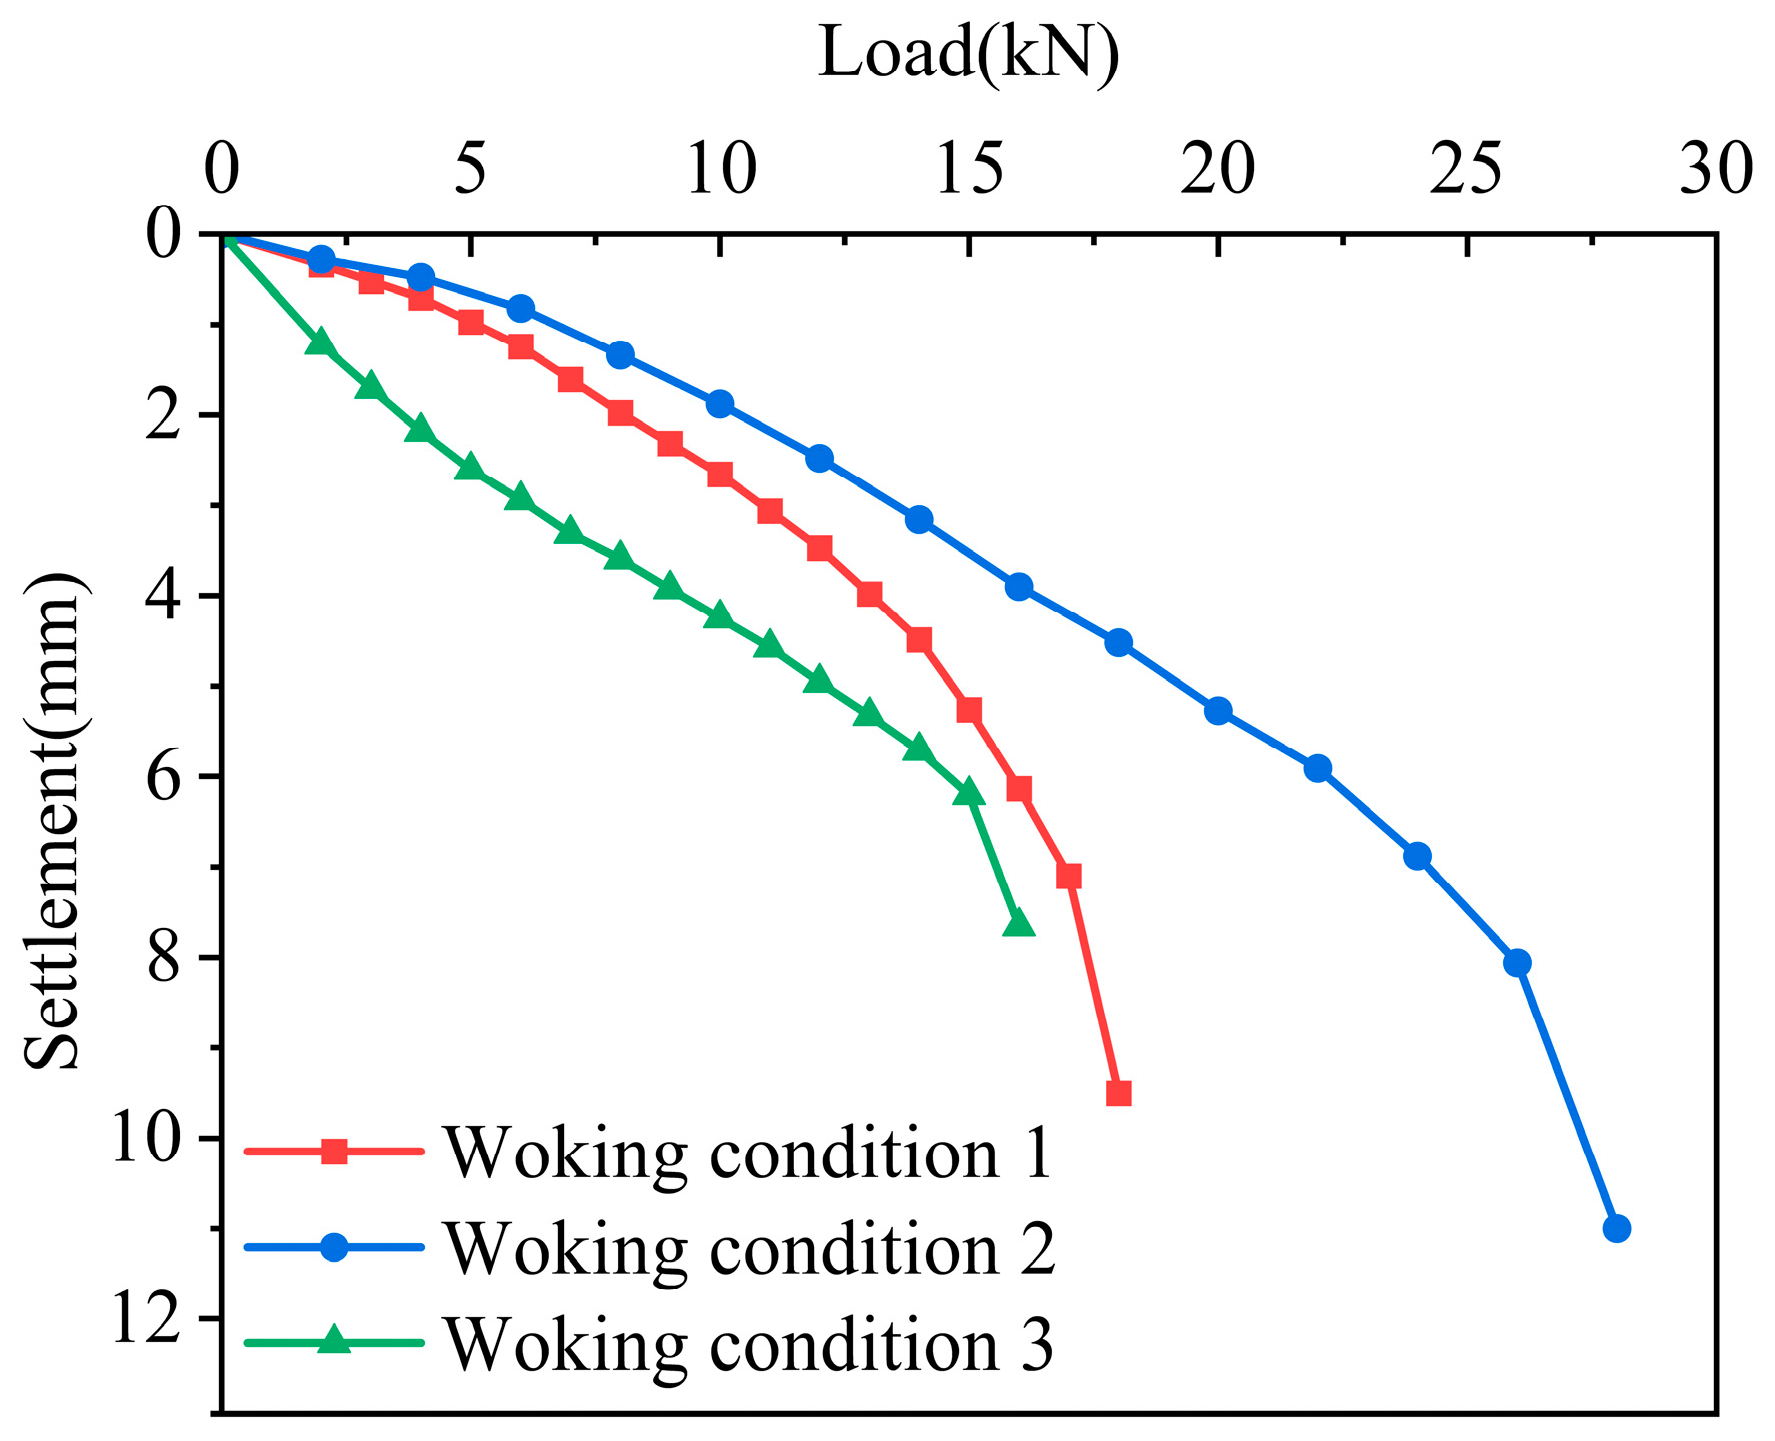
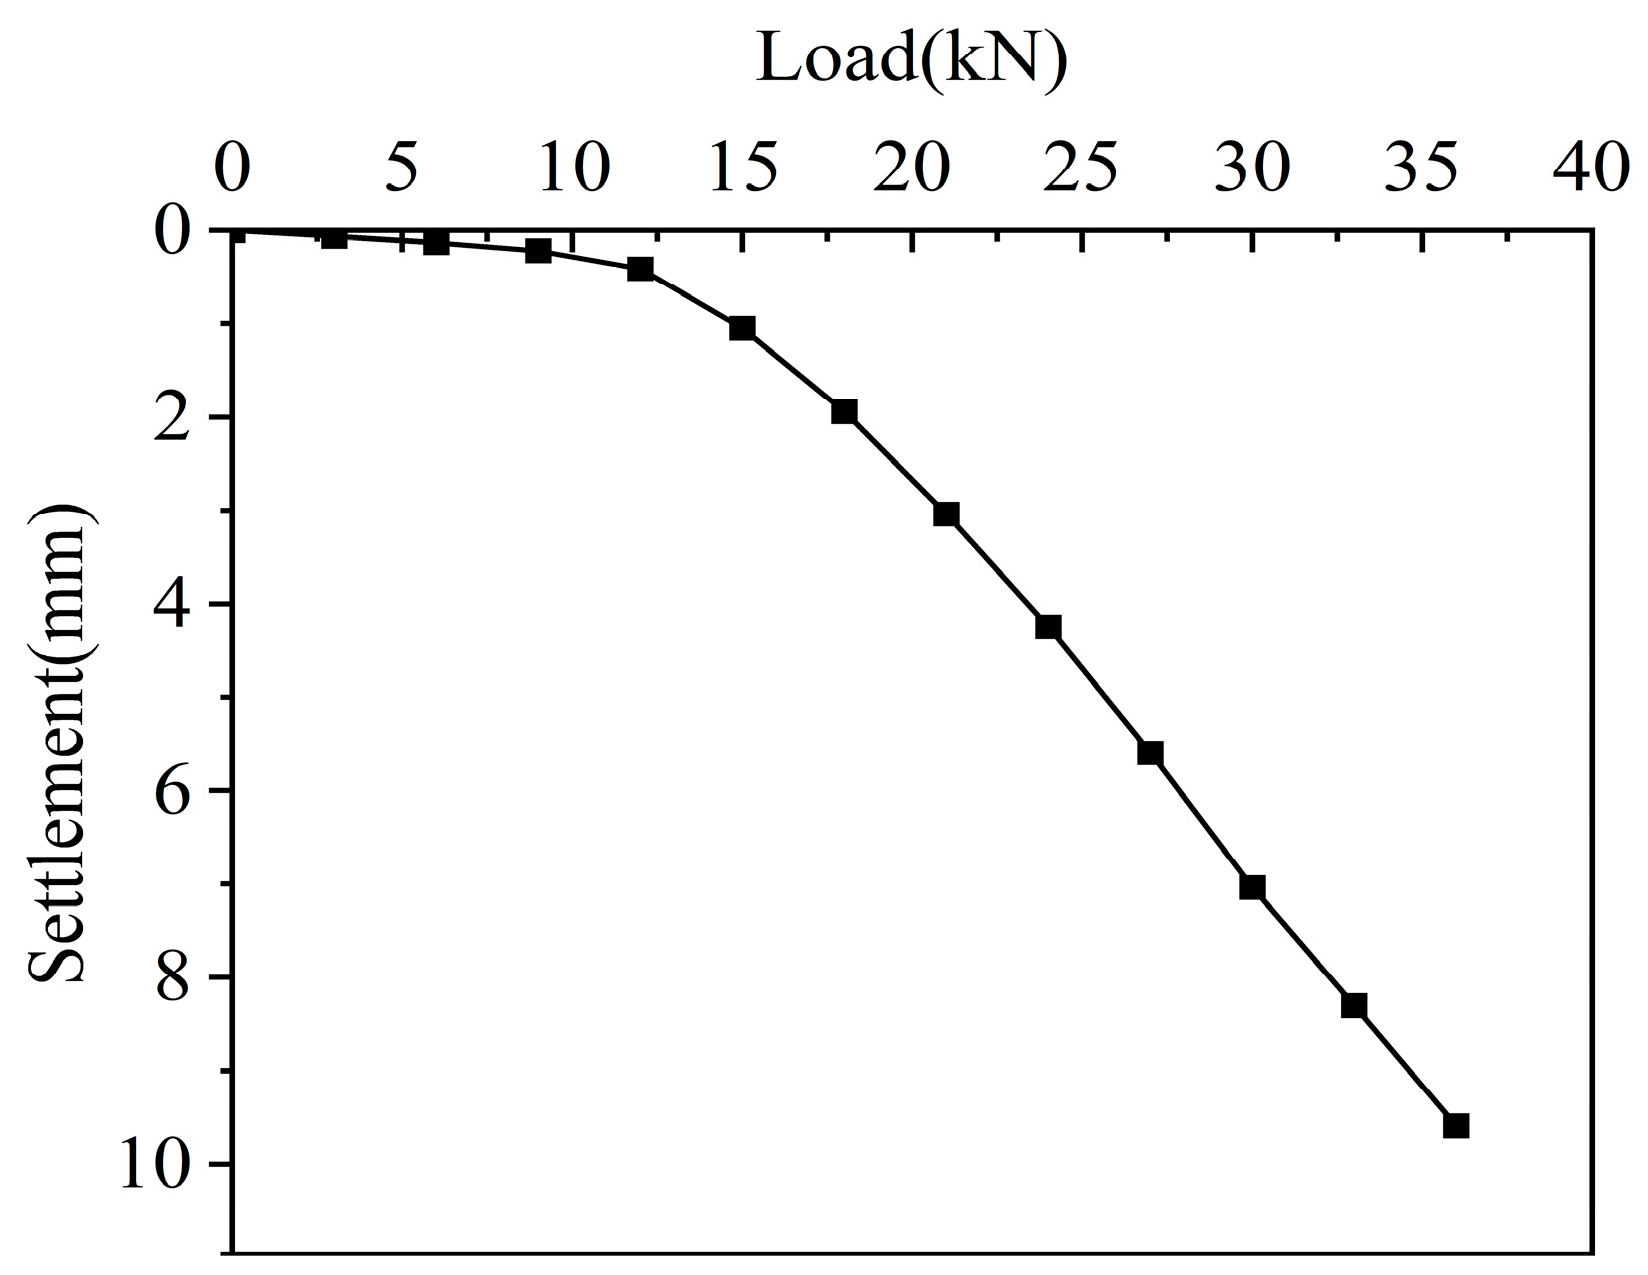
Figure 6 shows the load–settlement curves of the pile foundation under three conditions: underlying cavity (condition 1), underlying eccentric cavity (condition 2), and coexistence of beads and underlying cavity (condition 3). It can be seen from the figure that under the three conditions, the settlement of the pile top increased with the increase in load. The curve trends of conditions 1 and 2 are roughly the same. For condition 3, due to the existence of the beaded cavity, the instability of the pile body increased, and the settlement of the pile top became larger under various loads. The presence of the underlying cavity at the pile end caused the load–settlement curves of the pile foundation to exhibit steep deformations. The load corresponding to the point just before the abrupt change is considered the ultimate bearing capacity of the pile top. The ultimate bearing capacities of the three working conditions were found to be 17 kN, 26 kN, and 15 kN, respectively. It could be obtained that when the eccentricity of the underlying karst cavity reached 2.5 d, that is, the pile end acted on the edge of the underlying top plate, the ultimate bearing capacity of the pile foundation was increased by about 53%, and this improvement effect is significant; the existence of the beaded karst cavity had a relatively small effect on the ultimate bearing capacity of the pile foundation. The working condition with the beaded karst cavity was about 12% lower than that with only the underlying karst cavity.
The reasons for the changes in the ultimate bearing capacity of pile foundations under three working conditions are discussed here. For working conditions 1 and 2, when the deviation between the center of the cave and the center of the pile is large, the influence range of the cave on the pile foundation will be reduced. The closer the pile is to the edge of the top plate, the smaller the range of the rock mass at the bottom of the pile will be in the air, the more stable the rock mass at the pile end, and the greater the bearing capacity that the rock mass at the pile end can withstand. For working conditions 1 and 3, since the through-type cave mostly affects the stability of the pile body and the lateral friction resistance of the pile body, the lack of rock mass in the cave section leads to a decrease in the overall pile–rock lateral friction resistance, which reduces the ultimate bearing capacity within a certain range.
2.4.2. Pile Axial Force and Side Friction
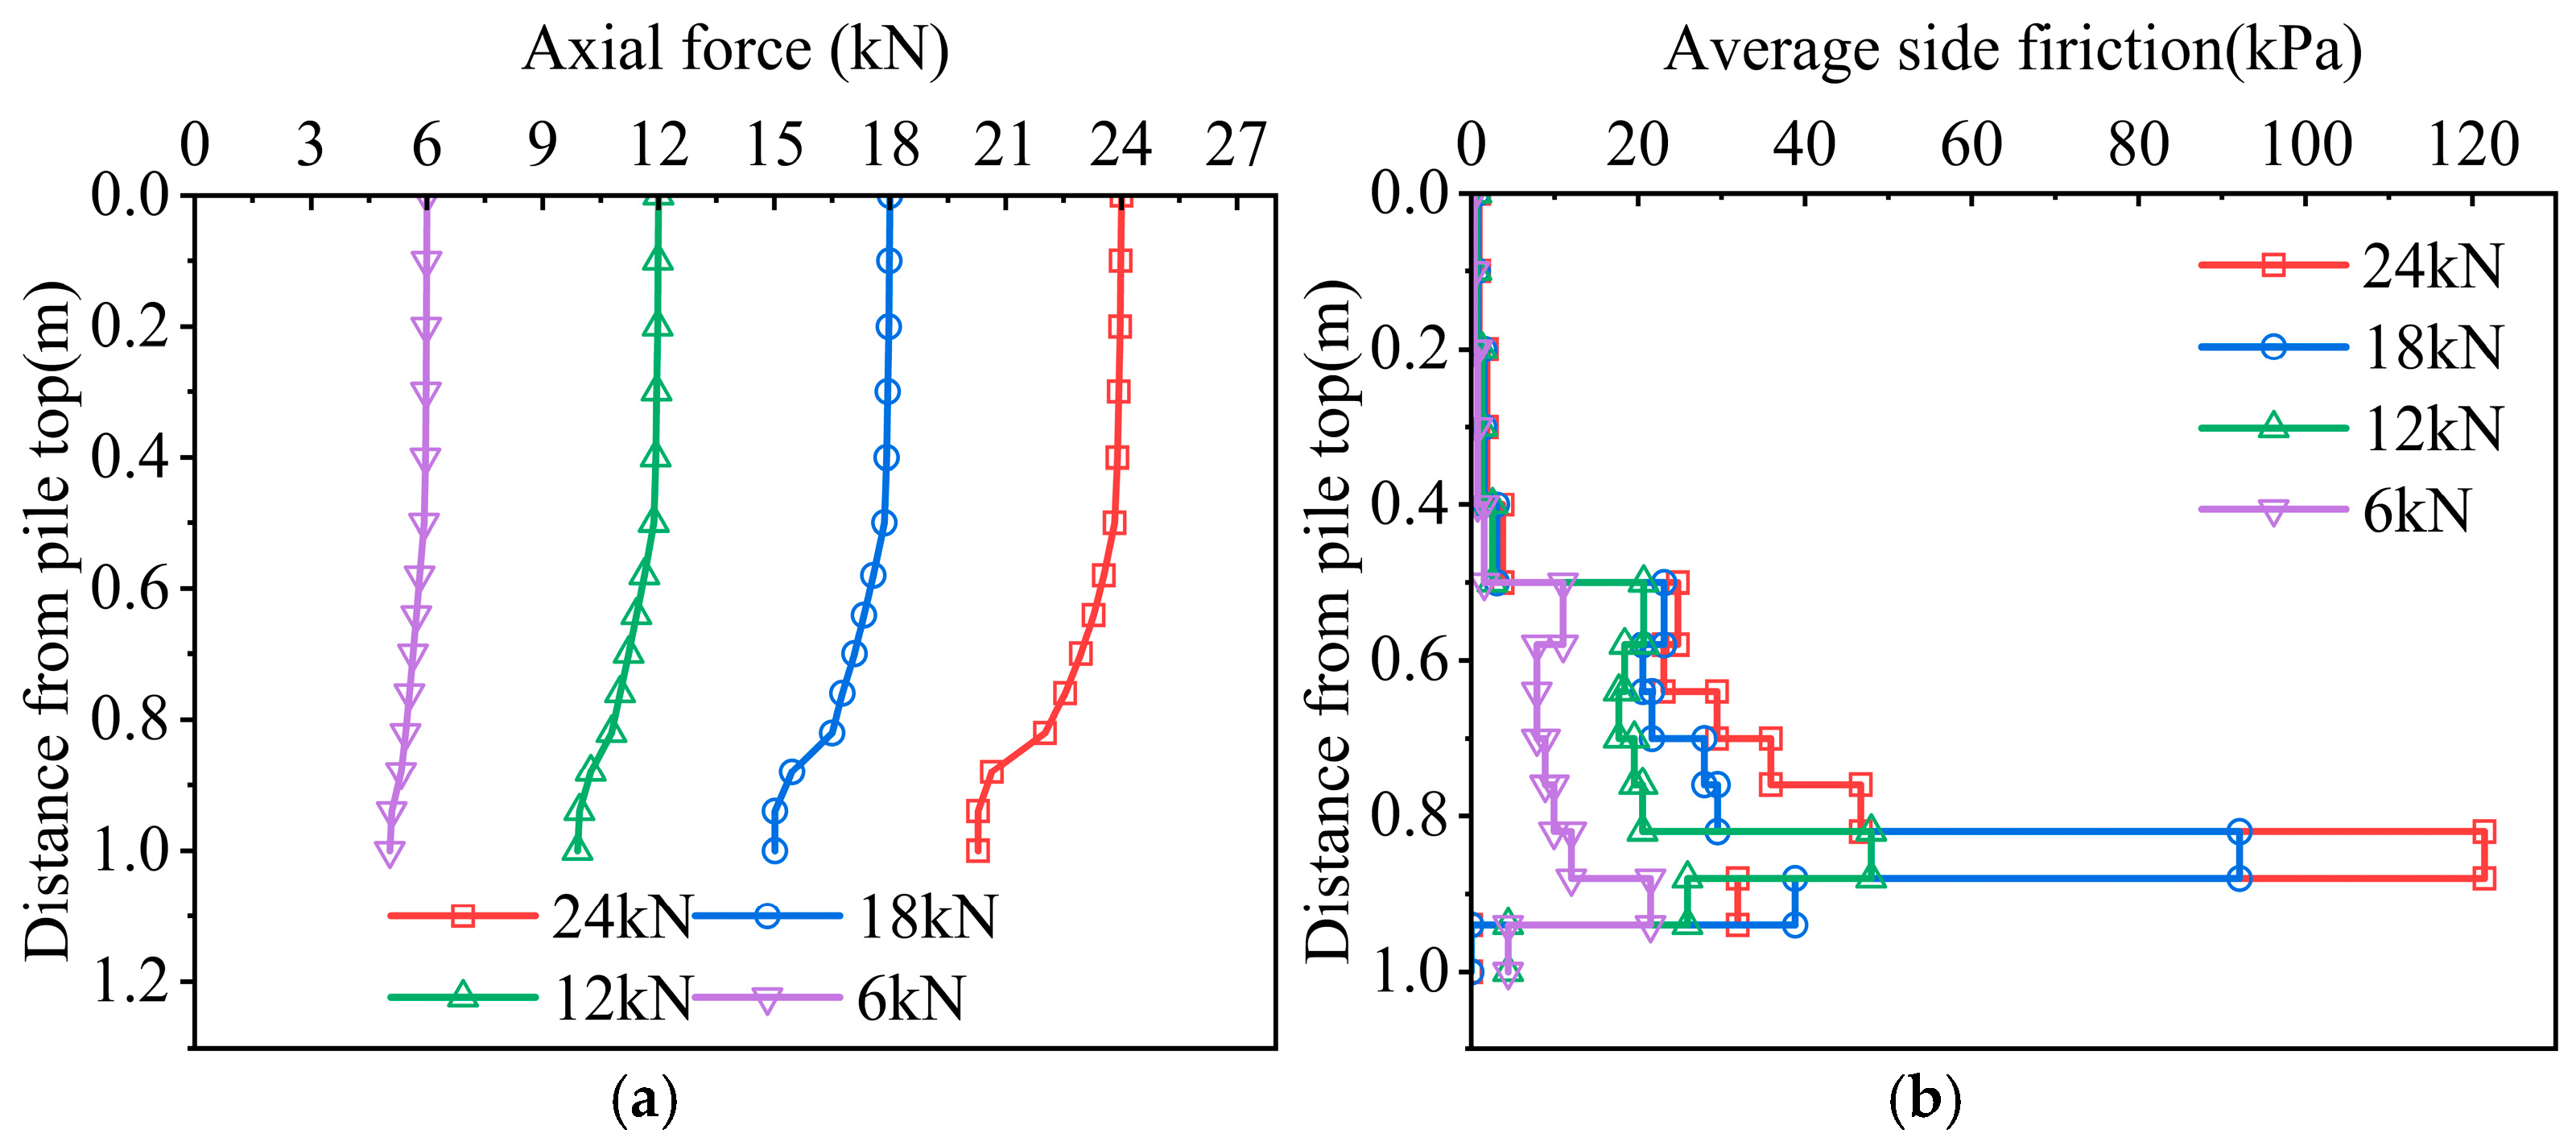
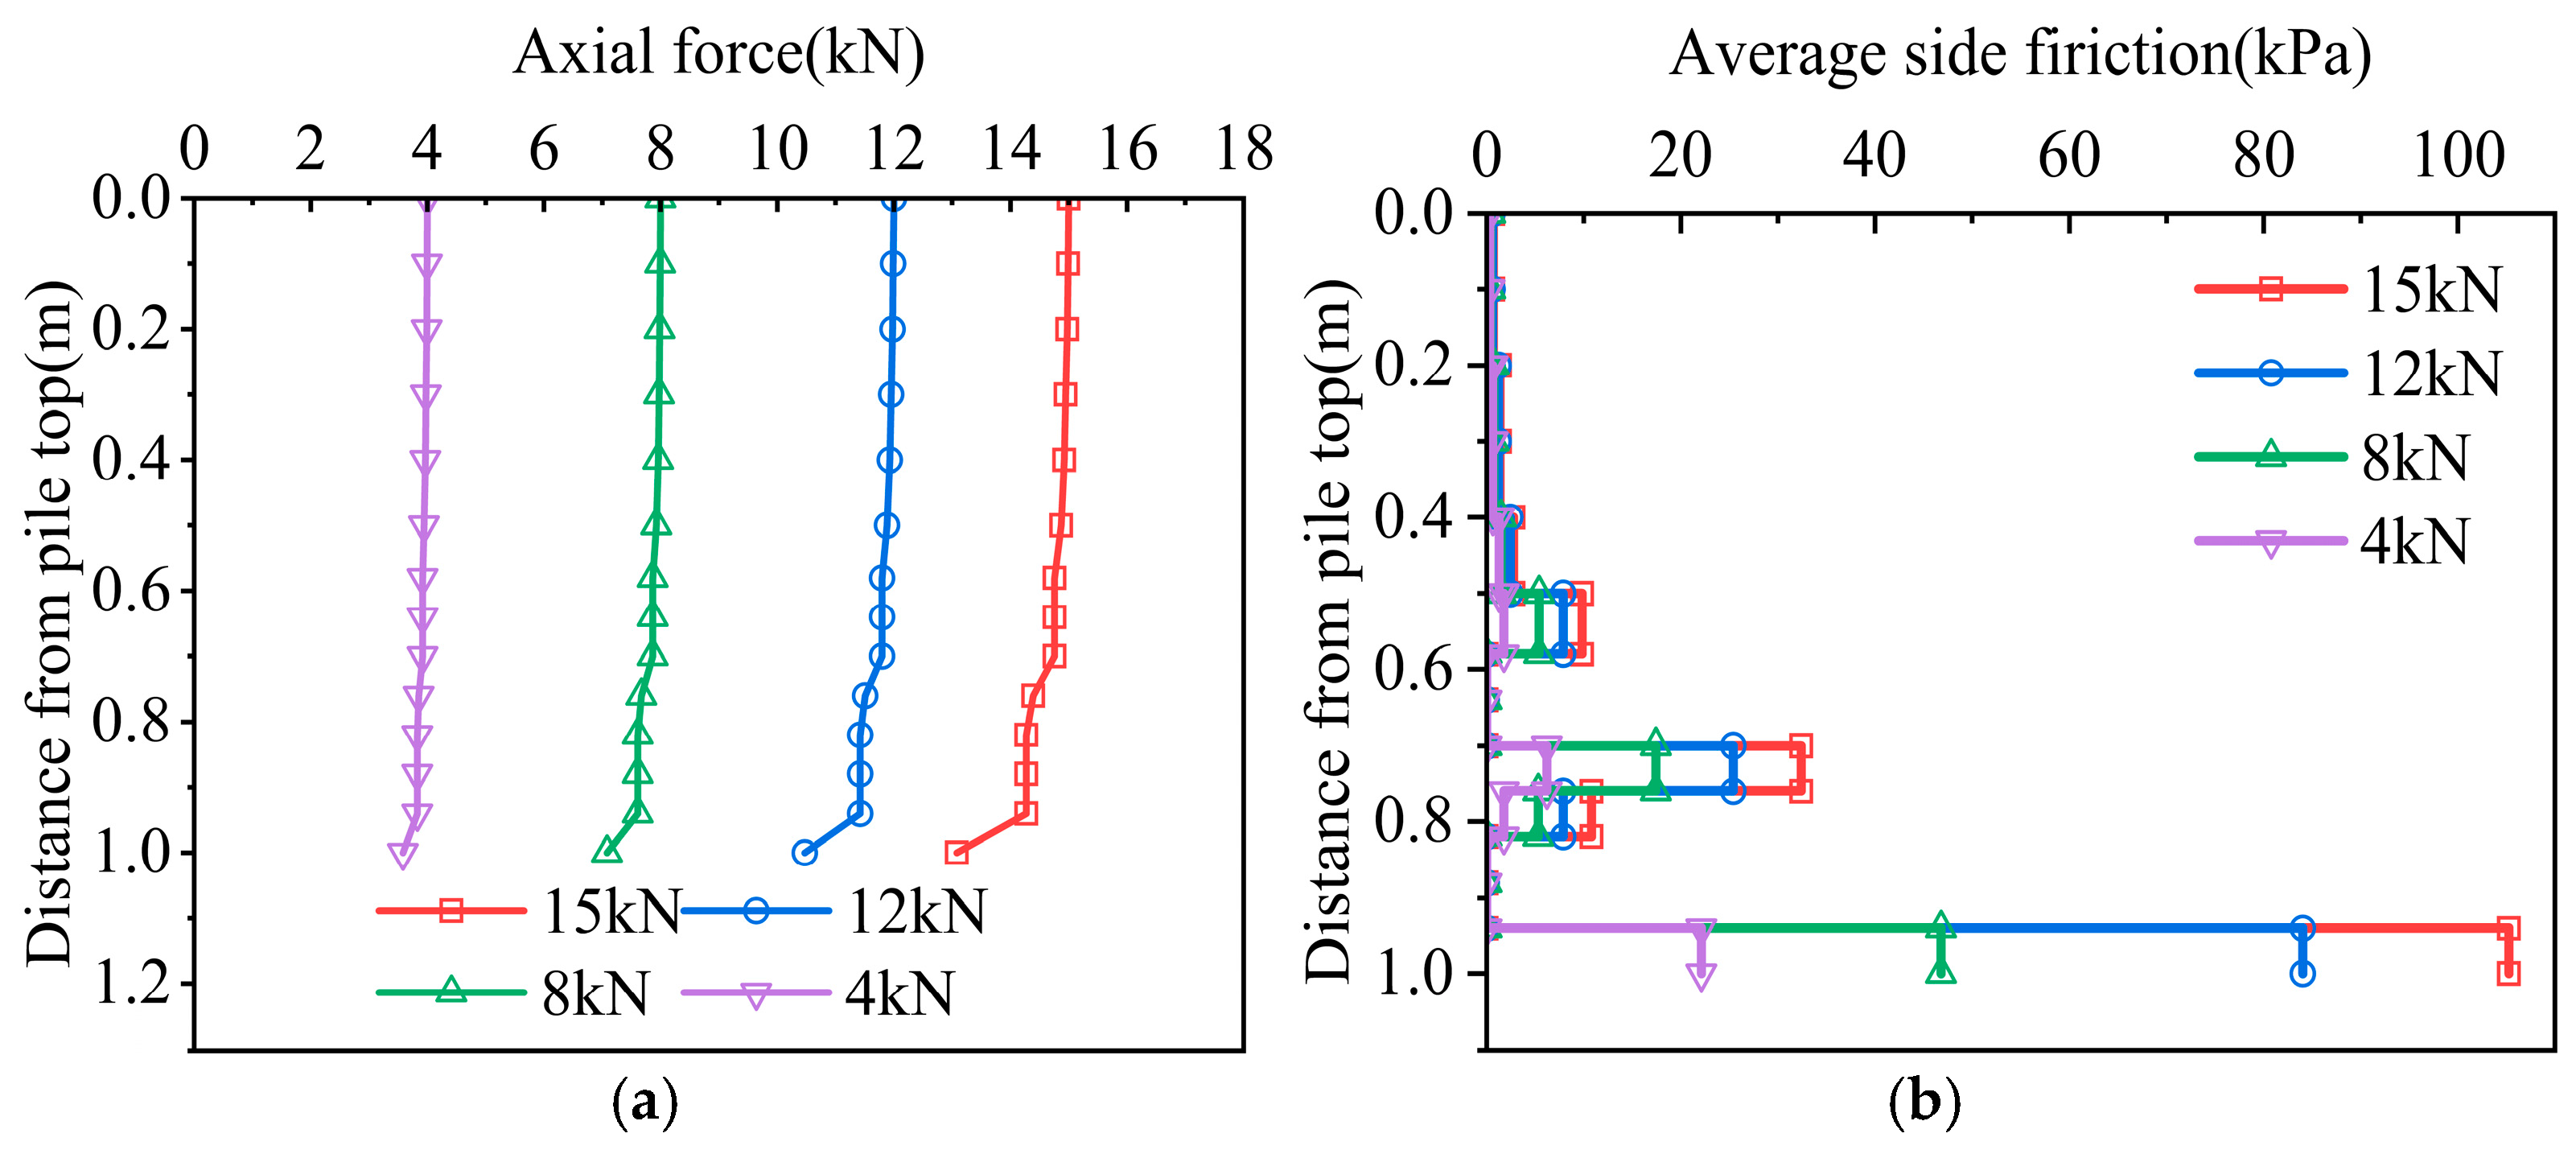
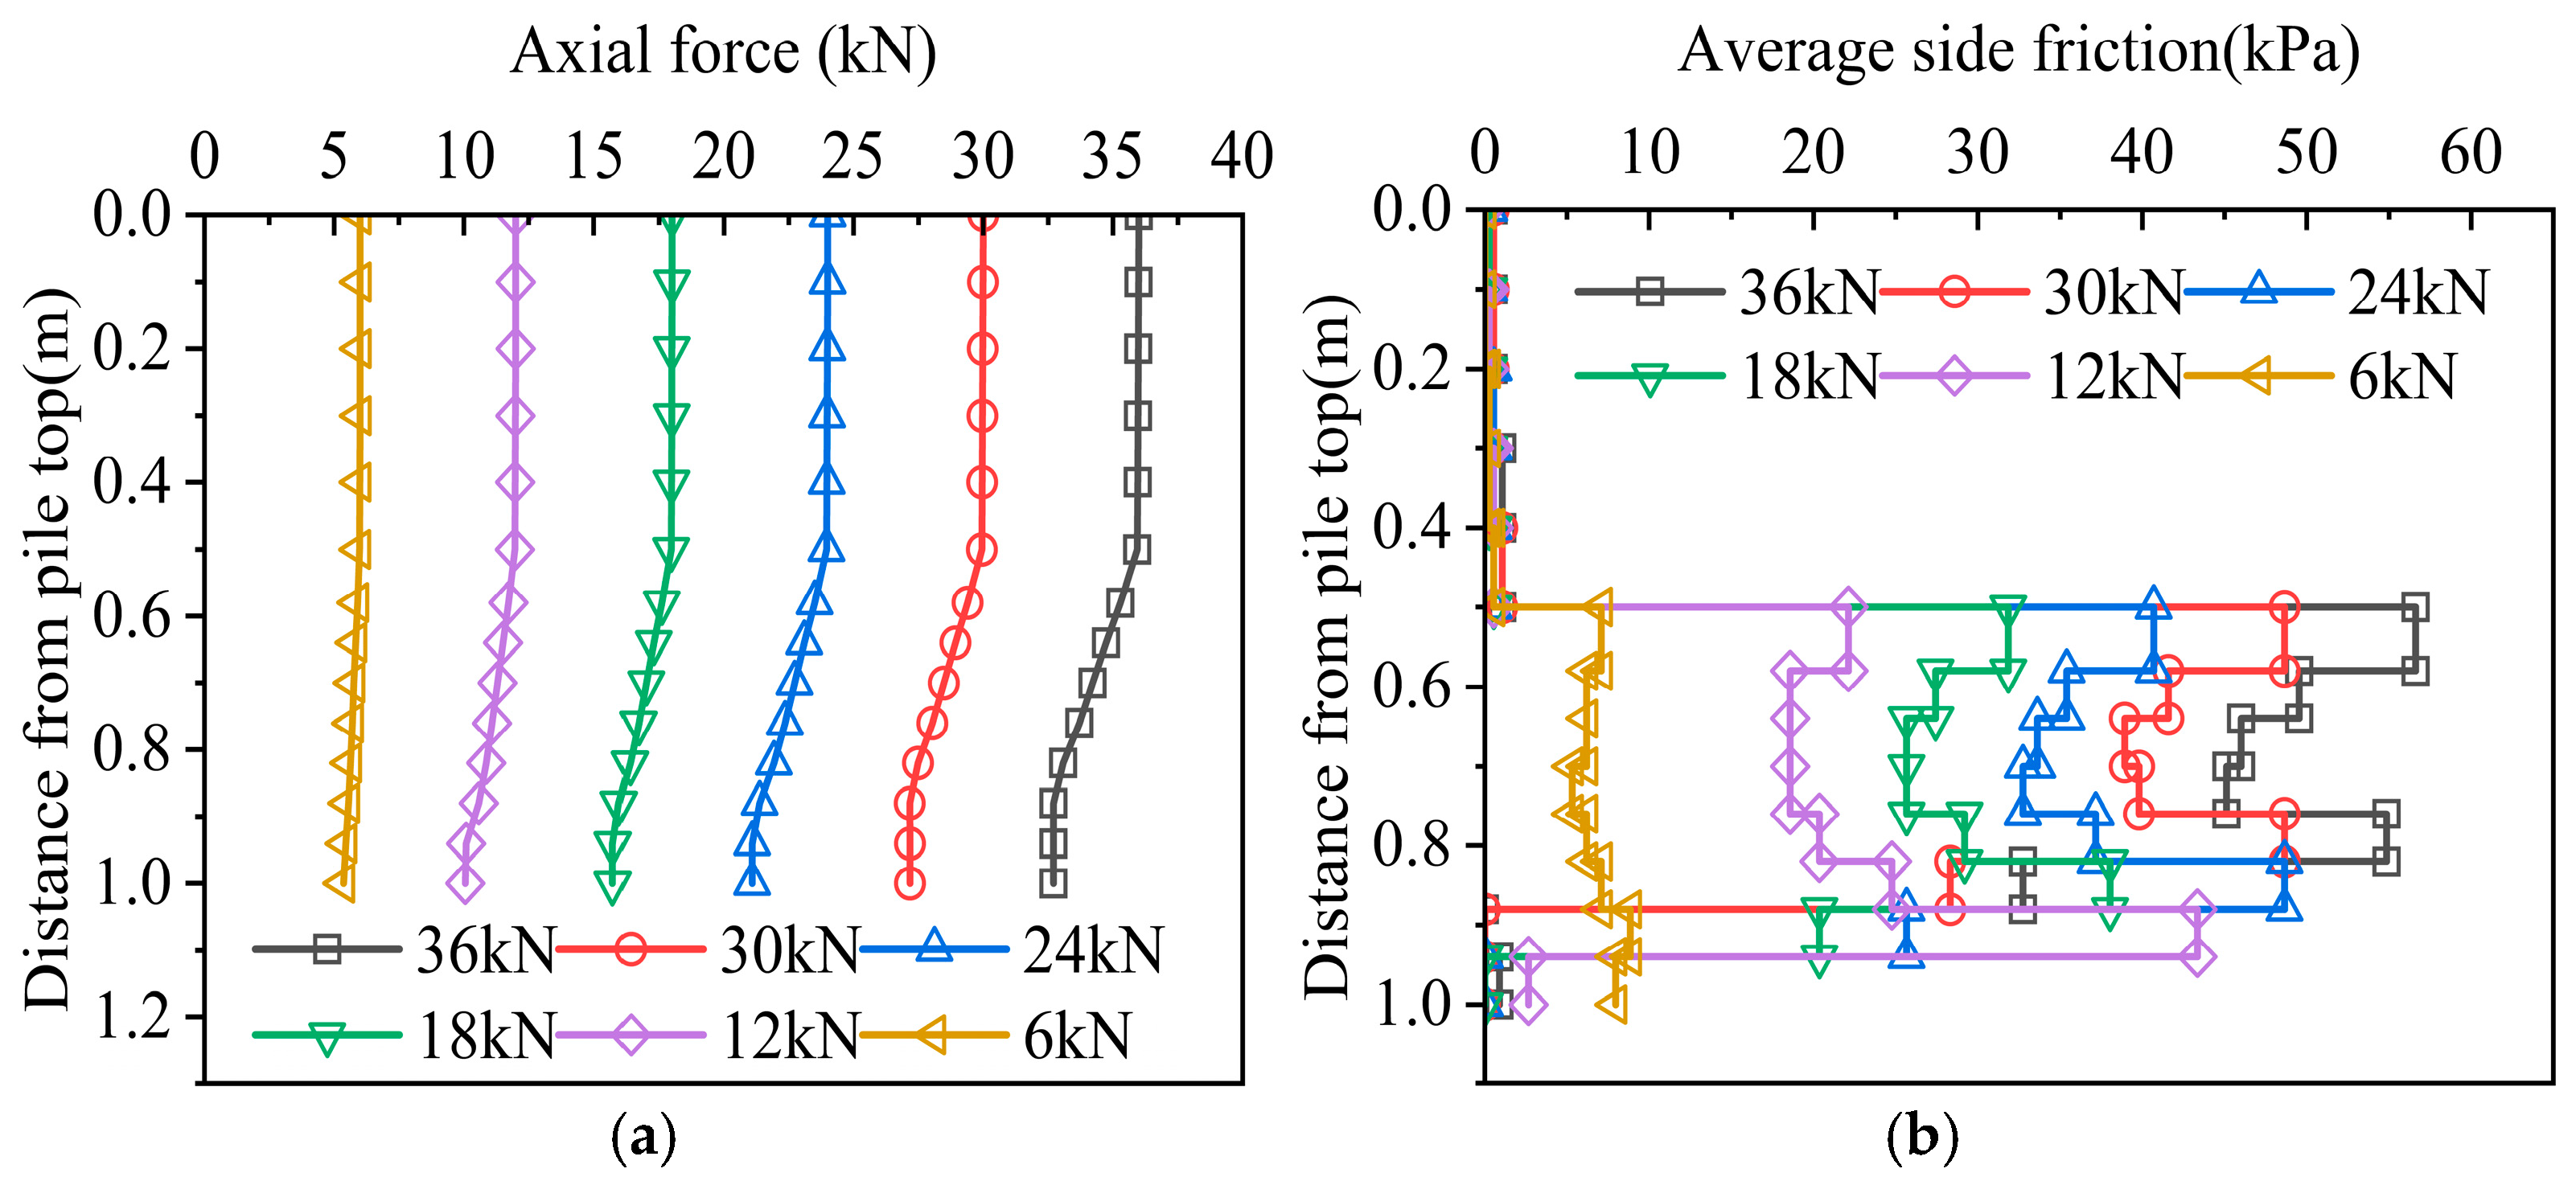
The distribution diagrams of the pile axial force and average side friction resistance of the three working conditions are shown in
Figure 7,
Figure 8 and
Figure 9. As can be seen from the figure, the axial force of each working condition decayed with increasing depth. Since the pile–rock friction force was much greater than the pile–soil friction force, the decay rate of the axial force in the rock-embedded section was much greater than that in the sand layer section.
The axial force diagrams of working conditions 1 and 2 have basically the same trend, that is, the mechanism of lateral friction resistance is similar, and the rock-embedded section shows a trend of “decrease–increase–decrease”; but due to the eccentricity of the underlying karst cave in working condition 2, the ultimate bearing capacity of the pile end became larger, and the allowable pile foundation settlement also became larger. As the load increased, the pile foundation settlement continued to increase, so the lateral friction resistance of the pile body was more fully exerted.
In working condition 3, the side friction of the pile body increased significantly after entering the rock, and then in the section through the cave, due to the lack of soil on the side of the pile, the side friction was almost 0, and the axial force hardly decayed in this section; the side friction of the interlayer section in the beaded cave was exerted accordingly, and then, due to the existence of the second through cave, the side friction gradually decreased to 0; the side friction of the rock-embedded section after the beaded cave was fully exerted and reached an extreme value. The main reason is that the existence of the through cave increases the relative displacement between the pile and the rock, and more load is transmitted downward. At the same time, due to the joint influence of the underlying cave roof, after the pile foundation is embedded in the rock layer again, the rock layer will bend and deform under the action of the load to squeeze the pile body so that the friction of the rock-embedded section below can be more fully exerted.
3. Three-Dimensional Numerical Simulation Analysis
Through the abovementioned indoor model test, the vertical bearing characteristics of pile foundations under three conditions were studied: the presence of an underlying cavity, an underlying eccentric cavity, and a string of beads and an underlying cavity. It was found that when the underlying cavity was eccentric for 2.5 days, the ultimate bearing capacity of the pile foundation was significantly improved. This section uses the relevant parameters of the model test to perform numerical simulation, compares the results of the two, verifies the rationality of the numerical simulation data, and on this basis, expands the study on the influence of the eccentricity of the underlying eccentric cavity and the backfill of the underlying cavity on the vertical bearing characteristics of the pile foundation.
3.1. Numerical Model Establishment and Verification
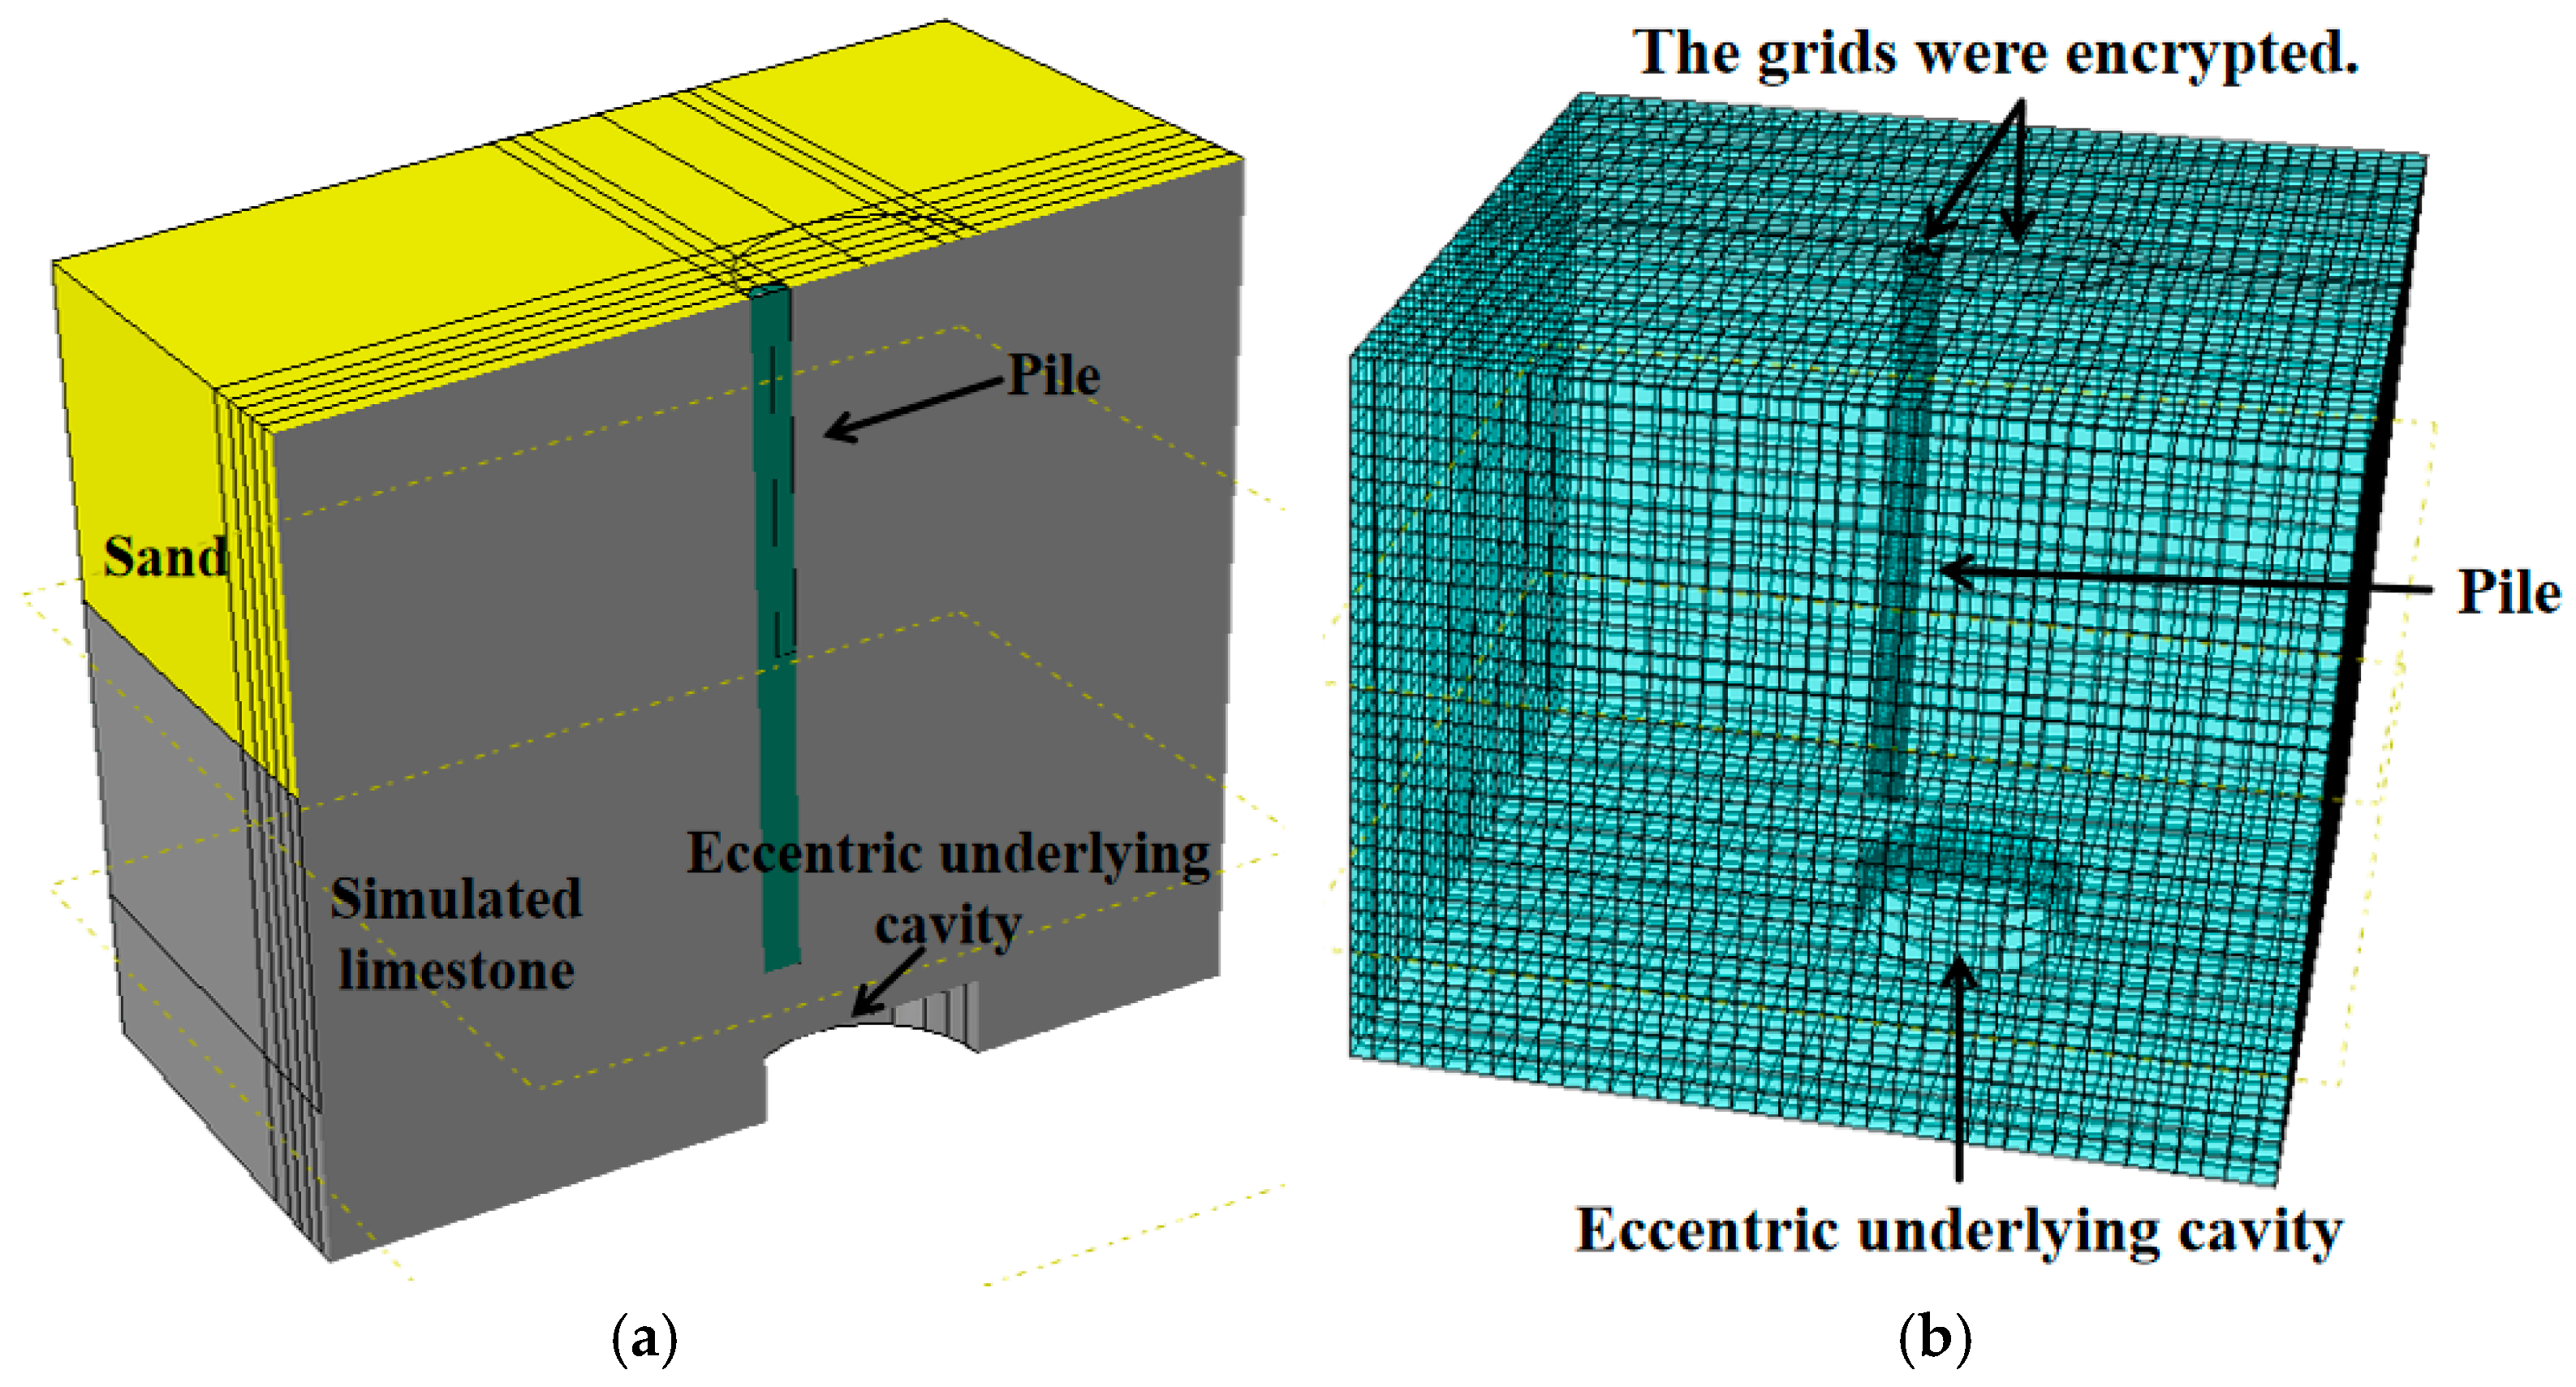
The finite element analysis software ABAQUS was used to restore the indoor model test at a 1:1 ratio. The geometric dimensions and rock and soil parameters were consistent with those of the model test. The model piles and soil simulation materials in the model test were tested for compressive strength and direct shear, and the relevant mechanical parameters were measured, as shown in
Table 1. For the cavity area, it was regarded as a fully developed cylindrical cavity without considering the influence of its filling. The ideal elastic model was selected because the pile had high strength and small deformation, while the Mohr–Coulomb constitutive model was used for the rock and soil layer. Surface-to-surface contact was set between the pile–soil and pile–rock, with the main surface being the pile and the secondary surface being the soil. The slip formula was set to finite slip. In the contact properties, the tangential behavior was “penalty”, the friction coefficient was set to 0.5, and the normal behavior was “hard” contact. The model boundary conditions were as follows: the X and Y constraints were set around, and the X, Y, and Z constraints were set at the bottom of the model. The piles and strata were divided into three-dimensional computational grids, both using C3D8R units. The existence of cavities in the strata made the model more complicated, so the grids were encrypted at the cavities and pile sides [
33]. The three-dimensional model is shown in
Figure 10.
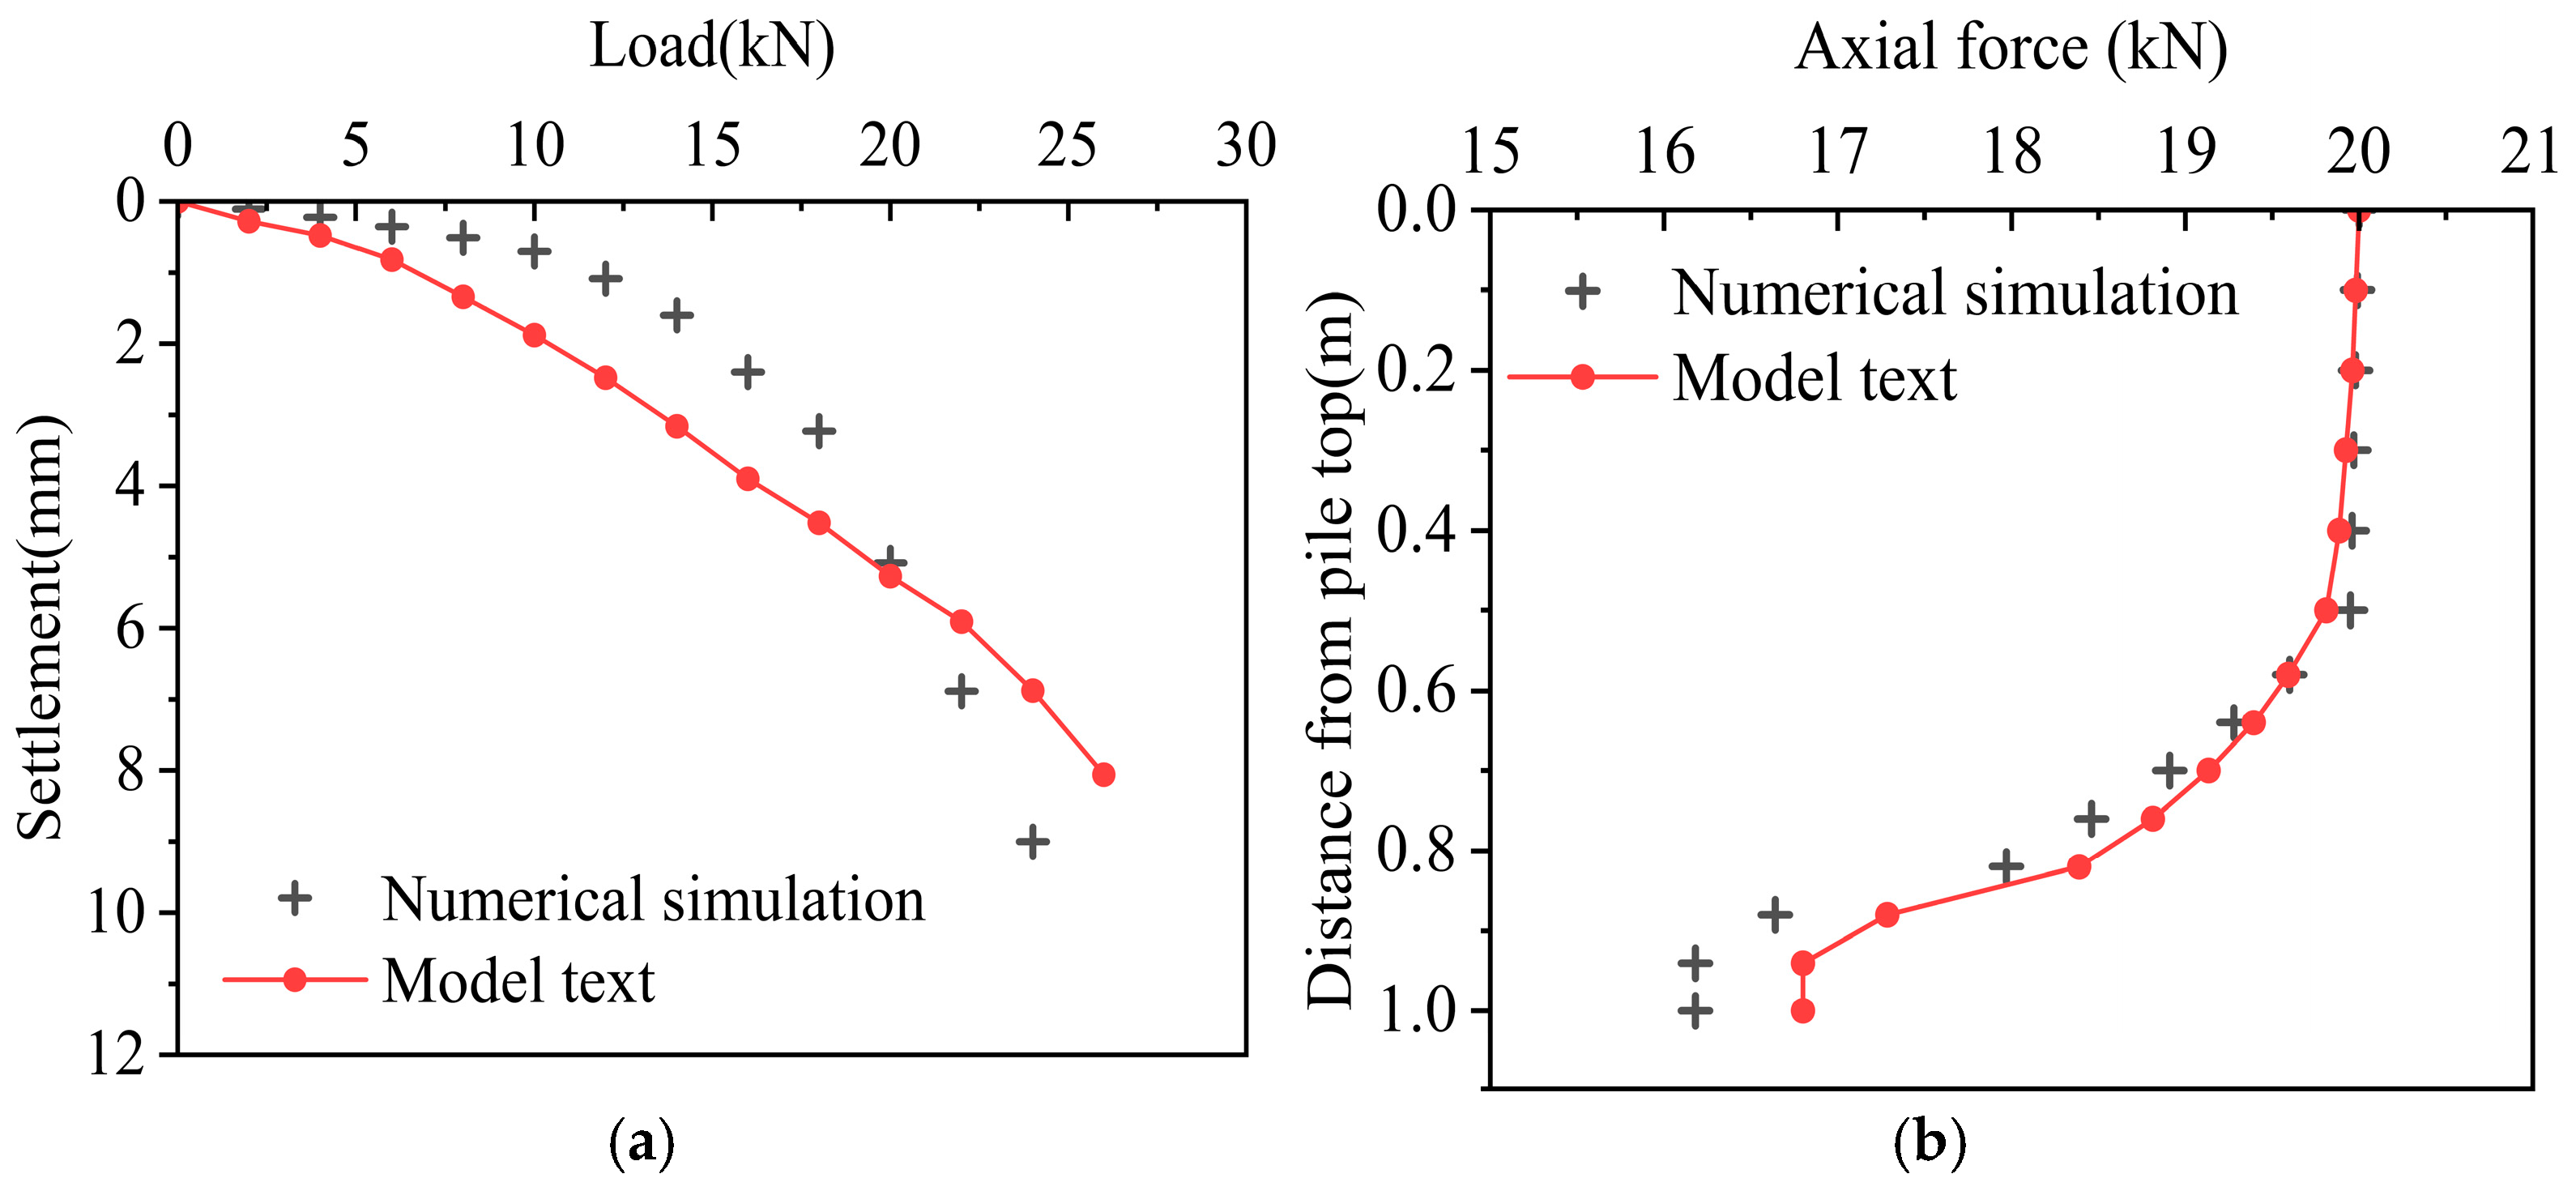
Combined with different working conditions, the ultimate bearing capacity of the pile top was estimated, and the loading method consistent with the model test was adopted, with 10~14 levels of loading. In order to verify the reliability of the numerical simulation, the working condition with an underlying eccentric cavity was taken as an example, and the numerical simulation results were compared with the model test results. The comparison diagram of the load–settlement curve and the pile body axial force curve is shown in
Figure 11. It can be seen that the load–settlement curve of the numerical simulation is basically consistent with the overall trend measured by the test. The load on the pile top before failure is not much different. The load obtained in the test came out to 26 kN, while the result of the numerical simulation came out to 25 kN, with a deviation of about 3.8%; the total settlement value of the pile top before the top plate was destroyed is relatively close between the models, with a deviation of less than 1 mm; for the axial force, since the settlement of the two under the 20 kN load was basically the same, it is more representative, so the axial force under this load was selected for comparison. It can be seen from the figure that the axial force distribution of the two is consistent, and the deviation is small.
In summary, numerical simulation can better simulate indoor model tests. Although there is a slight difference between the results of the two, they are relatively consistent in the analysis of the vertical bearing characteristics of pile foundations in karst areas and the law of load transfer. Therefore, numerical simulation can be used to further analyze the bearing characteristics of pile foundations under different working conditions.
3.2. Effect of the Eccentricity of the Underlying Eccentric Cavity on the Bearing Characteristics of Pile Foundation
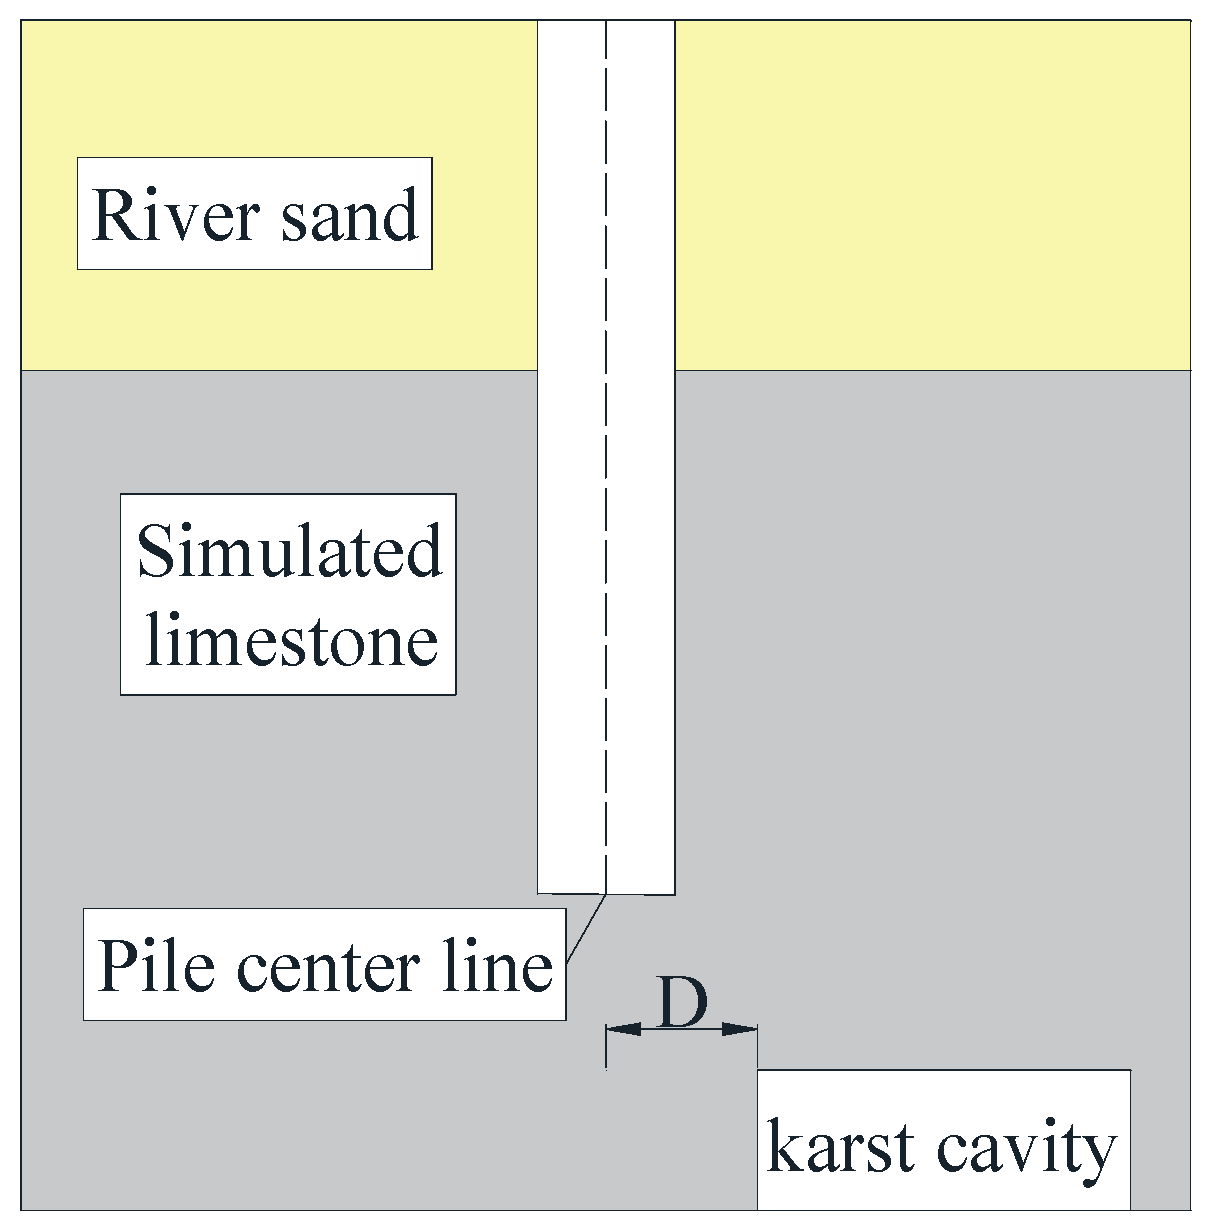
In the model test, it was found that when the eccentricity between the center of the underlying cavity and the center of the pile was 2.5 d, the ultimate bearing capacity of the pile increased by 53% compared with the condition with an eccentricity of 0, and the improvement effect was very significant. In order to further study the critical distance of the influence of the underlying eccentric cavity on the ultimate bearing capacity of the pile foundation, the horizontal distance D between the center of the pile and the edge of the cavity was used as a variable, and the changes in the ultimate bearing capacity of the pile foundation when D was 0.5 d, 1 d, 1.5 d, 2 d, 2.5 d, 3 d, and 3.5 d were studied respectively. This variation was compared with ordinary rock-embedded piles under the same conditions to find the critical distance. Its working condition diagram is shown in
Figure 12.
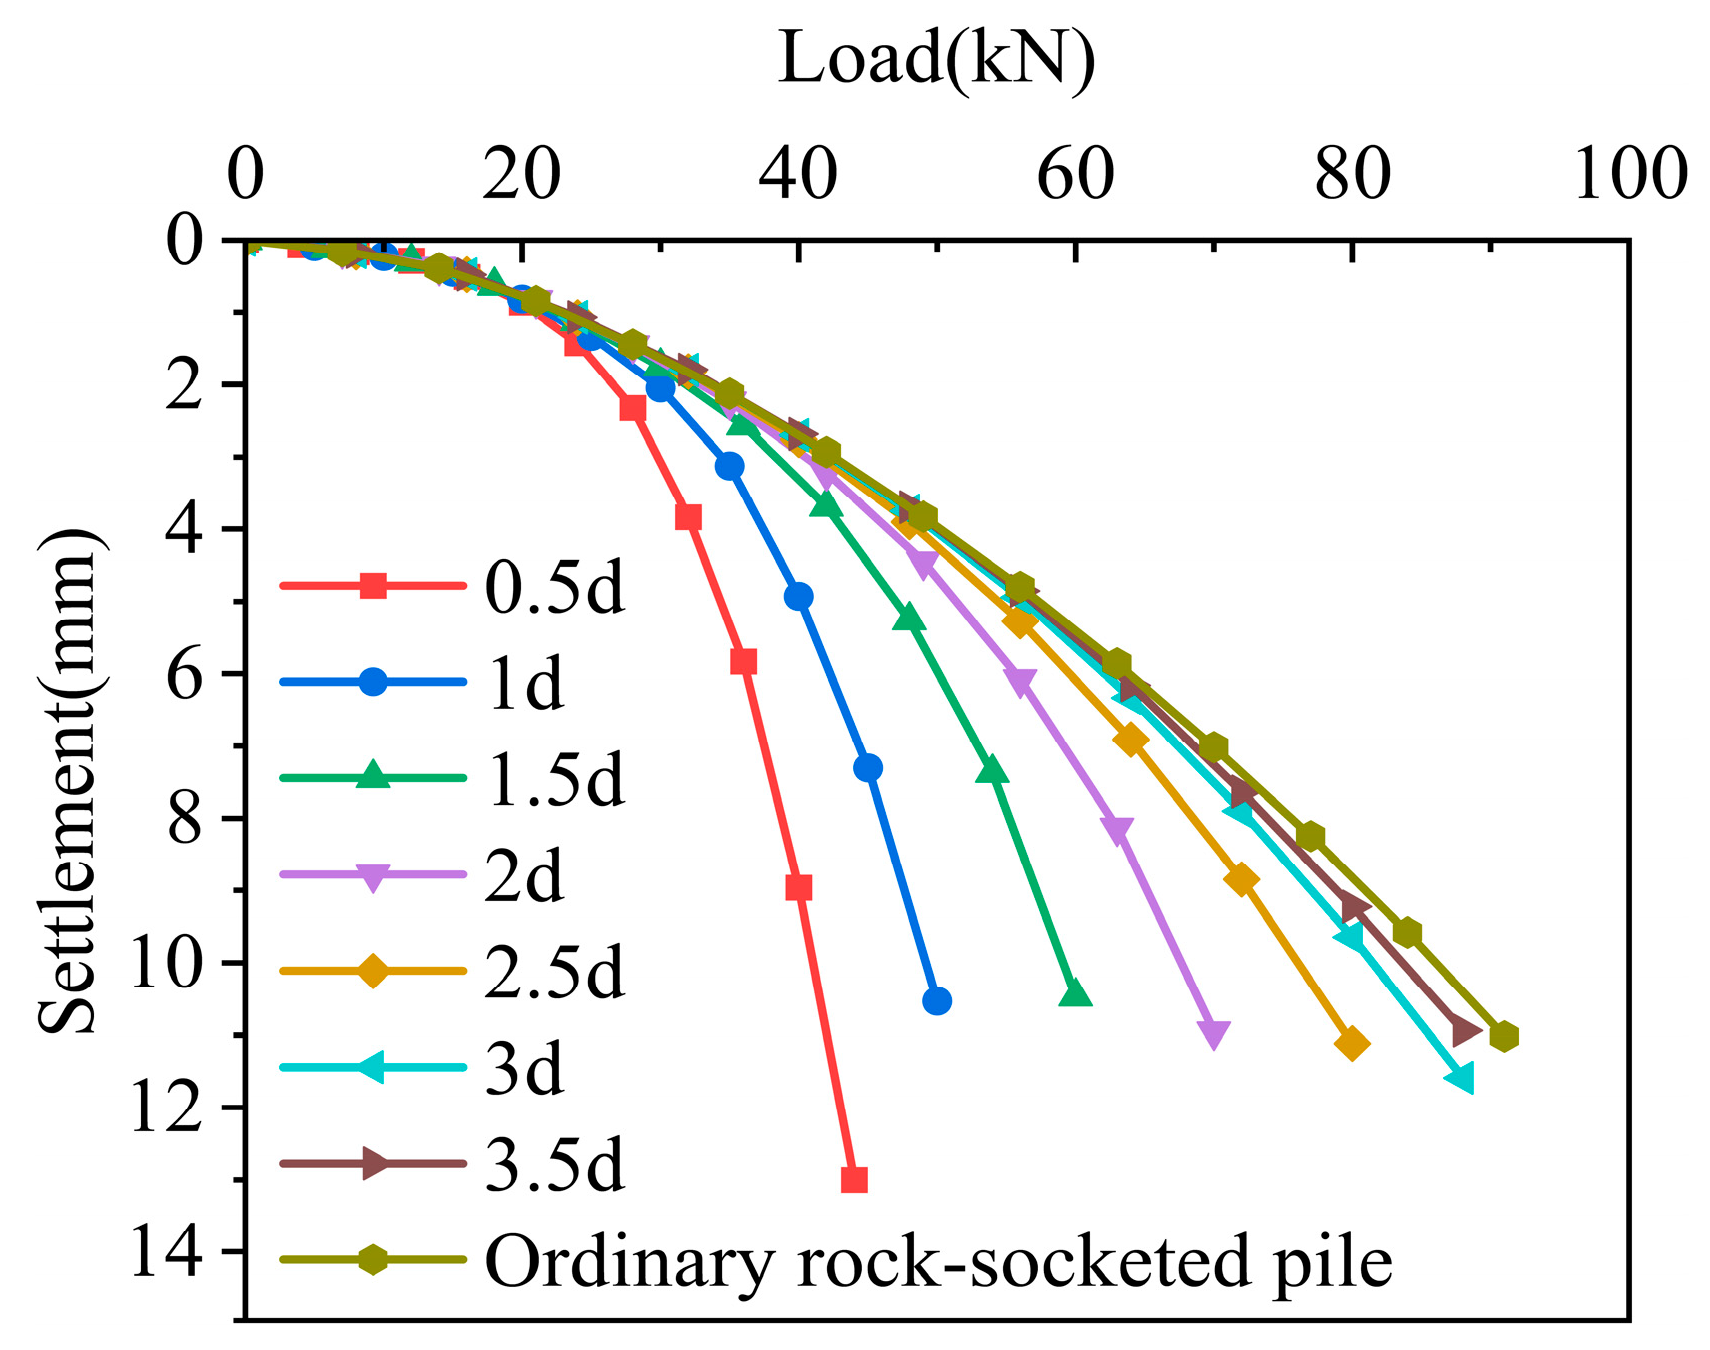
The Q-S curves under the eight working conditions are shown in
Figure 13. Since the pile ends are not acting on the top plate, no sudden damage will occur. Therefore, the Q-S curves of the eight models have the same trend, which is a slow-changing type. The load value corresponding to a 10 mm settlement was taken as the ultimate bearing capacity of the pile [
34]. The ultimate bearing capacity of the eight working conditions is shown in
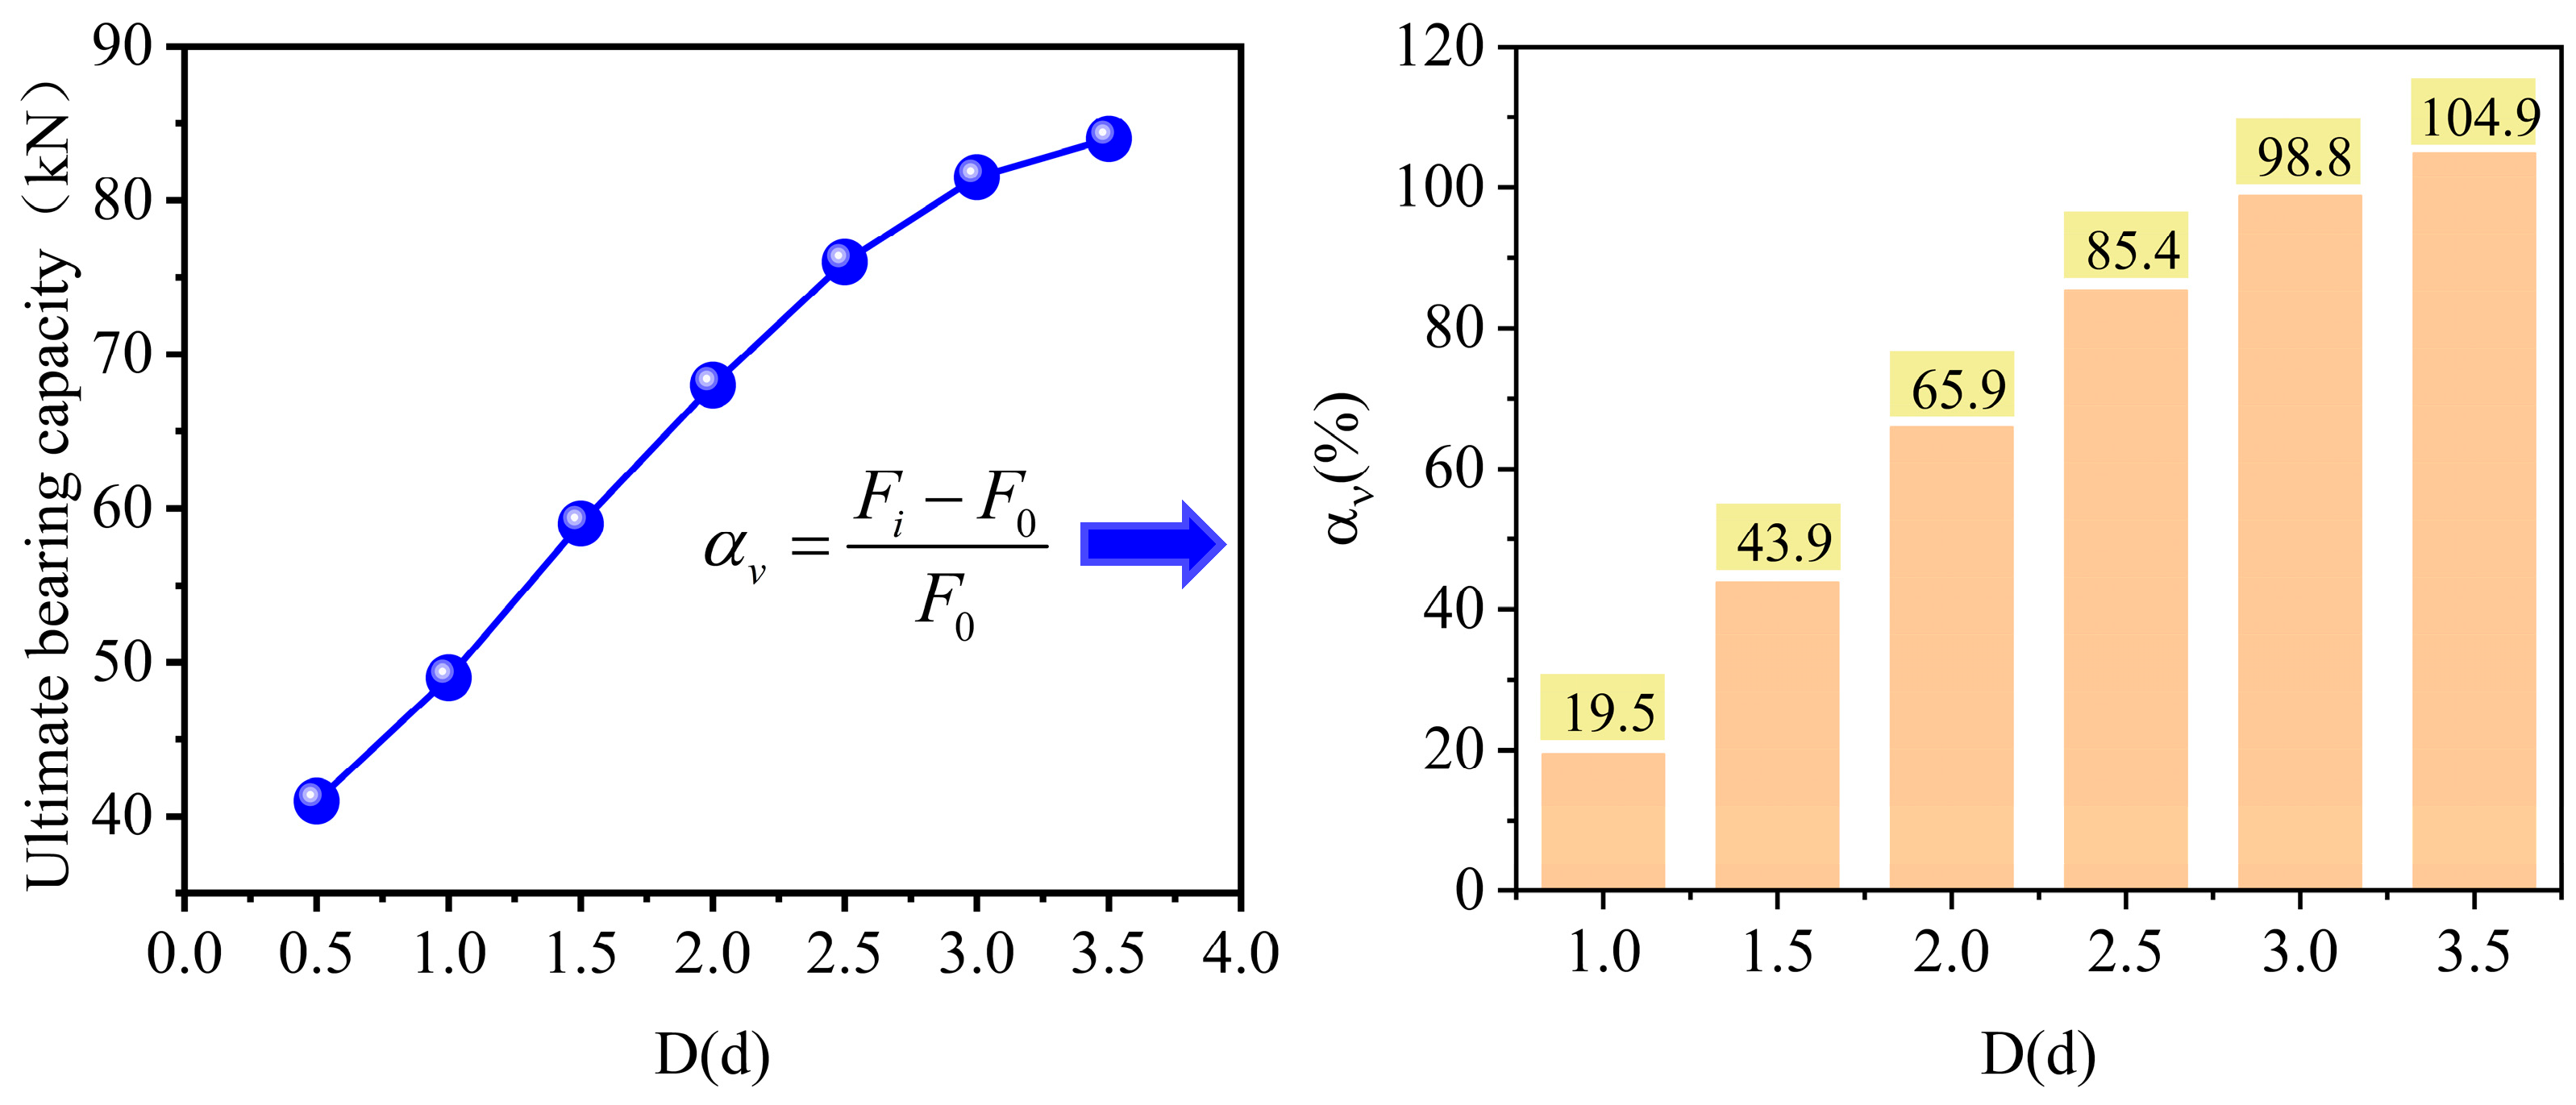
Table 2. The relationship between the ultimate bearing capacity of the pile foundation and the horizontal distance D is shown in
Figure 14. As can be seen from the figure, the ultimate bearing capacity of the pile foundation increased with the increase in distance. By calculating the increase rate of the ultimate bearing capacity of the pile foundation at different distances, it could be found that the ultimate bearing capacity increased by 104.9% from 0.5 d to 3.5 d, and this improvement effect is particularly significant [
35].
where
is the increase rate of the ultimate bearing capacity of the pile foundation,
is the ultimate bearing capacity at different eccentric distances, and
is the ultimate bearing capacity at an eccentric distance of 0.5 d.
Among them, when the eccentric distance D changed from 0.5 d to 2.5 d, the ultimate bearing capacity increased almost linearly; from 2.5 d to 3.5 d, its growth rate decreased continuously, indicating that after 2.5 d, the sensitivity of the ultimate bearing capacity to the change in the horizontal distance S decreased. Combined with what is shown in
Figure 13, it was found that the trend of the Q-S curve at 3.5 d was close to that of ordinary rock-embedded piles without cavities. Both the settlement values at each level and the ultimate bearing capacity of the piles are relatively similar. It can be concluded that when the distance between the center of the pile and the edge of the underlying eccentric cavity reaches 3.5 d, the existence of the cavity will basically not affect the ultimate bearing capacity of the pile foundation. Chen [
36] studied the effect of the underlying eccentric elliptical cave on the stability of pile foundations and found that when the horizontal distance between the cave edge and the pile side is greater than 4 d, the effect of the cave on the stability of the pile foundation can be ignored. Based on the conclusions of this paper, this distance is slightly conservative.
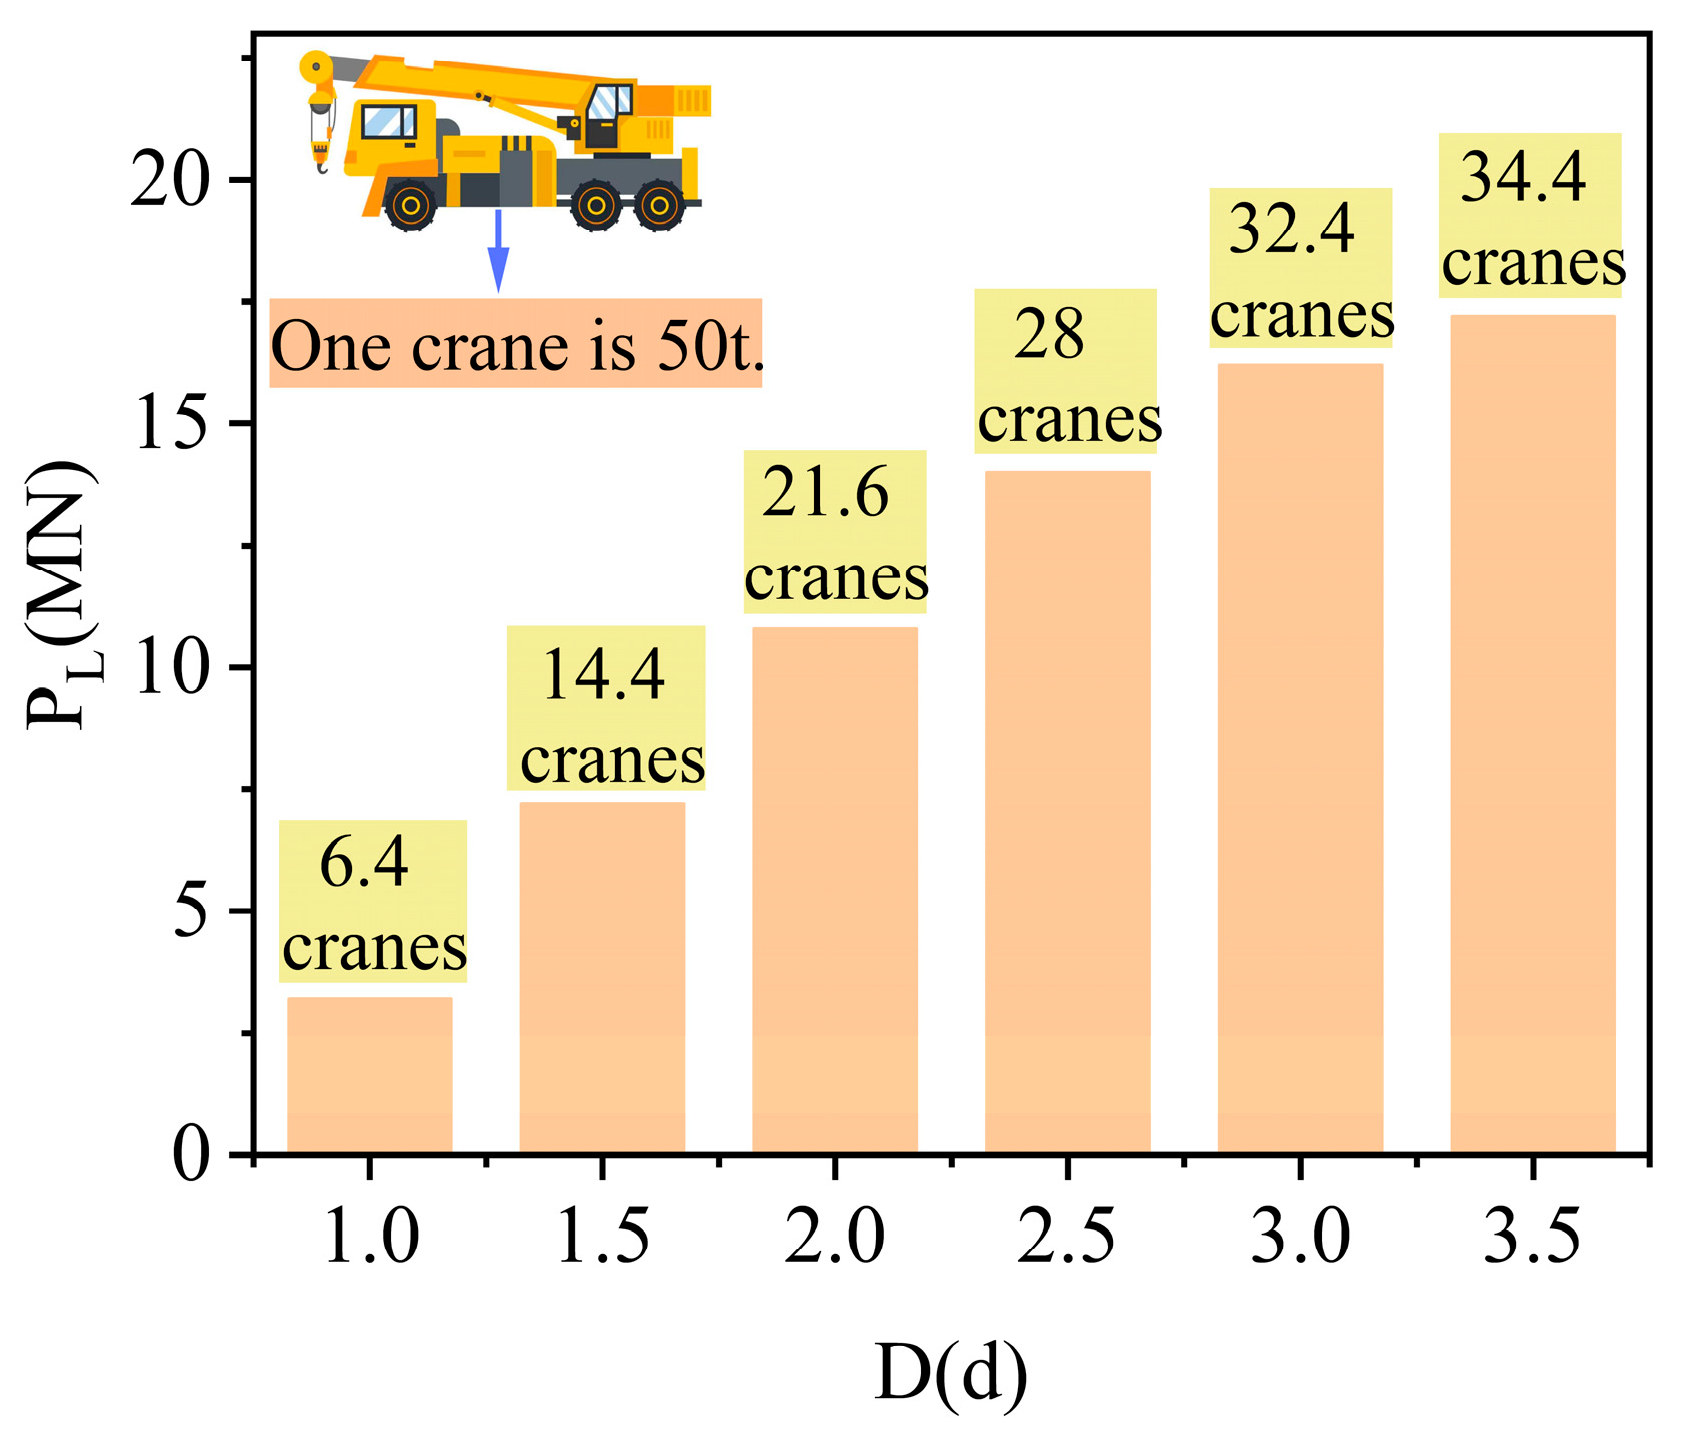
Since the numerical model was established according to the geometric dimensions of the model test, the ultimate bearing capacity of the prototype pile can be converted according to the similarity ratio of 1:202, and the calculation results are shown in
Table 2. The results show that with the increase in the eccentric distance D, the ultimate bearing capacity of the pile foundation is significantly improved. If an SCC508 crane with a weight of 50 t is used to represent the increase in the ultimate bearing capacity [
36], it can be concluded that the ultimate bearing capacity increases by 6.4, 14.4, 21.6, 28, 32.4, and 34.4 cranes from 0.5 d to 3.5 d, respectively, as shown in
Figure 15.
where
is the increase in the ultimate bearing capacity of the pile foundation,
is the ultimate bearing capacity at different eccentric distances, and
is the ultimate bearing capacity at an eccentric distance of 0.5 d.
3.3. Effect of Underlying Cavity Backfill on Pile Foundation Bearing Characteristics
From the above model test, it can be seen that when there is an underlying cavity in the karst area, the bearing capacity of the pile end is completely borne by the roof of the underlying cavity because the rock layer below the pile end is in an open state, and the ultimate bearing capacity of the pile foundation is greatly reduced. When the load on the pile end is greater than the ultimate bearing capacity of the roof, the roof will be suddenly damaged, and the danger will increase. The backfill method can fill the missing soil in the cavity and is the most commonly used cavity treatment measure in engineering. In order to explore the influence of the backfill of the underlying cavity on the bearing capacity and load transfer law of the pile foundation, the model was built with the relevant dimensions of working condition 1 in the model test. The filling materials in the underlying cavity are stone and clay, with a ratio of 3:7. The relevant parameters of the filling materials are shown in
Table 1 above, and the working condition diagram is shown in
Figure 16.
3.3.1. Load–Settlement Curve
The Q-S curve after the underlying cavity has been backfilled is shown in
Figure 17. It can be seen from the figure that the load–settlement curve is a slow-varying type, indicating that due to the support of the backfill body, the underlying cavity roof will not be sheared. The load value corresponding to 10 mm settlement is about 36 kN, that is, the ultimate bearing capacity of the pile foundation after the cavity has been backfilled is 36 kN. The ultimate bearing capacity of the underlying cavity in the model test is 17 kN. In comparison, the ultimate bearing capacity of the pile foundation after the cavity has been backfilled increased by about 111.8%, and this backfill effect is significant.
However, since the compressive strength and other mechanical parameters of the backfill are relatively small, its bearing capacity is limited. As the load at the pile end is continuously transmitted downward, the backfill in the cavity gradually shares the load. Therefore, as the load increases, the rate of increase in the pile top settlement will also increase. Therefore, the degree of improvement in the ultimate bearing capacity of the pile after the underlying cavity is backfilled mainly depends on the strength of the backfill.
3.3.2. Pile Axial Force and Side Friction
As shown in
Figure 18, the axial force diagram and side friction resistance distribution diagram of the pile body after the underlying cavity has been backfilled are compared with the axial force diagram and side friction resistance distribution diagram of working condition 1 with an underlying cavity in the model test, and it can be seen that the side friction resistance mechanism has not changed much before and after the underlying cavity has been backfilled, and the axial force diagram has the same trend. However, since the ultimate bearing capacity of the pile end was increased after the cavity was filled, no sudden damage will occur, so the allowable pile settlement increases, and as the settlement increases, the side friction resistance can be more fully exerted.
3.4. Effect of Beaded Cavity Backfill on Pile Foundation Bearing Characteristics
In the model test, it was concluded from the working condition of the coexistence of beads and underlying cavities that the existence of the beaded cavities has a relatively small effect on the ultimate bearing capacity of the pile foundation. However, due to the lack of soil in the section passing through the cavity, the instability of the pile body increases, and the settlement becomes larger. Therefore, this section will explore the effect of cavity backfill on the bearing characteristics of the pile foundation when the pile foundation passes through a double-layer cavity. The working condition diagram is shown in
Figure 19.
3.4.1. Load–Settlement Curve
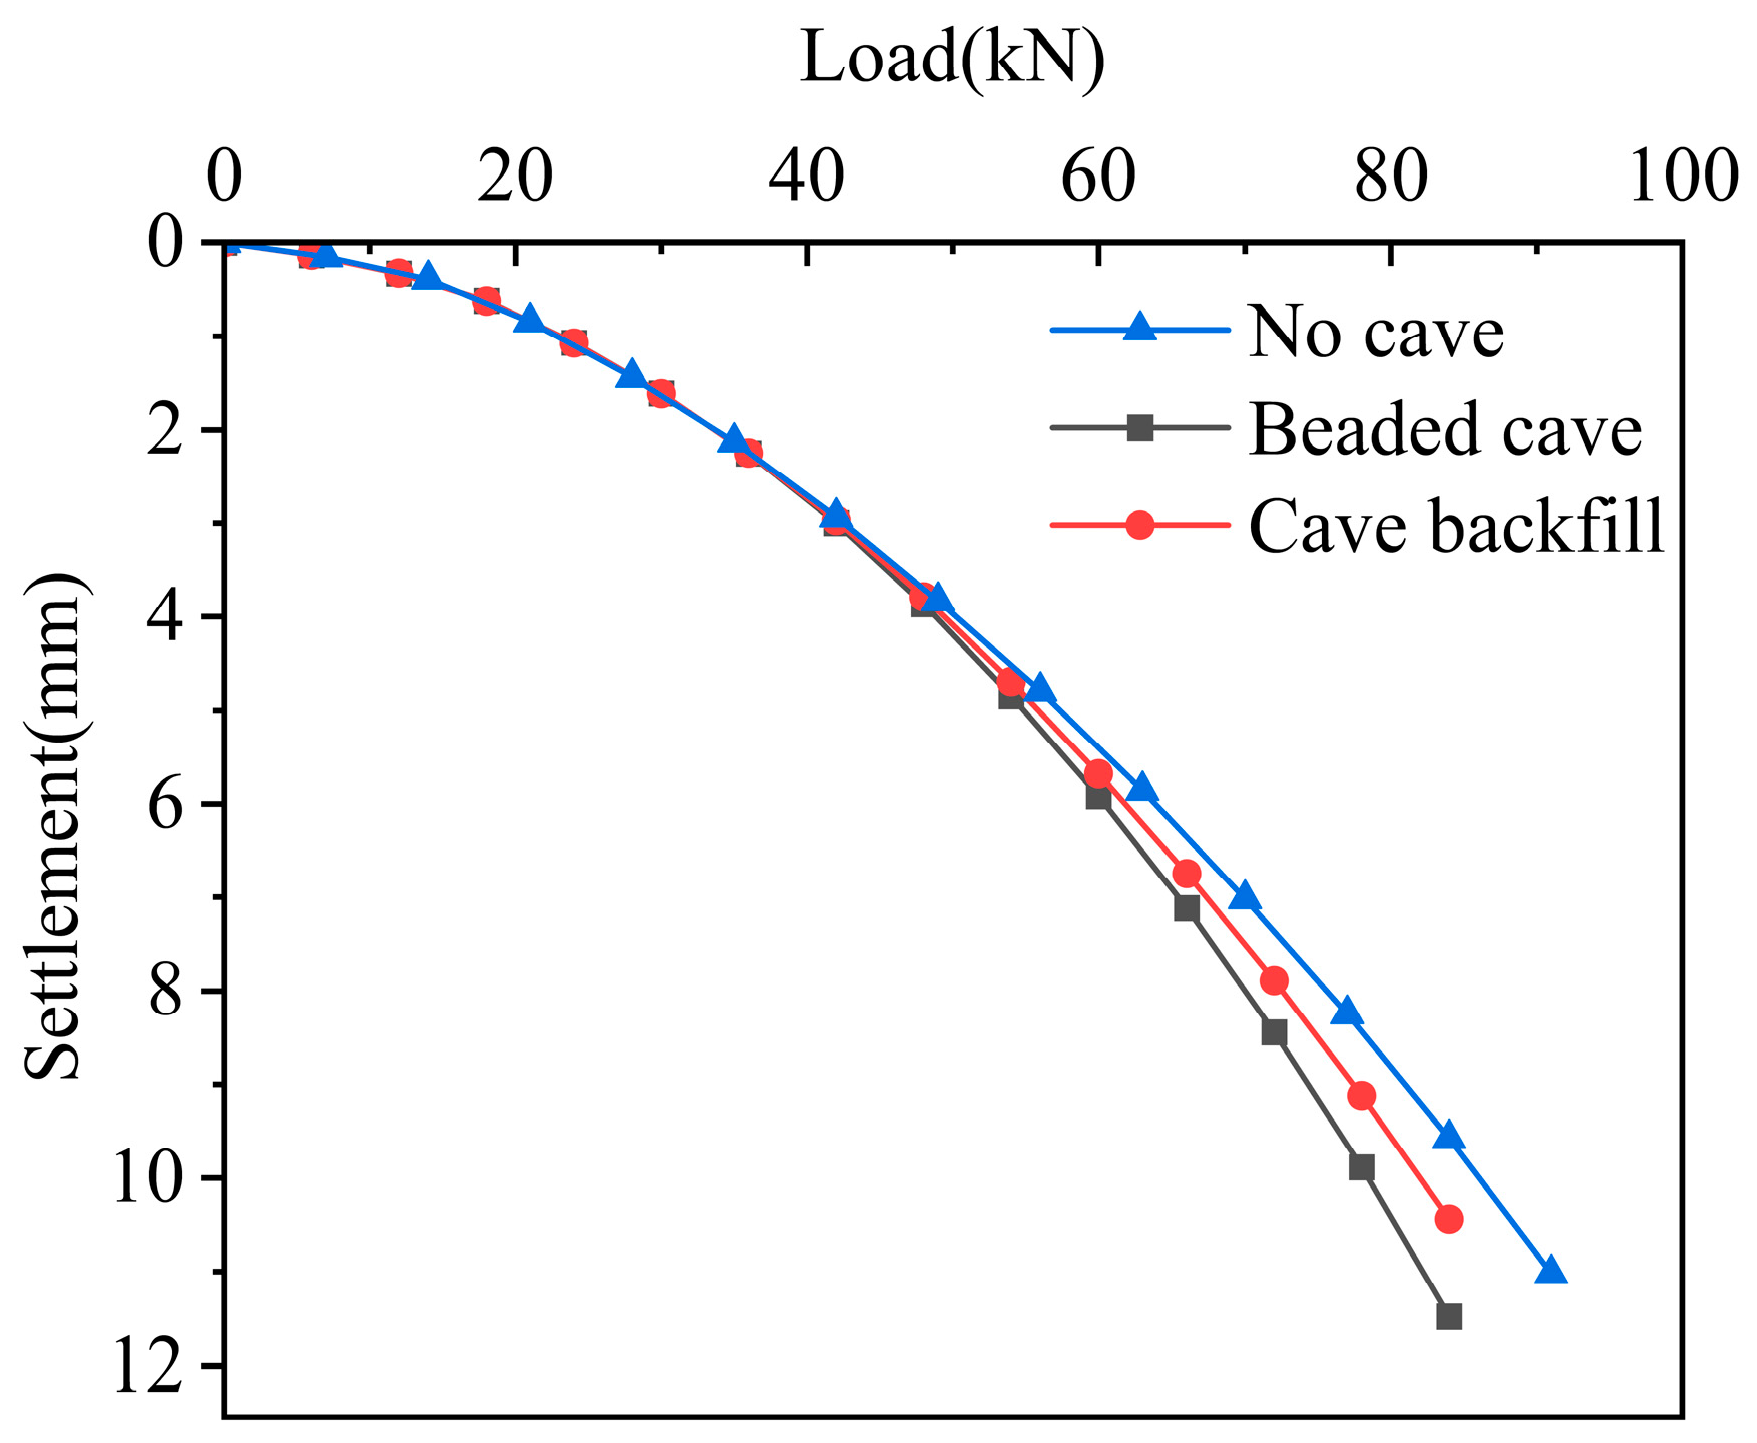
As shown in
Figure 20, the Q-S curves of three working conditions are shown for ordinary rock-embedded piles (without cavities), beaded cavities, and cavity backfilling at the same rock-embedded depth. As can be seen from the figure, when the applied load is small, the corresponding settlement values under each load level of the three working conditions are close. As the pile top load increases, the three working conditions gradually show differences. Under the same load, the settlement of the beaded cavity working condition increases rapidly, and the settlement decreases after the cavity is backfilled, but it is still greater than the working condition without cavities. The load value corresponding to the pile top settlement of 10 mm was selected as the ultimate bearing capacity of the pile foundation. The ultimate bearing capacity of the pile foundation corresponding to the beaded cavity is about 78.5 kN, and the ultimate bearing capacity increased to 82 kN after the cavity is backfilled. The ultimate bearing capacity is about 86 kN when there is no cavity. It can be obtained that after the beaded cavity is backfilled, the ultimate bearing capacity of the pile is increased by 4.5%, but compared to the working condition without cavities, the ultimate bearing capacity of the pile foundation is still about 4 kN lower. This shows that cavity backfilling has a certain effect on improving the ultimate bearing capacity of pile foundation, and the settlement of pile top becomes smaller under each load level, which improves the stability of the pile body.
3.4.2. Pile Axial Force and Side Friction
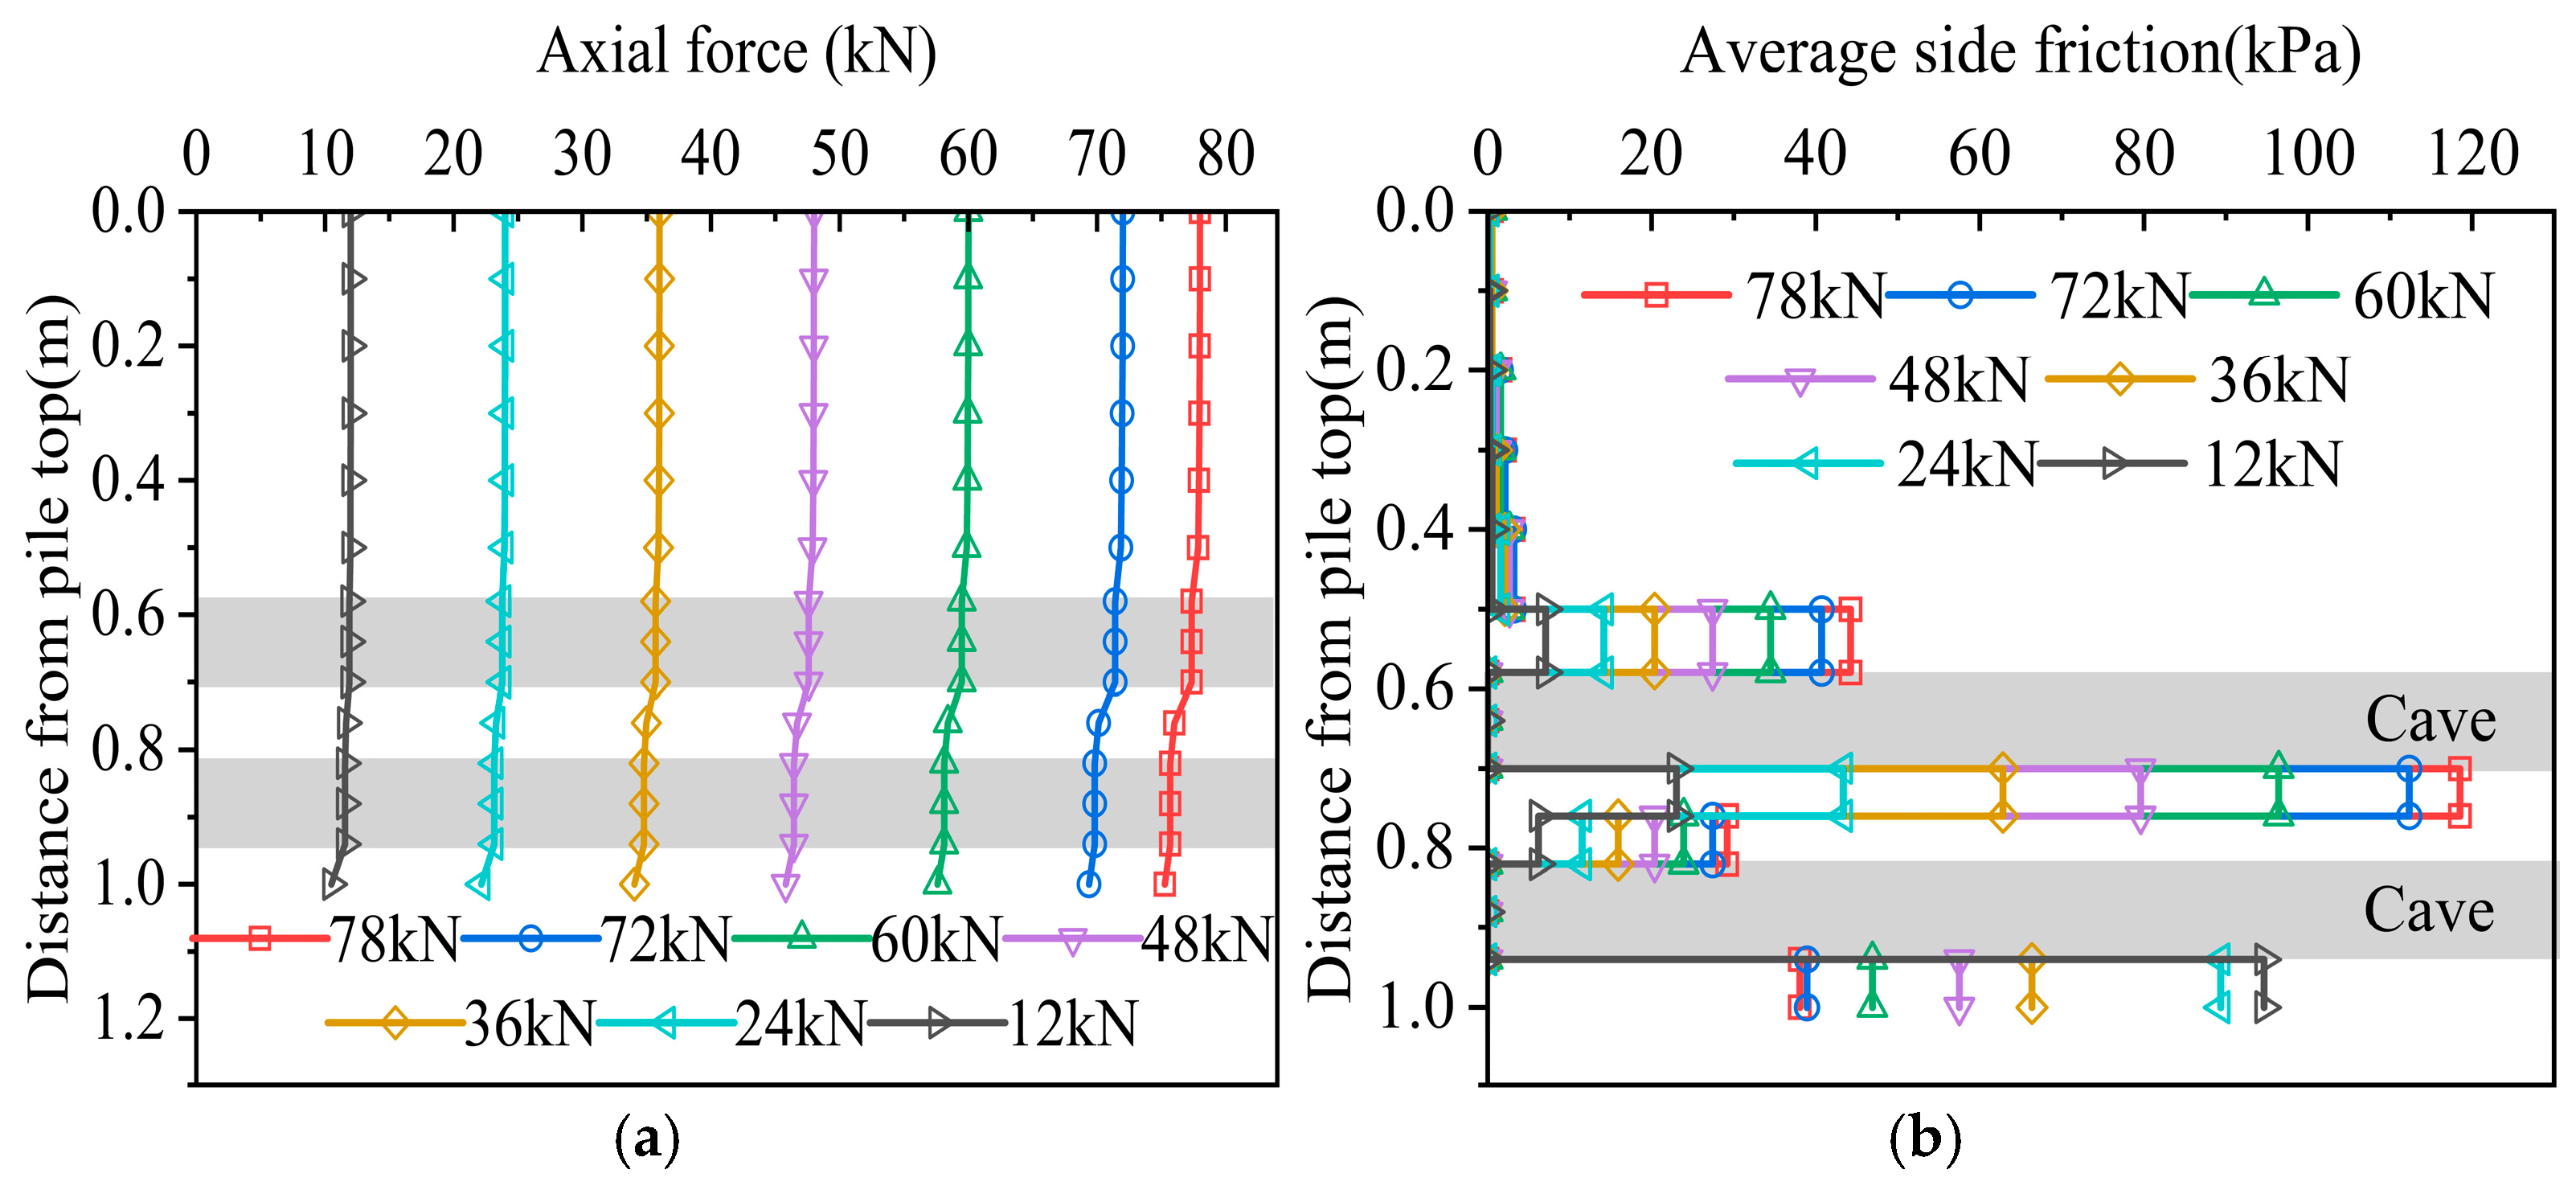
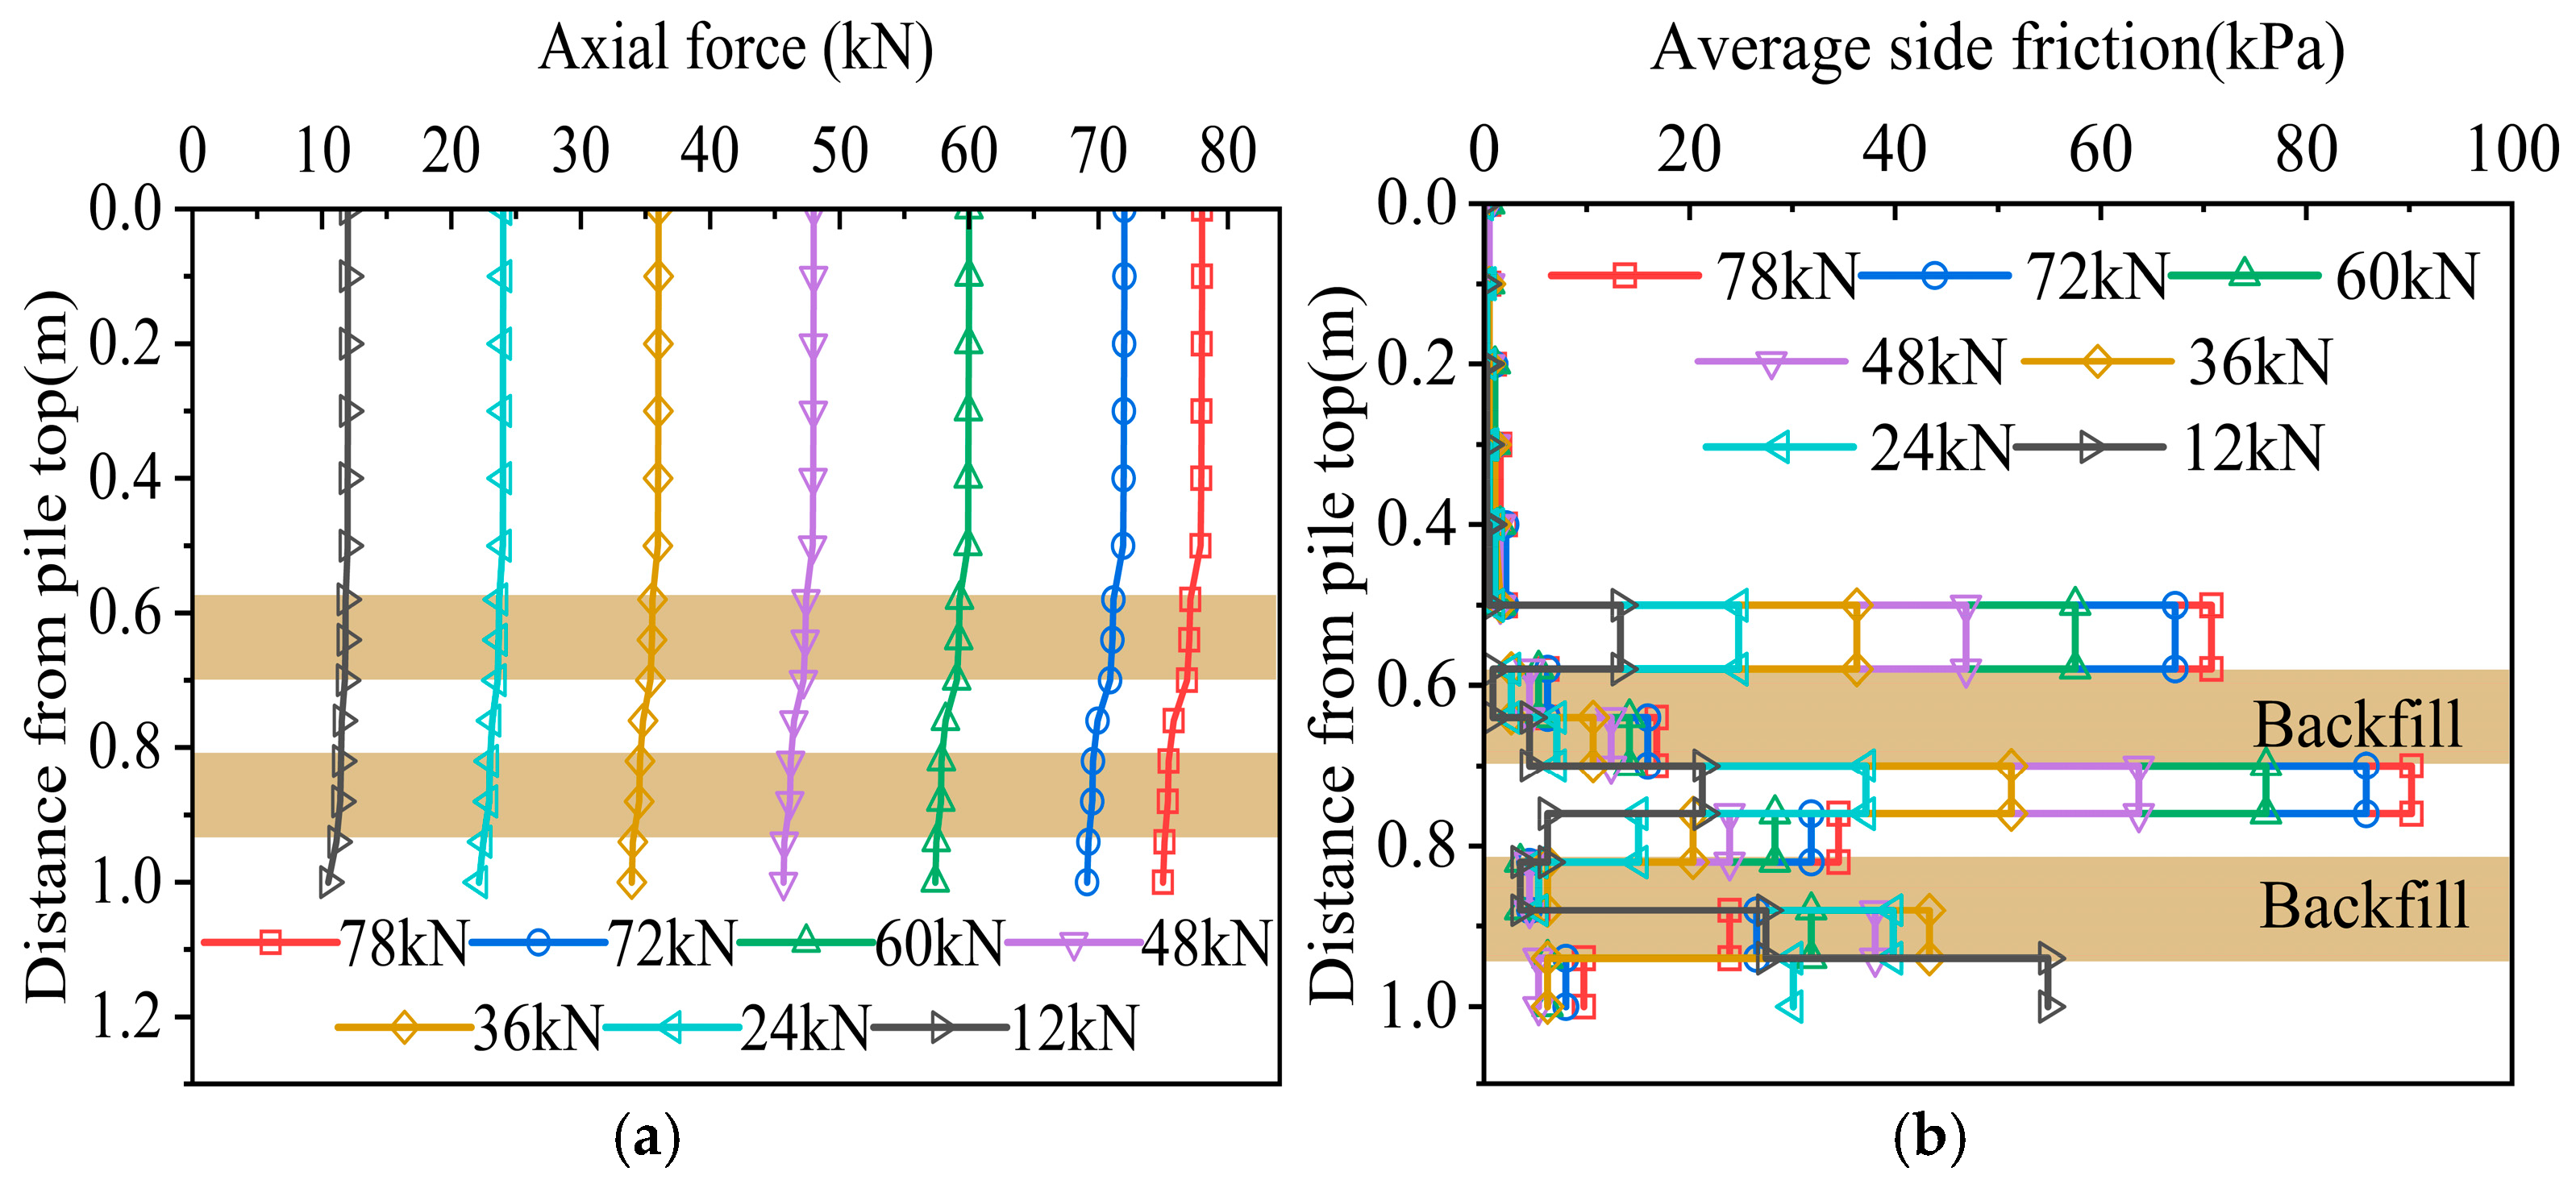
Figure 21 and
Figure 22 are the pile axial force diagram and side friction resistance distribution diagram of the pile body passing through the beaded cavity and the cavity backfill. It can be seen from the figure that the distribution law of the side friction resistance of the pile body is basically the same whether the cavity is backfilled or not. The side resistance of the pile in the sand layer is small, and it will increase significantly after entering the rock layer. The existence of the cavity in the stratum increases the relative displacement between the pile and the rock, resulting in the full play of the side friction resistance in the interlayer section between the two cavities and the rock-embedded section at the pile end. The difference is that the cavity backfill makes up for the lack of rock mass on the side of the pile. As the pile foundation settles under load, relative movement occurs between the backfill and the pile, allowing the cavity region to contribute to frictional resistance. Among them, Feng et al. [
37] studied the effect of cave backfill on the bearing characteristics of pile foundations when crossing a single-layer cave. The conclusion obtained (backfill soil makes up for the lack of soil within the cave and provides more pile side friction resistance) verifies the correctness of the results of this point.
4. Discussion
This paper conducted a model test and numerical simulation study on the vertical bearing characteristics of a single-pile foundation in a karst area and obtained corresponding conclusions, which can provide a certain reference for the design of karst pile foundations. However, due to the complexity and changeability of karst geology and the limitations of the test conditions and time, many aspects need further research:
(1) At present, most of the studies on the bearing characteristics of pile foundations in karst areas are single-pile conditions, and there are few studies on pile groups. The bearing characteristics of pile groups in complex interactive karst areas can be further studied.
(2) Future work could incorporate a more nuanced analysis of the soil–rock interface, potentially using advanced numerical simulations or additional experimental setups to explore the interaction between different soil and rock layers.
(3) At present, most of the studies on the bearing characteristics of karst pile foundations are limited to short-term static load behavior. A detailed study can be carried out on the changes in the load transfer law of pile foundations in karst areas under earthquake action or during traffic operation of the upper structure [
38,
39].
(4) Changes in parameters such as cave spatial morphology, pile diameter, and bedrock strength may lead to changes in the ultimate bearing capacity of pile foundations. Therefore, the sensitivity of the ultimate bearing capacity of pile foundations to changes in various parameters can be analyzed by changing the mechanical parameters of the cave backfill, the material parameters of the pile body, and the bedrock strength.
5. Conclusions
Based on indoor model tests, this paper compared the bearing characteristics of pile foundations under three conditions: underlying cavities, underlying eccentric cavities (eccentricity 2.5 d), and the coexistence of beads and underlying cavities. The influence of the eccentricity of the underlying eccentric cavity and the backfill of the underlying cavity on the vertical bearing characteristics of the pile foundation was further explored through numerical simulation. The main conclusions are as follows:
(1) The presence of the underlying cavity at the pile end causes the load–settlement curves of the pile foundation to exhibit steep deformations. When the eccentricity of the underlying cave is 2.5 d, the ultimate bearing capacity of the pile foundation increases by 53%; the bearing capacity of the condition with the presence of the beaded cave is reduced by 12% compared with the condition with only the underlying cave. Therefore, in actual engineering, the impact of the underlying cave on the ultimate bearing capacity of the pile foundation may be far greater than that of the underlying cave.
(2) The load transfer law of the pile foundation is basically the same whether the underlying eccentricity is present or not, but when the cave is eccentric, the bearing capacity of the pile end is improved, and the lateral friction resistance is more fully exerted; the existence of the beaded cave in the pile body increases the instability of the pile body, and the lateral friction resistance is almost not exerted in the section of the cave but is fully exerted in the interlayer section of the beaded cave, and it reaches the extreme value in the rock-embedded section of the pile end.
(3) As the distance between the pile center and the edge of the cave increases, the ultimate bearing capacity of the pile foundation continues to increase, with an increase of 104.9% from 0.5 d to 3.5 d; among them, the ultimate bearing capacity increases almost linearly from 0.5 d to 2.5 d, and its growth rate decreases from 2.5 d to 3.5 d; when the distance is greater than 3.5 d, the influence of the cave on the ultimate bearing capacity of the pile foundation can be ignored. When designing the pile foundation project, the corresponding position of the pile foundation can be adjusted according to actual needs to improve the structural safety.
(4) After the underlying cave is backfilled, the top plate will no longer be sheared, and the side friction resistance distribution of the pile body is relatively similar with or without backfilling; compared to the working condition without backfilling, the ultimate bearing capacity of the pile foundation is increased by 111.8%. The degree of increase mainly depends on the strength of the backfill material. In actual engineering, the appropriate backfill material can be selected for backfilling according to the bearing requirements of the upper part of the pile foundation.
(5) Backfilling the beaded cavity compensates for the lack of rock mass around the piles in the cavity zone, enabling full utilization of the side friction resistance in this section; after backfilling, the ultimate bearing capacity of the pile foundation increased by about 4.5%; the main function of backfilling through the cave is to reduce the settlement of the pile top under each load level, thereby improving the stability of the pile body.
Author Contributions
Conceptualization, X.W.; data curation, C.L.; formal analysis, H.H.; methodology, H.H.; funding acquisition, X.W.; investigation, C.L.; software, C.L.; project administration, X.W.; resources, X.W.; supervision, Y.T.; validation, H.C.; visualization, J.H.; writing—original draft, C.L.; writing—review and editing, H.H. All authors have read and agreed to the published version of the manuscript.
Funding
This research was supported by the National Natural Science Foundation of China (52278373).
Data Availability Statement
The data presented in this study are available upon request from the corresponding author. The raw/processed data needed to reproduce these findings cannot be shared publicly at this time, as they are also part of ongoing study.
Conflicts of Interest
The authors declare no conflicts of interest.
References
- Ma, J.; Guan, J.; Duan, J.; Huang, L.; Liang, Y. Stability analysis on tunnels with karst caves using the distinct lattice spring model. Undergr. Space 2021, 6, 469–481. [Google Scholar] [CrossRef]
- Han, G.; Zhang, H.; Wang, Z.; Wang, Y.; Geng, N.; Guo, P.; Li, X.; Zhao, Y.; Lin, H.; Wang, Y. Bearing behavior of rock socketed pile in limestone stratum embedded with a karst cavity beneath pile tip. Case Stud. Constr. Mater. 2023, 18, e02203. [Google Scholar] [CrossRef]
- Xia, C.; Shi, Z.; Kou, H.; Meng, S.; Liu, M. Sensitivity analyses of random cave groups on karst tunnel stability based on water–rock interaction using a novel contact dynamic method. Undergr. Space 2024, 18, 162–186. [Google Scholar] [CrossRef]
- Kong, G.Q.; Cao, T.; Hao, Y.H.; Zhou, Y.; Ren, L.W. Thermomechanical properties of an energy micro pile-raft foundation in silty clay. Undergr. Space 2021, 6, 76–84. [Google Scholar] [CrossRef]
- Cui, C.; Meng, K.; Xu, C.; Liang, Z.; Li, H.; Pei, H. Analytical solution for longitudinal vibration of a floating pile in saturated porous media based on a fictitious saturated soil pile model. Comput. Geotech. 2021, 131, 103942. [Google Scholar] [CrossRef]
- Li, L.; Wu, W.; Liu, H.; Lehane, B. DEM analysis of the plugging effect of open-ended pile during the installation process. Ocean Eng. 2021, 220, 108375. [Google Scholar] [CrossRef]
- Peng, Y.; Liu, H.; Li, C.; Ding, X.; Deng, X.; Wang, C. The detailed particle breakage around the pile in coral sand. Acta Geotech. 2021, 16, 1971–1981. [Google Scholar] [CrossRef]
- Moradshahi, A.; Faizal, M.; Bouazza, A.; McCartney, J.S. Effect of nearby piles and soil properties on thermal behaviour of a field-scale energy pile. Can. Geotech. J. 2021, 58, 1351–1364. [Google Scholar] [CrossRef]
- Zheng, C.; Kouretzis, G.; Ding, X.; Luan, L. Vertical vibration of end-bearing single piles in poroelastic soil considering three-dimensional soil and pile wave effects. Comput. Geotech. 2022, 146, 104740. [Google Scholar] [CrossRef]
- Wu, W.; Yang, Z.; Liu, X.; Zhang, Y.; Liu, H.; El Naggar, M.H.; Xu, M.; Mei, G. Horizontal dynamic response of pile in unsaturated soil considering its construction disturbance effect. Ocean Eng. 2022, 245, 110483. [Google Scholar] [CrossRef]
- Li, L.; Liu, X.; Liu, H.; Wu, W.; Lehane, B.M.; Jiang, G.; Xu, M. Experimental and numerical study on the static lateral performance of monopile and hybrid pile foundation. Ocean Eng. 2022, 255, 111461. [Google Scholar] [CrossRef]
- He, S.; Lai, J.; Li, Y.; Wang, K.; Wang, L.; Zhang, W. Pile group response induced by adjacent shield tunnelling in clay: Scale model test and numerical simulation. Tunn. Undergr. Space Technol. 2022, 120, 104039. [Google Scholar] [CrossRef]
- Cui, C.; Meng, K.; Xu, C.; Wang, B.; Xin, Y. Vertical vibration of a floating pile considering the incomplete bonding effect of the pile-soil interface. Comput. Geotech. 2022, 150, 104894. [Google Scholar] [CrossRef]
- Kong, G.; Fang, J.; Lv, Z.; Yang, Q. Effects of pile and soil properties on thermally induced mechanical responses of energy piles. Comput. Geotech. 2023, 154, 105176. [Google Scholar] [CrossRef]
- Zhou, Y.; Kong, G.; Li, J. Performance of a belled pile influenced by pile head freedom response to a cooling–heating cycle. J. Geotech. Geoenviron. Eng. 2023, 149, 04022133. [Google Scholar] [CrossRef]
- Li, R.; Yin, Z.-Y.; He, S.-H. 3D reconstruction of arbitrary granular media utilizing vision foundation model. Appl. Soft Comput. 2025, 169, 112599. [Google Scholar] [CrossRef]
- Jiang, C.; Liu, L.; Wu, J.P. A new method determining safe thickness of karst cave roof under pile tip. J. Cent. South Univ. 2014, 21, 1190–1196. [Google Scholar] [CrossRef]
- Sheng, M.; Lu, F.; Jiang, N.; Guo, P.; Li, X.; An, R.; Wang, Y. Bearing behavior of pile foundation in karst region: Physical model test and finite element analysis. Appl. Rheol. 2024, 34, 20230115. [Google Scholar] [CrossRef]
- Zhang, J. Study on Bearing Mechanism and Stability Evaluation of Pile Foundation in Karst Cave Areas with Inclined Roof. Ph.D. Thesis, Shandong University, Jinan, China, 2019. (In Chinese). [Google Scholar]
- Serrano, A.; Olalla, C. Ultimate bearing capacity at the tip of a pile in rock—Part 1: Theory. Int. J. Rock Mech. Min. Sci. 2002, 39, 833–846. [Google Scholar] [CrossRef]
- Serranoa, A.; Olallab, C. Ultimate bearing capacity at the tip of a pile in rock—Part 2: Application. Int. J. Rock Mech. Min. Sci. 2002, 39, 847–866. [Google Scholar] [CrossRef]
- Lei, Y.; Li, P.; Liu, Z.; Li, J.; Hu, W.; Chen, G.; Liu, S. Experimental study on ultimate bearing capacity and failure mode of pile foundation crossing karst cave in karst areas. Chin. J. Appl. Mech. 2023, 40, 1343–1353. (In Chinese) [Google Scholar]
- Feng, Z.; Chen, H.; Xia, C.; Li, S.; Cai, J.; He, J. Prediction of bearing capacity of pile foundation in karst area based on model of metabolic GM (1, 1). In IOP Conference Series: Earth and Environmental Science; IOP Publishing: Bristol, UK, 2018; Volume 189, p. 042012. [Google Scholar] [CrossRef]
- Feng, Z.; Chen, J.; He, J.; Huang, Z.; Dong, Y.; Jiang, D.; Meng, Y. Study on vertical bearing characteristics of bridge pile foundation in karst area considering the size. In IOP Conference Series: Materials Science and Engineering; IOP Publishing: Bristol, UK, 2020; Volume 780, p. 022003. [Google Scholar] [CrossRef]
- Wang, P.; Ding, H.; Zhang, P. Influence of Karst Caves at Pile Side on the Bearing Capacity of Super-Long Pile Foundation. Math. Probl. Eng. 2020, 2020, 4895735. [Google Scholar] [CrossRef]
- Zhang, Q.; Qiao, S.; Xing, Y.; Zhang, K.; Cui, W.; Wang, Z.; Chen, D. Study on bearing characteristics of single pile crossing unfilled karst cave. J. Hunan Univ. 2022, 49, 186–196. (In Chinese) [Google Scholar]
- Gotman, N.Z.; Evdokimov, A.G. Calculation of Bridge-Support Pile Foundations Taking Karst Deformations Into Account in the Base. Soil Mech. Found. Eng. 2023, 60, 401–409. [Google Scholar] [CrossRef]
- Zhang, Y.; Deng, J.; Yang, X.; Zhao, M.; Wang, G. Stability analysis method of pile foundation in karst area base on cavern spatial form. China J. Highw. Transp. 2019, 32, 37–45. (In Chinese) [Google Scholar] [CrossRef]
- Zhao, M.; Xiao, Y.; Xu, Z.; Yang, C.; Hu, Q.; Liu, J. Bearing capacity at tip of rock-socketed pile in karst areas. Chin. J. Geotech. Eng. 2017, 39, 1123–1129. (In Chinese) [Google Scholar]
- Hu, B.; Yang, M.; Yuan, T.; Zhao, M. Study on bearing capacity of piles in karst based on settlement control. J. Highw. Transp. Res. Dev. 2009, 26, 11–15. (In Chinese) [Google Scholar]
- Pham, T.A.; Akan, R.; Tabaroei, A. A simplified soil-structure interaction model for load-settlement analysis of piles. Can. Geotech. J. 2025, 62, 1–24. [Google Scholar] [CrossRef]
- JGJ 106-2014; Technical Code for Testing of Building Foundation Piles. Architecture Building Press: Beijing, China, 2014.
- He, J.; Feng, Z.; Dong, Y.; Chen, H.; Huang, Z.; Xia, C.; Zhao, Y.; Hu, H. Grey theory study on the influence of karst-pile-soil coupling on the ultimate bearing capacity of pile foundation in karst development area. In IOP Conference Series: Earth and Environmental Science; IOP Publishing: Bristol, UK, 2019; Volume 218, p. 012025. [Google Scholar] [CrossRef]
- Zhang, H.; Ma, L.; Zhang, Z.; Sun, Y. Test research on factors influencing bearing capacity of rock-socketed piles in karst area. Rock Soil Mech. 2013, 34, 92–100. (In Chinese) [Google Scholar] [CrossRef]
- Feng, Z.; Hu, H.; Dong, Y.; Wang, F.; Jia, M.; Zhao, Y.; He, J. Effect of steel casing on vertical bearing characteristics of steel tube-reinforced concrete piles in loess area. Appl. Sci. 2019, 9, 2874. [Google Scholar] [CrossRef]
- Chen, G. Research on Stability of Elliptical Karst Cave Under Pile Foundation in Karst Area. Master’s Thesis, Xi’an University of Architecture and Technology, Xi’an, China, 2023. (In Chinese). [Google Scholar]
- Feng, Z.; Xu, B.; Chen, H.; Xia, C.; Cai, J. Study on the influence of different treatment measures for karst caves on bearing characteristics of pile foundation. J. Archit. Civ. Eng. 2024, 41, 151–158. (In Chinese) [Google Scholar] [CrossRef]
- Asgari, A.; Bagheri, M.; Hadizadeh, M. Advanced seismic analysis of soil-foundation-structure interaction for shallow and pile foundations in saturated and dry deposits: Insights from 3D parallel finite element modeling. Structures 2024, 69, 107503. [Google Scholar] [CrossRef]
- Asgari, A.; Ranjbar, F.; Bagheri, M. Seismic resilience of pile groups to lateral spreading in liquefiable soils: 3D parallel finite element modeling. Structures 2025, 74, 108578. [Google Scholar] [CrossRef]
Figure 2.
Simulated interior of the cavity. (a) Underlying cavity. (b) Traversed cavity.
Figure 2.
Simulated interior of the cavity. (a) Underlying cavity. (b) Traversed cavity.
Figure 3.
Overall layout of the test.
Figure 3.
Overall layout of the test.
Figure 4.
Pile strain gauge layout.
Figure 4.
Pile strain gauge layout.
Figure 5.
Pile layout diagram.
Figure 5.
Pile layout diagram.
Figure 6.
Load–settlement curve.
Figure 6.
Load–settlement curve.
Figure 7.
Pile axial force diagram and side friction diagram for working condition 1. (a) Pile axial force diagram. (b) Side friction diagram.
Figure 7.
Pile axial force diagram and side friction diagram for working condition 1. (a) Pile axial force diagram. (b) Side friction diagram.
Figure 8.
Pile axial force diagram and side friction diagram for working condition 2. (a) Pile axial force diagram. (b) Side friction diagram.
Figure 8.
Pile axial force diagram and side friction diagram for working condition 2. (a) Pile axial force diagram. (b) Side friction diagram.
Figure 9.
Pile axial force diagram and side friction diagram for working condition 3. (a) Pile axial force diagram. (b) Side friction diagram.
Figure 9.
Pile axial force diagram and side friction diagram for working condition 3. (a) Pile axial force diagram. (b) Side friction diagram.
Figure 10.
Finite element analysis model and mesh division. (a) Finite element analysis model. (b) Mesh division.
Figure 10.
Finite element analysis model and mesh division. (a) Finite element analysis model. (b) Mesh division.
Figure 11.
Comparison of model test and numerical simulation results. (a) Model test. (b) Numerical simulation.
Figure 11.
Comparison of model test and numerical simulation results. (a) Model test. (b) Numerical simulation.
Figure 12.
Diagram of the underlying eccentric cavity.
Figure 12.
Diagram of the underlying eccentric cavity.
Figure 13.
Q-S curve when horizontal distance changes.
Figure 13.
Q-S curve when horizontal distance changes.
Figure 14.
Relationship between ultimate bearing capacity and horizontal distance D.
Figure 14.
Relationship between ultimate bearing capacity and horizontal distance D.
Figure 15.
Increase in ultimate bearing capacity.
Figure 15.
Increase in ultimate bearing capacity.
Figure 16.
Backfilling condition diagram of underlying cavity.
Figure 16.
Backfilling condition diagram of underlying cavity.
Figure 17.
Q-S curve of underlying cavity backfill.
Figure 17.
Q-S curve of underlying cavity backfill.
Figure 18.
Pile axial force diagram and side friction diagram for backfilling piles in underlying cavities. (a) Pile axial force diagram. (b) Side friction diagram.
Figure 18.
Pile axial force diagram and side friction diagram for backfilling piles in underlying cavities. (a) Pile axial force diagram. (b) Side friction diagram.
Figure 19.
Diagram of the beaded cavity.
Figure 19.
Diagram of the beaded cavity.
Figure 20.
Q-S curve of beaded cavity backfill.
Figure 20.
Q-S curve of beaded cavity backfill.
Figure 21.
Pile axial force diagram and side friction diagram of piles in beaded cavities. (a) Pile axial force diagram. (b) Side friction diagram.
Figure 21.
Pile axial force diagram and side friction diagram of piles in beaded cavities. (a) Pile axial force diagram. (b) Side friction diagram.
Figure 22.
Pile axial force diagram and side friction diagram for backfilling piles in beaded cavities. (a) Pile axial force diagram. (b) Side friction diagram.
Figure 22.
Pile axial force diagram and side friction diagram for backfilling piles in beaded cavities. (a) Pile axial force diagram. (b) Side friction diagram.
Table 1.
Physical and mechanical properties of rock and soil layers.
Table 1.
Physical and mechanical properties of rock and soil layers.
| | Density
(g/cm3) | Elastic Modulus (MPa) | Poisson’s
Ratio | Cohesion
(kPa) | Internal Friction Angle (°) |
|---|
| Model piles | 2.7 | 40,000 | 0.27 | / | / |
| River sand | 0.73 | 15 | 0.27 | 1.5 | 27 |
| Simulated Limestone | 1.69 | 1070 | 0.25 | 200 | 30 |
| Cavity backfill | 1.3 | 90 | 0.25 | 15 | 20 |
Table 2.
Main physical properties of calcareous sand samples with varying fines contents.
Table 2.
Main physical properties of calcareous sand samples with varying fines contents.
| Horizontal Distance D | 0.5 d | 1 d | 1.5 d | 2 d | 2.5 d | 3 d | 3.5 d | No Cave |
|---|
| Ultimate bearing capacity/kN | 41 | 49 | 59 | 68 | 76 | 81.5 | 84 | 86.5 |
| Prototype pile/MN | 16.4 | 19.6 | 23.6 | 27.2 | 30.4 | 32.6 | 33.6 | 34.6 |
| Disclaimer/Publisher’s Note: The statements, opinions and data contained in all publications are solely those of the individual author(s) and contributor(s) and not of MDPI and/or the editor(s). MDPI and/or the editor(s) disclaim responsibility for any injury to people or property resulting from any ideas, methods, instructions or products referred to in the content. |
© 2025 by the authors. Licensee MDPI, Basel, Switzerland. This article is an open access article distributed under the terms and conditions of the Creative Commons Attribution (CC BY) license (https://creativecommons.org/licenses/by/4.0/).


 ,
, 


