Article

Optimizing Urban Spaces: A Parametric Approach to Enhancing Outdoor Recreation Between Residential Areas in Riyadh, Saudi Arabia

by
Amr Sayed Hassan Abdallah
1,
Randa Mohamed Ahmed Mahmoud
2 and
Mohammed A. Aloshan
1,*
1
Department of Architectural Engineering, College of Engineering, Imam Mohammad Ibn Saud Islamic University (IMSIU), Riyadh 11432, Saudi Arabia
2
Department of Architecture, Faculty of Engineering, Assiut University, Assiut 71516, Egypt
*
Author to whom correspondence should be addressed.
Buildings 2025, 15(9), 1527; https://doi.org/10.3390/buildings15091527
Submission received: 23 March 2025 / Revised: 25 April 2025 / Accepted: 27 April 2025 / Published: 2 May 2025
(This article belongs to the Section Architectural Design, Urban Science, and Real Estate)

Abstract

Improvement of recreational areas between the residential areas to achieve human behavior and the concept of humanization is urgently needed to achieve the 2030 vision of Saudi Arabia. This study aims to develop a parametric urban optimization framework to optimize the outdoor thermal comfort in outdoor recreational areas between residential buildings in Riyadh City, Saudi Arabia, based on the 2030 vision of Saudi Arabia to achieve a high standard of quality of life with thermal comfort. Measurement was conducted inside the sports walking path with walk-through observation and interviews. Then, case study geometry was generated computationally, using Rhinoceros software and its plug-in Grasshopper to implement the set of development scenarios. Then, the optimization process for the case study was integrated with 192 proposed development solutions to assess the solutions’ influence in reducing the Universal Thermal Comfort Index (UTCI) and average solar irradiance, besides increasing energy generated by PV panels. EnergyPlus engine and Ladybug plug-in are used to integrate PV panels with shading scenarios, to utilize the high solar irradiation, and to calculate the generated electrical energy. The results concluded that trees with diameters between 10 and 15 m could achieve thermal comfort and reduction UTCI by 11.26 K and average solar irradiance by 642.77 W/m2 with average energy generation of PV panel and optimum inclination angle of 20°. The integration of PV with shading scenarios generates electricity for every square meter of PV panel, equal to 578.84 kWh/m2 for lighting poles and service areas within the recreational areas. The results of this study help to improve the current park as a prototype, for which results can be implemented in more than 8100 instances of gardens, parks, and municipal squares in Saudi Arabia.

1. Introduction

Humanizing cities as a concept is based on human behavior, taking into account different levels of planning and development of cities and urban areas. Due to the rapid population growth, increasing urbanization, and the impact of global climate change, the microclimate of urban spaces has significantly changed, and several challenges exist to human well-being and space sustainability [1]. Therefore, there is a rising demand for providing urban living spaces to achieve a high quality of life for inhabitants and more sustainability for urban areas. In response to these demands and challenges, the Saudi 2030 vision of the Kingdom of Saudi Arabia paid great attention to enhancing the quality of life for the population through several mechanisms, including the urban design sector, to encourage healthy and physical life and enhance walking and practice public life [2]. On the other side, several scientific researchers, such as [3,4,5], have proposed, developed, and provided urban heat mitigation strategies and methodologies to improve outdoor thermal comfort in urban areas and improve the quality of life. While urban areas are noticeably influenced by the impacts of climate change, which affect outdoor thermal comfort and overall quality of life, the study has reviewed improvement solutions in hot climates, such as [6,7]. Consequently, there is a need to utilize parametric urban design methodology because it can be considered a beneficial tool for achieving sustainable and healthy solutions [8]. Accordingly, the relevant literature is categorized into three main areas: optimizing urban morphological parameters, urban morphological and building geometrical parameters, and the positive utilization of high solar radiation and solar energy in hot climates.

1.1. Background and Literature

Many studies have addressed the optimization process in urban morphological parameters, such as vegetation, shading areas, and coverage ratio, to improve outdoor thermal comfort. For example, authors of [3] have studied the effect of different types and locations of greenery scenarios (on streets, walls, and rooftops) on the outdoor air temperature (Ta) and air quality. It was found that the highest reduction in Ta reached 18.02 °C when the buildings were stepped and with green walls. Furthermore, the influence of greening façades and roofs on outdoor thermal comfort and indoor energy consumption in the residential cluster has been investigated by applying a couple-simulation strategy by Envi-met4.4.5 and DesignBuilder software (V.5.0.3.007) [9]. Hence, the reduction in Physiological Equivalent Temperature (PET) and energy consumption were 11.2 °C and 32.67%, respectively. In addition, ref. [4] investigated the influence of vegetation on the outdoor thermal comfort index (PET) in two urban plazas with different morphologies in Algeria, using ENVI-met software 4.4.5. Due to vegetation, the reduction in Ta and mean radiant temperature Tmrt reached 1 °C and 20 °C, respectively. In addition, authors of [5] have investigated the effect of vegetation, shading, and hybrid scenarios on improving outdoor thermal comfort in urban public spaces between residential buildings using ENVI-met4.4.5 software. The results revealed that the PET was reduced to 19.10 °C as a result of applying hybrid scenarios (grass, trees, and semi-shading). A novel optimization approach to obtain the optimal tree location and the lowest Universal Thermal Comfort Index (UTCI) in urban areas has been proposed by [1] based on three optimization algorithms. As a result, the clustering of tree canopies has a cooling impact on urban areas. In another context, nine mitigation strategies (different shading, vegetation, and hybrid) were evaluated in two school courtyards using ENVI-met software 4.4.5 to optimize outdoor thermal comfort [10]. The results concluded that the hybrid diagonal staggered shading (at a height of 4 m) with trees strategy caused a PET drop of a value of 18.6 °C.
On the other hand, a set of studies has elaborated on the interaction between the morphological and geometrical parameters to optimize outdoor and indoor thermal comfort. Ref. [11] used a parametric design environment to improve the energy cooling and UTCI in three types of courtyards by optimizing three parameters—building heights, orientation, and interspaces of courtyard blocks—using a Ladybug plug-in. Hence, the reduction in UTCI, cooling load, and heating load were 1.6 °C, 31.7%, and 4%, respectively. Meanwhile, ref. [12] used the Grasshopper and Ladybug plug-in to develop a parametric approach for optimizing urban parameters (rotation and aspect ratio) and building parameters (window–wall ratio and topology) to enhance thermal comfort, cooling, and heating energy. It was found that outdoor thermal comfort was improved by 25.85%, besides 72.76% and 93.67% enhancement in the cooling and heating energies, respectively. Ref. [13] used Wallacei, a plug-in in Grasshopper, as a multi-objective optimization algorithm to evaluate the impact of three building additions (horizontal, vertical, and mixed) in existing buildings on optimizing the floor area ratio and solar radiation and reducing solar shade. The results revealed that mixed addition could improve the floor area ratio by 70%. Conversely, vertical additions caused the lowest solar shade. Meanwhile, the optimization of eight urban morphology parameters to improve solar radiation in four urban scales (district, cluster, block, and plot) has been studied using the Grasshopper and Ladybug plug-in [14]. Then, the correlation performance between parameters and objectives has been analyzed. It was found at the scale of district, cluster, and block that the highest effective parameters are block surface ratio (R2 = 0.96), minimum distance between buildings (R2 = 0.7), and block surface ratio (R2 = 0.55), respectively. Additionally, ref. [15] used Galapagos, a plug-in in Grasshopper, as an evolutionary algorithm to optimize thermal comfort indices (PET, UTCI) based on various spatial indicators (sky view factor, floor area ratio, building height, wall area ratio, building density, green plot ratio, and pavement area ratio). Findings revealed the improvement of outdoor thermal comfort by up to 25% and 33% for UTCI and PET index, respectively. Likewise, ref. [16] has developed a parametric-simulation framework to assess the impact of three parameters—street aspect ratio, building density, and street orientation—on improving UTCI. As a result, the reductions of UTCI were by 1 °C and 1.02 °C, with an increase of each 10% of building density and 1 unit of street aspect ratio, respectively. Eventually, ref. [17] used Revit software 2023 to optimize courtyard size, orientation, and the arrangement of buildings around the courtyard in four types of courtyards (square, rectangle, triangle, and circle) to increase the shading area and save cooling and heating energies. It was found that, in hot climates, the rectangular courtyard was the most efficient in providing shading and, consequently, reducing energy use.
A few studies have addressed the integration of solar photovoltaic panels (PV) in outdoor environments to utilize high solar radiation in generating energy and reducing inner energy consumption. For example, ref. [18] has presented a tool-chain based on multi-objective optimization to improve outdoor thermal comfort and life cycle assessment. Hence, the tool could investigate the impact of outdoor vegetation and photovoltaics on buildings’ façades to obtain the optimal solution. Also, ref. [19] has developed an Urban Block Generator tool in Rhino + Grasshopper to investigate the interactions between solar energy use and urban design in 18 blocks in Singapore. Consequently, the parameters of block dimensions, building patterns, and floor area ratios are optimized to enhance solar energy penetration and capital costs for photovoltaic panel installations. Similarly, ref. [20] has parametrically assessed the interaction between urban morphology and the annual average irradiance on rooftops and façades to utilize PV panels in generating renewable energy. It was found that urban PV integration is beneficial for urban planners to consider in sustainable cities.
Based on the 2030 vision of Saudi Arabia [2], developing an enriching lifestyle is essential, especially for the urban design sector and recreational areas between residential buildings. This study is very important for recreational areas in a hot, arid climate in general, and Saudi Arabia in particular, as it contains more than 8100 instances of gardens, parks, and municipal squares [21]. There is no doubt that the essential trends of sustainable cities and quality of life have been the focal axes of many studies, such as [1,18,20]. Recently, the concept of humanizing cities has become the main goal in the future vision of several countries around the world. Therefore, the Saudi 2030 vision seeks to apply the concept of humanizing cities and high quality of life in its cities to list its three cities in the top 100 cities in the world [2]. At the same time, the urban design sector encounters a set of problems as a result of global climate change to improve the thermal performance of outdoor urban spaces, which impacts the inhabitants’ social activities.

1.2. Research Objectives

Consequently, there is a research gap in using parametric urban design methodology to enhance outdoor thermal comfort and utilizing high solar irradiance to generate energy in recreational areas in hot climates [11,17]. Thus, the main objective is optimizing the outdoor thermal comfort in outdoor recreational areas between residential buildings in Riyadh City, Saudi Arabia. Consequently, the parametric urban optimization framework was proposed and applied in Rhino 3D+ Grasshopper software (V 8), which contributed the following:
(a)
Improving outdoor thermal comfort in recreational areas to achieve the city’s sustainability principles.
(b)
Utilizing the maximum solar energy to provide renewable energy and a high quality of life.
(c)
Developing a prototype of the outdoor recreational area that can be applied in many various residential clusters to enhance the concept of humanizing cities.
Hence, the novelty of this study is utilizing the hybrid shading strategy (trees and shading system-integrated PV panels) in improving outdoor thermal comfort and generating energy from a renewable resource to benefit from it in terms of lighting poles and services area in Alhasnaa Park, Riyadh [5,20]. This park is one of the biggest recreational areas in the Al-Falah district, north Riyadh, and it was designed as a prototype with different social activities to be repeated in different places and different districts.

2. Methodology

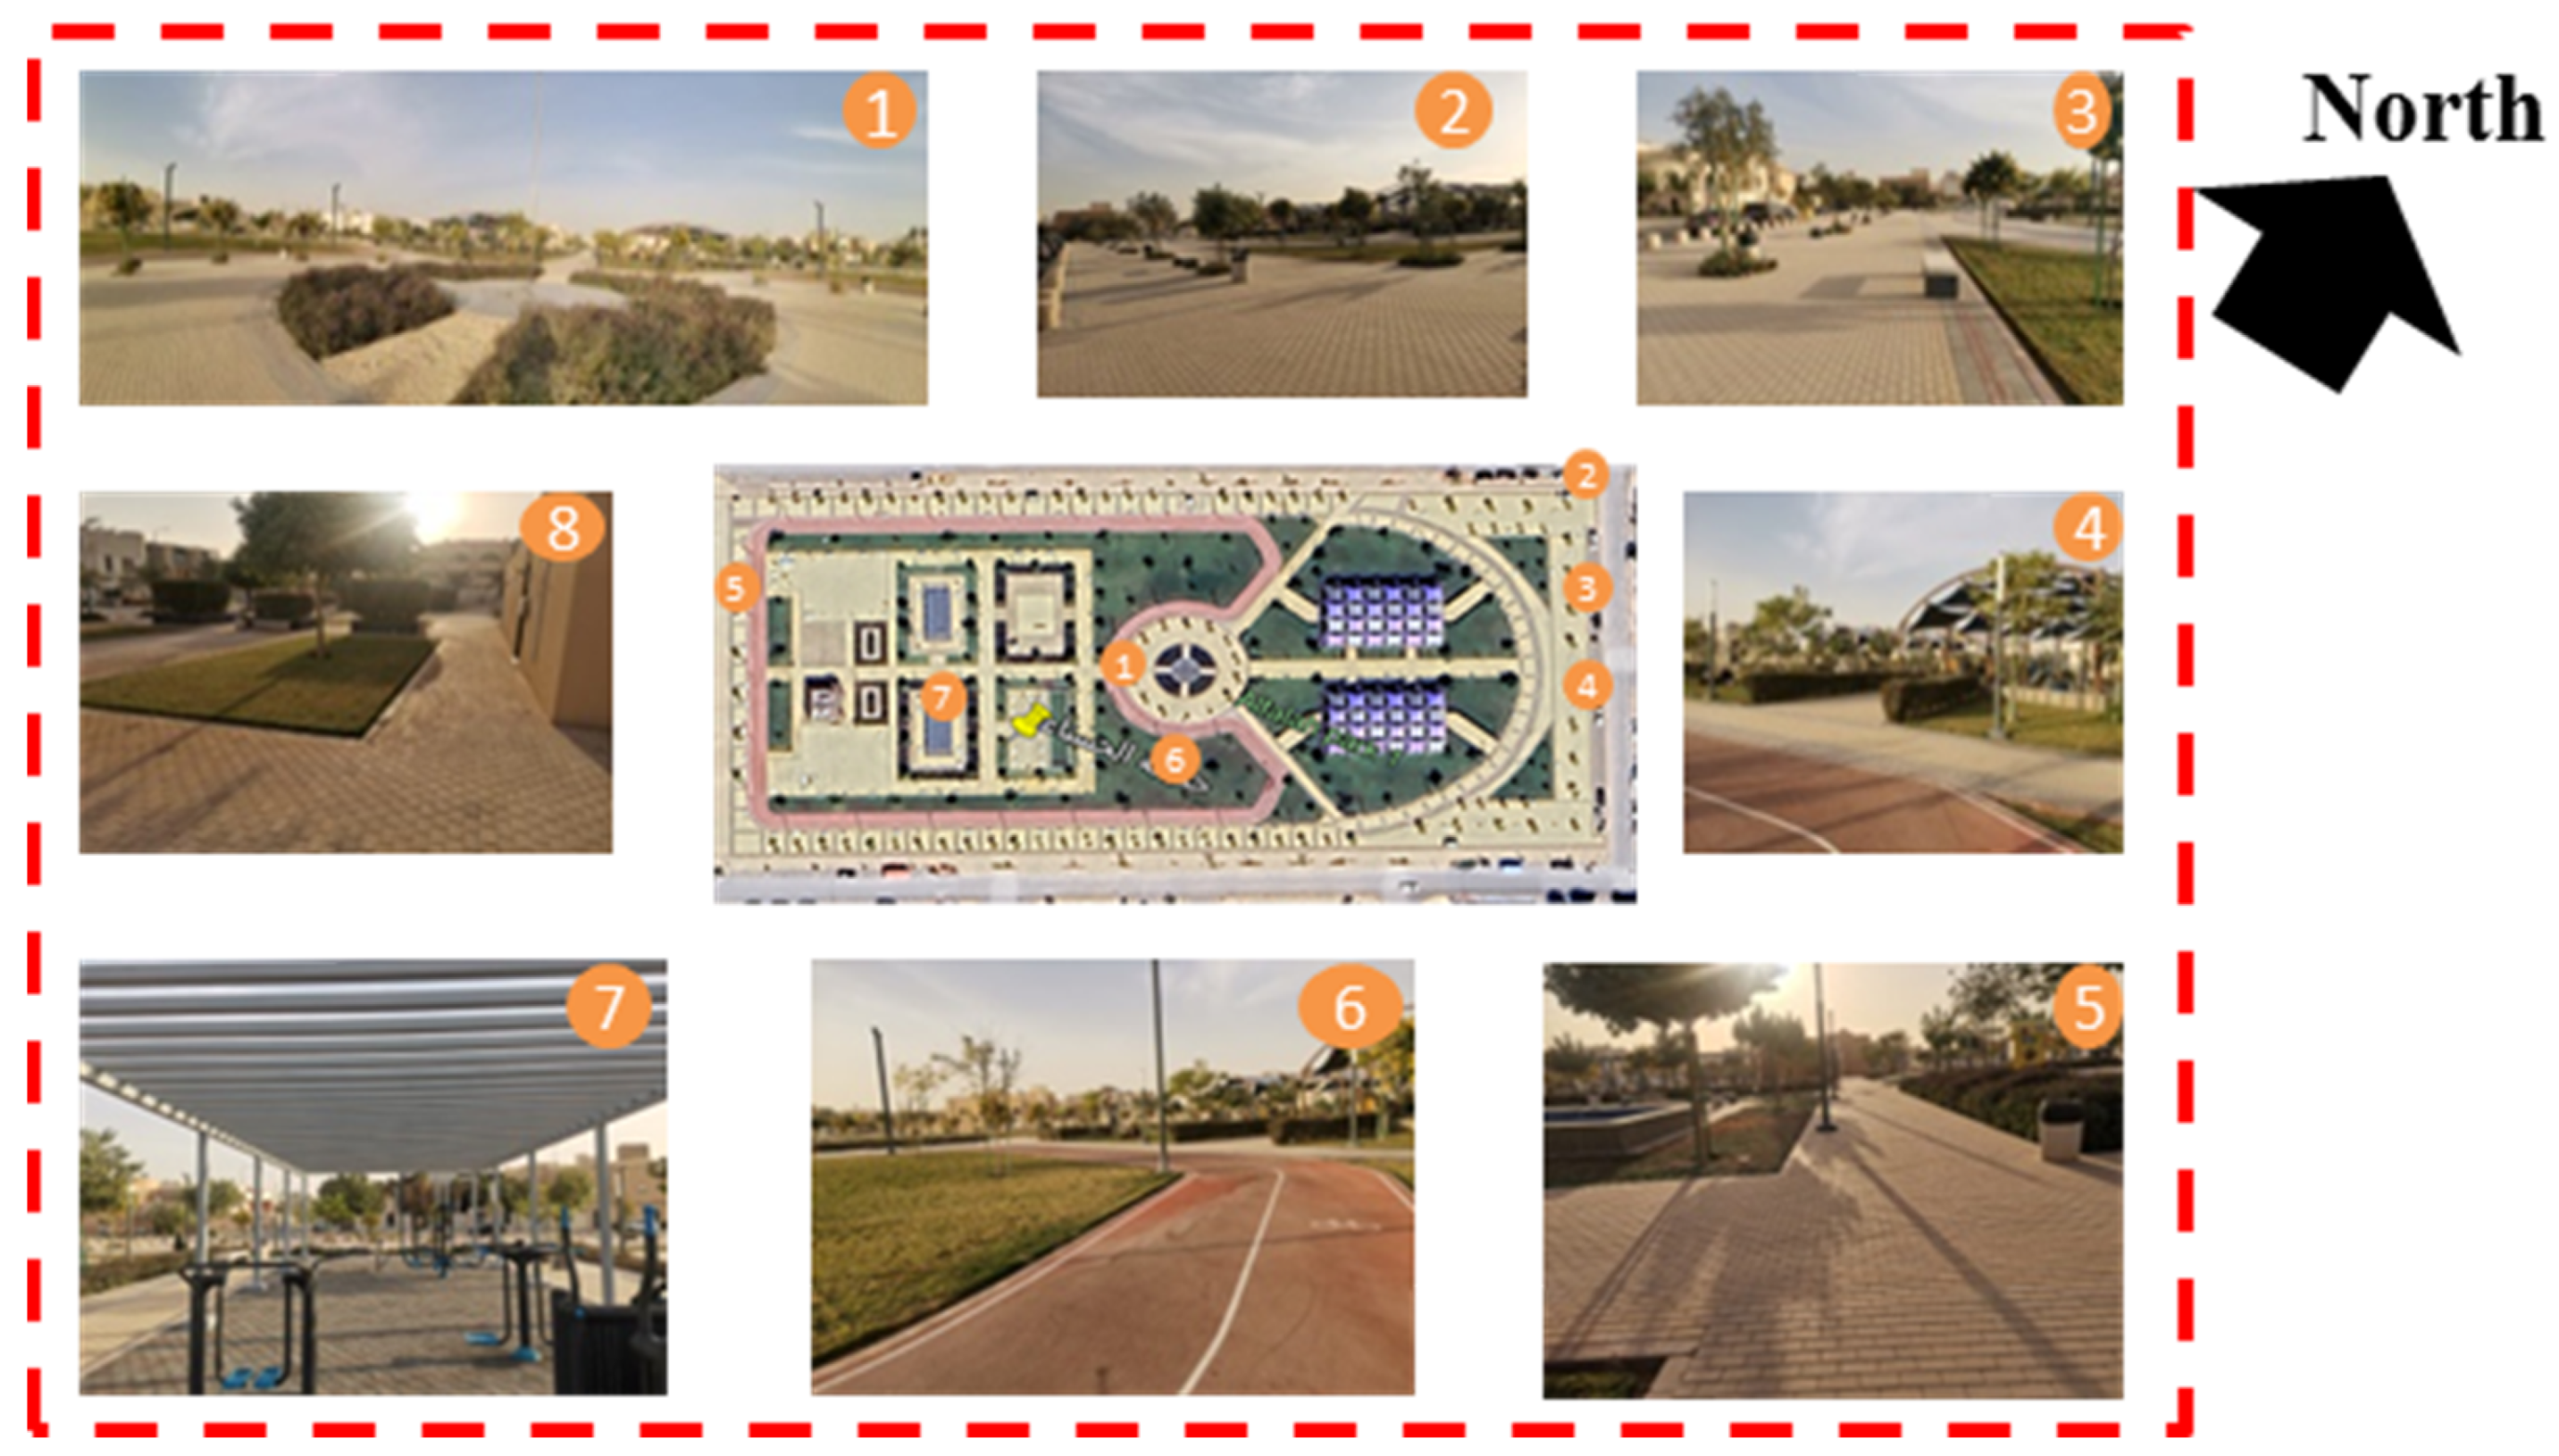
2.1. Regional Climate and Case Study Analysis

Riyadh has a desert climate with high air temperatures during summer and very mild temperatures during winter. The average temperature during summer is 43 °C during the daytime. The average humidity is very low (19%) due to high temperatures with low precipitation. The Al-Falah district was selected for the study as it is one of the districts that was designed as a well-organized district with a high quality of life standard in Riyadh.
The Al-Falah district is located in the eastern part of Riyadh, as shown in Figure 1. Alhasnaa Park, the case study area, is situated within the Al-Falah district and spans an area of 25,000 m2. The park includes two semi-shaded children’s play areas, a sports walkway, two open gym zones, a fountain, an open sports field, a sitting area, a service area, and public restrooms. Figure 2 presents various views of the park, including the sports walkway and shaded play zones.
Although Riyadh experiences low levels of precipitation, the city has made significant strides in sustainable urban greening initiatives under Vision 2030 and the Green Riyadh Project. These efforts primarily utilize treated wastewater as the irrigation source. The municipality has established an extensive 1350 km irrigation network, capable of supplying up to 1.7 million cubic meters of treated water daily, effectively meeting the irrigation needs of approximately 7.5 million trees across the city. This approach not only mitigates dependency on potable water resources but also supports the creation of cooler microclimates in urban areas and aligns with the national strategy to reduce energy consumption through improved urban design. These infrastructure investments ensure the sustainability and feasibility of tree planting in public parks such as Alhasnaa [2,22].
Figure 1. The satellite image of Riyadh city, its location in Saudi Arabia, and the location of the study area of Alhasnaa Park in Riyadh (summarized from [23]).
Buildings 15 01527 g001
Figure 2. Pictures of different parts of the recreational area of Alhasnaa Park (summarized from [23]).
Buildings 15 01527 g002

2.2. Data Collection

The surface of the sports walkway is made of rubber for walking and running. The material of the ground in the children’s playing area is made of rubber, too. The children’s playing area is shaded with a steel structure with a semi-shaded tent. The gym sports area is covered with a semi-shaded steel beam made of a steel structure. There are various tree types used in the park. The long trees are located in the green area, only without shading the sports walkway or the path in the park. The Shrubby Orache plant is used in the open middle spaces and on the edge of some paths.
Measurement was conducted for temperature and humidity to model validation and analysis for the outdoor environment using walk-through observation, interviews, and surface temperature distribution measurement using thermal images (Flir camera C2). Measurement devices were used to measure temperature and humidity at a height of 1.8 m, according to ASHRAE Standard 55-2017 [24], using datalogger TR-72 Ui when the outdoor temperature reached 29 °C during daytime for simulation validation and to conduct a pilot study. An interview survey was conducted for different people and families staying inside the park, inquiring about thermal sensation vote, the reason for discomfort, and elements that contribute to comfort in open spaces. The interview survey was conducted during the period from 1 pm until 5 pm on the weekend for around 30 people. Different questions were asked of different families concerning the following: How satisfied are you with the overall temperature, humidity, and wind speed level? What is the source of your discomfort within the space? If you feel comfortable within the space, which of the following factors contributes to your satisfaction? This is important to understand the feelings and thermal behavior of different people doing different activities inside the park.

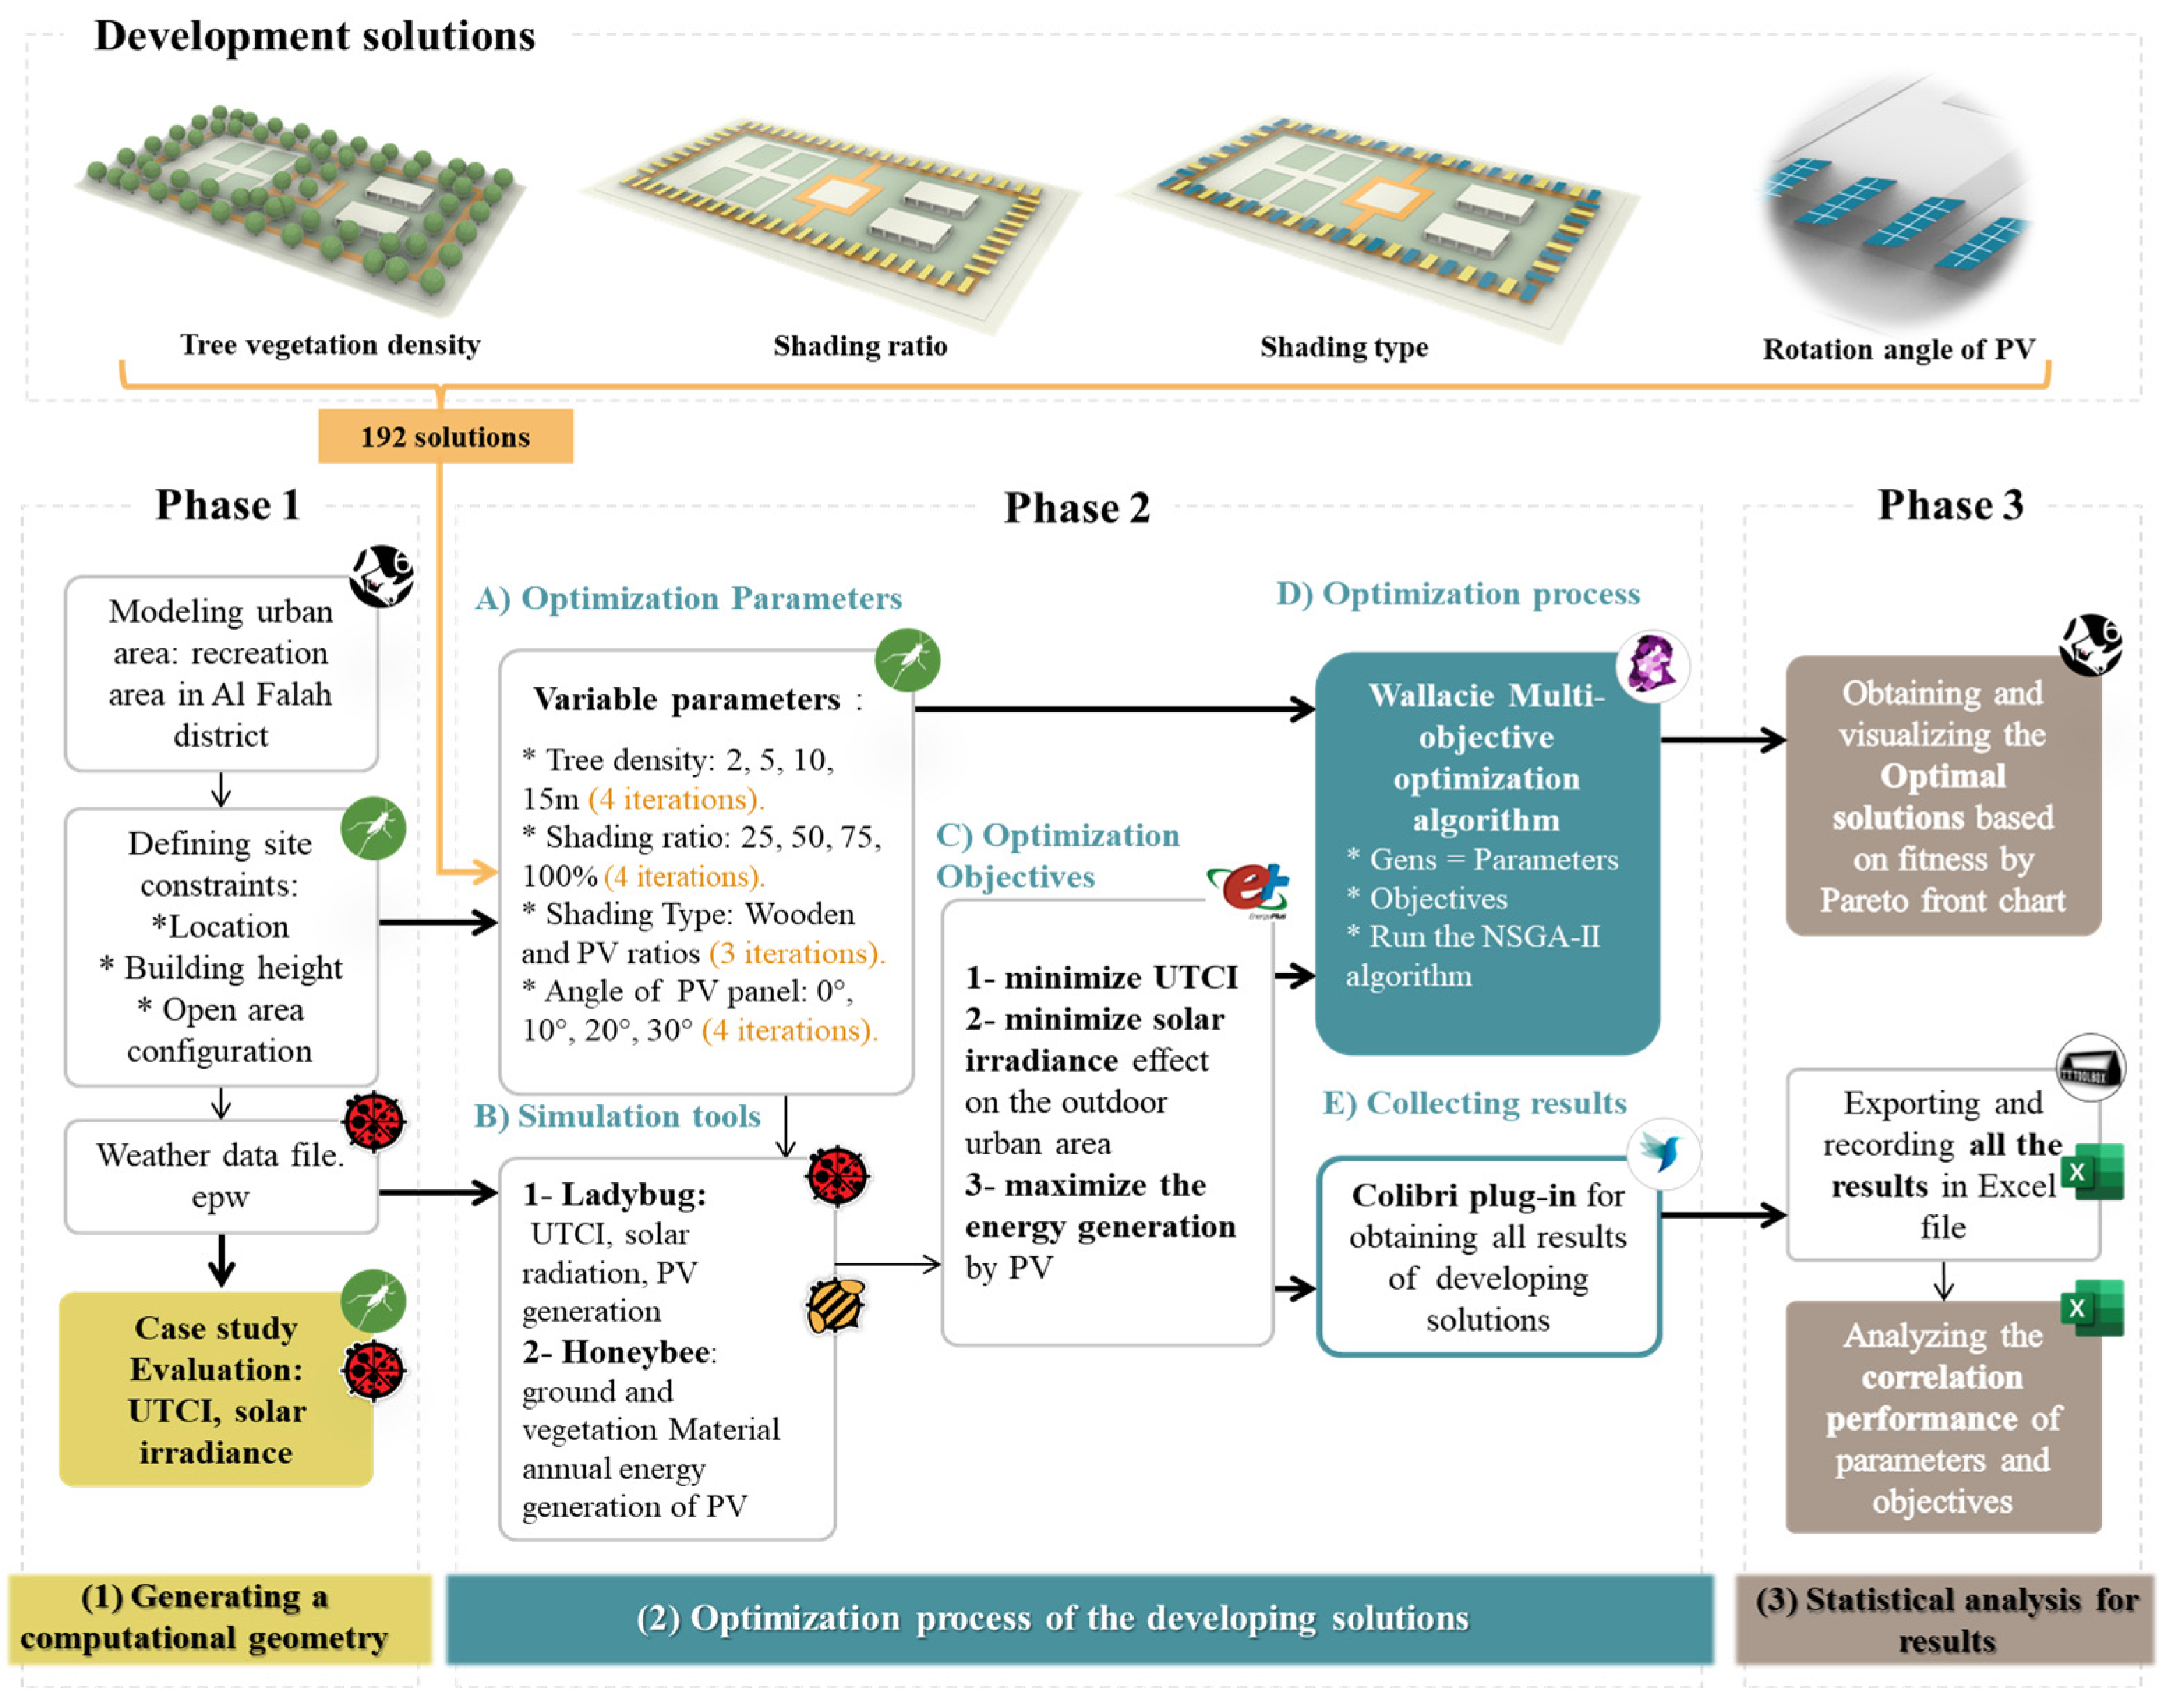
2.3. Establishing the Parametric Urban Optimization Framework

In order to implement a sustainable concept in designing urban areas, there is a need for a sustainable tool that can be developed and renewed over time to keep pace with the requirements and changes in urban spaces and meet the users’ needs to achieve the Saudi Vision 2030. Consequently, this study proposed a parametric urban optimization framework based on a multi-objective optimization algorithm. As shown in Figure 3, the framework mainly consists of three phases. First, the case study geometry will be generated computationally using Rhinoceros software (V 8) and its plug-in Grasshopper. The layout of the park was built inside the software, changing the curved pathway to a straight line without affecting the simulation results. Then, a set of development solutions seeking to improve the case study as a pre-step before/after the following was presented as variable parameters. After that, the optimization process for the case study integrated with the proposed development solutions will be conducted to assess the solutions’ influence. Following that, determining the optimal solutions and analyzing the results will be obtained in the last phase. For computationally implementing the parametric urban optimization framework, Rhinoceros software Version 8 and its plug-in Grasshopper were selected based on efficiency in providing parametric models [14,25]. Further, Ladybug was an essential plug-in that was used to insert the weather data file, simulate outdoor thermal comfort, and generate PV panels. Accordingly, the HoneyBee plug-in was used to apply the vegetation and soil materials and calculate the energy generation of solar energy based on the EnergyPlus engine. Nevertheless, Wallacie, as a multi-objective optimization algorithm, was used in the optimization process to obtain the optimal solutions [13,25]. Also, the Colibri plug-in was the collection tool for all results and exported them in an Excel sheet by TT Toolbox plug-in to be analyzed later.

2.3.1. Phase 1: Generating a Computational Geometry

In this research, the selected case study is the recreational area between residential buildings in the Al-Falah district, Riyadh City, Saudi Arabia. Firstly, the 3D model of the base case has been generated in Rhinoceros software with the real dimensions (200 × 110 m), the North direction angle (−26°), and configurations of trees, pedestrian paths, sports walkways, etc. However, in the 3D model, the curved pathway has been changed to a straight line to facilitate trees and shading distribution. Secondly, the microclimate conditions of the recreational area have been defined in the Grasshopper canvas by inserting the weather data file (in .epw format) by using the Ladybug plug-in. After that, the base case was simulated, and its results were collected to validate the base case. Thus, the field measurements were compared with the simulation results from Ladybug to validate the simulation tool. As a result, the Coefficient of Determination (R2) of Ta was calculated and found to be 0.83. The demonstrated accuracy and reliability of Grasshopper and Ladybug in predicting outdoor thermal performance, expressed through percentage-based validations, indicate their potential in exploring and implementing design optimizations for enhanced thermal comfort in outdoor environments, as shown in Figure 4. The validation of Rhino and Ladybug is powerful but has some limitations, according to geometry quality and abstraction and human error in script logic.
As illustrated before, the computational geometry of the recreational area was generated using Rhinoceros software. Also, the Grasshopper environment was utilized to determine the main constraints, such as location in Riyadh City, the buildings’ height of around 6 m, and the recreational area configuration. After that, the weather file of Riyadh City was merged inside the Grasshopper environment using Ladybug Plug-in. Consequently, the initial evaluation of the thermal performance of the base case was conducted using Ladybug to analyze air temperature, mean radiant temperature (MRT), and the Universal Thermal Comfort Index (UTCI), as elaborated in Figure 5a during the hottest week (from 24 to 30 August). The chart elaborates on the high values of Ta, MRT, and UTCI that reach 45.5 °C, 81.3 °C, and 53.5 °C (326.6 K), respectively. In addition, the annual solar radiation map is shown in Figure 5b and refers to the high solar incident radiation in the park, which is up to 2258 kWh/m2.

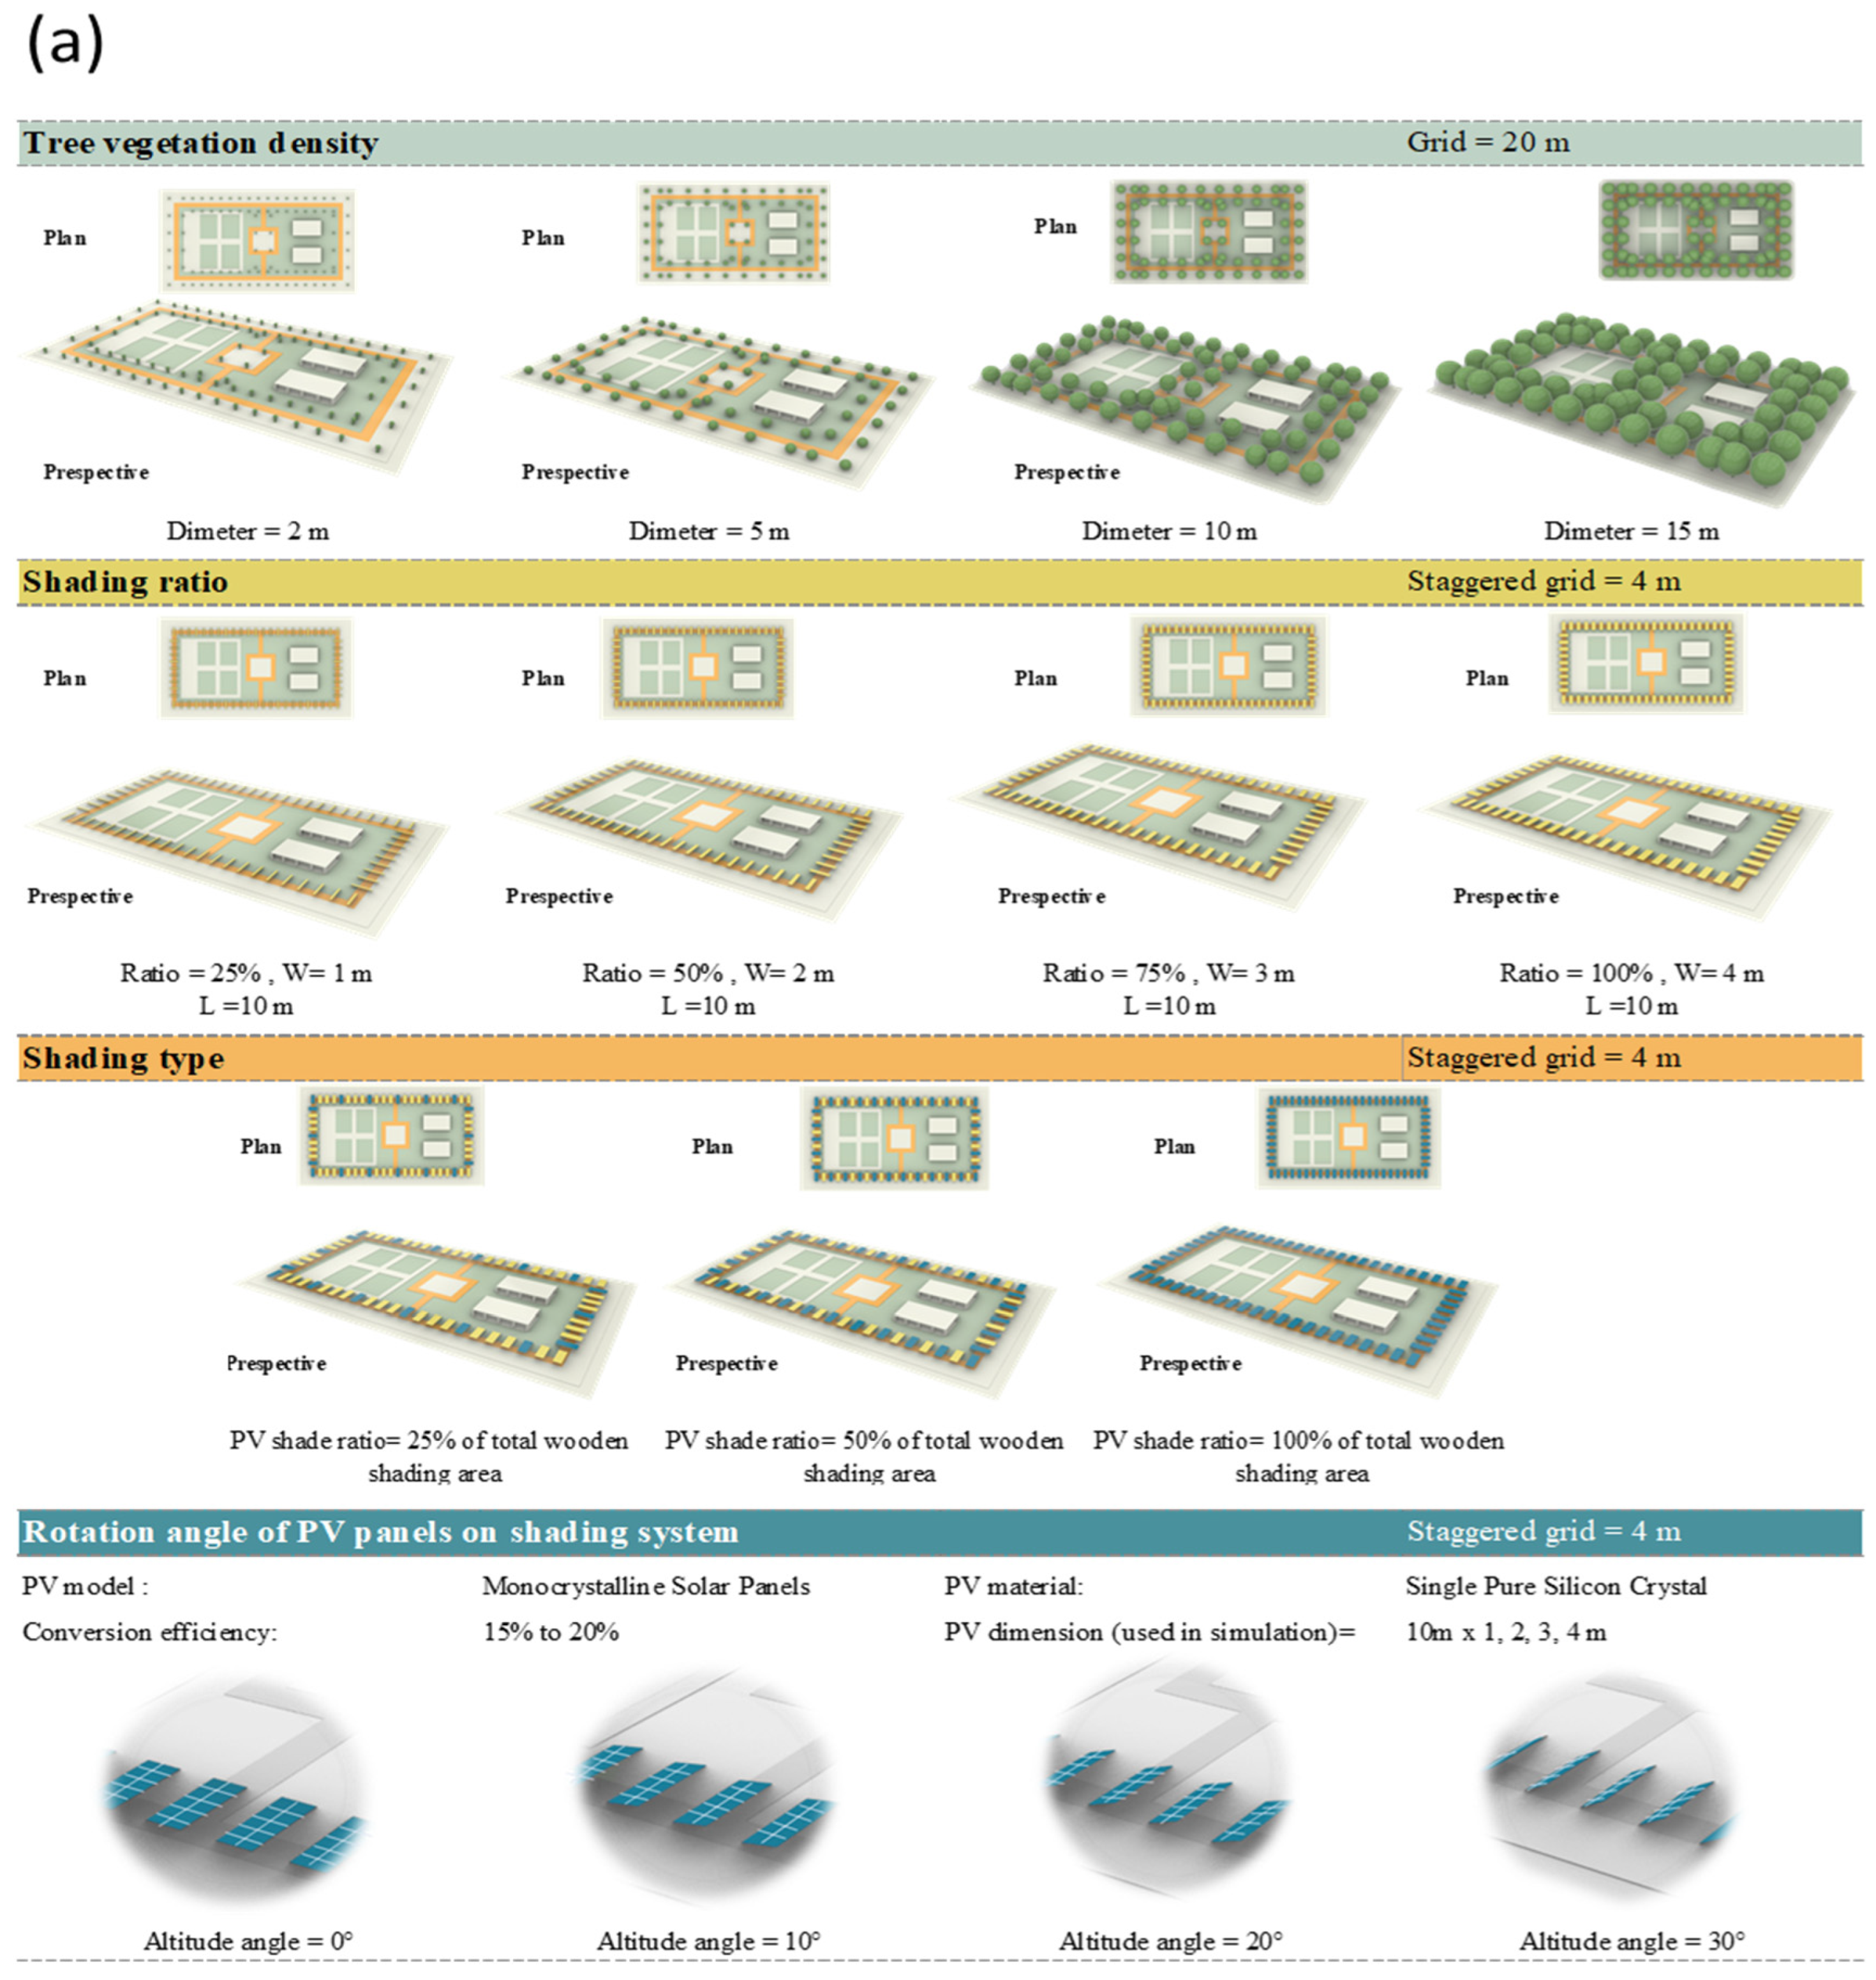
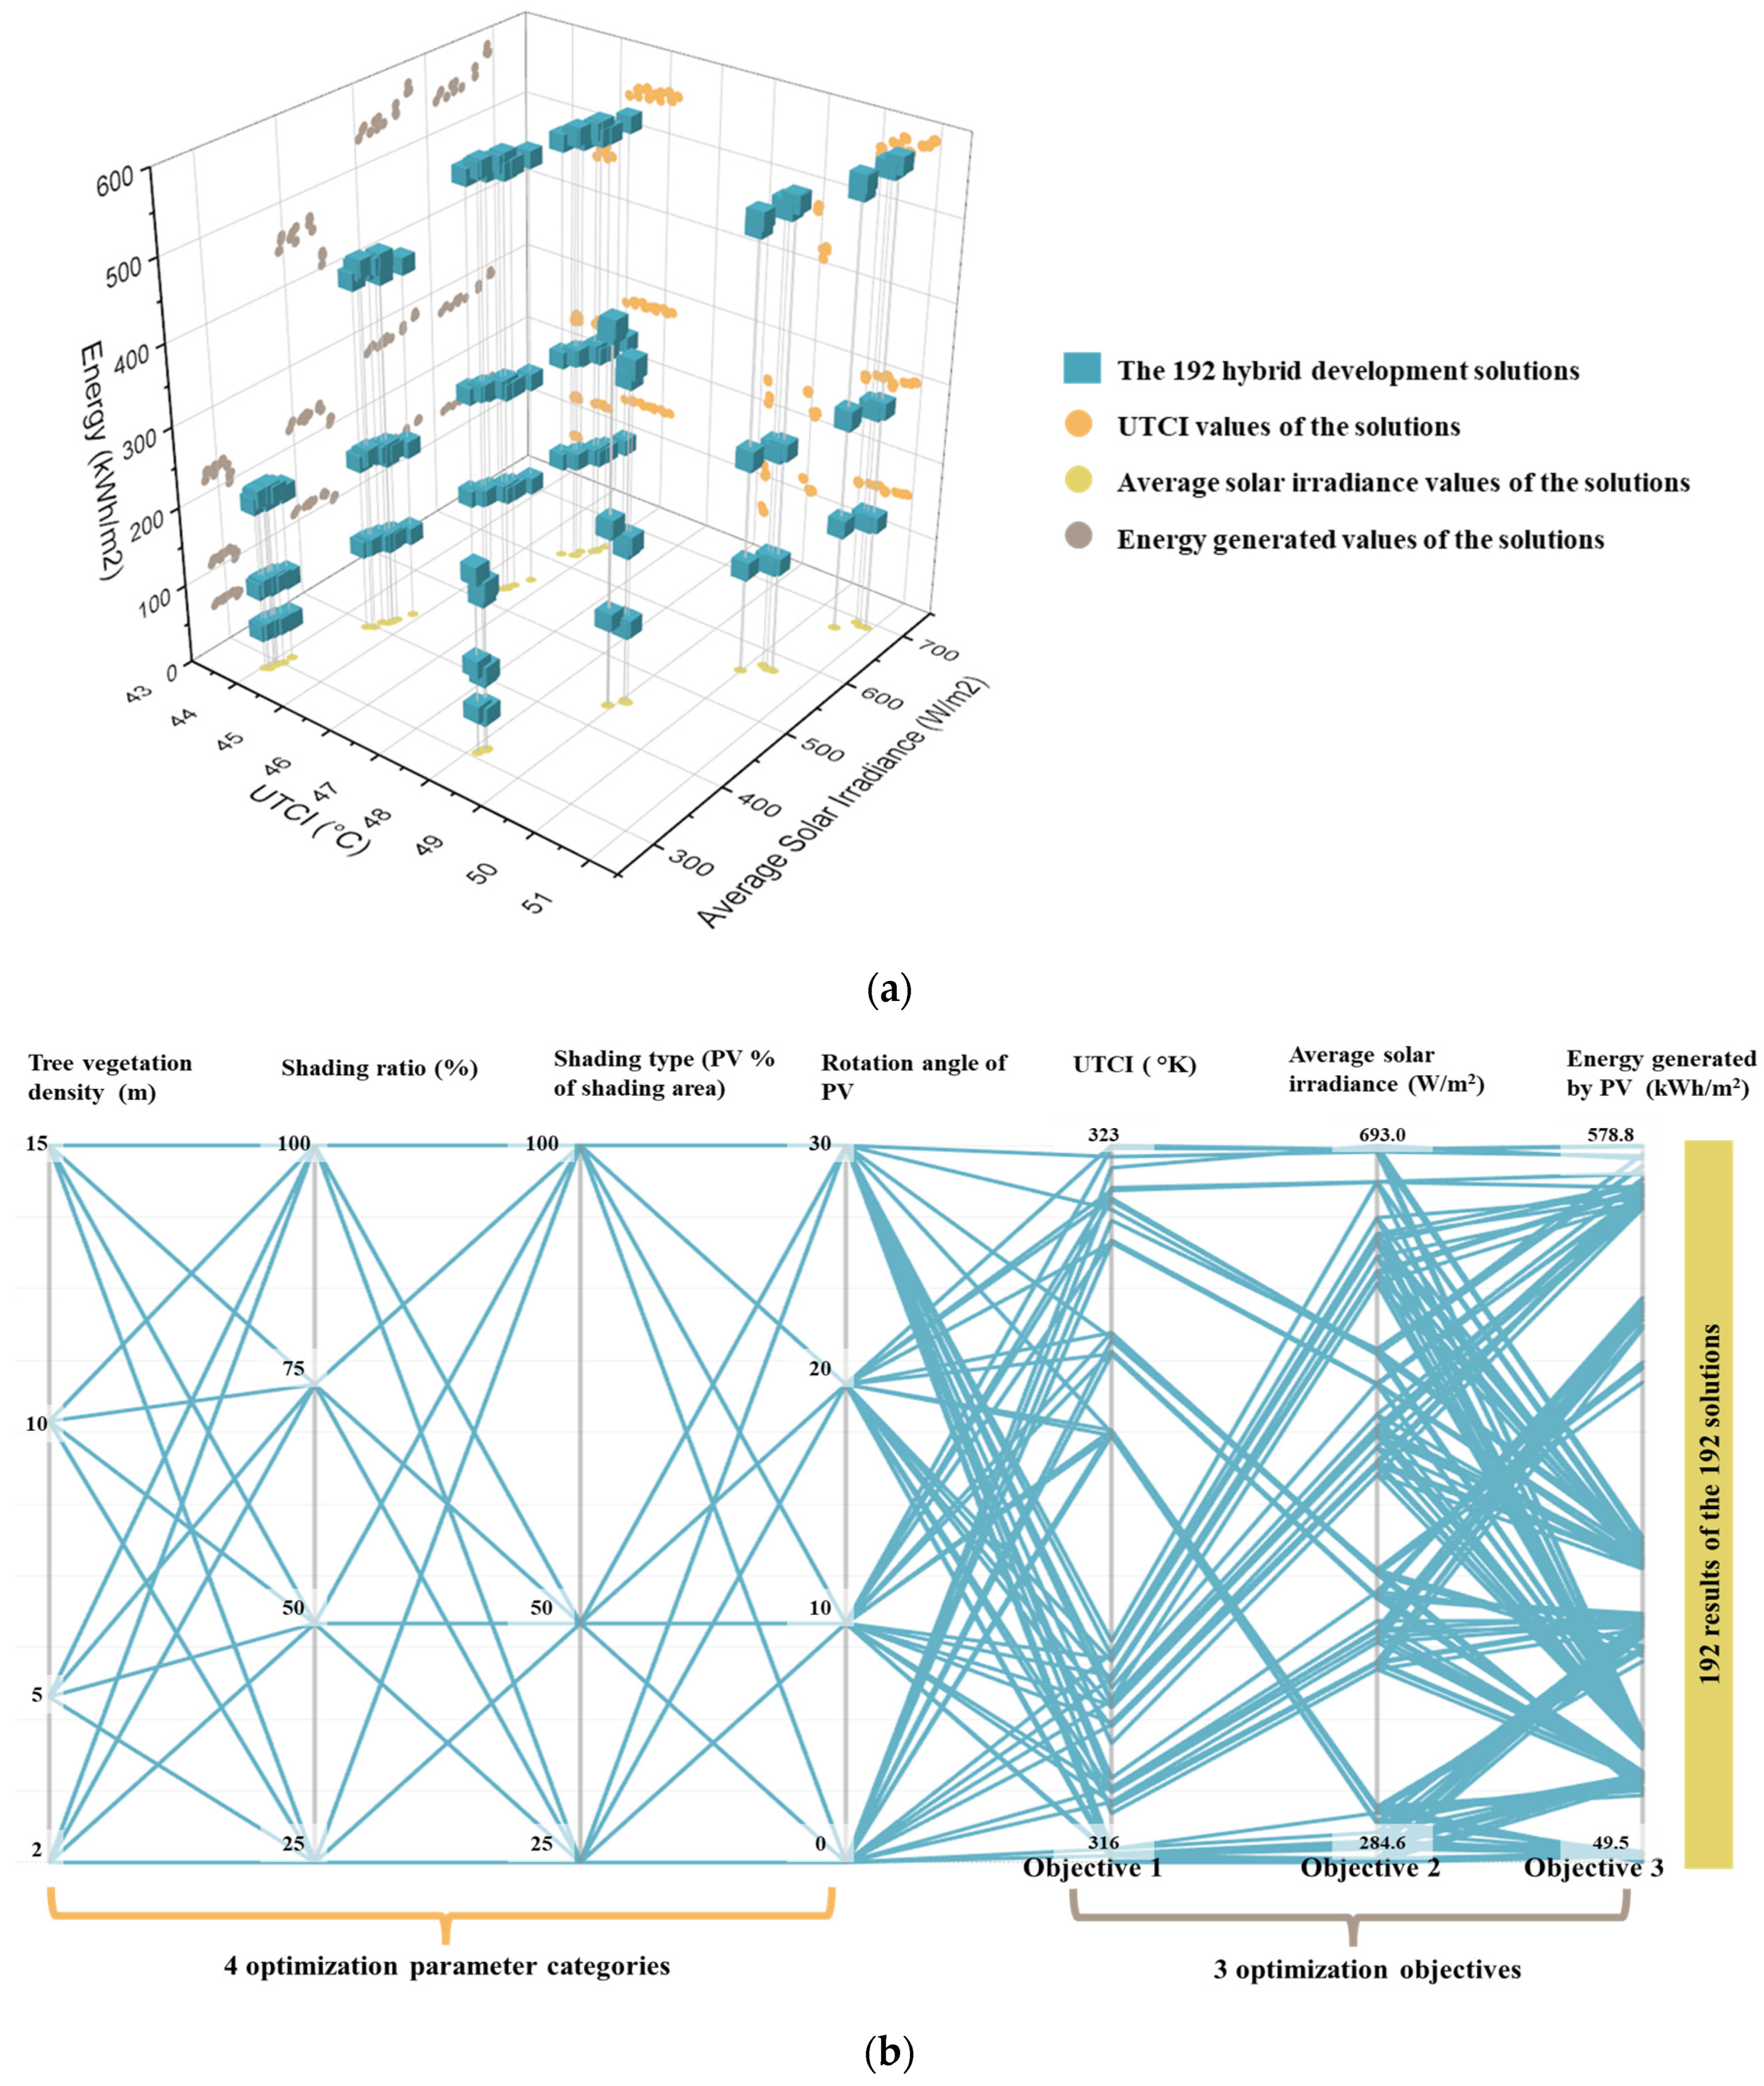
2.3.2. Phase 2: Optimization of the Development Solutions

The evaluation of the recreational area concluded that there is a problem of high solar radiation on the pedestrian paths and sports walkways. This problem results from the low density of trees and the lack of canopies on the paths. Accordingly, before implementing the optimization phase, a set of hybrid development solutions was proposed as a pre-step to improve outdoor thermal comfort and positively utilize the high solar radiation in the sports walkway. Figure 6a illustrates the proposed solutions that fall under 4 main categories: (a) tree vegetation density, (b) shading ratio, (c) shading type, and (d) rotation angle of PV panels. As observed in Figure 6, the grid size is set at 20 m to distribute the trees with various diameters: 5, 10, and 15 m, in addition to 2 m (as in the base case) in the case of studying shading effect only. Figure 6b shows the shape of the proposed scenarios. Some of the proposed tree vegetation density parameters were derived from the previous studies’ results, such as [1,3,5,10]; conversely, some others were proposed by the authors. On the other hand, a staggered grid with a size of 4 m was used to distribute the shading system, whereas the shading is located in one unit of the grid, and the following unit is unshaded. The proposed shading unit has a fixed length of 10 m and a variable width of 4 m. So, the proposed ratios are 25%, 50%, 75%, and 100% as well. Some of the proposed shading parameters were derived from the previous studies’ results, such as [5,7], and some others were proposed by the authors. Also, the type of shading category illustrated the ratio of PV panels to the total wooden shading area (25%, 50%, and 100%).
The Monocrystalline Solar Panels type was used with a conversion efficiency of 20% to convert the solar energy to electrical energy. Finally, the rotation altitude angles of PV panels are 0°, 10°, 20°, and 30°. Some of the proposed parameters of angles of PV panels were derived from the previous studies’ results, such as [20,26], and some others were proposed by the authors. Consequently, the number of hybrid development solutions reached 192 solutions. So, it required a parametric optimization process to rapidly and accurately find the optimal solutions. Accordingly, the Grasshopper environment was used to model the development solutions as variable parameters.
Additionally, the objectives of the proposed parametric urban optimization framework are minimizing UTCI, minimizing solar irradiance, and maximizing energy generation of solar radiation. Therefore, the Ladybug plug-in was used to evaluate the outdoor thermal comfort index UTCI and solar irradiance and generate PV panels. Also, the Honeybee plug-in was used to define the grounds and vegetation material of the park. Then, Honeybee was used to calculate the energy generated by PV panels to save energy used for the lighting poles and service areas. These two plug-ins relied on EnergyPlus as the main engine for simulating the hybrid development solutions.
Furthermore, the Wallacei plug-in is selected as a multi-objective optimization algorithm to optimize all the variable parameters in order to reach the best results for the three objectives together. 24 August was selected as one day in the hottest week of the year to be a simulation and to evaluate the solutions’ impact, especially during three critical hours: 11:00, 14:00, and 16:00. The settings of Wallacei plug-in to run the optimization process are shown in Table 1. On the other hand, the Colibri plug-in was used to collect the results of the 192 hybrid development solutions to export them in an Excel sheet to be analyzed later.

2.3.3. Phase 3: Statistical Analysis of Results

To quantitatively evaluate the three objectives of minimizing UTCI, minimizing solar irradiance, and maximizing energy generation of solar radiation by PV panels, three indicators were relied on: (a) the average UTCI, (b) the average solar irradiance on all the recreational areas, and (c) the total annual energy generated by PV panels, respectively. The three indicators assisted in calculating the fitness value of each solution. Therefore, in the third phase, the optimal solutions based on the fitness values were obtained and visualized by Wallacei plug-in as a Pareto front chart. In addition, all solutions’ results were collected using the Colibri plug-in and exported by the TT Toolbox plug-in to conduct statistical analysis for results and analyze the correlation performance of parameters and objectives. Hence, the general results were represented as a Pareto front chart and parallel coordinate plot, as shown in Figure 7a and Figure 7b, respectively. The accurate analysis of results will be explained in the next section.

2.4. Abilities and Limitations of the Proposed Methodology

The parametric urban optimization framework has a set of abilities, as detailed below:
(a)
Providing many hybrid development solutions with different tree vegetation densities, shading ratios, and shading rotation angles.
(b)
Providing various ratios of PV panels to suit the energy demand over the year in the recreational area.
(c)
Exporting the results of the hybrid solutions and the non-hybrid solutions.
(d)
Providing hybrid solutions to achieve three different objectives that can be expanded in the future for adding new objectives and parameters.
(e)
Flexibility in simulating other recreational areas using the same framework.
(f)
Usability of the framework to provide solutions for adapting to climate changes by just inserting the future weather file of 2050 or 2080.
(g)
Visualizing the optimal solution of the three objectives together and of each objective separately.
(h)
Developing a prototype of the recreational area that can be applied in 8100 other recreational areas to enhance the concept of humanizing cities [21].
(i)
Optimal utilization of high solar radiation in generating electrical energy, a potential renewable energy source for lighting poles and service areas within the recreational area.
(j)
Analyzing the correlation performance among parameters and objectives to determine the most influential parameters for each objective separately.
On the other hand, the limitations and shortcomings of the framework are as follows:
(a)
We still need to study the hybrid development solutions’ impact on the sport walkway area.
(b)
Ignoring other strategies for improving outdoor thermal comfort, such as pavement material, and other shading types (e.g., tent shadings, arcades, and pergolas).
(c)
Changing the curved pathway to a straight line to facilitate trees and shadings distribution.
(d)
The area of the case study cannot exceed 50,000 m2 besides rectilinear boundaries and paths.

3. Results and Discussion

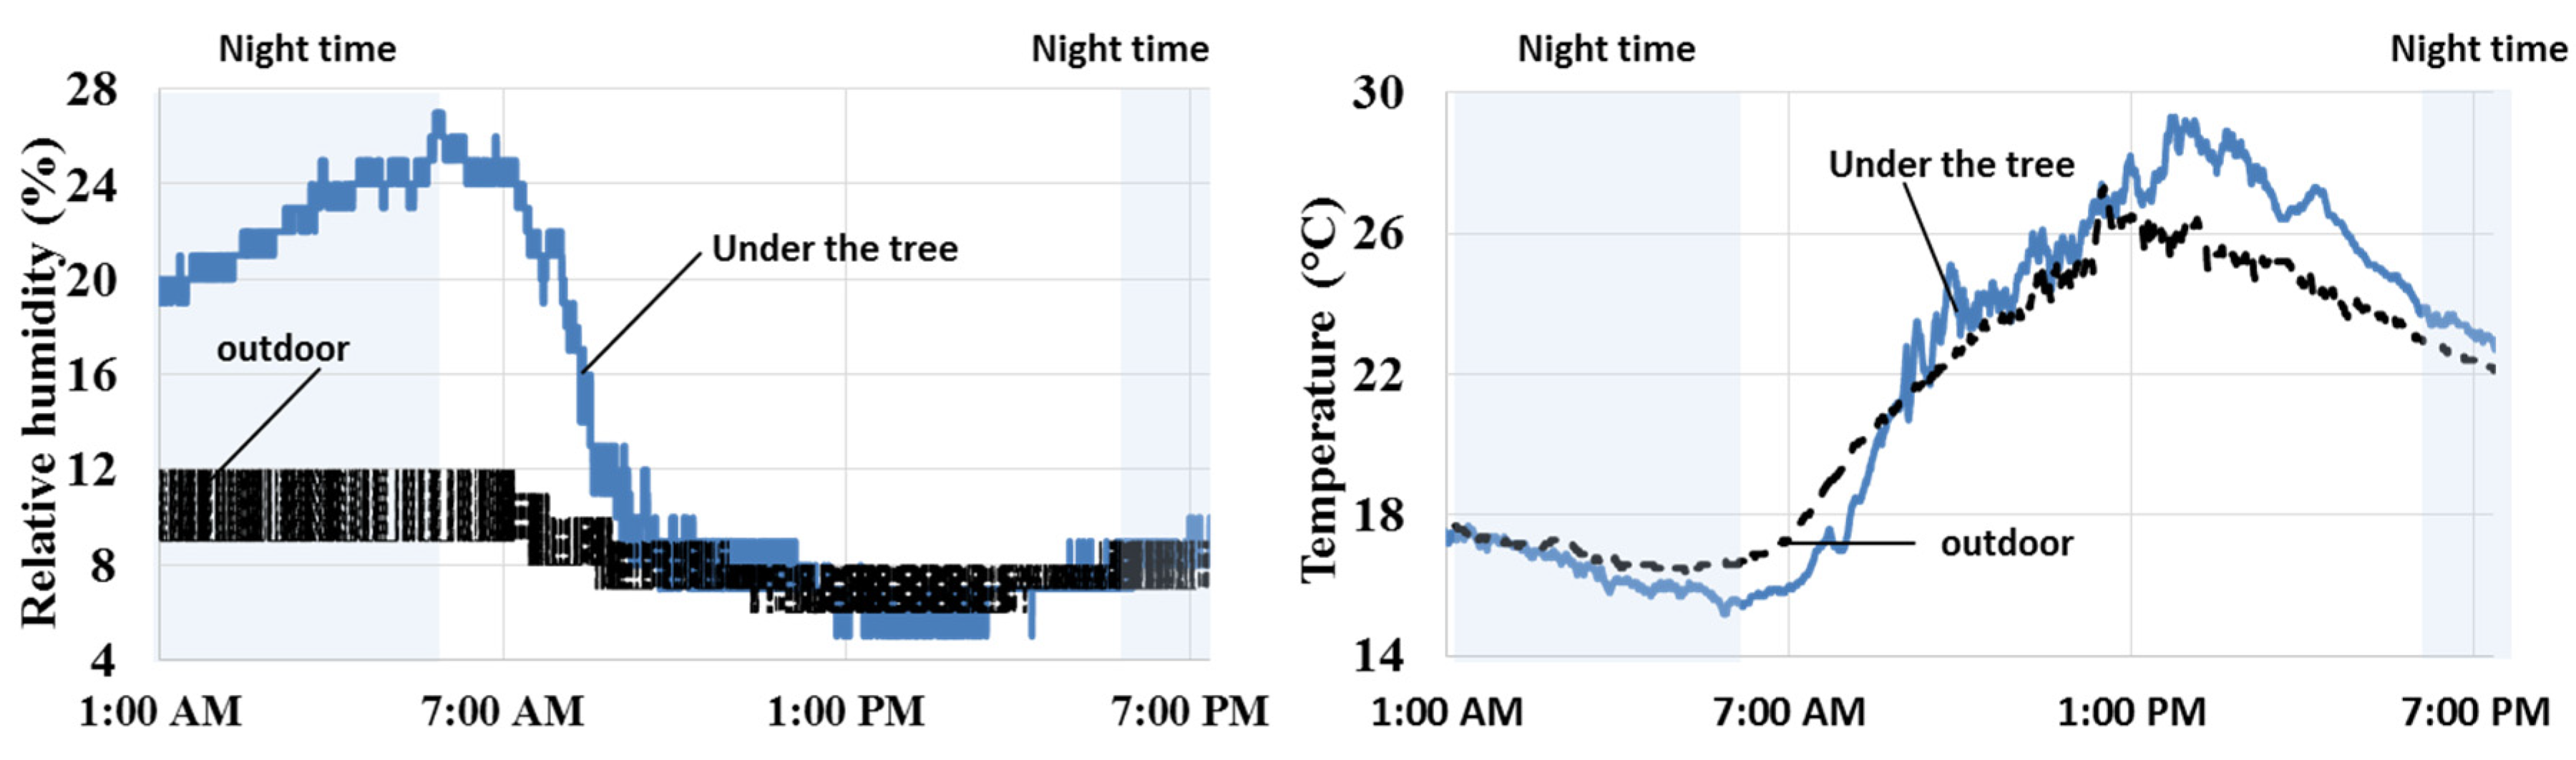
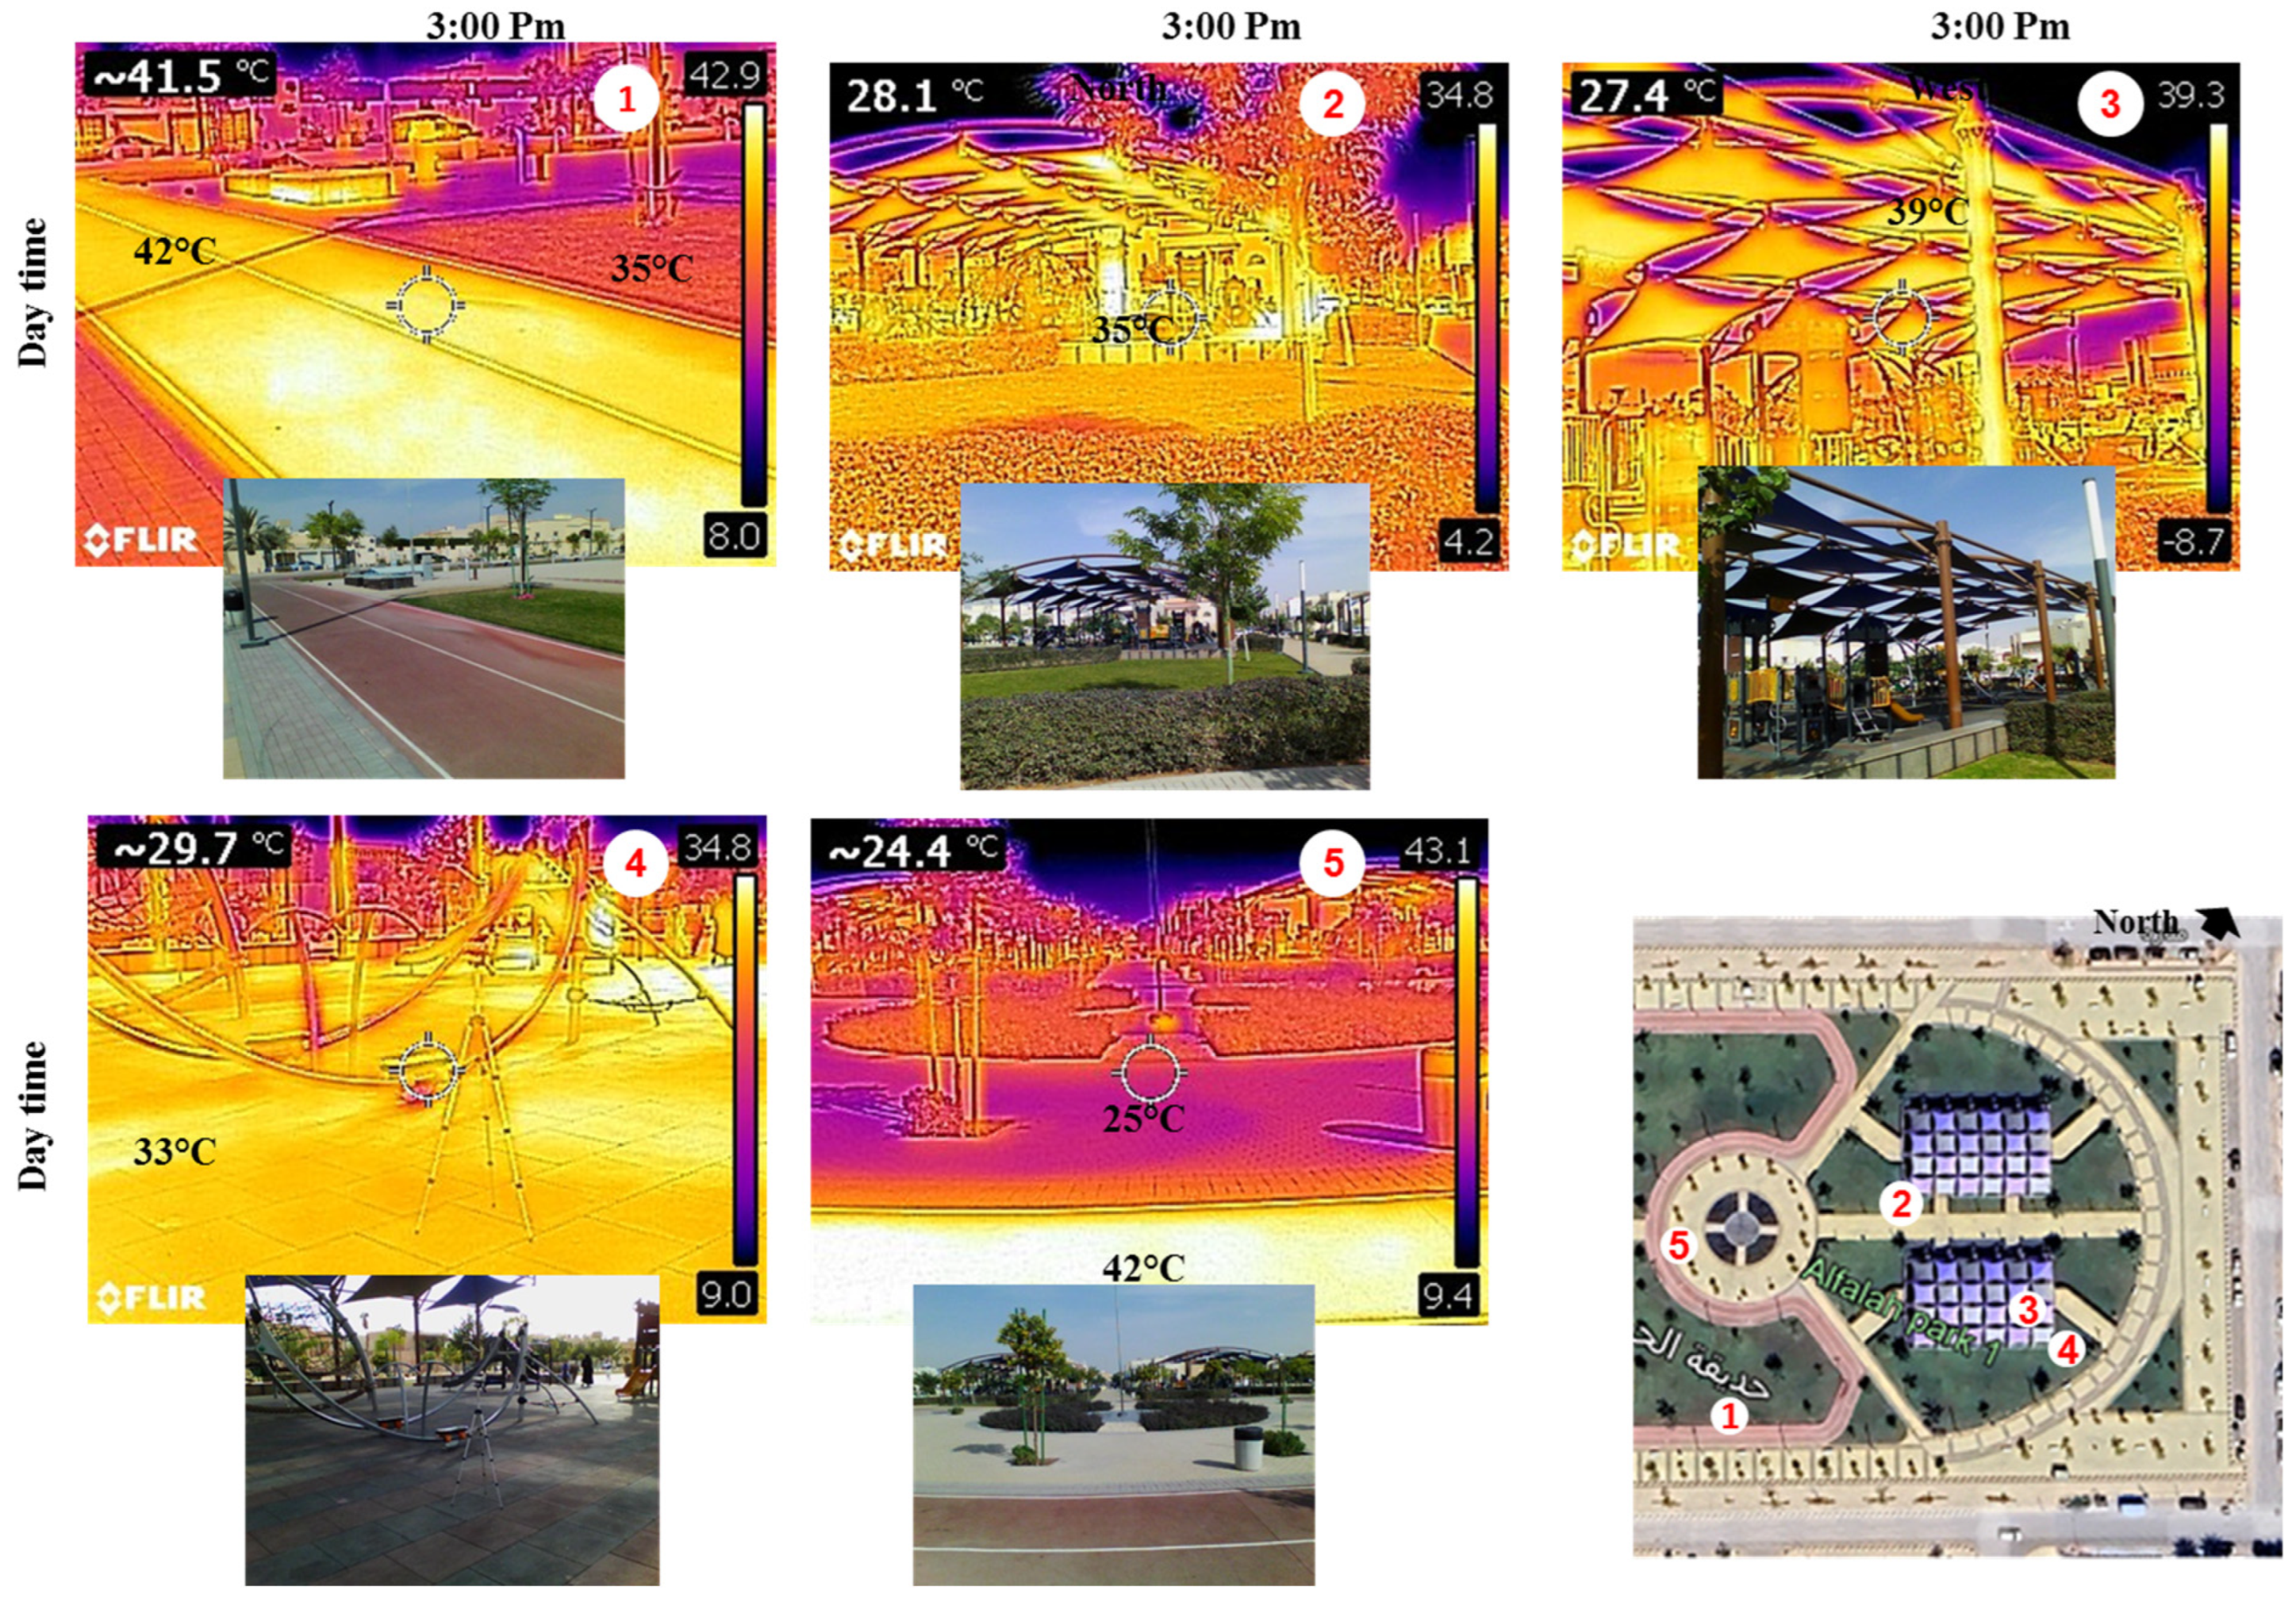
3.1. Evaluation of Temperature and Outdoor Temperature Distribution

Figure 8 shows the temperature and humidity evaluation for monitoring under one of the trees (Cassia Glauca) compared to outdoor air temperature outside the park. The temperature under the tree is higher than outdoors due to the leaf shape density with a small shadow area. Also, the relative humidity increased during the night time, which cooled the environment adjacent to the trees. Measurement was conducted under this tree, being a repeated pattern in different places in the park, as well as in many parks in Saudi Arabia.
On the other side, thermal images are useful for the evaluation of outdoor conditions for different materials in the ground and components installed in the outer environment with analyzed temperature variation and gradient in the park for different shading, trees, and ground material. Figure 9 shows the thermal image surface temperature evaluation for different places in the park.
Based on the pilot study monitoring, it was found that the surface temperature for the material for the walking path is higher than 43 °C, while the air temperature is 27 °C at 3 p.m. due to the absorption of solar radiation during daytime and releasing it at night. This causes thermal discomfort based on user interviews inside the park and responses of target individuals practicing different activities inside the park. The sports walkway is exposed to direct sunlight throughout the daytime without any shading along the entire path. Also, using a steel structure for shading the children’s playground zone with a small shading area absorbs and releases heat for this zone and increases the surface temperature of the ground to 33 °C. The responses of the different users practicing different activities inside the park during the daytime when the outdoor air temperature is 27 °C agree that the air temperature is slightly warm due to the lack of shading. Also, all of the users emphasize the importance of using more shading and more trees to achieve thermal comfort. Therefore, this study presented a parametric framework using Rhino 3D+ Grasshopper software to optimize the outdoor thermal comfort in outdoor recreational areas between residential buildings, intending to improve the thermal performance of outdoor urban spaces. Consequently, the parametric framework will contribute to enhancing the inhabitants’ social activities in one of the new parks designed as a prototype that will be implemented in different residential districts in Riyadh City, Saudi.

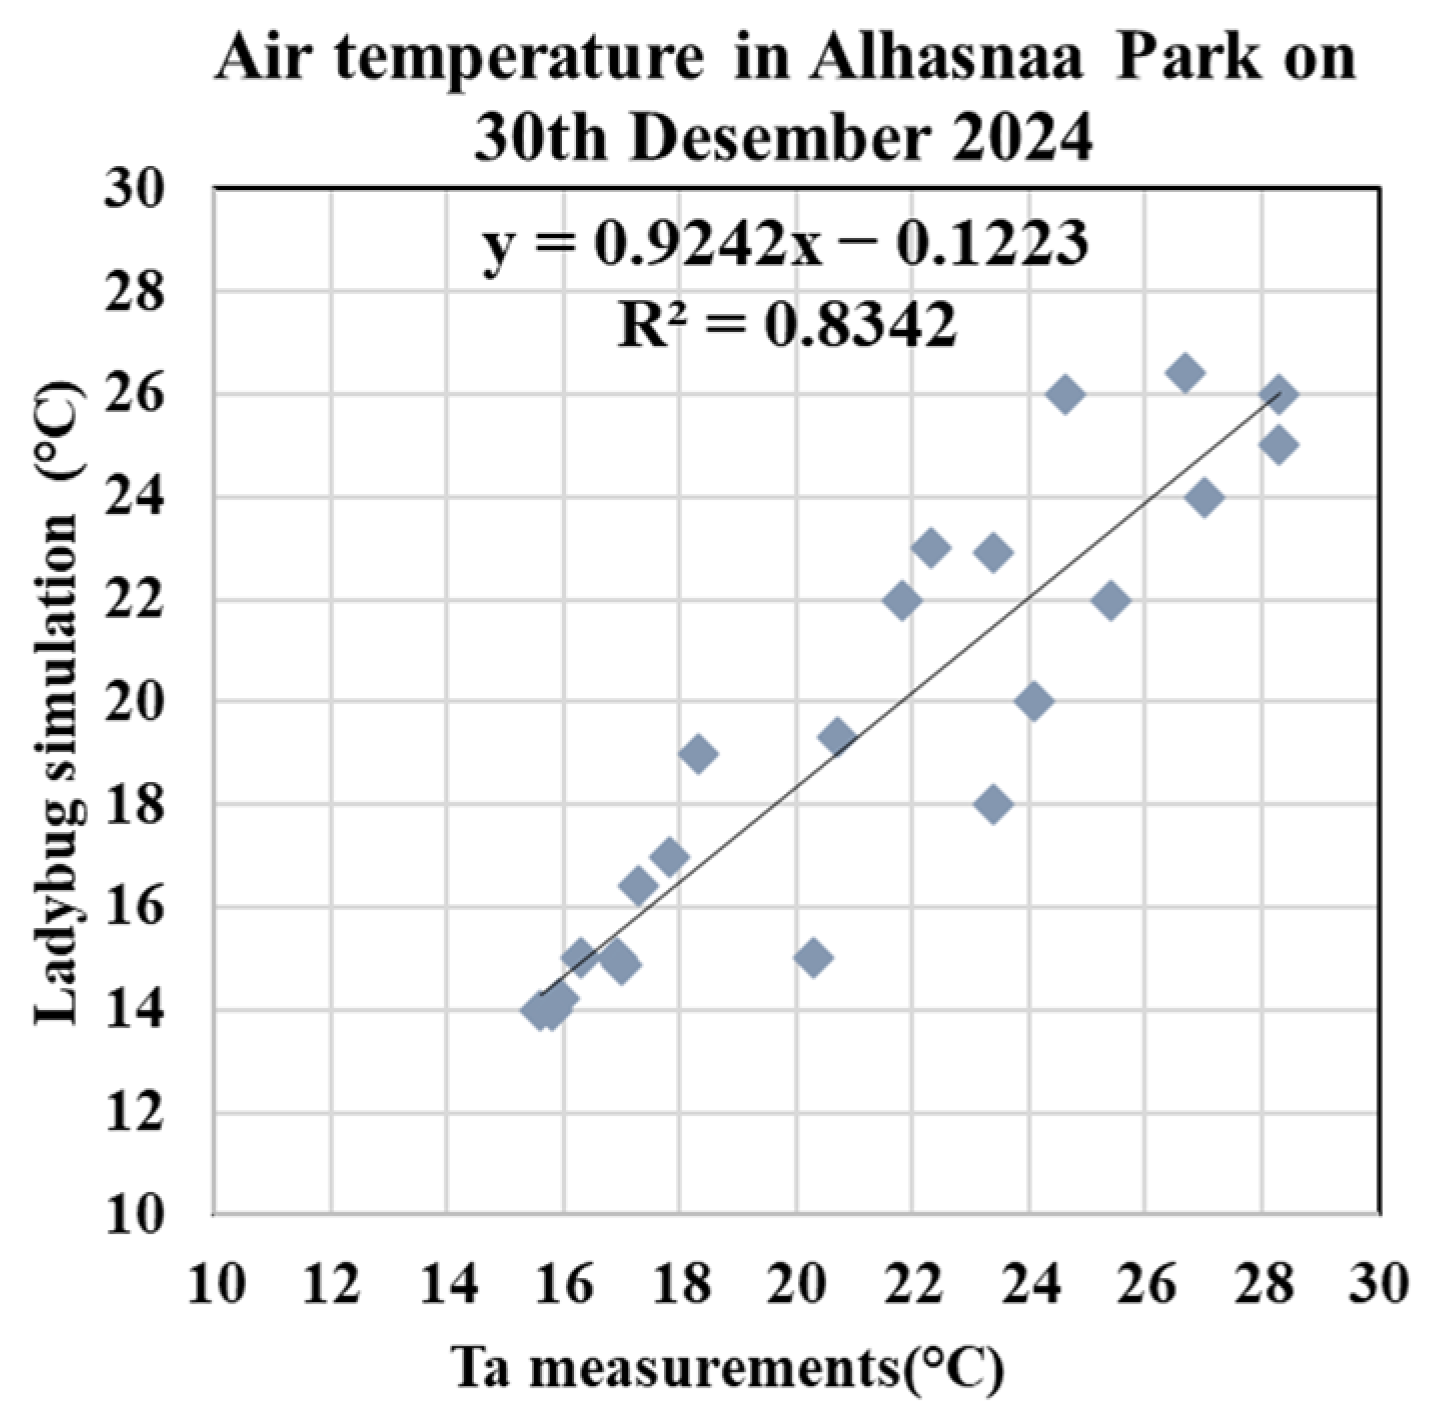
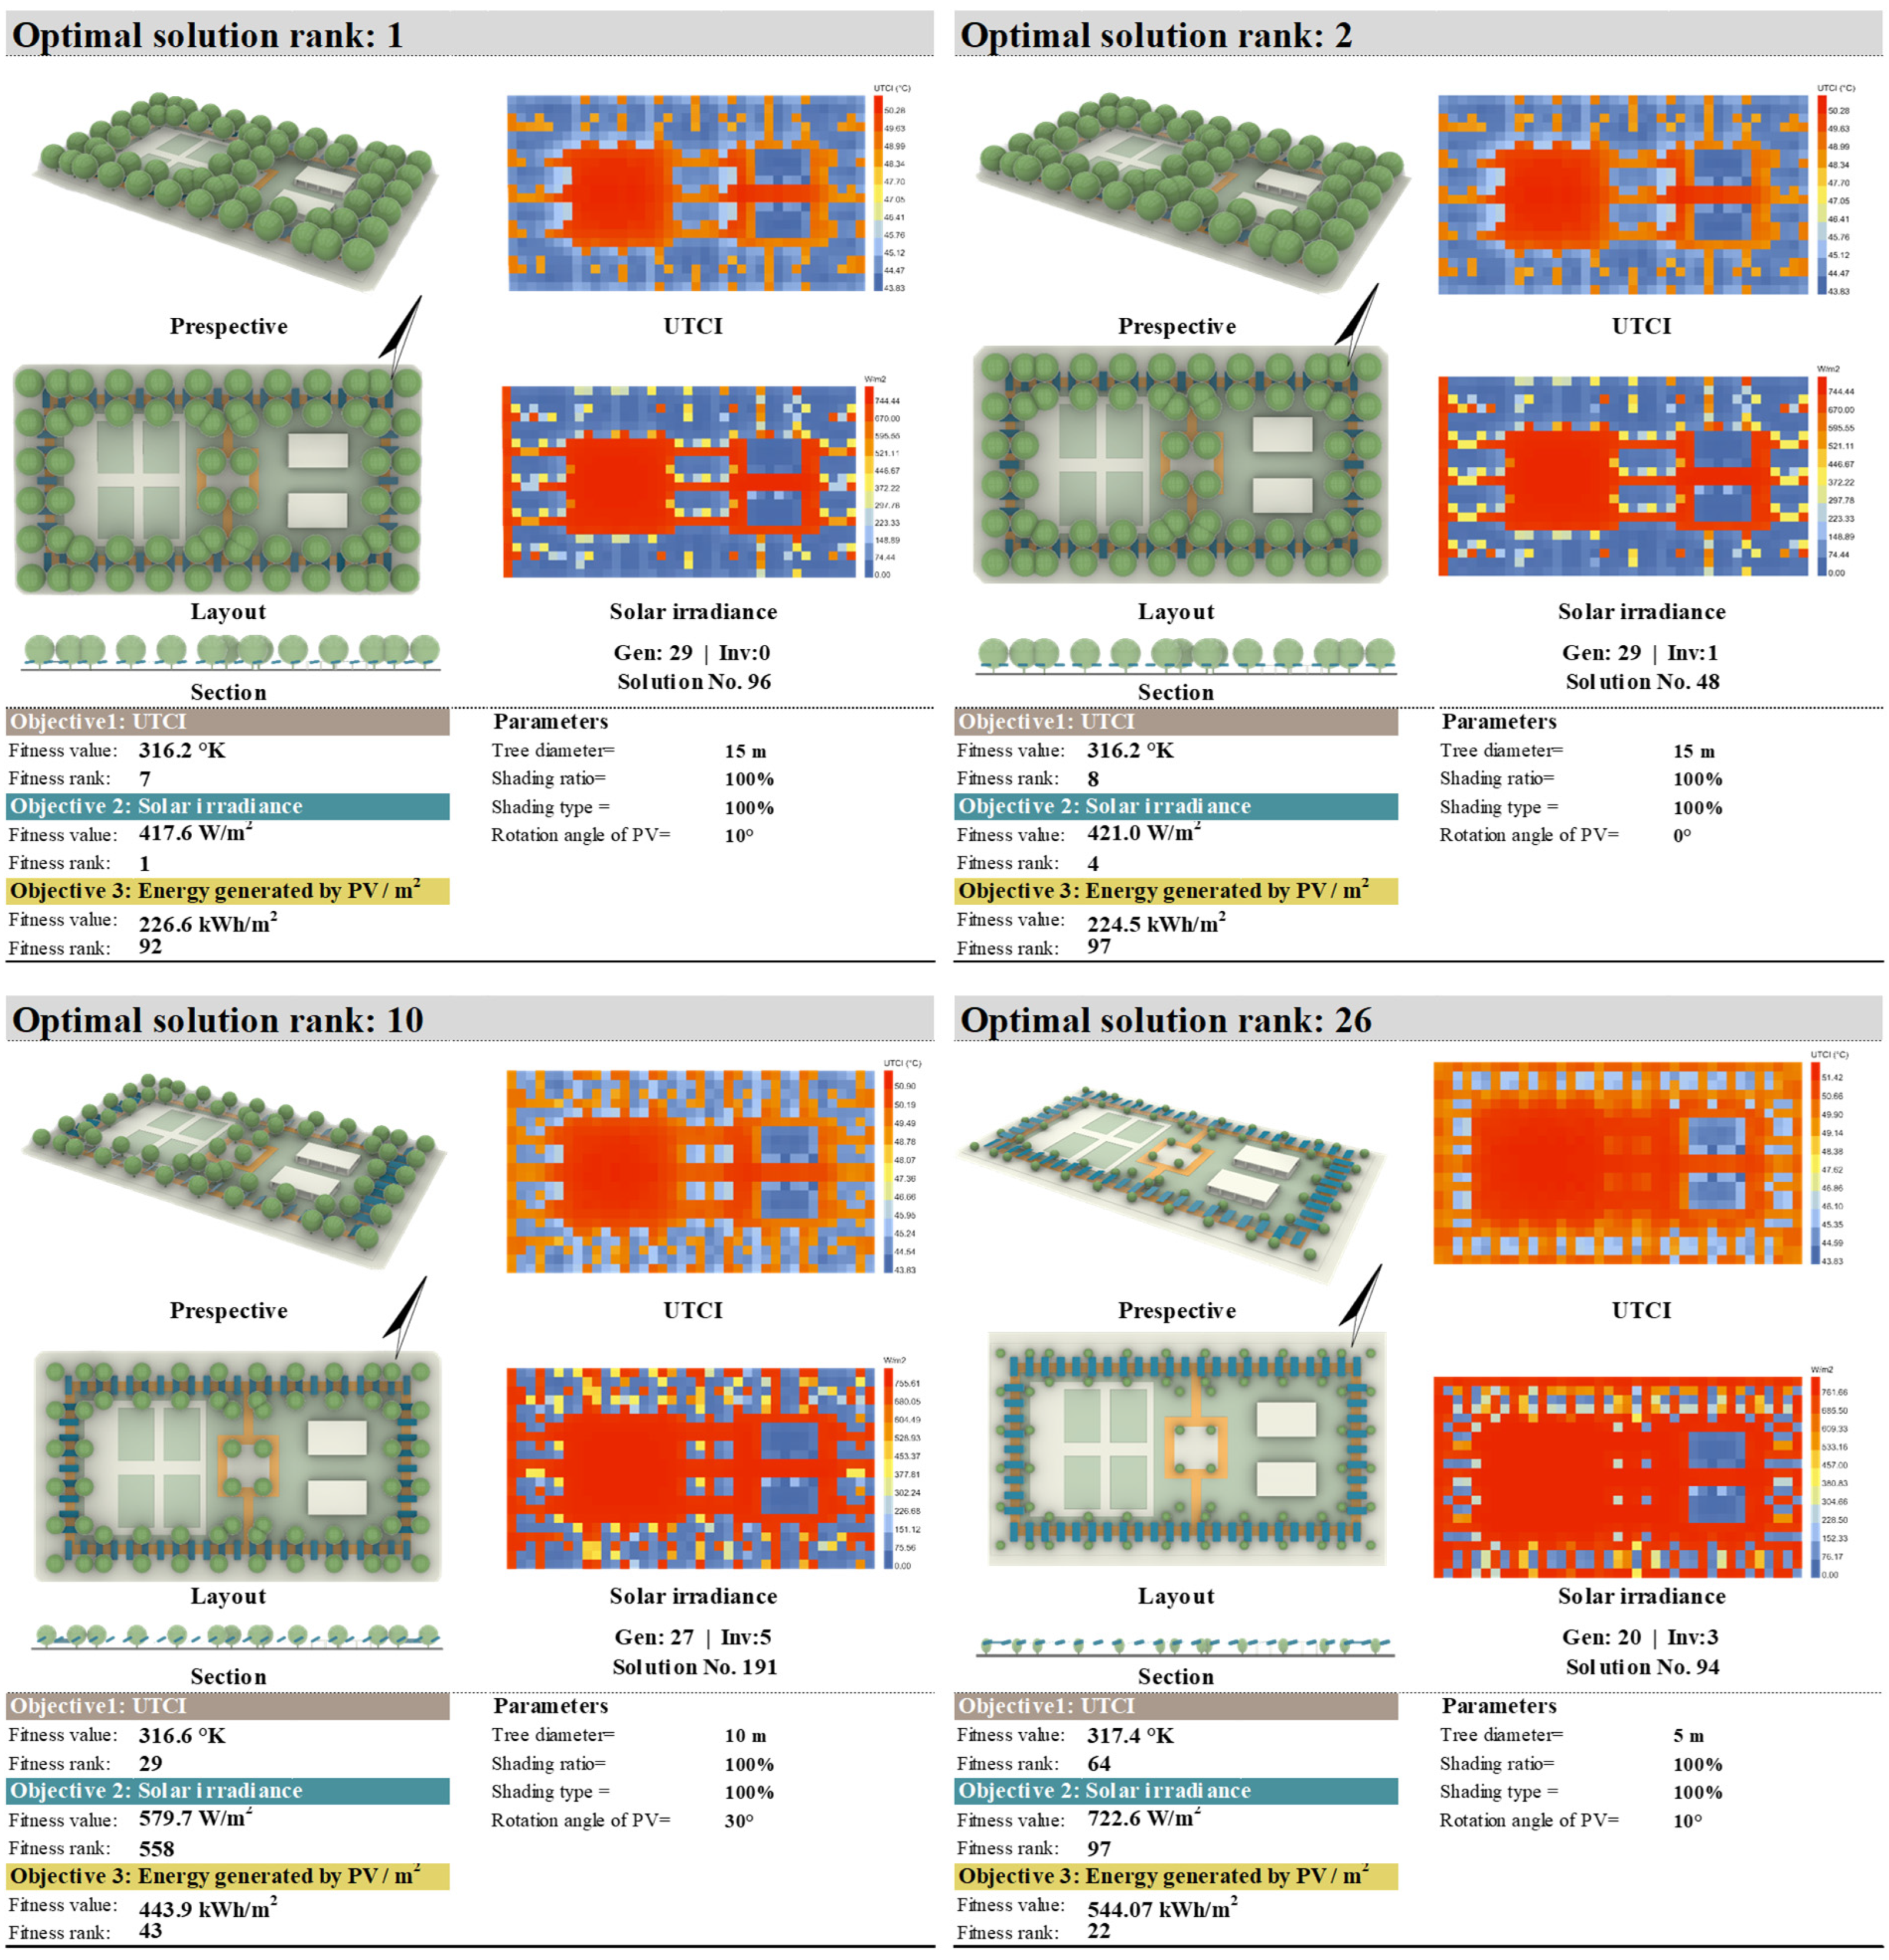
3.2. Simulation Results Evaluation

As mentioned earlier, the proposed parametric urban optimization framework was established to simulate and investigate the effect of a set of hybrid development solutions (192 solutions). On the other hand, seven non-hybrid solutions were also simulated to investigate their influence separately on UTCI and solar irradiance before hybridizing their variables. The seven non-hybrid solutions were divided into two groups: non-hybrid vegetation solutions (adding trees with diameters = 5, 10, and 15 m on grid size 20 m) and non-hybrid shading solutions (shading ratio 25%, 50%, 75%, and 100% of the shading area = 40 m2 on staggered grid size 4 m). Figure 10 illustrates the UTCI values and solar irradiance of the seven non-hybrid solutions compared to the base case of the recreational area at three critical hours: 11:00, 14:00, and 16:00 during one of the hottest days (24 August). It can be observed that at 11:00, the solution of non-hybrid vegetation with a diameter of 15 m could reduce UTCI by 11.26 K, being the highest reduction. Conversely, at 14:00, the highest reduction in UTCI was 6.98 K by applying a non-hybrid shading solution with a ratio of 0%. But at 16:00, the UTCI reduction caused by the non-hybrid solutions was close and ranged between 6.17 K and 7.0 K. Nevertheless, Figure 10b shows the high average solar irradiance of the base case, which reached 1099 W/m2 at 11:00. Thus, the non-hybrid vegetation solutions achieved the highest drop in average solar irradiance by ranging from 173.59 to 272.92 W/m2 with the smallest tree diameter (5 m) and ranging from 320.93 to 642.77 W/m2 with the biggest tree diameter (15 m). However, it can be observed that the tree diameter of 15 m caused darkness on pedestrian paths and sports walkways at 15:00 when the average solar irradiance dropped to only 82.07 W/m2. Meanwhile, the reduction in average solar irradiance was suitable by applying non-hybrid shading solutions and declined by a range between 131.12 and 260.83 W/m2 during the three hours. This result is compatible with the results of [10], which clarified that the reduction in PET in greenery solution ranges from 6.8 °C to 13.4 °C. Also, these outcomes are consistent with the results of [6,9,15].
In fact, the hybrid development solutions were more efficient in achieving the three objectives: reducing UTCI, reducing solar irradiance, and increasing energy generated using PV panels, as will be accurately discussed in the Section 3. Hence, the general results of the 192 hybrid development solutions will be elaborated in this part. First, the influence of the hybridization between tree vegetation density solutions and shading solutions was studied and analyzed to assess the energy generated by PV panels for each square meter of each panel and also the optimal location of trees in outdoor recreation areas to enhance thermal comfort and the effect of cooling benefits in urban areas, and this agrees with previous research [10]. Figure 11 shows the values of energy generated by PV panels in cases where the tree diameters equal 2, 5, 10, and 15 m. The highest values of energy generated were 568.9 and 564 kWh/m2 by applying a shading ratio of 25% and tree diameters of 2 m and 5 m, respectively. Also, the shading units with a ratio of 50% achieved the highest generated energy integrated with trees of diameters 10 m and 15 m, and the energy values were 459.6 kWh/m2 and 227.52 kWh/m2, respectively.
On the other hand, the altitude angle of PV panels plays an important role in collecting as much solar radiation as possible and converting it to electrical energy. As shown in Figure 11, the altitude angle of 10° caused the highest energy generated by PV whatever the tree diameter was. It can be concluded that the wide diameter of trees (15 m) negatively affects the energy generated by PV panels due to causing wide shade without solar radiation despite its positive impact in decreasing UTCI and solar irradiance. Hence, the energy generated, amount after adding trees with a diameter of 15 m, decreased by an average of 319.7 kWh/m2 to adding trees with a diameter of 5 m and by an average of 223.7 kWh/m2 than adding trees with a diameter of 10 m.
Second, the annual solar radiation results of the base case and the development solutions were plotted in a graph in Figure 12. Due to the lack of shading and high-density vegetation area in the recreational area’s base case, the annual solar radiation increased to 2258.8 kWh/m2. By applying the development solutions, the average annual solar irradiation has been decreased and ranged from 799.2 kWh/m2 to 2047 kWh/m2 in the entire park. Consequently, the reduction in solar irradiation was between 211.7 and 1459.5 kWh/m2. In sports walkways, the solar radiation dropped to range between 62.2 kWh/m2 and 1942.0 kWh/m2. However, some solutions with high-density trees (diameter = 15 m) cause some darkness alongside the walkways.
Third, it is important to study the impact of heat stress in urban environments and its effect on human thermal comfort. Thus, to evaluate the reduction in heat stress in the recreational area, the results of Tmrt of the base case and the development solution were obtained and plotted in Figure 13. Because of the lack of shading in the base case, the Tmrt value reached 78.9 °C, which expresses the extreme high in heat stress for users. Hence, the development solutions contributed to reducing heat stress, so the Tmrt values went from 45.05 °C to 72.22 °C in the sports walkways. Consequently, the reduction in Tmrt was between 6.75 °C and 33.92 °C. That wide range of reduction is a result of either a narrow or a wide shading area according to the hybrid shading system. Thus, the development solutions with high-density trees (diameter = 15 m) and high shading ratio (75% and 100%) caused a high reduction in Tmrt and, therefore, a high reduction in heat stress in sports walkways.
Eventually, the optimal solutions for the recreational area, as the outputs of the parametric urban optimization framework, were obtained and visualized in Figure 14. The optimization process occurred at 14:00 because it was a very critical hour in the day. The ranking of the optimal solution of the optimization process is based on achieving the highest ranking of the three objectives together as much as possible. Consequently, the optimal solution with ranking 1 was generated in Generation 29 and Individual 0.
The parameters of the optimal solution rank 1 are as follows: tree diameter is 15 m, the shading ratio is 100% of the total shading area, the shading type is PV by a ratio of 100% of the total wooden shading area, and the rotation angle of PV panels is 10°. Hence, the solution results of UTCI, average solar irradiance, and energy generated by PV are 316.2 K, 417.6 W/m2, and 226.6 kWh/m2, respectively, compared with those of the base case, which were 326 K, 1099.7 W/m2, and zero generated energy, respectively. Thus, the optimal solution ranking 1 could reduce the UTCI and average solar irradiance by 9.8 K and 682.1 W/m2, respectively. The ranking of each objective separately is 7 for UTCI, 1 for the average solar irradiance, and 92 for energy generated energy by PV. Additionally, other optimal solutions with different parameter/objective values are shown in Figure 14. Eventually, the typical or optimal solution for each objective will be accurately discussed separately in the following parts.

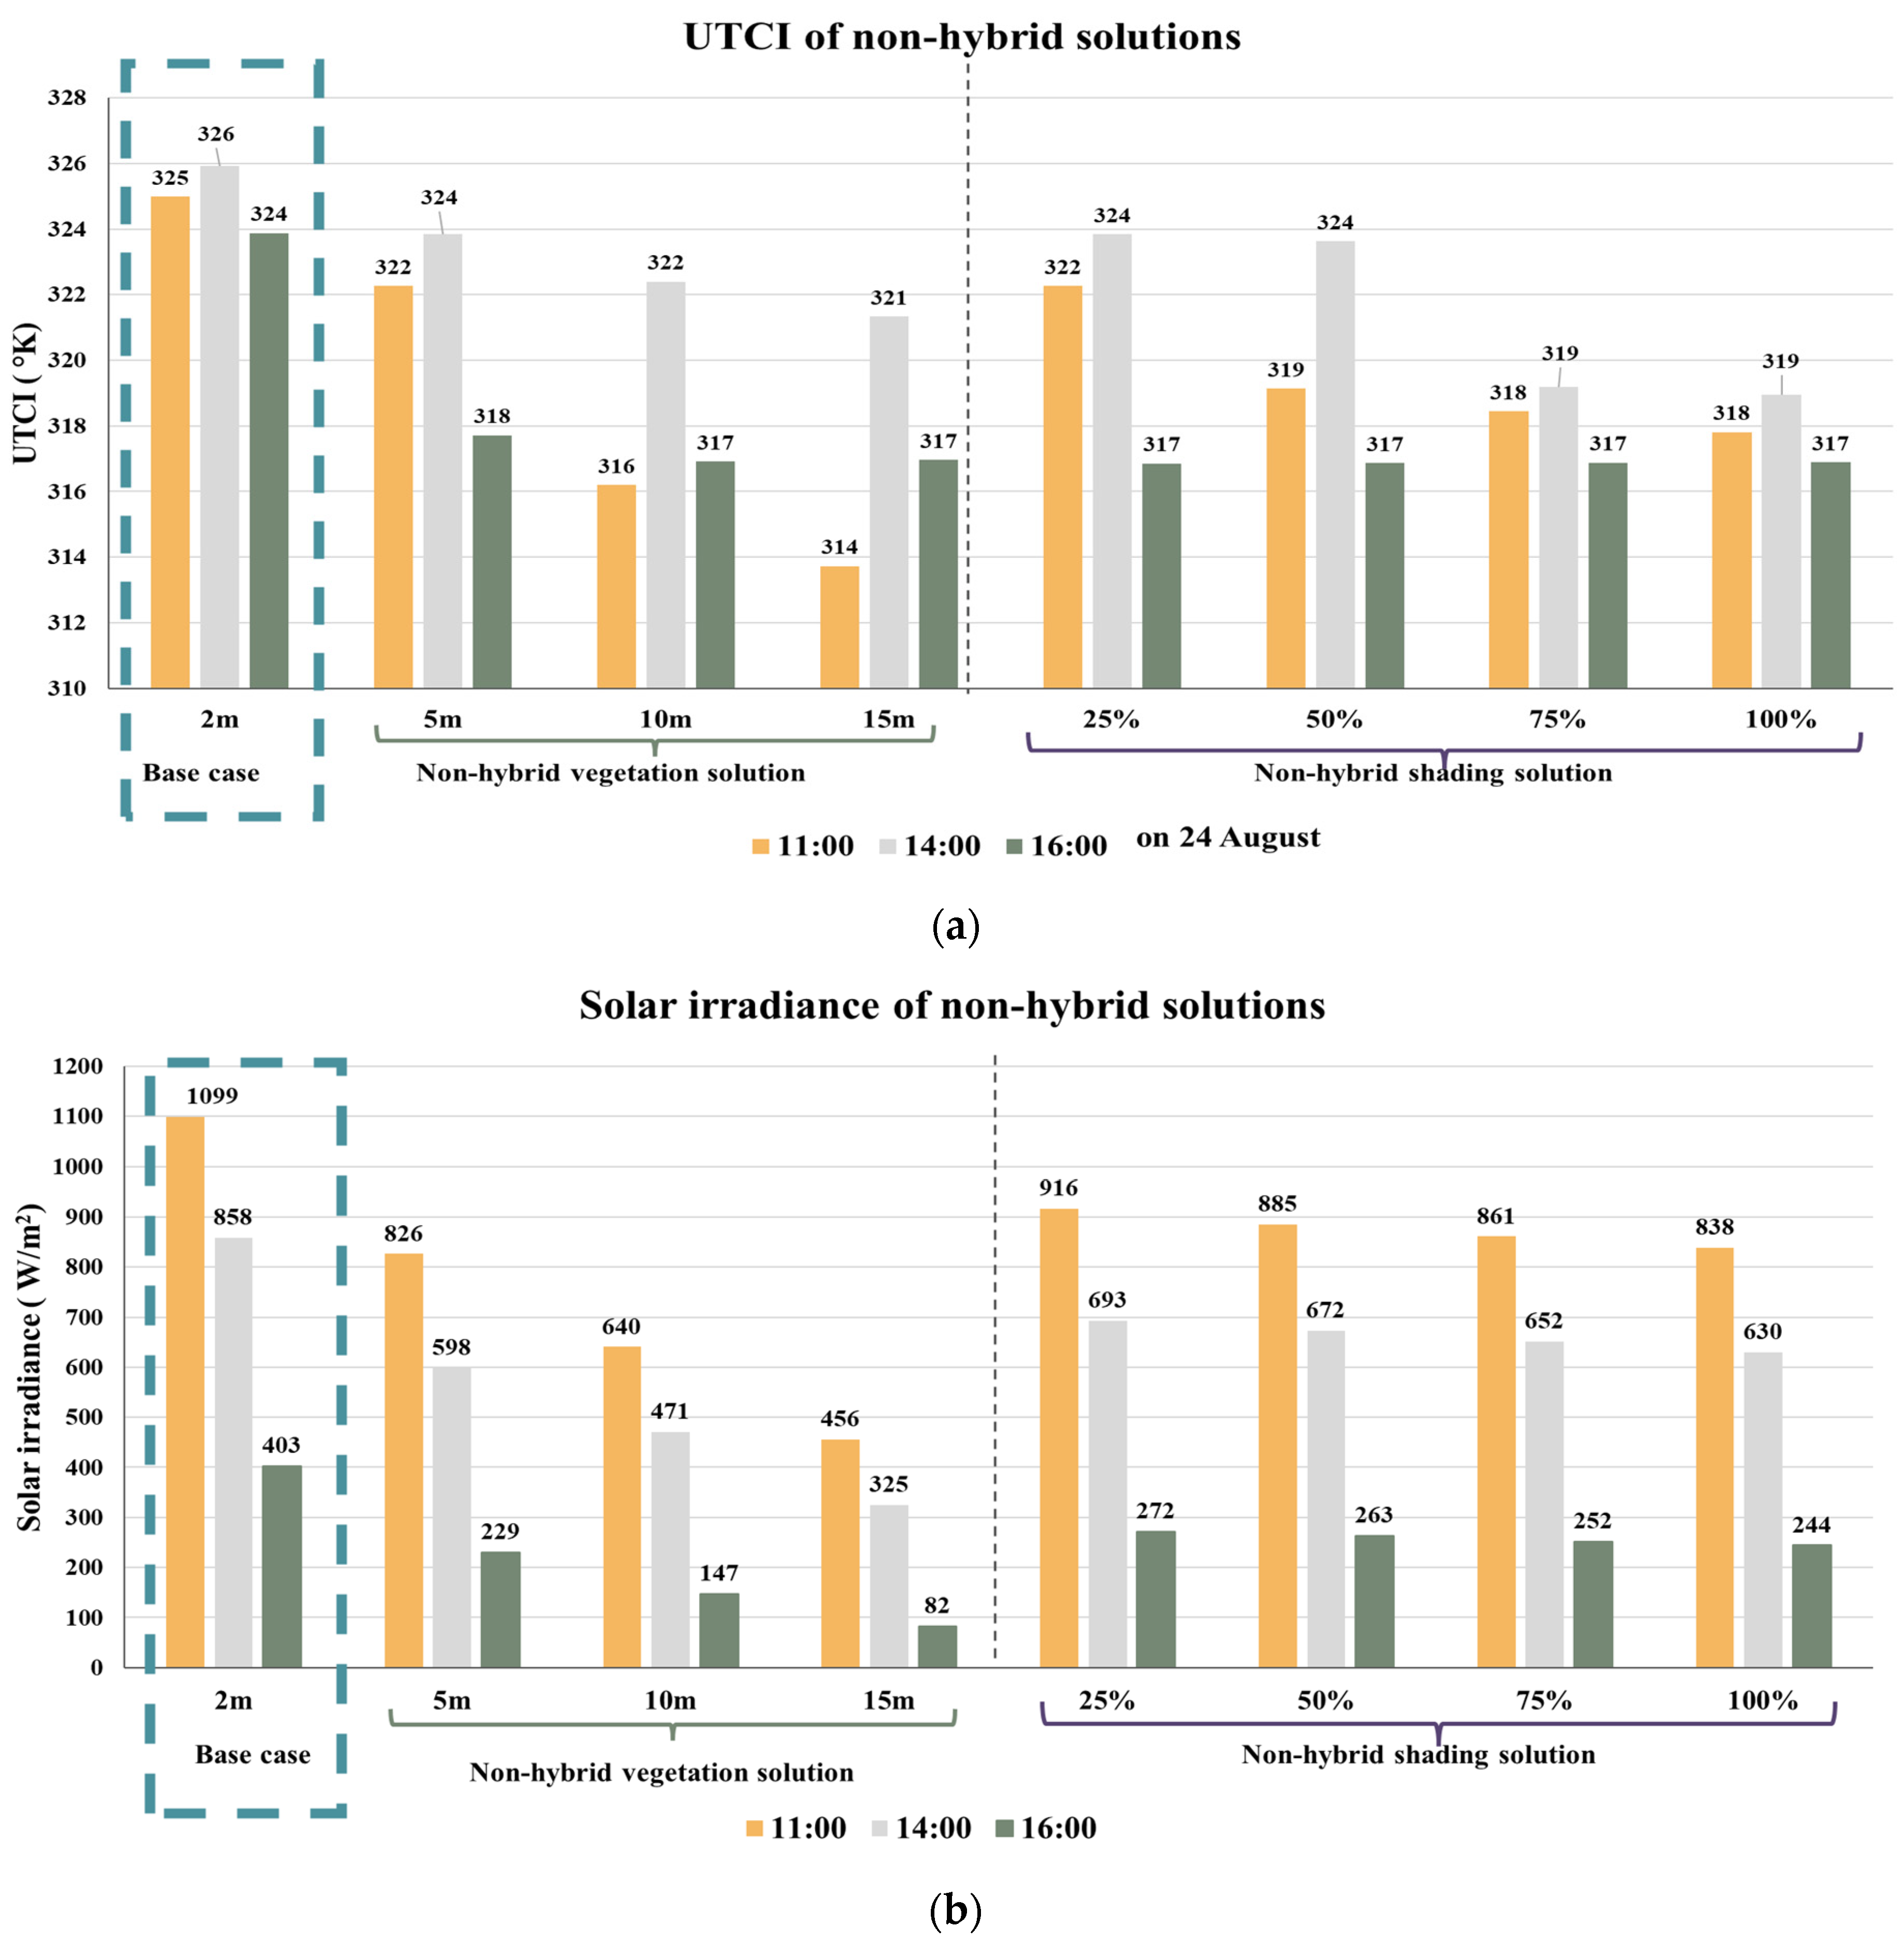
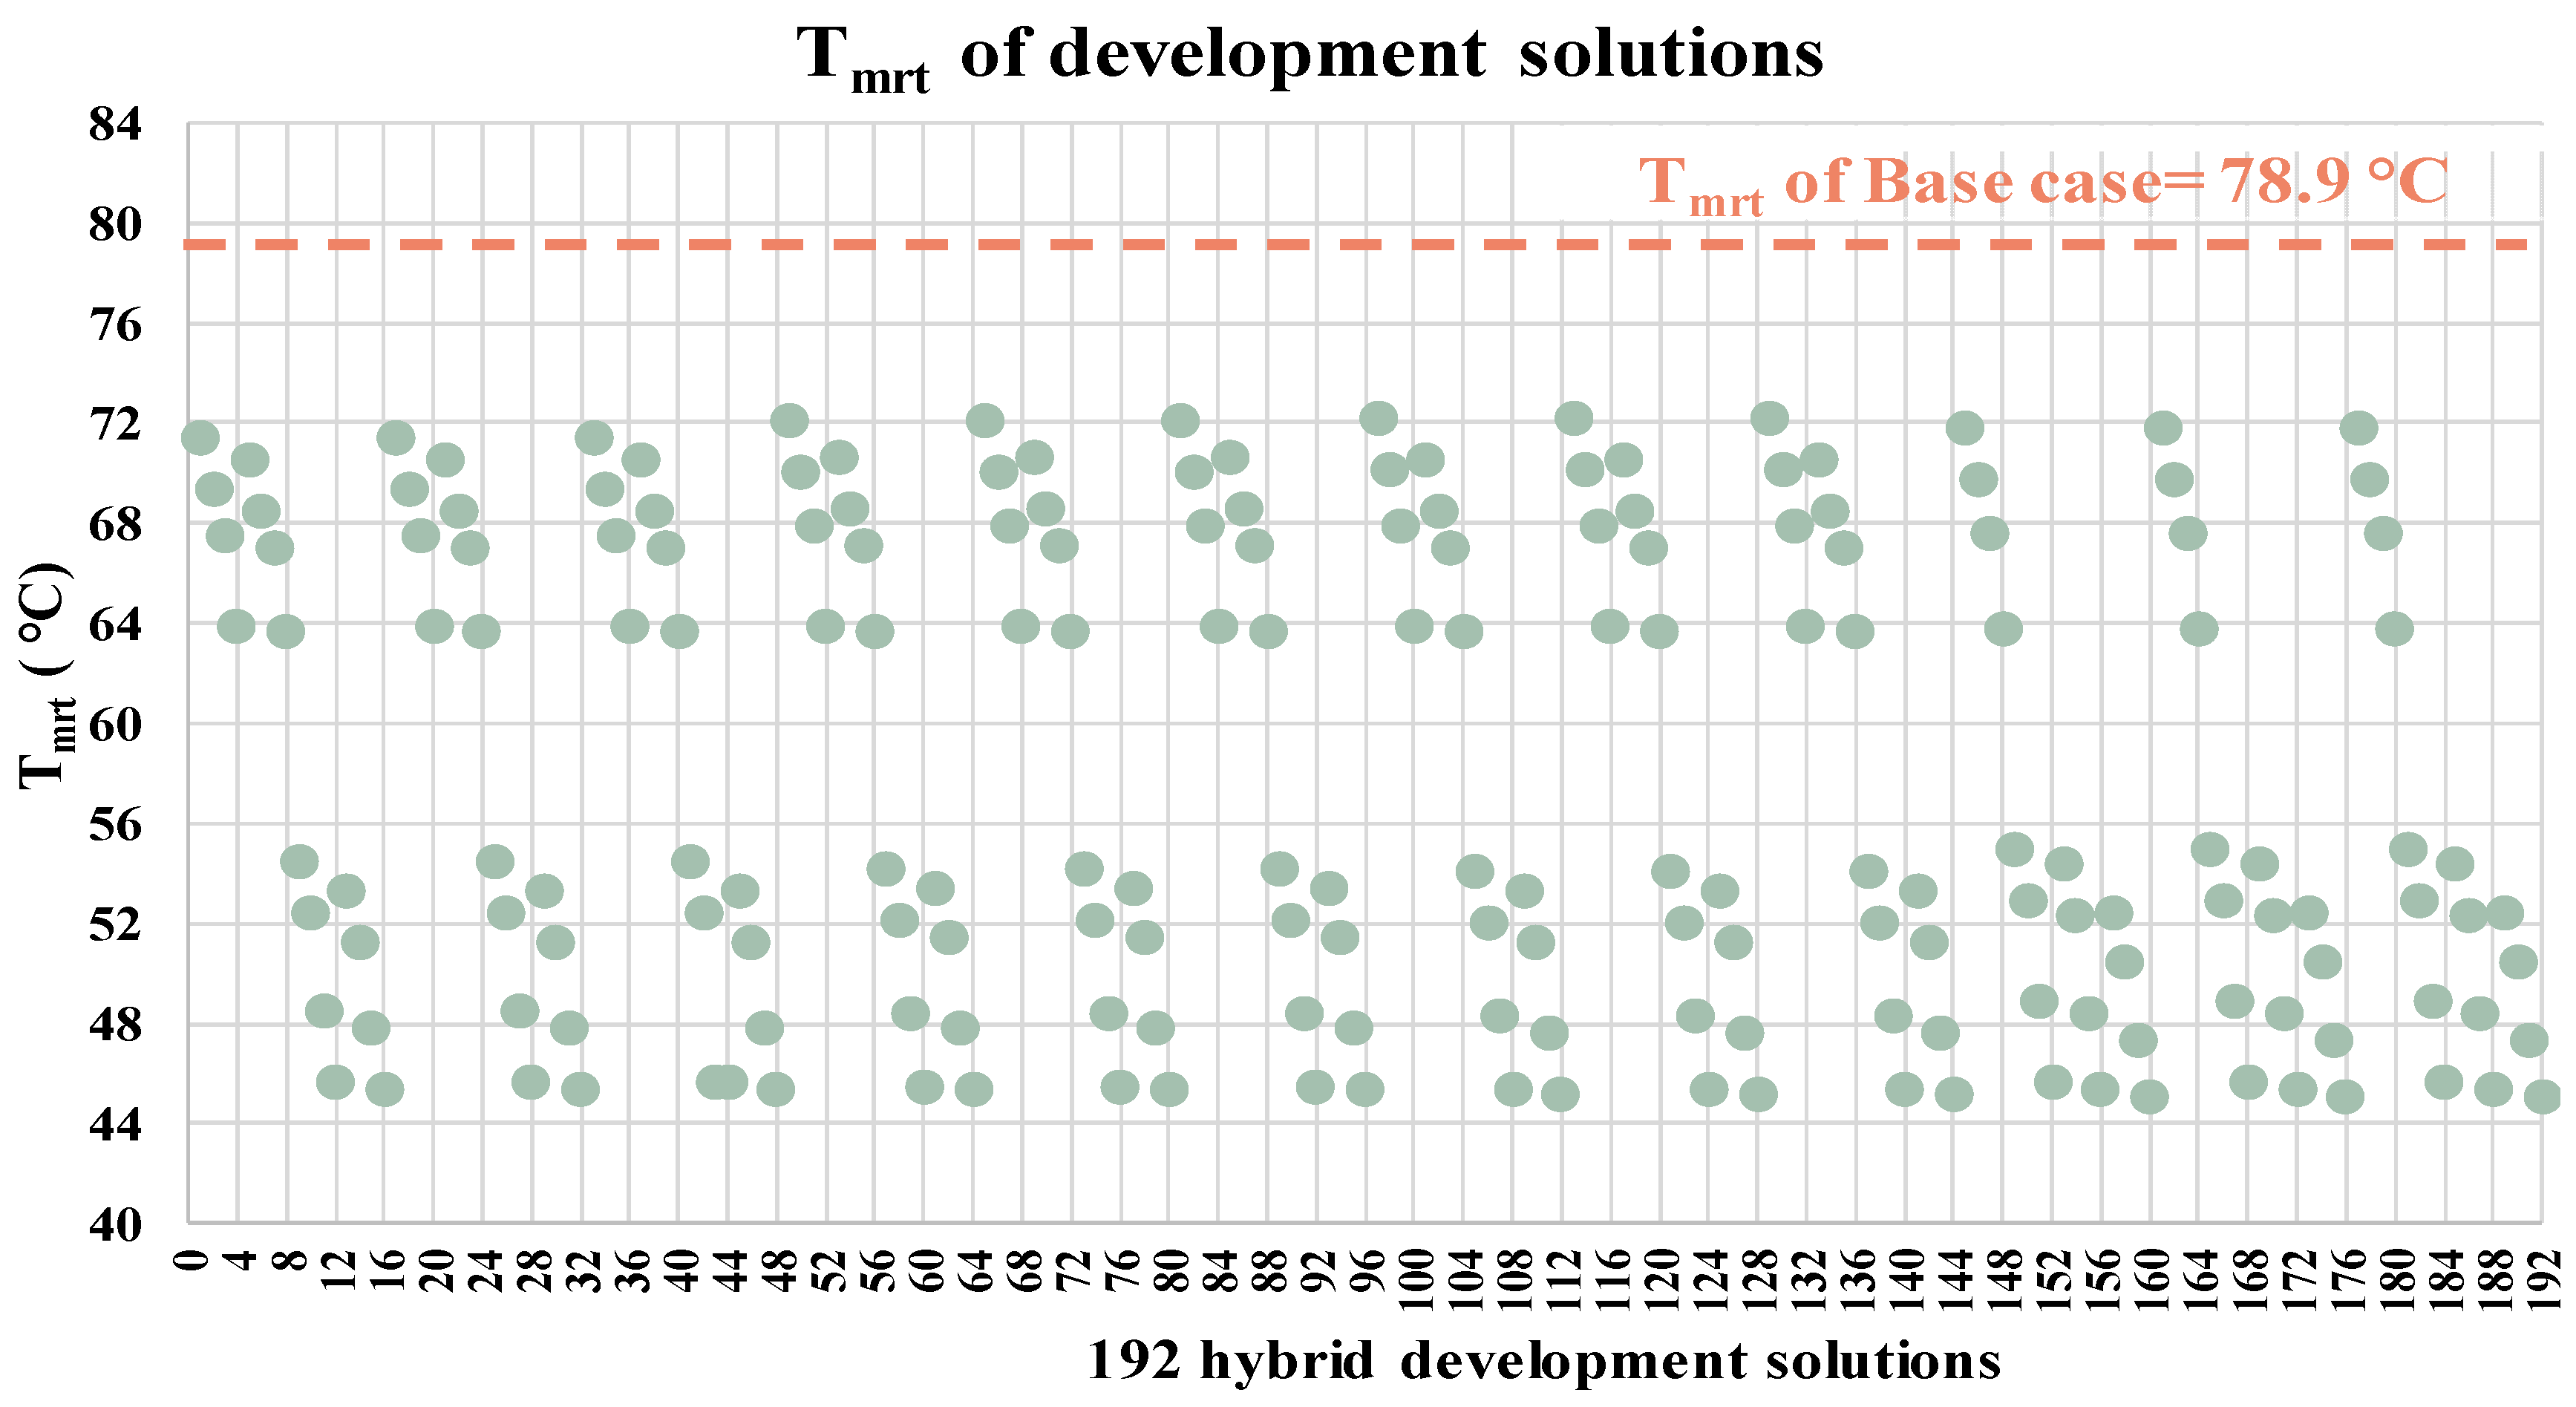
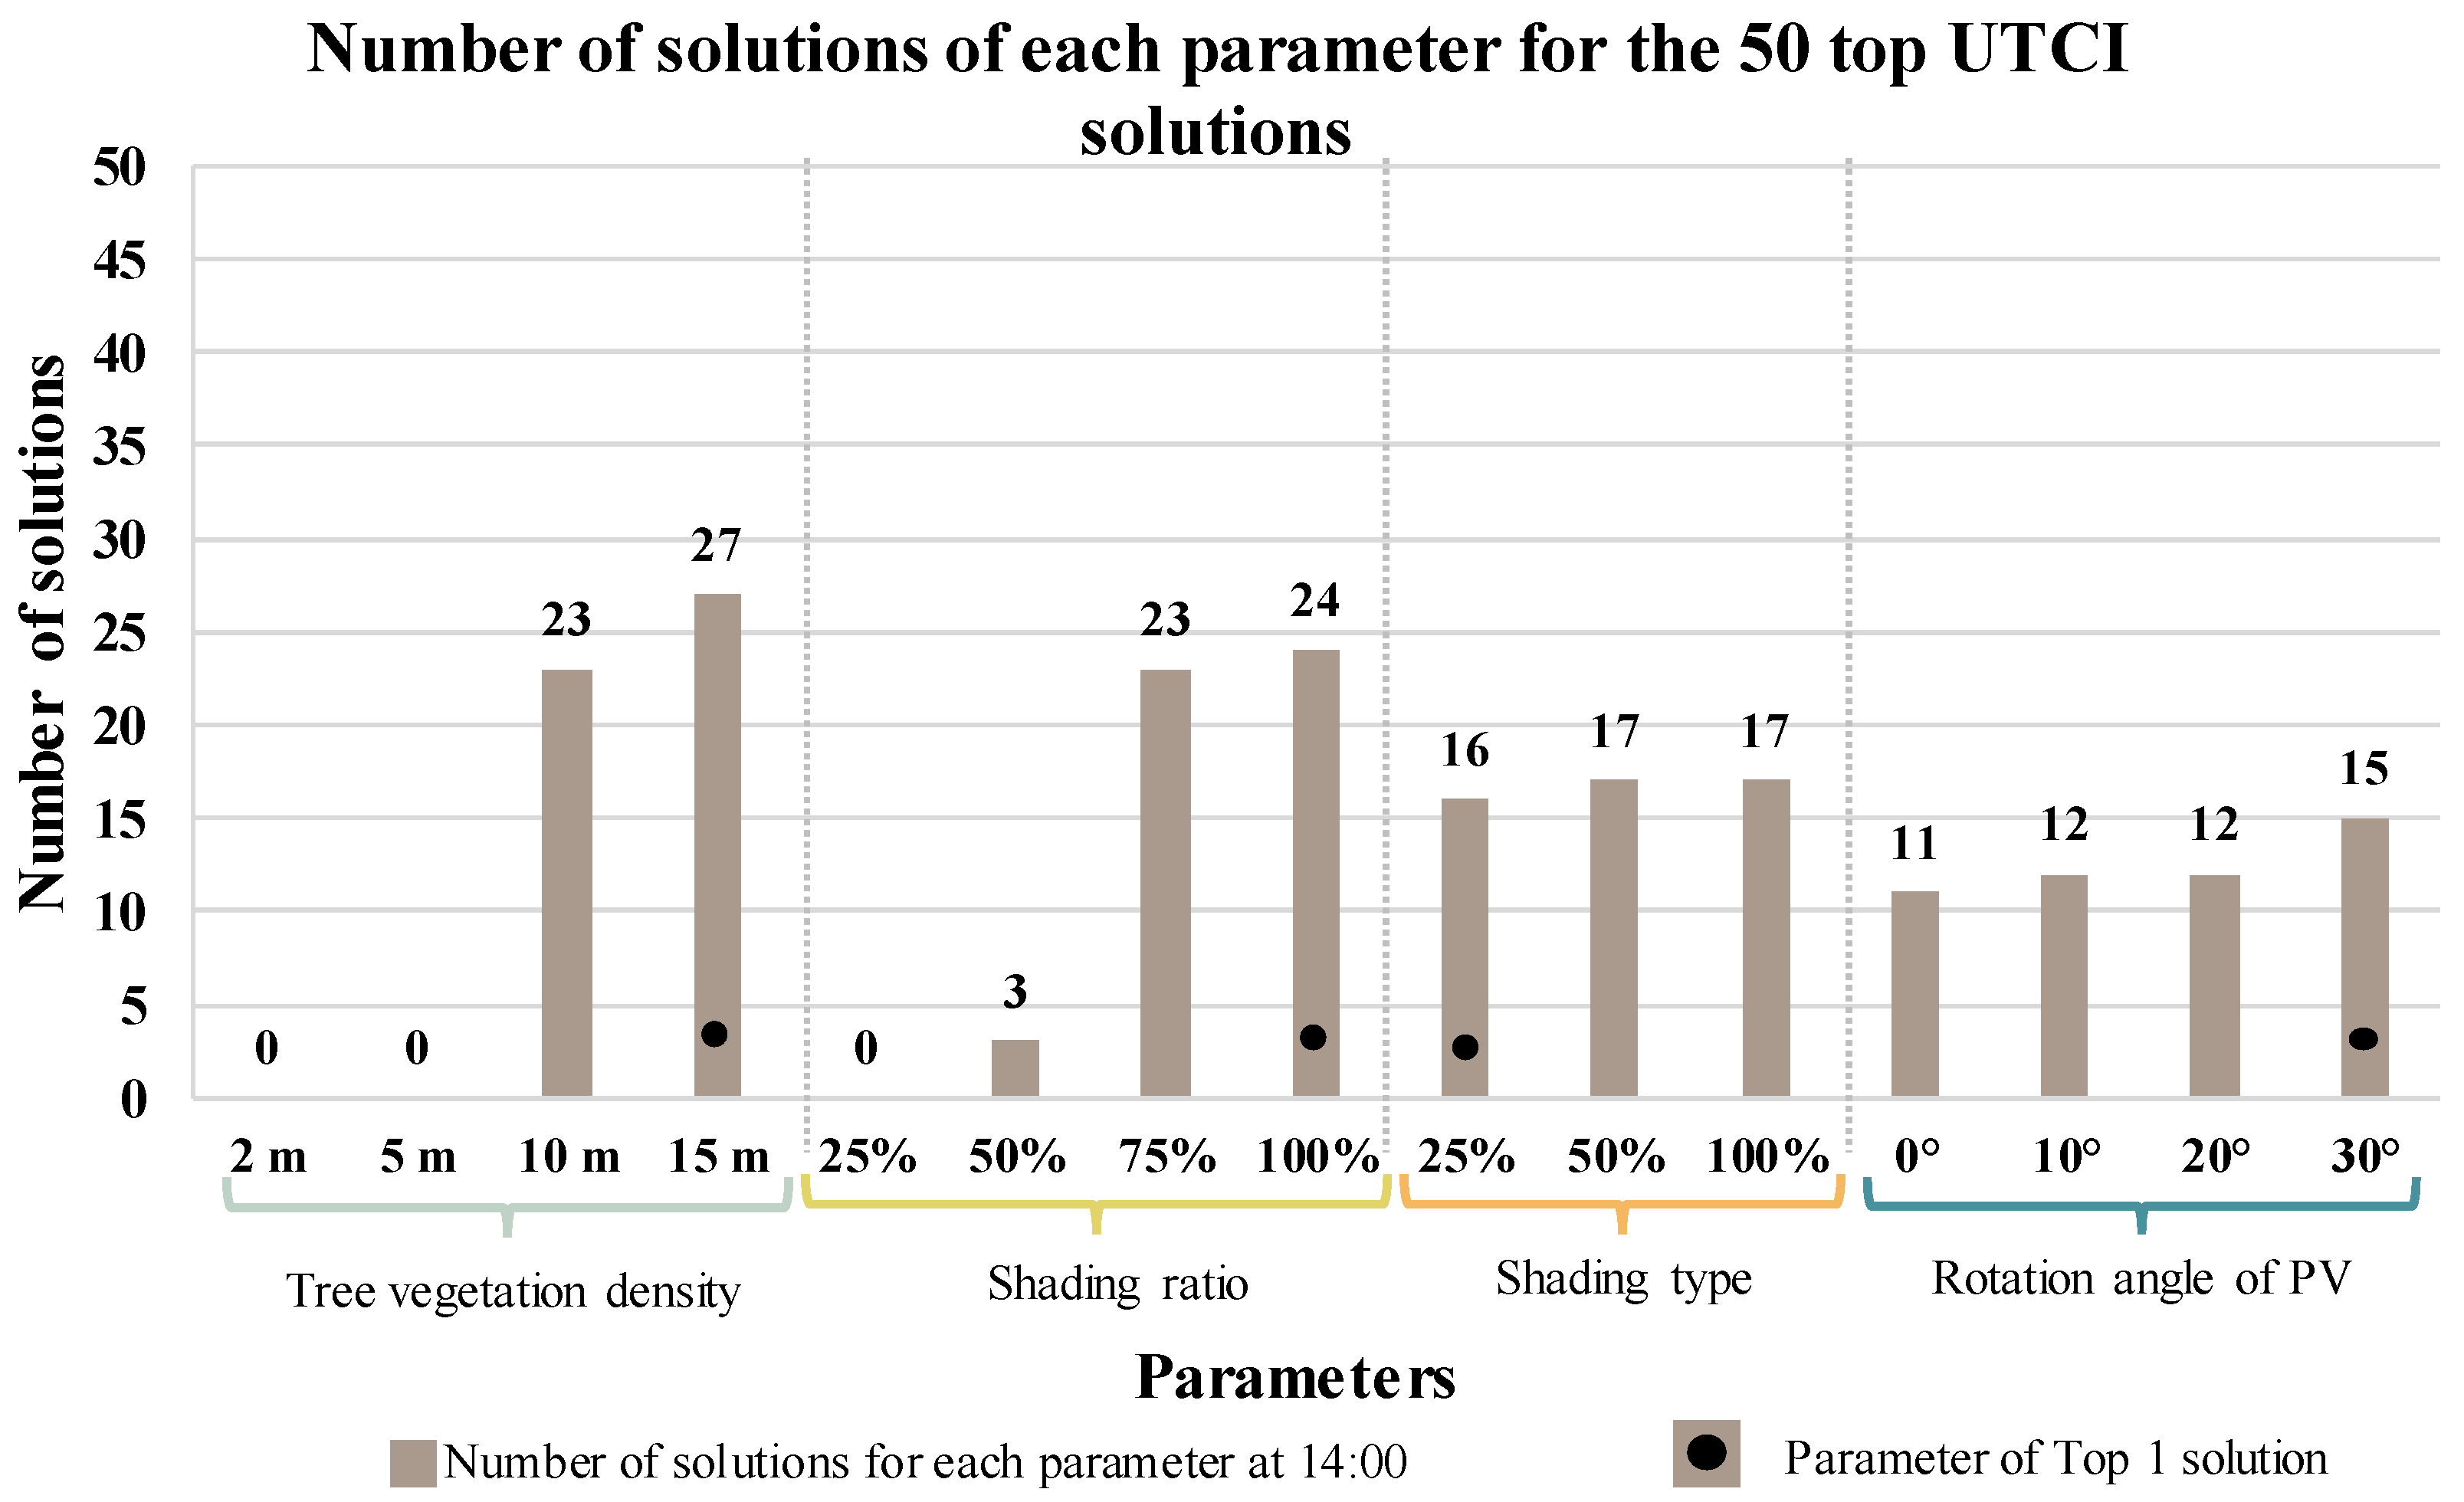
3.3. Optimization Objective 1: Improving Outdoor Thermal Comfort

The first objective in the parametric urban optimization framework is to improve the outdoor thermal comfort in the recreational area to enhance the inhabitants’ social activities. Consequently, the UTCI index was simulated in the base case and the 192 hybrid development solutions at three critical hours—11:00, 14:00, and 16:00—to investigate their impact during the hot hours of one day in the hottest week of the year (24 August). As elaborated in Figure 15, the hybrid development solutions contributed significantly to reducing UTCI values more than the base case. At 11:00, the reduction in UTCI in the sports walkways ranges from 3.18 K to 12.77 K. Also, Figure 15b illustrates the UTCI values of the development solutions at 14:00, which ranged from 316.6 K to 323 K. Consequently, the reduction was between 2.89 K and 9.74 K. The typical solution of UTCI at 11:00 and 14:00 is solution number 160, whose parameters are shown in Figure 15a at the right, and its UTCI values are 312.2 K and 316.2 K, respectively. On the other hand, the UTCI values at 16:00 were reduced by applying the development solutions in a range from 4.78 K to 9.2 K. So, the typical solution at 16:00 is solution number 109 with a UTCI value of 314.68 K.
This result is compatible with the results of [5], which clarified that the reduction in PET in hybrid solution reached 19.1 °C. Also, the results are consistent with the results of [6,9,10]. Conversely, these outcomes are inconsistent with the results of [11] that the reduction in UTCI was 1.6 °C by changing building rotation; in addition, the results of [16] that the reduction in UTCI was 1.02 °C by increasing 10% of building density.
Moreover, the impact of the parameters of the hybrid development solutions on UTCI reduction was analyzed and elaborated in Figure 16. In the beginning, the top 50 solutions of UTCI values were selected to study the impact of parameters on them. The UTCI values of the top 50 solutions at 14:00 were between 316.2 K and 316.9 K, while the UTCI value of the base case was 326 K. Hence, the trees with diameters 10 m and 15 m were the most efficient compared to the other ones. These results are compatible with past research that confirms the optimization of tree location and characteristics improves thermal comfort [1]. Also, shadings with a ratio of 75% and 100% of the total shading area were significantly influential in reducing UTCI. Despite the type of shading not being considered an efficient parameter, the rotation angle of PV panels of 30° slightly affects UTCI.

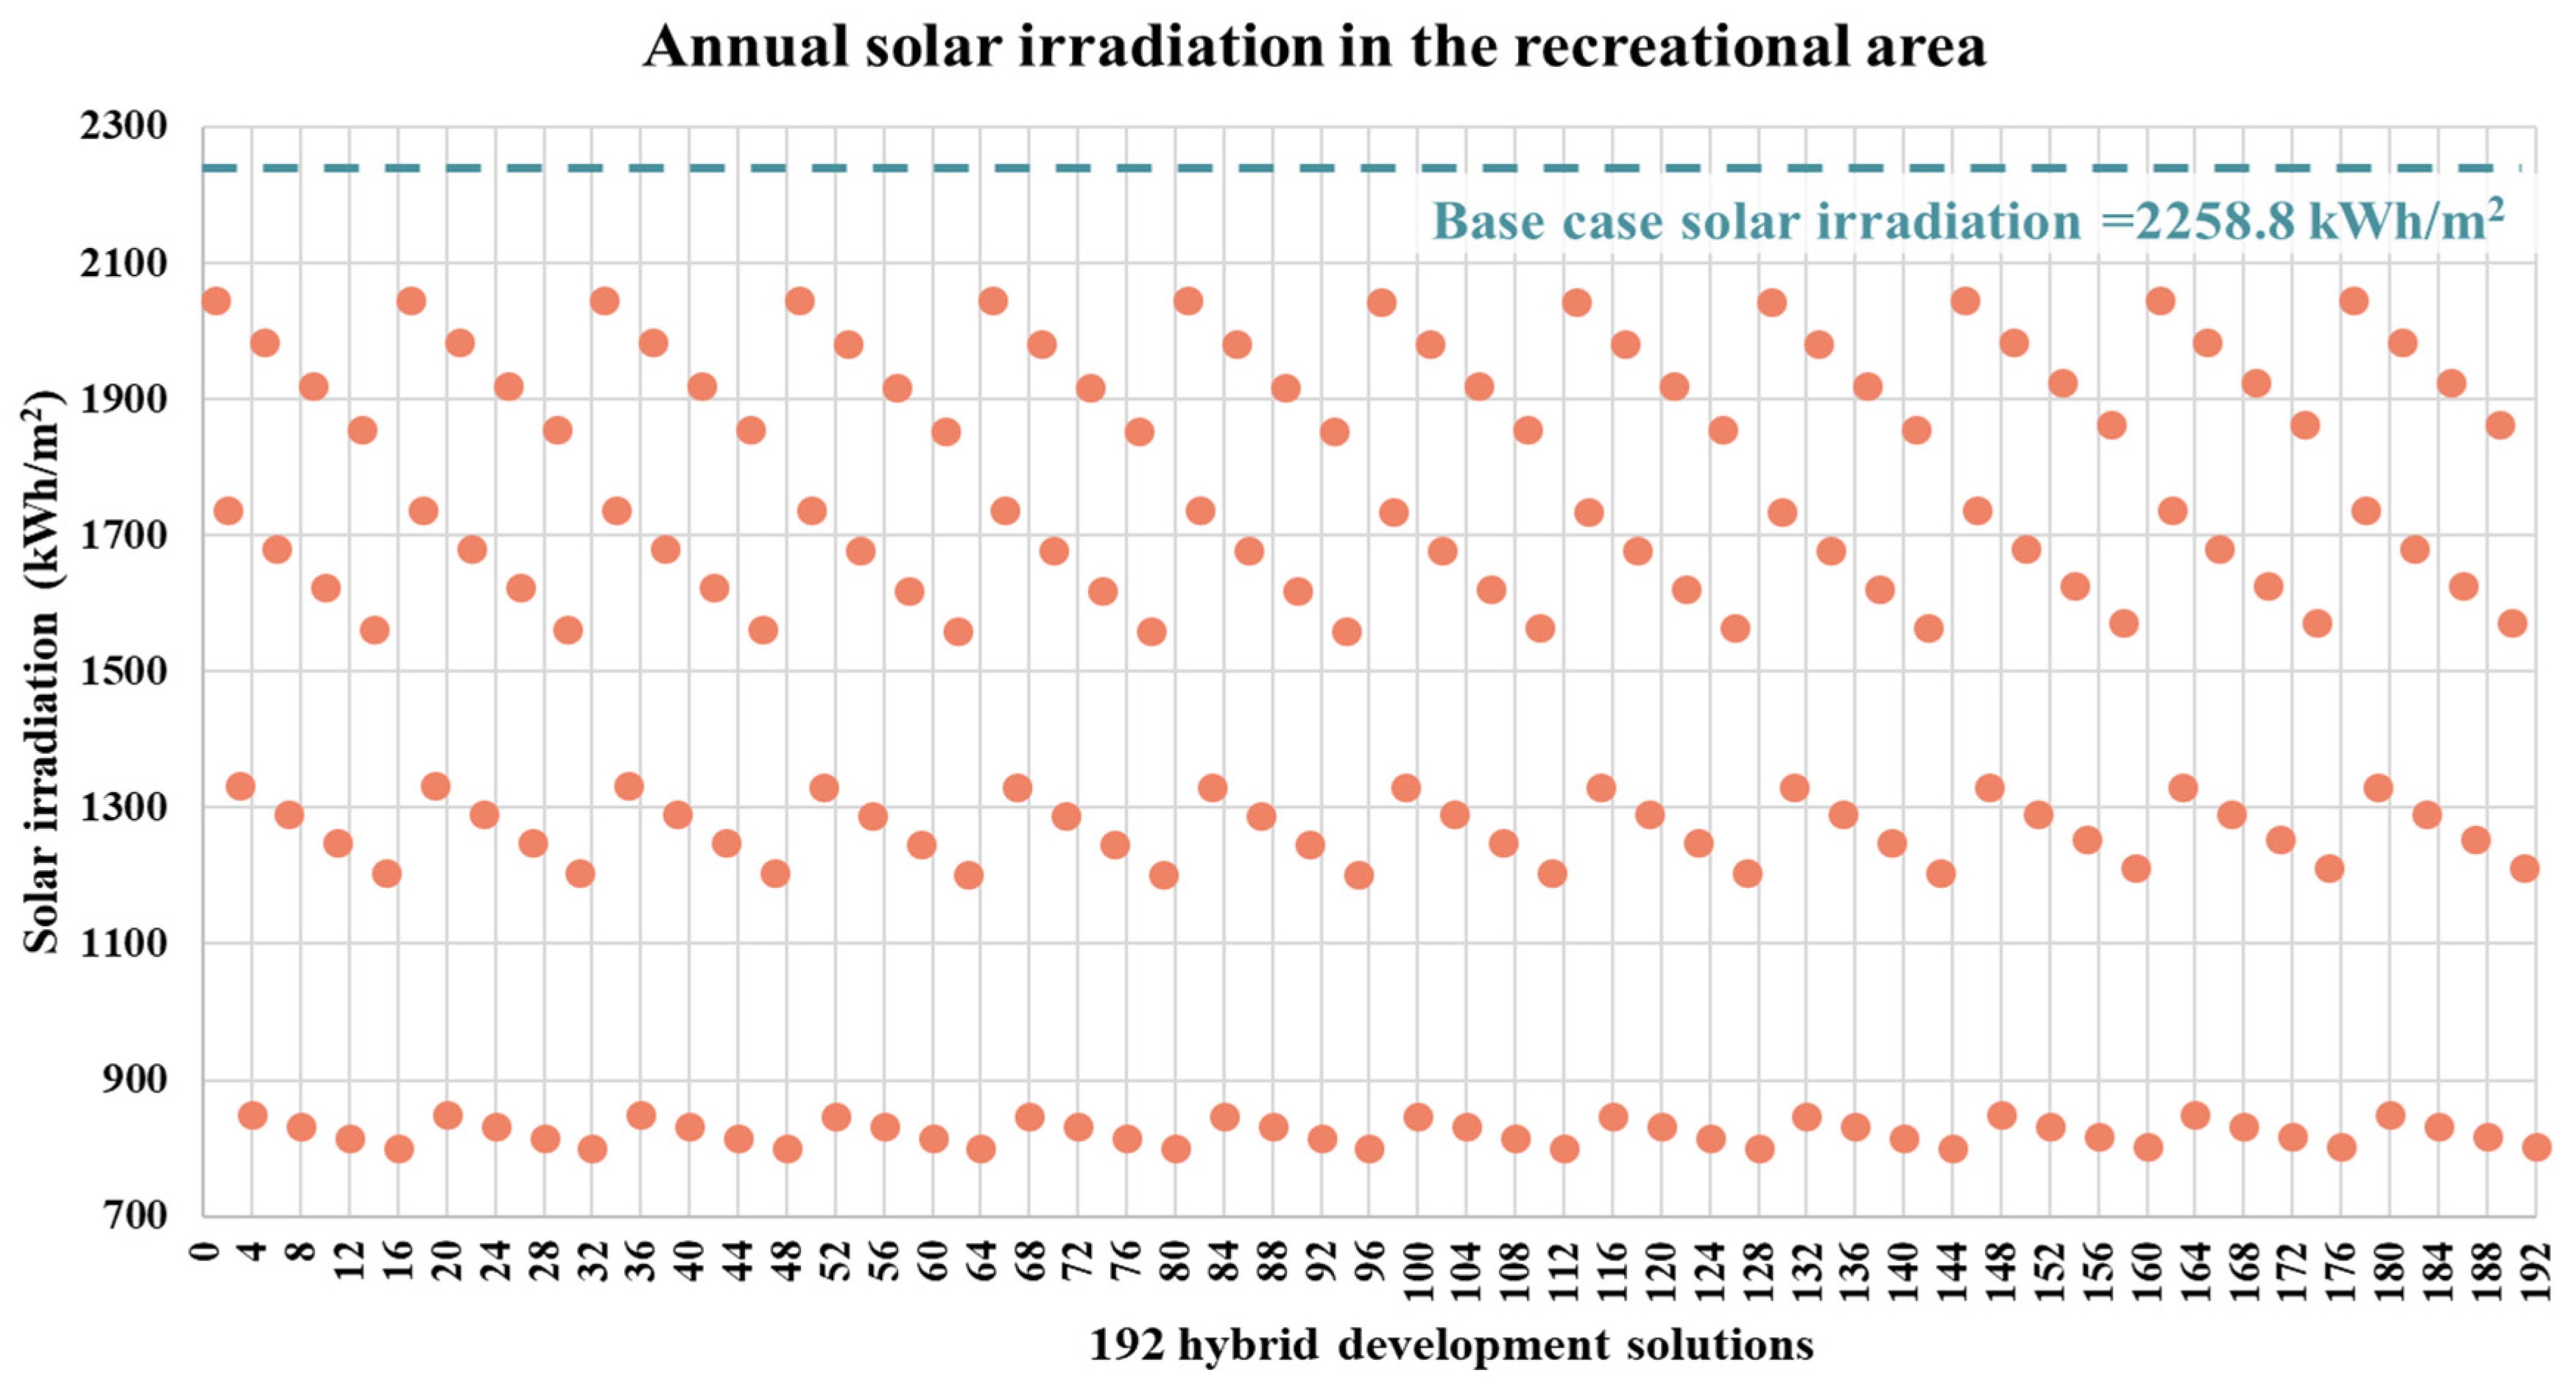
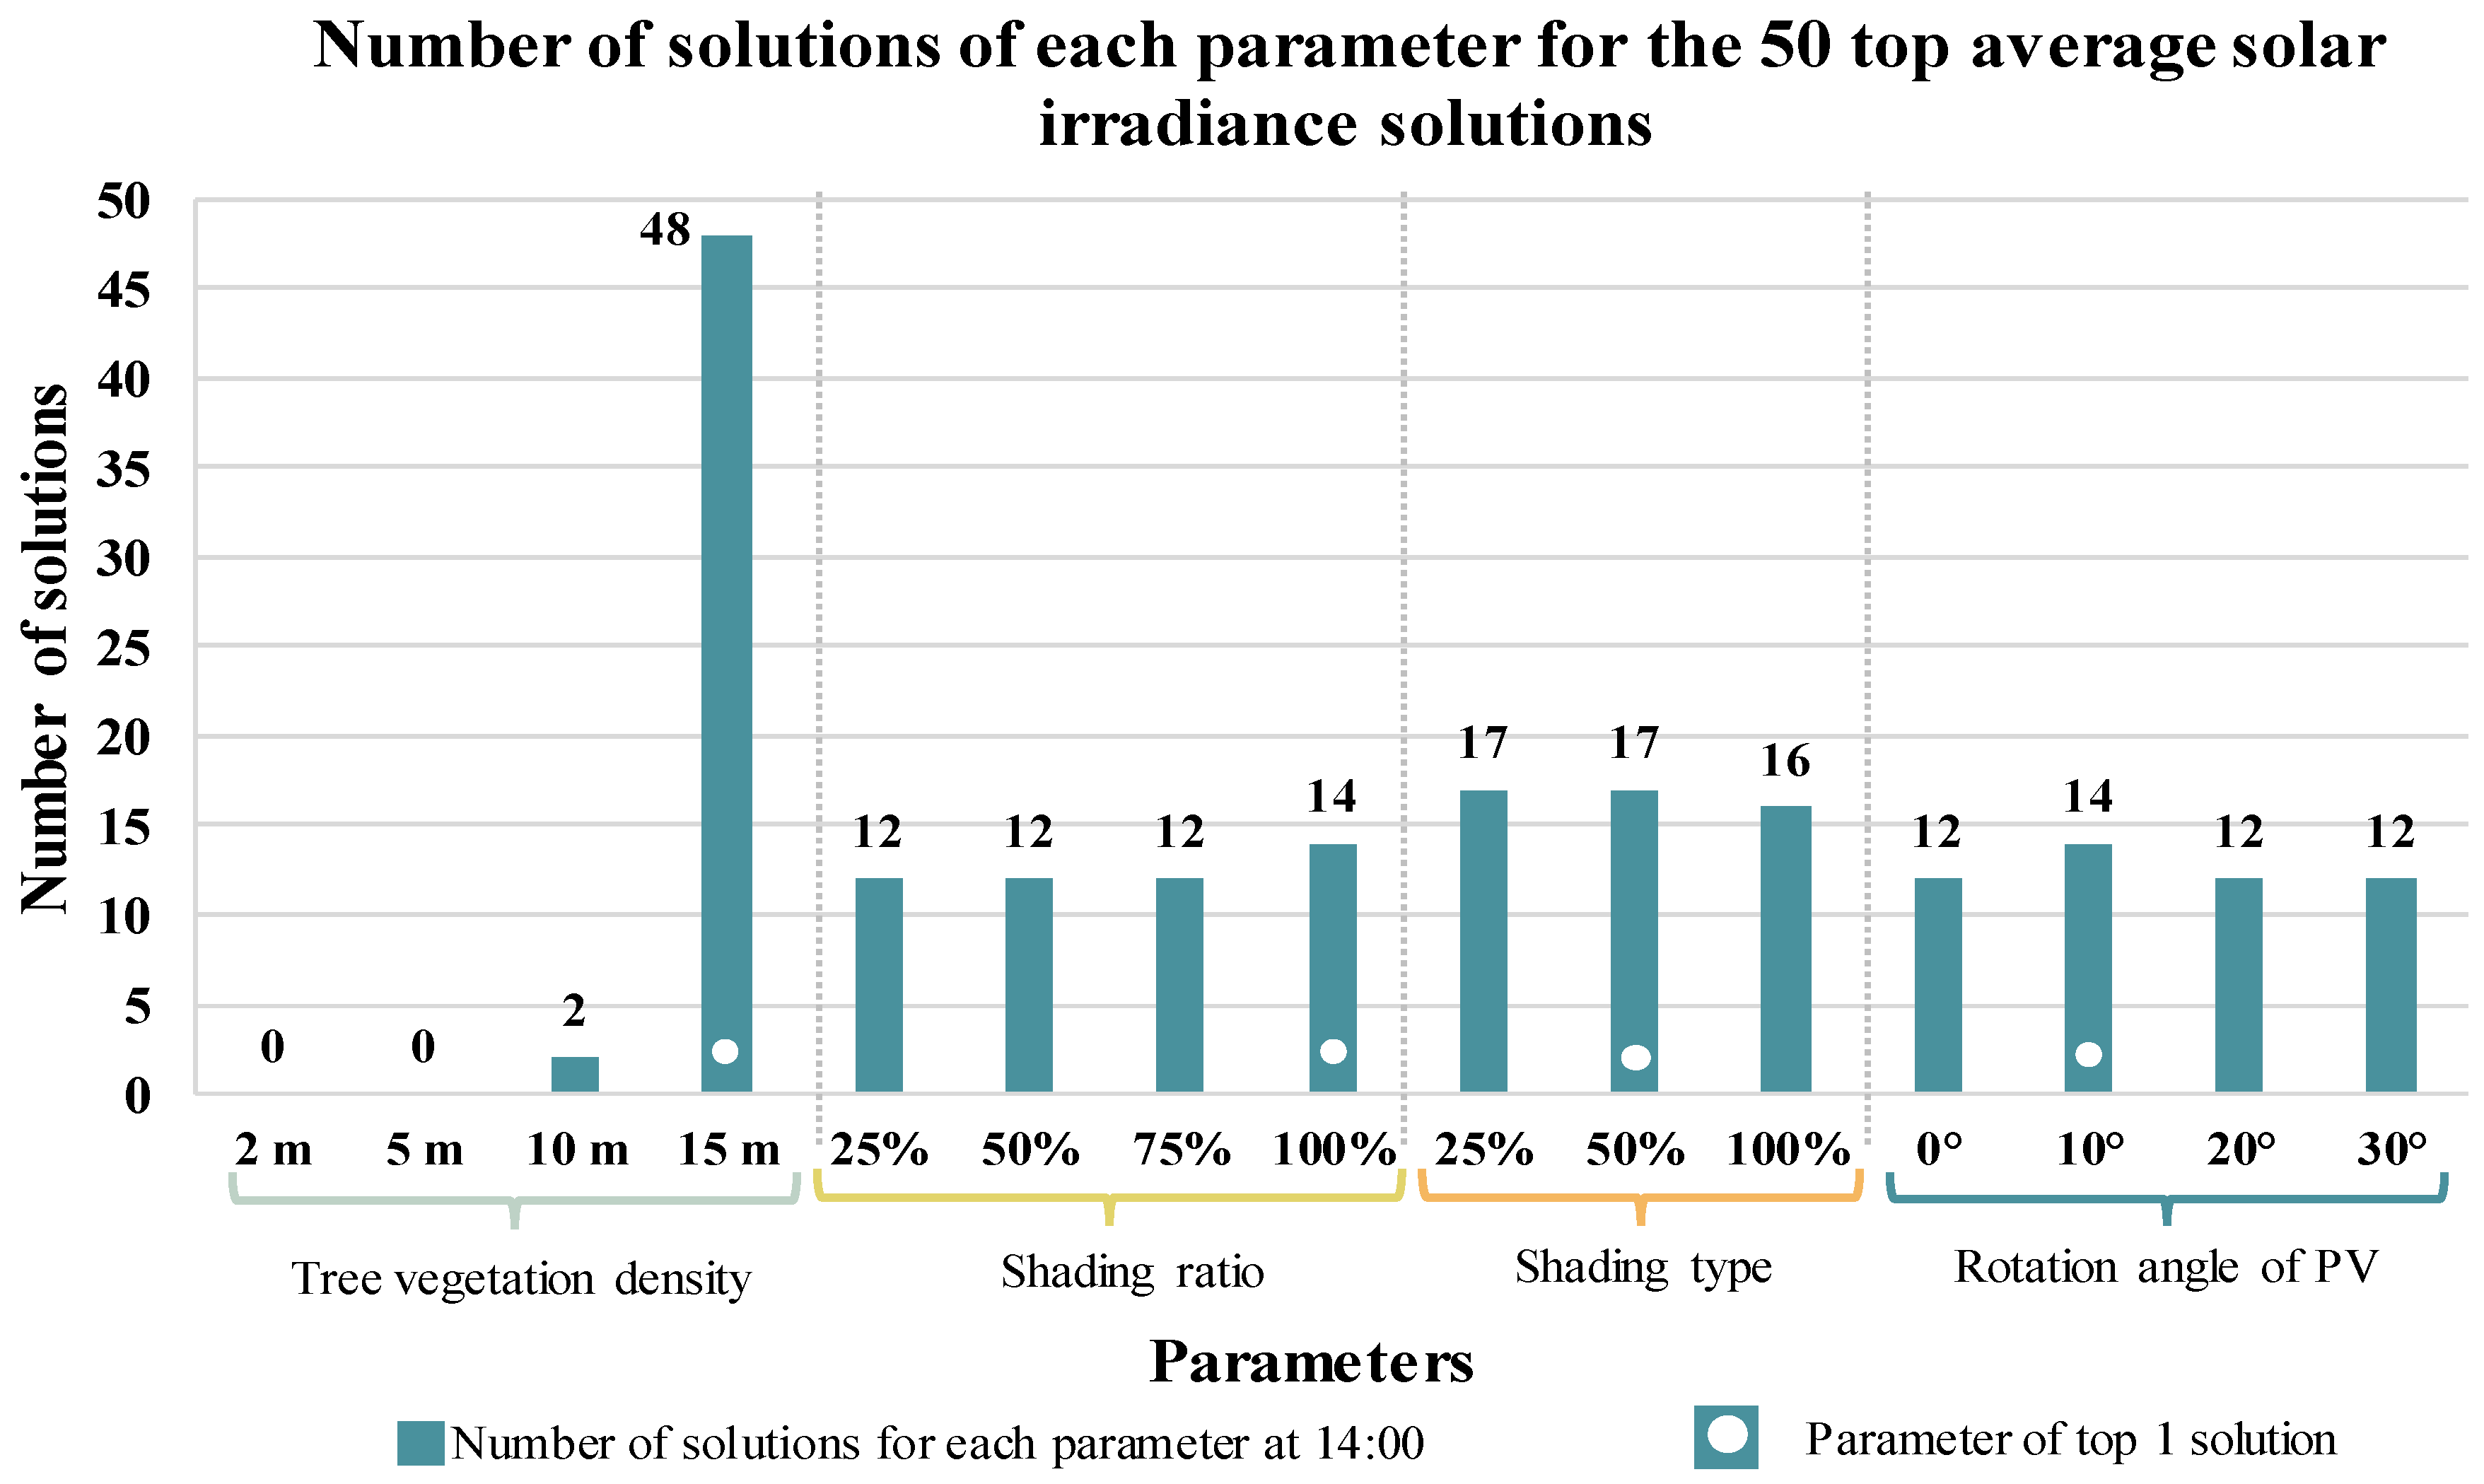
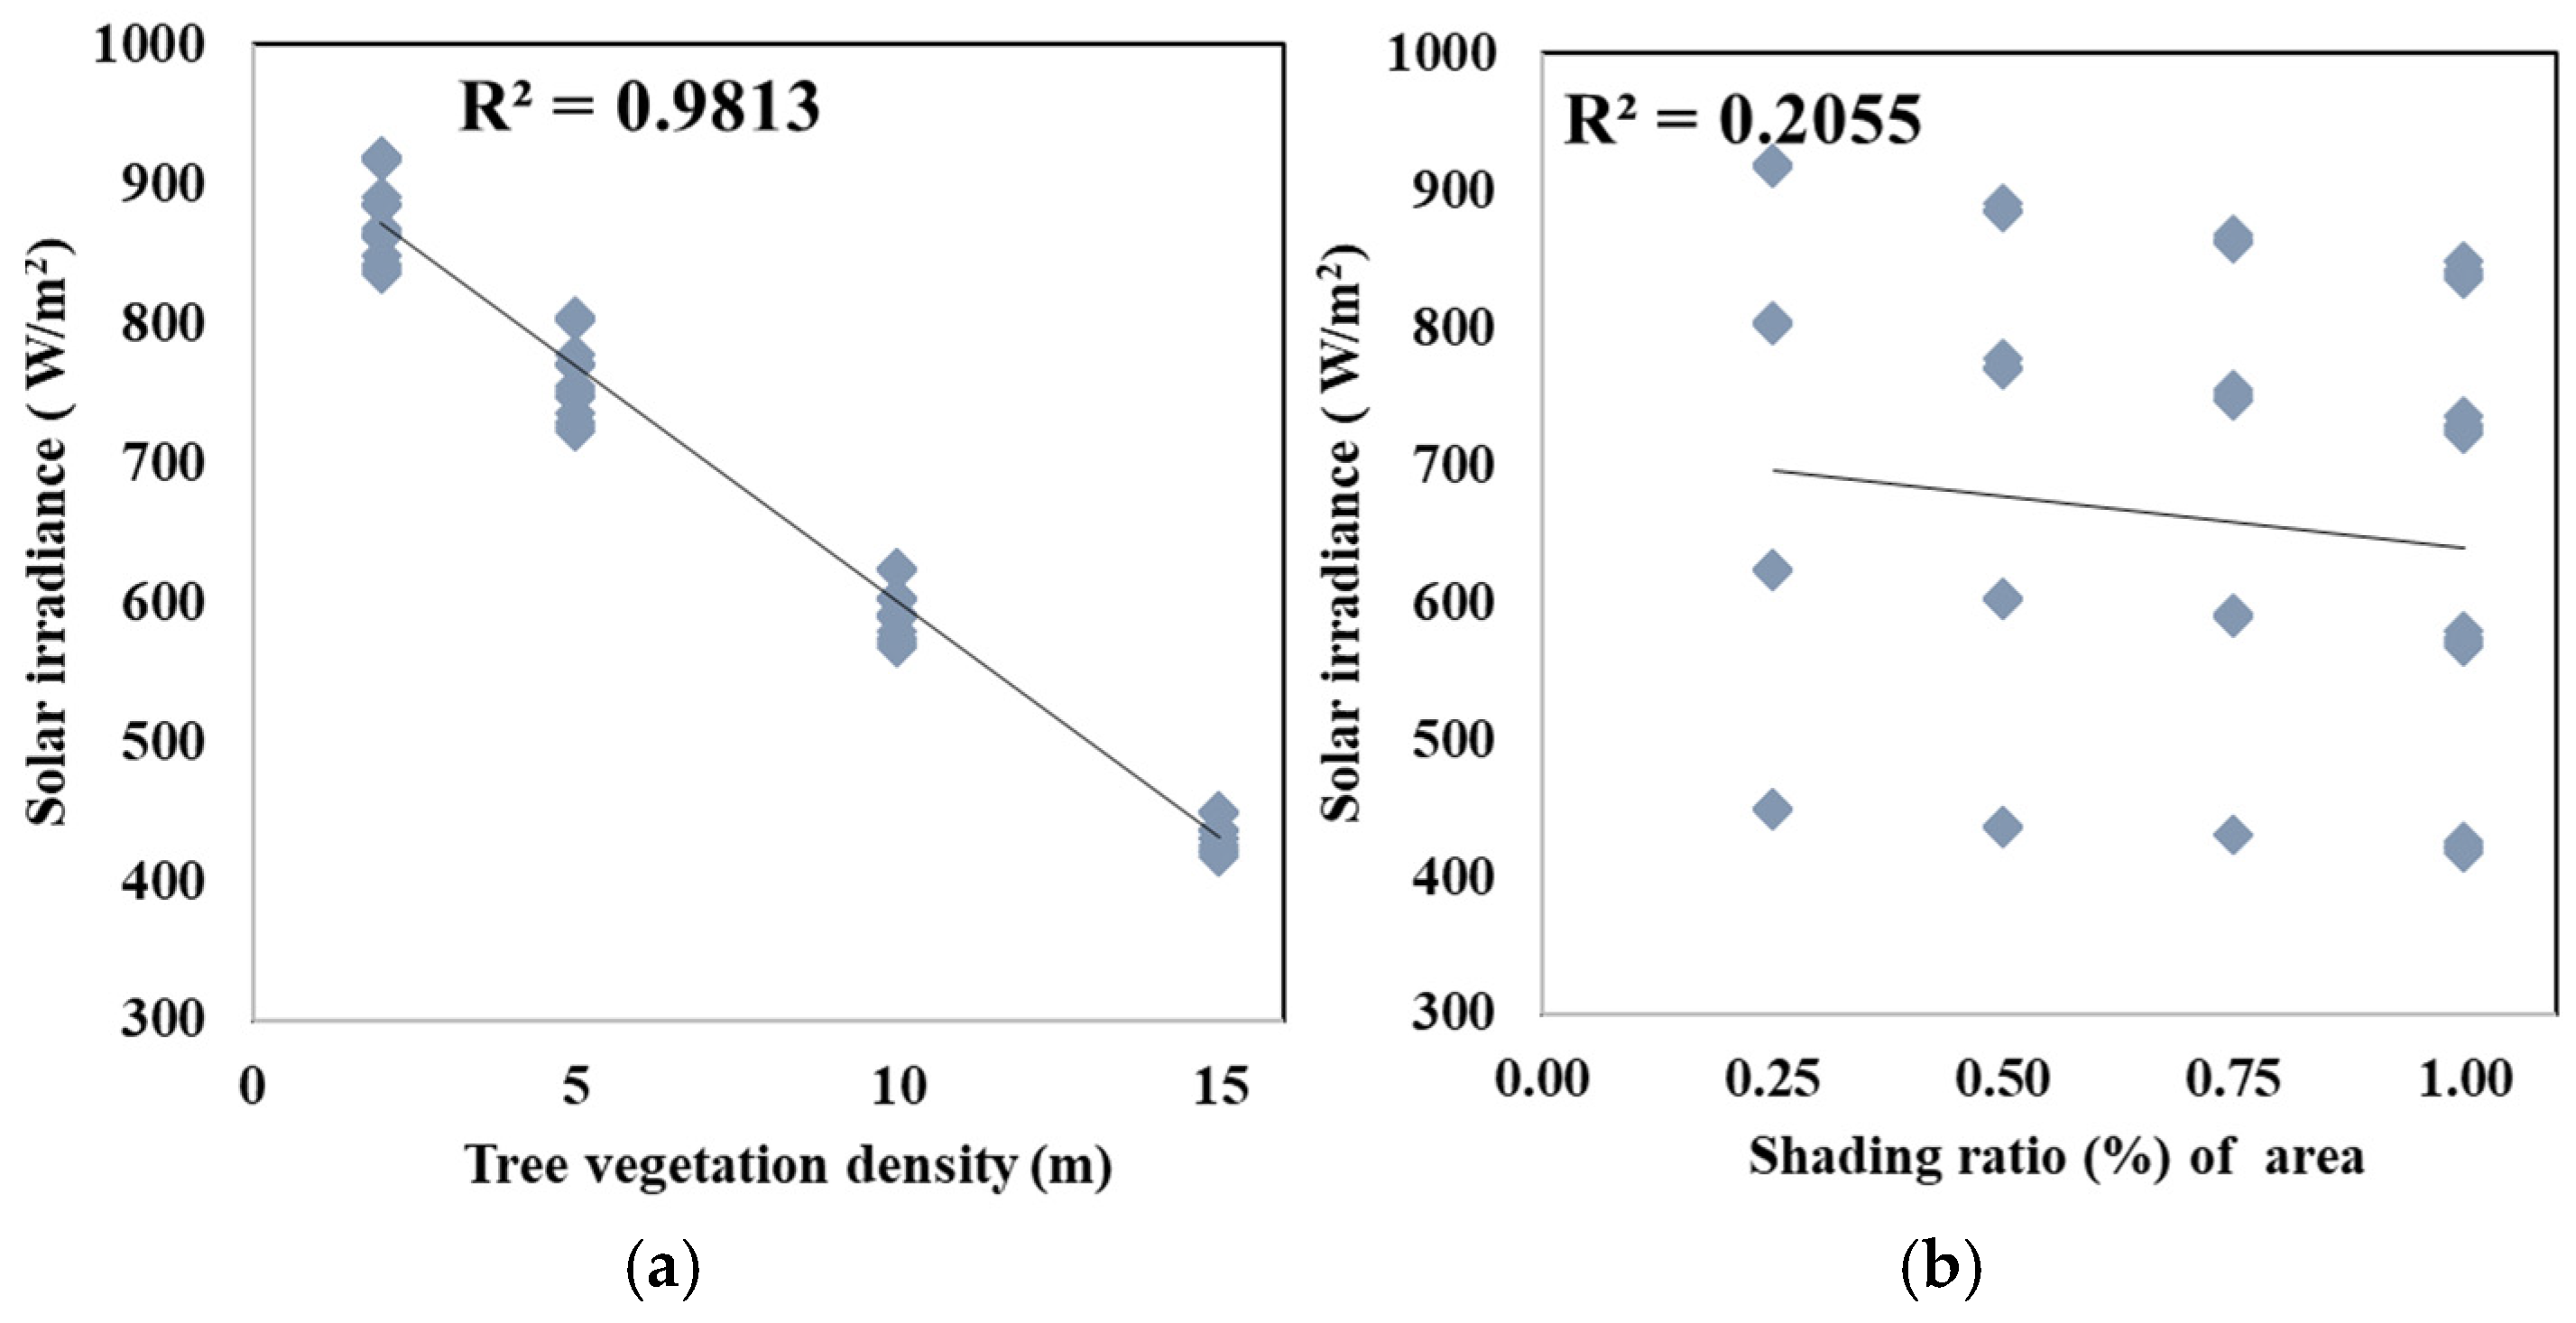
3.4. Optimization Objective 2: Reducing Average Solar Irradiance

The second objective in the parametric urban optimization framework is reducing the solar irradiance in the recreational area to enhance the inhabitants’ social activities. Hence, the average solar irradiance has been simulated for the base case and the 192 hybrid development solutions at 11:00, 14:00, and 16:00, separately. Figure 17a shows the high solar irradiance of the base case, which is 858.5 W/m2, while the average solar irradiance of the development ranges from 284.6 W/m2 to 693 W/m2. Thus, the development solutions contributed to a reduction ranging between 165.8 W/m2 and 574.2 W/m2. The typical solution for reducing the average solar irradiance was solution 160, whose parameters are shown in Figure 17a to the right, with a value of 284.6 W/m2. These results are compatible with past research that confirms the reduction in annual solar radiation based on geometric parameters [14].
The hour of 14:00 witnessed a very high solar irradiance in the base case, reaching 1099.7 W/m2. But after applying the development solutions, the average solar irradiance reduced by a range from 179.9 W/m2 to 682 W/m2, whereas it reached 284.6–417.6 W/m2 as the minimum value by applying development solution 64 (Figure 17b). Although the solar irradiance in the base case already decreased at 16:00 (403.07 W/m2), the development solutions contributed to reducing the same by 131.1–324.1 W/m2 to reach 78.94 W/m2 in solution 16.
Figure 18 shows the influence of the hybrid development solution parameters on the top 50 solutions of average solar irradiance. The average solar irradiance of the top 50 solutions ranges from 417.6 W/m2 to 568.1 W/m2, while the average solar irradiance of the base case is 1099.7 W/m2. It can be shown that the wide diameter of trees 15 m plays the main role in reducing the solar irradiance over the entire park area due to providing a wide shading area. Also, the shading ratio of 100% of the total shading area and the rotation angle of PV panels of 10° are effective to a small extent compared to their counterparts of the parameters.

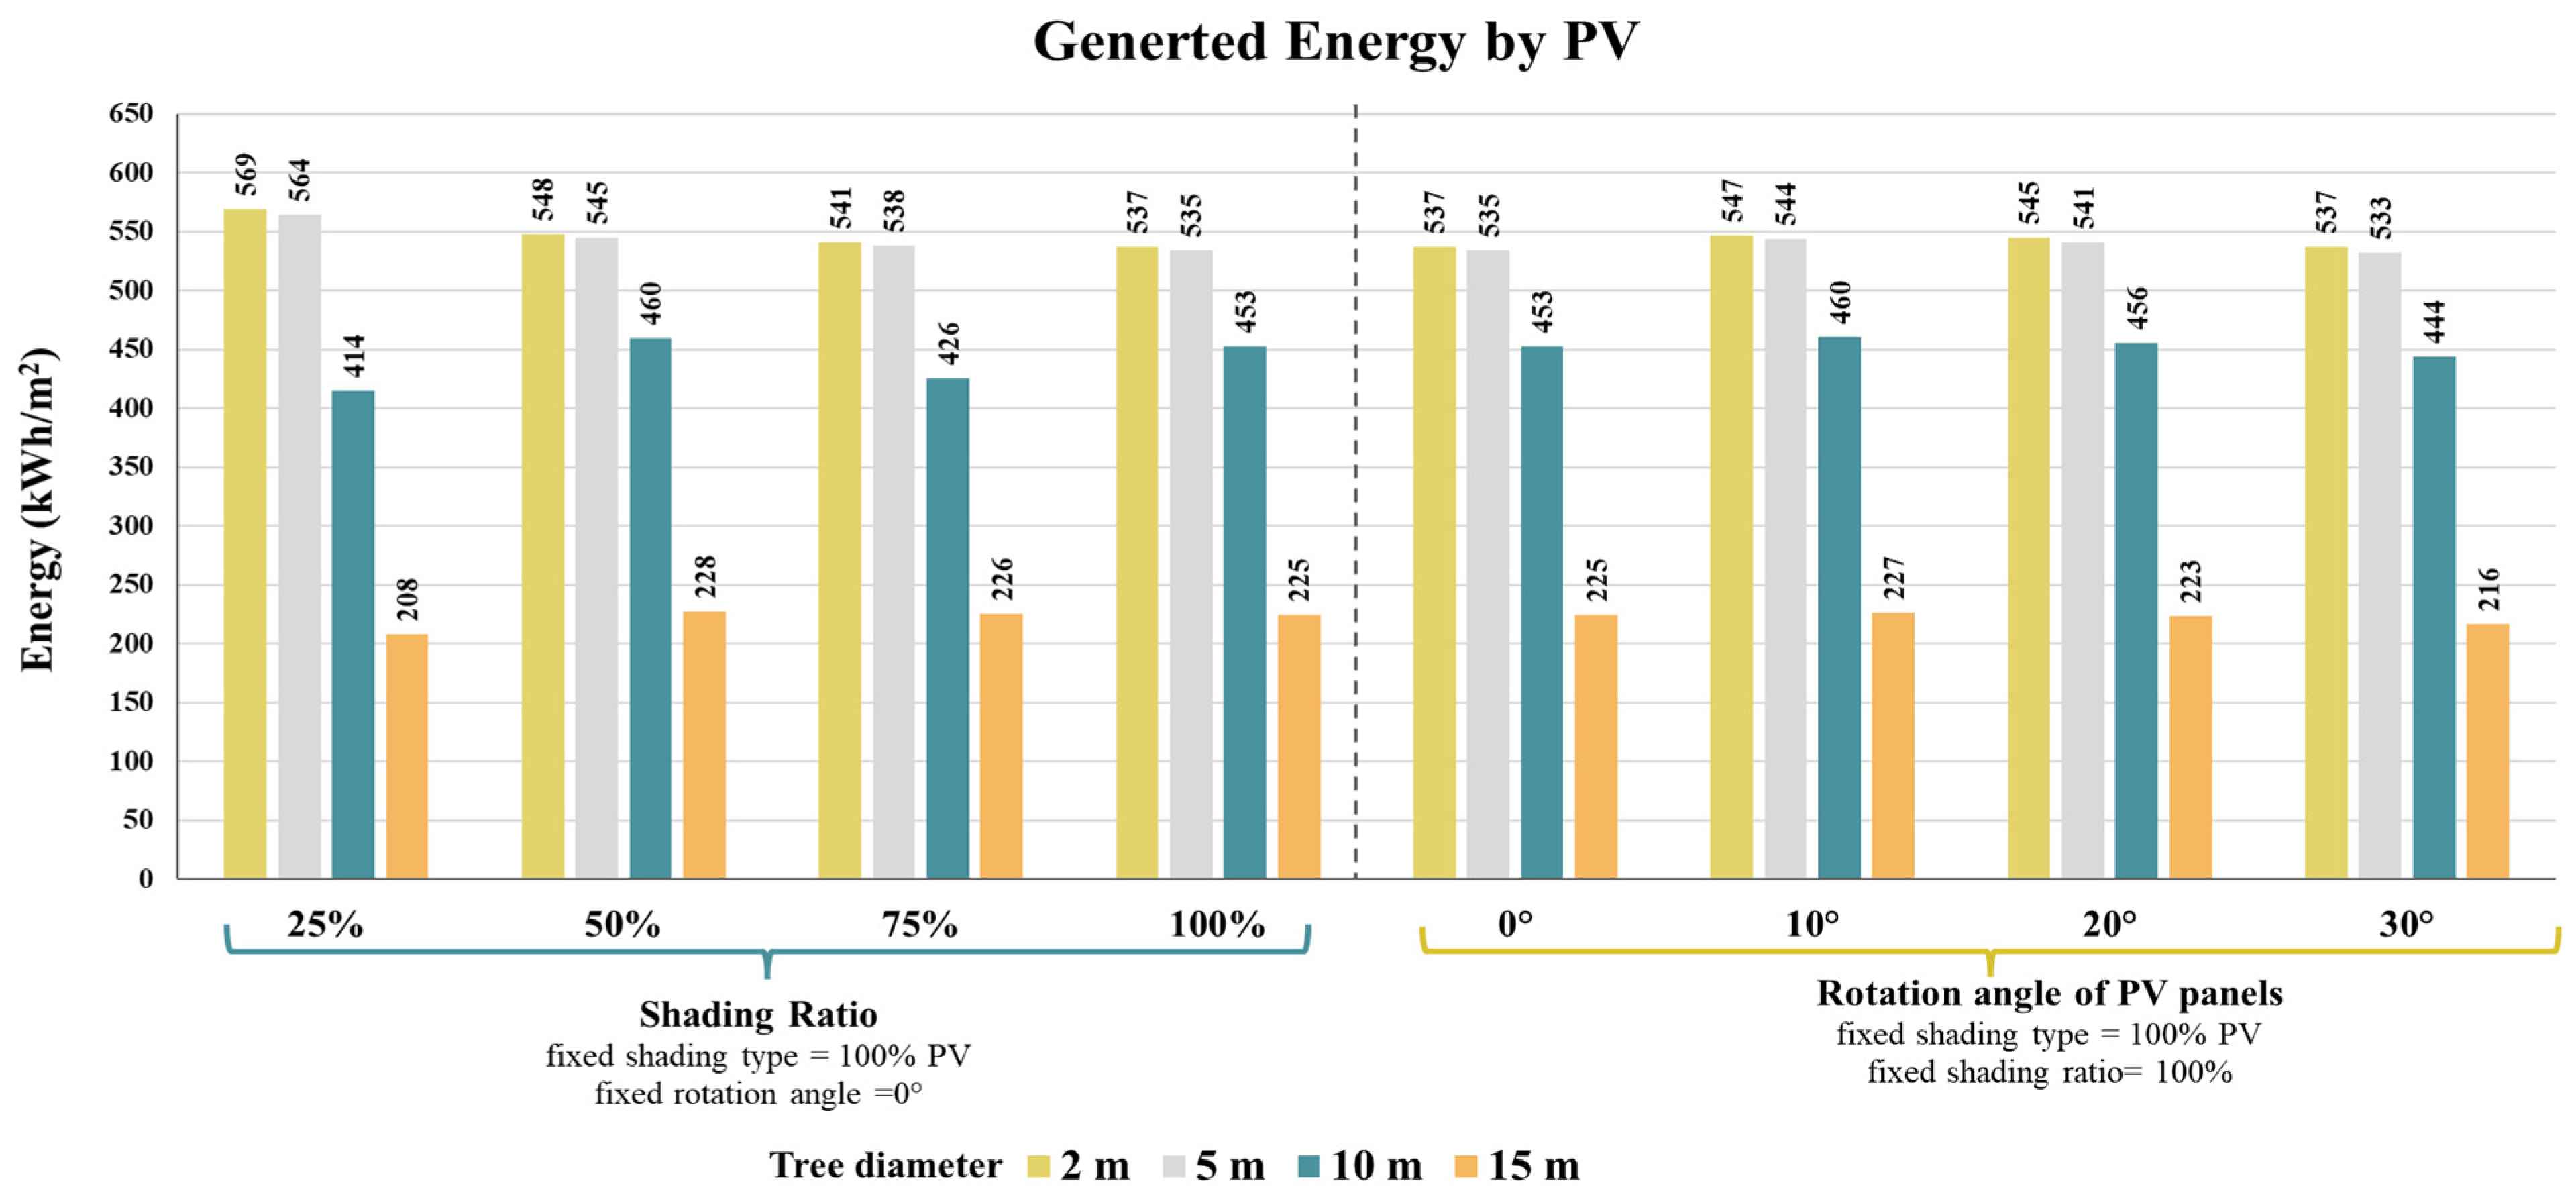
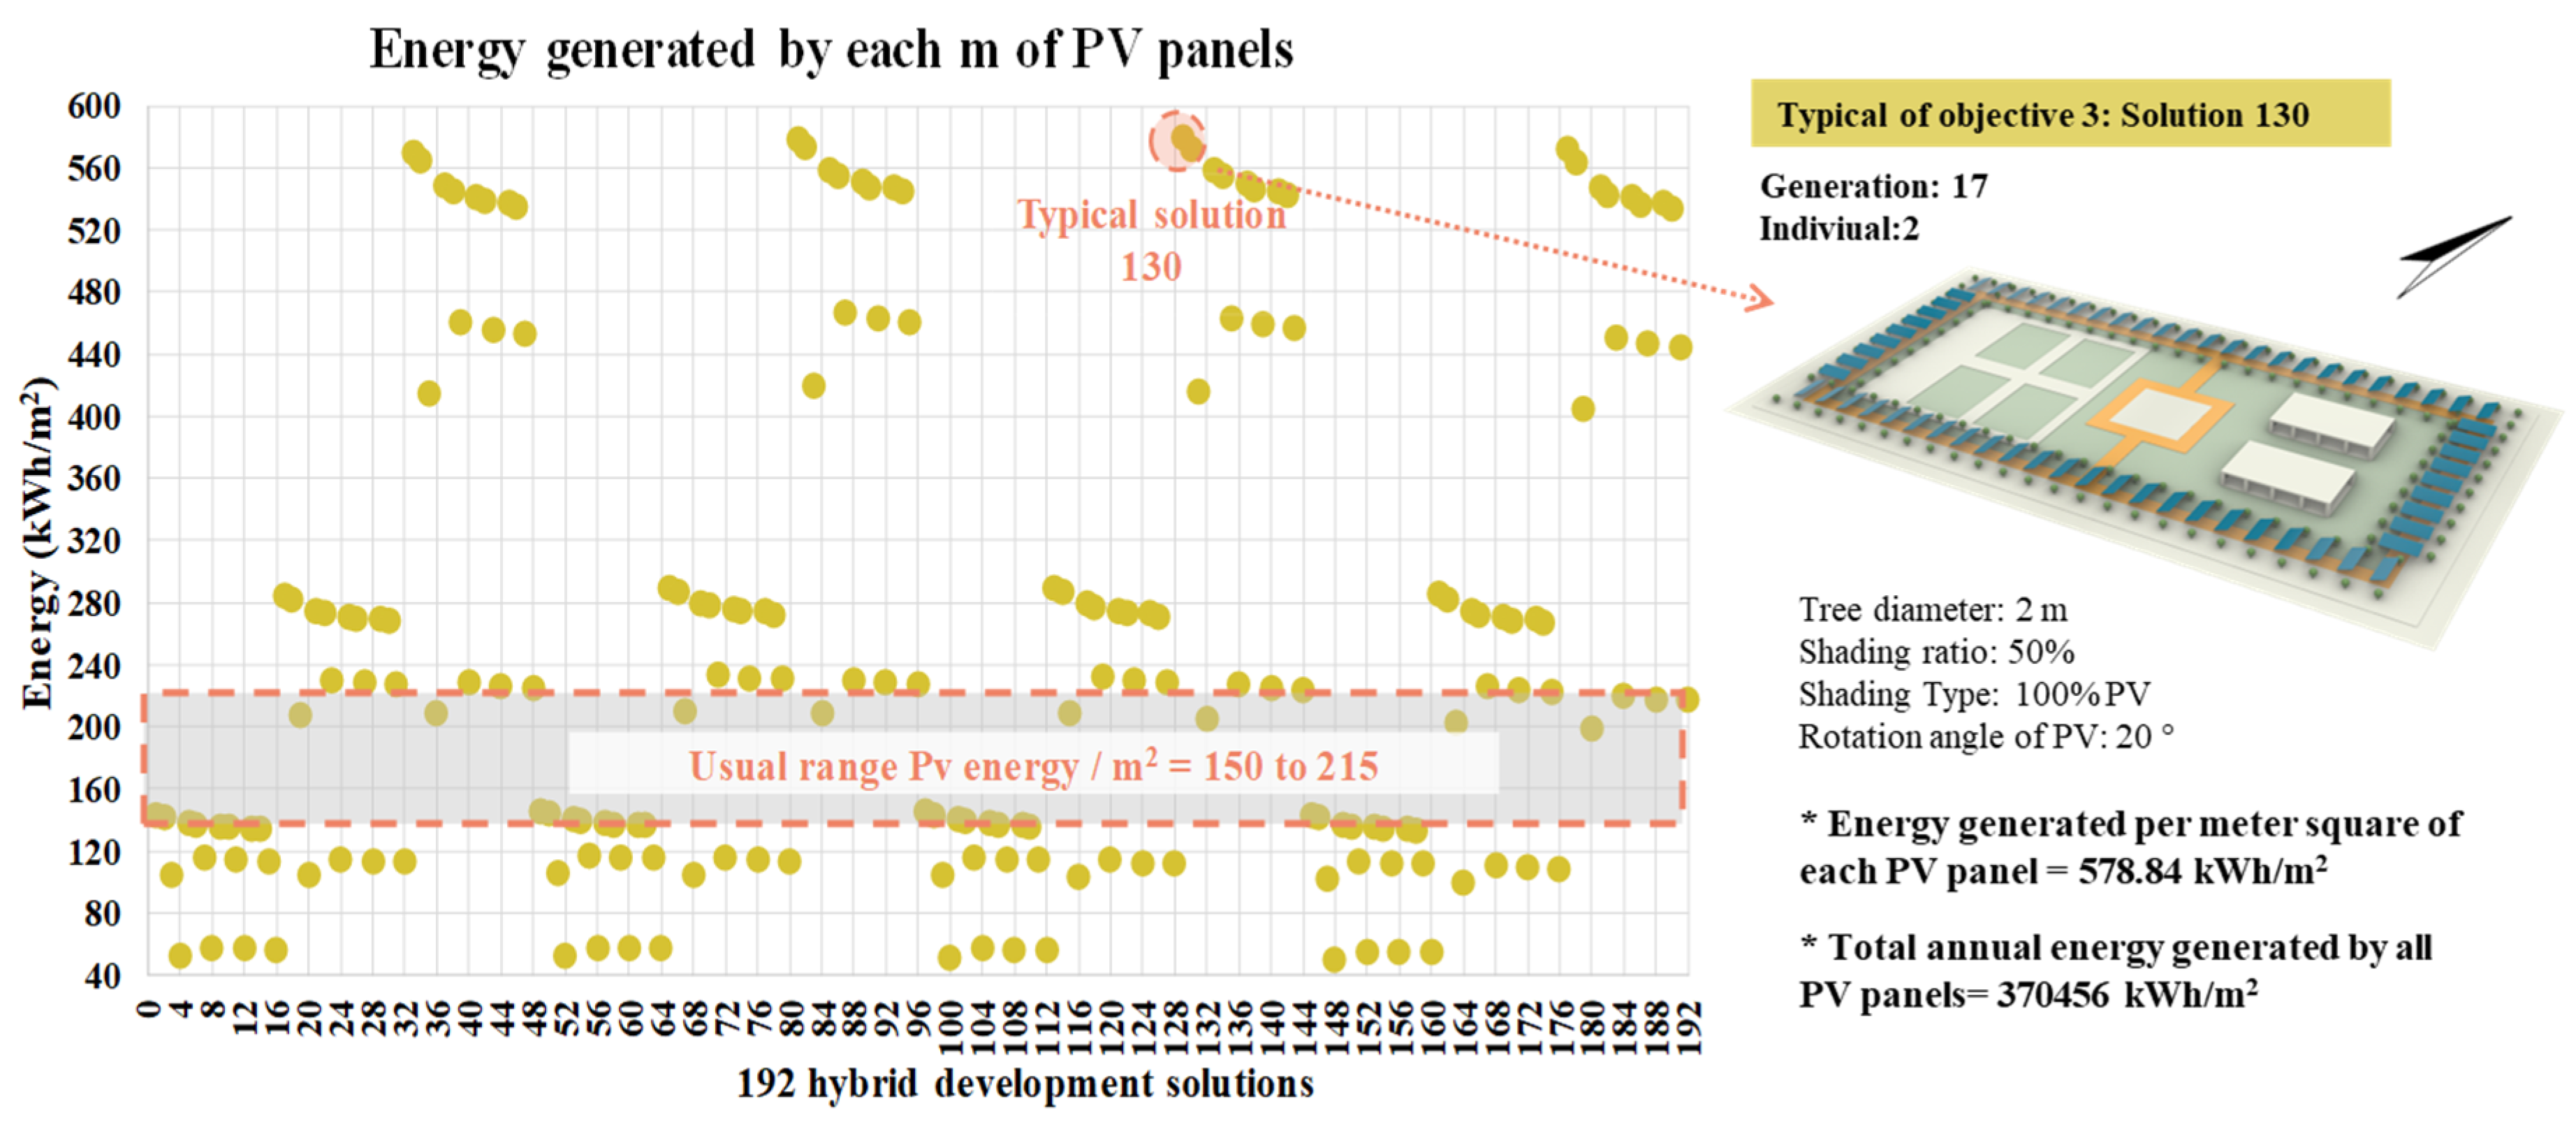
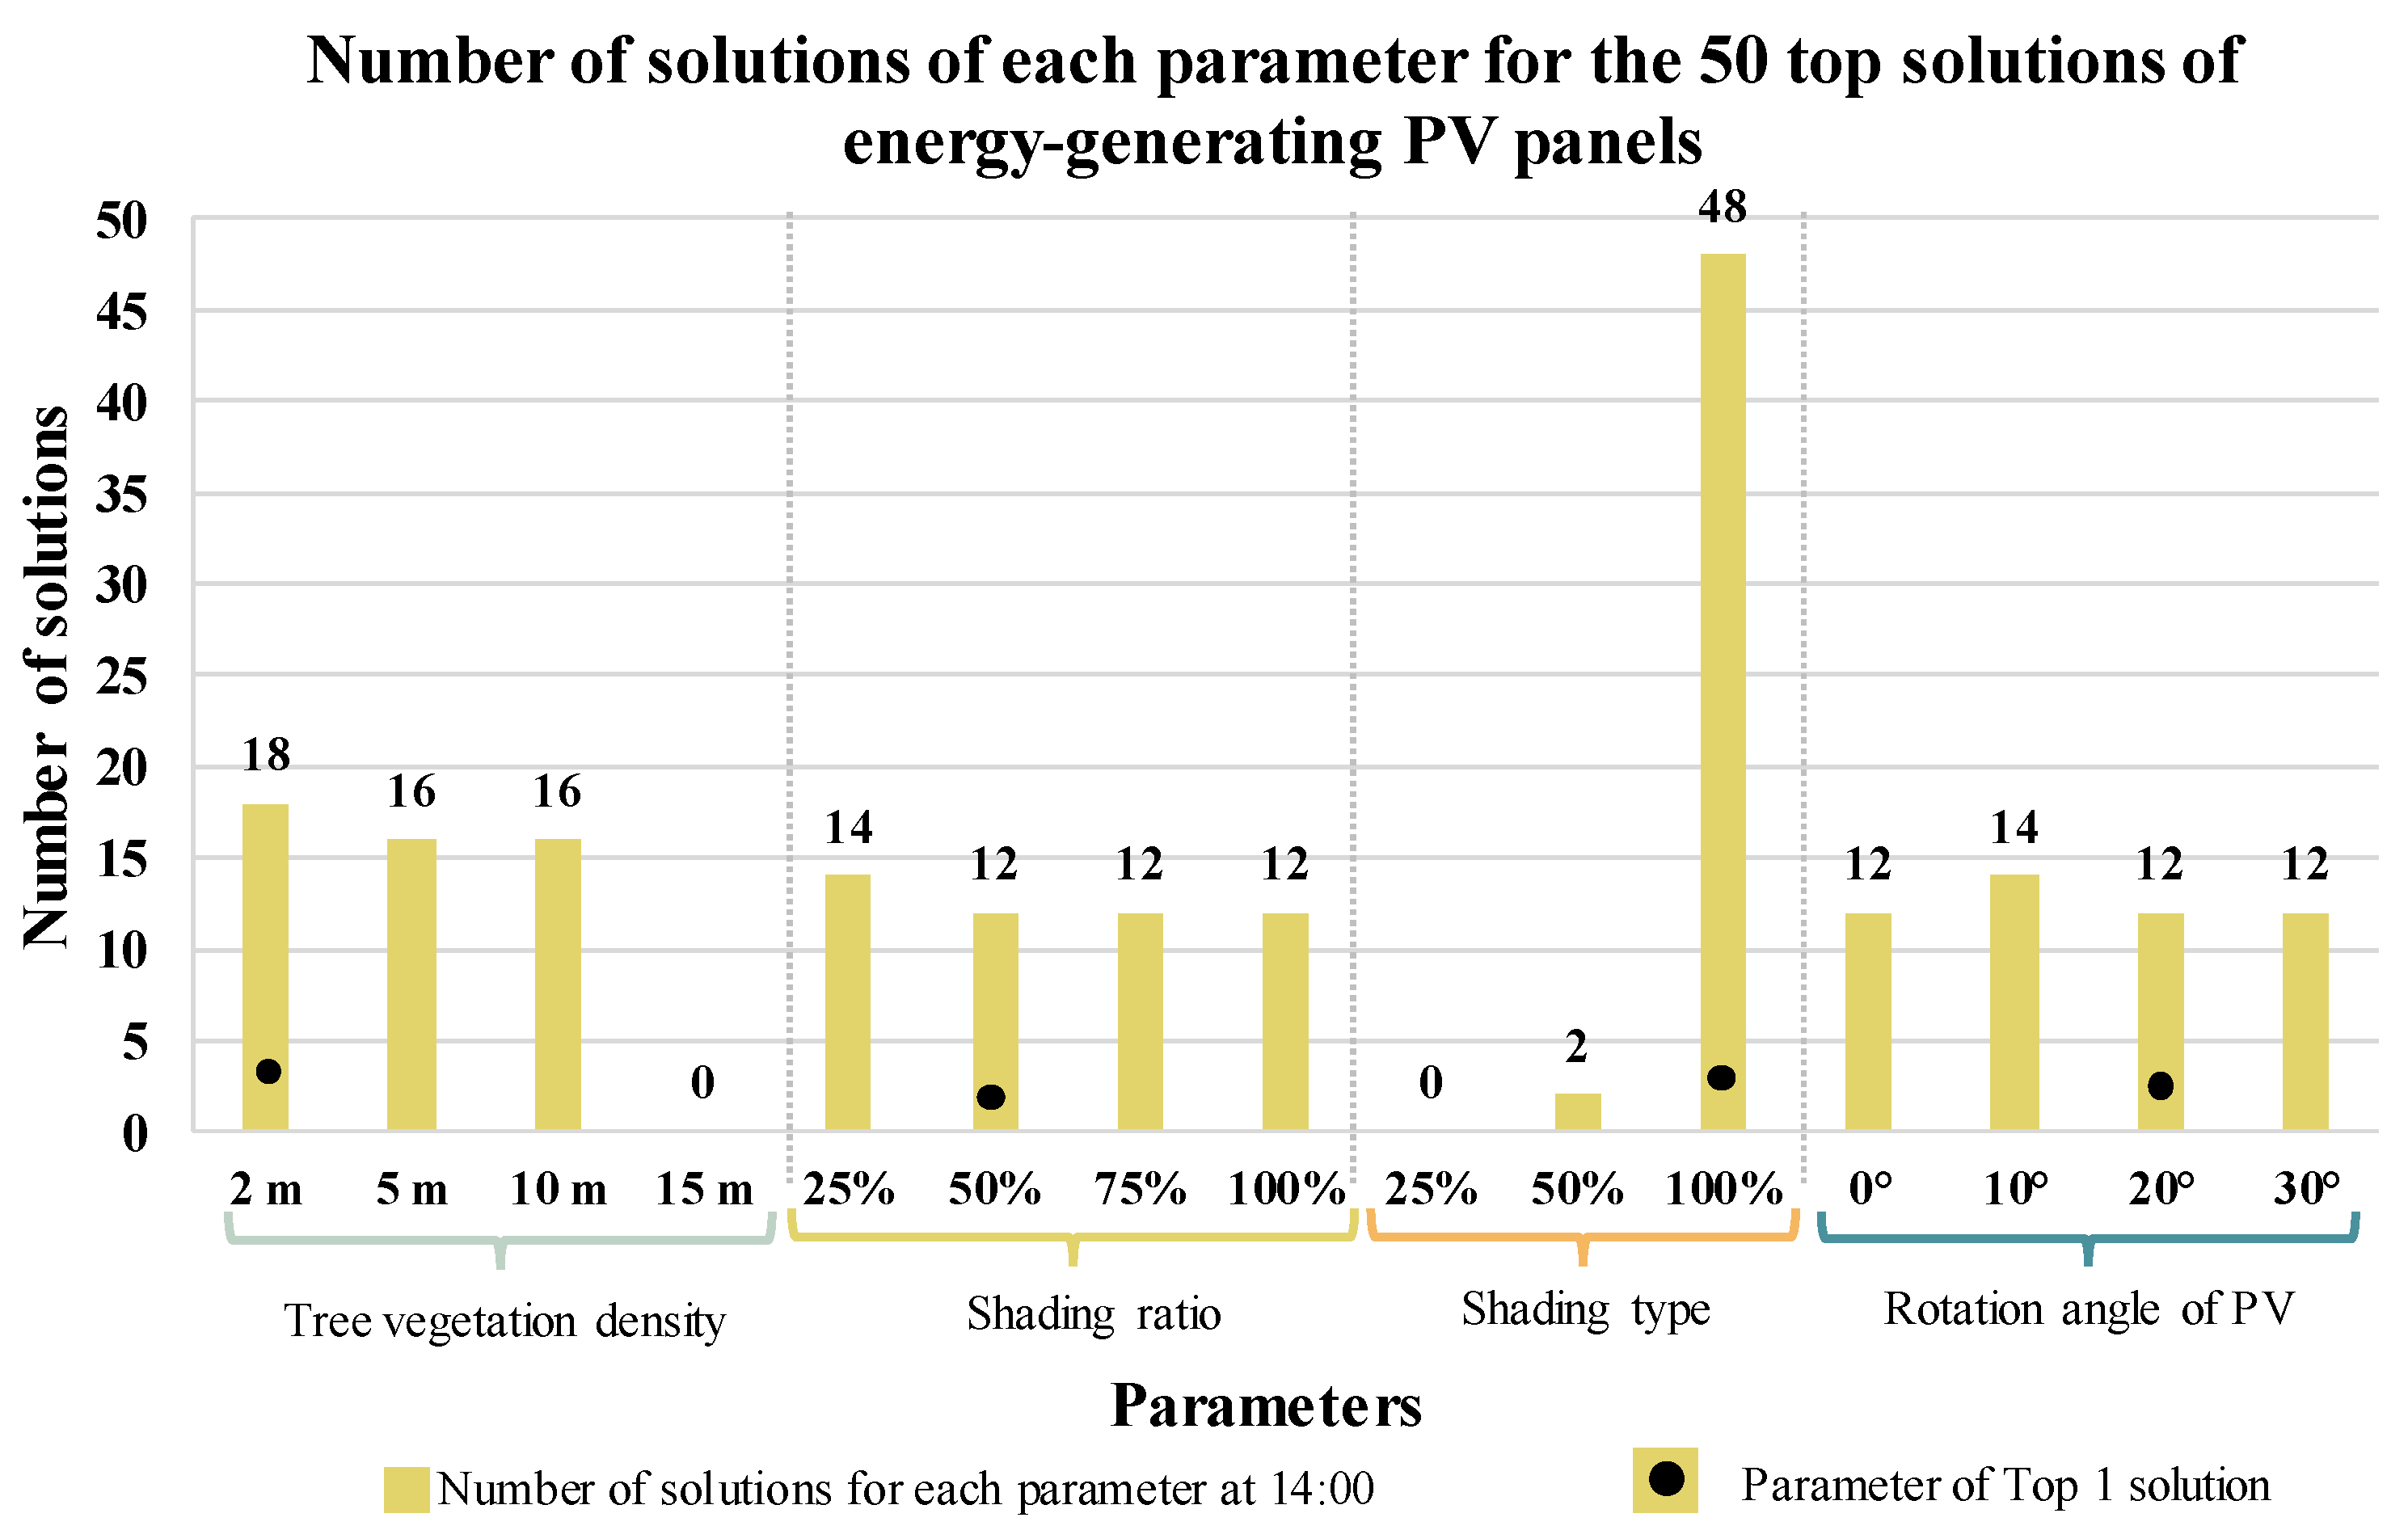
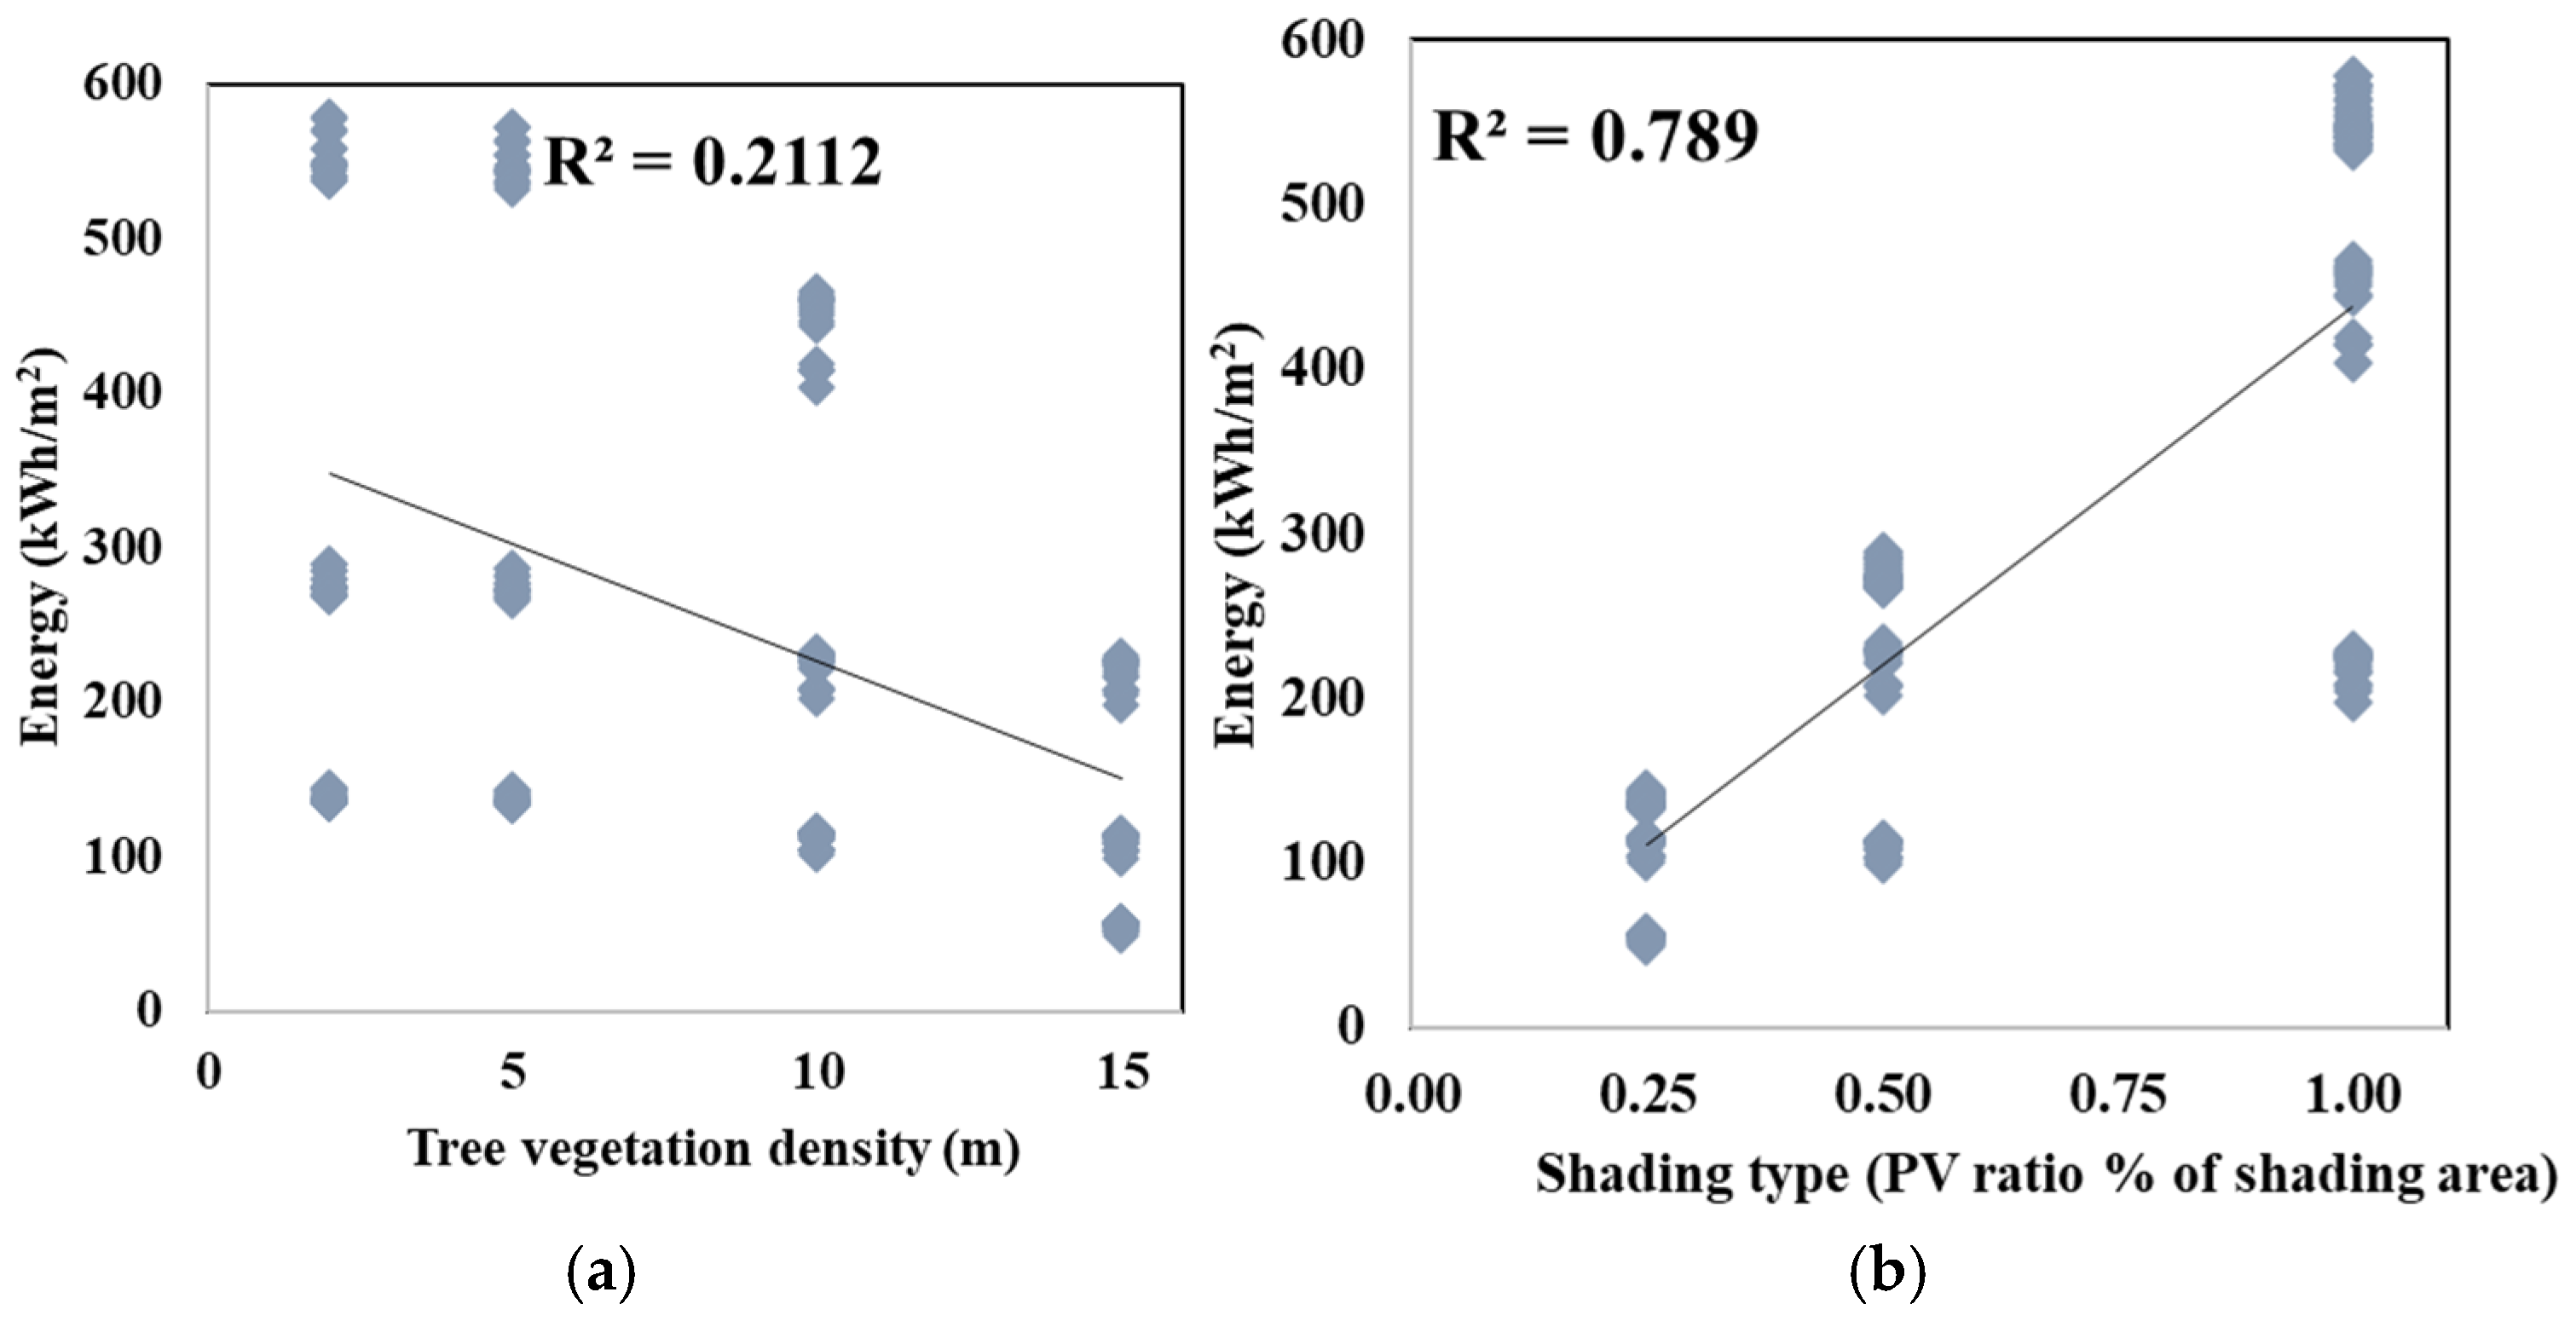
3.5. Optimization Objective 3: Utilizing Solar Radiation to Generate Electrical Energy by PV

Utilizing high solar radiation to generate electrical energy using PV panels integrated with shading units is the third objective of the parametric urban optimization framework. So, the annual generated energy by PV panels was simulated to calculate the total energy that could be generated by the entire PV panels in the park, besides the energy amount that could be generated per square meter of each PV panel. Hence, the annual total energy generated by all PV panels was massive because it relied on the shading ratio, which reached 100% of the total area of shading units (40 m2), and the shading type, which PV panels’ shading ratio reached 100% of the total wooden shading area. Accordingly, the annual total energy generated by all PV panels ranged from 126,716 kWh/m2 to 1,400,200 kWh/m2, while the total area of PV panels is 2560 m2. As shown in Figure 19, the energy generated per square meter of each PV panel was between 49.5 kWh/m2 and 578.84 kWh/m2. Whereas there are 192 development solutions, their PV panels generate electrical energy as and above the usual range of PV panels equals 150 kWh/m2 to 215 kWh/m2 [27]. In addition to 175 development solutions, their PV panels generate electrical energy above 100 kWh/m2. Therefore, the typical solution for energy generated was solution number 130, as shown in Figure 19 to the right, while the energy generated by the meter square of each PV panel is 578.84 kWh/m2, and the annual total energy is 370,456 kWh/m2. In conclusion, all this generated energy is considered a renewable energy source for lighting poles and service areas of the recreational area. This result is near to the results of [26], which clarified that the energy generated by PV panels is 411.680 kWh/m2.
Nevertheless, the analysis of the parameter influence of the hybrid development solutions on increasing energy generated by PV is illustrated in Figure 20. The energy generated by PV panels of the top 50 solutions ranges between 288.96 kWh/m2 and 578.84 kWh/m2. It can be observed that the widest tree diameter of 15 m causes shade on the PV panels, preventing solar radiation access and, therefore, decreasing electrical energy generation. Accordingly, trees with diameters 5 m and 10 m are more efficient in generating energy. Moreover, the shading ratios play an essential role in the total energy amount that could be generated by the entire PV panels in the park. However, the shading ratio is a critical parameter in the energy amount that could be generated per square meter of each PV panel. These results are compatible with past research that confirms the optimization of trees and PV is the most important parameter to support urban planners for outdoor thermal comfort and energy generation [18]. Also, the shading type of 100% PV panels is the most efficient in increasing the energy amount generated by PV panels. Despite the different rotation angles of PV panels equally affecting the generated energy, the angle of 20° was the most efficient. This result is compatible with [26] results, which clarified that the optimal tilt angle is 19.28°.

3.6. Correlation Analysis of Optimization Parameters and Objectives

Eventually, the correlation analysis between the optimization parameters and objectives was studied to determine the relation characteristics between them. First, the correlation analysis between the first objective UTCI and the four categories of parameters was demonstrated in Figure 21. Additionally, Table 2 illustrates the correlation value by calculating the coefficient of determination (R2) and the interpretation. It can be observed that the shading ratio parameter shows a high correlation with UTCI. So, the shading ratio parameter exhibits a strong positive relationship with a reduction in UTCI values with an R2 value of 0.66 [28], unlike the tree vegetation density parameter, which shows a weak relationship with a reduction in UTCI values. Since the small diameters lead to a slight decrease in UTCI. There is no relation between the parameters of shading type and rotation angle of PV panels and UTCI values at all.
Figure 22 elaborates on the correlation analysis between the optimization parameters and the second objective of average solar irradiance. Hence, the tree vegetation density parameter exhibits a high correlation with average solar irradiance values. According to Table 2, there is a very strong positive relationship between the tree vegetation density parameter and the reduction in average solar irradiance values with an R2 value of 0.98 [28]. Despite shading ratio parameters assisting in blocking out the solar rays and reducing solar irradiance, the relation between shading ratio parameters and the reduction in average solar irradiance is a weak relationship.
The trees provided a wider shade area than the shading units, which led to a significant and notable reduction in average solar irradiance. There is no relation between the parameters of shading type and rotation angle of PV panels and average solar irradiance values. The correlation analysis between the optimization parameters and the third objective of generated energy by PV is shown in Figure 23. Intuitively, the shading type parameter shows a high correlation with generated energy by PV. Thus, the shading type exhibits a very strong positive relationship with the generated energy by PV, with an R2 value of 0.78 [28]. Otherwise, the tree vegetation density parameter exhibits a high negative correlation with generated energy by PV and a weak relationship between them. The widest tree diameter causes shade on the PV panels and prevents solar radiation access, thus decreasing electrical energy generation. Despite the importance of the parameters of shading ratio and rotation angle of PV panels, there is no relation between the same and generated energy by PV. The parameters of shading ratio and rotation angle of PV panels are significantly correlated with the annual total energy generated by all PV panels and are not effective on the generated energy per square meter of each PV panel because some other parameters have a greater impact (e.g., shading type).
Important findings based on a multi-objective optimization algorithm show that trees with diameters 10 m and 15 m were the most efficient with significantly influential in reducing UTCI. Also, trees with diameters of 5 m and 10 m are more efficient in generating energy with low shading than trees with a diameter of 15 m. Therefore, the shading ratios play an essential role in the total energy amount that could be generated by entire PV panels in the park. The paper recommends that using trees with diameters between 10 and 15 m could achieve thermal comfort and reduction in UTCI, with average energy generation of PV panel and optimum inclination angle of 20°. Furthermore, the surface temperature (T surface) is an essential indicator of thermal comfort and affects users directly. Hence, the hybrid solution achieved the highest improvement in the surface temperature inside the walking path, reducing to 36.6 °C at 14:00 compared to the hybrid scenarios and shading only, so it provided a comfortable environment for the user. Therefore, vegetation configuration plays a crucial role in enriching the urban thermal comfort at the human scale, which is compatible with past research [29]. Based on the results from the simulation and recommendations for different solutions for the recreation area, the government should consider the practical constraints of maintaining vegetation under climate stress and high temperature to increase tree density and keep vegetation alive. The government should use sustainable irrigation solutions (e.g., treated greywater, rainwater harvesting, selection of drought-tolerant native plant species, use of new urban policy and infrastructure to support long-term vegetation maintenance). The results of this study can be applied easily in the future.

4. Conclusions and Recommendations

This research aims to develop a parametric urban optimization framework using Rhino 3D+ Grasshopper software to optimize the outdoor thermal comfort in an outdoor recreational area, Alhasnaa Park, between residential buildings in Riyadh City, Saudi Arabia, based on the 2030 vision of Saudi Arabia with the integration of PV panels to provide energy for the park. The results based on measurement, walk-through observation, interviews, simulation, and optimization process can be summarized as follows:
  • Thermal discomfort occurs in outdoor recreational areas with high surface temperatures equal to 316.1 K when the air temperature is 27 °C at 3 p.m. due to the absorption of solar radiation for sports walkways.
  • It was observed that trees with diameters of 10 m and 15 m were the most efficient compared to other ones that affect the reduction in UTCI by 11.26 K and average solar irradiance by 642.77 W/m2.
  • Hybrid development solutions achieve a reduction in solar irradiance ranging from 179.9 W/m2 to 682 W/m2 for all development solutions.
  • Every square meter of PV panel integrated with shading scenarios generates electricity equal to 578.84 kWh/m2, and the annual total energy is 370,456 kWh/m2 and is considered a renewable energy source for lighting poles and service areas of the recreational area.
  • It is recommended to integrate vegetation with shading to achieve the highest reduction for the ground surface temperature of the sports walking path, which reached 36.6 °C at 14:00.
  • Finally, tree vegetation density integrated with shading scenarios exhibits a high negative correlation with generation energy by PV and a weak relationship between both. This is because the widest tree diameter causes shade on the PV panels and prevents solar radiation access.
In conclusion to this research, it is recommended to use tree densities for the sports walking path in the recreational area ranging between 10 m and 15 m and integration of PV with hybrid scenarios to achieve thermal comfort and reduce UTCI with a generation of energy.
Future research is recommended to apply this study in this park as a prototype, evaluate it, and develop the scenarios to apply them in many parks in Riyadh.

Author Contributions

Conceptualization, A.S.H.A., R.M.A.M. and M.A.A.; methodology, A.S.H.A. and R.M.A.M.; software, R.M.A.M.; validation, R.M.A.M.; formal analysis, A.S.H.A. and R.M.A.M.; investigation, A.S.H.A. and R.M.A.M.; resources, A.S.H.A., R.M.A.M. and M.A.A.; data curation, A.S.H.A. and R.M.A.M.; writing—original draft preparation, A.S.H.A., R.M.A.M. and M.A.A.; writing—review and editing, A.S.H.A., R.M.A.M. and M.A.A.; visualization, R.M.A.M.; supervision, A.S.H.A.; project administration, M.A.A.; funding acquisition, M.A.A. All authors have read and agreed to the published version of the manuscript.

Funding

This work was supported and funded by the Deanship of Scientific Research at Imam Mohammad Ibn Saud Islamic University (IMSIU) (grant number IMSIU-DDRSP2502).

Data Availability Statement

Data are contained within the article.

Conflicts of Interest

There are no conflicts of interest. The authors declare that they have no known competing financial interests or personal relationships that could have appeared to influence the work reported in this paper.

References

  1. Shaamala, A.; Yigitcanlar, T.; Nili, A.; Nyandega, D. Strategic tree placement for urban cooling: A novel optimisation approach for desired microclimate outcomes. Urban Clim. 2024, 56, 102084. [Google Scholar] [CrossRef]
  2. Vision 2030. Green Riyadh Project. Available online: https://www.vision2030.gov.sa/en (accessed on 19 April 2025).
  3. Kaveh, S.; Habibi, A.; Nikkar, M.; Aflaki, A. Optimizing green infrastructure strategies for microclimate regulation and air quality improvement in urban environments: A case study. Nat. Based Solut. 2024, 6, 100167. [Google Scholar] [CrossRef]
  4. Boussaidi, K.; Djaghrouri, D.; Benabbas, M.; Altan, H. Assessment of Outdoor Thermal Comfort in Urban Public Space, during the Hottest Period in Annaba City, Algeria. Sustainability 2023, 15, 11763. [Google Scholar] [CrossRef]
  5. Abdallah, A.S.H.; Mahmoud, R.M.A. Urban morphology as an adaptation strategy to improve outdoor thermal comfort in urban residential community of new assiut city, Egypt. Sustain. Cities Soc. 2022, 78, 103648. [Google Scholar] [CrossRef]
  6. Abdallah, A.S.H.; Mahmoud, R.M.A. Sustainable Solutions for the Open Spaces of the New desert Egyptian Cities with Considering the Climate Change. Art Archit. J. 2022, 3, 159–173. [Google Scholar]
  7. Mahmoud, H.; Ragab, A. Urban Geometry Optimization to Mitigate Climate Change: Towards Energy-Efficient Buildings. Sustainability 2021, 13, 27. [Google Scholar] [CrossRef]
  8. Taleb, H.; Musleh, M.A. Applying urban parametric design optimisation processes to a hotclimate: Case study of the UAE. Sustain. Cities Soc. 2015, 14, 236–253. [Google Scholar] [CrossRef]
  9. Abdallah, A.S.H.; Mahmoud, R.M.A. Investigation of Greening Façade and Retrofitting Strategies on Outdoor Thermal Comfort and Indoor Energy Consumption in New Assiut City, Egypt. Mansoura Eng. J. 2023, 48, 9. [Google Scholar] [CrossRef]
  10. Mahmoud, R.M.A.; Abdallah, A.S.H. Assessment of outdoor shading strategies to improve outdoor thermal comfort in school courtyards in hot and arid climates. Sustain. Cities Soc. 2022, 86, 104147. [Google Scholar] [CrossRef]
  11. Ibrahim, Y.; Kershaw, T.; Shepherd, P.; Elkady, H. Multi-objective optimisation of urban courtyard blocks in hot arid zones. Sol. Energy 2022, 240, 104–120. [Google Scholar] [CrossRef]
  12. Abdollahzadeh, N.; Biloria, N. Urban microclimate and energy consumption: A multi-objective parametric urban design approach for dense subtropical cities. Front. Archit. Res. 2022, 11, 453–465. [Google Scholar] [CrossRef]
  13. Li, J.; Wang, Y.; Xia, Y.; Song, Y.; Xie, H. Optimization of Urban Block Form by Adding New Volumes for Capacity Improvement and Solar Performance Using A Multi-Objective Genetic Algorithm: A Case Study of Nanjing. Buildings 2022, 12, 1710. [Google Scholar] [CrossRef]
  14. Li, J.; Cui, X.; Yang, J. Multi-scale correlation analysis between geometric parameters and solar radiation in high density urban environment--Case study in Nanjing. Front. Archit. Res. 2024, 14, 248–266. [Google Scholar] [CrossRef]
  15. Bedra, K.B.; Zheng, B.; Li, J.; Luo, X. A Parametric-Simulation Method to Study the Interconnections between Urban-Street-Morphology Indicators and Their Effects on Pedestrian Thermal Comfort in Tropical Summer. Sustainability 2023, 15, 8902. [Google Scholar] [CrossRef]
  16. Bedra, K.B.; Zheng, J.; Li, J.; Sun, Z.; Zheng, B. Automating Microclimate Evaluation and Optimization during Urban Design: A Rhino–Grasshopper Workflow. Sustainability 2023, 15, 16613. [Google Scholar] [CrossRef]
  17. Al Haddad, M.; Al Shawabkeh, R.; Arar, M.; Rjoub, A.; Alhammad, R.; Senouci, A.; Maherzi, W. Modeling the Role of Courtyards with Clusters of Buildings in Enhancing Sustainable Housing Designs. Buildings 2024, 14, 2088. [Google Scholar] [CrossRef]
  18. Reitberger, R.; Palm, N.; Palm, H.; Lang, W. Urban systems exploration: A generic process for multi-objective urban planning to support decision making in early design phases. Build. Environ. 2024, 254, 111360. [Google Scholar] [CrossRef]
  19. Shi, Z.; Fonseca, J.A.; Schlueter, A. A parametric method using vernacular urban block typologies for investigating interactions between solar energy use and urban design. Renew. Energy 2021, 165, 823–841. [Google Scholar] [CrossRef]
  20. Poon, K.; Kämpf, J.; Tay, S.; Wong, N.; Reindl, T. Parametric study of URBAN morphology on building solar energy potential in Singapore context. Urban Clim. 2020, 33, 100624. [Google Scholar] [CrossRef]
  21. Ministry of Municipalities and Housing. 2021. Available online: https://momah.gov.sa/ar/node/13536 (accessed on 31 December 2024).
  22. Zawya. Green Riyadh Implements 1350 km of Water Networks to Irrigate 7.5 MLn Trees in the Capital. 2024. Available online: https://www.zawya.com/en/business/energy/green-riyadh-implements-1-350km-of-water-networks-to-irrigate-75mln-trees-in-the-capital-icrdv5pq (accessed on 19 April 2025).
  23. Google Earth Pro Version 7.3. 3582 Masafi, Al Falah, Park 2025, 7804, Riyadh 13314, Saudi Arabia. Available online: https://www.google.com.eg/maps/place/Alfalah+park+1/@24.8012192,46.7122686,17z/data=!3m1!4b1!4m6!3m5!1s0x3e2efd00481b8753:0x66df01a794e6336f!8m2!3d24.8012192!4d46.7122686!16s%2Fg%2F11vzsz627c?entry=ttu&g_ep=EgoyMDI1MDQyMy4wIKXMDSoASAFQAw%3D%3D (accessed on 20 April 2025).
  24. ANSI/ASHRAE 55-2017; Thermal Environmental Conditions for Human Occupancy. America Society of Heating Refrigerating and Air-Conditioning Engineers, Inc.: Atlanta, GA, USA, 2017.
  25. Mahmoud, R.M.A. Multiobjective Approach for Optimizing Buildings’ Forms and Kinetic Façade Systems in Office Buildings. Mansoura Eng. J. 2024, 49, 3. [Google Scholar] [CrossRef]
  26. Kaddoura, T.O.; Ramli, M.A.M.; Al-Turki, Y.A. On the estimation of the optimum tilt angle of PV panel in Saudi Arabia. Renew. Sustain. Energy Rev. 2016, 65, 626–634. [Google Scholar] [CrossRef]
  27. FACT SHEET: SOLAR PHOTOVOLTAIC PANELS (SOLAR ELECTRIC). Published by UK Alternative Energy. 2019. Available online: https://www.ukalternativeenergy.co.uk/wp-content/uploads/2019/09/7.1-Fact-Sheet-Solar-PV.pdf (accessed on 14 February 2025).
  28. Saura, R.B.D.; Andante, R.J.M. Detection of cyanide in freshwater fishes relative to sex dimorphism using landmark-based geometric morphometrics in Agusan del Sur, Philippines. Int. J. Biosci. 2018, 12, 176–192. [Google Scholar] [CrossRef]
  29. Zhang, Y.; Liu, C. Parametric Urbanism and Environment Optimization: Toward a Quality Environmental Urban Morphology. Int. J. Environ. Res. Public Health 2021, 18, 3558. [Google Scholar] [CrossRef] [PubMed]
Figure 3. The proposed parametric urban optimization framework (author).
Buildings 15 01527 g003
Figure 4. Linear regression for validating the Ladybug simulation tool compared with field measurements (author).
Buildings 15 01527 g004
Figure 5. Evaluation of case study in Phase 1 of the framework: (a) TA, MRT, and UTCI chart of a case study during the hottest week, and (b) the annual solar radiation map (author).
Buildings 15 01527 g005
Figure 6. The proposed development solutions: (a) the parameters and (b) the modeling of the developed solutions (author).
Buildings 15 01527 g006aBuildings 15 01527 g006b
Figure 7. Obtaining results of development solution in phase 3 of the parametric urban optimization framework: (a) the t Pareto front, and (b) the parallel coordinate graph of all solutions (author).
Buildings 15 01527 g007
Figure 8. The temperature and relative humidity pattern inside the recreational area under one of the trees compared to the outdoor air temperature (author).
Buildings 15 01527 g008
Figure 9. Thermal images for different places in the park, including the open walking path, vegetation, and children’s playing area (author).
Buildings 15 01527 g009
Figure 10. Results of base case and seven non-hybrid solutions at 11:00, 14:00, and 16:00: (a) UTCI, and (b) solar irradiance (author).
Buildings 15 01527 g010
Figure 11. The effect of hybridizing development solutions on generating energy by PV panels (author).
Buildings 15 01527 g011
Figure 12. The annual solar irradiation in sports walkways of the base case and 192 hybrid development solutions (author).
Buildings 15 01527 g012
Figure 13. The Tmrt in sports walkways of the base case and 192 hybrid development solutions (author).
Buildings 15 01527 g013
Figure 14. A set of the optimal solutions as outputs of the parametric urban optimization framework (author).
Buildings 15 01527 g014
Figure 15. UTCI simulation results of the base case and 192 hybrid development solutions (a) at 11:00, (b) at 14:00, and (c) at 16:00 (author).
Buildings 15 01527 g015
Figure 16. Number of solutions of each parameter for the top 50 UTCI solutions (author).
Buildings 15 01527 g016
Figure 17. Average solar irradiance simulation results of the base case and 192 hybrid development solutions (a) at 11:00, (b) at 14:00, and (c) at 16:00 (author).
Buildings 15 01527 g017
Figure 18. Number of solutions of each parameter for the top 50 average solar irradiance solutions (author).
Buildings 15 01527 g018
Figure 19. The simulation results of the energy generated by PV panels by the 192 hybrid development solutions (author).
Buildings 15 01527 g019
Figure 20. Number of solutions of each parameter for the top 50 solutions for energy generated by PV panels (author).
Buildings 15 01527 g020
Figure 21. Correlation analysis of the four parameter categories and UTCI: (a) tree vegetation density and (b) shading ratio (author).
Buildings 15 01527 g021
Figure 22. Correlation analysis of the four parameter categories and average solar irradiance: (a) tree vegetation density and (b) shading ratio (author).
Buildings 15 01527 g022
Figure 23. Correlation analysis of the four parameter categories and energy generated by PV: (a) tree vegetation density and (b) shading type (author).
Buildings 15 01527 g023
Table 1. The setting of the optimization process (author).
Input DataValue
LocationRiyadh City, Saudi Arabia (24°71′ 36″ N, 46° 67′ 53″ E)
Weather fileRiyadh.AB RI SAU 404380 TMYx
Simulation periodThree critical hours 11:00, 14:00, and 16:00 during one of the hottest days (24 August)
North angle−26°
Simulation grid1 m × 1 m
Simulation heightPedestrian level 1.8 m
AlgorithmNon-Dominated Sorting Genetic Algorithm II (NSGA-II)
Generation number30
Population size8
Random seed1
Table 2. Correlation analysis between the optimization parameters and three optimization objectives [28].
ObjectivesParameters
Tree Diameter DensityShading RatioShading TypeRotation Angle of PV Panels
UTCIR20.220.660.00030.0225
InterpretationWeak
relationship
Strong
relationship
Negligible relationshipNegligible relationship
Average solar
irradiance
R20.9810.2050.000060.00009
InterpretationVery strong
relationship
Weak
relationship
Negligible relationshipNegligible relationship
Generated energy by PVR20.21120.0050.7890.00001
InterpretationWeak
relationship
Negligible relationshipVery strong relationshipNegligible relationship
Disclaimer/Publisher’s Note: The statements, opinions and data contained in all publications are solely those of the individual author(s) and contributor(s) and not of MDPI and/or the editor(s). MDPI and/or the editor(s) disclaim responsibility for any injury to people or property resulting from any ideas, methods, instructions or products referred to in the content.

