Article

Mapping the Impact of Spontaneous Streetscape Features on Social Sensing in the Old City of Quanzhou, China: Based on Multisource Data and Machine Learning

School of Architecture and Design, China University of Mining and Technology, Xuzhou 221116, China
*
Author to whom correspondence should be addressed.
Buildings 2025, 15(9), 1522; https://doi.org/10.3390/buildings15091522
Submission received: 25 March 2025 / Revised: 24 April 2025 / Accepted: 29 April 2025 / Published: 1 May 2025
(This article belongs to the Special Issue Urban Infrastructure and Resilient, Sustainable Buildings)

Abstract

Streetscapes in old urban areas are not only an important carrier to show regional economies and city style, but also closely correlate to urban residents’ everyday life and the hustle and bustle in which they live. Nevertheless, previous studies have either focused on a few examples with low-throughput surveys or have lacked a specific consideration of spontaneous features in the data-driven explorations. Furthermore, the impact of spontaneous streetscape features on diversified social sensing has rarely been examined. This paper combined the mobile collection of street view images (SVIs) and a machine learning algorithm to calculate eight types of spontaneous streetscape elements and integrated two online platforms (Dianping and Sina Weibo) to map the distribution of economic vitality and social media perception, respectively. Then, through comparing multiple regression models, the impacts of the spontaneous streetscape characteristics on social sensing were revealed. The results include the following two aspects: (1) overall, the spontaneous streetscape features have a certain similarity in the impact on both dimensions of social sensing in Quanzhou, with significant clustering and transitional trends and strong spatial heterogeneity; and (2) specifically, the spontaneous streetscape elements can be divided into three categories, given the differentiated roles of significantly positive, negative, and polarizing impacts on the social sensing results. For example, proper use of open-interface storefronts, ads, and banners is consistent with the common suggestions, while the excessive pursuit of interface diversity and the use of cultural elements may bring an ambiguous effect. This paper provides a transferable analytical framework for mixed and data-driven sensing of streetscape regeneration and can potentially inspire related decisionmakers to adopt a more refined and low-cost approach to enhance urban vitality and sustainability.

1. Introduction

As the direct reflection of urban images and dynamics, streetscapes in old urban areas are not only an important carrier to show regional economies, local culture, and a city’s style, but also closely correlate to residents’ everyday life and the hustle and bustle in which they live [1,2]. All these factors make the street space the key area during urban regeneration. Despite the complicated spatial elements in urban environments, the coarse-grained objects along urban streets, such as land use and land type, building interfaces, roadside greening, urban infrastructure systems, and diversified requirements of street section design, attract more focus from urban planners, designers, and administrators [3,4]. This top-down thinking has its advantages, like making it easier to expand to massive street segments and blocks, and seemingly lower financial and management costs, especially for many developing countries and districts [5]. Meanwhile, the universal pattern comes at the cost of sacrificing individual needs and social–spatial diversity, with the numerous spontaneous spatial elements demonstrating this [6,7]. As urban construction patterns shift from incremental development to stock optimization, more refined and humanized objects of urban streetscapes should still be focused on. Furthermore, considering the complexities of property ownership and the difficulties of regeneration in many old city areas, exploiting the multiple spatial features and the impacts of spontaneous streetscape elements can potentially provide a feasible and humanized approach, which can further advance the 2030 United Nations Sustainable Development Goals [5,8,9].
In addition to the direct aspects, more indirect value from spontaneous streetscape components can be created and amplified through the proliferation of online sharing of diverse subjective perceptions [10]. Whether considering historical continuity or economic value, various storefronts comprise the main parts along the streets in old urban areas and become the usual contributors towards spontaneous streetscapes, such as by changing the types and styles of store interfaces and adopting distinctive signboards and attractive advertisements [11]. With the penetration of digital techniques and mobile devices into everyday urban scenarios, lots of store owners have exploited online–offline operation strategies, creating or approaching popular check-in spots to attract consumers and tourists [12]. During the interaction between different media forms, however, the impact mechanism of the spontaneous streetscape on the perception results is still highly obscure, which is mainly restricted by two key problems, including the digital identification of the related spontaneous spatial elements and the fusion analysis of the mixed perception data.
Regarding these two aspects, prior explorations have provided some references. For the former, traditional attention has mainly been paid to the micro-scale analysis of urban form characteristics and related spatial construction methods [6,13]. Usually by using low-throughput traditional surveys, typical spontaneous spatial elements, including door and window interfaces, awning and sunshade, ground steps, ads and banners, roadside greening, seating facilities and other urban furniture, have been studied [1,13]. Meanwhile, some of the latest works have utilized computer vision algorithms and all kinds of SVIs to identify and map the spatial distribution, although their perspectives dominantly concentrate on the all-factor-segmentation of streetscape photos [14,15,16,17,18,19]. As the nature of complexity and diversity of the elements is quite obvious, however, one of the potentially vital problems concerns what kinds of spontaneous streetscape elements should be considered, which is also an important factor that limits the regeneration strategies integrating spontaneity into old urban areas. In this respect, therefore, the latter may provide valuable inspirations by incorporating social-sensing-related objective elements into the research vision [20,21,22,23]. In other words, two steps, including a direct choice of the spatial elements themselves and another filtering judgement, are combined to target what really matters. As for the specific methods of the perception-related studies, while traditional on-site interviews and questionnaires are still important data sources, some of the latest attempts using public online perception platforms (e.g., Dianping, Yelp, Sina Weibo, Flickr, Panoramio, Facebook, etc.) or crowdsourced datasets, like the well-known Place Pulse datasets, have provided a cluster of approaches to analyze diversified social sensing data, including economic vitality, social media perception, etc. [24,25,26,27,28,29,30]. These methods are also believed to require lower labor, time, and financial costs.
Despite these efforts, few studies have focused on the spontaneous streetscape features and the impact on social sensing, especially with the latest techniques and tools. Specifically, there are at least three aspects of research gaps to be bridged and optimized further. First, most of the studies either focus on only a few street segments or lack specific considerations that are suitable for spontaneous streetscape features. While various costs may have restricted the spatial area in the studies with traditional investigation methods, the data-driven explorations with the latest perception techniques are far from sufficient. As an example of the latter, SVIs can deliver rich details of the micro-scale objects in streetscapes, even at the pixel level [31]. However, the mainstream of the application has paid much attention to sky, universal greenery, roads, and building facades, which are relatively coarse-grained streetscape elements compared with the precision level of human visual perception [11]. Accordingly, a fine-grained identification method is needed. Second, studies adopting SVIs often lack consistent categorizations of spontaneous streetscape components, causing ambiguity among different explorations. For example, one of the representative problems is that both public- and private-oriented spatial elements are chosen, such as confusing urban streetlights and public greening with store interfaces and private potted greenery. This is a natural processing if viewed solely from the perspective of visual classification, as in the frequently-used datasets based on autonomous driving scenarios, but there is a fundamental difference between humanized urban regeneration and driving perception. Third, the digital explorations of the impact of spontaneous streetscape features on diverse social sensing are still lacking, which is partly due to the unclear studies of the former problems. On the other hand, most of the related literature has taken the views of pedestrians, riders, and drivers, which can be categorized into the demand end of the street space use. From the perspective of the supply end, numerous ordinary socioeconomic entities, like storefronts, also play a significant role in providing and maintaining a vibrant economic environment and urban streetscape [11]. This is also one of the bases that supports the classical theory of Jane Jacobs [32]. Therefore, revealing the spontaneous streetscape features that are significantly correlated with social sensing can be helpful to deepening our knowledge of the spatial and social value of the street components.
In view of the gaps, this paper can contribute to the existing literature by using multisource data and the latest algorithms to reveal the spatial features of spontaneous streetscapes and the impact on diverse social sensing in an area containing hundreds of street segments. To the best of our knowledge, it is one of the few attempts to integrate a data-driven workflow into streetscape studies from a supply-end perspective. Specifically, there are three main questions in our research, as follows:
(1)
How can we combine the latest practices of visual perception methods and the nature of spontaneous streetscape elements?
(2)
What are the spatial distribution characteristics of the spontaneous streetscape elements at an intraurban scale?
(3)
What are the impacts of the features on diversified social sensing?
In order to tackle the problems, this paper first categorized the spontaneous streetscape elements through a literature review, taking the private-oriented elements into consideration. Taking the Old City in Quanzhou as a case, the study then integrated mobile collection of SVIs and a machine learning algorithm to establish a set of indexes for the analysis of spontaneous streetscape features, followed by mapping the distribution of economic vitality and social media perception from two large open platforms, namely Dianping and Sina Weibo. Finally, the impacts of the spontaneous streetscape characteristics on the sensing dimensions were revealed after adopting and comparing multiple regression models. The main results comprise the following two aspects.
(1)
Overall, the spontaneous streetscape features have a certain similarity in the impact on both dimensions of social sensing in Quanzhou, with significant clustering and transitional trends and strong spatial heterogeneity.
(2)
Specifically, the spontaneous streetscape elements can be divided into three types, given the differentiated roles of significantly positive, negative, and polarizing impacts on both types of social sensing.

2. Literature Review

2.1. Nature of the Spontaneous Streetscape and the Elements

Extracting the element-level representations along urban streets has a close relationship with the nature of spontaneous streetscapes. As opposed to point or areal space, the linear streets in old urban districts feature flat, dense, and continuous distributions of roadside elements. Storefronts, as important units of urban streetscapes, are usually controlled to avoid obvious concave–convex changes along the roads. Instead, diversified spontaneous spatial elements are preferred by them to create uniqueness [13].
The classification of spontaneous spatial elements along urban streets provides the basis for fine-grained analysis of the composition, distribution, and perceptual characteristics. As a prerequisite, understanding the meaning of spontaneity is of great help [7]. With the etymology of “spontaneity” traced back to the Latin root “sponte”, several key features of the concept can be extracted from the interpretations given by the Cambridge Dictionary website, i.e., being natural rather than planned, feeling natural, and internal stimulus [33].
Based on this, spontaneous spatial elements inherently possess a bottom-up and demand-oriented style in urban environments. However, there are still many kinds of elements involved, with diversified taxonomies. For example, some of them totally belong to personal choices, while others are chosen or advised by designers and local officials; some are adopted by storefronts (e.g., store interfaces and awnings), while others are used by temporary and mobile vendors or shared between storefronts and vendors (e.g., stalls and umbrellas); some have relatively large scales, while others are possibly minor changes; some are legal, while others, which encroach upon the street, look disagreeable. All the above are just examples. Actually, it seems impossible to list all the spontaneous spatial elements. Nevertheless, there are still some filter conditions to be chosen for this specific study. First, the research scope along with the selected technological characteristics is a vital approach. On-site observation can reach many seemingly inaccessible places and achieve high precision, but is usually low-throughput, labor-intensive, and limited by a small area. On the other hand, the existing automatic or semi-automatic image recognition techniques can be utilized in a much larger district but probably sacrifice some accuracy [19]. Second, as some spontaneous elements look similar to public items (e.g., signs), the division of public- or private-oriented is a feasible approach to classify spontaneous streetscape elements. This has potential value for urban planning and governance, as making the distinction of ownership of related elements is a fundamental prerequisite to some extent. Third, filtering and focusing on some elements with special value can narrow down the scope of urban regeneration movements. In this regard, this paper attempts to focus on those with potentially significant impacts on socioeconomic sensing.

2.2. Image Identification of Micro-Scale Elements in Street Studies

With the development of digital technologies, visual perception media represented by SVIs as well as the related processing of image identification and classification have been frequently examined in recent years. Given the advantages, micro-scale image identification methods, as well as data, like SVIs, have been utilized in multiple areas, including urban planning and design, geography, and psychology [34]. The data-driven workflow can be used to detect the visual features of spontaneous spatial elements at an (intra)urban scale.
As different meanings apply to varied resolutions for image identification, establishing a realistic connection with urban settings for SVIs requires human knowledge, which acts as a prefabricated impetus. Influenced by the works of early exploration with driving scenario datasets, pursuing all-factor segmentation and identification has predominantly become a trend. As briefly listed in Table 1, the explorations with SVIs and multiple kinds of advanced computer vision algorithms are capable of identifying more than a hundred types of objects, with the research areas varying from (intra)urban to global scales [11,16,21,35,36,37,38,39,40]. The elements that are more suitable for the spontaneous streetscapes mainly include basic interfaces, commercial, greenery, cultural features, etc. However, most of the selected micro-scale elements of the studies have focused on general scenarios, coarse-grained building components, or public urban furniture. The results are twofold. On the one hand, the universal object identification and segmentation workflows make large-scale detection and comparative studies possible, although the problem of lacking consideration of local characteristics exists to some extent. On the other hand, compared to the relatively more explored streetscape elements from the perspective of the demand end, the one that is related to the supply-end streetscape component, namely ordinary roadside storefronts, has gradually become the weak side and needs to be examined further. Actually, it should be noted that the so-called fine-grained attempt is still a relative concept.
Based on the current techniques, a few studies have chosen to exploit some characteristic and flexible applications of SVIs in the area, rather than focusing on excessive all-factor analysis. For example, Liu and Liu (2022) combined manually labeled images of four kinds of street vendors and a deep learning detection framework to map the spatial pattern of the informal sector in Shenzhen, China [41]. Furthermore, they found that the agglomeration of street vendors lay in the proximity of low-level roads and far away from the central business districts. Focusing on bus shelters, Kim et al. (2024) only collected SVIs near the geolocations of bus stops and put forward their bus shelter scores in 20 cities of the United States [42]. Cinnamon and Gaffney (2021) indicated the problems of absence, fragmentation, and obsolescence of commercial SVI platforms, like Google Street View, and explored the notion of do-it-yourself (DIY) street view production with the latest panoramic imaging technologies [43]. Similarly, Williams et al. (2019) also examined DIY sensor technologies and evaluated their performance and potential in urban public spaces [44]. Overall, these explorations can provide inspiration about customized data acquisition and the flexible use of streetscape image data.

2.3. Data-Driven Social Sensing and Its Methods

Using geospatial big data to reveal the distribution and dynamics of socioeconomic elements has become a prevalent branch in geography and urban science studies in the latest decade. As a special academic discourse, however, the concept was first put forward by Yu Liu in 2015 to indicate the counterpart to remote sensing [45]. Taking human beings as units of sensors, social sensing utilizes the collected high-resolution data to reveal the spatiotemporal distribution, dynamics and processes of socioeconomic phenomenon [46,47].
Given the diversity of the involved data sources and methods in social sensing scenarios, related practices are multifaceted, from relatively rarely used records of urban complaint hotlines to the datasets of trajectories, consumption, and social media records [24,47,48,49,50]. As examples, the commonly used crowdsourced platforms of Dianping and Sina Weibo not only possess a large number of stable users but also fit well in Chinese urban contexts. Considering the characteristics and user preferences of the applications, the two sources can deliver economic vitality and social perception liveliness, respectively. Still, it should be noted that the ordinary scenarios of the platforms usually agglomerate in popular urban areas to form uneven spatial distribution, which may cause bias in large-scale studies [47]. Therefore, the study area has to consider the influence or focus on the data concentration areas.
Furthermore, as recommended in Liu’s book, fusion analysis of SVIs and social sensing data represents a promising trend as well, which is exactly in line with this paper [51]. The similar traits of the point data or point-based data make the integration feasible, whether at an individual level or aggregate level.

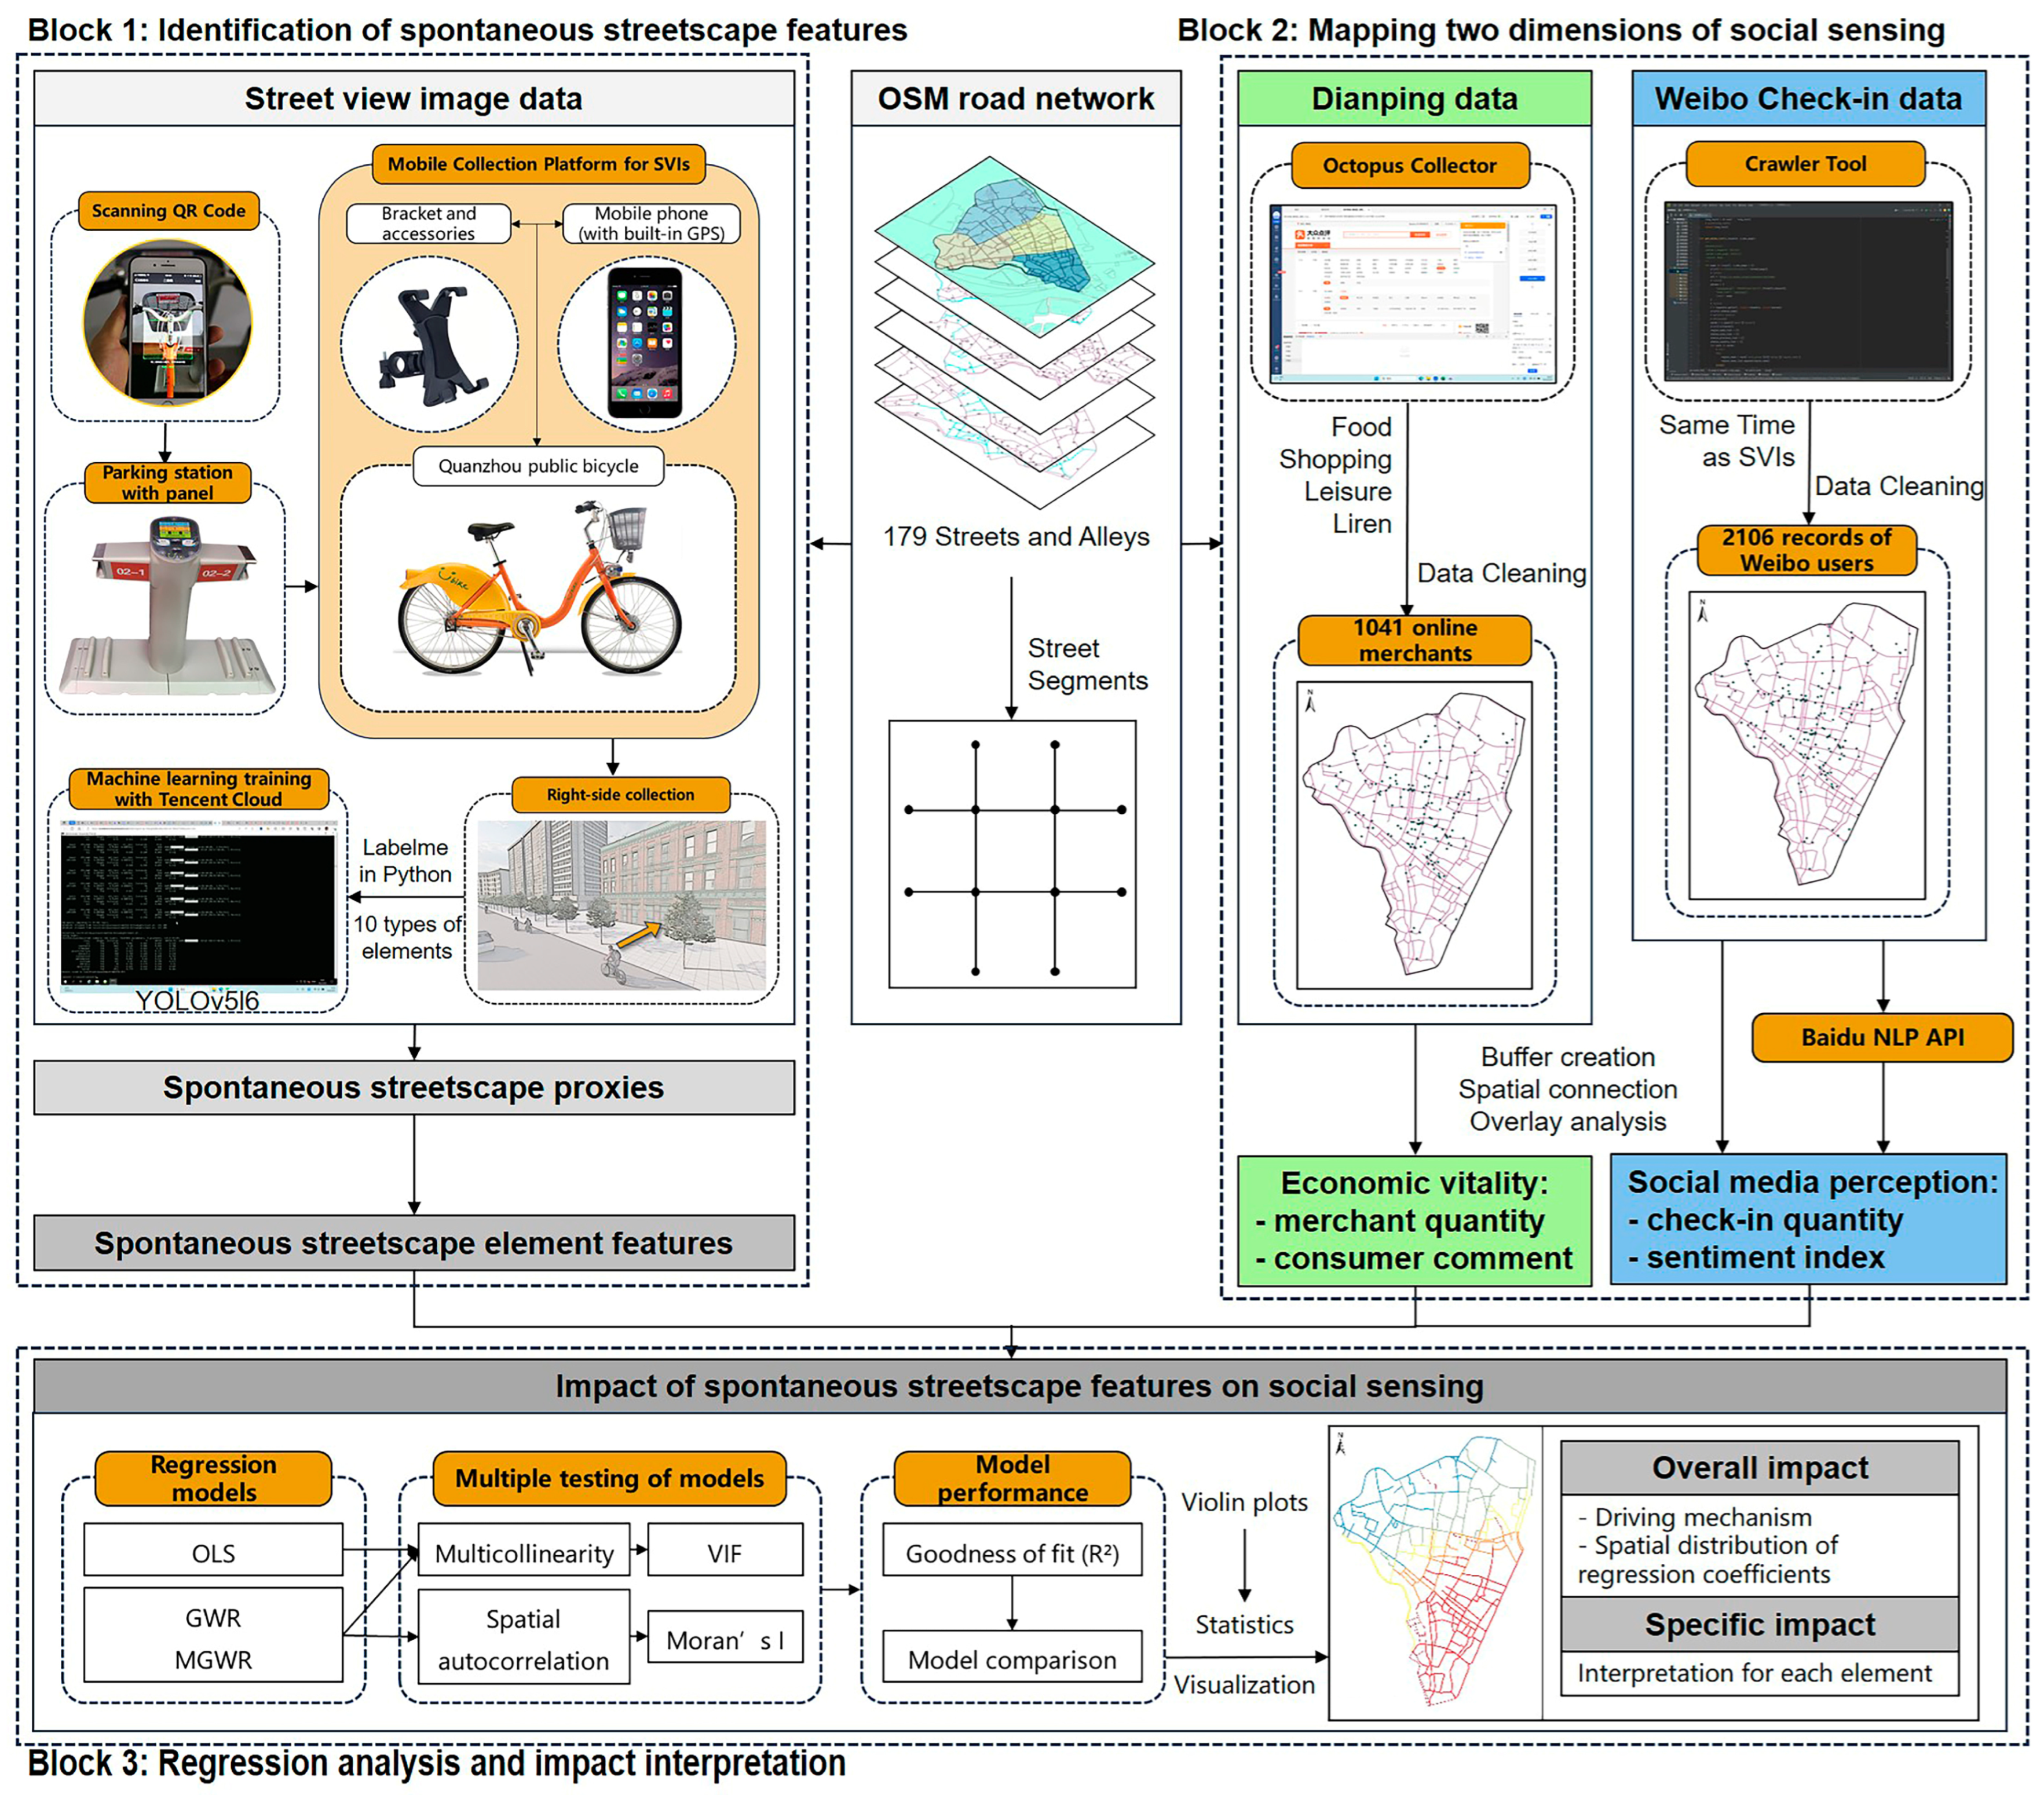
3. Materials and Methods

3.1. Study Area

This paper takes the Old City located in Licheng District, Quanzhou City, Fujian Province of China as the study area (see Figure 1). The whole area covers approximately 6.4 square kilometers. There are basically two aspects of consideration for this paper. First, due to the profound historical background and a long history of economic development in Quanzhou, it has both bottom-up commercial traditions and pretty good environments for numerous small and medium businesses along the roads, which can support the development of a spontaneous streetscape. Additionaly, the distinct phenomenon and culture in this Hokkien region is highly consistent with the ordinary experience of on-site investigation. Second, after Quanzhou was successfully listed in the World Cultural Heritage List in 2021, the Old City, as one of the core districts, has attracted a large number of residents and tourists [52]. Particularly, more and more youngsters are visiting and posting their experience through various social media platforms, which caused Quanzhou to be selected as the one of the vibrant cities at the China Vitality City Conference [53]. Given the abundant spontaneous streetscape elements and the relatively concentrated social sensing use, the Old City in Quanzhou can be an appropriate case for the study.

3.2. Data Acquisition and Methods

As is illustrated in Figure 2, the overall analytical framework comprises three main parts, to study the distribution features of spontaneous streetscape elements, distribution of social sensing results, and impact of spontaneous streetscape features on social sensing, respectively. Among them, the first part has further been divided into three subsectors in the following text, considering the fundamental focus of spontaneous streetscape in this paper. Furthermore, the physical environment orientation can also better support urban regeneration.

3.2.1. Mobile Collection of Street View Images

As the basis of the subsequent analysis, the road network was first downloaded from OpenStreetMap (OSM) and we made some necessary typology corrections compared to Baidu Map. After that, 179 streets and alleys were obtained and divided into street segments based on road intersections. Then, the segments were used to generate sampling points of SVIs with an interval of 20 m in ArcGIS (version 10.6, Esri) [11,54]. In total, 3447 points were attained.
Despite the usual workflow of using the points to gain SVIs, the timeliness of these data from prevailing open platforms may have a significant influence on the results. After checking the Baidu Map and Tencent Map platforms, we found that there is an evident time lag in the provided SVI data products in Quanzhou. For example, the latest data for most of the SVIs from the Baidu Street View platform have remained the record of 2017, with only a few of 2021. Given the significant context of the area’s successful inclusion in the World Heritage List in 2021, these data can reflect neither the recent intervention of urban regeneration nor the current streetscape. In fact, the problem of spatiotemporal accuracy has become one of the major limitations on geospatial big data. As a reflection and response, some scholars have put forward the concept of mobile sensing technology [55,56]. As an emerging exploration direction, it can integrate portable sensors to achieve low-cost collection and high temporal granularity while reaching more places [56].
Likewise, the SVIs in the study area were finally collected using a mobile and detachable sensing tool, which mainly consists of a public bicycle, a mobile phone with built-in GPS sensors, a bracket, and accessories (see Figure 2). Before on-site collection, a pre-survey was arranged to divide the whole area into several task modules and conduct route planning, which aimed to ensure a balanced workload between task modules and to avoid duplicate routes. Recording the images on the left and right sides of the street segments, the in situ mobile collection took place from the 3rd to 8th of July 2023. During the process, 274 sampling points were deleted due to temporary traffic blockage of urban regeneration and pipeline laying projects. Furthermore, the collection task was arranged between 9:30 and 18:30 each day. This was an essential but passive choice, because the selected period had to be consistent with the normal business hours of the storefronts. Finally, we obtained 6346 SVIs in total, with the image size of 1600 × 1200 pixels. Among them, 3624 images were selected as the training dataset and 910 images were used as the validation dataset.

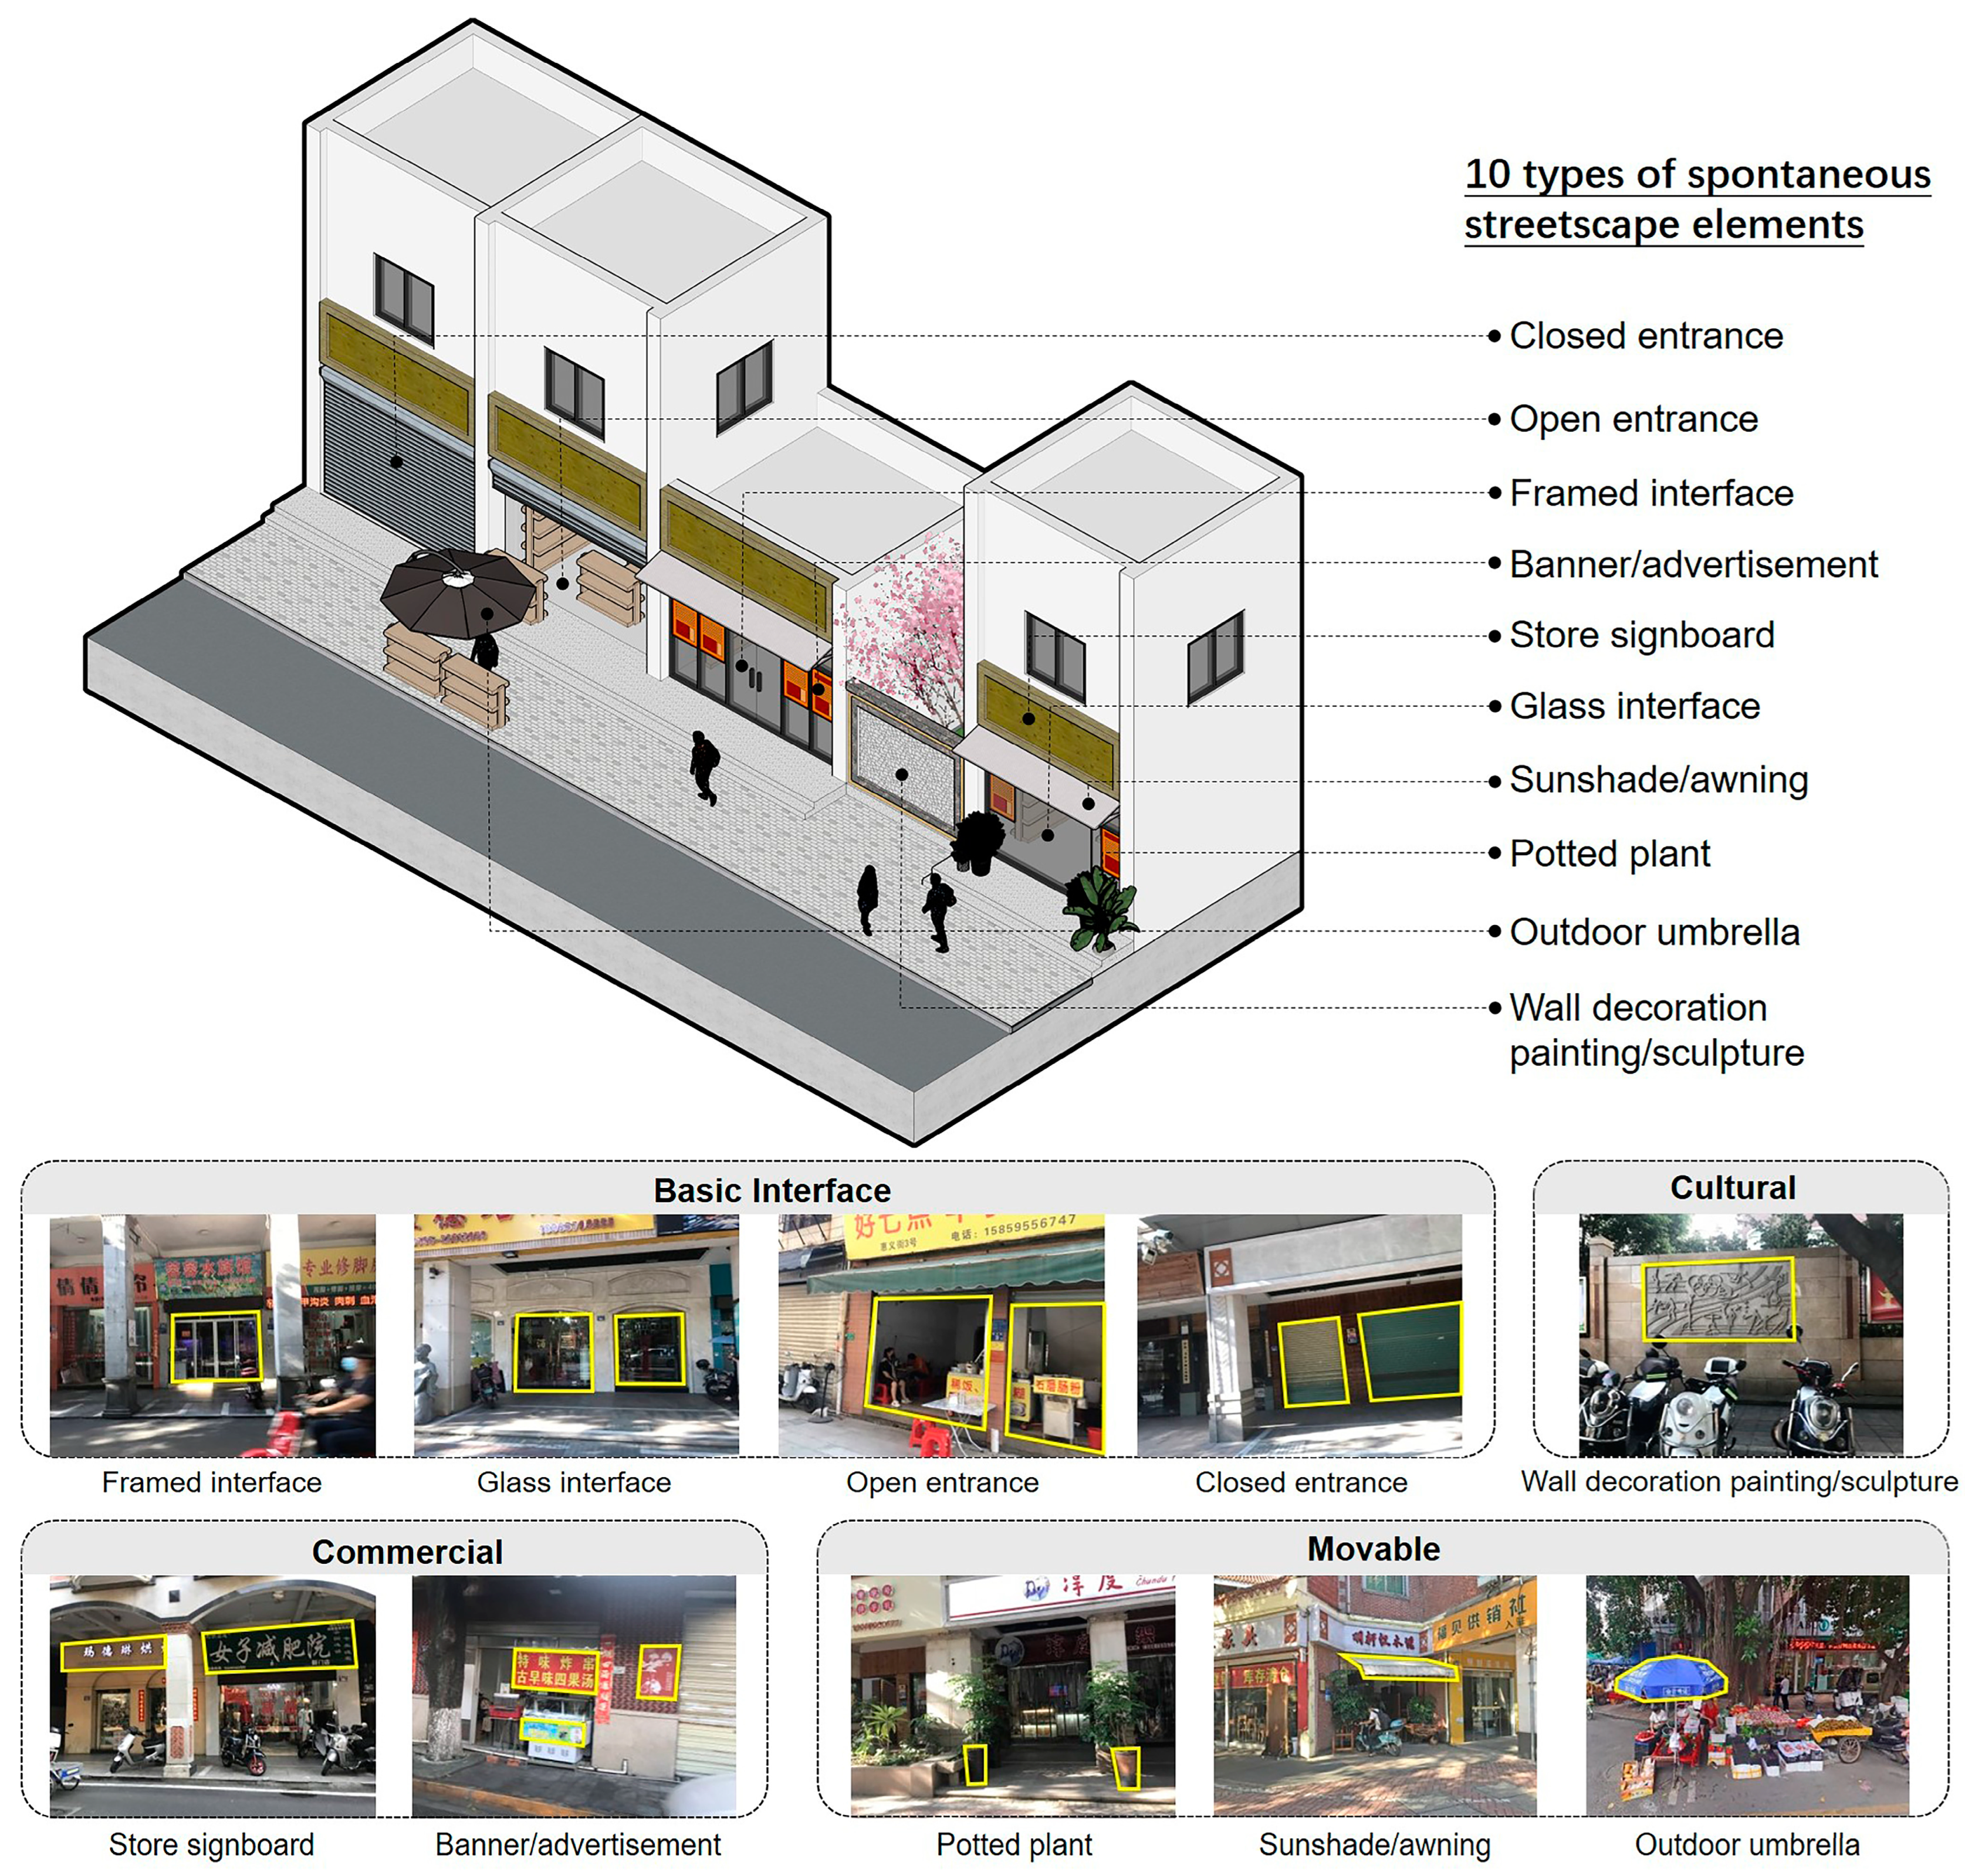
3.2.2. Classification of Spontaneous Streetscape Elements

As mentioned in Section 2.2, the examined diverse micro-scale streetscape elements mainly focus on some common functions, like basic interfaces, commercial, greenery, and cultural elements. However, the lack of consideration on the divergent public- or private-orientation and fine-grained identification of the storefronts as the supply end has restricted the humanized and complete perception of streetscape element system. According to the filtering conditions in Section 2.1, the spontaneous streetscape elements in the study area were categorized into four types, including basic, commercial, movable, and cultural elements. They could be further divided ten subtypes (see Figure 3). All the classification and definitions of the related elements are listed in Table 2. All the elements were labelled manually using the Labelme software (version 5.1.1) with Python (version 3.9). It should be noted that the selected spontaneous streetscape elements are the representative components of an orderly and typical street scenario and are not intended to include all the spontaneous counterparts in urban streets.

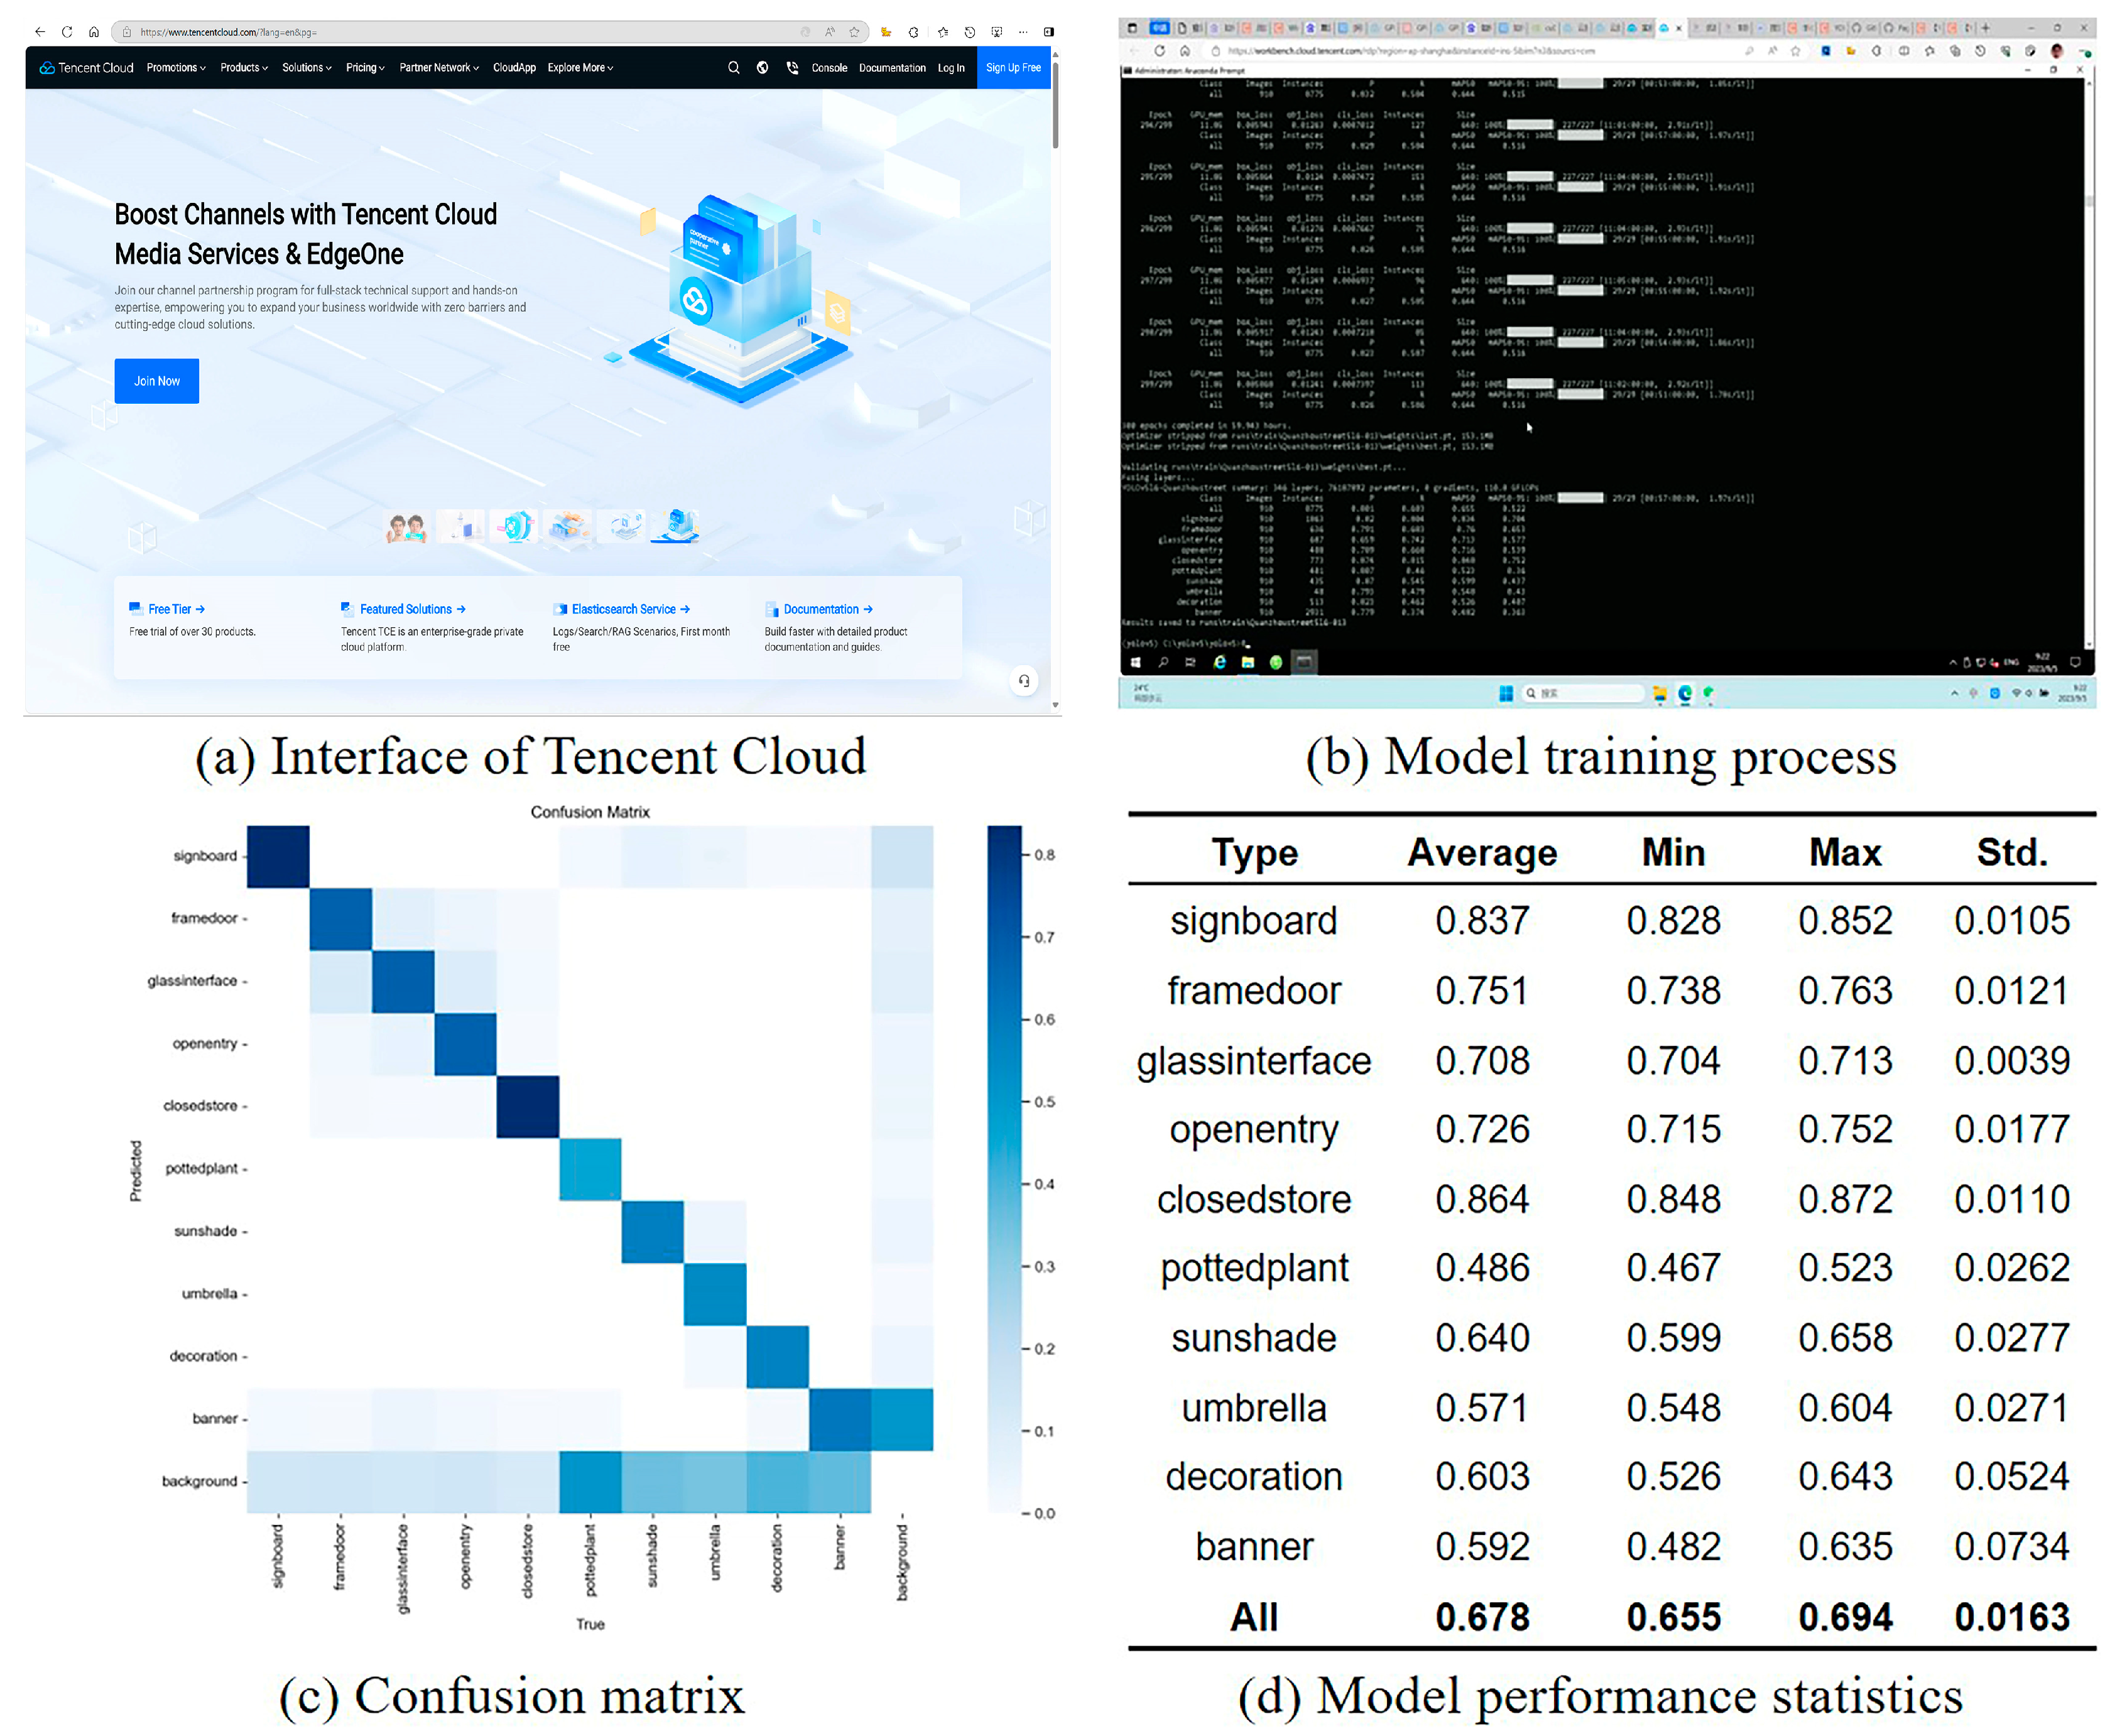
3.2.3. Machine Learning Model Training

As summarized in Section 2.2, many kinds of machine learning algorithms have been explored, among which YOLOv5 (version 6.0) was selected for further model training. YOLO is an example of a one-stage object detection algorithm. Compared to two-stage algorithms, like R-CNN, YOLO takes a detection task as the solution of regression models and considers global features simultaneously during the detection process, resulting in a significant speed improvement while paying a small cost in terms of accuracy [57]. After subsequent iterative optimization, YOLOv5 has been widely used due to its maturity and stability, with further improvements arriving in the latest 6.0 version. Given the different characteristics of the involved n, s, m, l, and x models, the l model was chosen to obtain a balance of data volume, accuracy, and speed.
To avoid the impact of long-term training on other parallel workflow, we built a server environment based on Tencent Cloud for model training (see Figure 4a,b). Specifically, the adopted type of instance is a GPU Computing GN7, with eight cores and 32GB configuration and the Windows Server 2019 system. The GPU model is an NVIDIA Tesla T4 16GB. During the training process, the batch-size, epoch, and IOU (intersection over union) were set to 16, 300, and 0.5, respectively, with other hyperparameters as the default. As the selection of IOU complies with the normal range (e.g., from 0.5 to 0.75), the setting of the batch-size and epoch has to consider many factors, like hardware resources, calculation period, and the model convergence speed. Given the selected model, we have began a pre-experiment with a smaller epoch (e.g., 50) and batch-size (e.g., 8) and adjusted them to obtain a relatively suitable value for the allowed GPU memory capacity. To avoid the influence of the randomly selected images during a training process, we further divided the training dataset into four sub-datasets. Each sub-dataset was taken as a test set and the others were used for training in turn, along with the validation dataset. The average performance of the models was then calculated to provide a relatively robust result in this study.
The performance of the model can be seen in Figure 4c,d. As is illustrated in the table, the mAP (mean average precision) value of the 10 subtypes reached 0.678, showing a good comprehensive performance. The small standard deviations for the specific subtypes and the all-factor approach reflects a relatively stable performance. In terms of the specific elements, the type of basic interfaces has high and relatively balanced results, with most of the mAP values over 0.75. While commercial signboards achieve the second highest record of all, the difference value between them and banners and ads is 0.217. This may correlate with the usual lower precision of identification of small-scale objects, as well as an amplified effect in the mixed recognition of multiscale elements. The performance of the movable and cultural elements mainly lies between 0.6 and 0.7, slightly lower than the average. However, the mAP of the potted plants has the lowest value of 0.484. From the confusion matrix, we can see that all the basic interface elements and the commercial signboards have higher values of the 10 subtypes, while the relatively low values of the others are basically due to the distraction of the image’s background. In other words, the model has a lower recognition ability to correctly distinguish the small-scale elements from the background of the sample images at a higher probability. The phenomenon can be caused due to the quality of the collected images, imbalanced quantities of different tags, etc. Although directly feeding machine learning models with SVIs is a common process, the lack of multiscale training inputs and specific control of the tag numbers of different elements may potentially affect the model performance in our study. Therefore, it should be noted that the small-scale elements with a relatively lower identification precision are likely to be overestimated in the related spatial analysis.
Given the obviously smaller number of tags of the umbrella element identified by YOLO, the distribution of it is likely to be zero in most of the street segments, resulting an in incomparable quantity compared to the other elements. Consequently, the other nine kinds of elements, as well as the interface diversity of storefronts, were adopted in the following text.

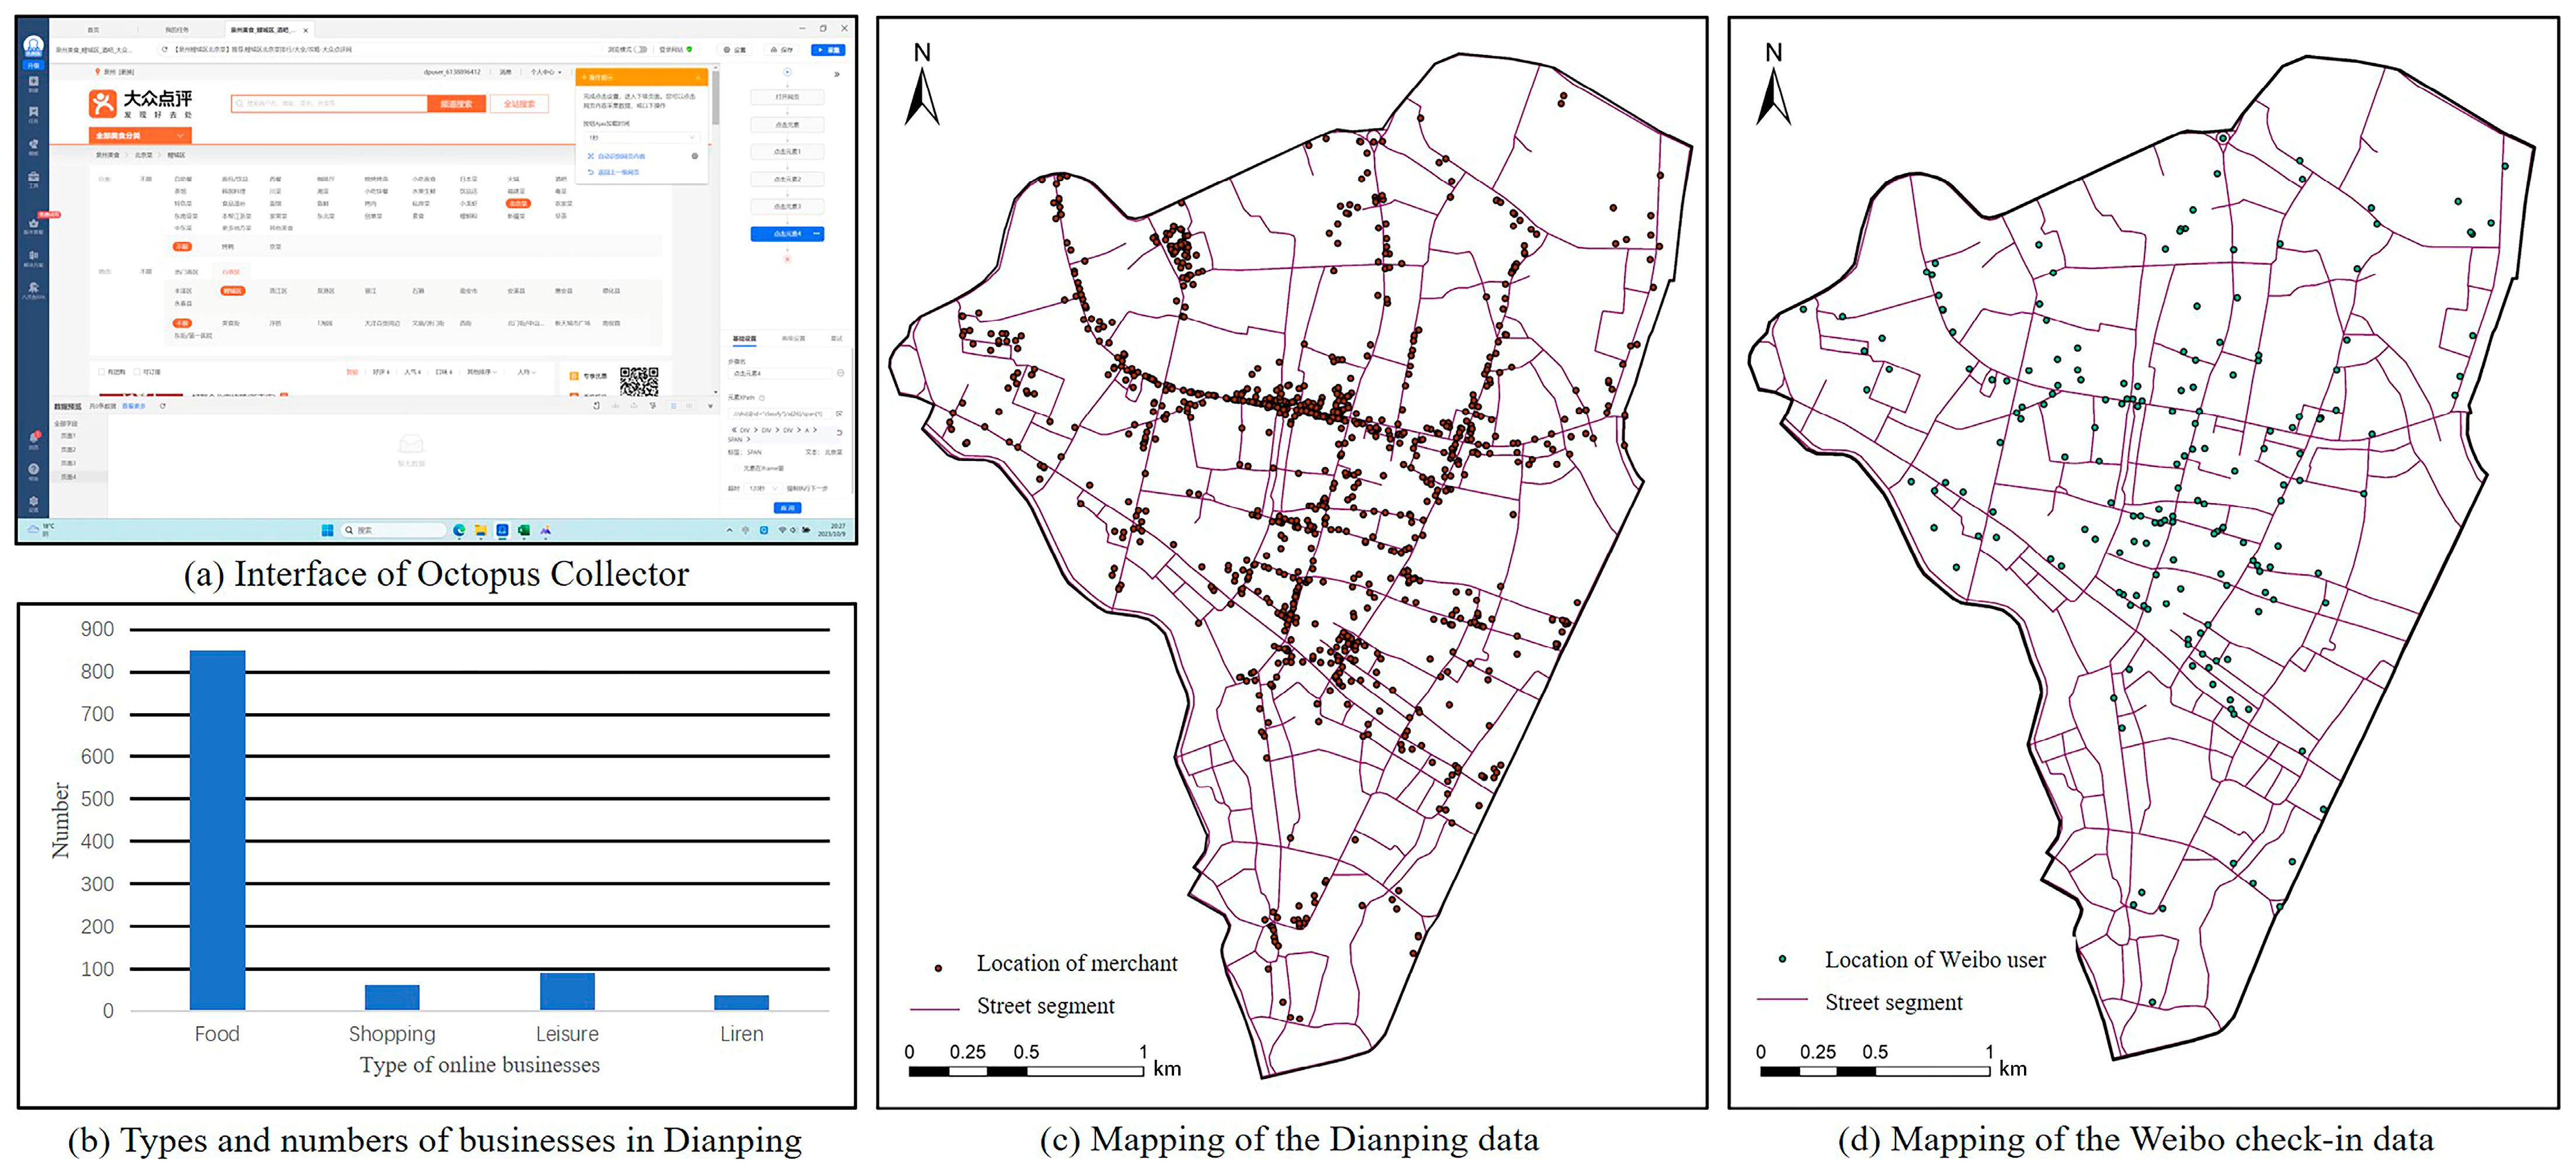
3.2.4. Social Sensing Data Processing

Two social sensing platforms, namely Dianping (https://www.dianping.com/, accessed on 12 October 2023) and Sina Weibo, were utilized to indicate online economic vitality and social media perception, respectively. These data platforms have demonstrated satisfactory support value due to their high user quantity and stickiness [27,58,59]. Based on the latest reports released by the related companies, youngsters and females are the main users of these platforms, which may reflect the characteristics of the population.
For the online economic vitality, we used Octopus Collector in July 2023 to obtain four types of businesses in the Old City area of Quanzhou, including food, shopping, leisure and entertainment, and liren (namely beauty issues). The collected information includes merchant type, location, per capita consumption, rating score, number of reviews, etc. Among these tags, the per capita consumption is affected by multiple factors, such as merchant type and individual consumption level, and the rating scores from different businesses have both differentiated standards and missing values of a whole type (e.g., liren). However, the number of reviews can avoid the abovementioned drawbacks. Thus, this factor was adopted in this study. In fact, the four types also contain different numbers of lower-level tags. For example, the type of food comprises 40 subtypes from the website, including buffet, bread/drinks, Western cuisine, coffee shops, barbecue skewers, snack noodles, and various local and foreign cuisines. These types are selected due to their preferences for offline operation and the experience during the on-site investigation in the Old City area. After inspecting the duplicated and missing items, 1041 pieces of store information were obtained in total (see Figure 5). Among them, however, the type of food accounts for over 80% of all the businesses. Given the obviously uneven quantities of the four types of points of interest (POIs), the related data were combined together to calculate the Dianping merchant quantities and consumer comments, which can, thus, indicate the online economic vitality in this paper.
For the social media perception, to maintain the temporal consistency with other data, the Weibo check-in data of the study area were crawled, with their timeframe limited to July 2023. There were 2106 pieces of data as a results. These records possess approximately 10 types of tags, such as user identity, spatiotemporal information, text content, and online interaction data. In this paper, we focus on both the locations and contents of the Weibo texts to calculate check-in quantity and sentiment index. Although the former was easy to obtain, the latter was calculated using the Natural Language Processing (NLP) API of the Baidu Cloud platform (https://cloud.baidu.com/product/nlp_basic, accessed on 10 January 2024). Given the rich corpus resources and the multiple deep learning training from Baidu, the sentiment analysis tool can obtain a high overall precision and a good generalization ability when faced with diversified text content. By requesting the URL, it can return a probability value of a positive/negative judgement, a confidence level (with the interval from 0 to 1), and a predicted sentimental classification code (e.g., 0, 1, or 2, for negative, neutral, and positive results, respectively). As the sum of the positive and negative probabilities of a post text is 1, a higher positive probability is likely to indicate a better feeling. However, only considering the predicted emotional judgement result from the deep learning model may overlook the impact of the confidence level. Accordingly, this paper multiplied the positive probability of a text with its confidence level to obtain the sentiment index for a Weibo record. The average of all the nearby records was then deemed as the corresponding sentiment index of a street unit.
Taking street segments as units, their centerlines were adopted to expand by 50 m on both sides to form buffer zones. The distance of about 50 m has become a common practice for the visual recognition of SVIs [60] and is suitable for the street scale in the Old City of Quanzhou. The quantities of online businesses and Weibo check-in records were then used to conduct overlay statistics and visualization in ArcGIS.

3.2.5. Multiple Regression Models

Based on the handling of the multisource data, a set of independent and dependent variables was established (see Table 3). Then, multiple regression models were used to reveal the impact of spontaneous streetscape features on social sensing, including the ordinary linear squares (OLS) model, the geographically weighted regression (GWR) model, and the multiscale geographically weighted regression (MGWR) model. Among them, the OLS model is used as a benchmark model reference because its insufficient consideration of spatial heterogeneity often leads to poor model performance. In this regard, the GWR and MGWR models highlight spatial heterogeneity by automatically selecting the optimal bandwidth and calculating the respective bandwidths for different variables to avoid this weakness. Meanwhile, the workflow of the MGWR model usually makes the results more robust [61]. The software for the GWR and MGWR calculation can be downloaded directly from the website of the School of Geographical Sciences and Urban Planning at Arizona State University (https://sgsup.asu.edu/form/windows-sparc-mgwr (accessed on 15 May 2023)). The selection of the spatial kernel function, the model function, and the convergence threshold of the model were all consistent with the settings from one of our prior papers [11]. Nonetheless, to avoid a potential interrupted calculation due to a zero problem for certain elements, we replaced 0 with 1 × 10⁻⁵, a very small value without a significant impact on the result [62]. However, it should be noted that this minor adjustment is relatively reasonable, partly because we have focused on the common elements of streetscape features and removed the umbrella category with a very low quantity.
After the construction of the models, the best one can be obtained by comparing the values of the goodness of fit. It can then be used for further analysis. To avoid the influence of different variable dimensions and value ranges on calculation robustness, all proxies were calculated to the [0,1] interval according to min–max normalization method.

4. Results

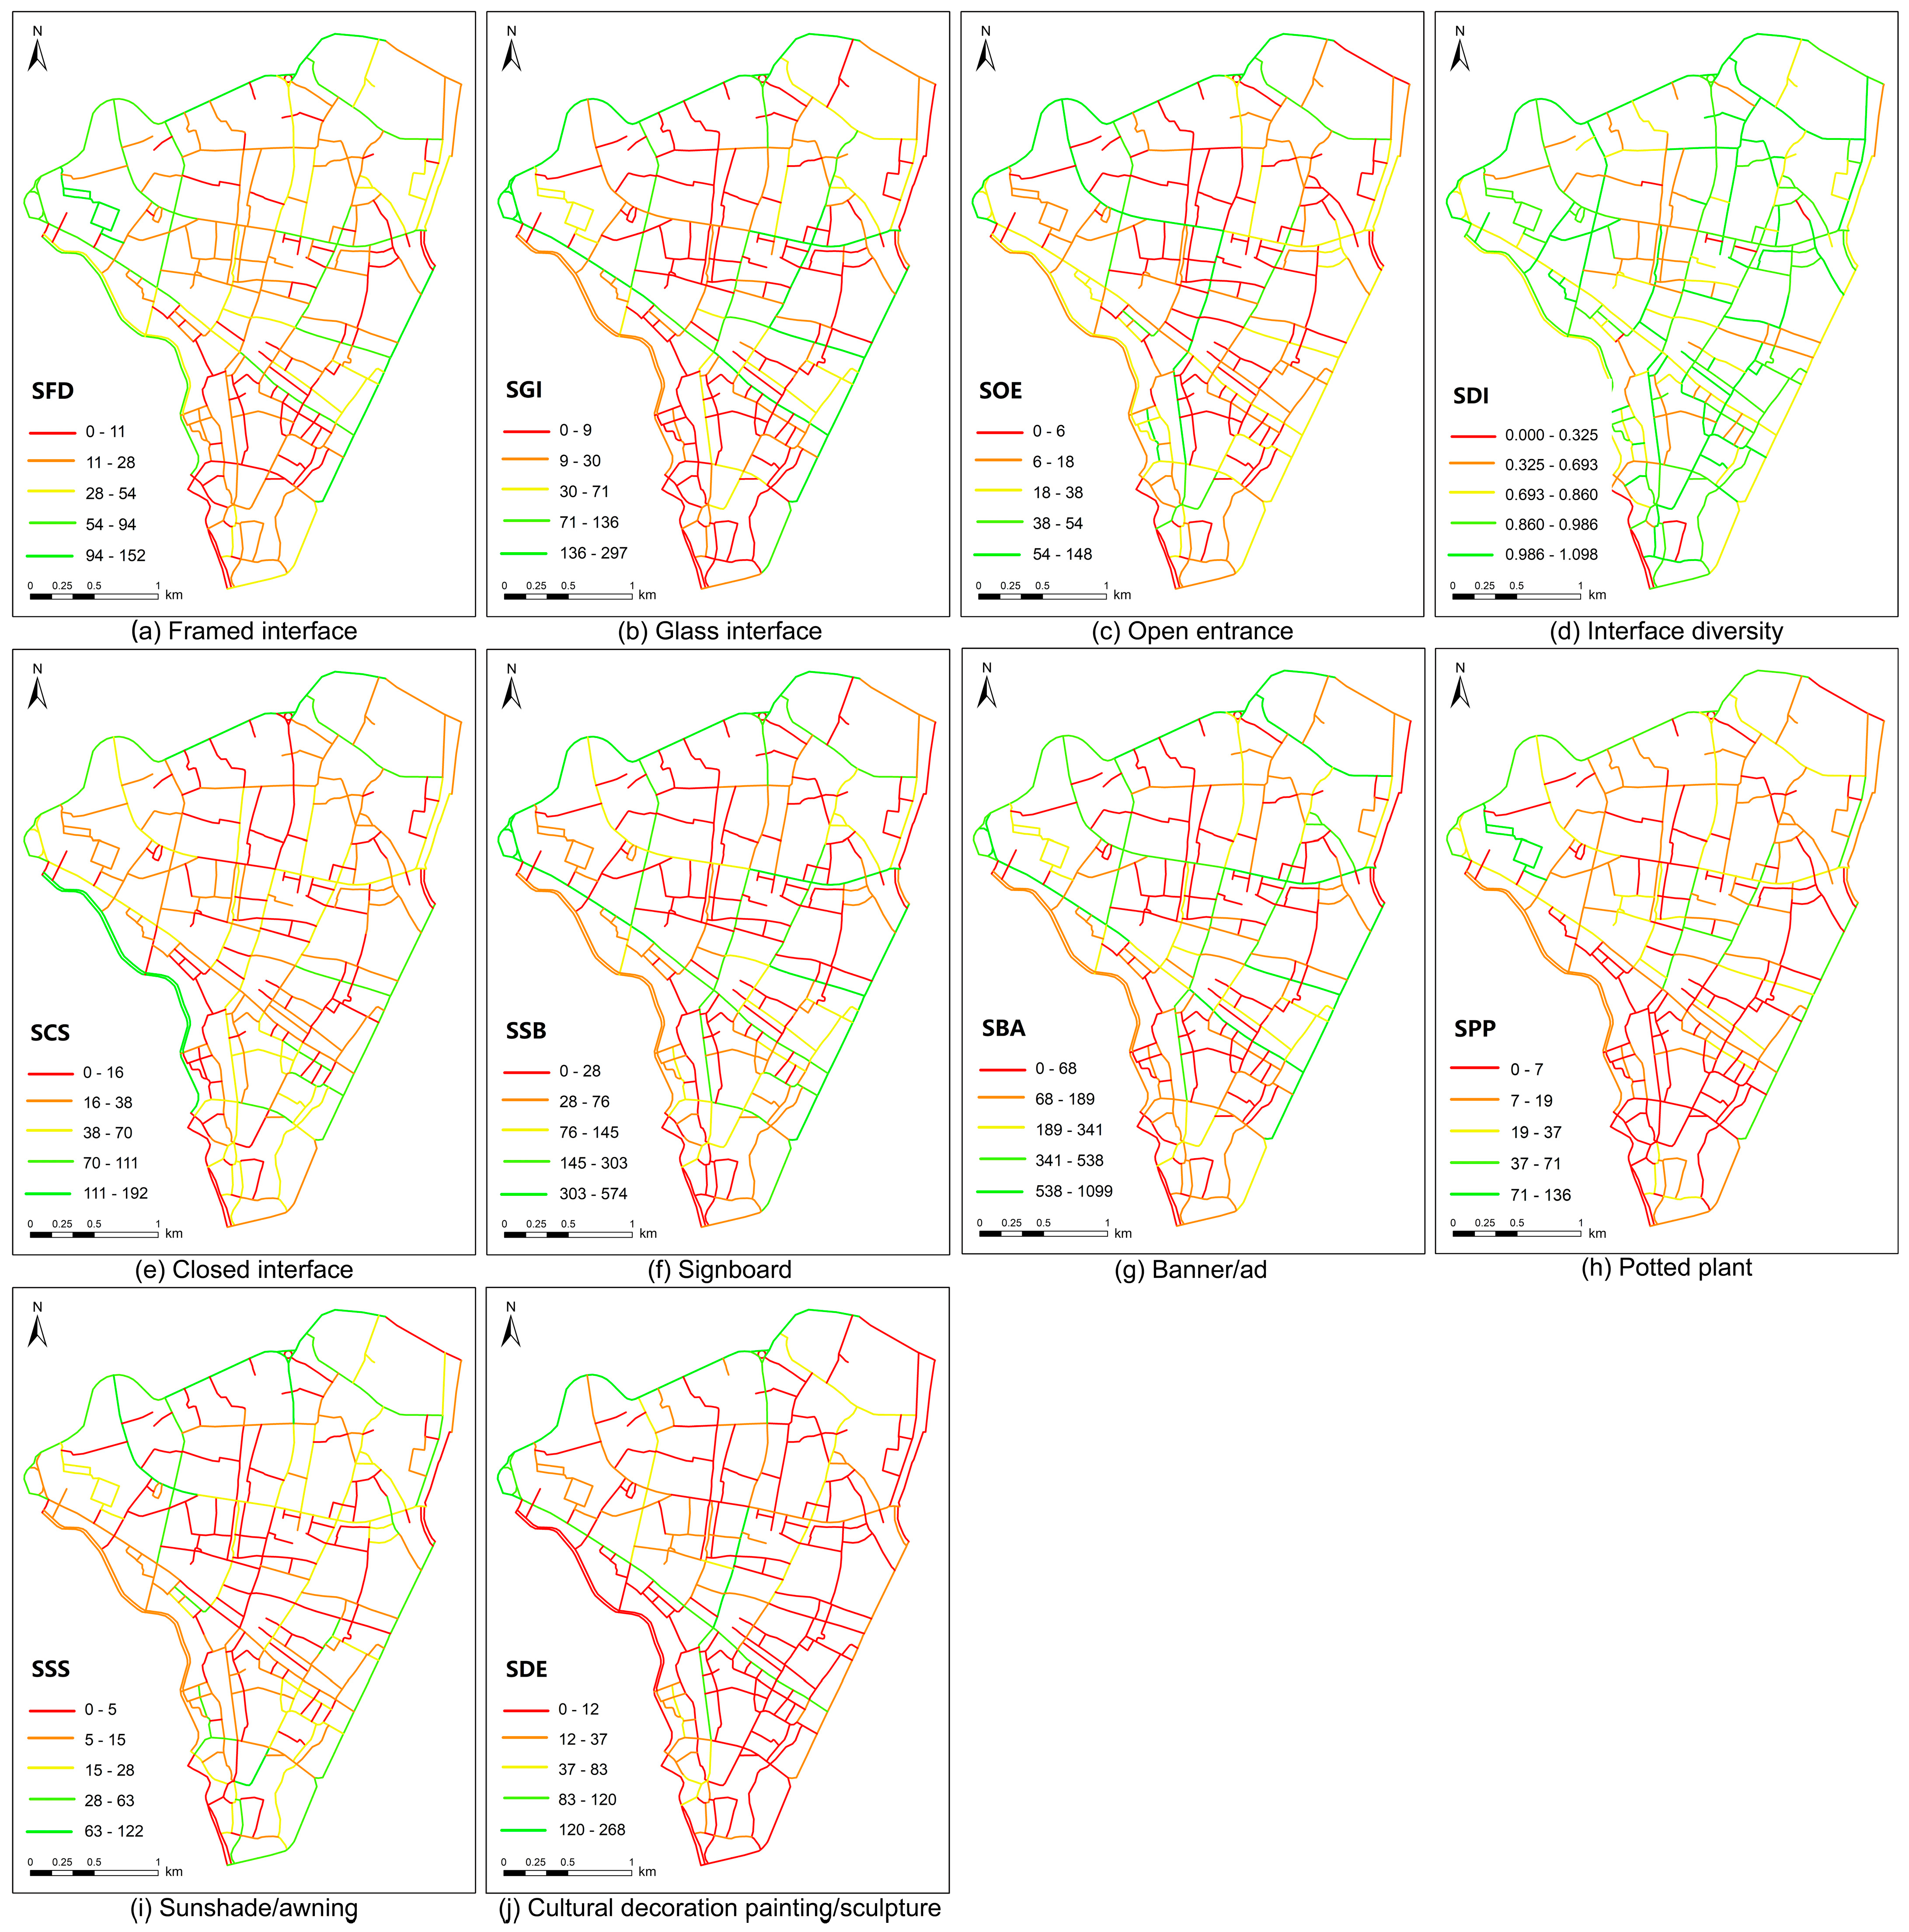
4.1. Features of Spontaneous Streetscape Element Distribution

The spatial distribution of the spontaneous streetscape elemental proxies is shown in Figure 6. Overall, various spontaneous streetscape elements exhibit a similar characteristic of concentrated distribution along the high-level roads of the Old City in Quanzhou, although the differentiated distribution results of different elements vary.
Specifically, the spatial characteristics of the basic interface categories are relatively consistent. The high-value areas of the three types of interfaces from operating storefronts and the low-value area of the closed store entrances are concentrated along the main roads north of Xinmen Street and Tumen Street. The interface diversity index exhibits a high value in most of the street segments, indicating a diversified trend of the streetscapes. As for the commercial type of elements, the spatial distributions of store signboards and banners and advertisements show a high similarity. While the commercial elements mainly agglomerate along the main and secondary roads at the edge of and inside the Old City, some of them also exist in some residential streets and alleys. In terms of the movable type, the spontaneous greenery from potted plants basically shows a higher quantity in the north part of Xinmen Street and Tumen Street, including most of the high-level roads and some famous alleys in the central and western parts. Meanwhile, the southern area maintains a stable and sparse distribution of the spontaneous plants. The sunshades and awnings possess both low level of spatial distribution continuity and high degree of fragmentation. They mainly concentrate along the roads near the northwest and southeast boundaries of the Old City. On the other hand, the scattered clusters in some important roads located at the center parts of the study area, such as Xinmen Street, Tumen Street, Zhongshan Middle Road, and Zhongshan South Road, are probably due to the continuous arcade forms of these street segments. In terms of the cultural elements, they are generally located in a V-shape along the two lines of Chengxi Road-–Chengbei Road and Xinmen Street–Tumen Street. Actually, the area of their distribution is rather limited, which presents a high degree of aggregation in the Old City.

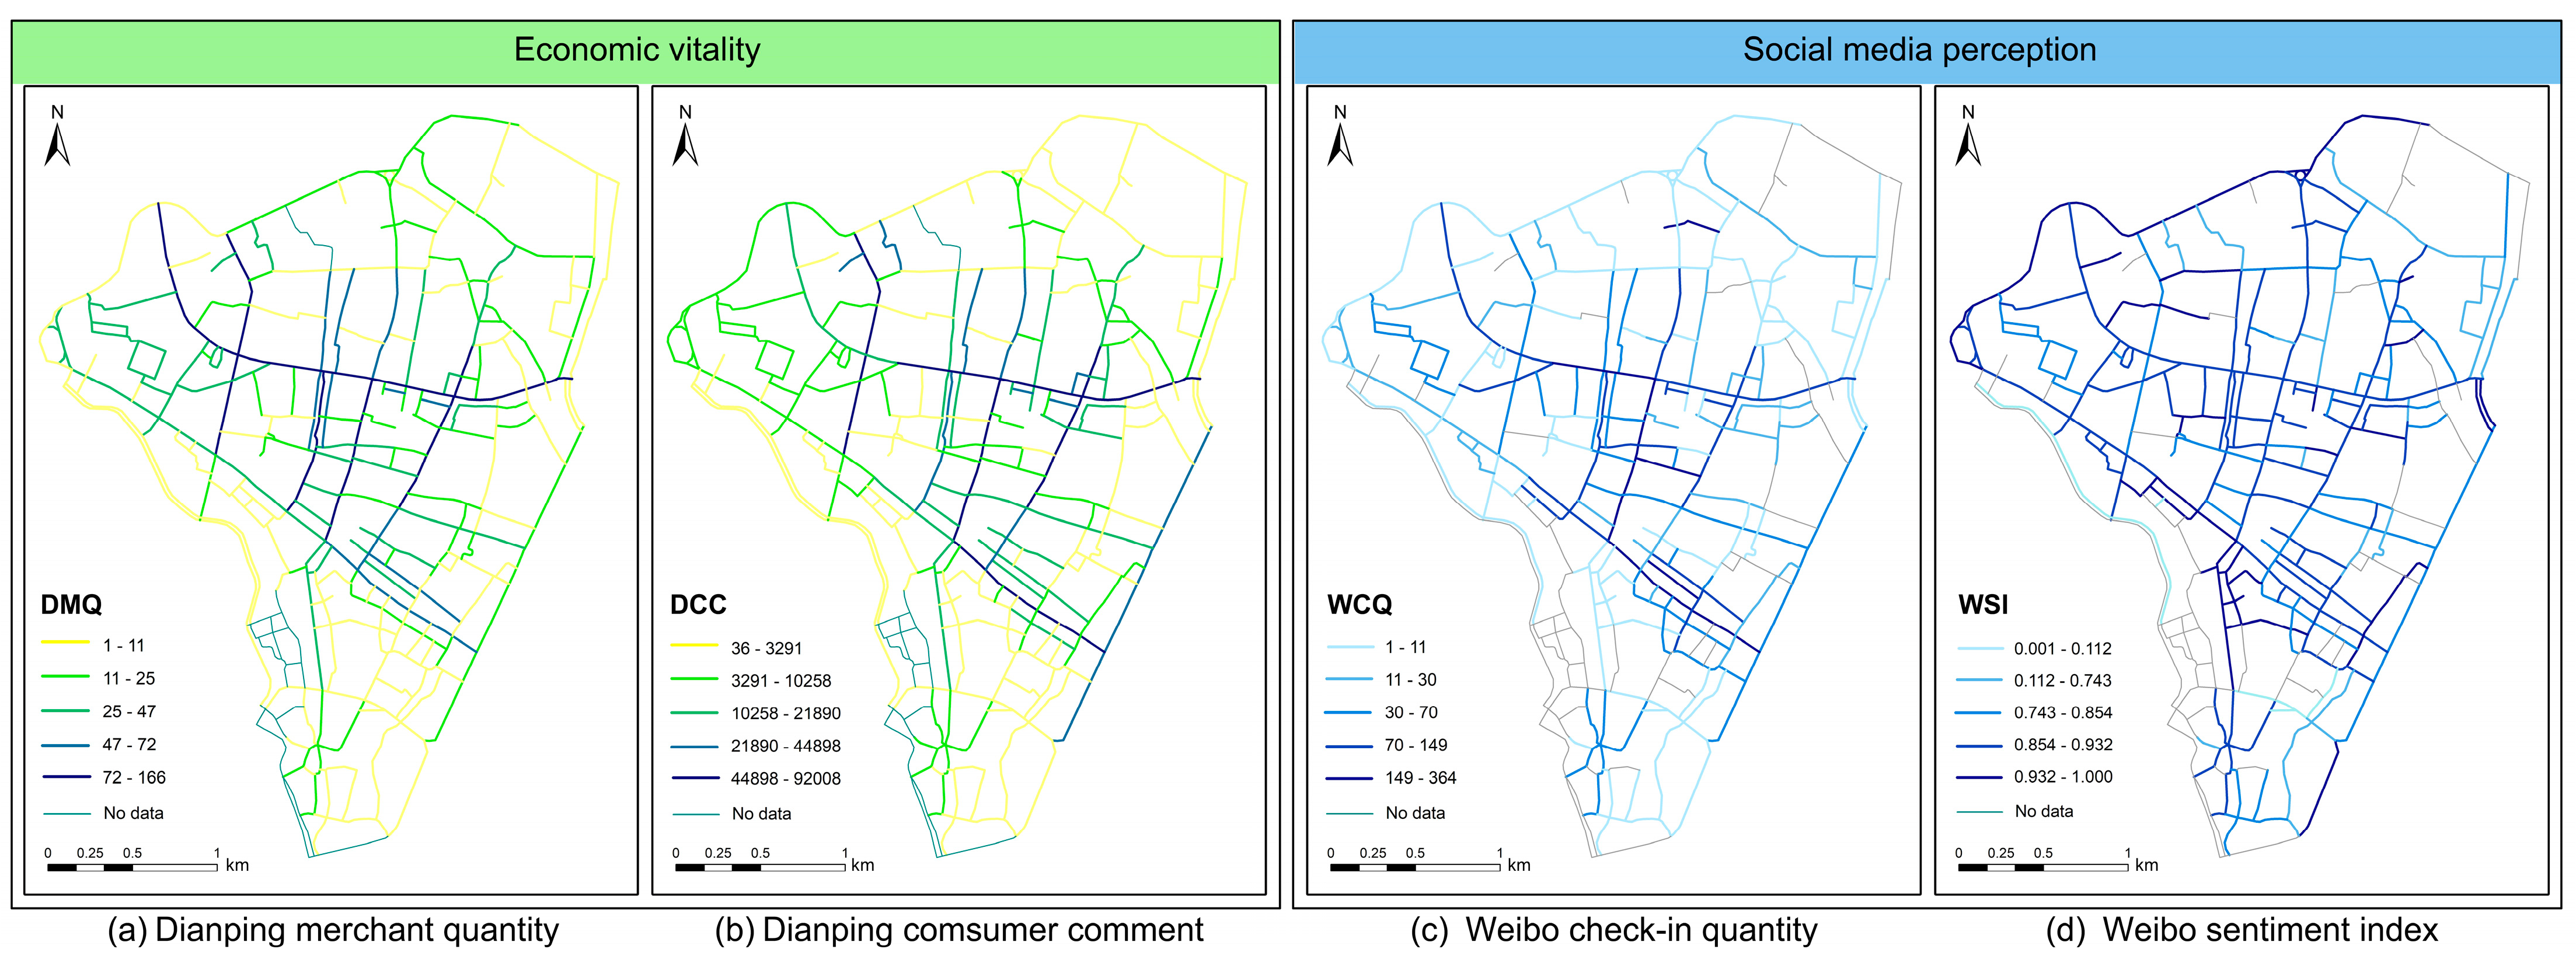
4.2. Spatial Distribution of Social Sensing

Two dimensions of social sensing, namely economic vitality and social media perception indexes, have been illustrated in Figure 7. In terms of the overall characteristics, the high-value areas of them agglomerate approximately at the central district of the Old City.
Specifically, for the economic vitality, DMQ generally exhibits a fishbone-shaped distribution pattern. Along the axis of West Street and East Street, several connected roads, including Xinhua Road, Haogouqian, Zhongshan Middle Road, and Nanjun Road with a west–east sequence, form a core area of a merchant gathering that extends north to Aiguo Road and south to Xinmen Street Tumen Street. In addition, other street segments, such as the back alleys near Tumen Street, the surrounding roads of 1916 Creative Industry Park, and the northern segments of Zhongshan South Road, have exhibited a moderate level of DMQ. As some of them have already become well-known check-in spots for residents and tourists, potential future regeneration can stimulate a larger area of online economic vitality to connect with the existing patches. Similarly, the pattern of DCC shows a fishbone-shaped and agglomerated distribution pattern in the central area, with a shorter axis of West Street and East Street. This reflects a more compact core consumption area, compared to the distribution of DMQ. Considering the huge distinction in the number of comments from different segments, the attractiveness to consumers of the core area is overwhelming.
From the perspective of social media perception, WCQ extends in a zigzag pattern to the surrounding road network. In the area between West Street–East Street and Xinmen Street–Tumen Street, some contiguous high-value clusters appear. In addition, moderate levels of check-in numbers are found in the street segments near Tianhou Road, Zhongshan South Road, Wanshou Road, and north of West Street in the study area. As opposed to the limited concentration area of check-in records, streets with high sentiment indexes show a wide distribution across the Old City. Specifically, those with a sentiment index of over 0.8 account for 77.4% of all the effective measured street segments, which indicates an overall positive perception in the whole area. Beyond the central part, the segments with high indexes also exist in the boundaries of the City, like Chengxi Road and Chengbei Road, which may reflect a differential motivation or social media attraction between them.

4.3. Impact of the Spontaneous Streetscape Features on Social Sensing

4.3.1. Performance Comparison of Multiple Regression Models

Given the features of linear regression models, the variance inflation factors (VIFs) of all the variables are usually adopted to test the multicollinearity. While most of the VIFs of the variables are lower than 10 [63], the VIF value of the store signboard type is not. As such, it was excluded from further analysis. The OLS model was established, with the performance summarized in Table 4. Although the explanatory power of the independent variable for changes in the dependent variable of economic vitality is higher than that of social media perception, the overall performance of the OLS models still remains to be improved.
Moran’s I index was then used in ArcGIS to test the spatial autocorrelation of the dependent variables [63]. The calculation results showed that at a confidence level of 0.001, the Moran’s I indexes for the four types of social sensing proxies were 0.242, 0.167, 0.213 and 0.275, respectively, indicating a positive spatial autocorrelation for the social sensing indexes that can be further analyzed through the GWR and MGWR models. The model performance of the two kinds of models can be seen in Table 5. The overall model performance of the economic vitality is higher than that of the social media perception, showing a stronger spatial heterogeneity of the latter. Furthermore, the adjusted R2 values of the spatial heterogeneity models are higher than those of the OLS model, with the best performance of the MGWR model. Therefore, the next explorative analyses are based on that.

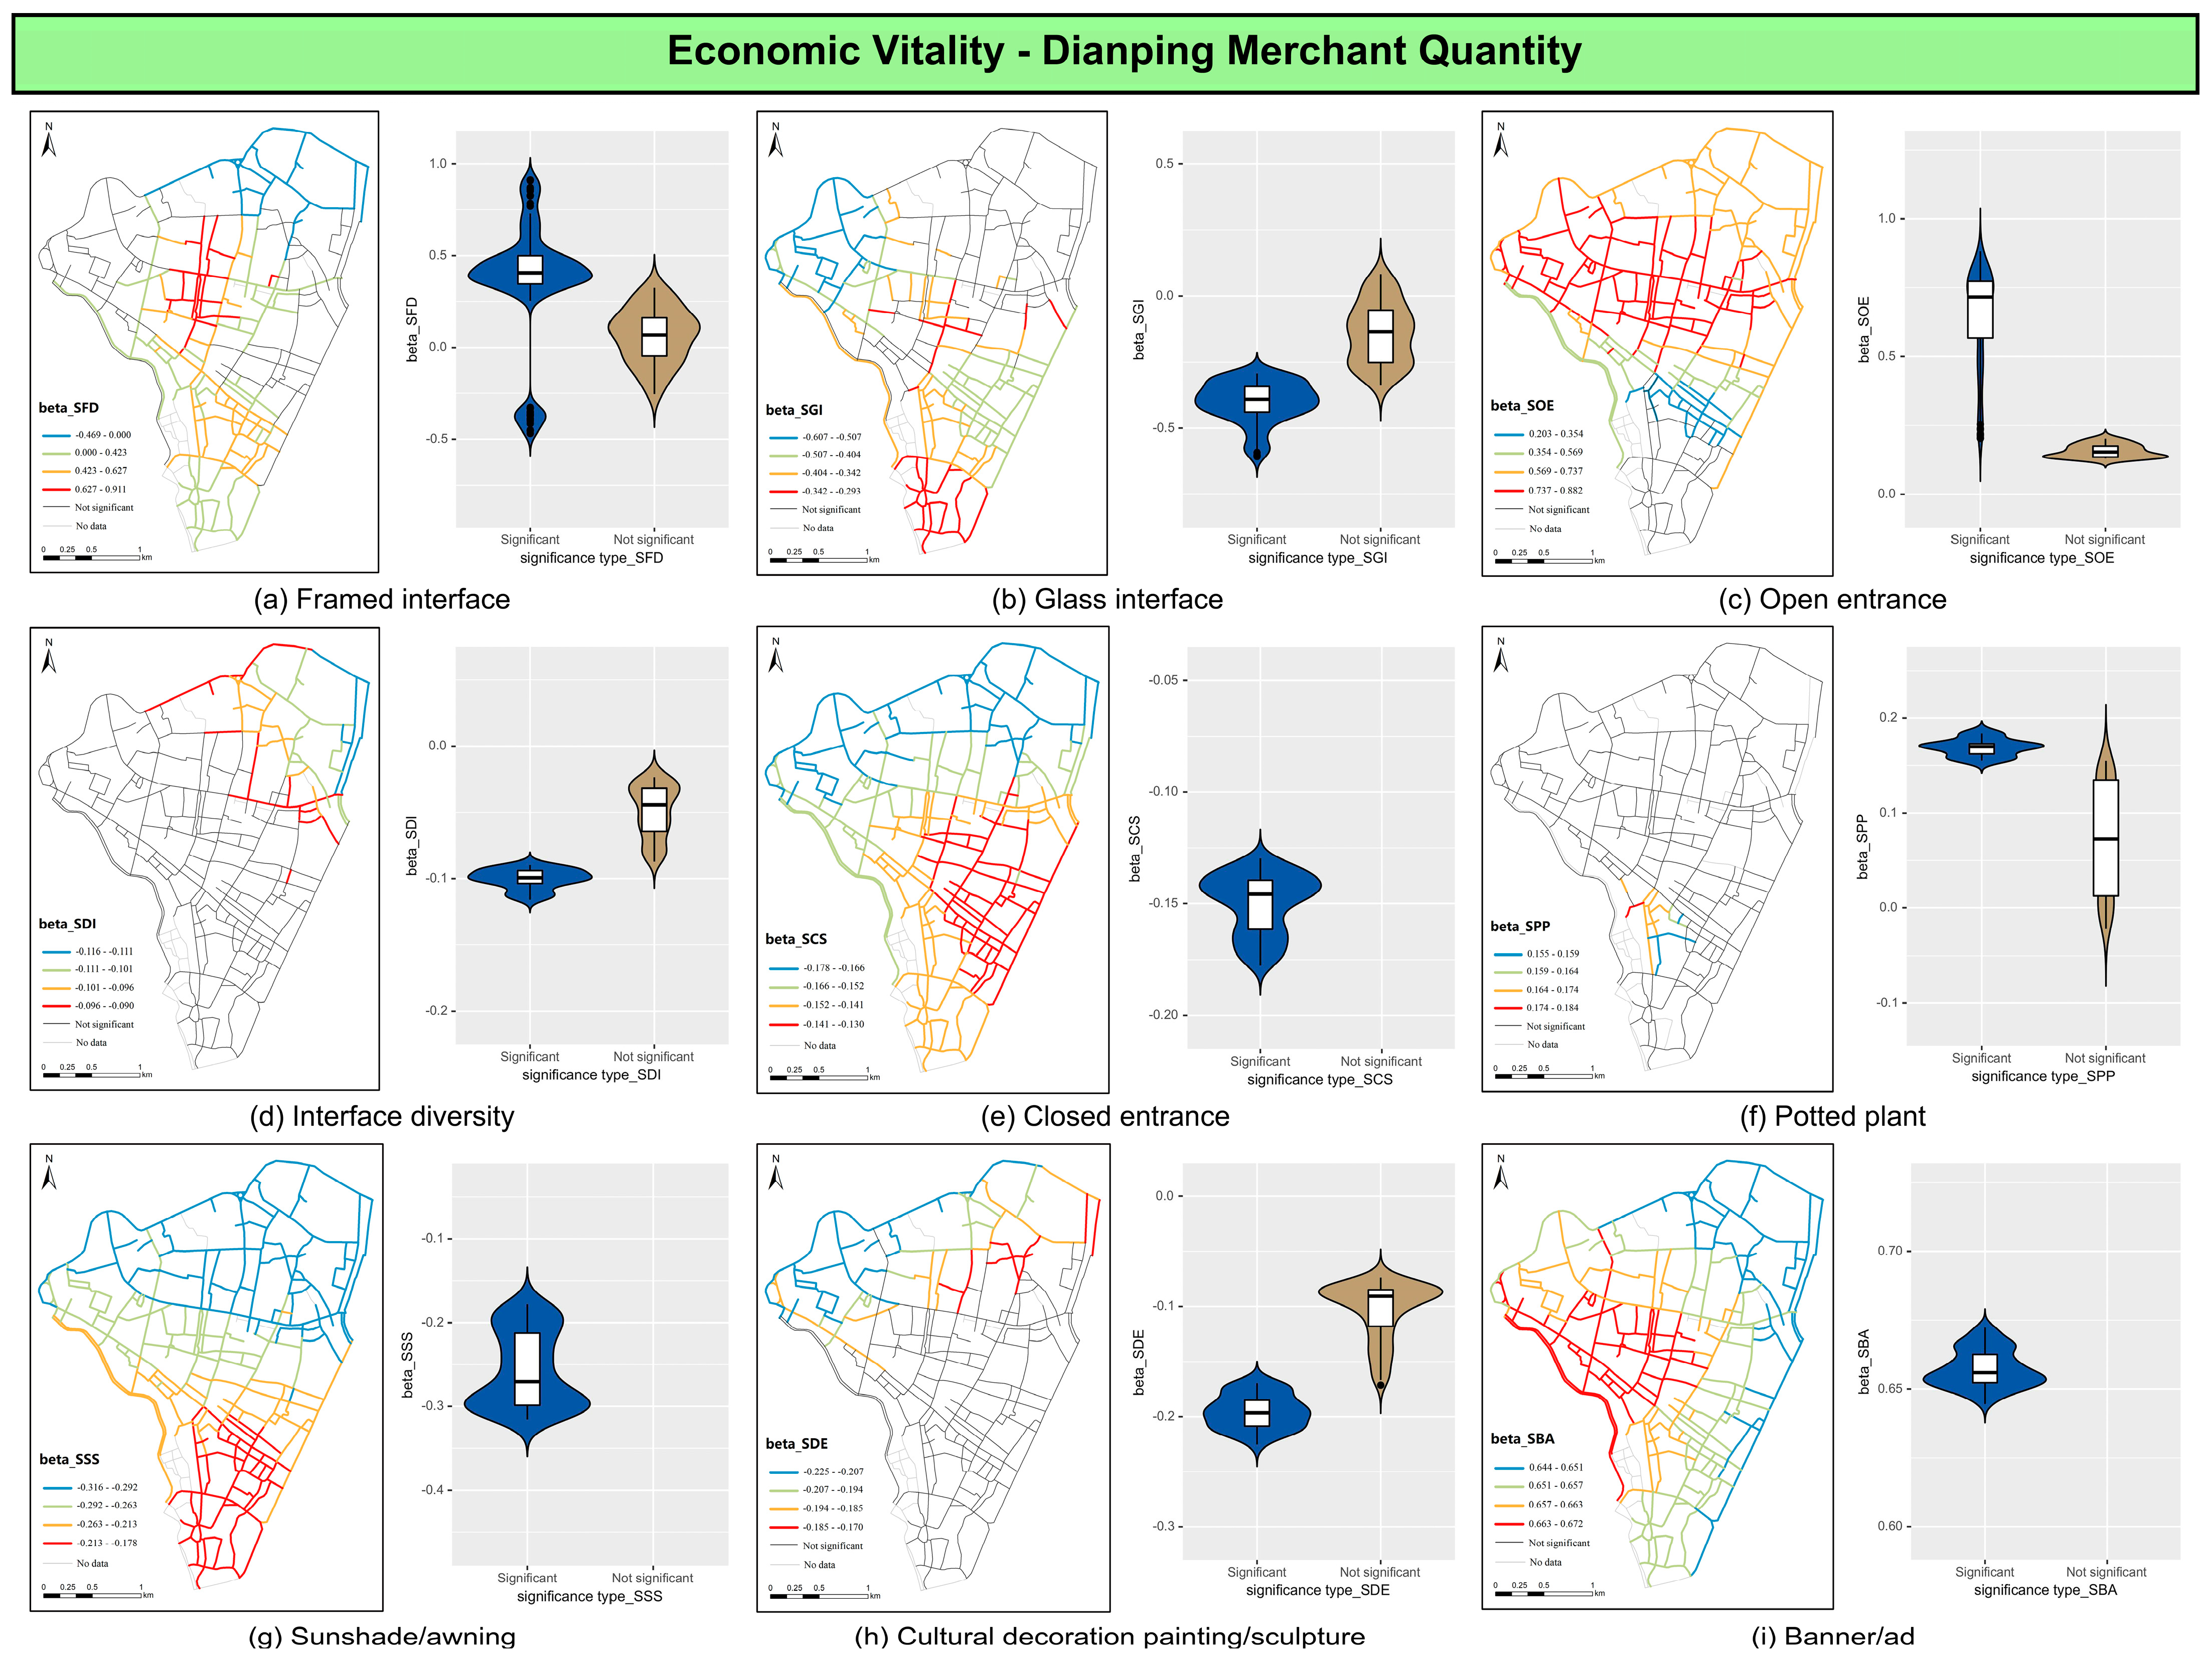
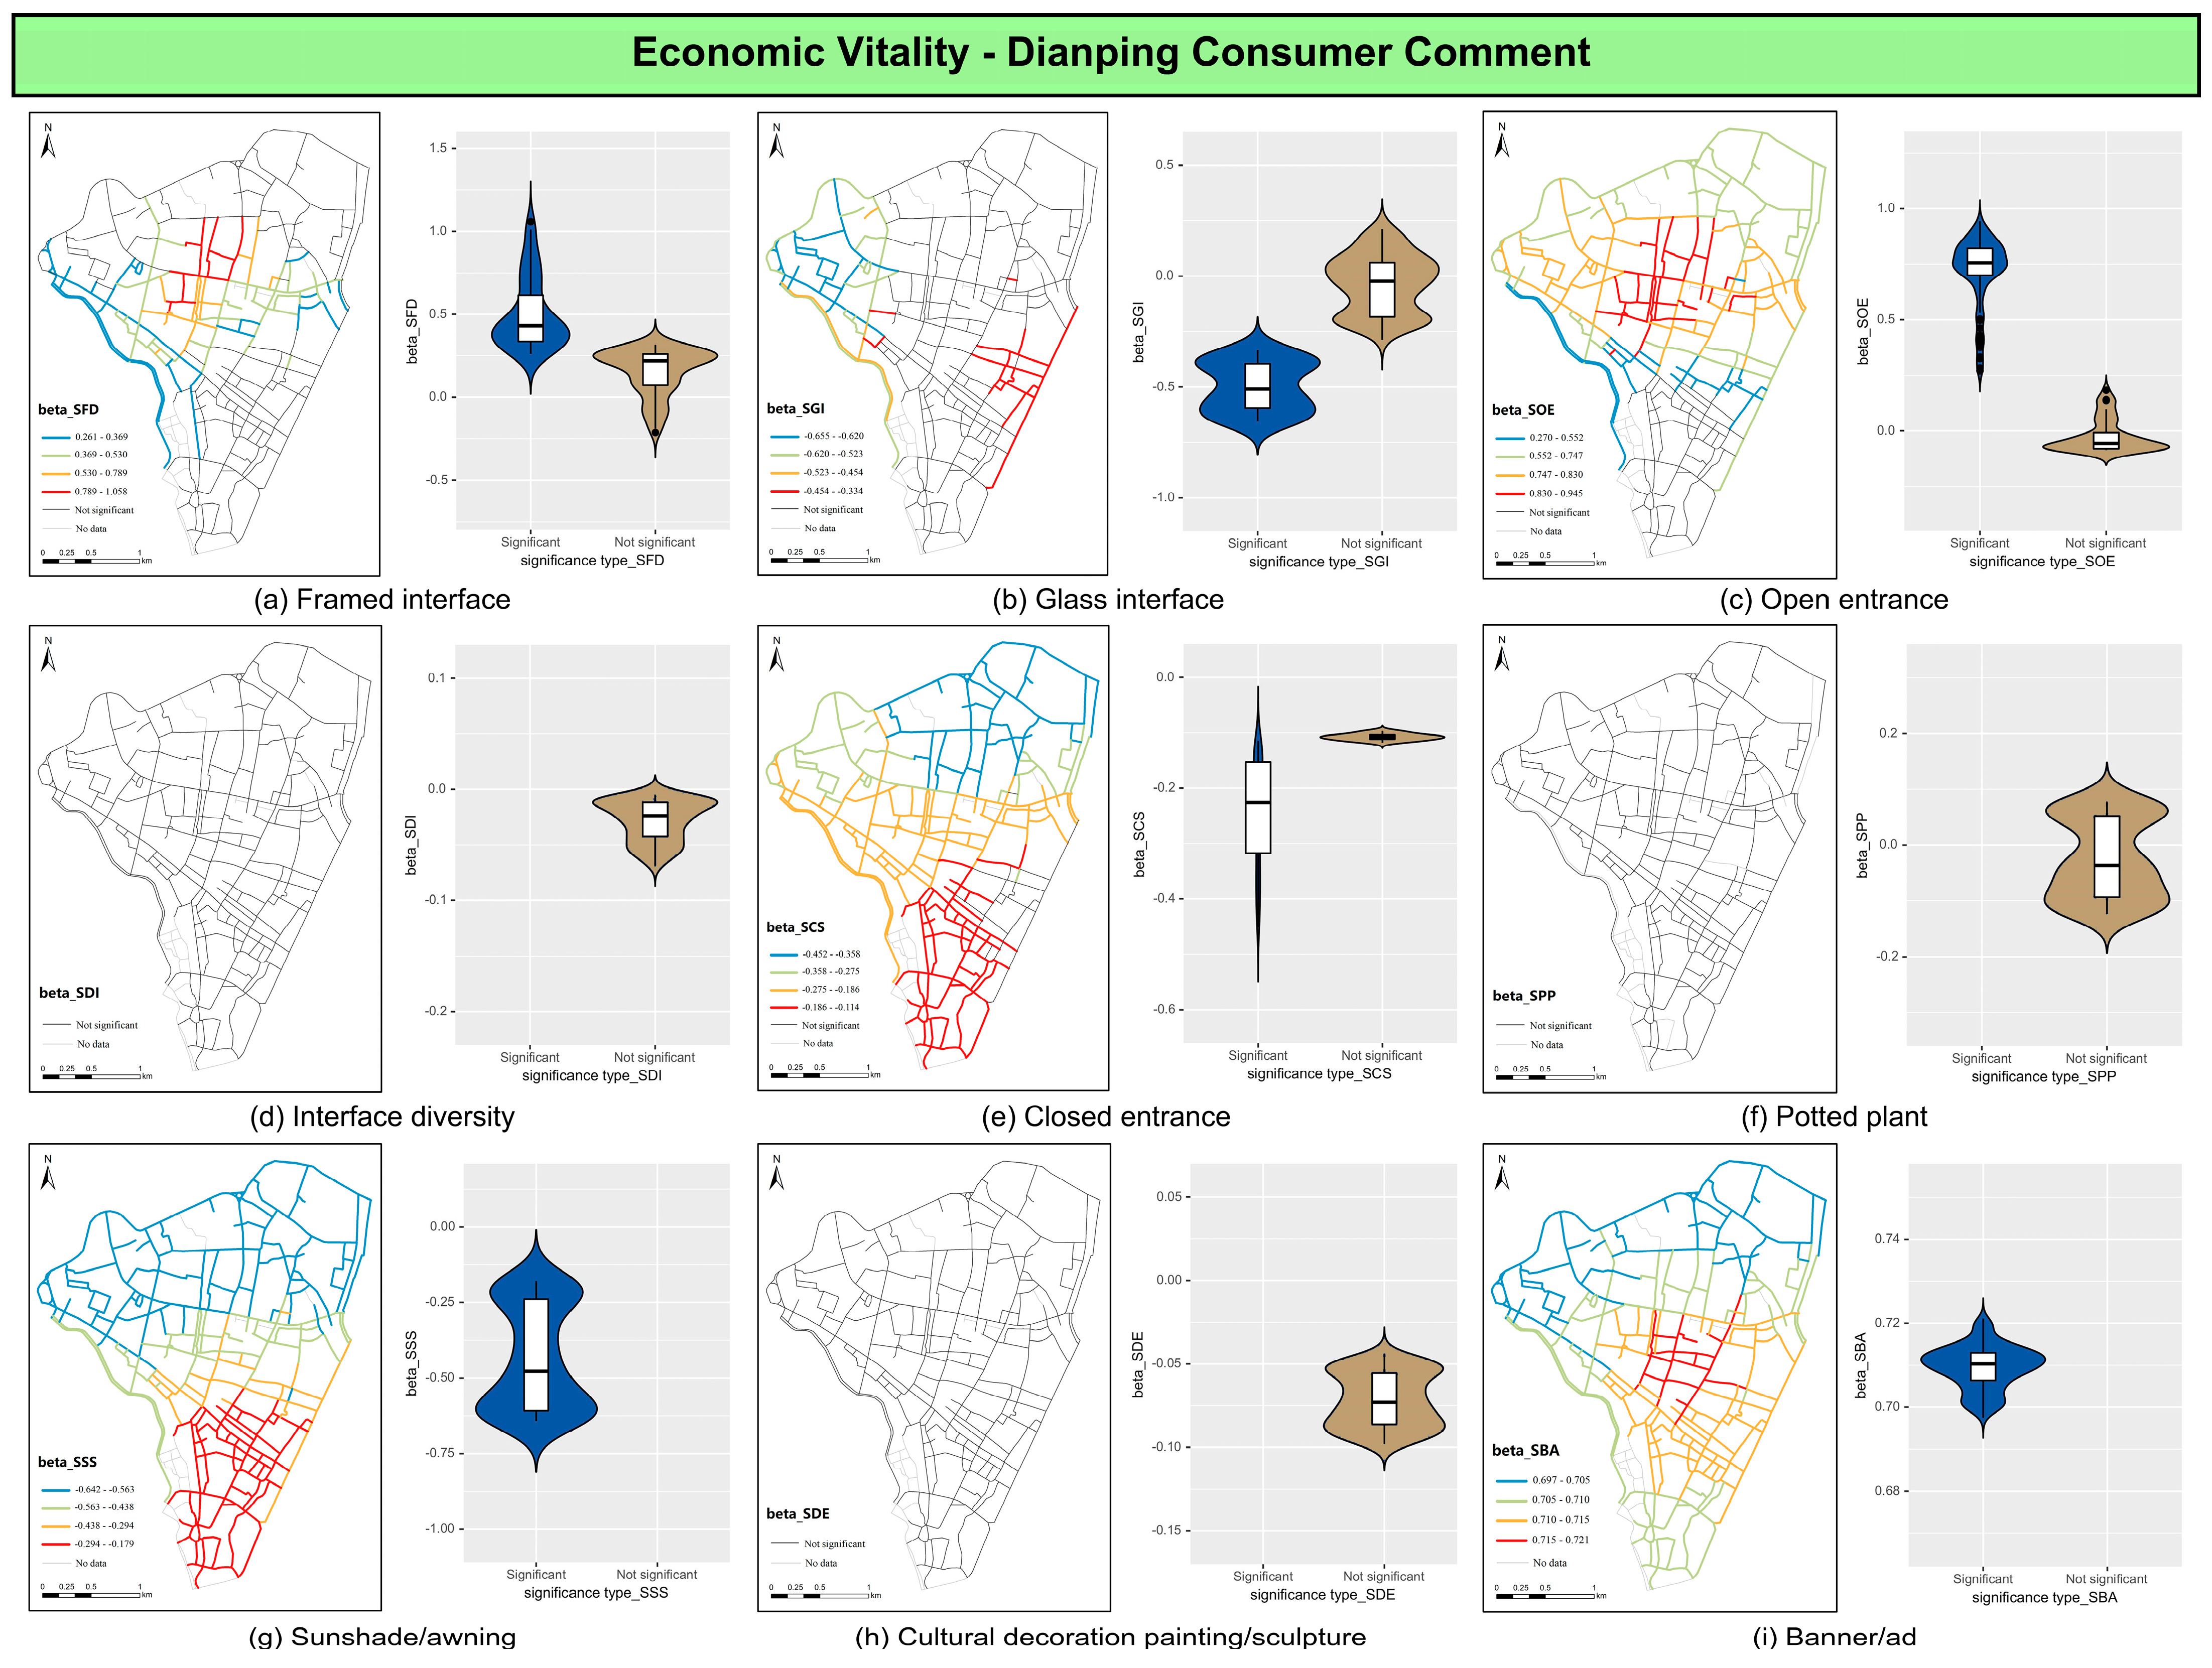
4.3.2. Impact of Spontaneous Streetscape Features on Economic Vitality

The local parameter estimates of the spontaneous streetscape on the economic vitality and the significance performance are shown in Figure 8 and Figure 9. Overall, it can be interpreted through the spatial distribution and variation of regression coefficients, and the driving mechanisms of each element. First, spontaneous streetscape elements generally exhibit clustering and transitional features, reflecting the strong spatial heterogeneity of the impact. Second, the influence tendency between spontaneous spatial elements and the economic vitality can be divided into three categories, except for the insignificant estimates for some elements. The first category, such as open entrances, banners and ads, can exert a positive effect, while the second type, like closed store interfaces, sunshades and awnings, shows significantly negative correlations. Furthermore, some elements may exhibit polarizing characteristics to some extent, which means that their coefficients are significantly positive in some street segments and significantly negative in others. Still, the regression coefficients of varied spontaneous streetscape features have some differences for the two proxies of economic vitality; thus, the two sets of results are interpreted separately, as follows.
Dianping Merchant Quantity as the Proxy of Economic Vitality
Specifically, the above three significant categories exist for all the independent variable when taking DMQ as the dependent variable. In terms of the elements that exert a positive influence, SOE, SPP, and SBA are included. Among them, the commercial type of elements, namely SBA, has the smallest standard deviation, as the upper and lower quartiles are 0.66 and 0.65, respectively. Its relatively stable positive driving force reflects the broad adaptability in promoting the perception of online economic vitality. On the other hand, the open entrance interface (i.e., SOE) has demonstrated larger variations, with the upper and lower quartiles of 0.77 and 0.58. While it possesses relatively low positive intensity in most of the area near Tumen Street, a higher driving intensity is reflected in the streets and alleys along the axis of West Street and East Street. Furthermore, the proxy of SPP also shows a significantly positive impact in limited segments along the north part of Zhognshan South Road.
The spontaneous streetscape elements that are negatively correlated with DMQ can be ranked from high to low according to the absolute value of the significantly median regression coefficient in parentheses as follows: SGI (−0.391), SSS (−0.270), SDE (−0.197), SCS (−0.146), and SDI (−0.099). Among them, the glass interface shows a high and negative driving force in the northwest of the Old City, and the diffusion gradients weaken towards the southeast. Similarly, while sunshades and awnings have a lower driving intensity in the streets located south of Tumen Street, they exhibit a relatively higher negative driving intensity in the large areas north of West Street and East Street. The intensity attenuation of the cultural elements from northwest to southeast is mainly influenced by the relatively concentrated distribution of the cultural elements. Although the node-like cultural buildings, such as Linzhang Gate and Chaotian Gate along the north outline of the Old City, act as good indications of the city’s image and urban history, the adoption range is too limited and non-systematic. The negative impact presented by the closed interface is consistent with our general understanding, which can be partly reflected by the significant results in all the effectively measured street segments. Its spatial variation mainly indicates the sensitivity of different regions’ economic vitality to the negative interfaces. The negative driving intensity of the interface diversity index in the northeast of the Old City is high, which may be related to the relatively limited daily consumption scenarios dominated by the surrounding large-scale communities.
The interfaces of framed doors and windows exhibit a polarizing correlation across the entire area, demonstrating both a strong positive impact in the adjacent alleys of the eastern section of West Street, and a strong negative driving intensity in the northern area of the Old City. This can also be reflected in the two concentration areas in the violin plot. With a relatively traditional and historical charm, the pedestrian street blocks represented by the eastern section of West Street have gathered a large number of residents and tourists, which attracts more categories of small businesses, like catering, drinking, and specialty snacks. Therefore, the businesses that tend to operate indoors and use the framed interfaces can not only provide a distinctive place for people to relax and enjoy the traditional flavor, but also avoid the adverse effects on the historical style of the streetscape. The small measures can help to obtain a balance between the multifaceted needs of related stakeholders. On the other hand, as the northern region has relatively scattered flow of people and the greatly changing street environment, the framed interfaces in this area are negatively correlated to DMQ.
Dianping Consumer Comments as the Proxy of Economic Vitality
When taking DCC as the dependent variable, categories of streetscape elements with significantly positive and negative impact exist. Furthermore, there are also some proxies with totally insignificant performance in the study area, such as SDI, SPP, and SDE. Compared to the results of DMQ, the difference may indicate the varied influence between the supply and consumer ends, although they were both chosen as proxies of economic vitality.
Specifically, the proxies of SFD, SOE, and SBA all present positive correlations with DCC. In the whole area, the regression coefficients of SBA are close to 0.71. The street network in the central part of the Old City has a slightly higher value, with a small interval between 0.697 and 0.721. All these indicate that the commercial elements, including advertisements and banners, have shown a stable and significantly positive impact on DCC, as with the effect on DMQ. On the other hand, the value ranges of the estimates of SFD and SOE are similar and share a larger variance. The high-value areas of them are in the central area, near the eastern part of West Street. Although both of them have some insignificant segments, the significant group of SOE reflects an obviously higher driving intensity than the insignificant one. Furthermore, the median value of SOE (0.751) is also higher than that of SFD (0.431).
The proxies of SCS, SSS, and SGI all appear to have a negative influence on DCC. Among them, the former two basically show a significantly negative effect from every street segment. The distributions of their estimates also share a similar structure of spatial gradient, with a stronger negative performance in the northern part and a smaller absolute value in the southern area located south of Tumen Street. In terms of their numerical performance, the median of SCS (−0.226) is larger than that of SSS (−0.478), indicating a weaker negative effect on DCC. Actually, as the negative association of SCS is understandable, the variation of its esti-mates may be influenced by the types of storefronts, with different sensitivities. This might partly explain the smaller absolute values in the southern part of the Old City. Wholesalers of daily necessities and hardware processing industry are the dominant store types in that area; both are demand-oriented and not usually deemed to be businesses that have strong dependence on the conditions of nearby economic entities. Similarly, the effect from the SSS also has the relatively smaller absolute value in the southern area. In addition, unlike SCS and SSS, which have a wide distribution of significant results, SGI only shows a scattered pattern in limited segments of the eastern and western areas. The higher negative driving force in the eastern area may correlate with the insufficient demand for the display consumption characteristics, as usually realized through large and transparent glass interfaces.

4.3.3. Impact of Spontaneous Streetscape Features on Social Media Perception

The impact of the spontaneous streetscape elements on the social media perception is illustrated in Figure 10 and Figure 11. Likewise, the spatial distribution of regression coefficients of the independent factors basically exhibits significant clustering and transitional characteristics, as well as strong spatial heterogeneity. From the perspective of driving mechanisms, the spontaneous streetscape elements with differentiated impacts on the social media perception can also be divided into the following three types: the first category, like SPP, shows a clear positive influence; the second one, like SCS, can exert negative impacts; the third one presents polarizing features. Besides, although the regression estimates of some elements are insignificant, their statistical characteristics are illustrated in the violin plots as well. Similarly, interpretations based on different dependent variables are explained separately.
Weibo Check-In Quantity as a Proxy of Social Media Perception
In the case of WCQ as the dependent variable, the elements of SOE, SPP, and SBA show significantly positive correlation in almost every street segment of the Old City. Among them, the regression coefficients of open entrance interfaces, banners, and advertisements have a smaller range of values ([0.308,0.417] for SPP, and [0.489,0.552] for SBA), and the median of SBA (0.516) is higher than that of SPP (0.367), indicating a stronger positive impact. On the other hand, as the estimate of SOE has a greater range ([0.312,0.721]), its median (0.661) is the largest of the three. In terms of the distribution, the high-value segments of SPP mainly agglomerate near Tumen Street, while the western part of the Old City shows a stronger driving force of SBA. With a larger spatial gradient, SOE has a higher performance in the central pedestrian streets and the northwestern area.
The elements with significantly negative impacts can be sorted by the absolute value of the median regression coefficients as SFD (−0.508), SSS (−0.338), and SCS (−0.205). Among them, the segments with significant estimates of SFD are rather limited and are mainly located in the northern part of the Old City. The proxy of SSS exhibits a high negative driving intensity in a large area located north of West Street and East Street. This may be not only related to the lack of distinctive check-in attractions near the high-level traffic streets, such as Chengbei Road, but also to people’s short-term consumption experience and “lagging” check-in behavioral habits in the main streets represented by West Street. On the other hand, the significantly negative driving intensity of SCS decreases from Wenling South Road and Wenling north Road to the central area. Considering that the southeastern boundary is near several clusters of commercial centers and squares, the gradient may be correlated with the massive influx of pedestrians and the requested continuous social places.
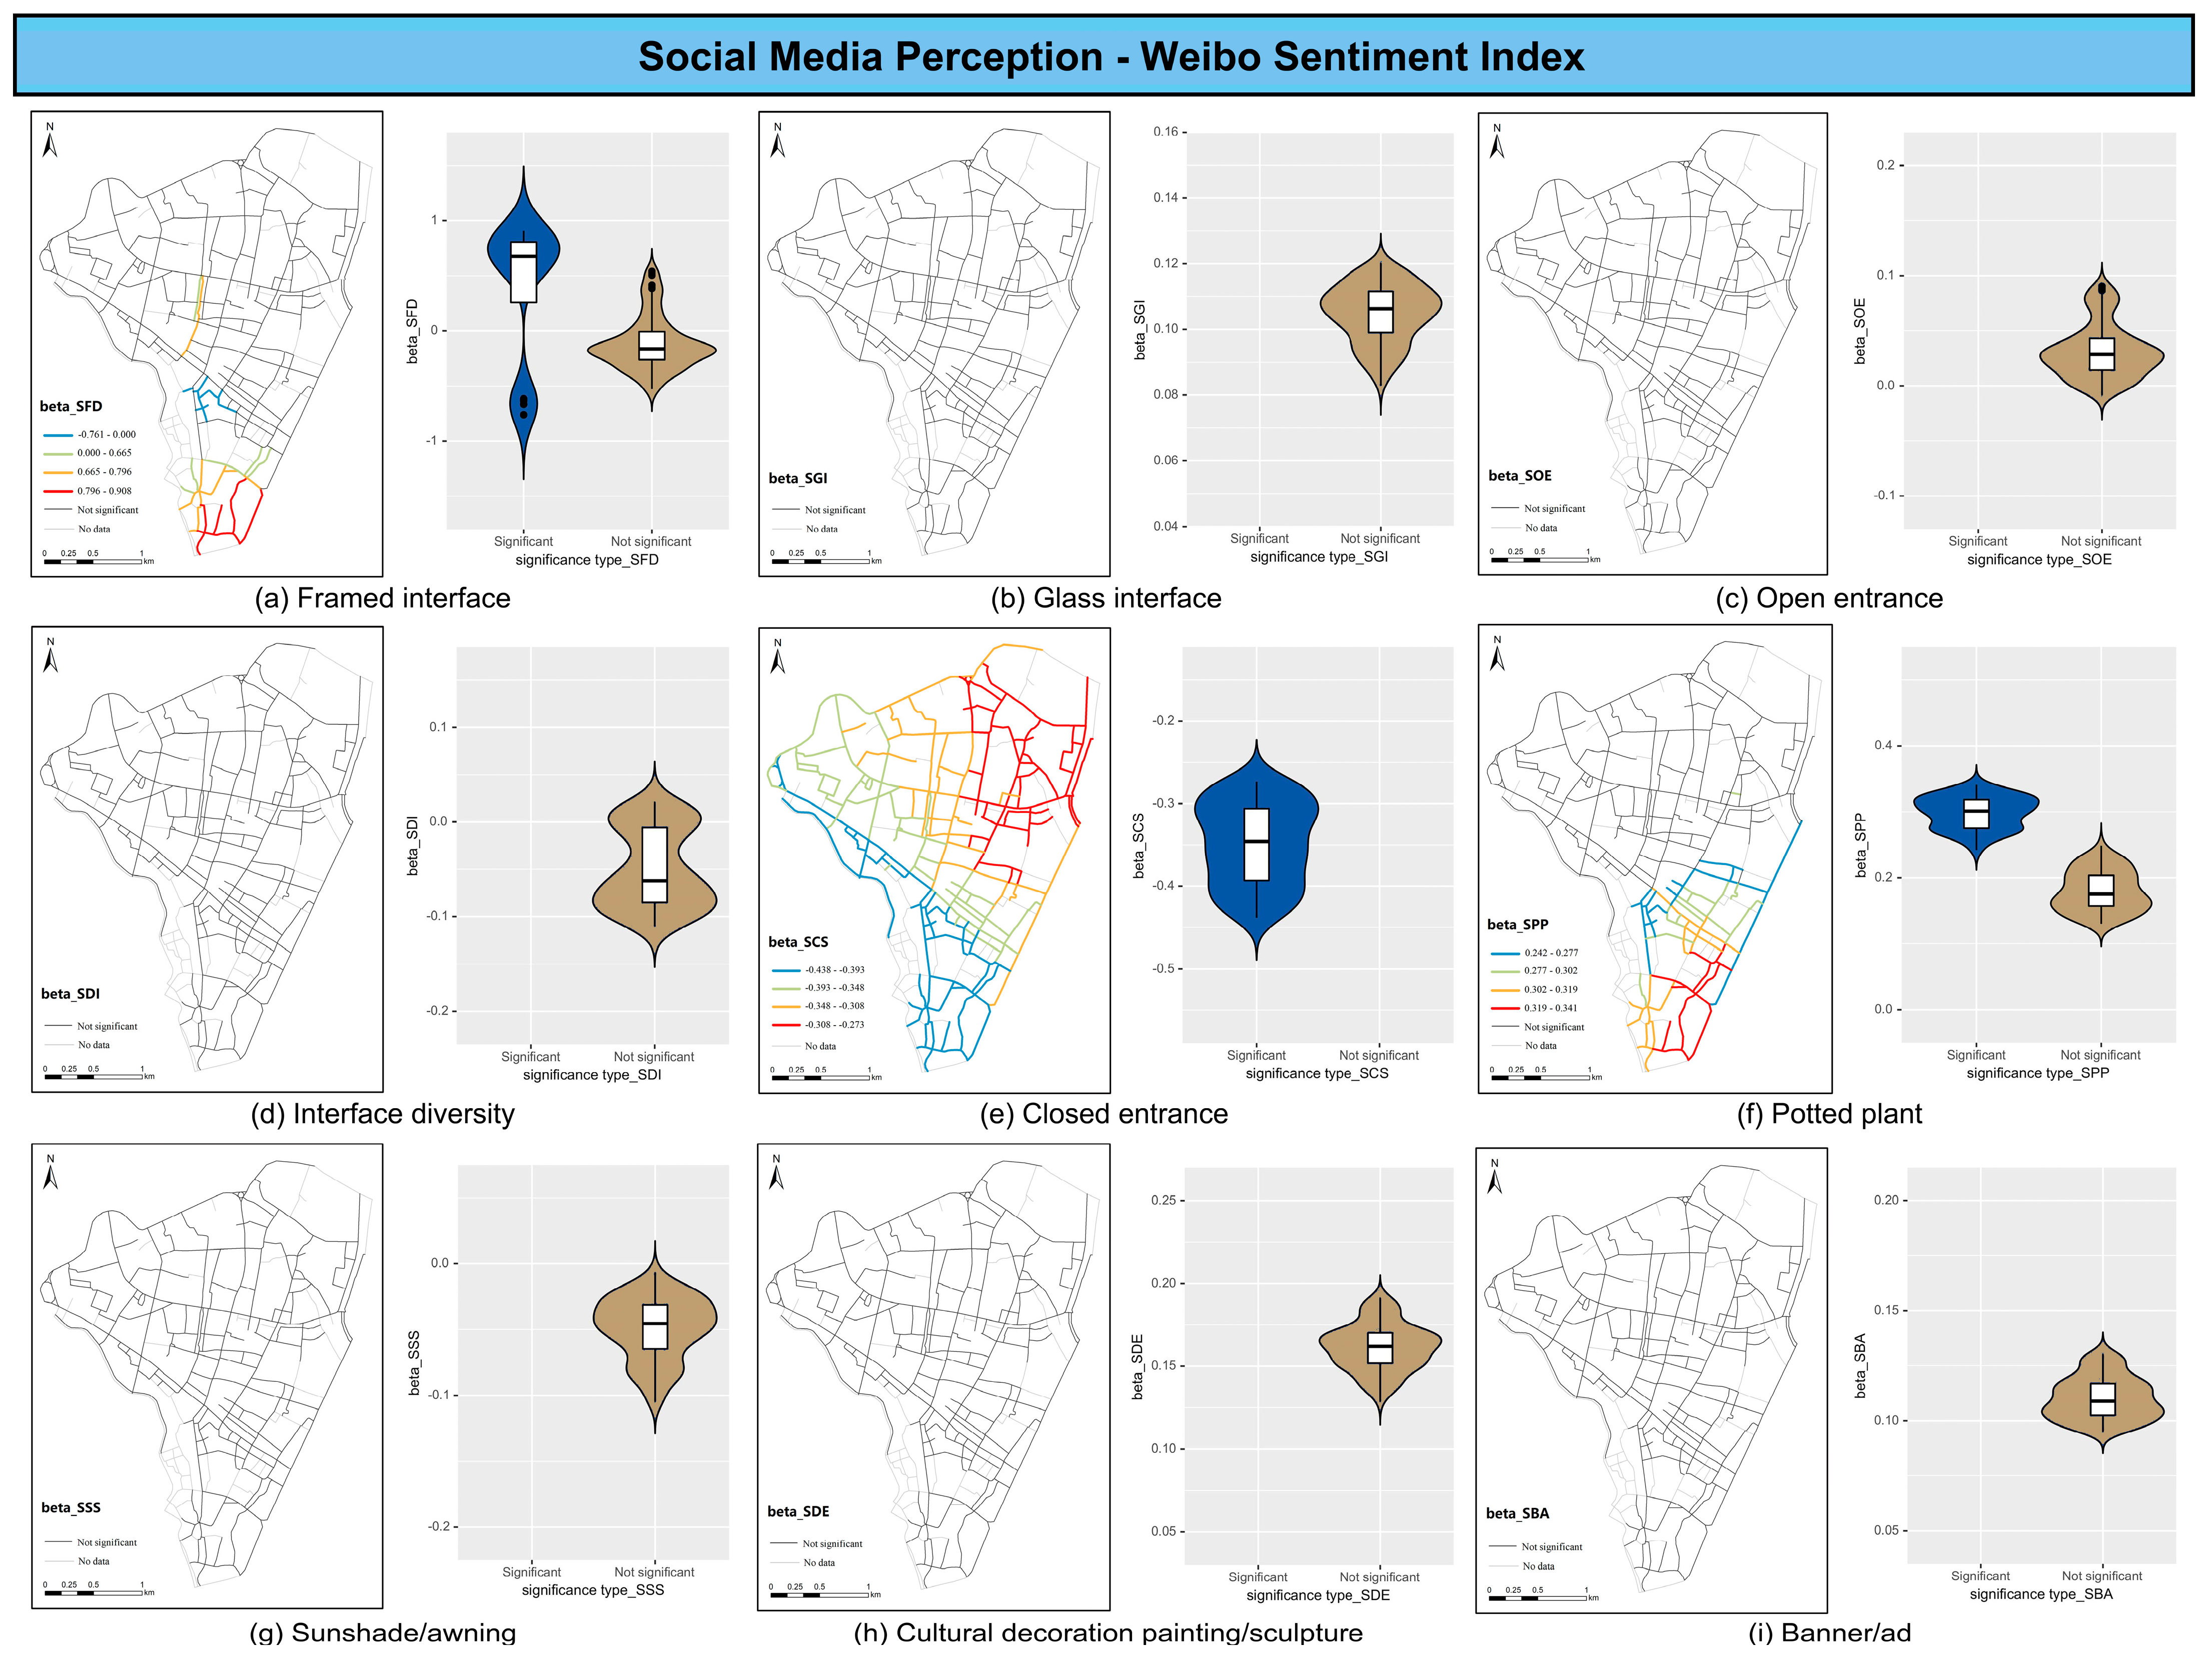
Weibo Sentiment Index as the Proxy of Social Media Perception
When taking WSI as the dependent variable, only three independent proxies show significant regression estimates. The other six categories of elements, including SGI, SOE, SDI, SSS, SDE, and SBA, present insignificant results over the whole area.
The proxy of SPP has shown a significantly positive impact on WSI in the southern and southeastern parts, with a range between 0.242 and 0.341 and a median of 0.301. Like the barbell-shaped violin plot in Figure 8, SFD also shows a polarizing correlation. On the one hand, it exhibits a significantly negative driving force in several segments, such as Yanzhi Alley and Yanggong Alley, with coefficients of about −0.7. On the other hand, it presents significantly positive estimates in Haogouqian Alley and in the southern area of the Old City, with a median of about 0.7. As opposed to the limited distribution of effective results of the other two proxies, SCS has a significantly negative impact on WSI in nearly every segment. With the upper and lower quartiles of −0.31 and −0.39, respectively, it shows a relatively stronger negative driving force in the areas located south of Xinmen Street and Tumen Street, and a weaker negative intensity in the northeastern part of the Old City.

5. Discussion and Conclusions

As a complement to top-down streetscape creation, the spontaneous streetscape is closely related to individual subjective initiatives. If these approaches are integrated together, we can strive for a better balance between societal efficiency and order and humanized tenderness and vitality. To fully understand how the spontaneous streetscape influences diversified social sensing, both a fine-grained identification of the spontaneous streetscape elements from the perspective of the supply end of streetscapes, and a data fusion framework at a relatively large scale is required. However, previous studies have either focused on few examples with low-throughput surveys or lacked specific consideration of spontaneous features in the data-driven explorations. Furthermore, the impact of spontaneous streetscape features on diversified social sensing has rarely been examined. Given the context, this paper first categorized the spontaneous streetscape elements, by taking the existing micro-scale visual identification method, functions and ownership of the spontaneous elements into consideration. Taking the Old City in Quanzhou as a case, the study then adopted the mobile collection of SVIs and a machine learning algorithm to establish a set of indexes of spontaneous streetscape features, followed by mapping the distribution of economic vitality and social media perception from two large open platforms, namely Dianping and Sina Weibo. Finally, the impacts of the spontaneous streetscape features on both dimensions of social sensing were revealed using multiple regression models. The main results comprise the following two aspects:
(1)
Overall, the spontaneous streetscape features have a certain similarity in terms of their impact on both dimensions of social sensing in Quanzhou, indicating significant clustering and transitional trends and strong spatial heterogeneity.
(2)
Specifically, the spontaneous streetscape elements can be divided into three categories, given their differentiated roles of significantly positive, negative, and polarizing impacts on the social sensing results.
The idea of using computer vision techniques to identify and map the spontaneous streetscape elements at an (intra)urban scale is one of our main contributions. To the best of our knowledge, this is the first paper to conduct such explorations. Compared to the other related literature on urban street studies, an important difference is to distinguish micro-scale spatial elements from their spontaneous counterparts in the study. Although many scholars have exploited multifaceted applications of SVIs to reveal some vital implications concerning refined physical environments, socioeconomic development, and urban perception [30,64,65], the universal framework is primarily used as a tool for all-factor identification scenarios. However, it should be noted that so-called visual precision is still a relative concept under the existing technological context. Although it has been proven to work reasonably well for micro-scale streetscape components, like streetlights, poles, signboards, etc., the ownership details of these elements are complex, and, as such, they can hardly be used to support urban regeneration practices [16,35]. This is particularly true with the transformation from large-scale incremental construction to stock optimization. In this regard, therefore, we explored a feasible approach to visually identify the spontaneous streetscape-related elements that are usually involved in a localized area and used by roadside storefronts. The workflow is not limited to the coarse classification of “building” and “sign” types, nor just store interfaces, as we have examined previously [11]. Drawing on more elements from the spontaneous spatial studies can make this field of study more systematic.
As the main aim of the paper, we further revealed the impact of spontaneous streetscape features on two dimensions of social sensing, namely economic vitality and social media perception. On the one hand, as we investigated the storefronts as the supply end of streetscapes, exploring the correlation with economic vitality is both a natural association and a beneficial attempt to enrich the interpretation of urban vitality. In Jane Jacobs’ discourse about Manhattan, the seemingly common retail sector and catering businesses that were under decay were closely correlated with the depression of street life [32]. A similar viewpoint about the significance and vitality component of various individual-owned shops can be found in Maas’ doctoral thesis [66]. Despite these classic discussions, however, investigating the economic vitality from the supply end of streetscape components is still scarcely conducted. Using the latest social sensing data from third-party platforms, like Dianping, our methodology is consistent with the related existing research in terms of data sources [58,67]. Besides, we also utilized another dimension of social sensing, namely social media perception, to explore the correlation with spontaneous streetscape features. Similarly, both types of data were also adopted by Long and Huang (2019) to indicate economic vitality [59]. Given the initial aim and common use scenarios of Sina Weibo, we consider whether social media data are a direct source for large-scale economic assessment. In addition, scholars have found an obvious agglomeration tendency with social media data, such as in limited tourist attractions and scenic spots [47]. Therefore, we decided to use social media perception to demonstrate a kind of online popularity and vitality for the statistical unit of street segments.
Apart from the theoretical discussions, the results of this study can perhaps provide some inspiration for urban street planning and design practices. For example, due to the positive impacts on social sensing, areas for open entrance interfaces, spontaneous potted plants, and commercial elements can be purposefully reserved and added to storefronts. This is also consistent with some proposals on vibrant street construction in some guidelines of Chinese cities, like the Shanghai Street Design Guidelines [68]. However, there are still some differences. Under the target of comfortable activities, for instance, while the movable elements including sunshades and awnings can create more grey space and bring a richer offline spatial experience, there may be a reduction in the marginal benefits for some popular streets and alleys driven by online social sensing, and a significantly negative impact is even likely to appear. Besides, our results also reveal that there is probably a significantly negative or insignificant impact of the interface diversity index and the use of cultural elements on social sensing. We do believe in the significance of the proposals, such as diverse streetscape and highlighting regional and cultural symbols, as general guidelines of street design. However, planners and designers should be more cautious, especially from an (intra)urban scale. In addition, if a street is mainly dominated by online users, the disconnection between offline experience and online sensing may be different, and the influence should be considered carefully by urban planners and designers. With the flourishing development of agglomerated online retail sectors in the digital era, the corresponding streetscapes with the abovementioned transformed demand cannot be ignored.
The study also has some limitations that should be highlighted. First, the classification of streetscape elements in the study does not include all the related spontaneous spatial counterparts. Through on-site surveys and observation, for example, some behaviors causing changes in the material conditions and microtopography (e.g., steps) are the result of spontaneous spatial practices in some prior literature. They are excluded from our classification mainly because they are both seldom and difficult to consider in the mainstream computer vision techniques based on SVIs. However, further related spontaneous elements can be added in the future. Second, although the social sensing dimensions have been taken into consideration, the related exploitation was not very deep, due to us placing more focus on spontaneous streetscape digital identification and interpretation. Given the rich tags and high spatiotemporal resolution of the social sensing data, more detailed dimensions can be further explored.
In addition to the further expansion of spontaneous elements and multifaceted dimensions of social sensing, we also attempt to highlight some future directions from the perspective of mobile collection and data fusion. First, portable and low-cost sensors can help to perceive the pulses of diverse socio-spatial aspects. As many scholars have noticed, despite the limitations of large commercial platforms in terms of data availability, quality, and timeliness, humans as sensors can collect the requested data wherever they walk, ride, or drive. To gather numerous lively samples of bottom-up practices, like spontaneous space surveys, this approach could be quite useful. As the elements selected in the study basically belong to the common streetscape components, future explorations can be conducted in the urban street space of more regions. Second, from the perspective of data-aided planning and design practices, we also suggest that future studies should explore a flexible framework to integrate the multisource data and their specific implications for socioeconomic sensing. If the results in the socioeconomic dimension are different from or contradictory to the other, this can be useful, especially for urban planners, designers, and decisionmakers.

Author Contributions

Conceptualization, K.L.; methodology, K.L.; software, K.L.; validation, K.L.; formal analysis, K.L.; investigation, K.L.; resources, K.L.; data curation, K.L.; writing—original draft preparation, K.L.; writing—review and editing, K.L. and Y.L.; visualization, K.L.; supervision, Y.L.; project administration, K.L. and Y.L.; funding acquisition, Y.L. All authors have read and agreed to the published version of the manuscript.

Funding

This research was funded by the National Natural Science Foundation of China, grant number 52308040.

Data Availability Statement

The data presented in this study are unavailable due to privacy restrictions.

Conflicts of Interest

The authors declare no conflicts of interest.

References

  1. Shang, W.; He, C.; Lv, S. Sustainable Renewal of Spontaneous Spatial Characteristics of a Historical–Cultural District: A Case Study of Tanhualin, Wuhan, China. Sustainability 2023, 15, 2038. [Google Scholar] [CrossRef]
  2. Zhang, W.; Xin, J. Green Spaces and the Spontaneous Renewal of Historic Neighborhoods: A Case Study of Beijing’s Dashilar Community. Sustainability 2023, 15, 16566. [Google Scholar] [CrossRef]
  3. Hartmann, T.; Jehling, M. From diversity to justice-Unraveling pluralistic rationalities in urban design. Cities 2019, 91, 58–63. [Google Scholar] [CrossRef]
  4. Baharoglu, D.; Leitmann, J. Coping Strategies for Infrastructure: How Turkey’s Spontaneous Settlements Operate in the Absence of Formal Rules. Habitat Int. 1998, 22, 115–135. [Google Scholar] [CrossRef]
  5. Itma, M.; Monna, S. Sustainable Housing Design Potentials in Palestine: A Focus on the Spontaneous Urban Design Form. J. Urban Plan. Dev. 2024, 150, 04023050. [Google Scholar] [CrossRef]
  6. Li, J.; Wang, F.; Wuzhati, S.; Wen, B. Urban or village residents? A case study of the spontaneous space transformation of the forced upstairs farmers’ community in Beijing. Habitat Int. 2016, 56, 136–146. [Google Scholar] [CrossRef]
  7. Cozzolino, S. On the spontaneous beauty of cities: Neither design nor chaos. Urban Des. Int. 2022, 27, 43–52. [Google Scholar] [CrossRef]
  8. Wang, F.; Liu, X.; Zhang, Y. Spatial landscape transformation of Beijing compounds under residents’ willingness. Habitat Int. 2016, 55, 167–179. [Google Scholar] [CrossRef]
  9. Shen, J.; Lin, L. State-sponsored and spontaneous urbanization in Fujian province of China, 1982–2010. Cities 2017, 60, 420–427. [Google Scholar] [CrossRef]
  10. Zhou, L.; Wang, T. Social media: A new vehicle for city marketing in China. Cities 2014, 37, 27–32. [Google Scholar] [CrossRef]
  11. Li, K.; Lin, Y. Exploring the Correlation between Streetscape and Economic Vitality Using Machine Learning: A Case Study in the Old Urban District of Xuzhou, China. ISPRS Int. J. Geo-Inf. 2023, 12, 267. [Google Scholar] [CrossRef]
  12. Ali Qalati, S.; Li, W.; Ahmed, N.; Ali Mirani, M.; Khan, A. Examining the Factors Affecting SME Performance: The Mediating Role of Social Media Adoption. Sustainability 2021, 13, 75. [Google Scholar] [CrossRef]
  13. Zhang, Z.; Wang, X.; Zhu, G.; Zhang, W.; Chen, L.; Fang, K.; Xie, Y.; Shen, M.; Furuya, N. A micro-scale study on the spontaneous spatial improvement of in-between spaces in Chinese traditional districts considering the relationship between modifications and encroachment. J. Asian Archit. Build. 2023, 22, 783–801. [Google Scholar] [CrossRef]
  14. Jeon, J.; Woo, A. Deep learning analysis of street panorama images to evaluate the streetscape walkability of neighborhoods for subsidized families in Seoul, Korea. Landsc. Urban Plan. 2023, 230, 104631. [Google Scholar] [CrossRef]
  15. Chen, S.; Biljecki, F. Automatic assessment of public open spaces using street view imagery. Cities 2023, 137, 104329. [Google Scholar] [CrossRef]
  16. Larkin, A.; Gu, X.; Chen, L.; Hystad, P. Predicting perceptions of the built environment using GIS, satellite and street view image approaches. Landsc. Urban Plan. 2021, 216, 104257. [Google Scholar] [CrossRef]
  17. Koo, B.W.; Guhathakurta, S.; Botchwey, N.; Hipp, A. Can good microscale pedestrian streetscapes enhance the benefits of macroscale accessible urban form? An automated audit approach using Google street view images. Landsc. Urban Plan. 2023, 237, 104816. [Google Scholar] [CrossRef]
  18. Gong, Z.; Ma, Q.; Kan, C.; Qi, Q. Classifying Street Spaces with Street View Images for a Spatial Indicator of Urban Functions. Sustainability 2019, 11, 6424. [Google Scholar] [CrossRef]
  19. Huang, Y.; Zhang, F.; Gao, Y.; Tu, W.; Duarte, F.; Ratti, C.; Guo, D.; Liu, Y. Comprehensive urban space representation with varying numbers of street-level images. Comput. Environ. Urban Syst. 2023, 106, 102043. [Google Scholar] [CrossRef]
  20. He, J.; Zhang, J.; Yao, Y.; Li, X. Extracting human perceptions from street view images for better assessing urban renewal potential. Cities 2023, 134, 104189. [Google Scholar] [CrossRef]
  21. Ma, X.; Ma, C.; Wu, C.; Xi, Y.; Yang, R.; Peng, N.; Zhang, C.; Ren, F. Measuring human perceptions of streetscapes to better inform urban renewal: A perspective of scene semantic parsing. Cities 2021, 110, 103086. [Google Scholar] [CrossRef]
  22. Rui, J. Measuring streetscape perceptions from driveways and sidewalks to inform pedestrian-oriented street renewal in Düsseldorf. Cities 2023, 141, 104472. [Google Scholar] [CrossRef]
  23. Lynch, K. The Image of the City; The MIT Press: Cambridge, MA, USA, 1960. [Google Scholar]
  24. Dunkel, A. Visualizing the perceived environment using crowdsourced photo geodata. Landsc. Urban Plan. 2015, 142, 173–186. [Google Scholar] [CrossRef]
  25. Huang, J.; Obracht-Prondzynska, H.; Kamrowska-Zaluska, D.; Sun, Y.; Li, L. The image of the City on social media: A comparative study using “Big Data” and “Small Data” methods in the Tri-City Region in Poland. Landsc. Urban Plan. 2021, 206, 103977. [Google Scholar] [CrossRef]
  26. Zahnow, R.; Verrier, J.; Hames, S.; Corcoran, J. Mapping and measuring neighbourhood social media groups. The case of facebook. Appl. Geogr. 2024, 172, 103415. [Google Scholar] [CrossRef]
  27. Jia, J.; Zhang, X.; Zhang, W. Between place attachment and urban planning in Jinan: Does environmental quality affect human perception in a developing country context? Land Use Pol. 2025, 148, 107384. [Google Scholar] [CrossRef]
  28. Kim, S.; Woo, A. Streetscape and business survival: Examining the impact of walkable environments on the survival of restaurant businesses in commercial areas based on street view images. J. Transp. Geogr. 2022, 105, 103480. [Google Scholar] [CrossRef]
  29. Zhang, A.; Li, W.; Wu, J.; Lin, J.; Chu, J.; Xia, C. How can the urban landscape affect urban vitality at the street block level? A case study of 15 metropolises in China. Environ. Plan. B Urban Anal. City Sci. 2021, 48, 1245–1262. [Google Scholar] [CrossRef]
  30. Zhang, F.; Zhou, B.; Liu, L.; Liu, Y.; Fung, H.H.; Lin, H.; Ratti, C. Measuring human perceptions of a large-scale urban region using machine learning. Landsc. Urban Plan. 2018, 180, 148–160. [Google Scholar] [CrossRef]
  31. Danish, M.; Labib, S.M.; Ricker, B.; Helbich, M. A citizen science toolkit to collect human perceptions of urban environments using open street view images. Comput. Environ. Urban Syst. 2025, 116, 102207. [Google Scholar] [CrossRef]
  32. Jacobs, J. The Death and Life of Great American Cities; Vintage Book Company: New York, NY, USA, 1961. [Google Scholar]
  33. Cambridge Dictionary. Available online: https://dictionary.cambridge.org/dictionary/english/spontaneity (accessed on 19 March 2025).
  34. Yuan, Y.; Wang, R.; Niu, T.; Liu, Y. Using street view images and a geographical detector to understand how street-level built environment is associated with urban poverty: A case study in Guangzhou. Appl. Geogr. 2023, 156, 102980. [Google Scholar] [CrossRef]
  35. Wang, X.; Liu, Y.; Yao, Y.; Zhou, S.; Zhu, Q.; Liu, M.; Helbich, M. Adolescents’ environmental perceptions mediate associations between streetscape environments and active school travel. Transp. Res. Part D Transp. Environ. 2023, 114, 103549. [Google Scholar] [CrossRef]
  36. Ye, Y.; Zeng, W.; Shen, Q.; Zhang, X.; Lu, Y. The visual quality of streets: A human-centred continuous measurement based on machine learning algorithms and street view images. Environ. Plan. B Urban Anal. City Sci. 2019, 46, 1439–1457. [Google Scholar] [CrossRef]
  37. Koo, B.W.; Hwang, U.; Guhathakurta, S. Streetscapes as part of servicescapes: Can walkable streetscapes make local businesses more attractive? Comput. Environ. Urban Syst. 2023, 106, 102030. [Google Scholar] [CrossRef]
  38. Lee, J.; Kim, D.; Park, J. A Machine Learning and Computer Vision Study of the Environmental Characteristics of Streetscapes That Affect Pedestrian Satisfaction. Sustainability 2022, 14, 5730. [Google Scholar] [CrossRef]
  39. Woo, A.; Han, J.; Shin, H.; Lee, S. Economic benefits of urban streetscapes: Analyzing the interrelationships between visual street environments and single-family property values in Seoul, Korea. Appl. Geogr. 2024, 163, 103182. [Google Scholar] [CrossRef]
  40. Yue, H.; Liu, L.; Xu, C.; Song, G.; Chen, J.; He, L.; Duan, L. Investigating the diurnal effects of on-street population and streetscape physical environment on street theft crime: A machine learning and negative binomial regression approach using street view images. Appl. Geogr. 2024, 163, 103194. [Google Scholar] [CrossRef]
  41. Liu, Y.; Liu, Y. Detecting the city-scale spatial pattern of the urban informal sector by using the street view images: A street vendor massive investigation case. Cities 2022, 131, 103959. [Google Scholar] [CrossRef]
  42. Kim, J.; Park, J.; Lee, J.; Jang, K.M. Examining the socio-spatial patterns of bus shelters with deep learning analysis of street-view images: A case study of 20 cities in the U.S. Cities 2024, 132, 104852. [Google Scholar] [CrossRef]
  43. Cinnamon, J.; Gaffney, A. Do-It-Yourself Street Views and the Urban Imaginary of Google Street View. J. Urban Technol. 2021, 29, 95–116. [Google Scholar] [CrossRef]
  44. Williams, S.; Ahn, C.; Gunc, H.; Ozgirin, E.; Pearce, M.; Xiong, Z. Evaluating sensors for the measurement of public life: A future in image processing. Environ. Plan. B Urban Anal. City Sci. 2019, 46, 1534–1548. [Google Scholar] [CrossRef]
  45. Liu, Y.; Liu, X.; Gao, S.; Gong, L.; Kang, C.; Zhi, Y.; Chi, G.; Shi, L. Social Sensing: A New Approach to Understanding Our Socioeconomic Environments. Ann. Assoc. Am. Geogr. 2015, 105, 512–530. [Google Scholar] [CrossRef]
  46. Liao, C.; Brown, D.; Fei, D.; Long, X.; Chen, D.; Che, S. Big data-enabled social sensing in spatial analysis: Potentials and pitfalls. Trans. GIS 2018, 22, 1351–1371. [Google Scholar] [CrossRef]
  47. Liu, Y. Geographical Big Data and Social Sensing; Science Press: Beijing, China, 2023. [Google Scholar]
  48. Peng, X.; Li, Y.; Si, Y.; Xu, L.; Liu, X.; Li, D.; Liu, Y. A social sensing approach for everyday urban problem-handling with the 12345-complaint hotline data. Comput. Environ. Urban Syst. 2022, 94, 101790. [Google Scholar] [CrossRef]
  49. Li, C.; Huang, Y.; Shen, Y.; Xu, L. Spatiotemporal patterns and mechanisms of street vending from the social sensing perspective: A comparison between law-enforcement reported and residents complain events. Cities 2022, 124, 103597. [Google Scholar] [CrossRef]
  50. Ghermandi, A.; Sinclair, M. Passive crowdsourcing of social media in environmental research: A systematic map. Glob. Environ. Change 2019, 55, 36–47. [Google Scholar] [CrossRef]
  51. Zhang, Y.; Kwan, M.-P.; Yu, B.; Liu, Y.; Song, L.; Chen, N. Quantitative Identification of Mixed Urban Functions: A Probabilistic Approach Based on Physical and Social Sensing Data. Trans. GIS 2025, 29, e13272. [Google Scholar] [CrossRef]
  52. UNESCO World Heritage Center. Quanzhou: Emporium of the World in Song-Yuan China. Available online: https://whc.unesco.org/en/list/1561 (accessed on 22 March 2025).
  53. Quanzhou Municipal People’s Government. Available online: https://www.quanzhou.gov.cn/zfb/xxgk/zfxxgkzl/qzdt/qzyw/202112/t20211205_2664783.htm (accessed on 22 March 2025).
  54. Li, Y.; Yabuki, N.; Fukuda, T. Exploring the association between street built environment and street vitality using deep learning methods. Sustain. Cities Soc. 2022, 79, 103656. [Google Scholar] [CrossRef]
  55. Jiang, J.; Wang, J.; Yao, H.; Zhang, Z.; Xu, Z. Revealing the mobile sensing powers of semi-random and deterministic “drive-by” vehicle fleets. Trans. GIS 2024, 28, 2–22. [Google Scholar] [CrossRef]
  56. Birenboim, A.; Helbich, M.; Kwan, M.-P. Advances in portable sensing for urban environments: Understanding cities from a mobility perspective. Comput. Environ. Urban Syst. 2021, 88, 101650. [Google Scholar] [CrossRef]
  57. Redmon, J.; Divvala, S.; Girshick, R.; Farhadi, A. You Only Look Once: Unified, Real-Time Object Detection. In Proceedings of the 2016 IEEE Conference on Computer Vision and Pattern Recognition (CVPR), Las Vegas, NV, USA, 27–30 June 2016. [Google Scholar] [CrossRef]
  58. Ye, Y.; Li, D.; Liu, X. How block density and typology affect urban vitality: An exploratory analysis in Shenzhen. China. Urban Geogr. 2018, 39, 631–652. [Google Scholar] [CrossRef]
  59. Long, Y.; Huang, C. Does block size matter? The impact of urban design on economic vitality for Chinese cities. Environ. Plan. B Urban Anal. City Sci. 2019, 46, 406–422. [Google Scholar] [CrossRef]
  60. Yang, D.; Wang, X.; Han, R. Nonlinear and Synergistic Effects of the Built Environment on Street Vitality: The Case of Shenyang. Urban Plan. Forum 2023, 5, 93–1002. [Google Scholar] [CrossRef]
  61. Fotheringham, A.S.; Yang, W.; Kang, W. Multiscale Geographically Weighted Regression (MGWR). Ann. Assoc. Am. Geogr. 2017, 107, 1247–1265. [Google Scholar] [CrossRef]
  62. Xia, C.; Zhang, A.; Yeh, A.G.O. The Varying Relationships between Multidimensional Urban Form and Urban Vitality in Chinese Megacities: Insights from a Comparative Analysis. Ann. Assoc. Am. Geogr. 2022, 112, 141–166. [Google Scholar] [CrossRef]
  63. Chen, Y.; Yu, B.; Shu, B.; Yang, L.; Wang, R. Exploring the spatiotemporal patterns and correlates of urban vitality: Temporal and spatial heterogeneity. Sustain. Cities Soc. 2023, 91, 104440. [Google Scholar] [CrossRef]
  64. Hou, C.; Zhang, F.; Kang, Y.; Gao, S.; Li, Y.; Duarte, F.; Li, S. Transferred Bias Uncovers the Balance Between the Development of Physical and Socioeconomic Environments of Cities. Ann. Assoc. Am. Geogr. 2025, 115, 148–166. [Google Scholar] [CrossRef]
  65. Zhang, F.; Salazar-Miranda, A.; Duarte, F.; Vale, L.; Hack, G.; Chen, M.; Liu, Y.; Batty, M.; Ratti, C. Urban Visual Intelligence: Studying Cities with Artificial Intelligence and Street-Level Imagery. Ann. Assoc. Am. Geogr. 2024, 114, 876–897. [Google Scholar] [CrossRef]
  66. Maas, P.R. Towards a Theory of Urban Vitality. Doctor’s Thesis, University of British Columbia, Vancouver, BC, Canada, 1984. [Google Scholar]
  67. Zikirya, B.; He, X.; Li, M.; Zhou, C. Urban Food Takeaway Vitality: A New Technique to Assess Urban Vitality. Int. J. Environ. Res. Public Health 2021, 18, 3578. [Google Scholar] [CrossRef]
  68. Shanghai Municipal Bureau of Planning and Land Resources Management, Shanghai Municipal Commission of Transport, Shanghai Urban Planning and Design Institute. Shanghai Street Design Guidelines; Tongji University Press: Shanghai, China, 2016. [Google Scholar]
Figure 1. Study area.
Buildings 15 01522 g001
Figure 2. Analytical framework.
Buildings 15 01522 g002
Figure 3. Illustrations of the spontaneous streetscape elements.
Buildings 15 01522 g003
Figure 4. Machine learning model training processes and performance: (a) interface of Tencent Cloud; (b) model training process; (c) confusion matrix; (d) model performance statistics.
Buildings 15 01522 g004
Figure 5. Data collection and description of social sensing: (a) interface of Octopus Collector (a Chinese website); (b) types and numbers of businesses in Dianping; (c) mapping of the Dianping data; (d) mapping of the Weibo check-in data.
Buildings 15 01522 g005
Figure 6. Distribution of the spontaneous streetscape elements in the Old City of Quanzhou.
Buildings 15 01522 g006
Figure 7. Distribution of economic vitality and social media perception.
Buildings 15 01522 g007
Figure 8. Regression coefficient distribution with Dianping merchant quantity as the dependent variable.
Buildings 15 01522 g008
Figure 9. Regression coefficient distribution with Dianping consumer comments as the dependent variable.
Buildings 15 01522 g009
Figure 10. Regression coefficient distribution with Weibo check-in quantity as the dependent variable.
Buildings 15 01522 g010
Figure 11. Regression coefficient distribution with the Weibo sentiment index as the dependent variable.
Buildings 15 01522 g011
Table 1. A brief summary of the types and algorithms of micro-scale streetscape elements.
Study AreaImage DataSelected Streetscape ElementAlgorithmSource
56 global citiesGoogle Street ViewWall, building, road, sidewalk, fence, signboard, path, stairs, door, bench, awning, streetlight, pole, fountain, sculpture, traffic light, stairway, tree, grass, plant, water, waterfall, lake, mountain, rockPSPNet[16]
Shenzhen, ChinaTencent Street ViewGreenspace vegetation (tree, forest, greenbelt, lawn), building, sky, wall, road, pavementSegNet[21]
Guangzhou, ChinaTencent Street ViewStreet furniture (fences, streetlights, traffic lights, cameras, windows), pedestrian, bicycle, booth, trade name, signboard, pavement, roadway, motor vehiclesFCN[35]
Shanghai, ChinaBaidu Street ViewSky, building, tree, road, pavement, fence, sign, vehicle, pedestrian, bikeSegNet[36]
Xuzhou, ChinaBaidu Street ViewSignboard, frame door, glass interface, open store, closed storeYOLO[11]
Atlanta, GA, USAGoogle Street ViewBuilding, house, sidewalk, road, car, tree, plant, grass, walk signal, crosswalk, sidewalk, buffer, streetlightPSPNet[37]
Seoul, KoreaNaver Street ViewBuilding, tree, plant, sky, road, sidewalk, street furnitureHigh-resolution networks; Canny Edge[38]
Seoul, KoreaGoogle Street ViewVegetation, building, road, sidewalkDeeplab V3+[39]
ZG city, ChinaBaidu Street ViewWall, building, tree, road, window, grass, plant, sidewalk, fenceFaster R-CNN; PSPNet[40]
Table 2. Classification and related definitions of spontaneous streetscape elements.
TypeSubtypeLabel CodeDefinition
BasicFramed door/windowFramedoor(1) There are clear horizontal and vertical frames inside the outline of doors and windows; (2) an interface mainly used by the storefronts operating indoors, with relatively poor display quality.
Glass gateway/windowGlassinterface(1) Glass occupying the main part of the gateways or windows, with no frame inside; (2) an interface mainly used by the storefronts needing to be displayed externally.
Open entranceOpenentry(1) Only the outlines of entrances can be seen, with shadows or various goods in them; (2) an interface of the storefronts that require direct and constant outdoor activities.
Closed entranceClosedstore(1) Storefronts that are shut down or not in business; (2) a special component of the streetscape that can reflect urban economies and the experience of street vitality.
CommercialStore signboardSignboard(1) A reflection of street economic vitality and the number of storefronts, whether in business or not; (2) usually fixed above entrance interfaces.
Banner/adBanner(1) Larger quantity and smaller scale compared to store signboards; (2) generally used at the height of the visual level or lower.
MovableSunshade/awningSunshade(1) It mainly serves to shield against wind, rain, and sunlight, and also indicates a certain outdoor usage range; (2) usually located at a higher position than doors and windows and close to the vertical interfaces of storefronts.
Outdoor umbrellaUmbrella(1) Commonly used by street vendors, or storefronts to set up stalls and outdoor businesses along the street.
Potted plantPottedplant(1) A kind of private greenery for store decoration and embellishment of natural elements; (2) usually placed at entrances.
CulturalWall decoration painting/sculptureDecoration(1) Generally, hard materials, such as bricks and stones, are used with clear outlines; (2) a cultural element usually placed at vertical interfaces or independently near entrances.
Table 3. Proxies and calculation methods of the spontaneous streetscape features and social sensing.
VariablesAbbr.DescriptionCalculation Method
Dependent variables
Online economic vitality indexDMQThe quantity of the Dianping merchants in a unitBuffer creation and the spatial connection tool in overlay analysis in ArcGIS
DCCThe sum of the Dianping consumer comments in a unitBuffer creation and the spatial connection tool in overlay analysis in ArcGIS
Social media perception indexWCQThe quantity of the Weibo check-in records in a unitBuffer creation and the spatial connection tool in overlay analysis in ArcGIS
WSIThe average sentiment index of Weibo texts in a unit W S I i = W C Q i c o n f i w × p r o b _ p i w / W C Q i
where confiw and prob_piw are obtained from the Baidu Natural Language Processing (NLP) API, and stand for the confidence level and positive sentiment probability of the w-th Weibo text in the i-th unit, respectively.
Independent variables
Basic interface usageSFDThe sum of the framed doors and windows in a unitSFDi = FDli + FDri
where FDli and FDri are the sums of the framed doors and windows of the i-th unit from the L- and R-side, respectively.
SGIThe sum of the glass gateways and windows in a unitSGIi = GIli + GIri
where GIli and GIri are the sums of the glass gateways and windows of the i-th unit from the L- and R-side, respectively.
SOEThe sum of the open entrances in a unitSOEi = OEli + OEri
where OEli and OEri are the sums of the open entrances of the i-th unit from the L- and R-side, respectively.
SCSThe sum of the closed entrances in a unitSCSi = CSli + CSri
where CSli and CSri are the sums of the closed entrances of the i-th unit from the L- and R-side, respectively.
Interface diversity indexSDIThe interface diversity degree of the storefronts in business calculated by Shannon entropy S D I i = ( P j × ln P j )
where Pj is the proportion of the j-th type of the interfaces from operating storefronts within the i-th unit.
Commercial element usageSSBThe sum of the store signboards in a unitSSBi = SBli + SBri
where SBli and SBri are the sums of the store signboards of the i-th unit from the L- and R-side, respectively.
SBAThe sum of the banners and ads in a unitSBAi = BAli + BAri
where BAli and BAri are the sums of the banners and ads of the i-th unit from the L- and R-side, respectively.
Movable element usageSSSThe sum of the sunshades and awnings in a unitSSSi = SSli + SSri
where SSli and SSri are the sums of the sunshades and awnings of the i-th unit from the L- and R-side, respectively.
SPPThe sum of the potted plants in a unitSPPi = PPli + PPri
where PPli and PPri are the sums of the potted plants of the i-th unit from the L- and R-side, respectively.
Cultural element usageSDEThe sum of the wall decoration paintings and sculptures in a unitSDEi = DEli + DEri
where DEli and DEri are the sums of the cultural decoration paintings and sculptures of the i-th unit from the L- and R-side, respectively.
Table 4. Performance of the OLS model.
Social Sensing IndexR2Adjusted R2Durbin-Watson Value
DMQ0.4390.4061.976
DCC0.4630.4312.119
WCQ0.2550.2012.076
WSI0.1830.1241.949
Table 5. Performance of the GWR and MGWR models.
Social Sensing IndexGWRMGWR
R2Adjusted R2AICR2Adjusted R2AIC
DMQ0.7860.709300.6330.8000.744274.549
DCC0.8190.746281.0440.8120.755268.980
WCQ0.3770.271357.5670.5020.374343.209
WSI0.2450.134378.7240.3640.242364.564
Disclaimer/Publisher’s Note: The statements, opinions and data contained in all publications are solely those of the individual author(s) and contributor(s) and not of MDPI and/or the editor(s). MDPI and/or the editor(s) disclaim responsibility for any injury to people or property resulting from any ideas, methods, instructions or products referred to in the content.

