1. Introduction
Functionally graded materials (FGMs), which belong to a category of composite materials, were initially developed to meet the demands of thermal barrier materials [
1]. Comprehensive reviews in terms of properties of FGMs can be observed from Naebe M. et al. [
2] and Yu X. et al. [
3] In contrast to conventional composites, FGMs exhibit a continuous gradient in microstructure and mechanical properties. This characteristic endows them with exceptional abilities to resist deformation and enhance toughness under extreme mechanical and thermal conditions [
4]. Thus, functionally graded materials (FGMs) have garnered significant interest and undergone swift advancements over the past ten years. Currently, a variety of structural components produced using FGMs are employed in numerous fields, including aerospace, bioengineering, nuclear industries, and civil construction, among others [
5,
6]. As one of the most representative and fundamental structures of FGMs, a significant number of investigations have been performed on functionally graded (FG) Euler–Bernoulli beams under different conditions. The influence of material properties on the mechanical performances of FGMs have been investigated. For instance, the static and dynamic modeling of functionally graded Euler–Bernoulli microbeams, as investigated by Dinachandra, provides significant insights into their mechanical behavior [
7], the mechanical characteristics of microstructure-dependent FG-MEE composite beams studied by Zhang et al. [
8,
9,
10], the free vibration characteristics of the rectangle [
11], tapered [
12] Euler–Bernoulli functionally graded beams, or Timoshenko functionally graded beams [
13]. The aforementioned theoretical research has significantly contributed to enhancing the understanding of the mechanical properties of functionally graded materials among researchers and practitioners.
Nevertheless, in practical engineering scenarios, FG Euler–Bernoulli beams might experience some degree of damage while being utilized [
14]. Thus, improving the safety of functionally graded (FG) beams in practical applications requires critical research on damage identification, particularly when the damage is minimal [
15]. Over the past few years, there has been growing interest in damage detection techniques that rely on vibration characteristics, as these are considered among the most efficient technologies available [
16,
17]. The primary concern is a dynamic characteristic index that exhibits sensitivity to the target structures both before and after the occurrence of damage [
18,
19]. Some dynamic parameters, such as frequencies, mode shapes or modal strain energy, are frequently employed in various analyses [
20,
21]. Especially, the modal identification of structures can be fully automated through ensemble learning, which offers even more advantages [
22]. Among the aforementioned damage indexes, modal strain energy (MSE) has been widely adopted [
23,
24,
25], due to their high sensitivity to damage and superior resistance to noise. Additionally, numerous researchers have shown that approaches based on MSE possess a strong capability to accurately identify the location or extent of damage. Seyedpoor [
26] introduced a two-step approach for identifying structural damage, which utilizes a modal strain energy-based indicator and intelligent method. Subsequently, Alavinezhad [
27] presented a new approach for identifying structural damage in offshore bridges based on this indicator. To further enhance the efficiency of damage detection, Yan et al. [
28,
29] proposed an effective approach utilizing element modal strain energy sensitivity (EMSES) for identifying structural damage in homogeneous materials. The findings indicate that this method provides a reliable means to determine both the location and severity of damage in beam-like structures. Further, to detect the damage of the beams whose material properties vary continuously along the axial direction, Lu [
30] presented a finite element model updating method based on sensitivity. More recently, Yang [
14] applied an EMSES method, originally used for detecting damage in isotropic materials, to identify damage in FG Euler–Bernoulli beams. The findings indicate that this approach exhibits exceptionally high performance.
In practical engineering, the models and measurement data used inevitably have different degrees of uncertainty. As a result, significant uncertainties may arise when detecting damage in functionally graded structures. These uncertainties can cause discrepancies between the identified damage and the actual damage, leading to missed detections and incorrect judgments. Thus, it is crucial to adopt a statistical approach to damage detection. It is well understood that statistical approaches are capable of efficiently handling uncertain issues. Currently, it has been applied to address damage detection issues in homogeneous beam structures [
31]. In contrast to the deterministic damage detections means, this approach can effectively capture the uncertainties involved in damage detections. This enables a more thorough resolution of the issues affecting the damage detections outcomes, thereby enhancing the reliability of these results.
Despite the successful application of the statistical structural damage identification method for homogeneous materials, as far as we know, it still needs to be confirmed whether it is applicable to FG Euler–Bernoulli beams. On the other hand, it should be compared with the deterministic damage identification methods such as Yang’s [
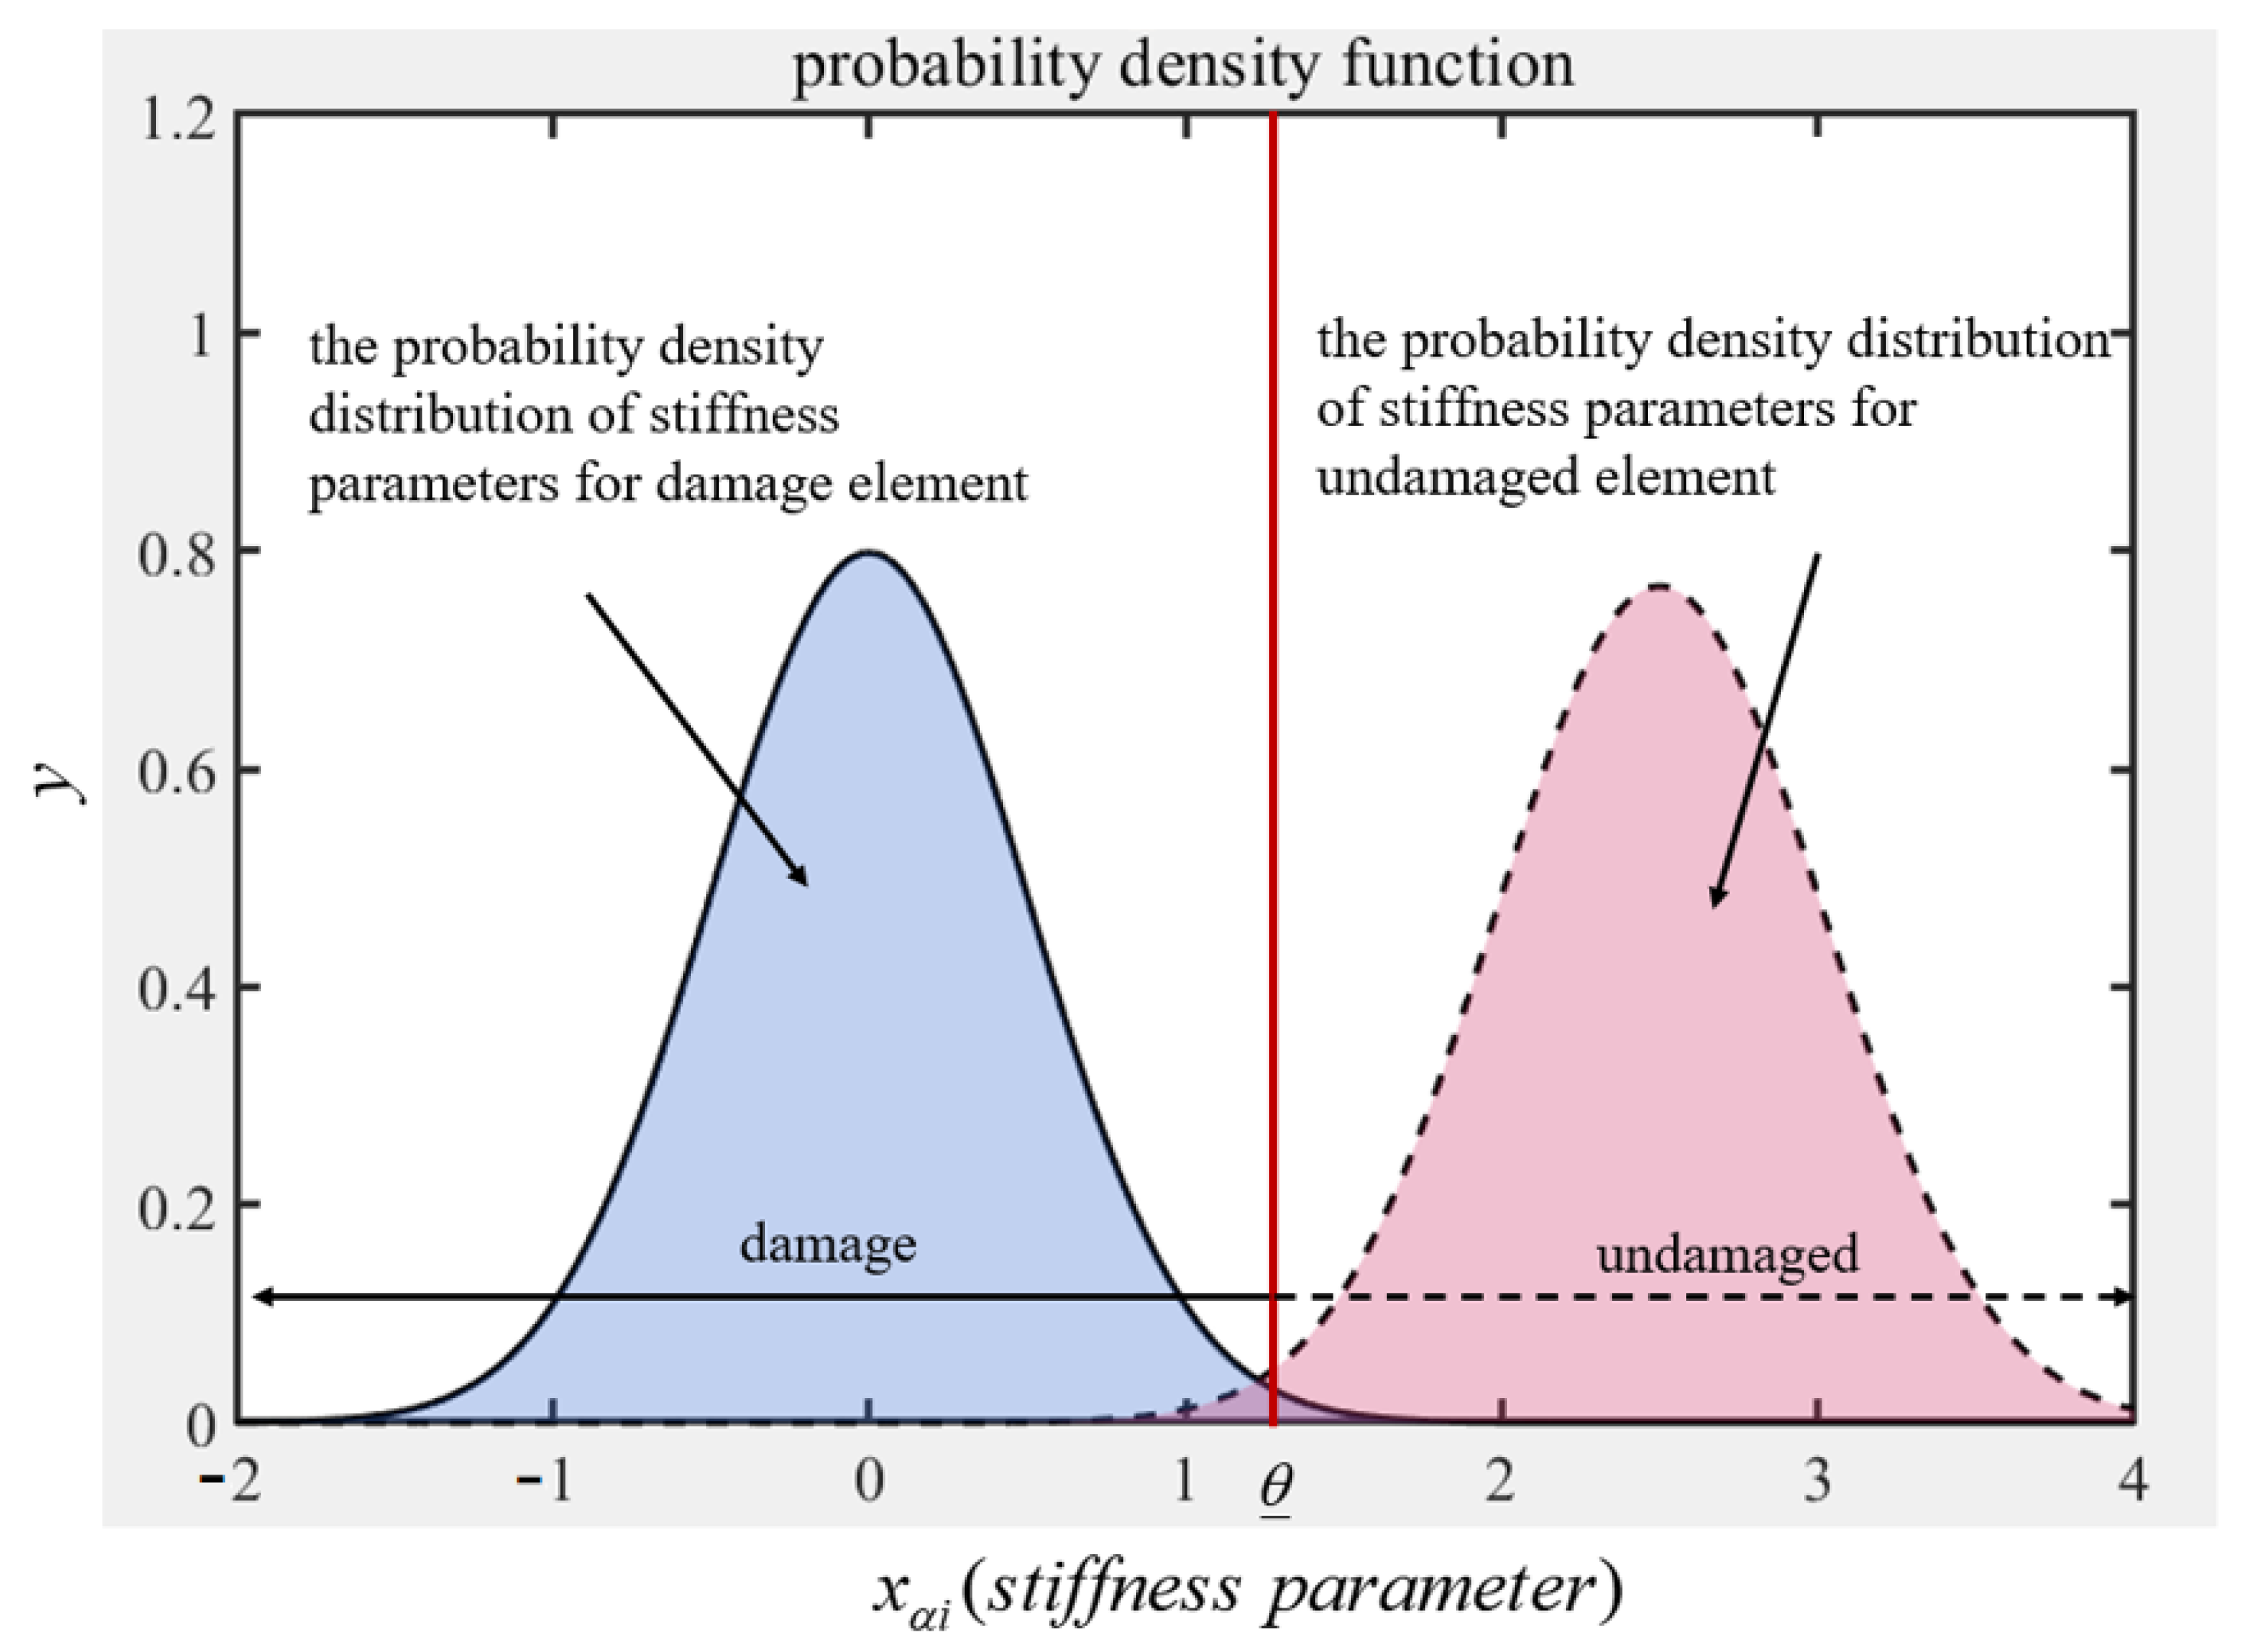
14]. Therefore, the study on this topic in necessary to be carried out. In this paper, a statistical structural damage detection method for FG Euler–Bernoulli beams based on element modal strain energy sensitivity and perturbation method is proposed. By considering the structural parameters (primarily stiffness parameters) as random variables, the perturbation method is employed to derive the mean and variance of the stiffness parameters for damaged structural elements. Subsequently, the probability distribution in terms of the variables for both damaged and healthy elements are obtained. Combined with the probability distribution of the stiffness parameters for the health elements, the structural damage probability can be determined. This provides a statistical method for uncertain problems to identify damages in FG Euler–Bernoulli beams which may not only reduce the adverse effects on damage identification outcomes but also improves the robustness and reliability of the results.
The structure of this paper is arranged as follows:
Section 2 provides a detailed explanation of the statistical damage detection method for FG Euler–Bernoulli beams.
Section 3 provides the numerical outcomes and examines how the gradient index, damage severity, noise level, and boundary conditions affect the results. The conclusion of the work is summarized in
Section 4.
3. Results and Discussion
A numerical example involving a simply supported beam is selected to verify the presented method which considers a variety of different damage conditions. The effects of gradient index k, damage severity, noise level and different boundary conditions on damage identification are also discussed in detail.
3.1. Description of Numerical Examples
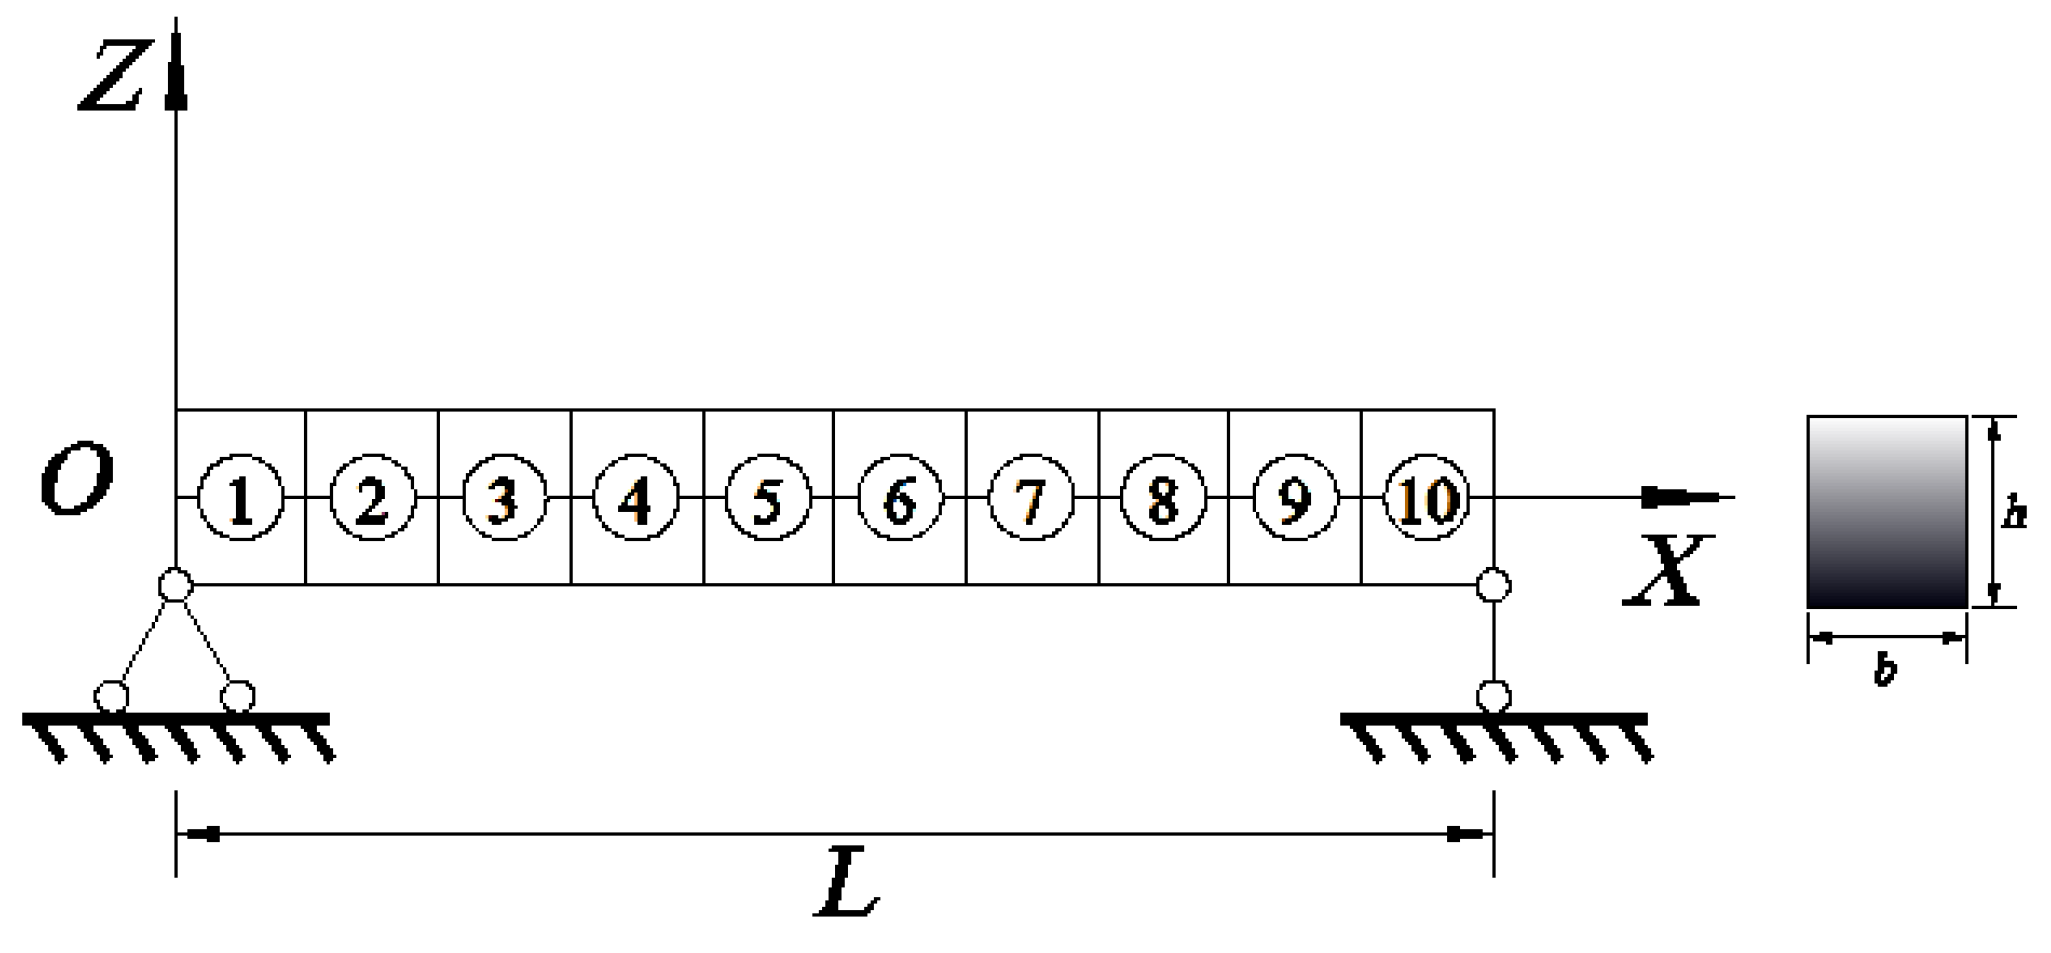
As depicted in
Figure 2, the dimensions of the FG Euler–Bernoulli simply supported beam are defined as follows: the length
L is 6 m, the width
b is 0.1 m, and the height
h is 0.2 m. The substance located beneath the beam cross-section is steel with the elastic modulus
El = 210 GPa and density equals
ρl = 7800 kg/m
3. The substance located at the upper part of the beam cross-section is aluminum oxide, the elastic modulus and density are
Eu = 390 GPa and
ρu = 3960 kg/m
3. The materials are identical to those used by Alshorbagy A.E. et al. [
11] to facilitate comparison and verification of the results. On the basis of plane beam element, the structure is divided into 10 elements leading to 11 nodes and 30 degrees of freedom.
3.2. Value of the Damaged Probability
The model error and the measurement error of vibration mode are assumed to be subjected to the normal distribution (the average value is 0, the noise level is 1%). The errors are independent of each other and the confidence level is
. In order to verify the accuracy of the method in identifying damage in FG beam structure and for the purpose of comparison, the damage cases are the same as that of Yan et al. [
31] shown in
Table 1.
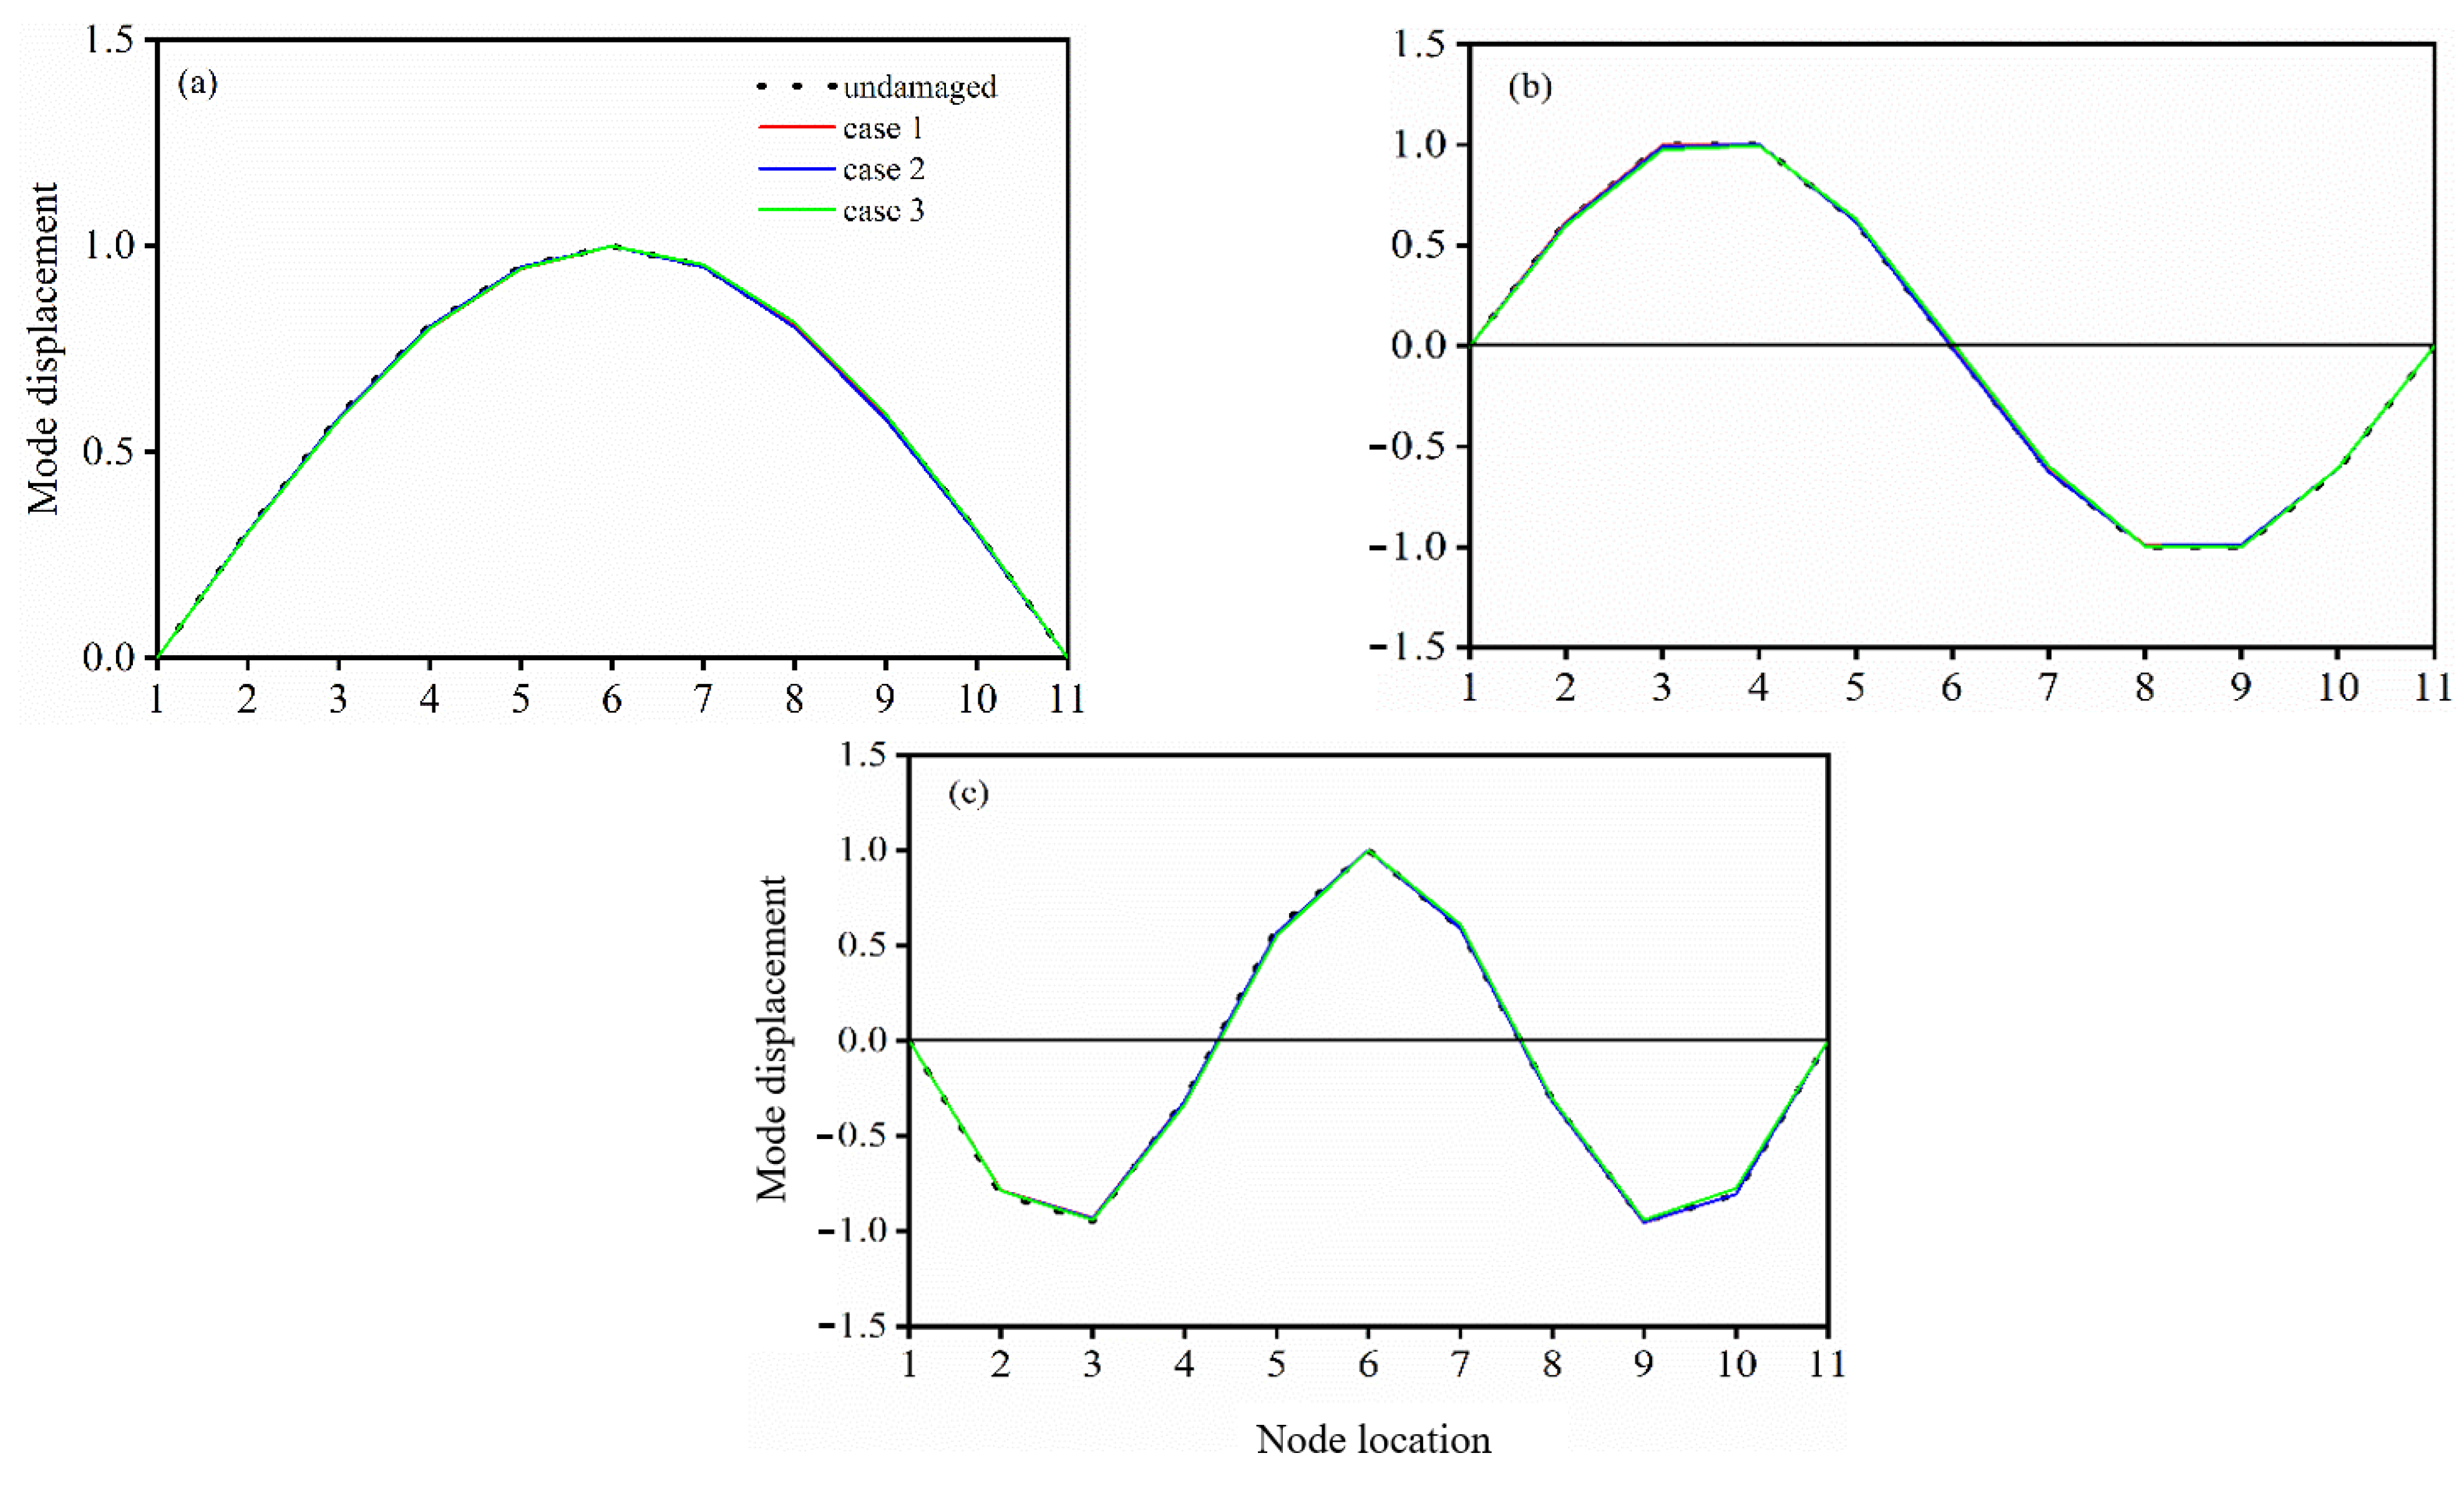
The structural dynamic variable, including natural frequencies and mode shapes are obtained and the initial three mode shape for the three selected cases in
Table 1 is displayed in
Figure 3, respectively. As can be seen, the mode shapes are virtually identical in all scenarios.
The probability density curve of the stiffness parameter for damage condition C1 in
Table 1 before and after damage is shown in
Figure 4. The forms of the probability density function curve of condition C2 and condition C3 are similar to that of condition C1.
It can be seen from
Figure 4f that the curve of the probability density function of the stiffness parameters for the damaged element (element 6) deviates very distinctly before and after damage. However, if the undamaged elements are far from the damaged element, such as elements 1, 2, 9, and 10, the curves of probability density functions of them are almost coincident. Another noticeable phenomenon is that when healthy components are located near the damaged ones, such as elements 4, 5, 7, and 8, the resulting curves are also different but without any noticeable deviation. This suggests that the mean values of stiffness parameters remain similar before and after damage occurrence; however, the variance values exhibit significant differences when undamaged elements are in proximity to healthy elements. Changes in dispersion can significantly affect the calculated probability of damage. Now, utilizing the theory of statistical method for damage detection mentioned above, the probability of damage existence for each element damage under various damage conditions in
Table 1 can be calculated and presented in
Table 2.
It can be seen from
Table 2 that whether a single element is damaged (C1) or multiple elements are damaged (C2 and C3), results show that the probability of damage existence for damaged structure approaches 1. Compared with the damage element, the probability of damage existence for the healthy component is significantly small, especially for the ones near the support. This is because the damaged elements exert little influence on the probability density function curves of health components close to the supports (see
Figure 4a, the curves are nearly the same), However, the presence of healthy elements near the damaged ones significantly affects the probability density function curves (see
Figure 4c–e), resulting in a higher probability of damage. Therefore, the proposed probabilistic statistical method can be suitable when applied to FG Euler–Bernoulli beams.
3.3. Influence of Different Gradient Indexes on Probabilistic Damage Detection
The gradient parameters for the FG simply supported beam in the above example is
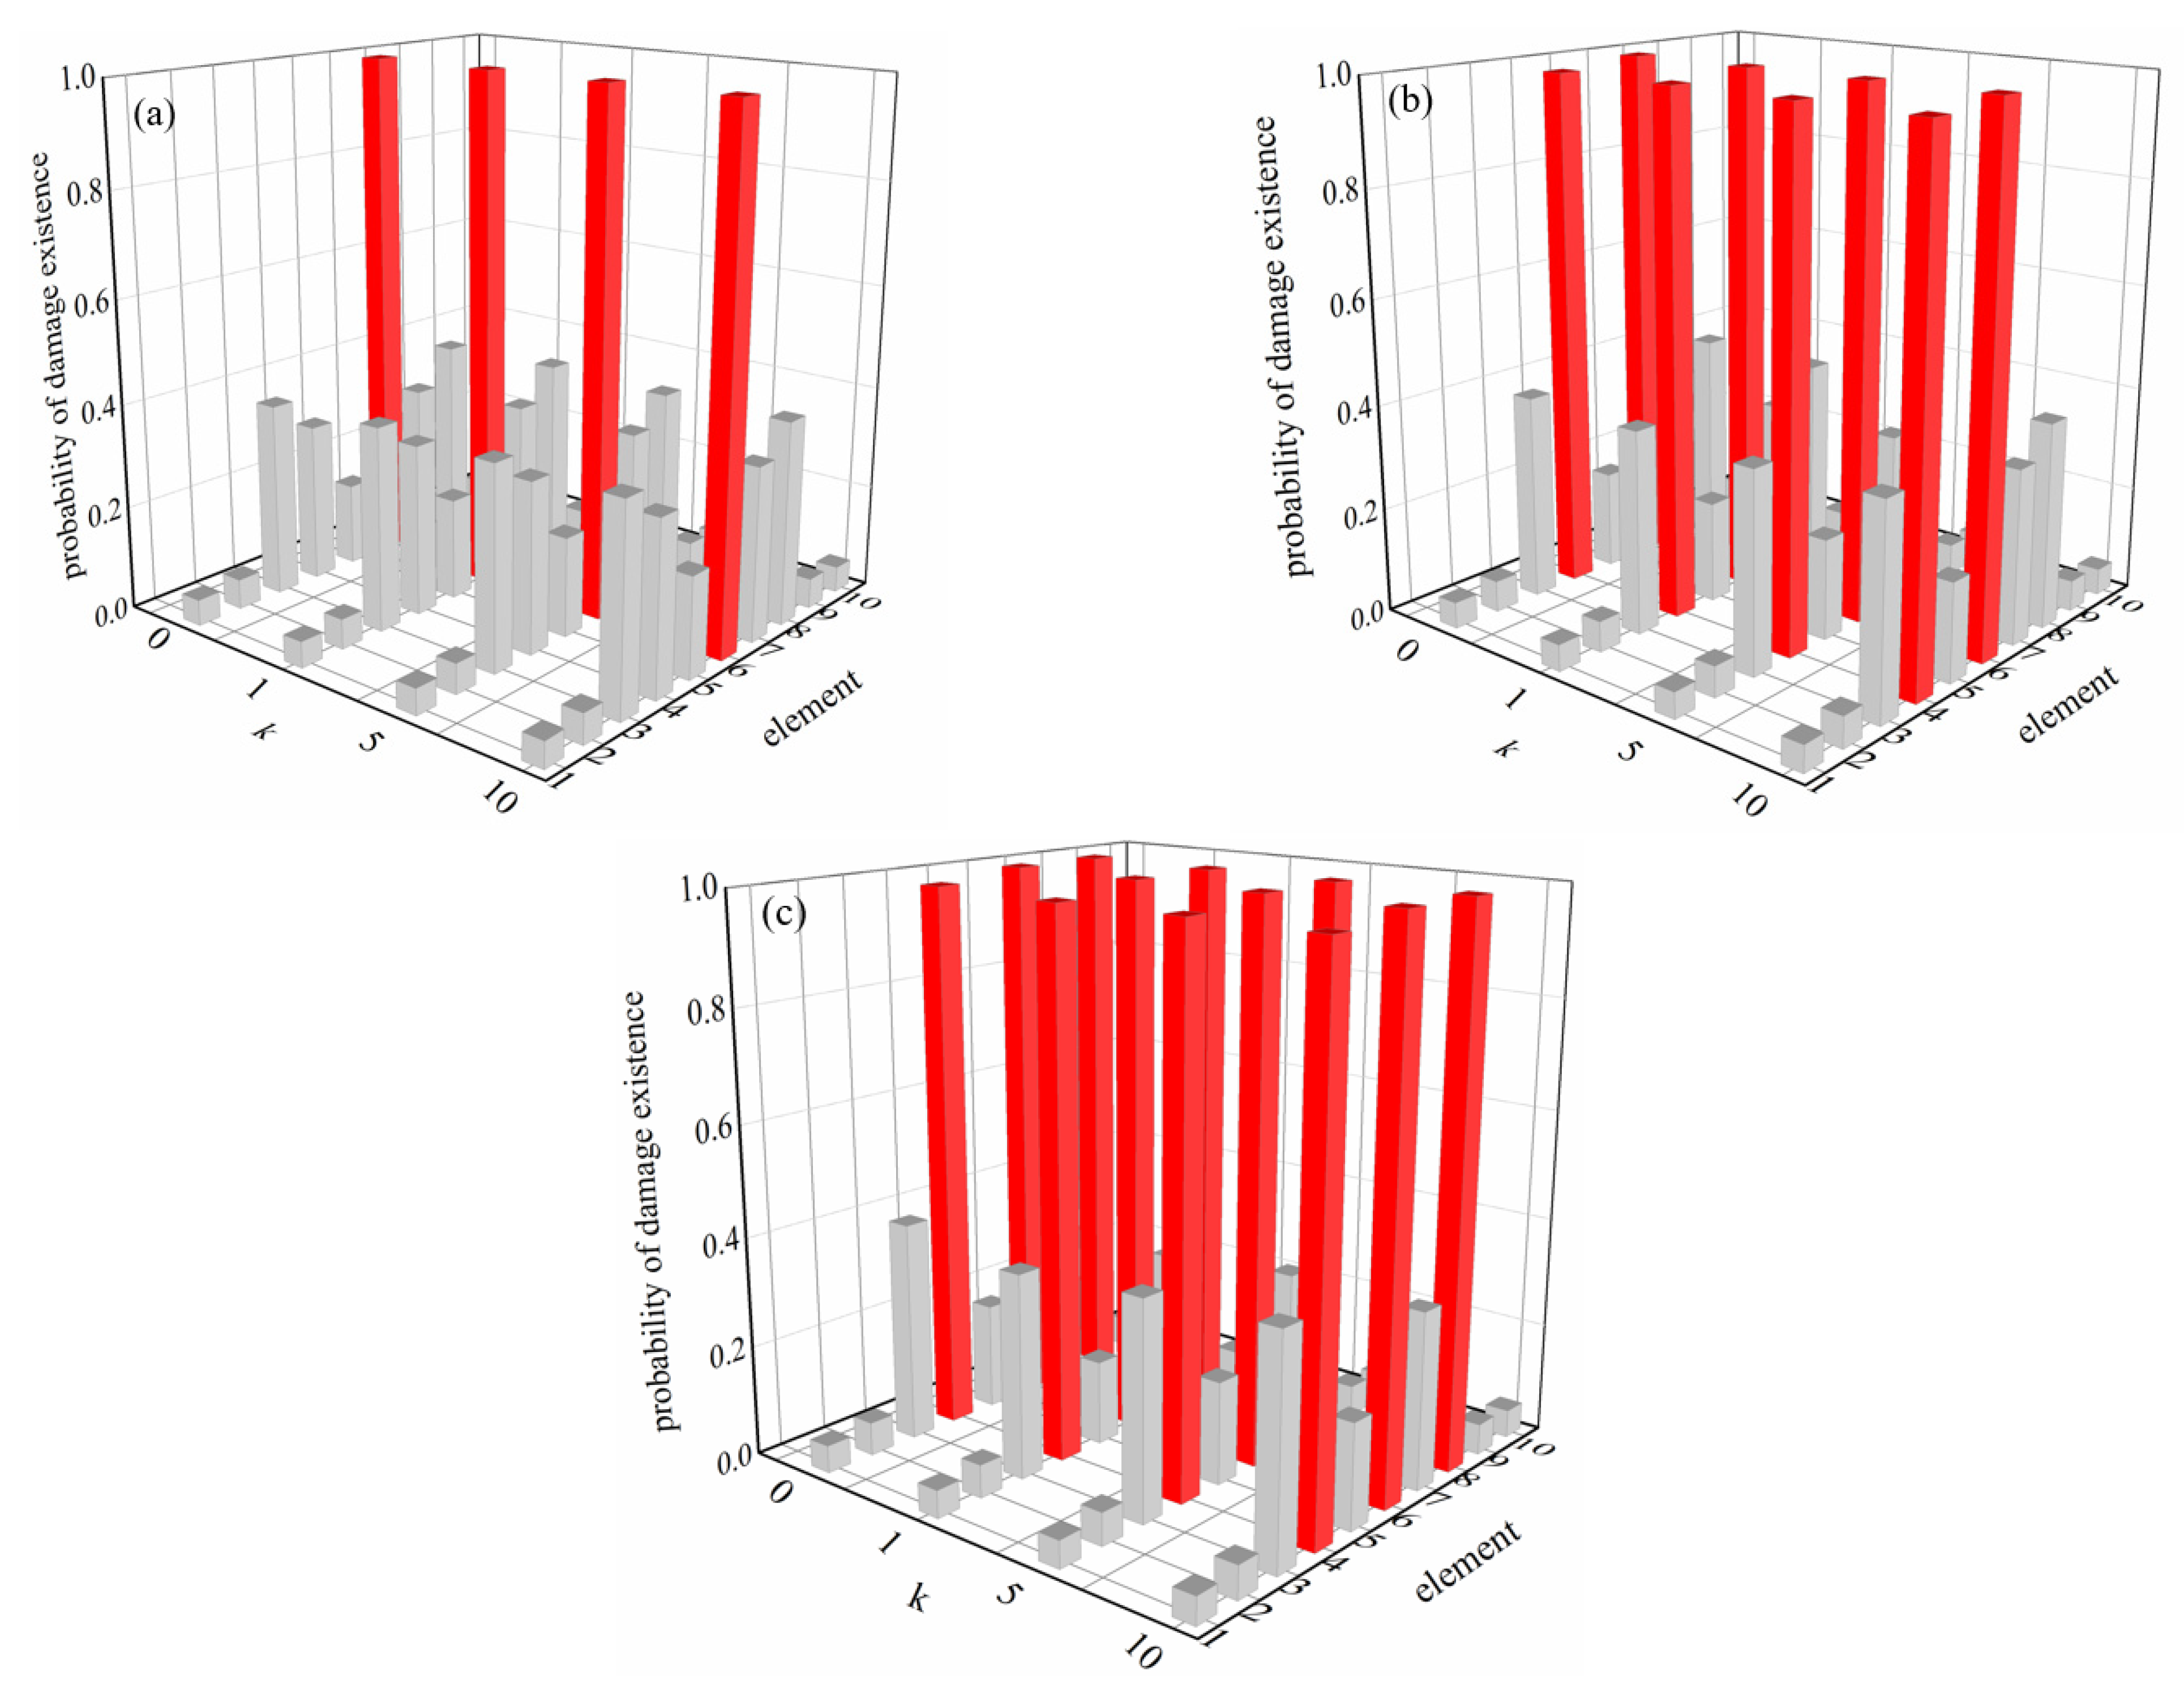
k = 5. To examine the impact of the gradient indexes on damage identification results based on the probabilistic statistical method, only the gradient indexes which are set as 0, 1, 5, and 10 are changed. Other parameters are the same as those in the numerical example in 3.1. The cases of damage remain the same as those outlined in
Table 1, and the results of damage detection are presented in
Figure 5.
It can be seen from
Figure 5 that when the gradient indexes vary from 0, 1, and 5 to 10, the probability of damage for each element remains relatively stable across the gradient indices. They are close to 1 for the damage elements in each damage condition; therefore, it can be implied that the proposed method is not influenced by the gradient index and is effective to detect damage in FG beam with changes in gradient index. For undamaged elements, the closer the support, the smaller the probability value. For example, the results of elements 1, 2, 9, and 10 are close to zero. However, it is worth mentioning that the elements remaining undamaged near the damaged ones, such as elements 3 and 7 in case 3, still have a maximum probability of damage existence of 0.4. Despite this, compared with the damaged elements they are still small, which may lead to some interference during the damage detection. If the error is large, it may cause misjudgment. This can be ascribed to the effect of supports, which results in the change in modal strain energy of elements near the supports being smaller compared to that of other elements located farther away [
14].
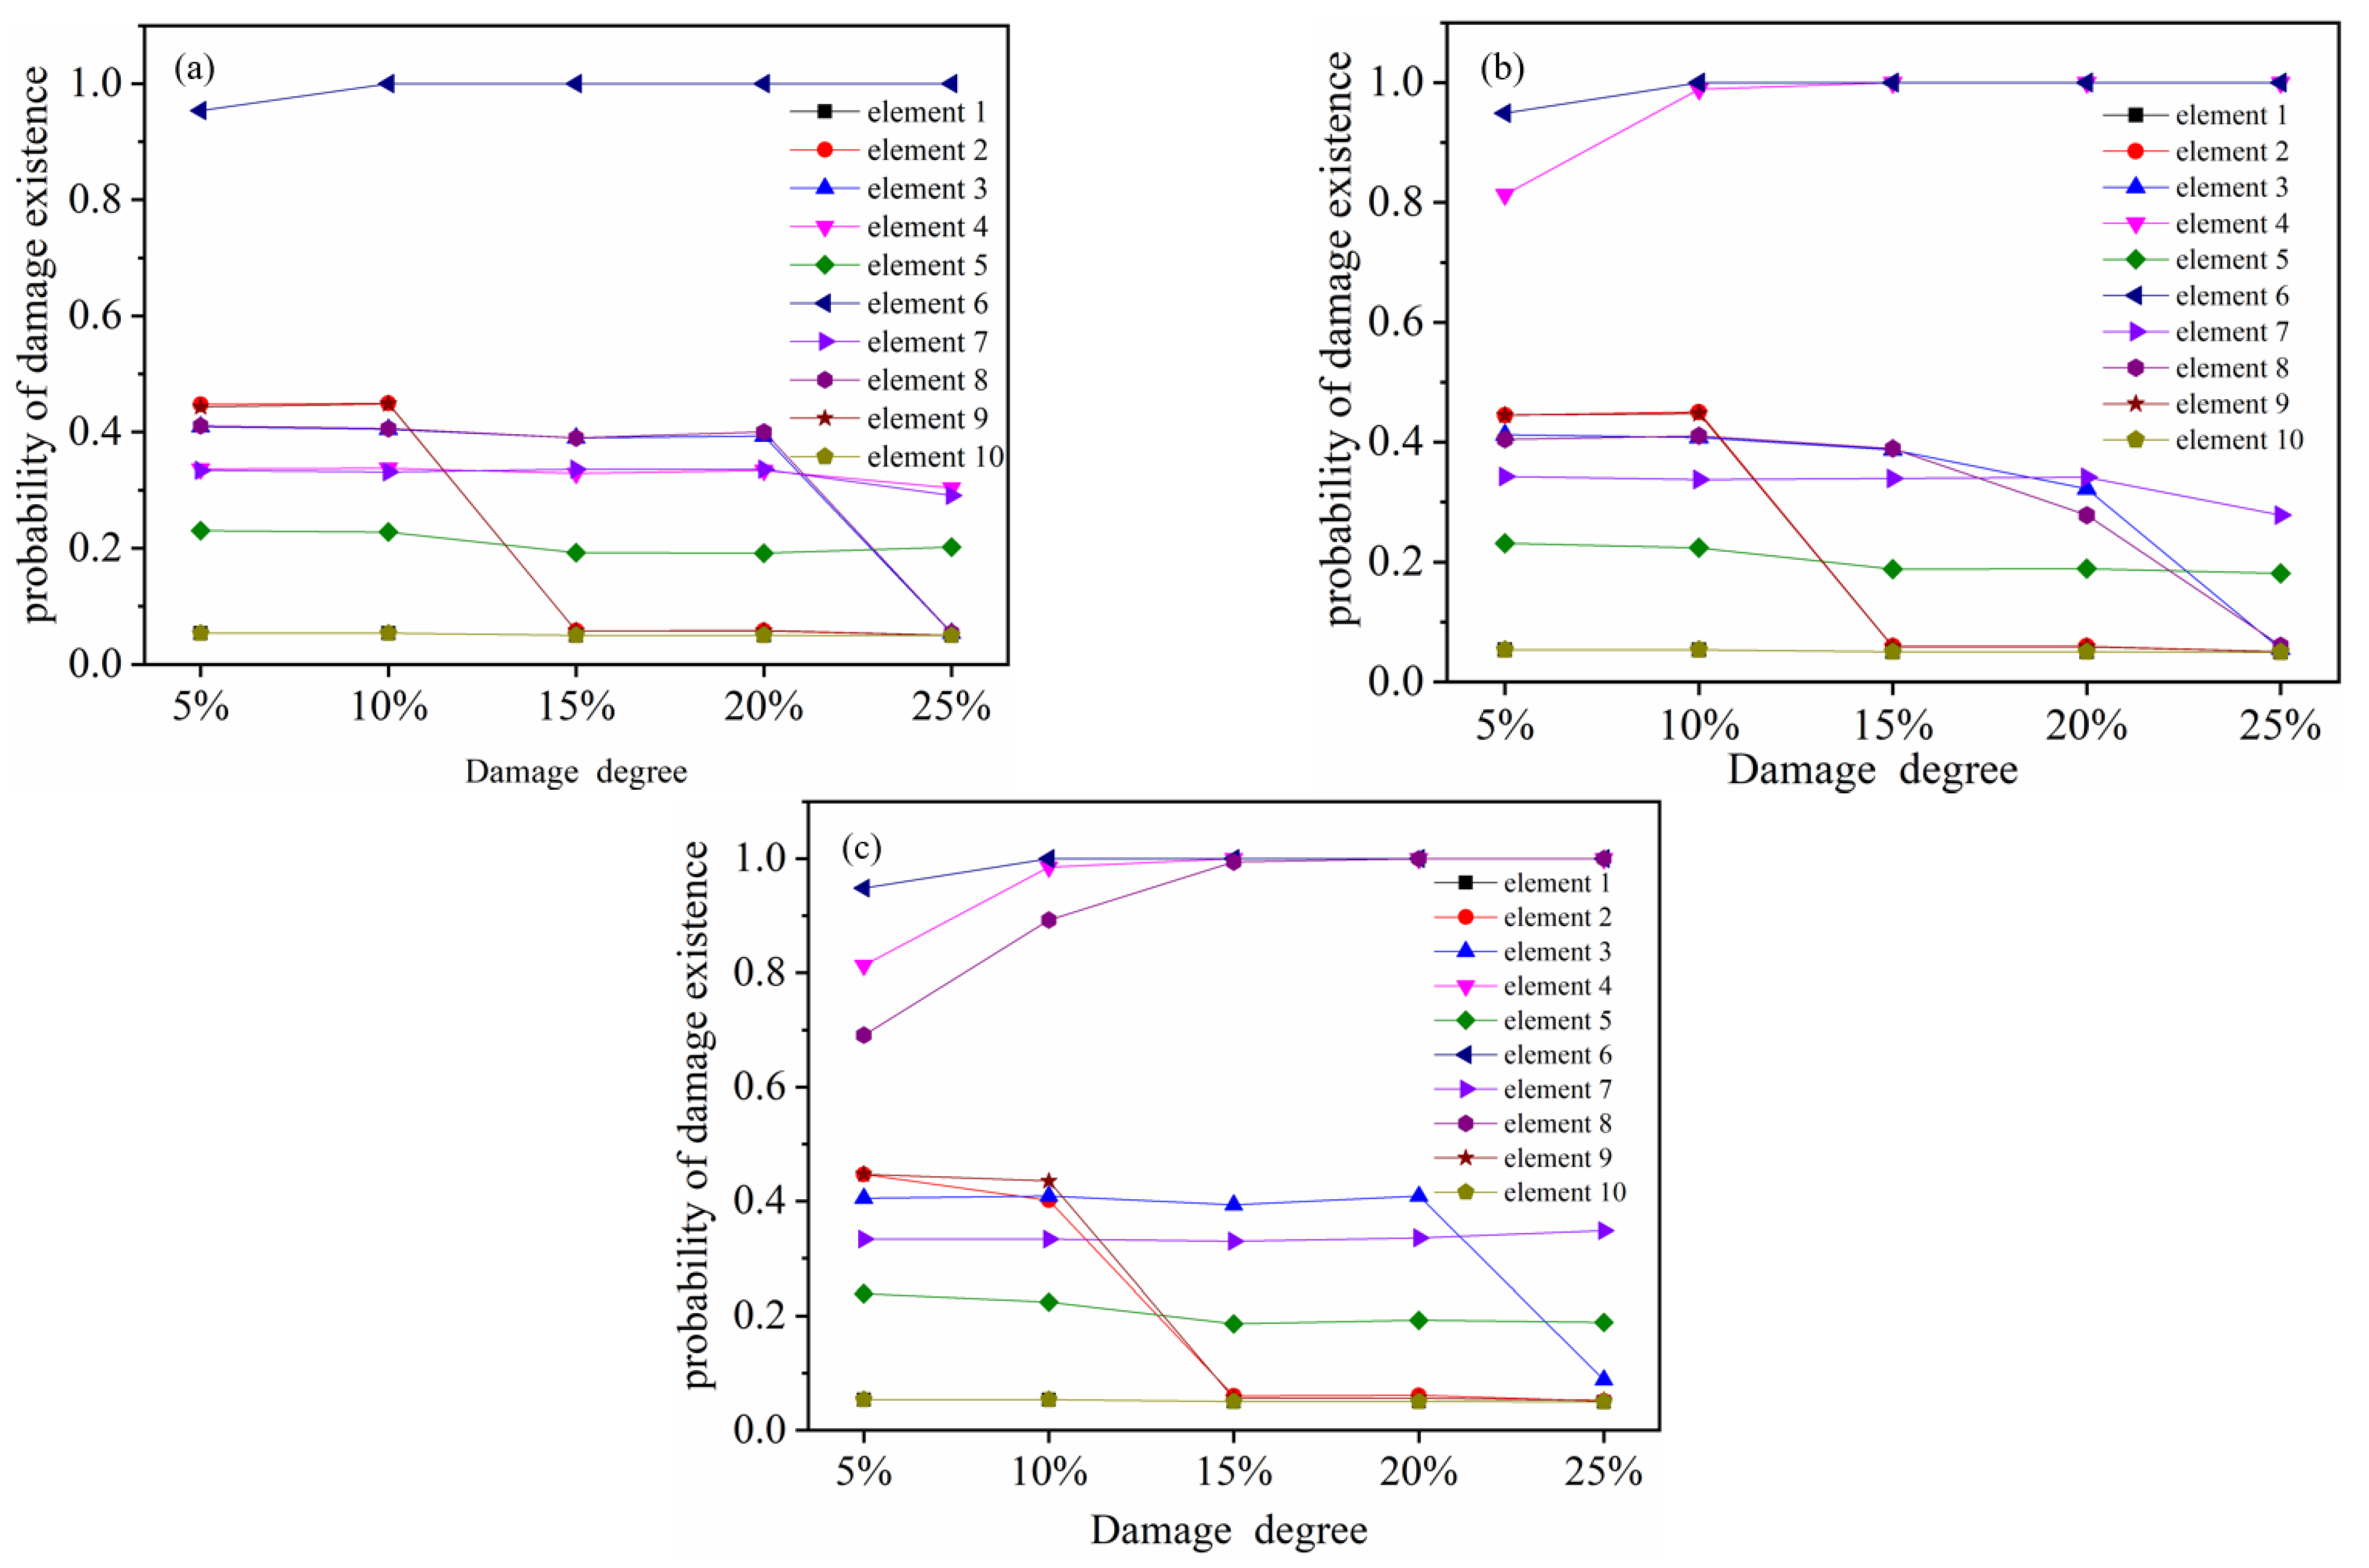
3.4. Influence of Damage Severity on Probabilistic Damage Detection
To study the impact of changes in damage severity on damage detection, the severity levels of the damaged components are systematically modified while keeping other variables constant, which are set as 5%, 10%, 15%, 20%, and 25%, respectively. Other parameters are the same as those of numerical example 3.1. The damage conditions presented in
Table 1 are utilized and the results of damage probability of each element are illustrated in
Figure 6.
As presented in
Figure 6, regardless of whether the damage occurs in a single element or multiple elements, the results of the damaged elements progressively increase and eventually tend to one as the level of damage increases. And for most undamaged elements, the values decrease gradually and finally tend to 0.05. Only elements 5 and 7, which are very close to the damaged elements, show no obvious changes. Therefore, it can be assumed that the greater the extent of damage, the more precise the damage detection outcomes become.
3.5. Impact of Noise on Probabilistic Damage Detection Results
Since noise is unavoidable in practical engineering, it is essential to examine how noise affects the efficiency of damage detection. To investigate the influence of noise on damage identification outcomes, the noise levels for each case are set at 0.5%, 1%, 2%, 3%, 5%, and 10%, respectively. The other parameters remain unchanged. The results of the probability of damage existence for each case are shown in
Figure 7.
In
Figure 7, the probability of damage existence is shown for different noise levels ranging from 0.5% to 5%. Our findings reveal that, irrespective of whether a single element is damaged or multiple elements are affected, as the noise level progressively increases, the results in the damaged elements gradually decreases. Conversely, the healthy elements tend to remain stable, with minimal or no variation. For example, the probability of damage existence in element 6 in case 1 is larger than 98% when noise levels vary from 0.5% to 3%, while the detection result decrease significantly with the value of 80%, when the noise levels are at 5%. It is worth noting that the damage can still be detected in this noisy situation. With the further increase in noise levels, the detection result is nearly the same as in the undamaged element. Therefore, this method could produce false positive results when the noise level is higher than 8%. However, in practical engineering applications, the noise level can be effectively reduced through various noise mitigation techniques, thereby demonstrating the method’s continued applicability and effectiveness.
3.6. Effect of Different Boundary Conditions on Probabilistic Damage Identification
To investigate the impact of boundary conditions on damage detection results and demonstrate the effectiveness of the proposed method for various FG beams, only the boundary condition is changed. The four types of the boundary condition models are shown in
Figure 8 and the other parameters along with damage conditions remain unchanged. The results of the probability of damage existence for each case are shown in
Figure 9.
As depicted in
Figure 9, when the boundary conditions are different, the probability of damage of existence for each case is greatly affected. For the cantilever beam, whether for the one element (case 1) or multiple elements damaged (case 2), the damage identification results are not good. Specifically, the damage probability of the undamaged element on the clamped side is very close to that of the damaged element, which is prone to misjudgment. For example, the detection results of undamaged elements 1 to 5 are 46%, 48%, 49%, 49%, and 48%, respectively, which are very close to the damaged element 6 with a value of 65% in case 1. On the side of the cantilever end, both the damaged element and the undamaged element have a small probability of damage, so it is easy to make mistakes. This phenomenon may be attributed to the insensitivity of MSE changes at the cantilever end to the occurrence of damage.
For the simply supported beam, whether it is a single element damaged or multiple elements damaged, the damage identification effect is good. The results for the undamaged element at the boundary of both ends are very small. The probability of existence of damage to the undamaged element near the damaged element has an increasing trend, but it is still relatively small compared with the damaged element. For the beam with clamped-simply boundary conditions, the results of the damaged component are significant, thus allowing for the identification of the damaged element. However, the damage probability for the undamaged one at the left clamped end is higher compared to that of a simply supported beam. Additionally, the condition at the right simply supported end resembles that of a simply supported beam. For a beam with clamped–clamped boundary conditions, when one element (element 4) and two elements (elements 4 and 6) of the clamped beam at both ends are damaged, the damaged element can be identified. However, when three elements (elements 4, 6, and 8) are damaged, the probability of the damage of element 8 is very small and cannot be accurately identified. At the clamped ends on both the left and right sides, the damage result resembles that of the left clamped end of the simply clamped beam.
Generally, different boundary conditions have a great impact on the damage detection results. The clamped end and cantilever end have a prominent impact on the damage identification results, which makes the identification results unstable compared with the simply supported end. Therefore, the method presented in this paper can be improved to solve the adverse influence of clamped and cantilever boundary conditions in the future.
4. Conclusions
This paper presents a probabilistic statistical damage detection approach for FG Euler–Bernoulli beam structures, utilizing the sensitivity of element modal strain energy. The probability of damage existence, which can determine whether the beam structure is damaged or not, is calculated for each element. The influence of damage severity, boundary condition, and noise level on the detection effect are also considered. A numerical simply supported beam has confirmed this, and the conclusions can be presented as follows:
(1) The numerical outcomes confirm that the suggested approach provides an effective method for identifying damage occurrence in FG Euler–Bernoulli beams. Regardless of whether it involves damage to a single element or multiple elements, results show that the probability of damage existence for the damaged element tends to 1, while for undamaged elements the results are much smaller with the value of 0.05, especially for the elements near the support. It is worth mentioning that the undamaged elements close to the damaged ones may have a maximum probability of damage existence of 0.4. Even so, the value still much smaller than in the damaged elements. Thus, the proposed method, based on element modal strain energy sensitivity approach, is applicable to FG Euler–Bernoulli beams.
(2) As the severity of damage increases, the probability of damage existence in the damaged components gradually rises and eventually approaches a value of 1. In contrast, for the healthy one it slowly diminishes and ultimately converges to 0.05. As a result, it can be concluded that the greater the extent of damage, the more precise the outcomes of damage detection become.
(3) As the noise level continues to increase, the results of the damaged elements decrease gradually, while the healthy structures remain stable. When the noise level is higher than 8%, the proposed approach may produce false positive results, which can be attributed to measurement noise and modeling errors that render the changes in MSE less discernible. However, when the noise level is not higher than 5%, it can provide an effective way to detect damage locations.
(4) Different boundary conditions have a great impact on the damage identification. In contrast to the simply supported end, the clamped and cantilever ends have a prominent impact on the damage identification results, making the identification results unstable.


