Article

Advanced Damage Monitoring in Beam Structures Using Grey Wolf Optimizer and Additional Masses

1
Department of Structural Engineering, Faculty of Engineering, Zagazig University, Zagazig 44519, Egypt
2
Department of Civil Engineering, Southern Illinois University Edwardsville, Edwardsville, IL 62026, USA
*
Author to whom correspondence should be addressed.
Buildings 2025, 15(2), 279; https://doi.org/10.3390/buildings15020279
Submission received: 27 November 2024 / Revised: 14 January 2025 / Accepted: 15 January 2025 / Published: 18 January 2025
(This article belongs to the Special Issue Recent Developments in Structural Health Monitoring)

Abstract

Dynamic characteristics are of significant interest to researchers in the field of damage detection. Among these, natural frequencies stand out due to their high accuracy and resistance to noise. However, relying solely on natural frequencies is often insufficient for determining the depth and location of damage. To address this limitation, additional masses can be strategically placed at different locations on structural elements, altering the natural frequencies. Each mass placement creates a distinct dynamic scenario with a unique frequency profile, enabling a more comprehensive analysis. In this study, additional masses were introduced at specific elements of the beam structure within the numerical model which were then strategically placed at various locations along the beam. The resulting shifts in natural frequencies served as inputs to the Grey Wolf Optimizer (GWO), which identified elements with stiffness reductions indicative of damage. A custom MATLAB code was developed to perform finite element analysis on the numerical model. The results were validated against previously published experimental data, demonstrating the method’s reliability with a 5% difference. A parametric study involving both simple and continuous span beams was performed. The procedure effectively detected damage severities of 10%, 25%, and 50%, with corresponding errors of 4.3%, 0.44%, and 0.02%, respectively.

1. Introduction

Structural systems may degrade over time due to aging or may suffer significant damage from sudden catastrophic events like earthquakes, explosions, or hurricanes. Consequently, monitoring the health of these structures is essential for the early detection of damage, helping to avert potential disasters [1]. Damage detection in structural elements is a critical aspect of structural health monitoring (SHM), which plays an indispensable role in ensuring the safety, durability, and longevity of infrastructure such as bridges, towers, dams, and buildings. As the demand for robust and reliable infrastructure increases globally, the need for advanced techniques to detect and monitor structural damage has become more pressing.
Over the past few decades, a variety of non-destructive testing techniques have been developed, including vibration analysis, ultrasonic testing, and modal analysis. Among these, dynamic-characteristic-based methods, which rely on modal shapes and natural frequencies, have shown great potential due to their sensitivity to structural damage [2,3]. The process of detecting damage in structures has been an interesting topic for many scientists and researchers. Researchers remain focused on developing new or improved methods, emphasizing techniques that apply to entire structural elements without causing collateral damage. To detect the damage, lots of non-destructive testing are used, such as ultrasonic techniques, visual inspection, eddy current method, radiography methods, acoustic emission, magnetic methods, and dynamic-characteristics techniques [4,5,6].
Dynamic-characteristics techniques are effective methods of detecting damage in different structure types [7,8,9,10,11]. The dynamic techniques depend on one or more of the dynamic characteristics of the structure. Modal shapes, natural frequencies, and damping parameters are the dynamic structural characteristics that are affected by damage. These effects occur due to the change in the local stiffness and energy dissipation characteristics. By studying one or more of these dynamic characteristics, the damage location and severity can be detected.
Despite the high sensitivity of damping to damage, its drawback is that its parameters are difficult to measure and are strongly influenced by environmental factors, loading, and boundary conditions [12]. The changes in mode shapes also give indications of structural damage and detect its location and severity. However, the main defect is a high affection for noise, especially in small damage when the noise level is higher than the changed value in mode shapes between damaged and undamaged structures.
The covariance-driven stochastic subspace identification method along with silicone rubber-packaged FBG sensing information were used for identification purposes.
The covariance-driven Stochastic Subspace Identification (SSI) method is utilized to analyze sensor responses and extract the structure’s modal parameters. Building on this approach, an improved damage identification index is introduced, designed to reduce the influence of support and excitation positions on the accuracy of damage detection [13,14].
The structure mode shapes could be combined with wavelet analysis to detect the damage in beam and plate structures accurately [15,16]. The mode-shape-curvature-based algorithm was used to detect the location and severity of the damage in plate structures. This method has an advantage, such as it needs the damage case mode shapes only [17]. The continuous symmetry measure could be used for measuring the symmetry of structural mode shapes as a feature for damage detection in structural health monitoring [18]. Mode shape curvature and damage locating vector methods were considered for predicting damage to structures [19]. Output-only data of damaged structures can be used to reconstruct and identify the modal shapes of the uncracked structure. After that, the curvature modal shapes were used to locate the damage as a damage-sensitive feature [20,21]. Using operational deflection shapes (ODS) has demonstrated improved sensitivity in detecting and localizing beam damage. ODS, which captures deformation responses across a wide frequency range, offers superior detection capabilities compared to traditional modal analysis [22].
The mode-shapes method requires accurate acceleration or displacement measurements on the surfaces of damaged and undamaged structures with a good distribution of the sensors and a sufficient number of measurement points [23]. This makes the natural-frequencies method the best and easiest of the dynamic-characteristics techniques because it is less affected by noise, its high accuracy in detecting damage, and its severity with easy practice in the field [24,25,26].
To find the damage location in a cantilever beam, a natural-frequency method was proposed [27]. In this method, the cantilever beam is discretized into several zones, where the first four normalized natural frequencies for each zone are classified [27]. Also, the transverse mode’s first three natural frequencies were evaluated. Based on this, the behavior of cracked and healthy beams is compared and discussed. It was concluded that the transverse vibration’s natural frequency could be used to detect a damaged location and the severity of the damage on the cantilever shaft beam [28]. The objective function was the change in the natural frequencies of the structure due to the existence of a crack. Particle Swarm Optimization was used to locate the damage and its severity in beam-like structures [3]. Relative natural frequency changes were used to detect single and multiple cracks in beam structures, and the concept of relative-natural-frequency-change curves for local damage characterization was presented [29].
The natural frequencies can be used with structure mode shapes to localize the damage and its severity in different types of structures. The use of the two dynamic characteristics can improve the result accuracy [30,31,32,33].
Adding mass to damaged structures can improve the sensitivity for the detection of damage [34,35]. The contact-point response of a moving test vehicle is adopted for the damage detection of bridges [36]. Additionally, moving or parked vehicles can be used as additional masses in the process of bridge damage detection [9]. Adding virtual masses to the tank structures can also be used to detect damage. The virtual distortion is used to deduce the frequency-response function of a structure with additional virtual masses [37]. In another study, a structural parameter identification method for damped structures was introduced, using additional known masses [38]. The method does not require an initial guess for system parameters, reduces computational cost, and can detect multiple damages without compromising accuracy. The algorithm, which identifies mass, stiffness, and damping coefficients from modal parameters, was validated through numerical simulations and experiments.
Optimizer algorithms are required to identify the location and severity of the damage. The Grey Wolf Optimizer (GWO) is a new meta-heuristic method that was inspired by grey wolves. The GWO algorithm mimics the hunting mechanism and leadership hierarchy of the grey wolves in nature. The GWO algorithm yields highly competitive results compared to other established meta-heuristic techniques [39]. An improved Grey Wolf Optimizer algorithm is developed for the optimal design of structures [40].
Techniques like the gapped-smoothing method (GSM) and the global-fitting method (GFM), when paired with ODS data, have been experimentally validated on both small-scale and large-scale beam structures, showing remarkable accuracy in identifying damage with slight severity [41]. Recent comparative studies have evaluated various damage detection methods, including the global-deviation method (GDM), the finite-element methods (FEM), and vibration-based techniques using optimization algorithms like the GWO. These studies highlight that techniques using ODS outperform others in terms of sensitivity to subtle damage [42]. Furthermore, FEM paired with machine learning, such as artificial neural networks (ANN), has been successfully used to predict crack severity in steel beams, offering another promising approach [42].
Building on the existing literature, the use of additional masses has demonstrated significant accuracy in identifying dynamic characteristics, such as natural frequencies, which exhibit reduced sensitivity to noise in damage detection applications. Furthermore, the GWO has proven to be highly effective in addressing complex optimization problems. This paper aims to enhance the application of additional masses and natural frequencies to accurately identify and locate damage in structural systems.
This paper presents a damage detection method that involves strategically adding additional masses to the structure to assess various dynamic responses. A tailored MATLAB code was created to analyze the data and precisely identify both the location and severity of damage using a combination of the GWO and finite-element analysis (FEA). Experimental and numerical validations were performed to confirm the accuracy of the dynamic parameter computations and the overall effectiveness of the damage detection approach. Detailed case studies were conducted to validate the procedure, examining three types of beam structures: a simply supported beam, a two-span beam, and a three-span beam, each with different damage severities and locations.

2. Additional Masses and Natural Frequency

Each structural element possesses unique dynamic characteristics, which are influenced by a range of variables. Among these, the natural frequency stands out as a crucial dynamic property, and it is the central focus of this paper. The natural frequency of a structural element is fundamentally determined by its mass and stiffness, which directly impacts its vibrational response. To calculate the natural frequencies using finite-element analysis (FEA), the eigenvalue problem must be solved. This is represented by the following relation:
K Φ = λ M Φ
where M and K are the global mass matrix and stiffness matrix of the beam, and λ and Φ are the eigenvalue and the corresponding eigenvector of the beam, respectively. The natural frequencies are driven from λ.
For a beam structure, the mass and stiffness matrices can be determined as follows: The beam is discretized into (n) finite elements, and the stiffness and mass matrices for each element are computed individually, as shown in Equations (2) and (3). These individual element matrices are then assembled into the global stiffness and mass matrices of the entire structure.
K = E A / l 0 0 0 12 E I / l 3           6 E I / l 2 0 6 E I / l 2           4 E I / l E A / l 0 0 0 12 E I / l 3 6 E I / l 2 0 6 E I / l 2 2 E I / l E A / l 0 0 0 12 E I / l 3 6 E I / l 2 0 6 E I / l 2 2 E I / l E A / l 0 0 0 12 E I / l 3 6 E I / l 2 0 6 E I / l 2 4 E I / l
M =     ρ A l 420   140 0 0 0 156           22 l 0 22 l         4 l 2 70 0 0 0 54 13 l 0 13 l 3 l 2 70 0 0 0 54 13 l 0 13 l 3 l 2 140 0 0 0 156     22 l 0 22 l           4 l 2
where ρ , E, A, L, and I are density, modulus of elasticity, cross-section area, element length, and element inertia, respectively.
Structural damage is commonly modeled as a reduction in the stiffness of the affected elements. The extent of this reduction depends on the type and magnitude of damage present within the structural member. This reduction in stiffness, in turn, alters the overall stiffness matrix of the element, leading to changes in the natural frequencies of the damaged structure. As a result, the natural frequencies of a damaged structure differ from those of an undamaged (healthy) one. By analyzing the shift in natural frequencies, it becomes possible to infer the presence of damage, as well as to estimate its location and severity. In addition to natural frequencies, damage in structures also impacts other dynamic properties, such as modal shapes and damping characteristics.
While changes in natural frequencies provide valuable information, they are often insufficient by themselves to pinpoint the exact location and severity of damage [9]. To address this limitation, a more advanced approach involves introducing additional masses to the structural elements. The addition of mass modifies the mass matrix, as described by Equation (3). This modification, in turn, alters the total mass matrix of the structure, resulting in changes to the dynamic characteristics, including the natural frequencies, as governed by Equation (1). The introduction of additional masses increases the sensitivity of the system, making it possible to observe more noticeable shifts in dynamic properties. By examining how these changes manifest in the natural frequency values, it is possible to gain a deeper insight into the structural behavior and improve damage detection capabilities.
In the following example, the effect of adding masses to a structural element will be demonstrated, illustrating how this adjustment leads to noticeable changes in the natural frequency values, thus enhancing the accuracy of damage detection and localization. 
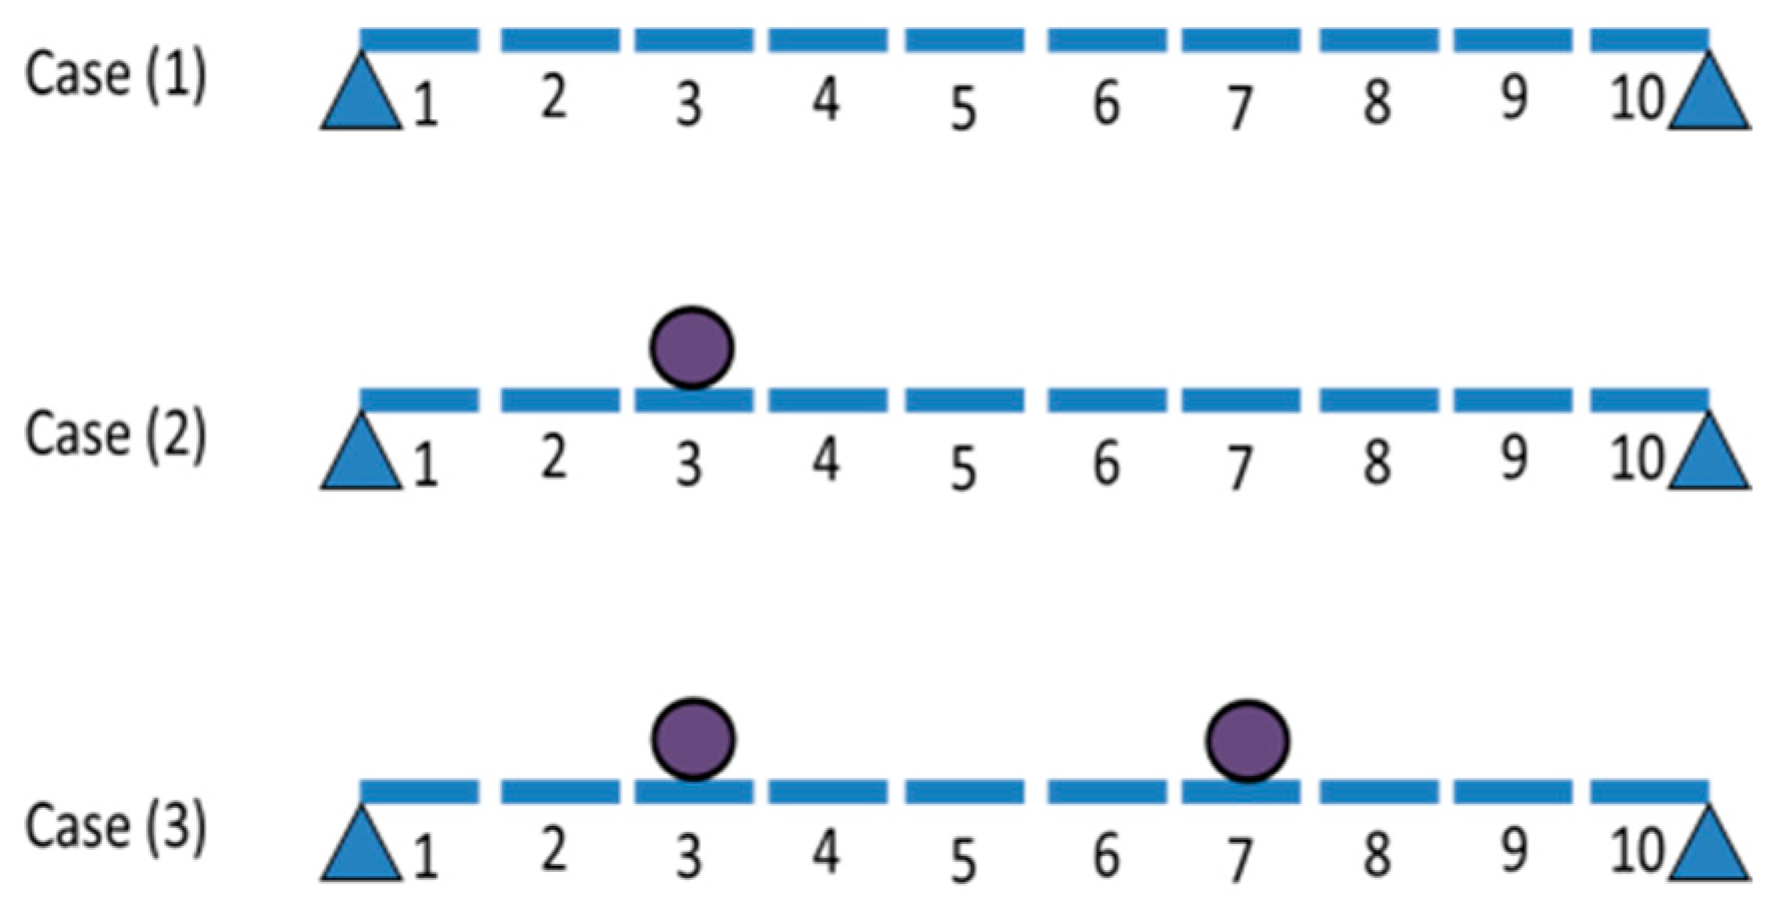
Figure 1 illustrates the studied 100 cm simple beam, which is divided into ten elements and analyzed under three distinct cases. In the first case, no additional masses are added to the beam. The second case introduces a single additional mass, while the third case incorporates two additional masses at different positions along the beam.
The beam’s key parameters include a modulus of elasticity of 2.2 × 10⁵ kg/cm2 and a cross-sectional area of 30 × 50 cm. Table 1 presents the influence of these additional masses on the beam’s natural frequencies across the three cases studied. The additional masses are equal to three times the element mass and it is applied by multiplying the element mass matrix at a targeted location by four. It is evident that the addition of masses leads to a decrease in the natural frequencies, particularly in the first four frequencies. The location of the added masses plays a crucial role in altering the natural-frequency values. These changes provide valuable insights into the structural behavior, as each variation in mass placement results in distinct natural-frequency shifts. This enhances the ability to detect the damage location and assess its severity more accurately, as further explained in the subsequent sections. The precise measurement of these frequency changes allows for improved damage detection, making the method more reliable for pinpointing the extent and location of damage.

2.1. Grey Wolf Optimizer

In this paper, the GWO is employed as the optimization technique. The GWO offers several key advantages that make it ideal for structural damage detection and optimization tasks. Its simplicity and ease of implementation allow for straightforward adaptation to complex problems, while its strong global search capability ensures effective exploration of nonlinear and multi-dimensional solution spaces. The algorithm’s adaptability to various constraints and its competitive performance compared to other optimization methods further highlights its suitability for damage detection in structural health monitoring. The GWO algorithm simulates the leadership hierarchy of grey wolves, utilizing four types of wolves—beta, alpha, omega, and delta—to guide the search process. Each wolf type plays a distinct role in the optimization process, mimicking the social behavior observed in real wolf packs. The GWO algorithm searches for the optimal solution by simulating the natural hunting and attacking strategies of grey wolves. To perform the optimization, a MATLAB (R2024b) code was developed, and three main steps were implemented: hunting, prey searching, encircling prey, and attacking. These steps mirror the wolves’ behavior in nature, where the wolves work collectively to track down and capture prey. The optimization process is designed to find the best match between the calculated and measured dynamic characteristics, thereby identifying the location and severity of the structural damage [39].
The parameters used in the GWO algorithm, such as the population size, and maximum iterations, were carefully chosen to balance optimization efficiency and computational resources. The population size was selected to ensure a sufficiently large search space for global exploration while maintaining manageable computational costs. The maximum number of iterations was determined based on convergence criteria, ensuring that the algorithm had adequate time to reach an optimal solution.

2.2. Additional Masses Procedure

Figure 2 illustrates the damage detection procedure using the additional masses. The proposed method involves a non-destructive experimental procedure to detect structural damage. The following steps outline the procedure:
  • Structure data: gather real structural data, including dimensions, materials, and load conditions, from the damaged structure.
  • Dynamic excitation: select a non-destructive dynamic excitation, such as impact loading, to induce vibrations in the structure.
  • Data collection: Measure the dynamic response of the damaged members such as acceleration history. Repeat the previous step with and without additional masses, while varying the mass locations. Each change in mass location corresponds to a new case, and the number of cases influences the accuracy of the solution.
  • Dynamic parameters: Use the acceleration data to evaluate the natural frequencies for every case. SeismoSignal software can be used to do that.
  • Optimization process:
    • Finite-element analysis (FEA): divide the structural member into small elements based on the required accuracy for detailed modeling.
    • Initial damage index: assume an initial random distribution of damage indices across the structural elements for optimization initialization.
    • Dynamic analysis: perform dynamic analysis for each of the field-based cases from step C and evaluate the dynamic characteristics for comparison.
    • Objective function calculation: use Equation (5) to compute the objective function, which will guide the optimization process.
    • Optimization with GWO: update the damage index using the GWO algorithm, adjusting the damage estimates iteratively.
    • Iteration for convergence: repeat steps 3–6 to solve the optimization problem, refining the damage indices.
  • Final damage identification: the optimized damage indices will pinpoint the specific damaged elements of the structural member, providing an accurate assessment of the damage location and severity.
The damage index (DI) is chosen as the relative rigidity between the cracked and healthy element:
DI = ( E I ) d ( E I ) h
where index d refers to the damaged case and index h refers to the healthy case.
The FEA and GWO were executed using MATLAB software to effectively detect structural damage. FEA is employed to model and simulate the structural behavior, while the GWO is applied as an optimization technique to search for and locate damage by comparing the simulated results with measured dynamic characteristics. This integrated approach leverages the computational power of MATLAB to enhance the accuracy and efficiency of damage detection in complex structural systems. The objective function of the optimization problem is:
min J ( DI ) = j = 1 n m i = 1 n e λ r , i - λ f , i λ u , i j
where J(DI) is the updating parameter, index r denotes the field measurement, f FEA result, u undamaged case, and nm and ne refer to the number of additional mass cases and eigenvalues, respectively.

3. Numerical Case Studies

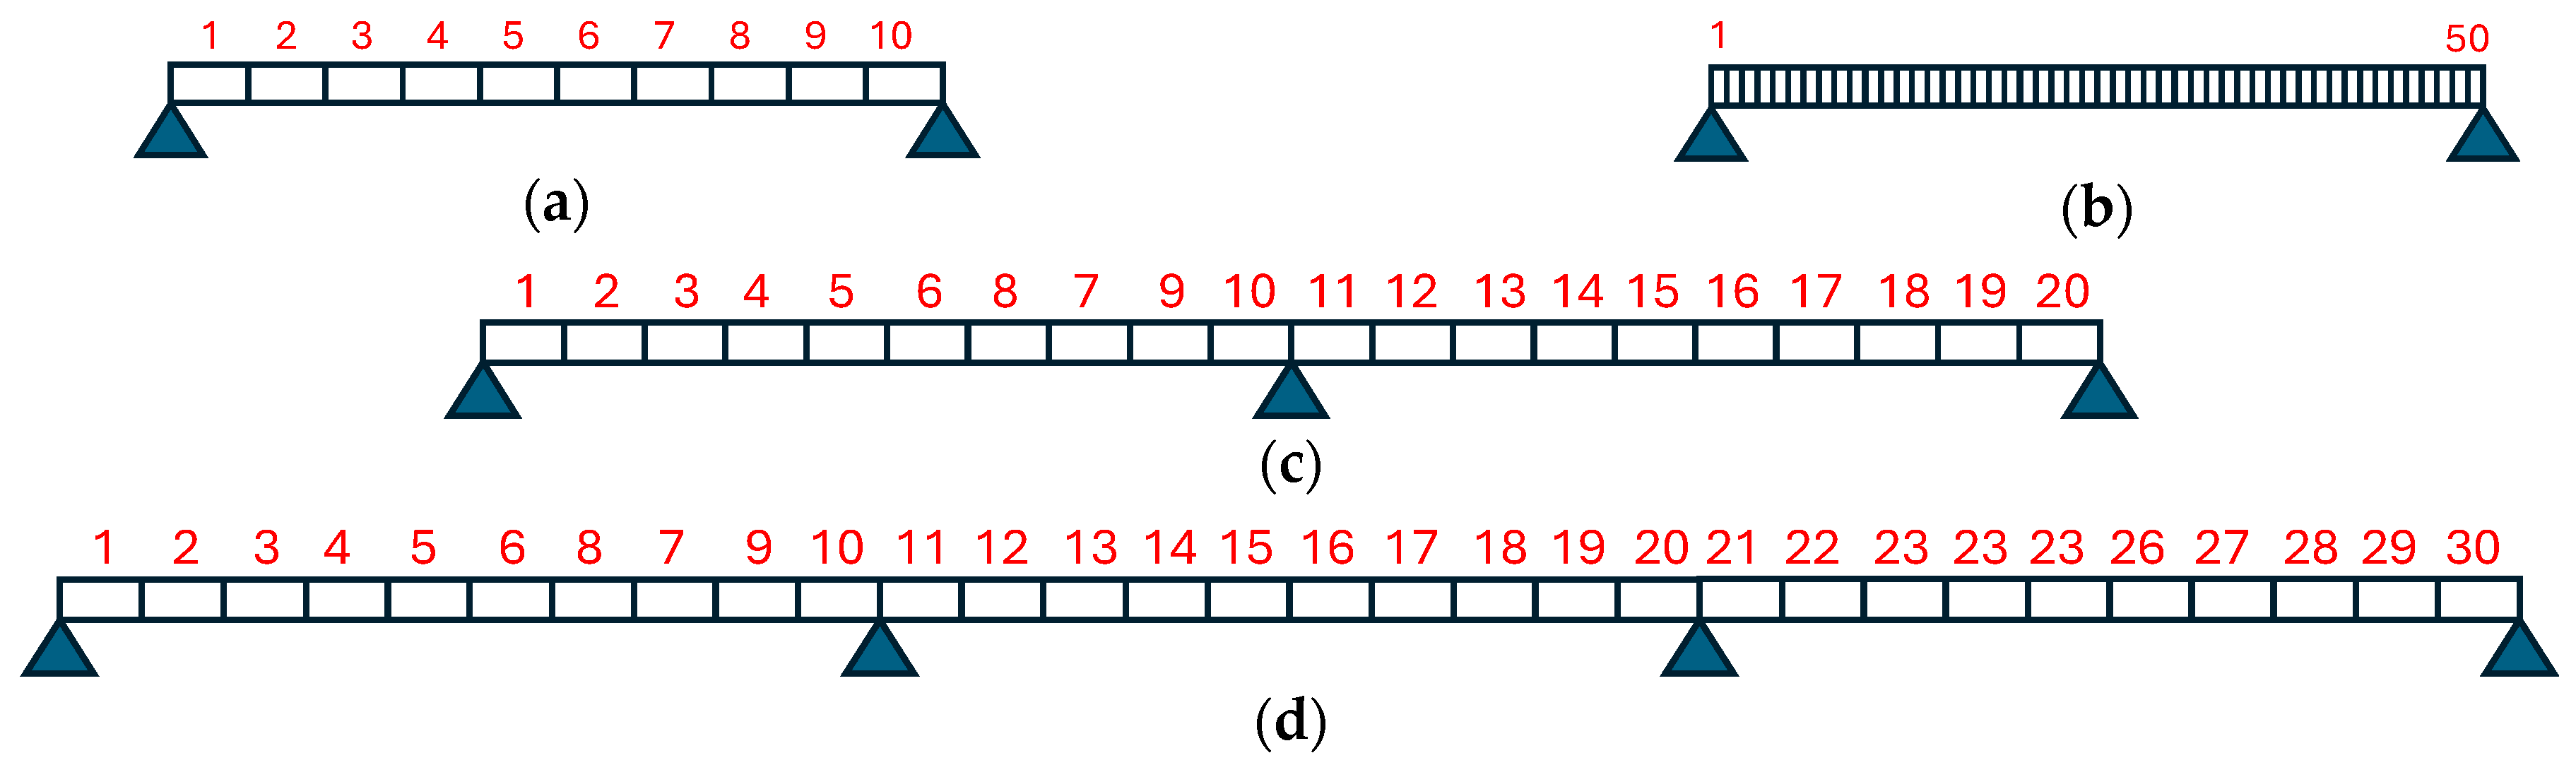
In this study, three distinct cases of a plain concrete beam are utilized to validate the effectiveness of additional masses and the GWO method. The 16 cases include a simply supported beam, a two-span continuous beam, and a three-span continuous beam, each subjected to different loading scenarios. These beam configurations, as illustrated in Figure 3a–c, represent a variety of real-world structural conditions, allowing for comprehensive testing of the proposed method under diverse scenarios. The cases in Figure 3a,b investigate the effect of the number of divisions on the simply supported beams. The cases in Figure 3c,d investigate the multispan beams.
The damage in the beam is modeled as a reduction in its flexural stiffness (EI), where the severity of the damage is represented by a percentage decrease in the EI value for the affected elements. The level of this reduction is detailed in Table 2, which provides a clear correlation between the level of damage and the corresponding decrease in flexural stiffness. This approach allows for a quantifiable representation of damage severity, essential for accurate damage detection and analysis.
The natural frequencies of the structure are utilized to detect both the location and severity of cracks in the beam.
Instead of experimental measurements, the damaged structure was built and solved under impact load using the CSI SAP2000 v21 finite element software for validation purposes. Two distinct cases were considered, one with additional masses added to the structure and one without. SAP2000 is a widely used general-purpose structural analysis and design software developed by Computers and Structures, Inc. (CSI). It is used for analyzing and designing buildings, bridges, dams, towers, and other structural systems. SAP2000 offers a comprehensive range of analysis types, including static, dynamic, linear, and nonlinear analysis, making it suitable for both simple and complex structural systems [43,44].
Two-node frame elements are employed to represent the beam, with each node having three degrees of freedom. The impact on the beam is introduced through a time-history case, specifically a half cubic sine function, which serves as the excitation source [45]. The resulting acceleration response to this impact is captured and can be measured at any node along the beam within SAP2000.
In experimental testing, measurements are influenced by noise, which varies based on the complexity and precision of the instruments and devices employed. To assess the robustness of the damage detection methods, artificial random noise was introduced to the simulated acceleration data. A Gaussian random number normal distribution with a zero mean and standard deviation (1) was used to apply the noise level of 2 × 10⁻³ as a ratio of the acceleration value [21]. To extract the natural frequencies of the cracked beam from the acceleration data, SeismoSignal 2022 software is employed. SeismoSignal is a software tool developed for processing and analyzing earthquake ground motion data [46]. It is particularly used to analyze accelerometer data, such as acceleration time-history signals, and to extract important seismic parameters for structural engineering applications. This software processes the acceleration response to determine the natural frequencies, which are then analyzed to detect the presence, location, and severity of the cracks in the beam. The use of both SAP2000 and SeismoSignal ensures accurate modeling, simulation, and frequency extraction, facilitating a more reliable assessment of structural integrity.

4. Experimental Validation

The accurate calculation of dynamic parameters is a critical step in the damage detection process. Before analyzing the cases outlined in Figure 3, it is essential to validate the computed-natural-frequency values against experimental results. This validation ensures the reliability and precision of the dynamic parameter calculations, forming a robust foundation for the subsequent damage detection analysis.
To validate the proposed step, experimental test results were used which were conducted on a steel cantilever beam measuring 750 mm in length, 25 mm in width, and 6 mm in thickness [29]. A 1 mm deep crack was introduced at a distance of 375 mm from the fixed end of the beam, simulating structural damage. The beam was excited using an impact hammer positioned 500 mm from the fixed end, and acceleration responses were recorded using an accelerometer placed at 700 mm. These measurements were taken for both the healthy and damaged beam cases. Because of the damage in the middle, the cantilever beam was divided into eleven elements to have a middle element. The damage was applied to element number six. The inertia reduction equals the ratio between the cracked and un-cracked element cross-section inertia.
The natural frequencies for the first four modes of vibration were determined using Seismo-Signal software, which processed the acceleration data from the beam. These experimental results were compared to the numerical simulations performed using SAP2000 and MATLAB. The cracked and healthy beam natural frequencies for both the experimental and numerical models are presented in Table 3. The results show excellent agreement between the experimental data and the numerical model, with frequency deviations of less than 2%.
The maximum error ratio is 1.84%, which may be sourced from the noise in the experimental results.

5. Case Study Results

In this section, the results of the three cases under investigation will be discussed.

5.1. Simply Supported Beam

To investigate the effect of noise, Figure 4a illustrates a simply supported beam modeled with 10 elements, subjected to damage severities of 10% with and without a simulated data noise of 2 × 10⁻³ as a ratio. It can be seen that at this level of noise, the procedure was able to predict the damage location and severity with an error of 5% for the case with noise and 4.3% for the case with no noise.
Figure 4a,b illustrate a comparison for a simply supported beam modeled with 10 elements, subjected to damage severities of 10% and 50% at the same location. In both scenarios, the proposed procedure accurately identified the damage location. The error in estimating damage severity was −5% for the 10% damage case and −0.02% for the 50% damage case. These results demonstrate that the procedure effectively detects damage severity across both low and high damage levels with acceptable accuracy, although, the accuracy becomes higher by increasing the damage severity.
Figure 4b,c present a comparison between a simply supported beam modeled with 10 elements and one with 50 elements. The actual damage location corresponds to element number 4 in the 10 elements case and 20 in the 50 elements case, with a damage level of 50%, as specified in Scenario 2. In both cases, the proposed method accurately identified the damage location, demonstrating its robustness. For the beam divided into 10 elements, the damage was located at element number 4, while for the beam with 50 elements, it was pinpointed at element number 20.
Both cases align with a damage location at 40% of the beam’s span, irrespective of the discretization level. However, the predicted damage severity differed from the actual value by less than 1% in the 10-element case, compared to a 7% discrepancy in the 50-element case, see Table 4. This higher variance in the 50-element scenario can be attributed to the larger search space inherent in finer discretization which affects the accuracy of the optimization algorithm.
Figure 5 provides detailed insights into the detection of damaged elements in a simply supported beam under varying scenarios. As seen in Figure 5a,b, the analysis reveals that when only one element is damaged, the proposed technique achieves remarkable accuracy in pinpointing both the location and severity of the damage, irrespective of the severity level. The maximum difference of this case was 0.44% for the 10-elements case, Table 4.
In cases involving two damaged elements, the detection accuracy shows a slight decline, especially for low-severity damage, where the difference between estimated and actual severity is approximately 3.72% for 25% damage and 0.5% for 50% damage. This reduction in accuracy can be attributed to the more complex impact of multiple damaged elements on the structural stiffness matrix, which can obscure subtle changes in natural frequencies. However, for cases involving significant damage severity, i.e., the 50% case, the method consistently provides precise results. The sharp differences in natural frequencies induced by severe damage create a distinct and identifiable signal that enhances detection reliability. This observation underscores the robustness of the method in handling both single and multiple damage scenarios, with an inherent advantage in detecting and quantifying more pronounced damages due to their clearer impact on dynamic characteristics. Finally, it can be concluded that the proposed procedure was able to predict both the damage location and severity accurately.

5.2. Two Continuous Spans Beam

Figure 6a–d show the damaged elements of the two continuous spans beam. It can be shown that the proposed technique was able to estimate the damage location and severity closely for single or double damages, where the detection error is 7.52% and 1.78% for the case of scenarios 1 and 2, respectively, see Table 5. While for the case of scenarios 3 and 4, the detection error is 9.88% and 1.68%, respectively.
It is also worth noting that some damage was detected in some undamaged locations with a severity of not more than 5%. That is because increasing the number of damaged elements has a bigger effect on the structural stiffness matrix than in the case of one damaged element. But when this damage is large, it causes a sharp difference in natural frequencies which is difficult to occur in other scenarios and its effect is clear, so it can be detected more accurately than in the case of the small one. Additionally, in the case of two continuous spans with more elements, the process of detecting damaged elements is more complicated than in the case of a single span, due to more scenarios that achieve results close to actual results.

5.3. Three Continuous Spans Beam

Figure 7a–f shows the damaged elements in three-continuous-span beams. It is shown that the technique detects approximately the damage location and severity, especially where multiple damages have occurred. The severity detection error is between 2.54 and 10.77% for the case of scenarios 3 and 4 and between 14.376 and 4.66% for scenarios 1 and 2. For the case of three spans found in scenarios 5 and 6, detection error is between 1.24 and 16.06%, respectively. It is also worth noting that some damage was detected in some undamaged locations with a severity of not more than 5% similar to the previous scenarios. That is because increasing the number of damaged elements has a bigger effect on the stiffness matrix that significantly affects the model shapes.
On the other hand, when this damage is large, it causes a sharp difference in natural frequencies which is difficult to occur in other scenarios and its effect is clear, so it can be detected more accurately than in the case of the small one. Additionally, in the case of three continuous spans with more elements, the process of detecting damaged elements is more complicated than in the previous two cases, due to more scenarios that achieve results close to actual results. It can be concluded that by increasing the damage severity the detection of the severity becomes easier. Table 6 summarizes the actual and estimated damage severities for all tested scenarios, alongside the respective estimation errors.

5.4. Statistical Analysis

To provide a more comprehensive evaluation of the Grey Wolf Optimizer (GWO) method’s accuracy, we computed statistical metrics including the Mean Absolute Error (MAE) and the Root Mean Square Error (RMSE) for all scenarios, Table 7. These metrics provide a clearer picture of the model’s performance across different beam structures and damage scenarios.
The MAE is defined as:
MAE = 1 n i = 1 n y i y i ^
where y i is the actual damage severity, y i ^ is the estimated severity, and n is the number of elements analyzed [39]. The RMSE provides a similar measure but gives more weight to larger errors:
RMSE = 1 n i = 1 n y i y i ^ 2
The RMSE provides a more sensitive measure to outliers, giving greater weight to larger deviations from the true value [31,40].
The results show that the MAE is below 5% for all scenarios, indicating that the GWO method performs well in predicting damage severity across different cases. The RMSE, which penalizes larger errors, remains within acceptable limits, showing that outlier errors do not heavily affect the overall prediction accuracy.

6. Conclusions

This paper presents a damage detection method that uses strategically placed additional masses using natural frequencies. Key conclusions are provided based on these findings.
  • The developed FEA algorithm demonstrated high precision in detecting natural frequencies, with a difference of less than 2%, making it well-suited for generating data for the optimizer. Across 16 studied cases, the GWO procedure accurately identified damage locations.
  • The procedure effectively detected damage severities of 10%, 25%, and 50%, with corresponding errors of 4.3%, 0.44%, and 0.02%, respectively. This shows that by increasing the damage severity, the detection accuracy increases.
  • For structures with a small number of elements, such as simply supported beams, the detection error was minimal, with a maximum of 0.44% for single-element damage and 3.73% for double-element damage.
  • For structures with a small number of elements such as two- and three-span beam structures, the maximum detection error was between 7.52% and 16.06%.
  • The work contributed to the health monitoring of the structure by introducing a highly efficient damage detection procedure using additional masses.

Author Contributions

Conceptualization, A.E.; Methodology, A.S., A.E. and S.E.; Software, A.S. and A.E.-S.; Formal analysis, S.E. and A.S.; Investigation, A.E.-S. and A.S.; Resources, A.E.-S. and A.E.; Data curation, A.S. and A.E.-S.; Writing—original draft, A.S.; Writing—review & editing, A.E.-S.; Visualization, S.E. and A.E.-S.; Project administration, A.E. All authors have read and agreed to the published version of the manuscript.

Funding

This research received no external funding.

Data Availability Statement

The original contributions presented in this study are included in the article. Further inquiries can be directed to the corresponding author.

Conflicts of Interest

The authors declare no conflicts of interest.

References

  1. Ditommaso, R.; Ponzo, F.C. Identifying Damage in Structures: Definition of Thresholds to Minimize False Alarms in SHM Systems. Buildings 2024, 14, 821. [Google Scholar] [CrossRef]
  2. Abdeljaber, O.; Avci, O.; Kiranyaz, S.; Gabbouj, M.; Inman, D.J. Real-Time Vibration-Based Structural Damage Detection Using One-Dimensional Convolutional Neural Networks. J. Sound. Vib. 2017, 388, 154–170. [Google Scholar] [CrossRef]
  3. Sha, G.; Radzieński, M.; Cao, M.; Ostachowicz, W. A Novel Method for Single and Multiple Damage Detection in Beams Using Relative Natural Frequency Changes. Mech. Syst. Signal Process 2019, 132, 335–352. [Google Scholar] [CrossRef]
  4. Collins, D. Damage Detection in Composite Materials Using Acoustic Emission and Self-Sensing Fibres. Ph.D. Thesis, University of Birmingham, Birmingham, AL, USA, 2010. [Google Scholar]
  5. Towsyfyan, H.; Biguri, A.; Boardman, R.; Blumensath, T. Successes and challenges in non-destructive testing of aircraft composite structures. Chin. J. Aeronaut. 2020, 33, 771–791. [Google Scholar] [CrossRef]
  6. Wang, B.; Zhong, S.; Lee, T.-L.; Fancey, K.S.; Mi, J. Non-Destructive Testing and Evaluation of Composite Materials/Structures: A State-of-the-Art Review. Adv. Mech. Eng. 2020, 12, 168781402091376. [Google Scholar] [CrossRef]
  7. Hu, W.-H.; Moutinho, C.; Caetano, E.; Magalhães, F.; Cunha, Á. Continuous Dynamic Monitoring of a Lively Footbridge for Serviceability Assessment and Damage Detection. Mech. Syst. Signal Process 2012, 33, 38–55. [Google Scholar] [CrossRef]
  8. Lu, L.; Le, J.; Song, H.; Wang, Y.; Huang, C. Damage Detection of Sandwich Panels with Truss Core Based on Time Domain Dynamic Responses. Compos. Struct. 2019, 211, 443–454. [Google Scholar] [CrossRef]
  9. He, W.-Y.; Ren, W.-X. Structural Damage Detection Using a Parked Vehicle Induced Frequency Variation. Eng. Struct. 2018, 170, 34–41. [Google Scholar] [CrossRef]
  10. Park, H.S.; Oh, B.K. Damage Detection of Building Structures under Ambient Excitation through the Analysis of the Relationship between the Modal Participation Ratio and Story Stiffness. J. Sound. Vib. 2018, 418, 122–143. [Google Scholar] [CrossRef]
  11. Wang, L.; Zhou, X.; Liu, H.; Yan, W. Damage Detection of RC Beams Based on Experiment and Analysis of Nonlinear Dynamic Characteristics. Constr. Build. Mater. 2012, 29, 420–427. [Google Scholar] [CrossRef]
  12. Cao, M.S.; Sha, G.G.; Gao, Y.F.; Ostachowicz, W. Structural Damage Identification Using Damping: A Compendium of Uses and Features. Smart Mater. Struct. 2017, 26, 43001. [Google Scholar] [CrossRef]
  13. Chen, C.; Zhang, C.; Ma, J.; He, S.-Z.; Chen, J.; Sun, L.; Wang, H.-P. FBG Sensing Data Motivated Dynamic Feature Assessment of the Complicated CFRP Antenna Beam under Various Vibration Modes. Buildings 2024, 14, 2249. [Google Scholar] [CrossRef]
  14. Zhang, C.; Li, G.-Z.; Wusiman, M.; Yan, G.; Yan, C.-L.; Wang, H.-P. Silicone Rubber-Packaged FBG Sensing Information and SSI-COV-Recognized Modal Parameters Motivated Damage Identification in Pipe Structures. Symmetry 2024, 16, 1302. [Google Scholar] [CrossRef]
  15. Fan, W.; Qiao, P. A 2-D Continuous Wavelet Transform of Mode Shape Data for Damage Detection of Plate Structures. Int. J. Solids Struct. 2009, 46, 4379–4395. [Google Scholar] [CrossRef]
  16. Solís, M.; Algaba, M.; Galvín, P. Continuous Wavelet Analysis of Mode Shapes Differences for Damage Detection. Mech. Syst. Signal Process 2013, 40, 645–666. [Google Scholar] [CrossRef]
  17. Rucevskis, S.; Sumbatyan, M.A.; Akishin, P.; Chate, A. Tikhonov’s Regularization Approach in Mode Shape Curvature Analysis Applied to Damage Detection. Mech. Res. Commun. 2015, 65, 9–16. [Google Scholar] [CrossRef]
  18. Chen, J.G.; Büyüköztürk, O. A Symmetry Measure for Damage Detection with Mode Shapes. J. Sound. Vib. 2017, 408, 123–137. [Google Scholar] [CrossRef]
  19. Frans, R.; Arfiadi, Y.; Parung, H. Comparative Study of Mode Shapes Curvature and Damage Locating Vector Methods for Damage Detection of Structures. Procedia Eng. 2017, 171, 1263–1271. [Google Scholar] [CrossRef]
  20. He, J.; Zhou, Y. A Novel Mode Shape Reconstruction Method for Damage Diagnosis of Cracked Beam. Mech. Syst. Signal Process 2019, 122, 433–447. [Google Scholar] [CrossRef]
  21. Alshalal, I.; Al Zubaidi, F.; El-Sisi, A.E.-D.; Feng, Z.C. Damage Detection in One- and Two-Dimensional Structures Using Residual Error Method. J. Sound. Vib. 2019, 462, 114908. [Google Scholar] [CrossRef]
  22. Hu, Y.; Gao, P.; Li, F.; Zhao, Z.; Yu, Z. Experimental Study and Failure Criterion Analysis of Rubber Fibre Reinforced Concrete under Biaxial Compression-Compression. J. Renew. Mater. 2023, 11, 2055–2073. [Google Scholar] [CrossRef]
  23. Zhang, Z.; Shankar, K.; Ray, T.; Morozov, E. V; Tahtali, M. Vibration-Based Inverse Algorithms for Detection of Delamination in Composites. Compos. Struct. 2013, 102, 226–236. [Google Scholar] [CrossRef]
  24. He, K.; Zhu, W.D. Structural Damage Detection Using Changes in Natural Frequencies: Theory and Applications. J. Phys. Conf. Ser. 2011, 305, 12054. [Google Scholar] [CrossRef]
  25. Radzieński, M.; Krawczuk, M.; Palacz, M. Improvement of Damage Detection Methods Based on Experimental Modal Parameters. Mech. Syst. Signal Process 2011, 25, 2169–2190. [Google Scholar] [CrossRef]
  26. Salawu, O.S. Detection of Structural Damage through Changes in Frequency: A Review. Eng. Struct. 1997, 19, 718–723. [Google Scholar] [CrossRef]
  27. Dahak, M.; Touat, N.; Benseddiq, N. On the Classification of Normalized Natural Frequencies for Damage Detection in Cantilever Beam. J. Sound. Vib. 2017, 402, 70–84. [Google Scholar] [CrossRef]
  28. Satpute, D.; Baviskar, P.; Gandhi, P.; Chavanke, M.; Aher, T. Crack Detection in Cantilever Shaft Beam Using Natural Frequency. Mater. Today Proc. 2017, 4, 1366–1374. [Google Scholar] [CrossRef]
  29. Khatir, S.; Dekemele, K.; Loccufier, M.; Khatir, T.; Abdel Wahab, M. Crack Identification Method in Beam-like Structures Using Changes in Experimentally Measured Frequencies and Particle Swarm Optimization. Comptes Rendus Mécanique 2018, 346, 110–120. [Google Scholar] [CrossRef]
  30. Chen, W.; Zhao, W.; Yang, H.; Chen, X. Damage Detection Based on Optimized Incomplete Mode Shape and Frequency. Acta Mech. Solida Sin. 2015, 28, 74–82. [Google Scholar] [CrossRef]
  31. Kaveh, A.; Zolghadr, A. An Improved CSS for Damage Detection of Truss Structures Using Changes in Natural Frequencies and Mode Shapes. Adv. Eng. Softw. 2015, 80, 93–100. [Google Scholar] [CrossRef]
  32. Umar, S.; Bakhary, N.; Abidin, A.R.Z. Response Surface Methodology for Damage Detection Using Frequency and Mode Shape. Measurement 2018, 115, 258–268. [Google Scholar] [CrossRef]
  33. Pan, J.; Zhang, Z.; Wu, J.; Ramakrishnan, K.R.; Singh, H.K. A Novel Method of Vibration Modes Selection for Improving Accuracy of Frequency-Based Damage Detection. Compos. B Eng. 2019, 159, 437–446. [Google Scholar] [CrossRef]
  34. Li, D.; Lu, D.; Hou, J. Pipeline Damage Identification Based on Additional Virtual Masses. Appl. Sci. 2017, 7, 1040. [Google Scholar] [CrossRef]
  35. Al-Wazni, S.; Alalikhan, A.; Mišković, Z. Structural Model Calibration of Vierendeel Bridge Based on the Vibration Properties. IOP Conf. Series Mater. Sci. Eng. 2018, 454, 012052. [Google Scholar] [CrossRef]
  36. Zhang, B.; Qian, Y.; Wu, Y.; Yang, Y.B. An Effective Means for Damage Detection of Bridges Using the Contact-Point Response of a Moving Test Vehicle. J. Sound. Vib. 2018, 419, 158–172. [Google Scholar] [CrossRef]
  37. Hou, J.; Wang, P.; Jing, T.; Jankowski, Ł. Experimental Study for Damage Identification of Storage Tanks by Adding Virtual Masses. Sensers 2019, 19, 220. [Google Scholar] [CrossRef] [PubMed]
  38. Dinh, H.M.; Nagayama, T.; Fujino, Y. Structural Parameter Identification by Use of Additional Known Masses and Its Experimental Application. Struct. Control Health Monit. 2012, 19, 436–450. [Google Scholar] [CrossRef]
  39. Mirjalili, S.; Mirjalili, S.M.; Lewis, A. Grey Wolf Optimizer. Adv. Eng. Softw. 2014, 69, 46–61. [Google Scholar] [CrossRef]
  40. Kaveh, A.; Zakian, P. Improved GWO Algorithm for Optimal Design of Truss Structures. Eng. Comput. 2017, 34, 685–707. [Google Scholar] [CrossRef]
  41. Moravvej, M.; El-Badry, M. Reference-Free Vibration-Based Damage Identification Techniques for Bridge Structural Health Monitoring—A Critical Review and Perspective. Sensors 2024, 24, 876. [Google Scholar] [CrossRef] [PubMed]
  42. Lee, Y.; Kim, H.; Min, S.; Yoon, H. Structural Damage Detection Using Deep Learning and FE Model Updating Techniques. Sci. Rep. 2023, 13, 1–19. [Google Scholar] [CrossRef] [PubMed]
  43. CSI. SAP2000. Analysis Reference Manual; CSI: Berkeley, CA, USA, 2016. [Google Scholar]
  44. El-Sisi, A.; El-Husseiny, O.; Matar, E.; Sallam, H.; Salim, H. Field-Testing and Numerical Simulation of Vantage Steel Bridge. J. Civ. Struct. Health Monit. 2020, 10, 443–456. [Google Scholar] [CrossRef]
  45. Huang, Z.; Zhao, X.; Guo, Y.; Liu, X. Residual Flexural Performance of Double-Layer Steel–RLHDC Composite Panels after Impact. Buildings 2023, 13, 2916. [Google Scholar] [CrossRef]
  46. Mollova, G. Effects of Digital Filtering in Data Processing of Seismic Acceleration Records. EURASIP J. Adv. Signal Process 2007, 2007, 029502. [Google Scholar] [CrossRef]
Figure 1. Representation of three different additional mass cases of simply supported beams.
Buildings 15 00279 g001
Figure 2. Illustration of the damage detection procedure.
Buildings 15 00279 g002
Figure 3. Three cases of concrete beam for numerical studies; (a) simply supported with 10 elements, (b) simply supported with 50 elements, (c) two spans, and (d) three spans.
Buildings 15 00279 g003
Figure 4. Effect of the number of elements for the simply supported beam case.
Buildings 15 00279 g004
Figure 5. Damage detection results of the simply supported beam.
Buildings 15 00279 g005
Figure 6. Damage detection results for two continuous span beams.
Buildings 15 00279 g006
Figure 7. Damage detection results for three-continuous-span beams.
Buildings 15 00279 g007
Table 1. Natural frequencies of simply supported beams with different additional masses cases (rad/s).
Case 1st Freq.2nd Freq.3rd Freq.4th Freq.
142.84169.73376.05651.45
228.36108.52253.23439.16
326.02100.35245.31414.52
Table 2. Different beam cases and damage scenario numerical studies.
Elements/SpanScenario 1Scenario 2Scenario 3Scenario 4Scenario 5Scenario 6
ElementSeverityElementSeverityElementSeverityElementSeverityElementSeverityElementSeverity
Simply support502050%----------
10410%----------
10425%450%4, 725%4, 750%----
Two spans10425%450%4, 1625%4, 1650%----
Three spans10425%450%4, 1625%4, 1650%4, 16, 2325%4, 16, 2350%
Table 3. The first four natural frequencies of the present work and steel cantilever beam (Khatir et al., 2018).
ModeUndamaged CaseDamaged Case
Experimental/ReferencePresent WorkExperimental/ReferencePresent Work
156.7556.5356.3855.34
2156.39157.821156.30157.8
3306.19308.27305.46302.4
4506.15507.82506.02507.4
Table 4. The actual and estimated damage severities for all tested scenarios of a simple beam.
LocationDamage Severity (%)
ScenarioActualEstimatedActualEstimatedError
1442524.89−0.44
2445049.99−0.02
34, 74, 725, 2525.84, 24.073.36, −3.72
44, 74, 750, 5050.21, 49.750.42, −0.5
Table 5. The actual and estimated damage severities for all tested scenarios of two-span beams.
LocationDamage Severity (%)
ScenarioActualEstimatedActualEstimatedError
1442523.12−7.52
2445049.11−1.78
34, 164, 1625, 2522.53, 23.06−9.88, −7.76
44, 164, 1650, 5049.16, 49.18−1.68, −1.64
Table 6. The actual and estimated damage severities for all tested scenarios of three-span-beams.
LocationDamage Severity (%)
ScenarioActualEstimatedActualEstimatedError
1442521.406−14.376
2445047.67−4.66
34, 164, 1625, 2523.01, 22.31−7.96, −10.77
44, 164, 1650, 5048.73, 48.18−2.54, −3.64
54, 16, 234, 16, 2325, 25, 2521.15, 23.46, 20.98−15.4, −6.18, −16.06
64, 16, 234, 16, 2350, 50, 5048.49, 49.38, 47.55−3.02, −1.24, −4.89
Table 7. The MAE and RMSE for all tested scenarios.
ScenarioMAE (%)RMSE (%)
11.251.41
23.504.12
32.853.57
43.153.78
54.305.10
Disclaimer/Publisher’s Note: The statements, opinions and data contained in all publications are solely those of the individual author(s) and contributor(s) and not of MDPI and/or the editor(s). MDPI and/or the editor(s) disclaim responsibility for any injury to people or property resulting from any ideas, methods, instructions or products referred to in the content.

