Article

Optimizing Recycled Tunnel Boring Machine (TBM)-Excavated Materials as Aggregates in Shotcrete Mix Design

PowerChina Northwest Engineering Corporation Limited, Xi’an 710065, China
*
Author to whom correspondence should be addressed.
Buildings 2025, 15(9), 1483; https://doi.org/10.3390/buildings15091483
Submission received: 10 March 2025 / Revised: 20 April 2025 / Accepted: 25 April 2025 / Published: 27 April 2025

Abstract

Tunnel Boring Machine (TBM) excavation materials were recycled by sieving and separating particles into sizes 5–10 mm (coarse aggregates) and below 5 mm (manufactured sand) to explore their potential as aggregates in shotcrete production, with the aim of reducing environmental harm from waste disposal. Mix proportion experiments were conducted to evaluate the mechanical properties—including failure patterns, compressive strength, flexural strength, and deflection—of the shotcrete specimens through cubic axial compression and four-point bending tests; furthermore, rebound tests were conducted on shotcrete mixed with the recycled TBM aggregates in foundation pit engineering. These tests assessed the effects of key parameters (water–binder ratio, sand ratio, fly ash content, synthetic fibers, and liquid alkali-free accelerator) on shotcrete composed of recycled TBM sand and gravel. The results indicated that crushing and grading flaky TBM-excavated rock fragments, and subsequently blending them with pre-screened fine aggregates in a 4:1 ratio, yielded manufactured sand with an optimized particle gradation and controlled stone powder content (18%). Adjusting the water–binder ratio (0.4–0.5), fly ash dosage (mixed with 0–20%), and sand ratio (0.5–0.6) are feasible steps in preparing shotcrete with a compressive strength of 29.1 MPa to 50.4 MPa and slump of 9 cm to 20 cm. Moreover, the rebound rate of the shotcrete reached 11.3% by applying polyoxymethylene (POM) fibers with a 0.15% volume fraction and a liquid-state alkali-free setting accelerator (8% dosage), demonstrating that the implemented approach enables a decrease in the rebound rate of shotcrete.

1. Introduction

Full-face rock Tunnel Boring Machines (TBMs) are special tunnel excavation machinery suitable for construction operations under hard-rock geological conditions. Their working principle involves the use of a specific cutting device to fragment the rock and quickly transporting the crushed rock through a dedicated transport system. Compared to traditional blasting excavation methods, TBMs offer rapid construction speeds, significantly shortening project duration, especially when tunneling long distances in stable rock formations [1,2]. Zhang et al. [3] have compared TBM methods with traditional drill-and-blast techniques, highlighting TBMs’ advantages such as faster excavation, reduced environmental impact, and enhanced safety, despite their higher costs and lower adaptability, while AI enhances their predictive accuracy and the Metaverse enables immersive infrastructure solutions. Furthermore, the TBM method allows for the precise control of the excavation section, ensuring accurate tunnel dimensions and shapes, optimizing the support work required, and enhancing engineering quality [4,5,6,7]. These advantages have led to the widespread adoption of the TBM method in modern tunnel construction, including highway tunnels, railway tunnels, and tunnels for large-scale water conservancy, hydropower, and water diversion projects.
The TBM tunneling process inevitably generates enormous amounts of sandstone waste, which is often not effectively managed. Most of the residue is discarded and piled up, occupying valuable land resources and polluting soil and water. Therefore, exploring recycling pathways for the sandstone waste from TBM tunneling has become particularly urgent. Among the various recycling approaches, utilizing the sandstone waste from TBM tunneling to produce fine aggregate concrete demonstrates significant advantages and potential [8,9]. Fine aggregate concrete, a high-performance building material, is widely used in various civil engineering projects. Recycling the sandstone waste from TBM tunneling to produce fine aggregate concrete can not only effectively address the disposal issue of sandstone waste, but also provide quality building materials for related projects, thereby achieving a win–win situation by reducing resource waste, conserving natural concrete aggregate resources, and lowering engineering costs, yielding significant economic and social benefits.
Numerous scholars have studied the characteristics of Tunnel Boring Machine (TBM) excavation materials and analyzed the feasibility of recycling them as concrete aggregates. The results indicate that TBM excavation materials can be utilized as concrete aggregates after appropriate treatment. Olbrecht and Studer [10] have recycled six types of TBM excavation materials with different properties and used them as coarse aggregates to produce concrete with a cubic compressive strength of 30 MPa. Their results indicate that, compared with ordinary concrete, concrete prepared with TBM aggregates exhibits higher shrinkage and a relatively lower elastic modulus. Alnuaim et al. [11] have analyzed the engineering properties of TBM-excavated material and its potential as a concrete aggregate through various mechanical and thermal processing methods. Their results showed that, while the compressive strength of TBM aggregate-based concrete is slightly lower than that of control mixtures, thermal treatment can mitigate this strength loss. The porosity and chloride diffusivity of TBM aggregate-based concrete were somewhat higher; the aggregate processing method had a negligible impact on strength and durability, especially at lower aggregate contents. Additionally, predictive models have been developed to forecast the strength and durability of TBM aggregate-based concrete, aiding in future material utilization and design optimization. Alnuaim et al. [12] assessed the performance of different mixtures of TBM-crushed limestone and granular materials to explore the feasibility of utilizing limestone crushed by Tunnel Boring Machines (TBMs) as a building material based on dynamic and static strength testing. Their results indicate that TBM-crushed limestone powder is feasible as a road-based material by conducting screening operations at the site and adding 3/8-inch aggregate at a ratio of 5–10% to the limestone powder. Tokgöz et al. [13] conducted laboratory testing of the physical and mechanical properties of TBM-excavated materials, which provided a detailed analysis of the geological structure, classification, and characteristics of the excavated materials, and proposed a design scheme for utilizing them as fill in abandoned quarry reservoirs.
Priyadharshini et al. [14] investigated the influence of thermal treatment on the properties of excavated soil as a fine aggregate in cement mortar. The thermal treatment of these soils at temperatures ranging from 200 °C to 1000 °C was conducted, and changes in their mineralogy and physical properties were analyzed using thermogravimetric analysis (TGA) and X-ray diffraction (XRD). The results showed that, as fine aggregate in cement mortar, thermally treated soils reduced water demand, increased dry density, and enhanced compressive strength; furthermore, this process can transform high-plasticity excavated soil into a suitable fine aggregate for cement mortar, with property improvements depending on soil mineralogy and treatment conditions. The drying shrinkage of the mixed mortar was significantly reduced, and its permeable pore volume decreased, improving durability. Voit and Zimmermann [15] examined the mechanical properties of concrete utilizing various tunnel excavation materials as aggregates in combination with different cement types, measured the parameters of both freshly mixed and hardened concrete, along with factors related to concrete fracture, and also conducted a comparison between the characteristics of plain concrete and fiber-reinforced concrete that incorporated aggregates sourced from tunnel excavation materials. Their results showed that washing the aggregate resulted in a 20% increase in compressive strength, which was attributed to the removal of adhering fines. Adding admixtures and hydraulically active additives enhanced the workability of the concrete, whereas it caused a decrease in density and compressive strength. Notably, adding fibers could improve the concrete’s fire resistance and mechanical properties.
Existing studies have demonstrated that the morphological characteristics of coarse aggregates and stone powder content in machine-made sand substantially influence concrete’s mechanical performance and workability [16,17,18]. Nevertheless, existing research exhibits notable limitations in addressing TBM-excavated materials. Despite the well-documented challenges posed by TBM-generated aggregates, particularly their inherently high flakiness indices and elevated stone powder concentrations, current research efforts remain inadequate in providing an optimized particle size distribution that comprehensively accounts for these material-specific characteristics. While partial investigations have explored the incorporation of recycled TBM tunnel excavation materials as coarse aggregate blends with conventional aggregates, critical knowledge gaps persist regarding their application as fine aggregates (manufactured sand). Therefore, in this study, the recycled TBM-excavated materials underwent mechanical processing involving crushing and multi-stage screening. This treatment effectively reshaped irregular rock fragments into geometrically favorable coarse aggregates for sprayed concrete while eliminating undersized particles. Then, blending the graded fine aggregates (obtained from the crushed flaky TBM aggregates) with pre-screened fine aggregates in a critical ratio produced machine-made sand with an optimized particle gradation and controlled stone powder content. Eventually, through systematic mix design optimization trials and rebound resistance assessments, this investigation elucidated the parametric interdependencies between composition variables (water–binder ratio, sand fraction, fly ash dosage, fiber reinforcement, and accelerator concentration) and the resultant concrete performance metrics—encompassing fresh-state workability, hardened-state mechanical properties (compressive/flexural strength), and spraying efficiency. The study concurrently formulated mitigation strategies for rebound control while establishing an evidence-based framework for engineering applications using TBM-excavated geomaterials as sustainable concrete aggregates.

2. Materials and Methods

2.1. TBM-Excavated Tunnel Materials

We began by screening 748.15 kg of TBM-excavated tunnel materials with sieve diameters of 5 mm, 10 mm, 20 mm, 30 mm, 40 mm, and 50 mm, and measuring the mass of the particles in the different size fractions using an electronic scale. Table 1 shows the percentage distribution of each particle size in the TBM-excavated tunnel materials; Figure 1 exhibits the aggregate of each size fraction. In the TBM-excavated tunnel materials, the content of fine particles with a particle size of less than 5 mm was relatively high. The amount of flaky rock among particles with a particle size of more than 10 mm was relatively high, and the proportion of flaky rock increased with the increase in particle size.

2.2. TBM Recycled Aggregate Performance

By analyzing the particle shape of the TBM screened materials, it could be found that the flaky content of the particles with a diameter of 5–10 mm in the screened materials was relatively small. Fine aggregate concrete is a special concrete material consisting of cement, coarse aggregate with a specific particle size (15–5 mm), sand, water, and admixtures. It has the advantages of high density, high strength, good fluidity, and excellent crack resistance. Due to its unique performance characteristics, it has been widely used in the field of civil engineering. Therefore, the TBM-excavated tunnel material was firstly pre-screened. Particles with a diameter of less than 5 mm were recovered as manufactured sand, and the particles with a diameter of 5–10 mm were recovered as coarse aggregate for preparing fine aggregate concrete. To improve the recycling rate of the TBM-excavated tunnel material, the flaky rocks with a diameter of more than 10 mm were crushed and screened, and the particles with a diameter of less than 5 mm and 5–10 mm were recovered. The manufactured sand obtained by pre-screening was tested based on the DL/T 5151-2014 [19]. The physical performance test results of the coarse aggregate are shown in Table 2, and the particle size distribution of the manufactured sand obtained from the TBM pre-screening materials (593 g) is shown in Table 3.

2.3. Optimization of Manufactured Sand Size Distribution

It could be understood from the particle size distribution test that the particle size distribution of the obtained manufactured sand was poor and its stone powder content was relatively high. Excessive stone powder will prevent the normal hydration of the cement, resulting in an uneven pore structure inside the concrete and a decrease in strength and durability [21]. Cai et al. [22] conducted a mix proportion test and found that when the stone powder content of the manufactured sand increased from 10% to 15%, the cubic compressive strength of the concrete increased significantly. When the stone powder content changed from 15% to 20%, the change in compressive strength tended to be stable. When the stone powder content of the manufactured sand was controlled in the range of 15–20%, the workability of the concrete mixture was better. In this paper, the flaky TBM aggregates were crushed and screened to obtain aggregates with diameters of less than 5 mm. According to the calculated particle size distribution, they were mixed with the manufactured sand obtained by pre-screening in a certain proportion (4:1). The particle size distribution of the obtained manufactured sand (596 g) is shown in Table 4, with a fineness modulus of 2.81, a stone powder content of 18%, and an apparent density of 2745 g/cm3. Table 5 shows the characteristics of the optimized manufactured sand.
Figure 2 shows the particle size distribution curves of the initial TBM-excavated materials, initial recycled manufactured sand, and optimized manufactured sand, respectively.

2.4. Accelerator

According to GB/T 35159-2017 [23], the setting time and the 1-day and 28-day compressive strength ratios of the JW-18 alkali-free accelerator were tested, respectively. The test results are shown in Table 6.

2.5. Binding Materials

The binding materials contained fly ash and cement. The cement used in the experiment was P·O 42.5 and its density was tested based on [24]. The physical properties of the cement and fly ash were tested based on [25,26], respectively, and the results are shown in Table 7 and Table 8. Table 9 shows the specific gravity of each material.

2.6. Mix Proportion Design

The strength grade of shotcrete is generally between 25 MPa and 40 MPa. In this test, the design strength grade of the concrete included 25 MPa, 30 MPa, and 35 MPa, with a slump between 80 mm and 200 mm. According to the strength design specification [27] and our engineering experience, the water-to-binder ratio typically ranges from 0.40 to 0.50 in order to reach the targeted strength proposed in this test, and the sand ratio is generally between 45% and 60%, with adjustments based on the fineness modulus of the fine aggregates; the dosage of fly ash does not exceed 20%. As shown in Table 10, mix proportioning tests were conducted using water-to-binder ratios of 0.4, 0.45, and 0.5; the dosages of fly ash were 0 and 20%, and the sand ratios were 0.5, 0.55, and 0.6, considering that the grain shape of the recycled aggregate was worse than that of ordinary aggregate. These parameters were selected for systematic evaluation and mix design optimization to achieve the target strength and construction performance. The water reducing agent was 1% of the binding material. As for the specimen numbers, T0.4S0.5 represents a water–binder ratio of 0.4 and sand–binder ratio of 0.5; T0.4F0.2S0.5 represents a water–binder ratio of 0.4, sand–binder ratio of 0.5, and fly ash to binding materials ratio of 0.2.

2.7. Experimental Apparatus

The axial compression tests of the cubic specimens were conducted using an automatic electro-hydraulic pressure testing machine. The dimensions of the cubic specimens were 100 mm × 100 mm × 100 mm, with three specimens per group. For the normal concrete mix proportion tests, specimens were made and cured under standard conditions and 7-day and 28-day compressive strengths were tested, respectively. For shotcrete proportioning tests, the 1-day and 28-day compressive strengths and flexural strengths were tested, respectively. During the test, the vertical surface of the specimen’s forming surface was the bearing surface. Before loading, the loading plate and the specimen surface were cleaned to ensure a uniform contact surface. The specimen was then placed and centered on the loading plate. The loading rate was set as 5 kN/s, and the four-point bending tests were loaded by a universal testing machine. The dimensions of the specimens were 100 mm × 100 mm × 400 mm, with three specimens per group. The specimens were loaded at the trisection points, and the net span distance of the specimens was 300 mm, with 50 mm overhangs at both ends of the support, as shown in Figure 3. The test loading rate was set at 0.2 mm/min.

3. Results

3.1. Normal Concrete Mix Proportion Test Results

Table 11 shows the normal concrete mix proportion test results, including the 7-day and 28-day mean cubic compressive strengths of each test group.

3.1.1. Compressive Strength

Based on the experimental results in Table 11, the bar charts shown in Figure 4 were plotted for the realation between the water-to-binder ratio, sand ratio, and the 7-day and 28-day cubic compressive strengths of the concrete. As shown in Figure 4, an increase in the water-to-binder ratio from 0.4 to 0.5 resulted in a 21–33% reduction in 7-day compressive strength and a 15–30% reduction in 28-day compressive strength. Similarly, replacing cement with 20% fly ash led to a 15–30% decrease in 7-day compressive strength and a 10–21% decrease in 28-day compressive strength. Additionally, when the sand ratio was increased from 0.5 to 0.6, the 7-day compressive strength showed a 2–18% reduction, while the 28-day compressive strength exhibited an 8–14% reduction. When the water-to-binder ratio rose from 0.4 to 0.45, the 28-day compressive strength of concrete decreased significantly, around 10–25%. However, the strength variation became more gradual from 4 to 10%, where the ratio continuously increased from 0.45 to 0.5. This nonlinear relationship between the water-to-binder ratio and concrete strength arises because cement undergoes faster chemical reactions at lower ratios (0.4), resulting in denser internal structures with reduced porosity and increased cementitious materials. The complete hydration process enhances both compactness and strength [28]. Compared to cement, fly ash exhibits lower hydration activity. Cement rapidly generates calcium silicate hydrate (C-S-H) gel upon water contact, critically determining compressive strength. The slower hydration rate and lower degree of fly ash reaction increase the effective water content for cement hydration, thereby indirectly elevating the water-to-binder ratio. Consequently, fly ash incorporation reduces concrete strength, with stabilized strength variations at higher water-to-binder ratios. Figure 4a reveals the decreasing concrete strength with increasing sand ratios. While sand initially fills coarse aggregate voids to improve compactness, excessive sand content (beyond optimal levels) increases mortar volume, weakens the mechanical interlocking between coarse aggregates, and loosens the internal structure. When concrete has a lower sand ratio, the cement paste coats the aggregate effectively, with strong interfacial bonding. However, higher sand ratios disperse the paste thinly across aggregate surfaces, reducing interfacial adhesion [29] and ultimately leading to strength degradation.

3.1.2. Workability Analysis

Figure 5 presents a bar chart plotting the water-to-binder ratio and sand ratio against the concrete slump. The data demonstrate a proportional relationship between the water-to-binder ratio and slump, attributed to the elevated free water content that enhances particle lubrication and system fluidity. Fly ash incorporation produces additional slump improvement in the range of 20–40%, principally attributed to the spherical morphology of its smooth glass microspheres. These geometrically optimized particles achieve dual functional effects: reduced interparticle friction through minimized contact surfaces and improved particle dispersion via ball-bearing-like rolling mechanisms. The influence of sand ratio on slump is governed by multiple factors. At higher water-to-binder ratios, the effect of sand ratio on slump is relatively minor. However, excessively high sand ratios reduce the paste coating on aggregate surfaces, slightly decreasing slump. The effect of sand ratio on concrete slump depends on multiple interacting factors. Under elevated water-to-binder ratios, the sand ratio’s influence on slump diminishes significantly. However, when the sand ratio exceeds an optimal threshold, insufficient paste coating of the aggregate creates reduced particle lubrication, ultimately causing measurable slump loss. When water-to-binder ratios are lower, an optimized sand ratio can fill interparticle voids in coarse aggregates, enhancing particle mobility and lubrication efficiency. However, surpassing the critical sand ratio threshold results in inadequate paste film thickness on aggregate surfaces, diminishing the fluidity performance. Notably, fly ash’s lower specific gravity being lower than cement’s induces the volumetric expansion of the cementitious system when substituted mass-for-mass. This elevated paste fraction enables a compensatory adjustment of the sand ratio to achieve targeted workability parameters, as validated by experimental studies [30].

3.2. Shotcrete Proportion Test Results

Table 12 shows the mix proportion test variable parameters of the shotcrete. As for the specimen numbers, T0.45F0.2S0.5 indicates that the water–binder ratio is 0.45, the content of fly ash in the concrete is 20%, and the sand–binder ratio is 0.2; M represents polyoxymethylene (POM) fibers and A represents Polyvinyl Alcohol (PVA) fibers.

3.2.1. Failure Mode

Figure 6 shows the compressive failure modes of the TBM concrete with an accelerator added. The concrete without fibers added to it usually exhibited brittle failure characteristics during compression. When its compressive strength limit was reached, the concrete collapsed, and the failure mode was typical truncated pyramid failure. After adding the fibers, the failure mode of the concrete changed to ductile failure. During the compression process, even when a relatively high stress level was reached, the concrete did not collapse immediately but experienced a relatively long deformation process. This is because the bridging effect of the fibers effectively limits the propagation of cracks, which enables the concrete with added fibers to maintain a certain integrity when it fails.
Figure 7 shows the flexural failure modes of the TBM concrete with an accelerator added. For these specimens, in the process of the flexural loading of the concrete without fibers added, once its ultimate bearing capacity was reached, the concrete quickly generated cracks and expanded rapidly along the cracks, resulting in rapid structural failure. This failure process usually showed obvious brittle characteristics. For the concrete with a small amount of fiber added, the presence of fibers could delay the generation and development of cracks to a certain extent. However, due to the small amount of fiber added, the improvement in the flexural failure mode of the prism specimen was not obvious, and its failure mode was similar to those of the concrete specimens without fibers added.

3.2.2. Compressive Strength Analysis

Table 13 shows the test results of compressive performance under different mix proportions and Figure 8 shows the comparison of compressive strengths. The 1-day and 28-day compressive strengths under each design mix proportion are the average strengths of three specimens in each group. It can be seen that the 28-day compressive strength of the TBM concrete with an accelerator added decreased by 10–30%. For the mix proportion T0.45F0.2S0.5, the influence of the same dosage of 18M and 18B accelerators on the compressive strength was different. The 28-day strength of the concrete with the 18B accelerator decreased by 10%, and the 28-day strength of the concrete with the 18M accelerator added decreased by 30%. This is because the early accelerator can accelerate the hydration of cement to promote the rapid setting of concrete, thus improving the early strength of the concrete. Since the early accelerator accelerates the hydration reaction of the cement, some hydration products are rapidly generated in the early stage and consume a large amount of water and energy, resulting in insufficient driving force for the later hydration reaction and a limited growth in later strength. Moreover, the alkali in the accelerator is similar to the alkali in cement, both of which will increase the shrinkage of the mortar and concrete. The shrinkage phenomenon is not only unfavorable to the development of the later strength but also may increase the risk of concrete cracking.

3.2.3. Flexural Strength Analysis

Table 13 shows the test results of flexural performance under different mix proportions. Figure 9 shows the load–displacement curves of the prism specimens with fiber added, and Figure 10 shows the comparison of the flexural strengths. The 1-day and 28-day flexural strengths under each design mix proportion are the average strengths of three specimens in each group. It can be seen that the addition of fibers imparts a certain improvement in the flexural strength of concrete, and the improvement of the flexural strength by a small amount of fiber is not obvious. PVA fibers have hydrophilicity, and the presence of coarse aggregate makes the PVA fibers more likely to agglomerate in concrete, so the measured strength decreases. POM fibers have a good dispersibility, and the addition of an appropriate amount of fiber can improve the strength of concrete. When the other parameters are the same, the tensile strength of the POM-doped specimen is 12.5% higher than that of the PVA-doped specimen. When the fiber dosage reaches a certain limit, the defects inside the concrete increase, and the adverse effects are greater than the strengthening effect of the fiber, resulting in a decrease in the strength of the concrete.

3.3. Rebound Test

The rebound test for shotcrete is a crucial indicator for evaluating its construction quality. It primarily assesses the adhesion of the concrete by calculating the rebound rate, which is determined by measuring the amount of shotcrete that rebounds during the spraying process. A lower rebound rate signifies the better adhesion performance of the concrete and a higher construction quality. During the shotcrete construction process, some concrete will rebound from the spraying surface to the ground, forming rebound materials due to various reasons, such as aggregate rebound or the poor fluidity of the concrete. The rebound rate is calculated as the ratio between the mass of the rebound materials and the total mass of the shotcrete and can be determined using Formula (1).
Rebound   rate = Mass   of   rebound   materials Mass   of   shotcrete × 100 %

3.3.1. Test Scheme

The rebound materials were measured by weighing. The weighing equipment was an electronic scale or a platform scale, which were used to accurately measure the mass of the rebound materials and the total mass of the shotcrete. The test procedure followed a structured protocol: First, a representative flat and debris-free section of the shotcrete construction area was selected as the test zone. Simultaneously, all the required testing equipment and tools were prepared according to the standard specifications. The concrete spraying operation was then conducted, following established construction protocols, with particular attention given to monitoring the material’s fluidity and adhesion characteristics during application. During or immediately after spraying, the ground-accumulated rebound materials underwent systematic collection, weighing, and precise mass documentation. Concurrently, the mass of the sprayed concrete was calculated through volumetric measurements and density verification in a hopper. The concrete volume in the hopper was kept constant between test initiation and the completion of the test in order to maintain measurement consistency, ensuring the accurate determination of the total concrete mass used.
The shotcrete tests were carried out under conditions with the same spraying machinery, spraying materials, and shotcrete technology. The influences of the accelerator and the addition of fibers on the rebound rate of the TBM shotcrete were tested, respectively; the wet spraying method was used for the test. According to the mix proportion specifications, such as T0.45F0.2S0.5, a certain proportion of cement, sand, stone, fine aggregate, water, and admixture were mixed into concrete and transported to the nozzle by a pump or compressed air. After mixing with the liquid accelerator, the concrete was sprayed. Before starting the shotcrete construction, soil nail construction and a mesh hanging operation were carried out in the excavated foundation pit according to the design requirements. Parameters such as the diameter, length, and spacing of the soil nails need to be strictly controlled. The steel mesh needs to be firmly connected to the soil nails. The steel bars used were HPB 300 plain round steel bars with diameters of 12 mm and a spacing of 200 mm. Concrete spraying was carried out twice. The thickness of the first spraying round was about 7cm–10 cm, and the second spraying round was carried out until the intended thickness was reached. The second spraying should be carried out after the final setting of the first layer of concrete, and the interval time between the two times should be controlled within a certain range. Non-woven fabrics were laid under the working surface to ensure that each area was covered. The design thickness of the on-site support was designed to be 150 mm. To avoid the problems of concrete peeling and an uneven surface after one spraying round, the method of layered spraying was adopted. After the spraying was completed, the rebound materials on the ground were collected and weighed. Figure 11 shows the working surface of the shotcrete. Part A shows the sprayed concrete without fiber added, and Part B shows the sprayed concrete with a 0.15% volume fraction of POM fiber added. The spraying test is shown in Figure 12. By comparing the rebound rates of the shotcrete in Part A and Part B, the improvement effect of the POM fiber on the rebound rate of the concrete can be verified.

3.3.2. Test Results

Figure 13 shows the rebound rate of the TBM concrete with the mix proportion T0.45F0.2S0.5 and 18B accelerator added, as well as the rebound rate of the TBM concrete with POM fiber added. It can be seen that the addition of the POM fiber significantly reduces the rebound rate of the TBM shotcrete.
Short fibers play a role in crack resistance and reinforcement in shotcrete. When the concrete is impacted by spraying, microcracks will be generated inside it. The addition of short fibers can effectively prevent the propagation of microcracks, thus enhancing the tensile strength and toughness of the concrete. This crack resistance directly reduces the rebound rate of the concrete during the spraying process. Moreover, adding short fibers improves the adhesion between the shotcrete and the base layer. The short fibers form a good bonding interface with the concrete, enabling the concrete to adhere better to the base layer after spraying and reducing the rebound phenomenon caused by insufficient adhesion. Furthermore, the hydrophobicity and inherent characteristics of POM fibers enable them to be evenly distributed in the concrete when added, thereby improving the integrity of the concrete and reducing the rebound rate.
The slump of a concrete directly influences its rebound rate during spraying operations. Elevated slumps enhance pumping fluidity, effectively filling surface irregularities and minimizing voids. However, excessive slump compromises adhesion strength, causing material detachment from the sprayed surface and paradoxically increasing rebound rates. Conversely, an insufficient slump reduces workability, leading to an uneven material distribution that creates voids and defects while elevating rebound rates. Empirical studies show that maintaining slump within an optimal range (typically 80–120 mm for shotcrete) minimizes rebound. Methods such as optimizing the mix proportion, strictly controlling the quality of the raw materials, and adopting a suitable spraying process are available to reduce the rebound rate of shotcrete.

4. Conclusions

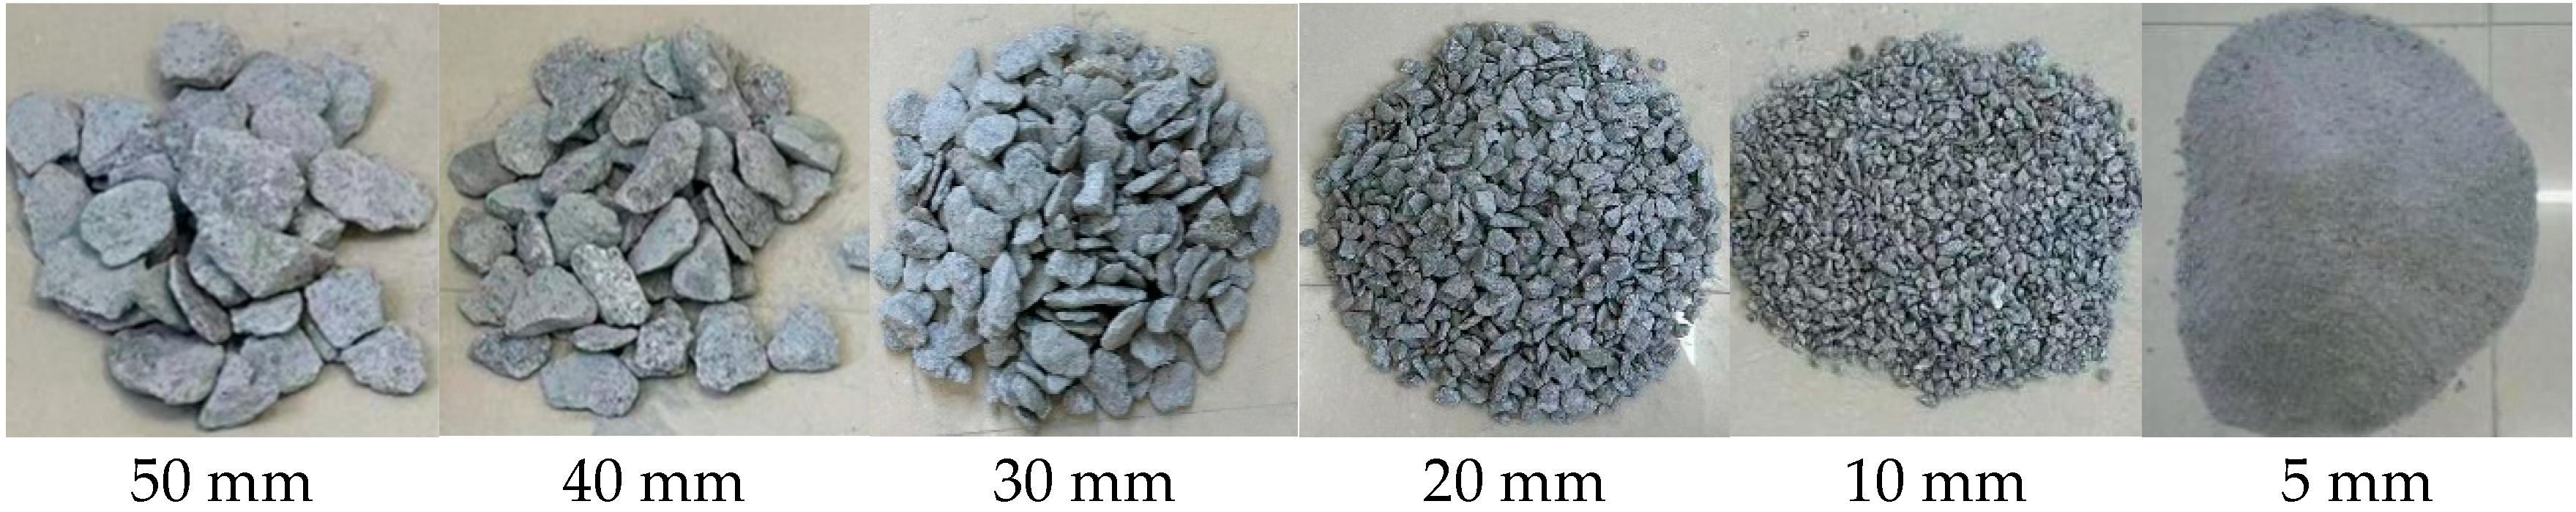
The 5–10 mm particles obtained from recycled TBM tunnel excavation materials exhibit low elongated and flaky contents (4%), making them suitable for concrete production. The manufactured sand initially screened from TBM tunnel excavation materials shows a poor particle size distribution and excessive stone powder content of around 40%. Crushing TBM-excavated flaky rocks above 10 mm in size and blending the screened particles below 5 mm with the manufactured sand in a 4:1 ratio can optimize the gradation distribution of the manufactured sand while reducing its stone powder content to a suitable level (18%), thus meeting the requirements for shotcrete preparation.
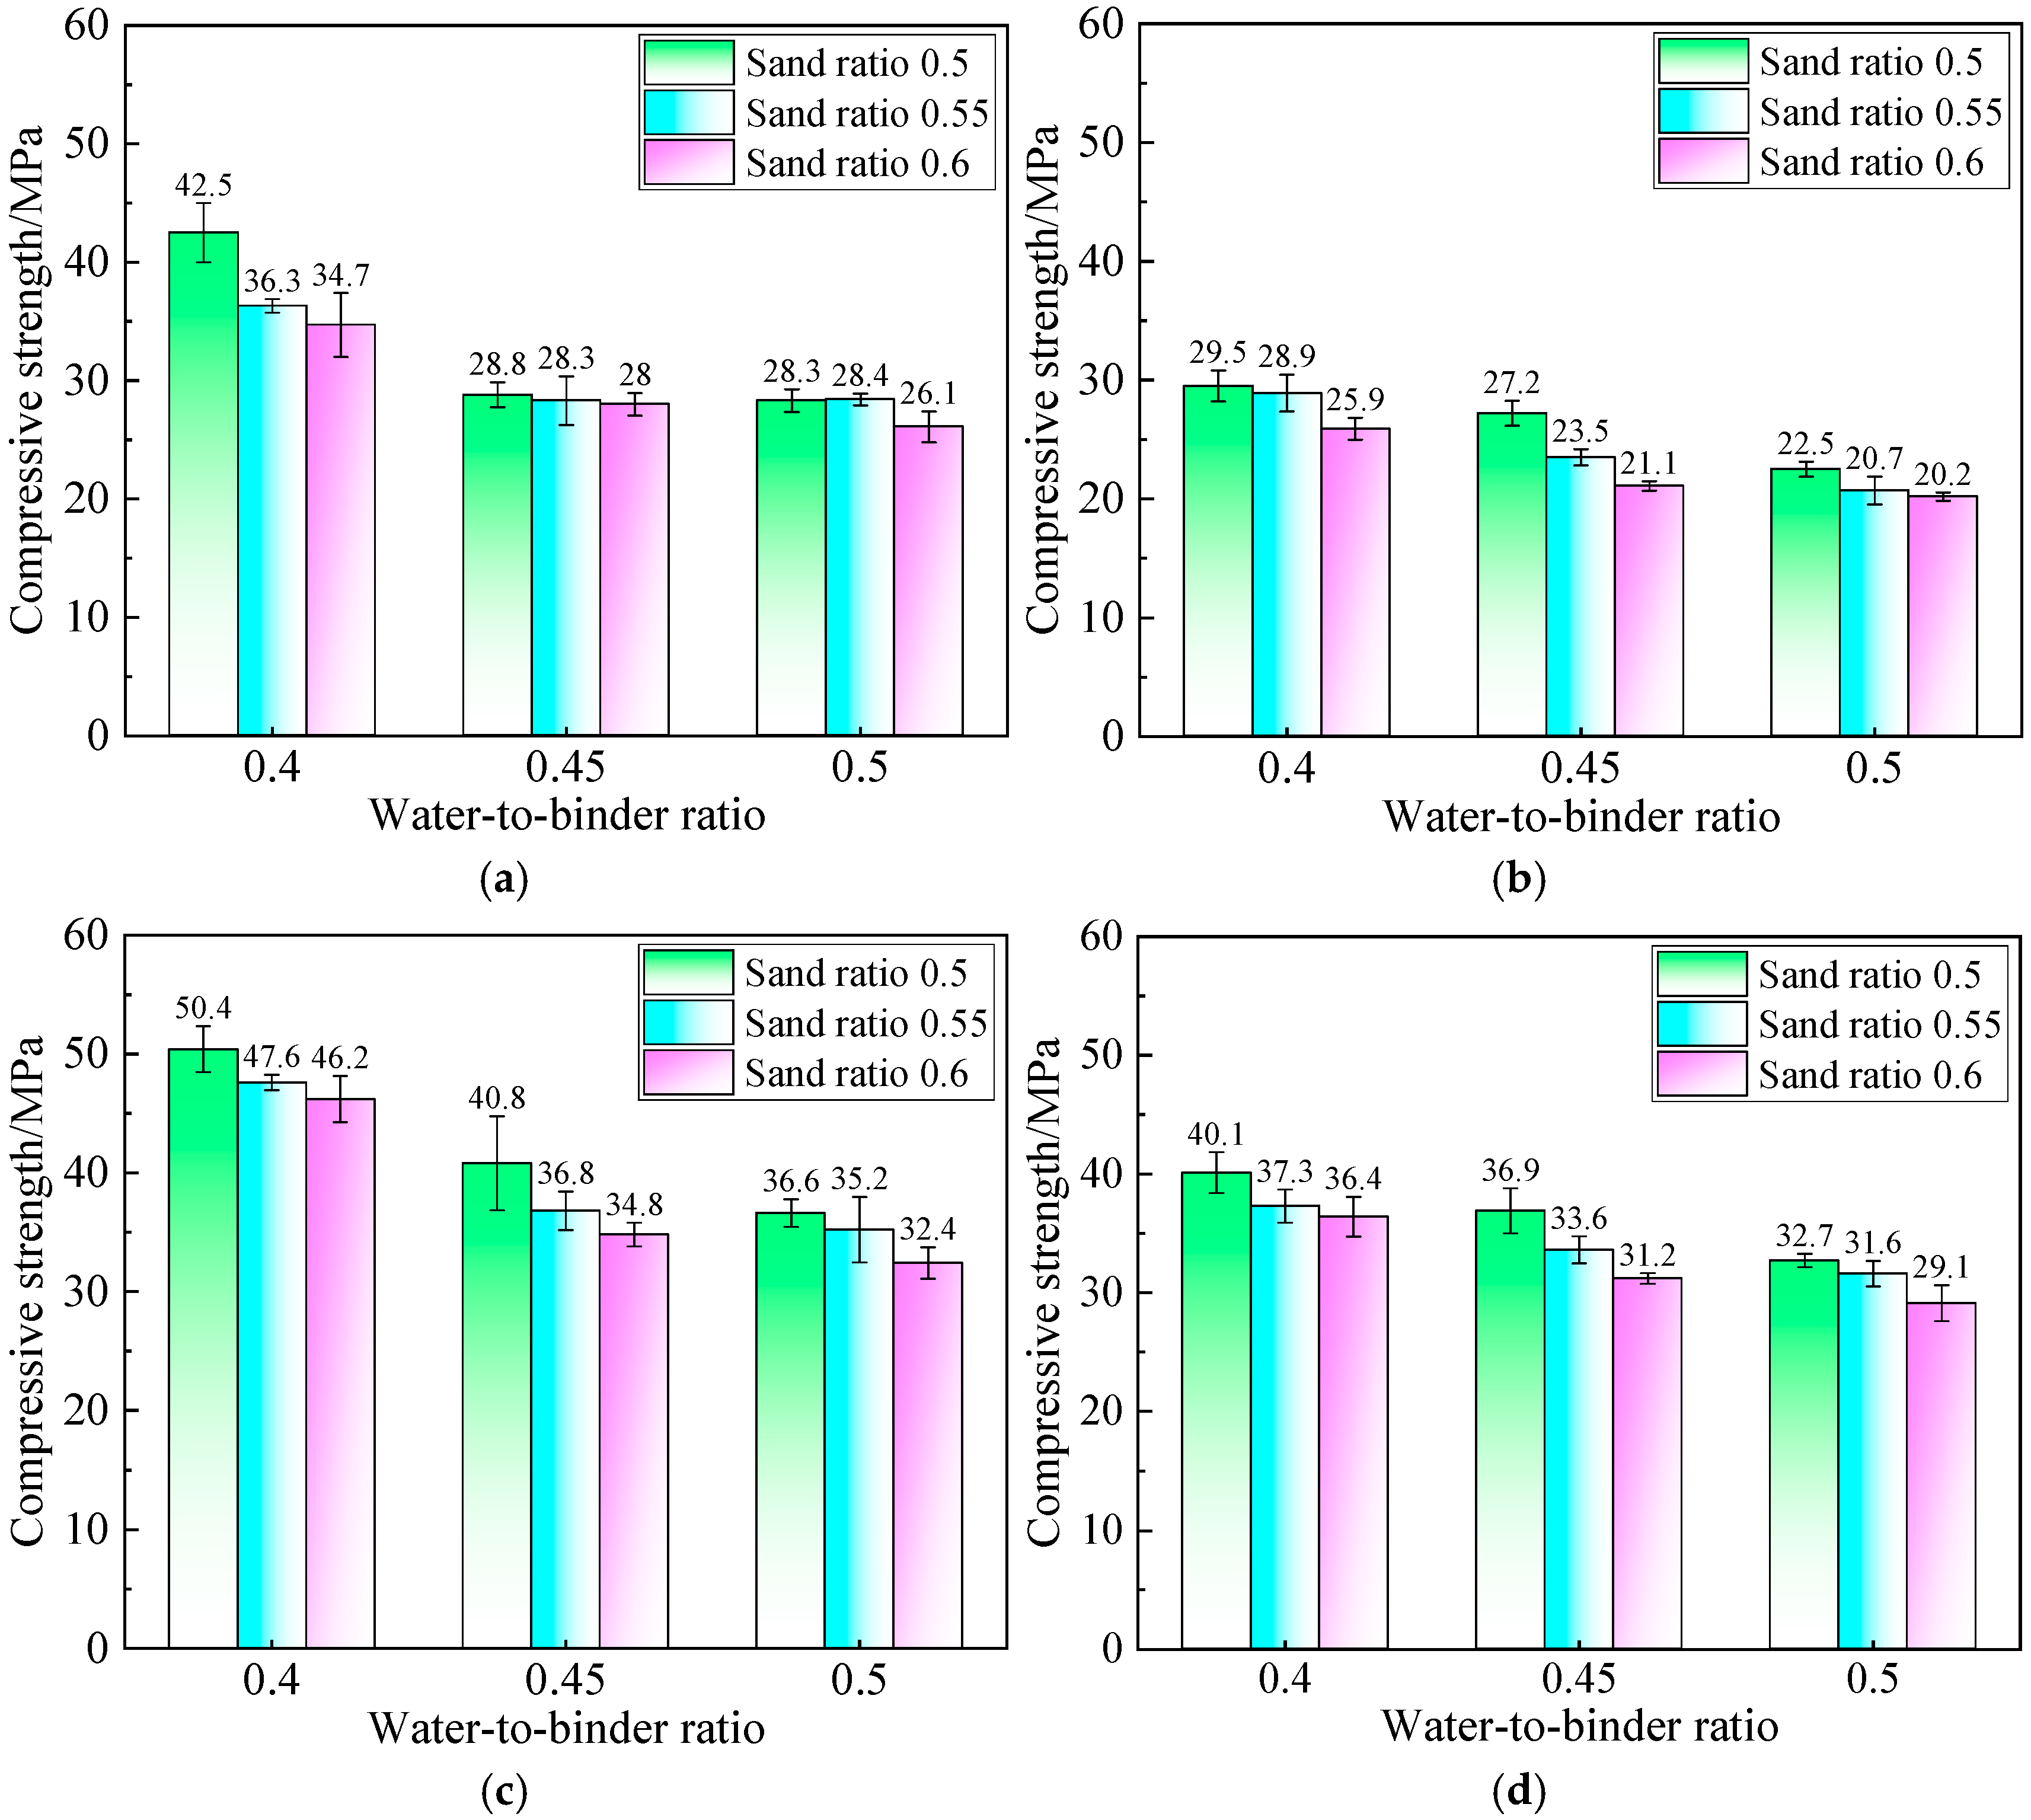
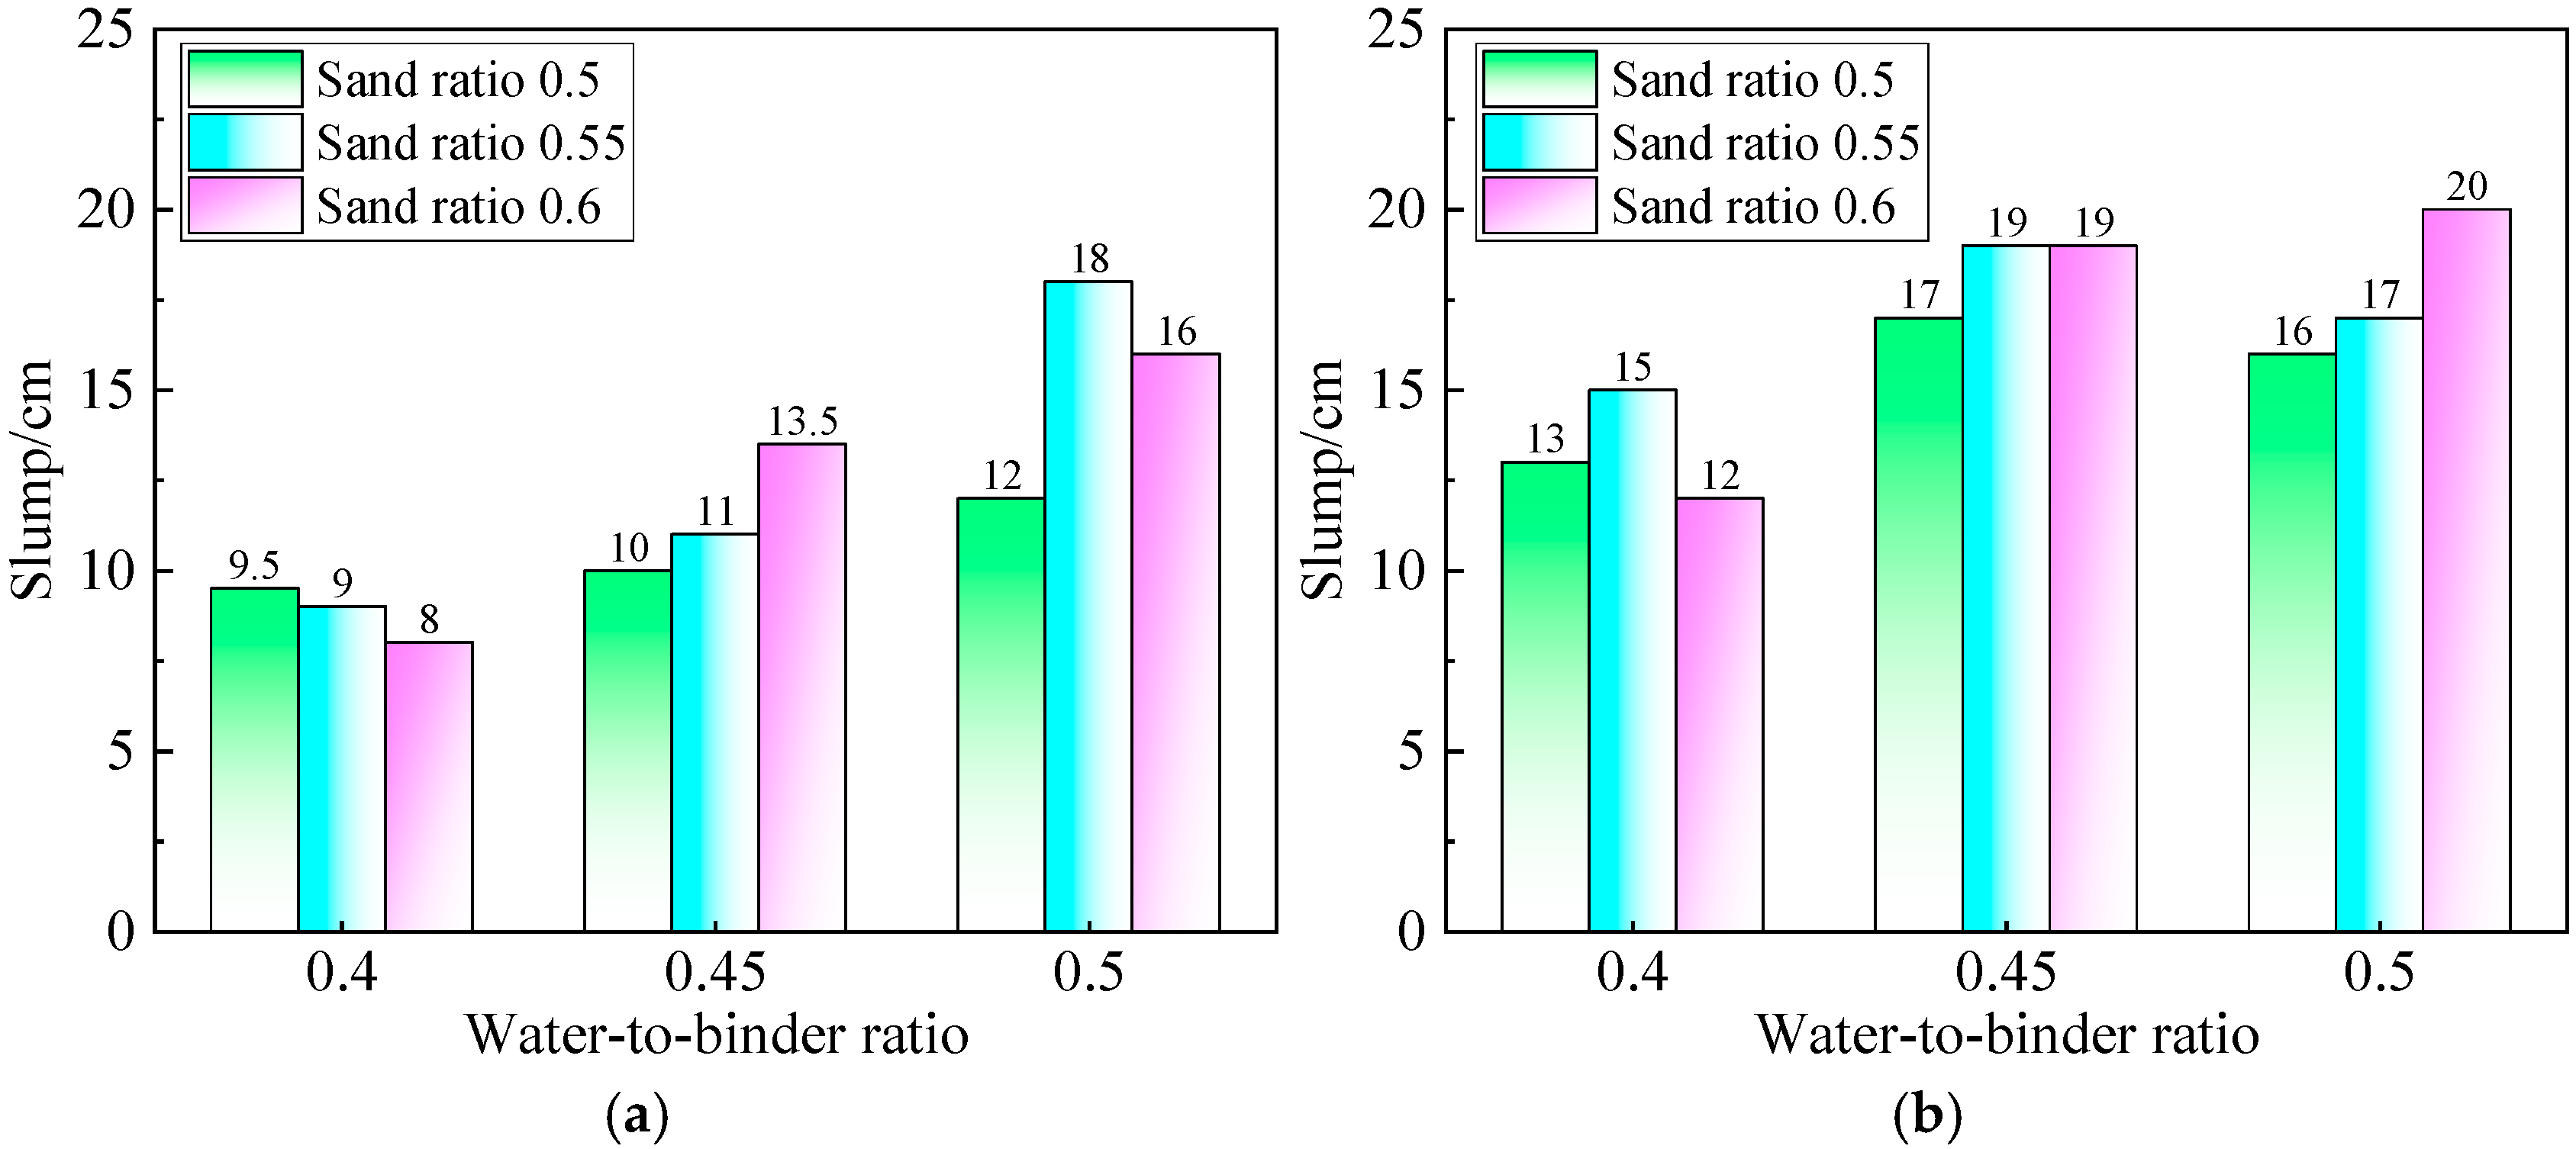
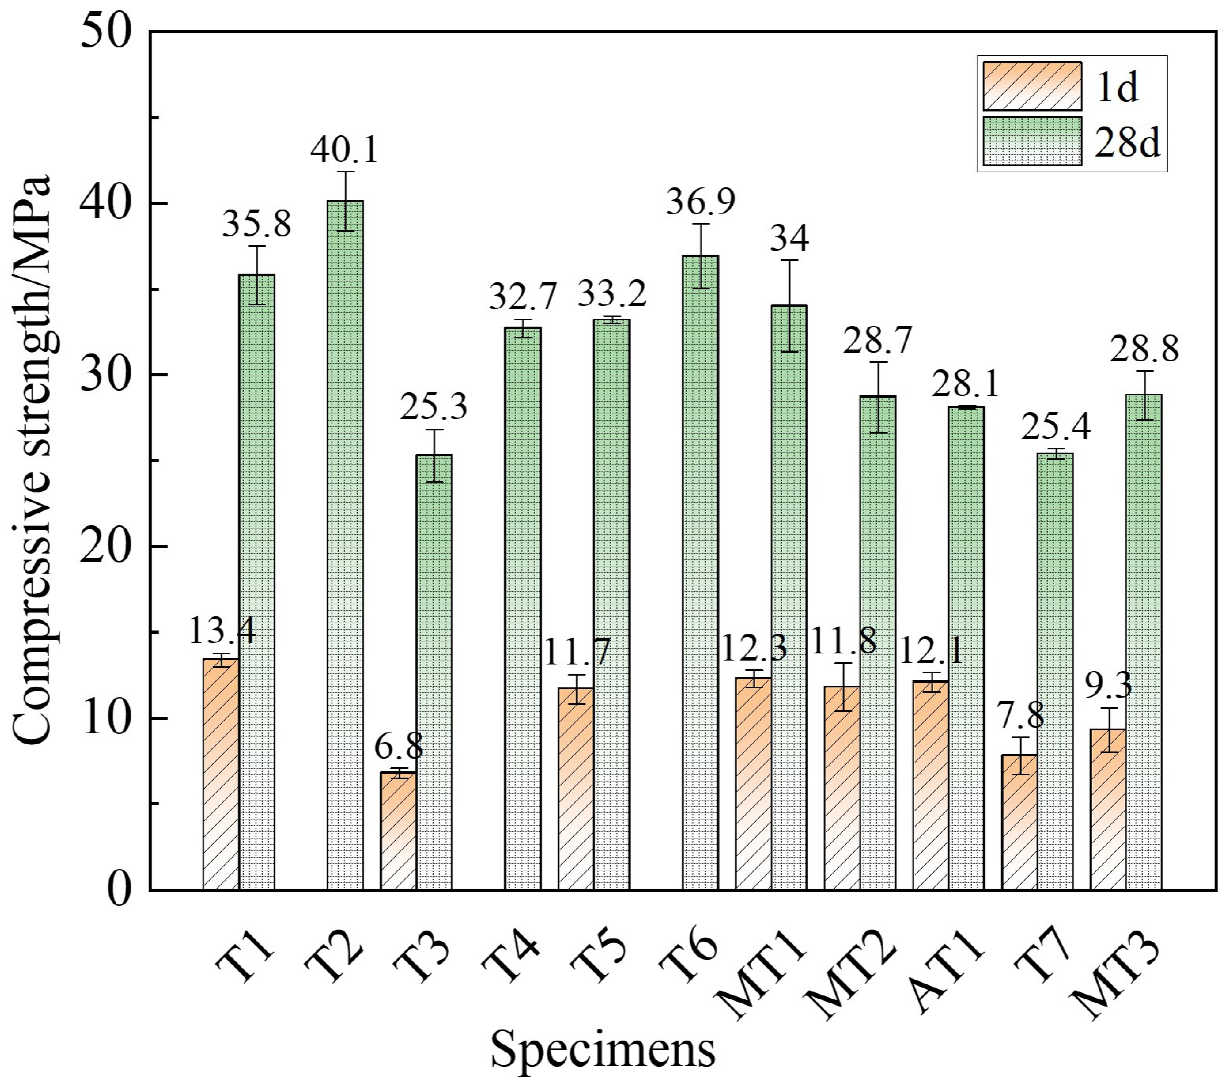
The strength characteristics of TBM concrete demonstrate significant sensitivity to variations in the water-to-binder ratio and fly ash content. It also exhibits a moderate sensitivity to the sand ratio; increasing it from 0.5 to 0.6 caused around an 8–15% strength reduction (28-day) in the concrete mixes, regardless of fly ash incorporation. An increase in the water-to-binder ratio from 0.4 to 0.5 resulted in divergent 28–day strength responses: the non-fly-ash concrete experienced a 26–29% strength decline, while the fly-ash-modified concrete showed a mitigated 15–20% reduction. Specifically, substituting 20% of the cement with fly ash induced distinct strength effects across water-to-binder ratios: a 20% reduction at a 0.4 ratio versus approximately 10% reductions at 0.45 and 0.5. By systematically optimizing key parameters, such as water-to-binder ratio and aggregate proportioning, engineers can design TBM fine aggregate concrete mixtures that meet C25, C30, and C35 strength requirements while ensuring excellent workability.
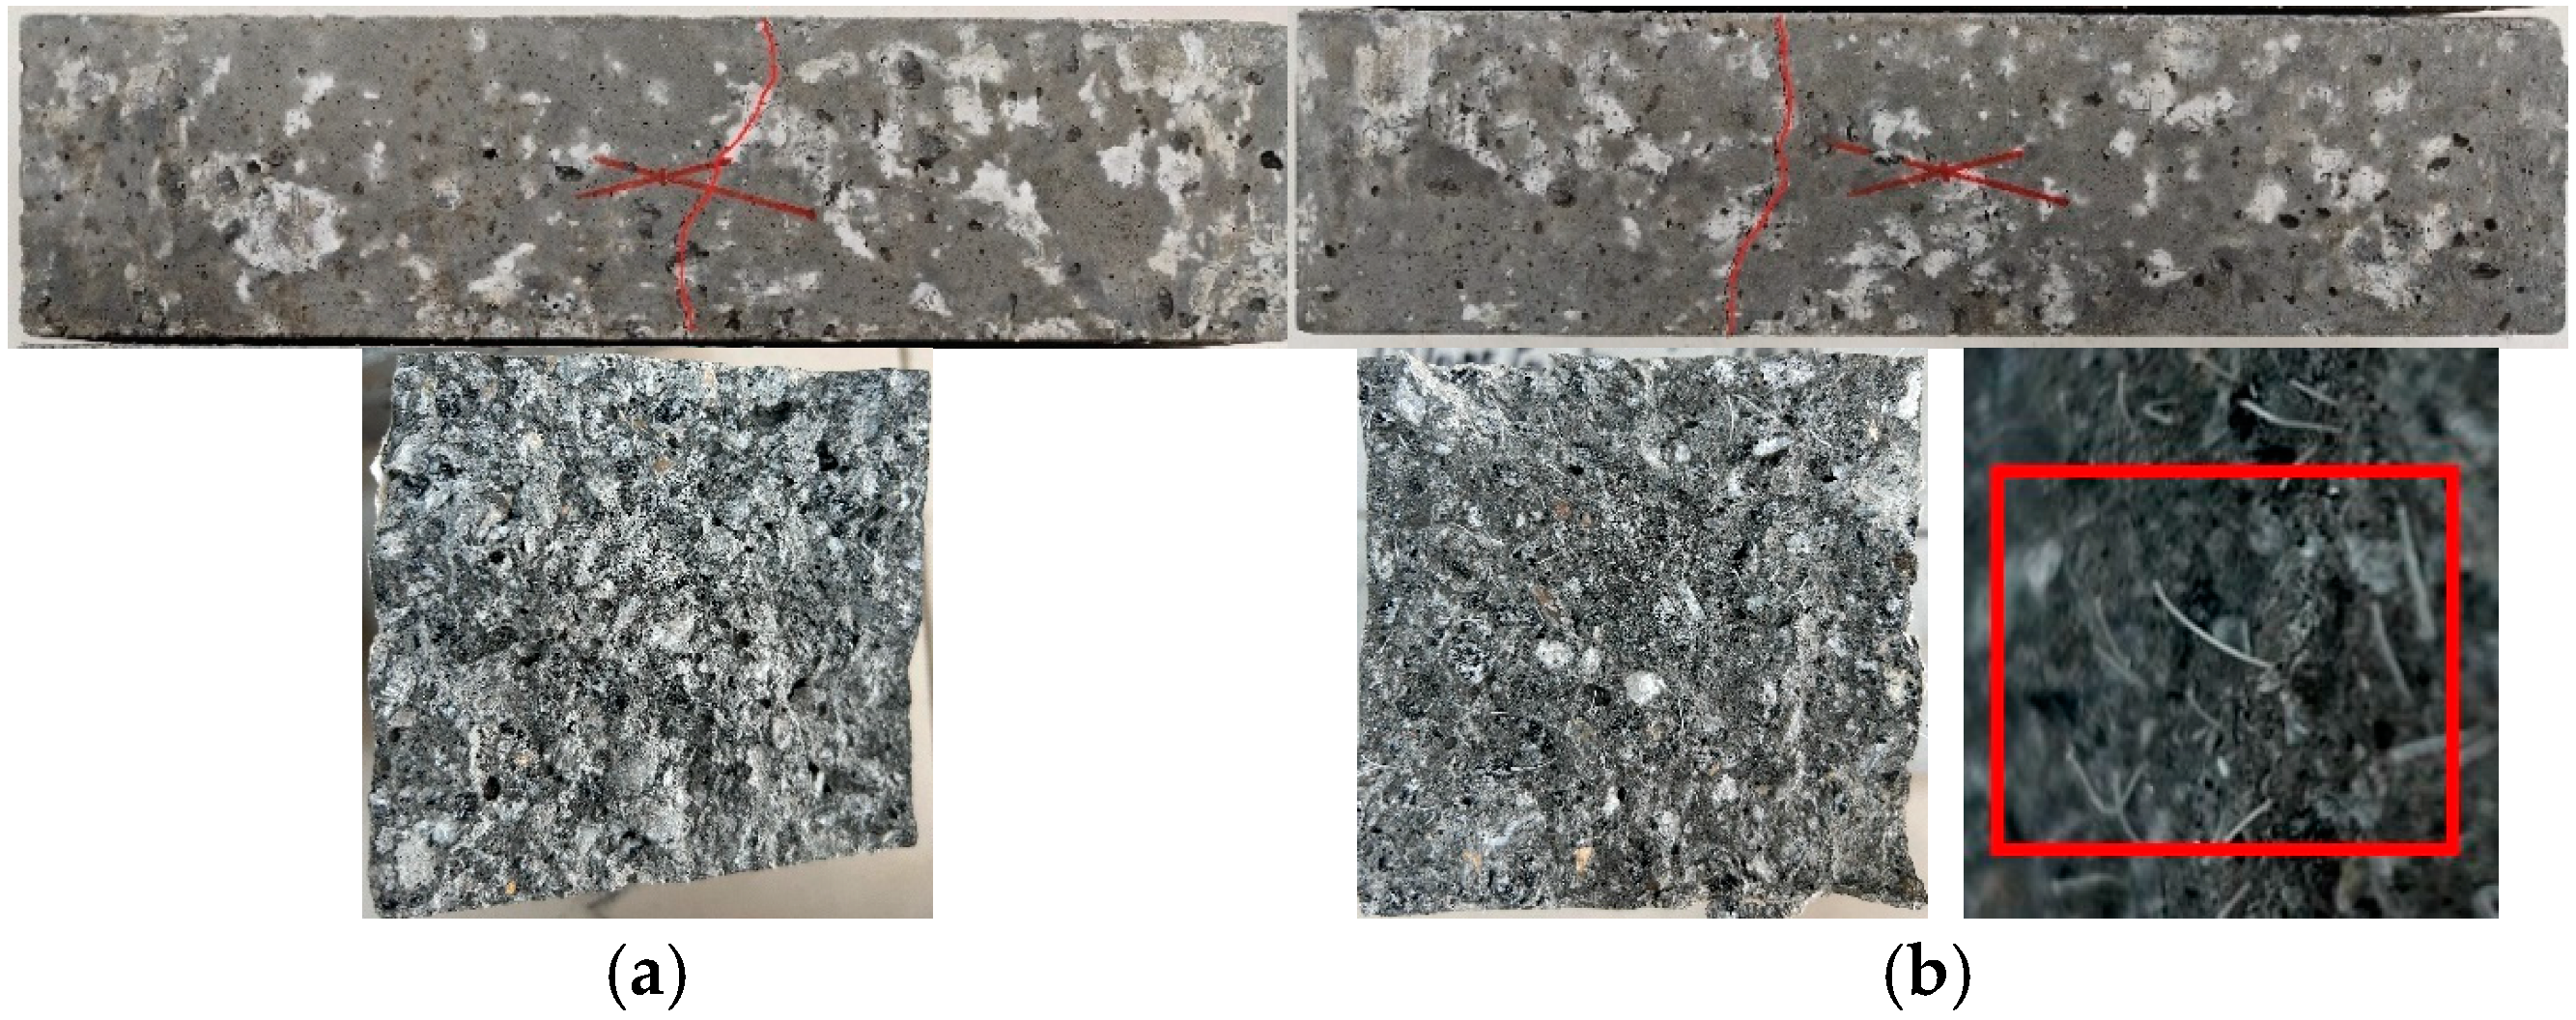
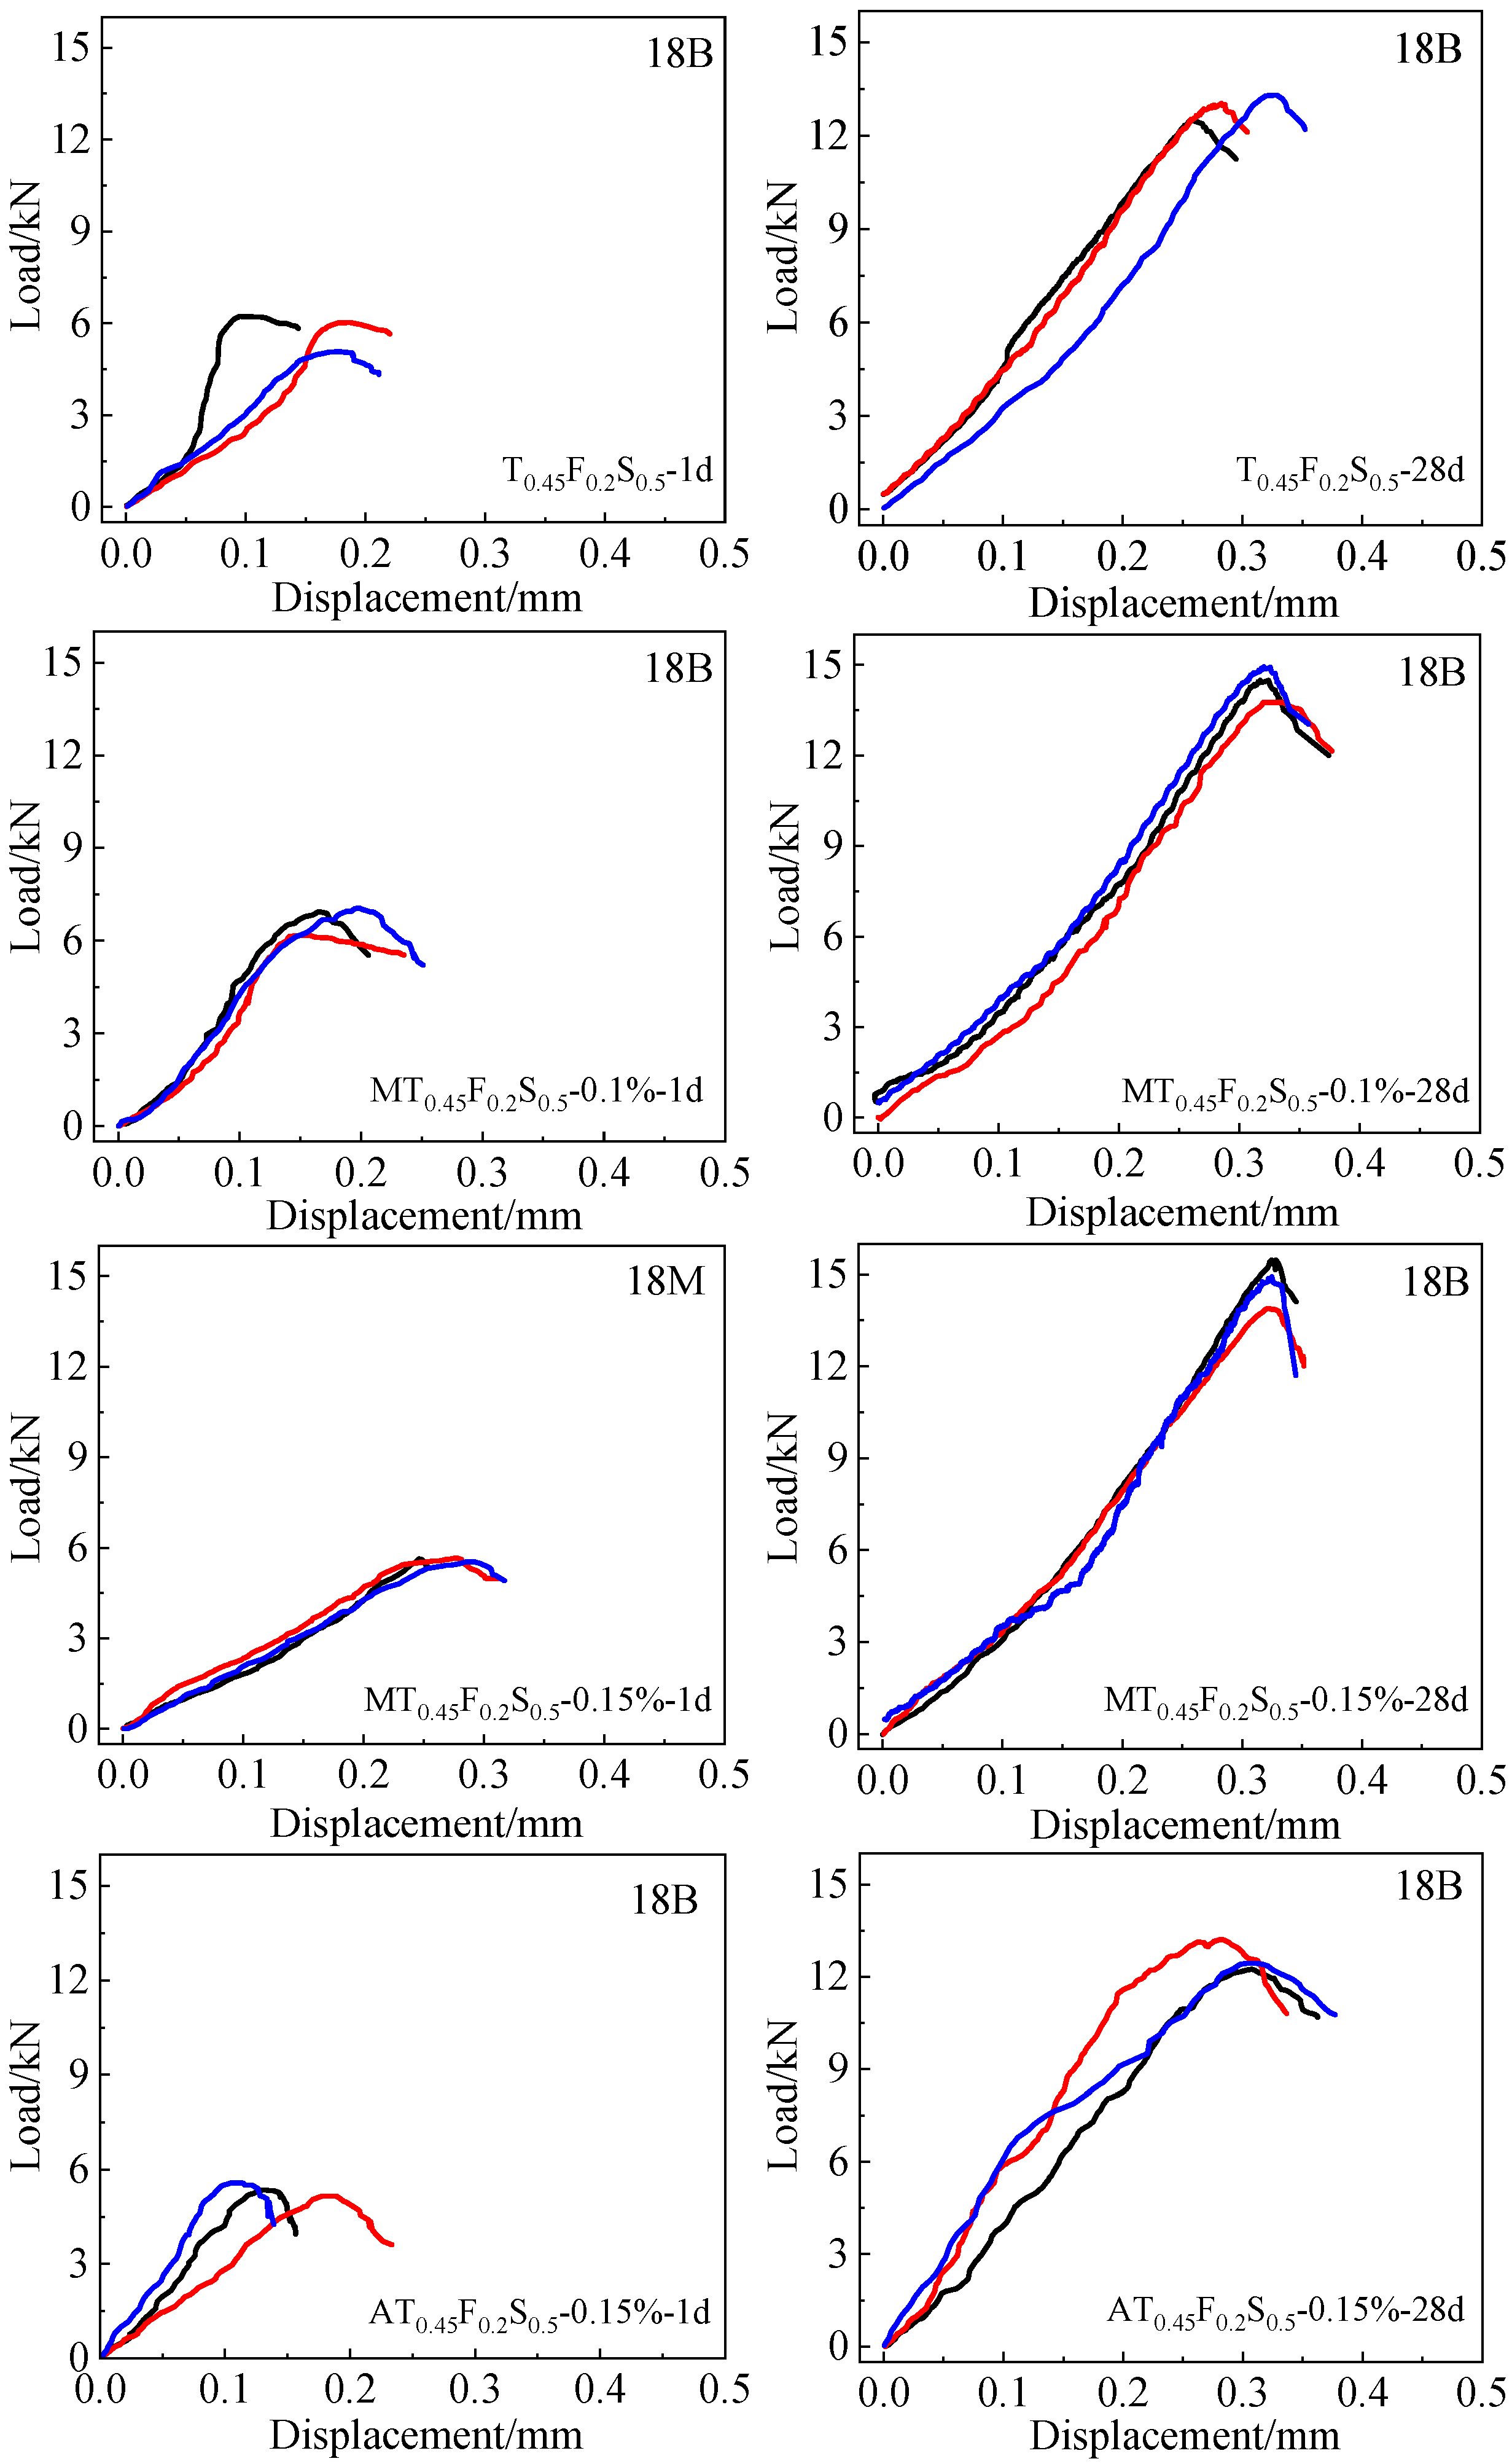
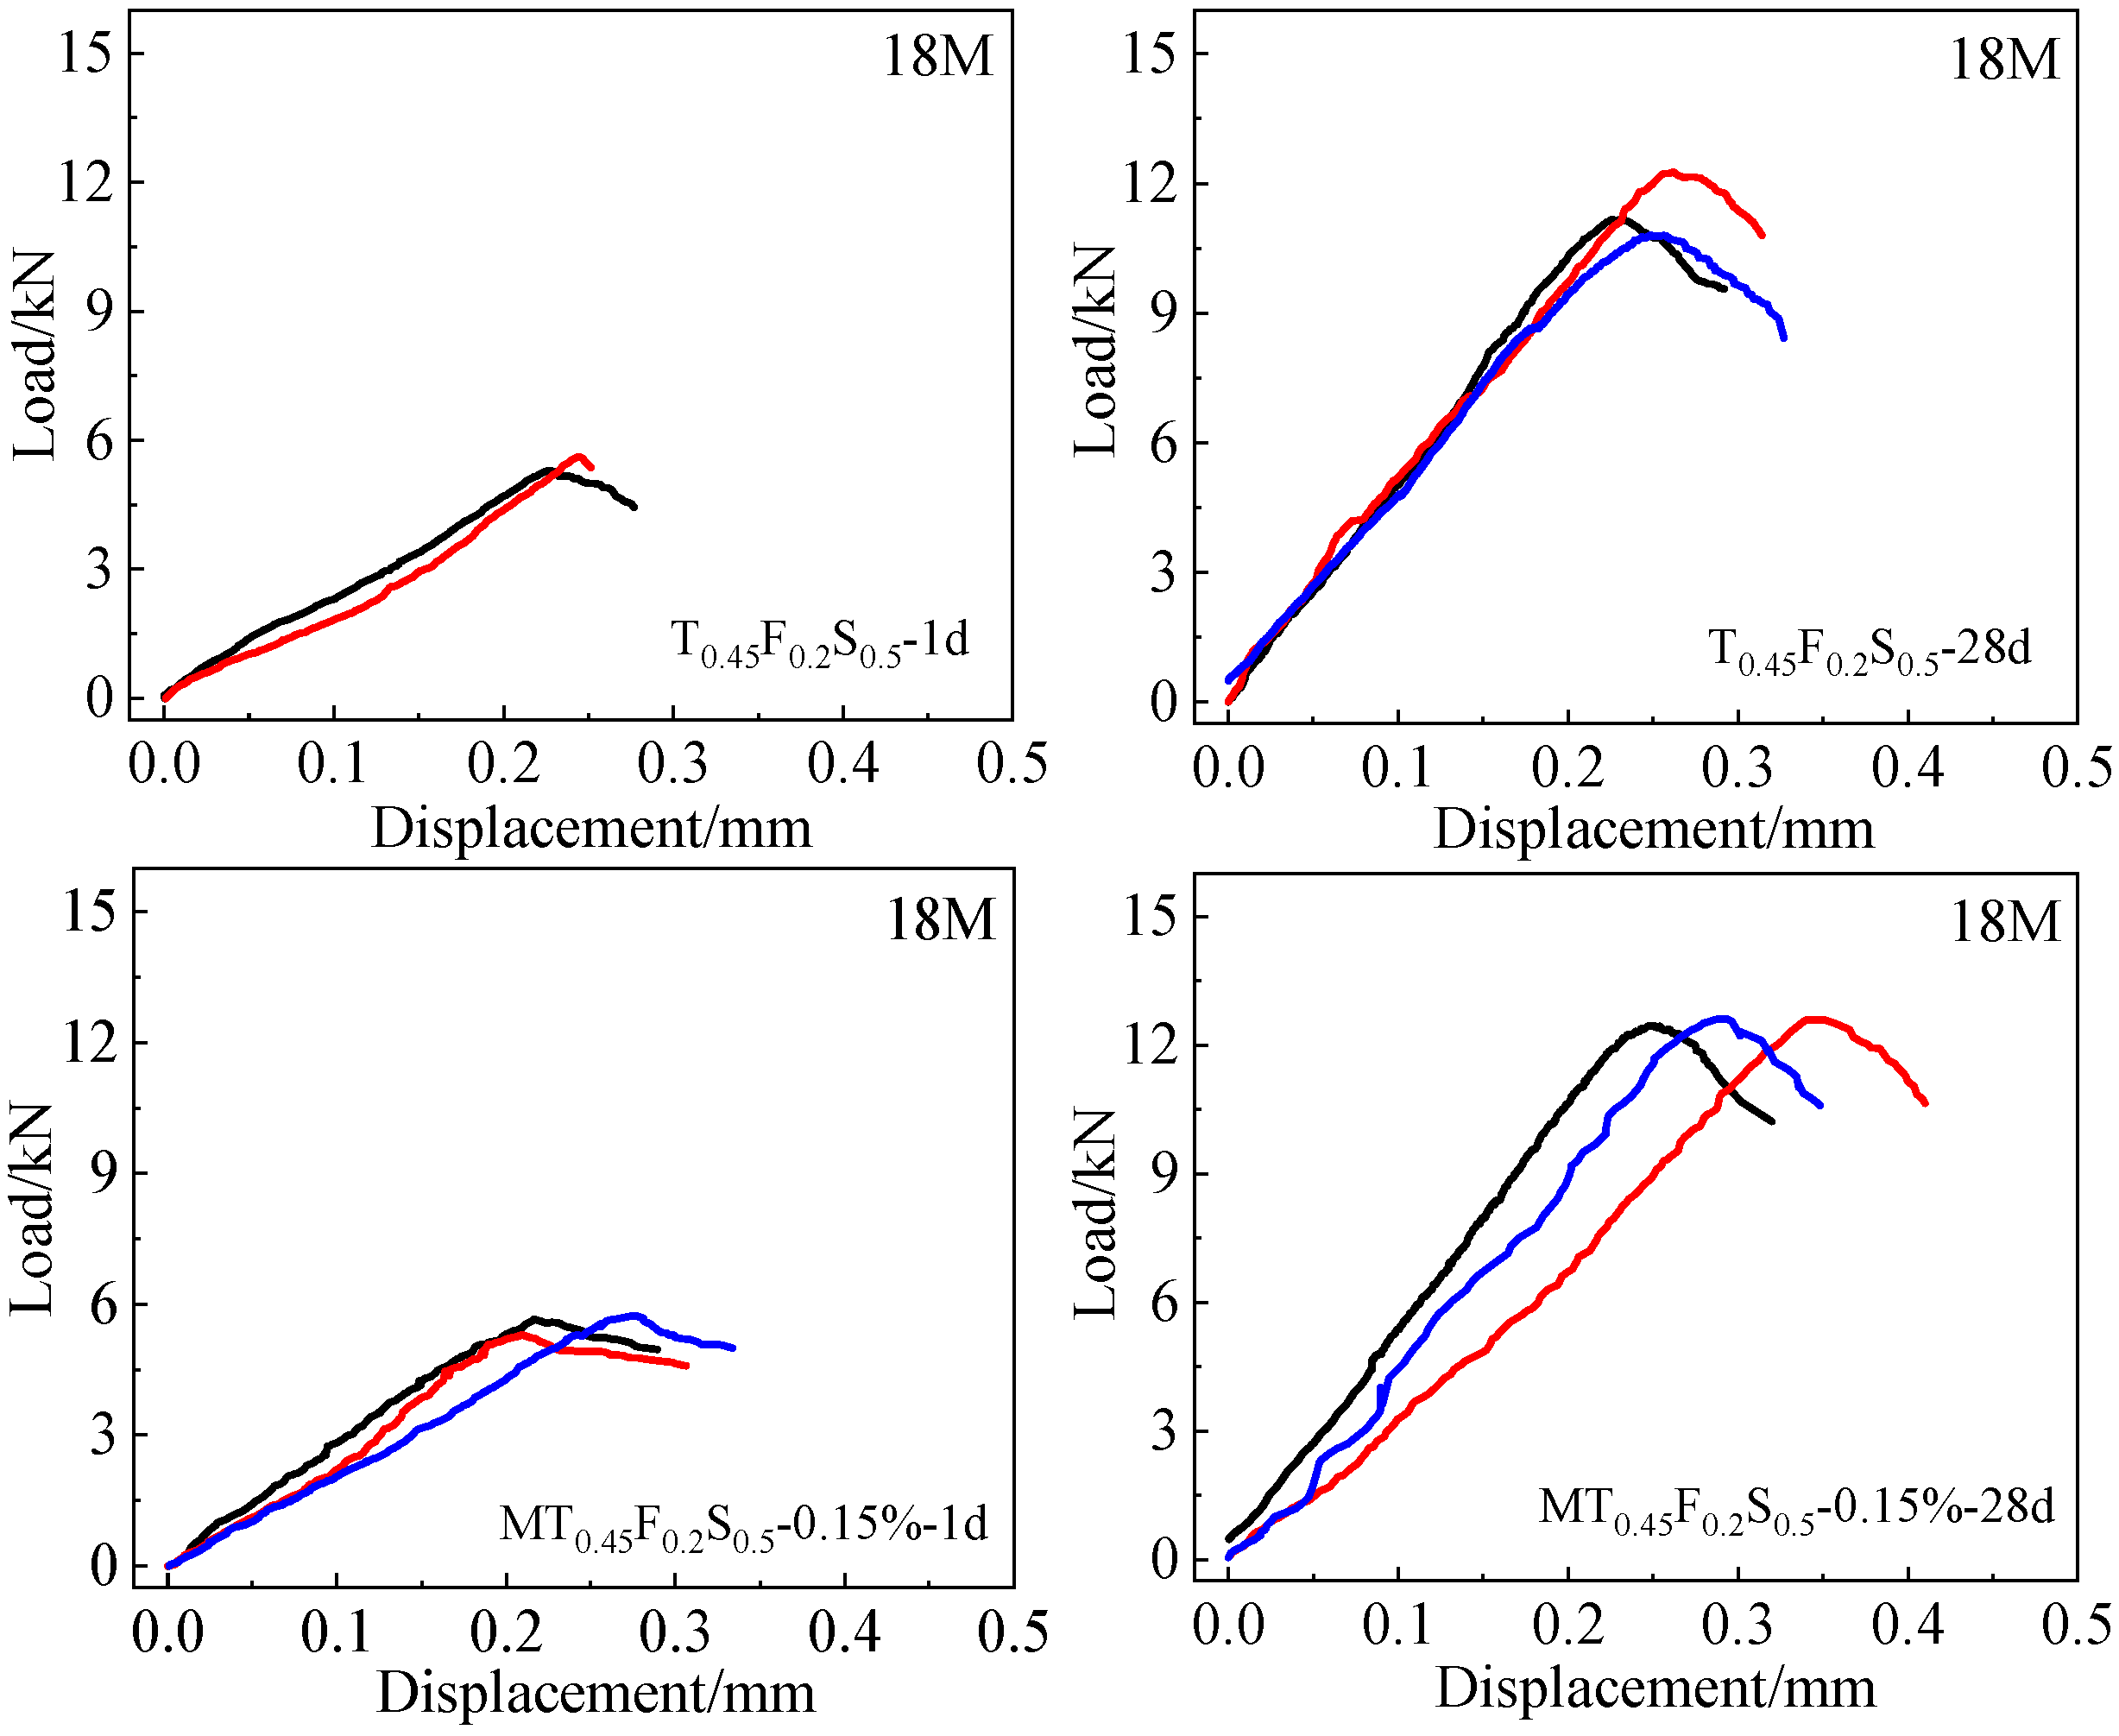
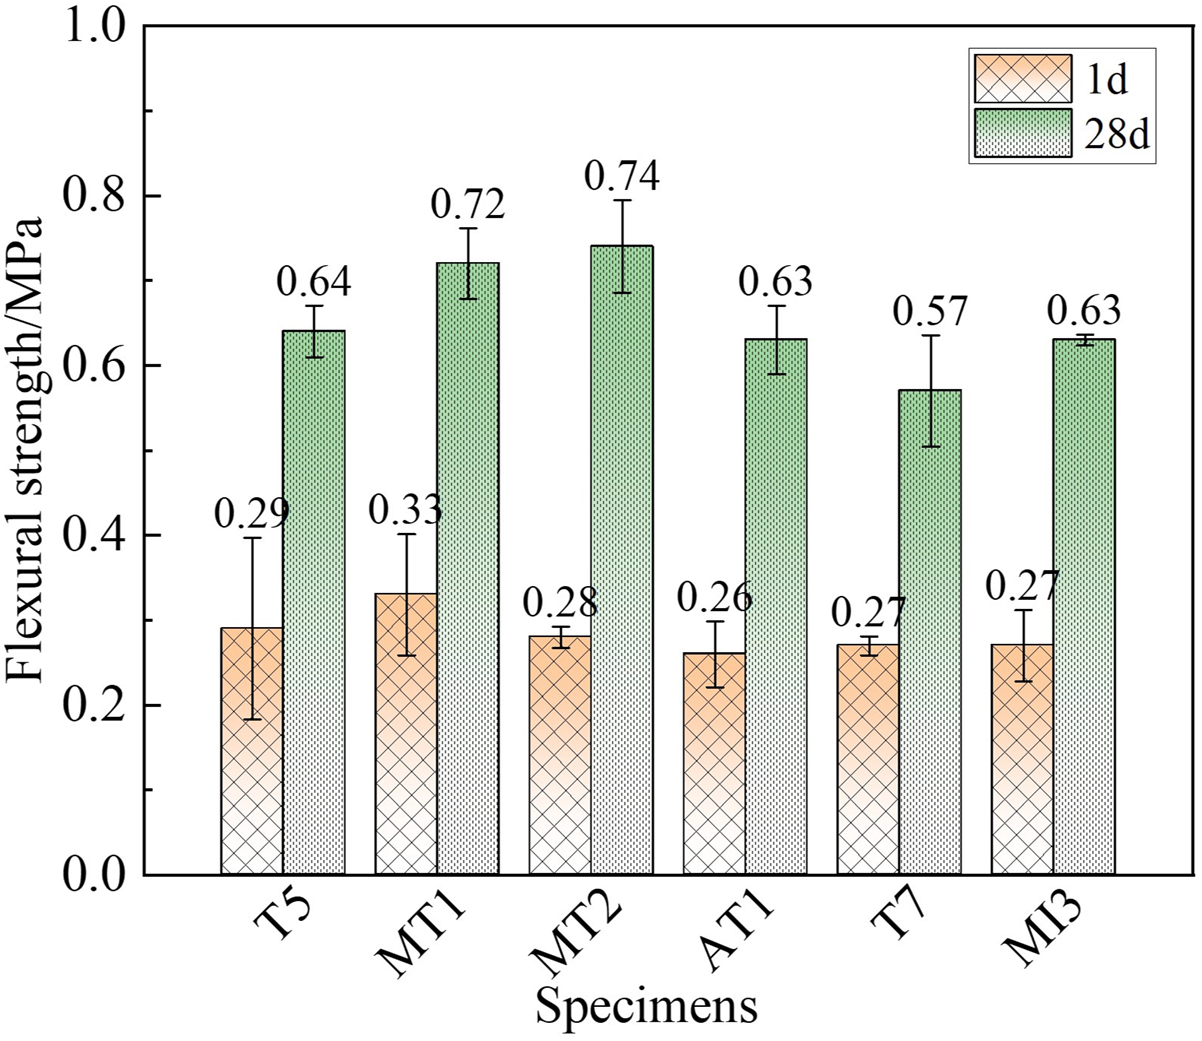
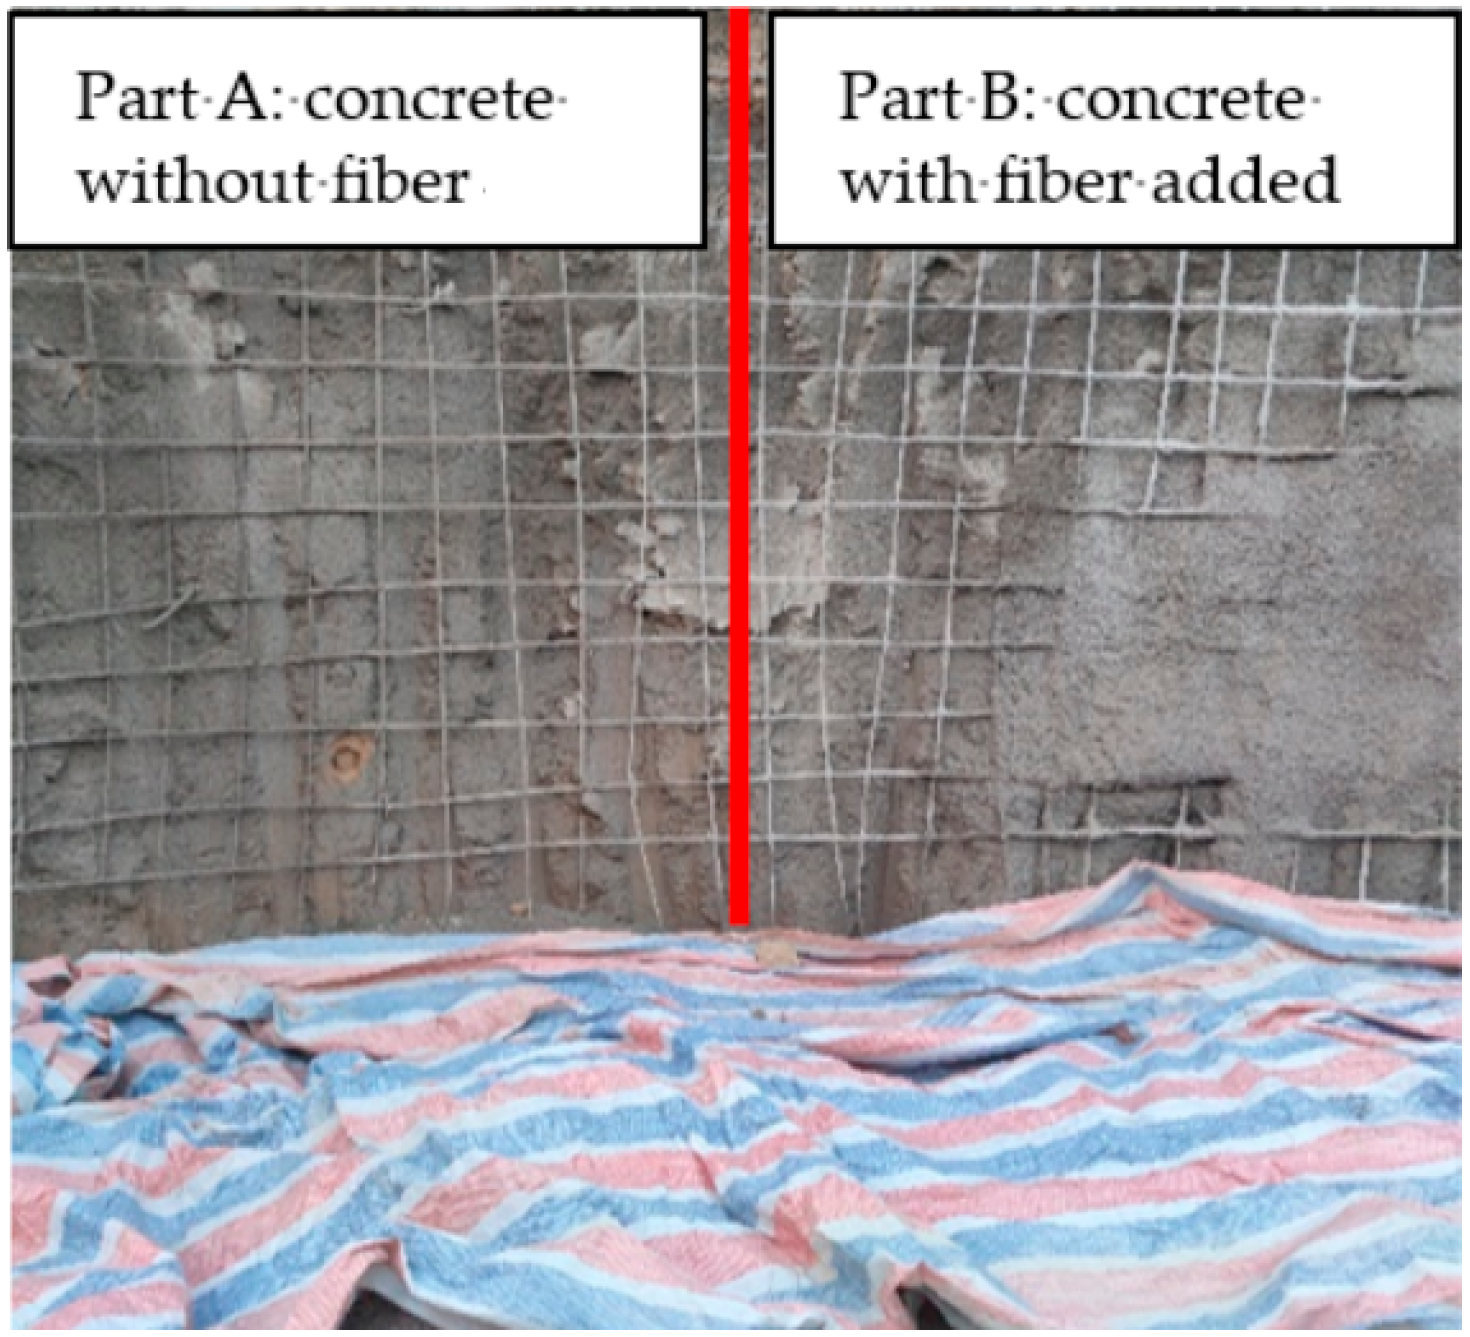
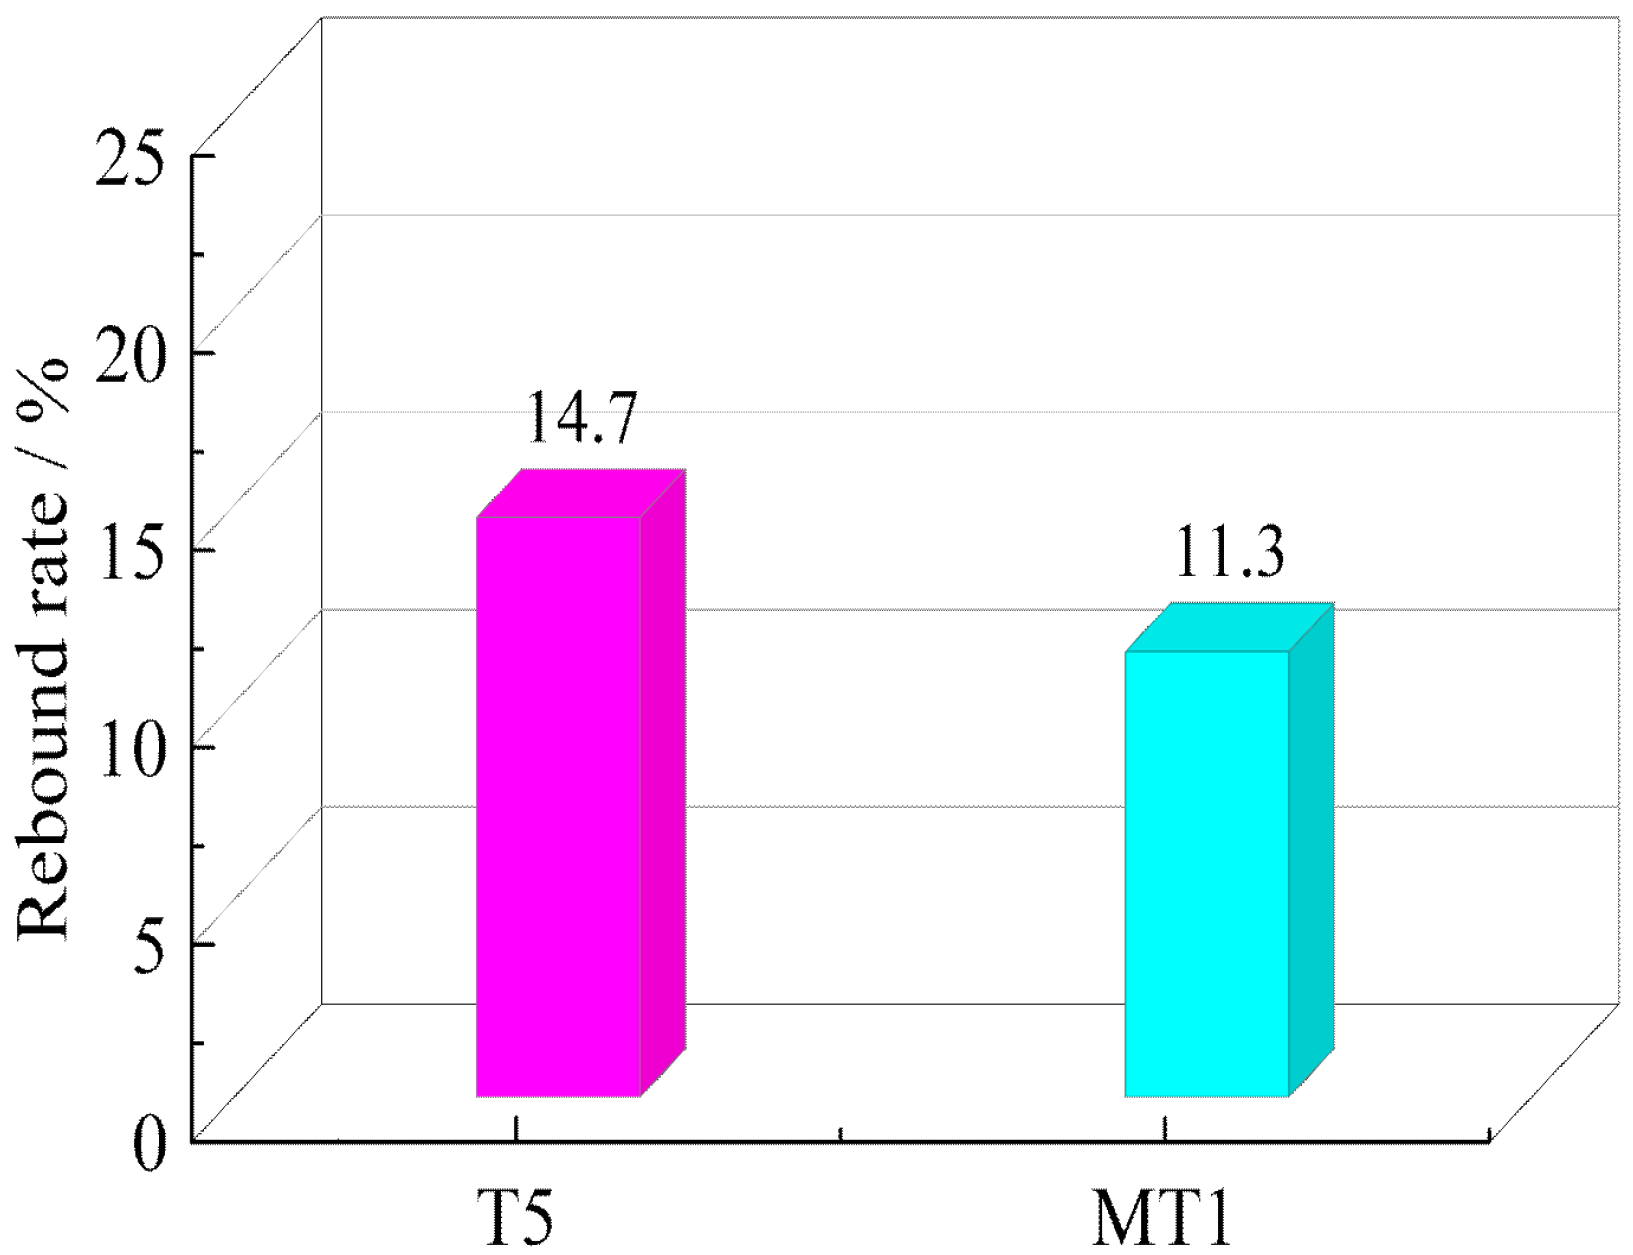
An accelerator can significantly shorten the setting time of concrete and increase its early strength. However, it caused the cement particles to be consumed rapidly in a short time, thus affecting the long-term strength development of the concrete and resulting in a reduction of around 30% in the 28d compressive strength of the concrete. Incorporating POM fibers at a volume fraction of 0.1% had little impact on the mechanical performance of the concrete while enhancing its cohesion and tensile strength, enabling the concrete to better resist its own weight and external impact forces during spraying or casting and thereby significantly reducing the rebound rate of the concrete. The prepared TBM shotcrete with a 0.15% volume fraction and a liquid-state alkali-free setting accelerator (8% dosage) had a moderate rebound rate of 11.3%.
Recycled TBM tunnel-excavated sand and aggregates demonstrate broad application prospects in concrete production, particularly for metro systems, railway construction, highway engineering, and hydraulic projects. However, the absence of comprehensive durability indices and the high processing costs of recycled sand and aggregates limit their large-scale application. Furthermore, this research focused solely on short-term performance (strength) and primary lining applications in tunnels, with insufficient systematic research on long-term durability (freeze–thaw resistance, permeability). Therefore, future research should prioritize optimizing shotcrete mix designs, improving durability, developing multifunctional materials, reducing processing costs, and evaluating environmental performance.
The applicability of recycled TBM-excavated materials is contingent upon the availability and quality of the aggregates at TBM construction sites. Although this research employed aggregates with particular mineralogical compositions and mechanical properties, it is recognized that geological heterogeneity can result in variations in aggregate characteristics across different TBM projects. In regions where comparable high-quality aggregates are accessible, the methodology and conclusions presented can serve as a reliable reference. However, when using alternative aggregate types, additional testing is recommended to address potential variations in material properties. Future studies should incorporate multi-source aggregate datasets and establish region-specific adjustment coefficients to enhance the generalizability of their findings for diverse TBM locations.

Author Contributions

Conceptualization, W.Z. and J.H.; methodology, R.H.; validation, W.Z. and R.H.; formal analysis, Z.M.; investigation, W.Z. and R.H.; resources, Y.Z.; data curation, W.H.; writing—original draft preparation, W.Z.; writing—review and editing, W.Z. and J.H.; visualization, Y.Z. and W.H.; supervision, W.H.; project administration, Y.Z. and W.H.; funding acquisition, J.H. All authors have read and agreed to the published version of the manuscript.

Funding

This research was funded by the National Natural Science Foundation of China, grant number 5207090694, the Natural Science Basic Research Program of Shaanxi Province, grant number 2021JQ-983, and Key R&D Plan Projects in Shaanxi Province, grant number 2023-ZDLGY-26.

Data Availability Statement

Some or all data, models, or code that support the findings of this study are available from the corresponding author upon reasonable request.

Acknowledgments

The authors would like to express their gratitude for the technical assistance from any individual or institution, including the provision of instruments and equipment, collaborative test work, and helpful guidance.

Conflicts of Interest

Authors Wei Zhang, Rusheng Hao, Zhijun Men, Jingjing He, Yong Zhang and Wei Hu were employed by the company PowerChina Northwest Engineering Corporation Limited. The remaining authors declare that the research was conducted in the absence of any commercial or financial relationships that could be construed as a potential conflict of interest.

References

  1. Barla, G.; Pelizza, S. TBM tunnelling in difficult ground conditions. In Proceedings of the GeoEng2000, International Conference on Geotechnical & Geological Engineering, Melbourne, Australia, 19–24 November 2000. [Google Scholar]
  2. Zheng, Y.; Zhang, Q.; Zhao, J. Challenges and opportunities of using tunnel boring machines in mining. Tunn. Undergr. Sp. Tech. 2016, 57, 287–299. [Google Scholar] [CrossRef]
  3. Zhang, Y.; Zhou, J.; Qiu, Y.; Armaghani, D.J.; Xie, Q.; Yang, P.; Xu, C. A visual survey of tunnel boring machine (TBM) performance in tunneling excavation: Mainstream direction, brief review and future prospects. Appl. Sci. 2024, 14, 4512. [Google Scholar] [CrossRef]
  4. Huang, X.; Liu, Q.; Shi, K.; Pan, Y.; Liu, J. Application and prospect of hard rock TBM for deep roadway construction in coal mines. Tunn. Undergr. Sp. Tech. 2018, 73, 105–126. [Google Scholar] [CrossRef]
  5. Glab, K.; Wehrmeyer, G.; Thewes, M.; Broere, W. Predictive machine learning in earth pressure balanced tunnelling for main drive torque estimation of tunnel boring machines. Tunn. Undergr. Sp. Tech. 2024, 146, 105642. [Google Scholar] [CrossRef]
  6. Liu, W.L.; Li, A.; Liu, C.J. Multi-objective optimization control for tunnel boring machine performance improvement under uncertainty. Automat. Constr. 2022, 139, 104310. [Google Scholar] [CrossRef]
  7. Home, L. Hard rock TBM tunneling in challenging ground: Developments and lessons learned from the field. Tunn. Undergr. Sp. Tech. 2016, 57, 27–32. [Google Scholar] [CrossRef]
  8. Gertsch, L.; Fjeld, A.; Nilsen, B.; Gertsch, R. Use of TBM muck as construction material. Tunn. Undergr. Sp. Tech. 2000, 15, 379–402. [Google Scholar] [CrossRef]
  9. Gagg, C.R. Cement and concrete as an engineering material: An historic appraisal and case study analysis. Eng. Fail. Anal. 2014, 40, 114–140. [Google Scholar] [CrossRef]
  10. Olbrecht, H.; Studer, W. Use of TBM chip as concrete aggregate. Mater. Struct. 1998, 31, 184–187. [Google Scholar] [CrossRef]
  11. Alnuaim, A.; Abbas, Y.M.; Khan, M.I. Sustainable application of processed TBM excavated rock material as green structural concrete aggregate. Constr. Build. Mater. 2021, 274, 121245. [Google Scholar] [CrossRef]
  12. Alnuaim, A.; Al-Mahbashi, A.M.; Dafalla, M. Utilizing Tunnel Boring Machine (TBM)-Crushed Limestone as a Construction Material. Materials 2022, 15, 7569. [Google Scholar] [CrossRef] [PubMed]
  13. Tokgöz, N. Use of TBM excavated materials as rock filling material in an abandoned quarry pit designed for water storage. Eng. Geol. 2013, 153, 152–162. [Google Scholar] [CrossRef]
  14. Priyadharshini, P.; Ramamurthy, K.; Robinson, R.G. Influence of temperature and duration of thermal treatment on properties of excavated soil as fine aggregate in cement mortar. J. Mater. Civil. Eng. 2019, 31, 04019137. [Google Scholar] [CrossRef]
  15. Voit, K.; Zimmermann, T. Characteristics of selected concrete with tunnel excavation material. Constr. Build. Mater. 2015, 101, 217–226. [Google Scholar] [CrossRef]
  16. Piotrowska, E.; Malecot, Y.; Ke, Y. Experimental investigation of the effect of coarse aggregate shape and composition on concrete triaxial behavior. Mech. Mater. 2014, 79, 45–57. [Google Scholar] [CrossRef]
  17. Gupta, T.; Kothari, S.; Siddique, S.; Sharma, R.K.; Chaudhary, S. Influence of stone processing dust on mechanical, durability and sustainability of concrete. Constr. Build. Mater. 2019, 223, 918–927. [Google Scholar] [CrossRef]
  18. Souza, A.T.; Barbosa, T.F.; Riccio, L.A.; Santos, W.J. Effect of limestone powder substitution on mechanical properties and durability of slender precast components of structural mortar. J. Mater. Res. Technol. 2020, 9, 847–856. [Google Scholar] [CrossRef]
  19. DL/T 5151-2014; Code for Testing Aggregates of Hydraulic Concrete. China Electric Power Press: Beijing, China, 2014. (In Chinese)
  20. DL/T 5144-2015; Specifications for Hydraulic Concrete Construction. China Electric Power Press: Beijing, China, 2015. (In Chinese)
  21. Fu, T.; Liang, J.; Lan, Y.; Xiao, Y.; Wei, J. Effect of stone powder content on mechanical properties of manufactured sand concrete. IJST-Trans. Civ. Eng. 2022, 46, 4255–4264. [Google Scholar] [CrossRef]
  22. Cai, J. Research of Effects and Mechanism of Micro Fines on Manufactured Fine Aggregate Concretes; Wuhan University of Technology: Wuhan, China, 2006. (In Chinese) [Google Scholar]
  23. GB/T 35159-2017; Flash Setting Admixtures for Shotcrete. Standard Press of China: Beijing, China, 2017. (In Chinese)
  24. GB/T 208-2014; Test Method for Determinging Cement Density. China Standard Press: Beijing, China, 2014. (In Chinese)
  25. GB 175-2023; Common Portland Cement. China Standard Press: Beijing, China, 2023. (In Chinese)
  26. GB/T 1596-2017; Fly Ash Used for Cement and Concrete. China Standard Press: Beijing, China, 2023. (In Chinese)
  27. JGJ/T 372-2016; Technical Specification for Application of Sprayed Concrete. China Architecture & Building Press: Beijing, China, 2016. (In Chinese)
  28. Yan, P.; Xu, Z. Influence of water-binder ratio and composition on the hydration of shrinkage-compensating binding material. J. Chin. Ceram. Soc. 2003, 31, 790–794. (In Chinese) [Google Scholar] [CrossRef]
  29. Li, M.Y.; Liu, Y.; Han, J.G.; Gao, Y.T.; Zhang, H.J.; Yan, P.Y. Influences of sand ratio and paste aggregate ratio on fresh properties of high-fluidity concrete. J. Chin. Ceram. Soc. 2020, 48, 1107–1113. (In Chinese) [Google Scholar] [CrossRef]
  30. Khouadjia, M.L.K.; Mezghiche, B.; Drissi, M. Experimental evaluation of workability and compressive strength of concrete with several local sand and mineral additions. Constr. Build. Mater. 2015, 98, 194–203. [Google Scholar] [CrossRef]
Figure 1. TBM-excavated tunnel materials.
Buildings 15 01483 g001
Figure 2. Particle size distribution.
Buildings 15 01483 g002
Figure 3. Four-point bending test.
Buildings 15 01483 g003
Figure 4. Compressive strength of normal concrete: (a) 7-day strength without fly ash; (b) 7-day strength with fly ash; (c) 28-day strength without fly ash; (d) 28-day strength with fly ash.
Buildings 15 01483 g004
Figure 5. Slump of normal concrete: (a) concrete without fly ash; (b) concrete with fly ash.
Buildings 15 01483 g005
Figure 6. Compressive failure modes: (a) concrete without fibers; (b) concrete with fibers; (c) fiber pullout and fracture.
Buildings 15 01483 g006
Figure 7. Flexural failure modes: (a) concrete without fibers; (b) concrete with fibers.
Buildings 15 01483 g007
Figure 8. Comparison of compressive strength.
Buildings 15 01483 g008
Figure 9. Load–deformation curves of prism specimens (each mix proportion contains three identical specimens, corresponding to curves of different colors in each diagram).
Buildings 15 01483 g009aBuildings 15 01483 g009b
Figure 10. Comparison of flexural strength.
Buildings 15 01483 g010
Figure 11. Working surface of shotcrete.
Buildings 15 01483 g011
Figure 12. Shotcrete spraying test: (a) spraying process; (b) spraying surface.
Buildings 15 01483 g012
Figure 13. Rebound rate of shotcrete.
Buildings 15 01483 g013
Table 1. Particle size distribution of TBM-excavated materials.
Sieve Mesh Size/mm50403020105
Sieve passing/kg721.83678.38618.99550.78473.60424.56
Sieve passing/%96.4890.6782.7373.6263.3056.74
Table 2. Physical performance of coarse aggregate.
Test ItemsStandard Requirements
DL/L 5144-2015 [20]
Coarse Aggregate
Apparent density (kg/m3)≥25502717
Water absorption (%)≤2.51.6
Clay lumps (%)Disallow0
Materials finer than 0.08 mm sieve (%)≤10.23
Bulk density (kg/m3)/1601
Soundness (%)≤54.2
Crushing index (%)≤2012.8
Porosity (%)/48
Content of needle and flake particles (%)≤154
Oversized/undersized content (%)Oversized≤50
Undersized≤100
Table 3. Particle size distribution of manufactured sand.
Sieve Mesh Size/mm52.51.250.630.3150.16
Sieve passing/g592.64566.73521.12462.89369.61281.550
Sieve passing/%99.9495.5787.8878.0662.3347.48
Table 4. Optimized manufactured sand particle size distribution.
Sieve Mesh Size/mm52.51.250.630.3150.16
Sieve passing/g594.15443.72343.41235.06171.35102.93
Sieve passing %99.6974.4557.6239.4428.7517.27
Table 5. Physical performance of optimized manufactured sand.
Test ItemsStandard Requirements
DL/L 5144-2015 [20]
Manufactured Sand
Fineness modulus2.4–2.82.81
Stone dust content (%)6–1818
Clay lumps (%)Disallow0
Soundness (%)≤101.5
Apparent density (kg/m3)≥25002675
Sulfare and suldide content (%)≤10.5
Saturated surface dry water absorption (%)/1.5
Mica content (%)≤21.67
Table 6. Test results of accelerator performance.
ParametersStandard Requirements
GB/T 35159-2017 [23]
Results
18B (8%)18M (8%)
Initial setting time/min≤53.32.9
Final setting time/min≤128.76.8
1d compressive strength (MPa)≥7.08.07.8
28d compressive strength ratio (%)≥909695
Density (g/cm3)/1.4581.455
Table 7. Physical performance of cement.
Test ItemsStandard Requirements
GB 175-2023 [25]
Cement
Density (g/cm3)/3.02
Standard consistency water consumption (%)/27.0
Stability (mm)≤5.01.0
Fineness (%)≥5.05.9
Setting time (min)Initially≥45220
Finally≥600301
Compressive strength (MPa)3-day≥17.025.4
28-day≥42.544.5
Flexural strength (MPa)3-day≥4.06.1
28-day≥6.58.6
Table 8. Physical performance of fly ash.
Test ItemsStandard Requirements
GB/T 1596-2017 [26]
Fly Ash
Density (g/cm3)≤2.62.36
Strength activity index (%)≥7077.2
Stability (mm)≤5.00.8
Fineness (%)≤3024.8
Water demand ratio (%)≤10590
SO3 (%)≤3.01.01
f-CaO (%)≤1.00.10
Table 9. Specific gravity of each material.
MaterialsWaterCementFly AshAcceleratorWater Reducing AgentManufactured SandCoarse Aggregat
Specific gravity1.003.022.361.4581.052.682.72
Table 10. Mix proportion test variable parameters.
NumbersBinding MaterialWaterSandStoneWater Reducing Agent
CementFly Ash
T0.4S0.5450-1808468594.5
T0.4F0.2S0.5360901808348484.5
T0.4S0.55450-1809307734.5
T0.4F0.2S0.55360901809187624.5
T0.4S0.6450-18010156874.5
T0.4F0.2S0.63609018010016784.5
T0.45S0.5400-1808678814.0
T0.45F0.2S0.5320801808578704.0
T0.45S0.55400-1809547934.0
T0.45F0.2S0.55320801809437844.0
T0.45S0.6400-18010417044.0
T0.45F0.2S0.63208018010296964.0
T0.5S0.5360-1808848983.6
T0.5F0.2S0.5288721808768893.6
T0.5S0.55360-1809738083.6
T0.5F0.2S0.55288721809638003.6
T0.5S0.6360-1807187183.6
T0.5F0.2S0.62887218010517123.6
Table 11. Experimental mix ratio and test results (kg/m3).
NumbersCompressive Strength (MPa)Slump (cm)
7-Day (Average)COV28-Day (Average)COV
T0.4S0.542.50.0650.40.049.5
T0.4F0.2S0.529.50.0440.10.049.5
T0.4S0.5536.30.0247.60.0113
T0.4F0.2S0.5528.90.0537.30.039
T0.4S0.634.70.0846.20.0115
T0.4F0.2S0.625.90.0436.40.058
T0.45S0.528.80.0440.80.0910
T0.45F0.2S0.527.20.0436.90.0517
T0.45S0.5528.30.0736.80.0411
T0.45F0.2S0.5523.70.0333.60.0319
T0.45S0.628.00.0434.80.0313.5
T0.45F0.2S0.621.00.0231.30.0419
T0.5S0.528.30.0336.60.0312
T0.5F0.2S0.522.50.0332.70.0216
T0.5S0.5528.40.0235.20.0818
T0.5F0.2S0.5520.70.0631.60.0317
T0.5S0.626.10.0532.40.0416
T0.5F0.2S0.620.10.0229.10.0520
Note: COV is coefficient of variation.
Table 12. Mix proportions of shotcrete.
NumbersAccelerator TypesAccelerator Content (%)Fiber TypesFiber Volume Content (%)
(T1) T0.4F0.2S0.518B7%--
(T2) T0.4F0.2S0.5----
(T3) T0.5F0.2S0.518B7%--
(T4) T0.5F0.2S0.5----
(T5) T0.45F0.2S0.518B7%--
(T6) T0.45F0.2S0.5----
(MT1) MT0.45F0.2S0.518B7%POM0.1
(MT2) MT0.45F0.2S0.518B7%POM0.15
(AT1) AT0.45F0.2S0.518B7%PVA0.15
(T7) T0.45F0.2S0.518M7% -
(MT3) MT0.45F0.2S0.518M7%POM0.15
Note: Number abbreviations are in brackets.
Table 13. Test results of TBM concrete with accelerator.
NumbersCompressive Strength (MPa)Flexural Strength (MPa)
1-Day (Average)COV28-Day (Average)COV1-Day (Average)COV28-Day (Average)COV
(T1) T0.4F0.2S0.513.40.0335.80.05----
(T2) T0.4F0.2S0.5--40.10.04----
(T3) T0.5F0.2S0.56.80.0425.30.06----
(T4) T0.5F0.2S0.5- 32.70.02----
(T5) T0.45F0.2S0.511.70.0733.20.010.290.110.640.03
(T6) T0.45F0.2S0.5--36.90.05----
(MT1) MT0.45F0.2S0.512.30.0334.00.080.330.070.720.04
(MT2) MT0.45F0.2S0.511.80.1128.70.070.280.010.740.05
(AT1) AT0.45F0.2S0.512.10.0528.10.010.260.040.630.04
(T7) T0.45F0.2S0.57.80.1325.40.010.270.050.570.07
(MT3) MT0.45F0.2S0.59.30.1328.80.050.270.040.630.01
Note: COV is coefficient of variation.
Disclaimer/Publisher’s Note: The statements, opinions and data contained in all publications are solely those of the individual author(s) and contributor(s) and not of MDPI and/or the editor(s). MDPI and/or the editor(s) disclaim responsibility for any injury to people or property resulting from any ideas, methods, instructions or products referred to in the content.

