Article

Rapid Damage Assessment and Bayesian-Based Debris Prediction for Building Clusters Against Earthquakes

1
School of Mechanics and Civil Engineering, China University of Mining and Technology, Xuzhou 221116, China
2
Key Laboratory of Building Structural Retrofitting & Underground Space Engineering, Ministry of Education, Shandong Jianzhu University, Jinan 250101, China
*
Author to whom correspondence should be addressed.
Buildings 2025, 15(9), 1481; https://doi.org/10.3390/buildings15091481
Submission received: 7 April 2025 / Revised: 23 April 2025 / Accepted: 25 April 2025 / Published: 27 April 2025

Abstract

In the whole service life of building clusters, they will encounter multiple hazards, including the disaster chain of earthquakes and building debris. The falling debris may block the post-earthquake roads and even severely affect the evacuation, emergency, and recovery operations. It is of great significance to develop a surrogate model for predicting seismic responses of building clusters as well as a prediction model of post-earthquake debris. This paper presents a general methodology for developing a surrogate model for rapid seismic responses calculation of building clusters and probabilistic prediction model of debris width. Firstly, the building cluster is divided into several types of representative buildings according to the building function. Secondly, the finite element (FE) method and discrete element (DE) method are, respectively, used to generate the data pool of structural floor responses and debris width. Finally, with the structural response data of maximum floor displacement, a surrogate model for rapidly calculating seismic responses of structures is developed based on the XGBoost algorithm, achieving R2 > 0.99 for floor displacements and R2 = 0.989 for maximum inter-story drift ratio (MIDR) predictions. In addition, an unbiased probabilistic prediction model for debris width of blockage is established with Bayesian updating rule, reducing the standard deviation of model error by 60% (from σ = 10.2 to σ = 4.1). The presented models are applied to evaluate the seismic damage of the campus building complex in China University of Mining and Technology, and then to estimate the range of post-earthquake falling debris. The results indicate that the surrogate model reduces computational time by over 90% compared to traditional nonlinear time-history analysis. The application in this paper is helpful for the development of disaster prevention and mitigation policies as well as the post-earthquake rescue and evacuation strategies for urban building complexes.

1. Introduction

There have been significant differences in the seismic resistance of structures in building clusters. It is a challenging task to rapidly compute the seismic response of regional building structures. In addition, the debris accumulation from the nonstructural components or adjacent collapsed buildings might block roads and even seriously affect post-earthquake emergency rescue operations [1,2]. As reported, there were about 13 million cubic yards of debris produced in the 2010 Haiti earthquake event, which vastly hindered emergency and recovery operations [3]. Thereby, it is necessary to develop a surrogate model for rapid calculation of seismic structural responses as well as a prediction model for post-earthquake debris width.
For building clusters against individual seismic events, a series of studies have been conducted on the seismic response calculation of buildings at the community or city level. The rapid estimation method for calculating the seismic responses of building clusters mainly includes the following: (1) FEMA-P58 [4] summarizes the seismic fragility database of common components such as beams, columns, and walls, which is beneficial for rapid assessment of the seismic fragility of structures. (2) The structure is simply simulated using a lumped mass model, and the mechanical behavior of a certain floor or several floors in buildings is simulated by a hysteresis model [5,6,7]. Then, the seismic response of structures can be quickly obtained by the nonlinear time-history analysis conducted on the simplified structural model. However, this method neglects the uncertainties related to the spatial characteristics and structural parameters of buildings.
Furthermore, artificial intelligence techniques are widely used in the rapid seismic response estimation of buildings under earthquakes [8,9,10,11]. Chen [10] employed the principal component analysis method to generate seismic factors, and 326 school buildings were obtained to investigate the relationship between seismic factors and the structural performance. Then, the artificial neural network (ANN) was used to develop a surrogate model for estimating the seismic responses of school buildings. Sergio Ruggieri et al. [11] presented an automated procedure for fragility calculations for masonry buildings at the urban scale, which is beneficial for rapidly obtaining the seismic responses of a large number of archetype models. Stojadinovic et al. [12] proposed a framework for rapid seismic loss assessment of building clusters based on a machine learning method. Similarly, Zhang et al. [13] and Zhou et al. [14] devoted attention to the surrogate model for rapid calculation of seismic responses of buildings.
Furthermore, the estimation of the debris width is an important reference for planning post-earthquake evacuation and rescue routes. To this purpose, both the American standard ASCE 7-22 [15] and the Chinese standard “Standard for urban planning on comprehensive disaster resistance and prevention (GB/T51327-2018)” [16] specify the threshold of the falling debris width as the maximum distance affected by falling debris between 1/2 and 2/3 of building height [16]. Similar research [17,18,19] has been devoted to developing the distribution law of debris after an earthquake. However, to the authors’ best knowledge, the theoretical formulas for calculating the debris width from collapsed buildings in the current literature are mainly deterministic versions. The deterministic prediction models fail to account for the influences of various damage levels of buildings subjected to earthquakes, and they describe the random distribution law of post-earthquake debris. Therefore, it is necessary to develop a probabilistic prediction model for the post-earthquake debris width.
This paper presents a framework to develop the surrogate model for rapid calculation of seismic responses of structures as well as the prediction model of post-earthquake debris width. Section 2 discusses the general concept of this presented framework. In Section 3, a surrogate model of rapid seismic response calculation is developed for the multi-story reinforced concrete (RC) frame structures. Section 4 presents a Bayesian-based prediction model of debris width for the RC frame structures based on the virtual data obtained by the physics engine technique on the Blender platform. Finally, the main conclusions are drawn in the last section.

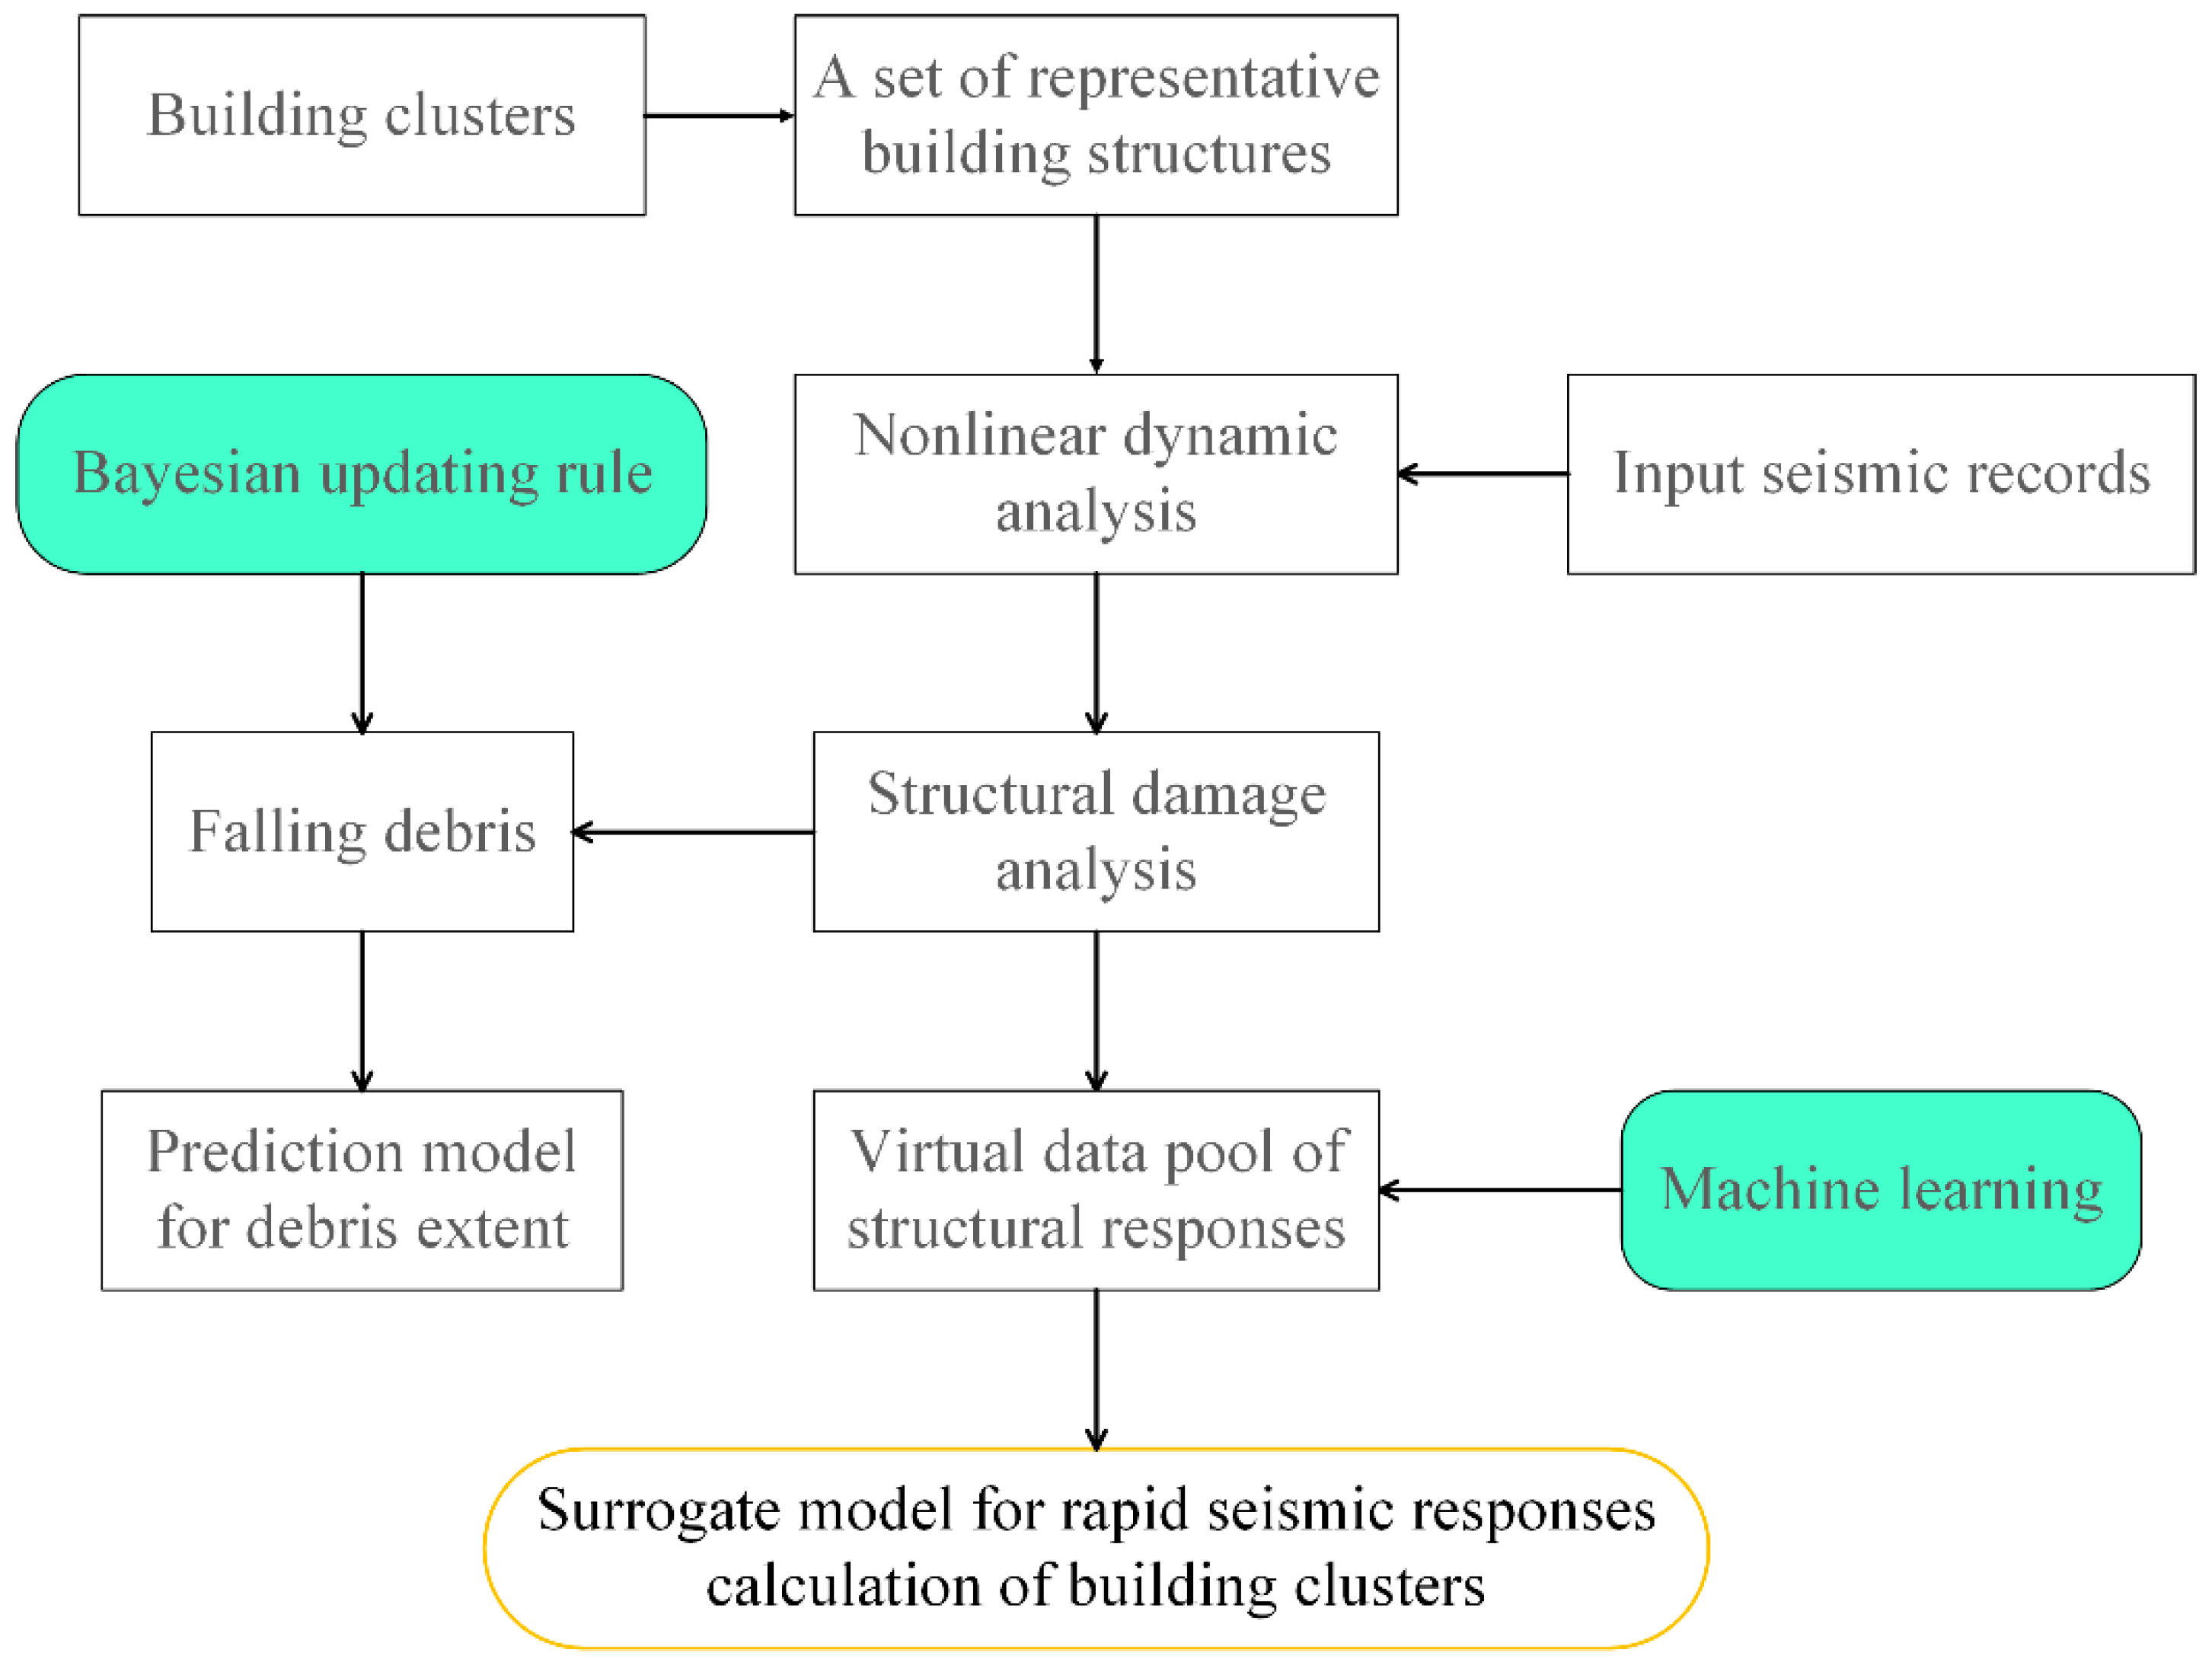
2. Framework for Developing the Surrogate Model for Rapid Seismic Responses Calculation of Building Clusters and Probabilistic Prediction Model of Debris Width

Urban building clusters comprise structures characterized by heterogeneous structural configurations, functional purposes, heights, and construction periods. Despite their inherent variability, these buildings possess shared attributes. Given that both FE analysis and DE analysis are computationally intensive, this study introduces a method for classifying the building cluster into representative structural typologies. Subsequently, the seismic-induced responses of building clusters are calculated by a surrogate model trained by the machine learning method according to the virtual data obtained from the finite element (FE) analysis of a representative building structures set.
The general concept of this presented methodology for developing a surrogate model for rapid seismic responses calculation of building clusters, as well as a Bayesian-based prediction model of post-earthquake debris width, are plotted in Figure 1.
As previously pointed out, the FE analysis is a time-consuming process. The trade-offs between computing speed, generalizability, and accuracy are balanced by the following:
(i)
Using the nonlinear time-history analysis (NTHA) on the refined FE models of buildings on OpenSees platform to generate high-quality training data.
(ii)
A surrogate model is trained with the XGBOOST algorithm based on the data obtained by the NTHA method.
(iii)
The trained surrogate model is used to rapidly calculate the seismic-induced structural responses of building clusters replacing the NTHA.
According to the debris distribution data and Bayesian updating rules, the probabilistic prediction model for post-earthquake debris width is expressed as follows [20,21,22,23]:
D ( x , Θ ) = d + γ ( x , θ ) + σ ε
where d is the deterministic predictive model for debris width that can be described by existing traditional models; γ(x, θ) is the linear correction term; θ is the coefficient vector in the correction term; σε is the model error following a normal distribution with a mean value of 0 and a standard deviation of σ; Θ = (θ, σ) represents the unknown model parameters. The error correction term can be rewritten as follows [24]:
γ ( x , θ ) = i = 1 n θ i h i ( x )
in which hi is the normalized variable or explanatory function that may affect the stochastic distribution of building debris. To capture potential biases in this probabilistic prediction model independent of the variable x, we set h1(x) = 1.0 [24]. According to the Bayesian updating rule [23], the posterior probability density function (PDF) of the unknown model parameters Θ is given by
f ( Θ ) = k L ( Θ ) f ( Θ )
where the normalization coefficient k = [∫L(Θ)f(Θ)dΘ]−1 is used to ensure the integration of posterior probability density function f’(Θ) equaling 1.0; L(Θ) is the likelihood function. To reflect the lack of prior information, the noninformative prior probability density function of the unknown parameter Θ can be expressed as follows [20]:
f ( Θ ) 1 σ
Upon determining f′(Θ), the Markov chain Monte Carlo (MCMC) simulation can be used to obtain the estimation of the unknown model parameters. The Metropolis–Hastings algorithm is commonly used to realize the MCMC sampling by the following steps [25]. Firstly, assume an arbitrary initial value Θ0 for the unknown parameters satisfying f′(Θ0|Data)>0. Secondly, the proposal distribution q(Θ′|Θ0) is used to generate a new candidate value Θ′ from the initial value Θ0. If Θ′ follows the proposal distribution, we accept this point as the new state Θ1 of the chain. Otherwise, Θ′ is rejected, then we set Θ1 = Θ0. Thirdly, we repeat the above process to obtain the chain for Θ.
Furthermore, the uncertainty associated with unknown model parameters Θ can be represented by their probability density functions developed by the Bayesian updating rule. Then, uncertainties in unknown parameters can be quantified by integrating over the domain of unknown parameters based on full probability theory.

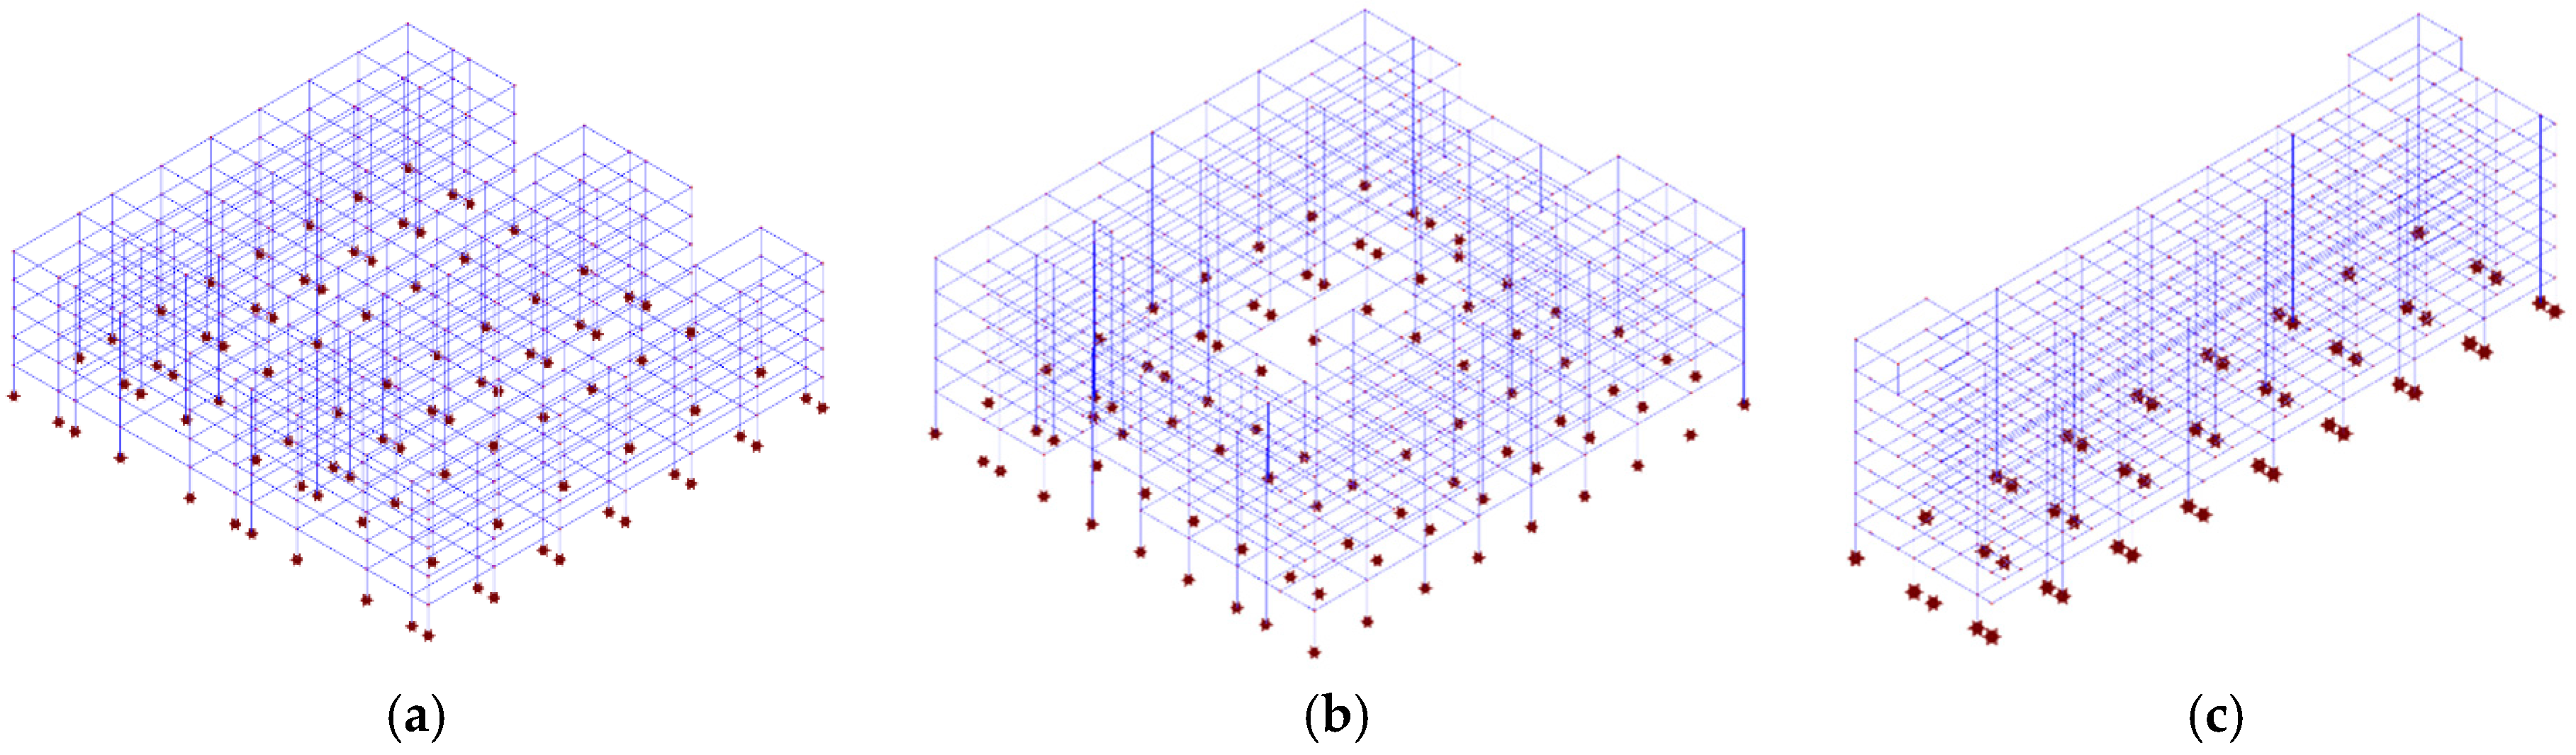
3. The Surrogate Model and Debris Width Prediction Model for Multi-Story RC Frame Structures

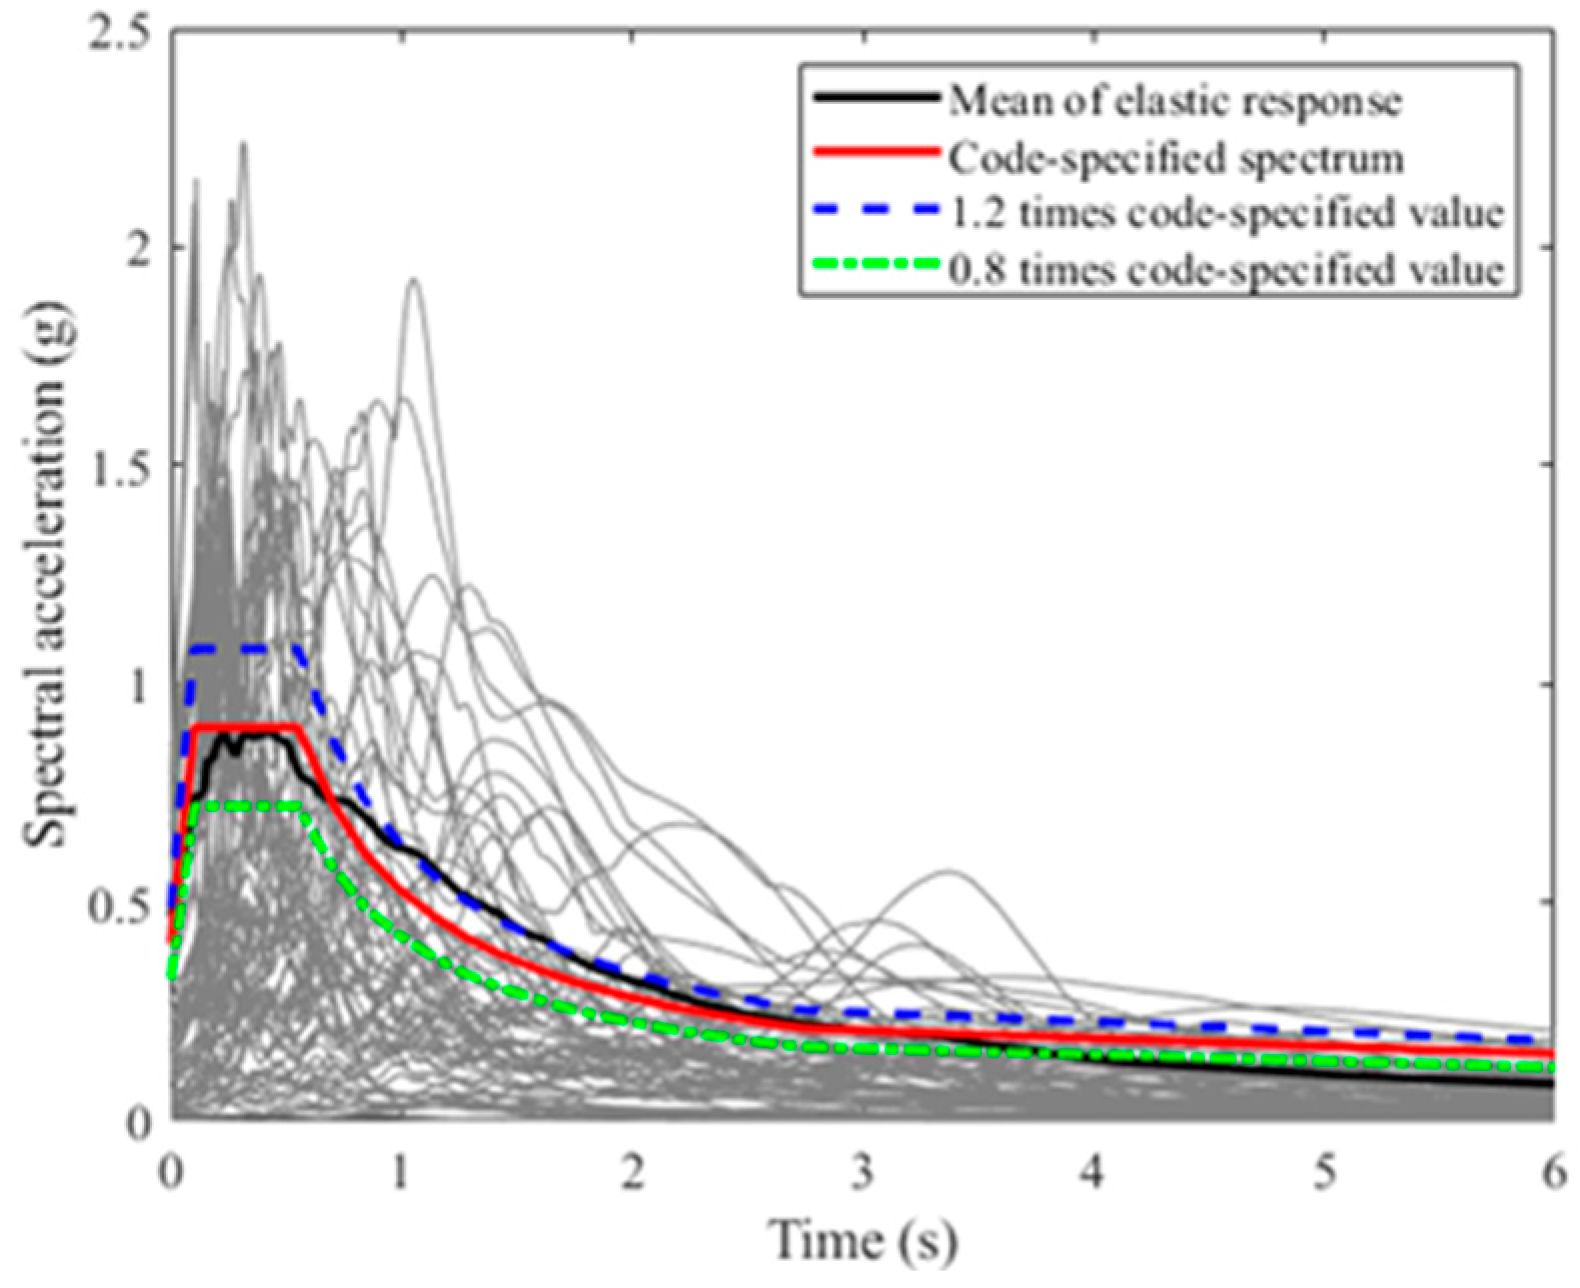
3.1. Input Seismic Ground Motion Records

To conduct the nonlinear dynamic analysis, 100 seismic records were downloaded from the PEER-NGA database (http://peer.berkeley.edu/nga/) [26]. Additionally, four seismic motion records from the Wenchuan earthquake catalogue were obtained from China Strong Motion Center. Totally, there are 104 seismic records used for finite element analysis.
The comparison between the elastic response spectrum of these seismic records and the code-prescribed spectra are plotted in Figure 2. It can be observed that the average of elastic response spectrum lies within 0.8 to 1.2 times the code-prescribed value, meaning that these selected seismic records satisfy the requirements of the Chinese seismic code [26].

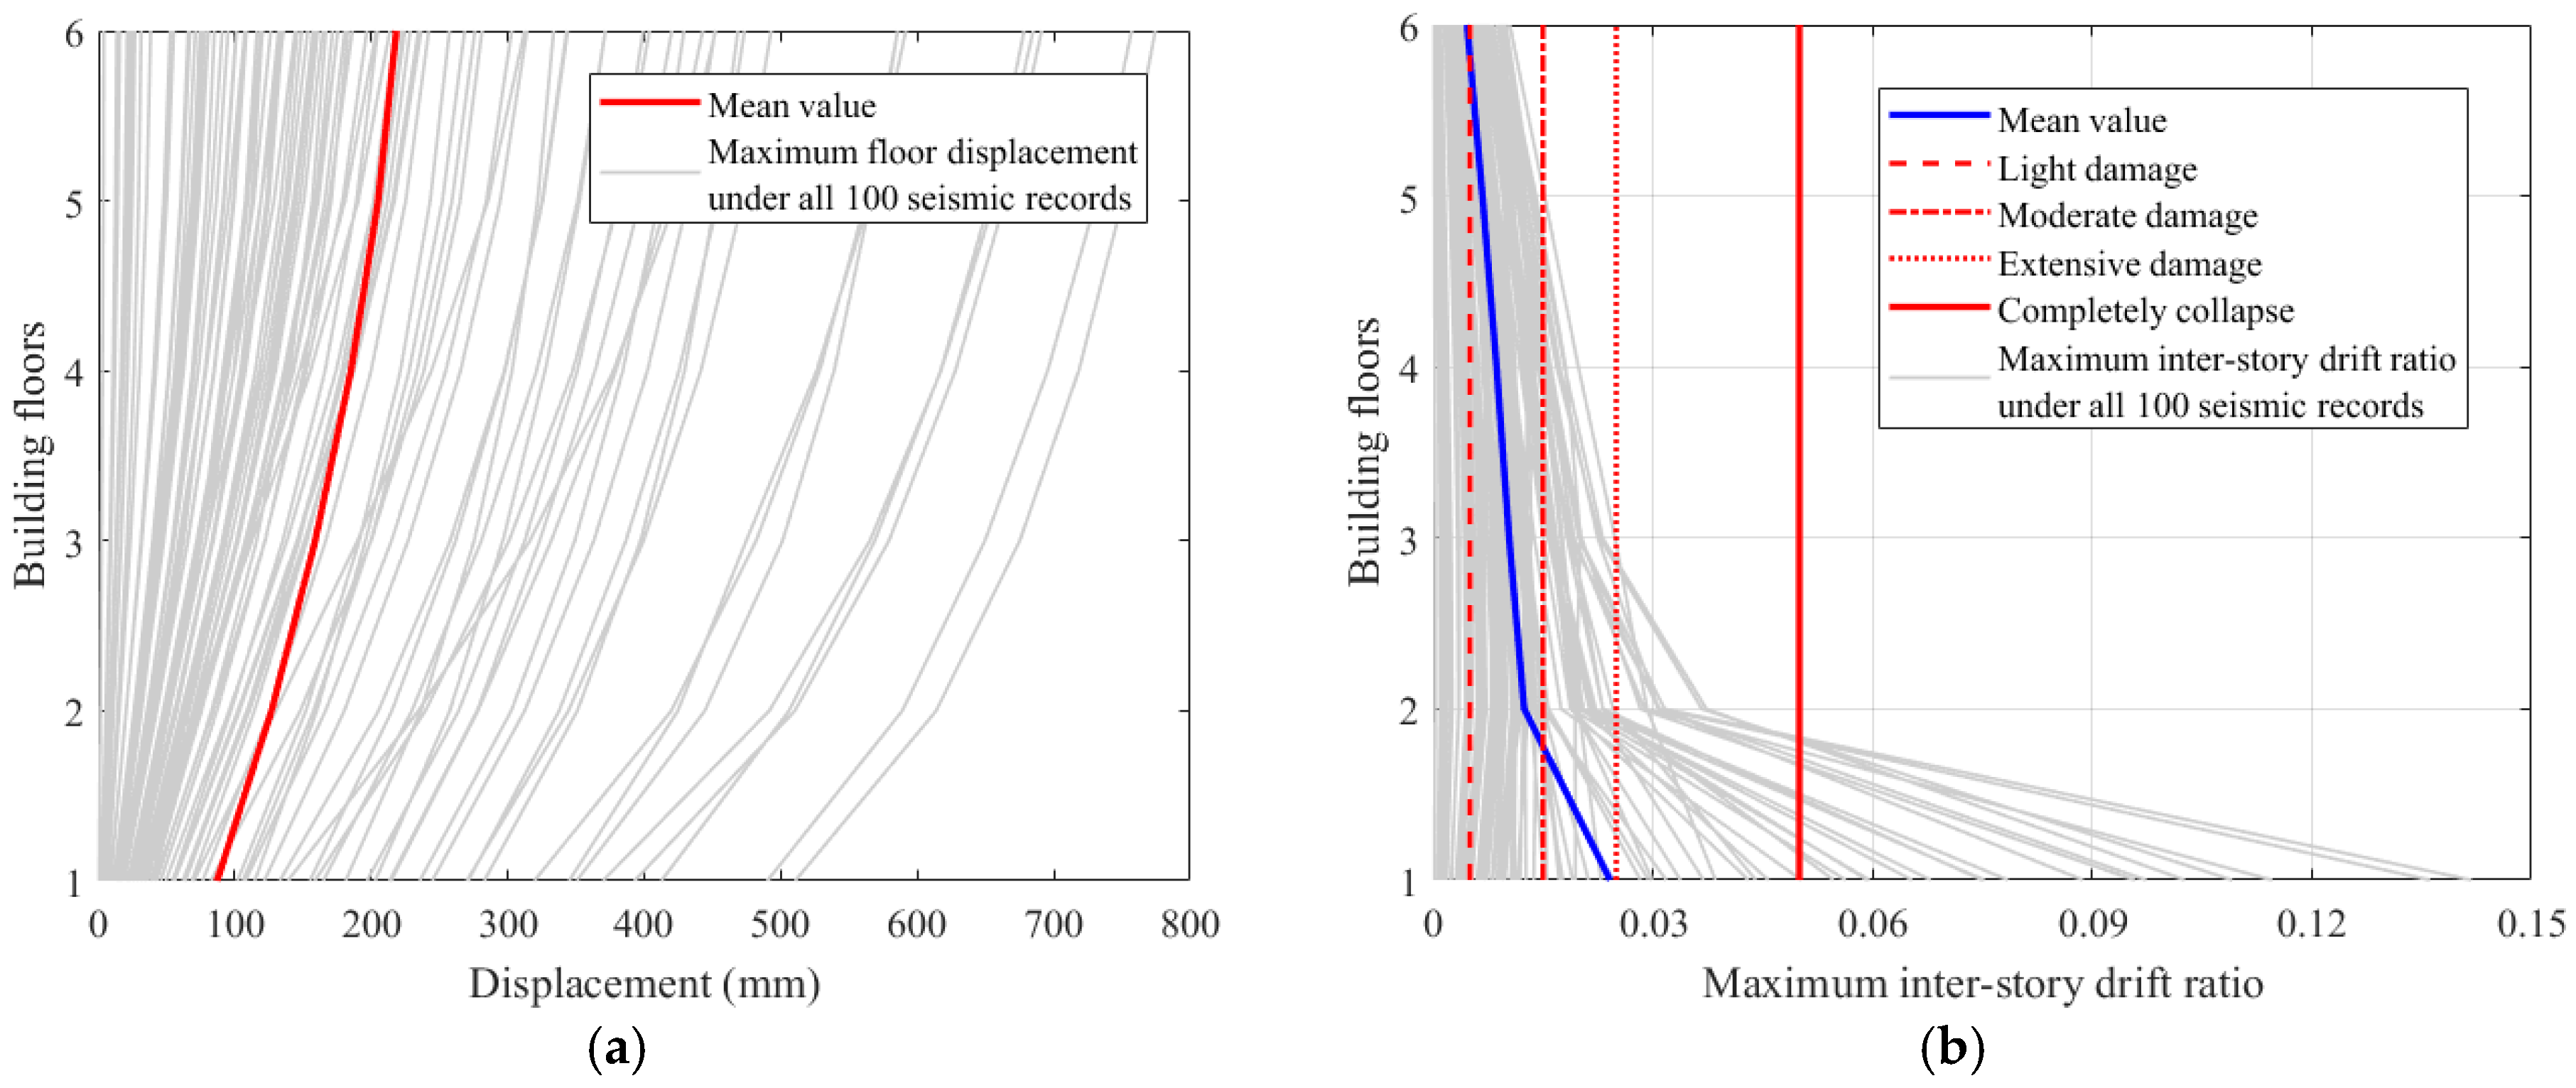
3.2. Machine-Learning-Based Surrogate Model

Referring to the “Code for Seismic Design of Buildings” (GB 50011-2010) [26], three multi-story RC frame structures were designed on the ETABS platform. The profile of these three representative buildings is shown in Table 1.
The OpenSees platform is used to construct the FE model of multi-story RC frame structures. The Concrete01 and Steel02 model are used to describe the mechanical behavior of concrete and steels, respectively. Both the beam and column members are simulated by the “dispBeamColumn” element. The FE models of these three representative building structures used, respectively, as teaching building, office building, and dormitory building, are illustrated in Figure 3.
In order to verify the modeling accuracy on OpenSees, the teaching building is taken as an example to compare the natural vibration period obtained by ETABS and OpenSees platforms, as listed in Table 2. In this table, Te represents the natural vibration period of the structure calculated by ETABS; conversely, To denotes the results determined by OpenSees.
It can be seen in Table 2 that the FE analysis of RC frame structure on OpenSees platform has high accuracy and can be used to establish the virtual data pool for training the surrogate model. In order to consider the uncertainty from various sources, the mechanical properties of concrete and steel materials, as well as the damping ratios, are regarded as random variables. The statistical characteristics and probability distributions of these random variables are summarized in Table 3.
The dynamic nonlinear analysis of structures under earthquakes is a time-consuming process. To balance the computational efficiency and accuracy, 30 FE models of structures were generated by the LHS method. Considering both the teaching building and office building having 5 floors, only 10 FE models were generated for the teaching building. Finally, a total of 70 FE models of RC frame structures were used for dynamic analysis, that is, 7280 (= 70 × 104) nonlinear time-history analyses were performed on the OpenSees platform. When the uncertain variables are taken as an average value, the maximum inter-story drift angle and the maximum lateral displacement of each floor of these three representative building structures under earthquake are shown in Figure 4.
Herein, the maximum inter-story drift ratio (MIDR) is applied to define the damage state of the RC frame structure, in which slight damage: MIDR > 0.5%; moderate damage: MIDR > 1.5%; serious damage: MIDR > 2.5%; and complete collapse: MIDR > 5.0% [30]. Figure 4 indicates that the representative building structures will experience serious damage or even collapse when subjected to earthquakes. In addition, the uncertainty of random variables has a significant impact on the seismic structural responses.
The input features used for training the surrogate model for rapidly calculating the seismic-induced structural responses mainly include building information, uncertainty variables, and intensity measurement of input ground motions, as shown in Table 4. The eigenvalues of the output layer are the maximum lateral floor displacements and the maximum inter-story drift ratio. In training the surrogate model, 70% of the total sample was selected as the training set, 20% of the sample is the testing set, and the remaining 10% of data is the verification set. We consider the advantages of the XGBoost algorithm in solving the following problems: (i) Handling high-dimensional data by gradient boosting and regularization, (ii) high computational efficiency for large datasets, and (iii) high accuracy in regression tasks. The XGBoost algorithm is used to train this surrogate model, in which the optimal network parameters are determined by the Newton–Raphson optimization algorithm and Trap Avoidance Operator (TAO) [31].
In this paper, the accuracy of the surrogate model is evaluated by parameters of mean absolute error (MAE), mean square error (MSE), root mean square error (RMSE), mean absolute percentage error (MAPE), and coefficient of determination (R2), as summarized in Table 5. It can be observed that the surrogate model for predicting the maximum floor drift and the maximum inter-story drift ratio responses under seismic loads has high accuracy.
Taking the MIDR of each floor in representative buildings, the regression results of the surrogate models are plotted in Figure 5. It can be found that there is high goodness of fit of this surrogate model with a correlation coefficient larger than 99%, which can be applied to replace the FE analysis. However, the surrogate model presented in this current study cannot generate the real-time structural responses, which is the main limitation of this paper.
To further show the superiority of the XGBoost algorithm, the comparison between the predicted and target MIDR is illustrated in Figure 6.
Figure 6 indicates that most of the predicted values are similar to the target values. Thus, this trained surrogate model will be used for the following seismic damage assessment of building clusters.

3.3. Bayesian-Based Prediction Model of Debris Width

In this subsection, a multi-story RC frame structure is used as a case to generate the virtual debris data by Bullet Constraints Builder (BCB) for Blender to develop the Bayesian-based prediction model for the debris width. This office building has a span of 6 m, with a first-floor height of 4.2 m and other-floor height of 3.5 m, as shown in Figure 7.
The reinforcement condition of beams is characterized as the longitudinal reinforcements with a diameter of 22 mm and stirrup bars of 8 mm diameter spaced at 150 mm intervals. The columns incorporate longitudinal reinforcements of 25 mm diameter and stirrup bars of 8 mm diameter spaced at 100 mm intervals. In addition, the HRB400 steel is used for all rebars and the concrete cover is 30 mm of beams and columns. The reinforcement details of the beams and columns are illustrated in Figure 7a. The floor slabs are designed with bidirectional reinforcement, with 8 mm diameter steel bars spaced 180 mm apart, made of HRB335 steel. The concrete grade for slabs is C30, with concrete cover of 30 mm. The layout of openings in the first floor and the building’s discrete element model are shown in Figure 7b. In modeling this building by the BCB, the representative value of gravity load on all floors roof is 750 kg/m2.
The BCB physics engine is applied to simulate the dynamic response of this six-story RC frame structure under 104 seismic motions bidirectional loading at a ratio of 1:0.85, respectively, for the X-axis and the Y-axis. Then, 104 post-earthquake building debris distribution maps are obtained, as shown in Figure 8.
In Figure 8, the maximum vertical distance from the building footprint to the edge of debris width is defined as the maximum debris width; the area of the region enclosed by the debris envelope is denoted as Ab,direction, in which the subscript direction refers to the orientation of the debris around the building, namely, up, down, left, and right. In addition, the side length of one small square in Figure 8 is 1 m. The average distance is computed by the ratio of Ab to the side length of the building footprint in the corresponding direction. The statistical characteristics of the debris width are shown in Figure 9.
It can be observed that there is a significant variability in debris width for different directions. The coefficient of variation (COV) of debris width ranges from 10% to 45%. Generally speaking, the post-earthquake debris width shows prominent random characteristics. Considering the characteristics of the traditional model, a model proposed by He et al. [32] is selected as the deterministic term in the prediction model. For the prediction model of maximum debris width, Equation (1) can be further rewritten as
D ( x , Θ ) = 0.58 H 1.06 PGA 0.5 + PGA θ 1 + θ 2 A b + σ ε
The normalized area of debris width and PGA are the random variables involved in the error correction term. The area of debris width is normalized by the area of the building plane. Herein, only the maximum distance of debris width in the left direction is presented as an example, and the posterior statistics of unknown model parameters are summarized in Table 6.
The values presented in the third column of Table 6 indicate that the model parameters exhibit significant dispersion. In other words, if the model parameters are taken as deterministic values, it will inevitably introduce considerable uncertainty into subsequent analyses. Therefore, it is necessary to develop a probability distribution of the unknown model parameters.
To further illustrate the advantage of the Bayesian-based method in reducing the impact of uncertainty, the prior and posterior probability density functions (PDFs) of the model error are illustrated in Figure 10. It can be found that the posterior PDF is more concentrated compared to the prior one, meaning that the Bayesian-based prediction model holds smaller dispersion.
The Bayesian-based prediction model of the maximum debris width in the left direction is shown in Figure 11.

4. Seismic Damage Assessment for Building Clusters

In this section, the 2008 Wenchuan earthquake with PGA = 203.450 cm/s2 and Δt = 0.002 is assumed to occur in Xuzhou City, Jiangsu Province. The reinforced concrete building clusters on the campus of China University of Mining and Technology are used as a case study to demonstrate the superiority of the proposed framework in rapidly assessing structural damage and predicting post-earthquake debris distribution patterns.
The trained surrogate model is applied to assess the structural damage of the RC buildings in the campus of China University of Mining and Technology, as shown in Figure 12. In this figure, the colors of blue, green, orange, and red, respectively, denote the light damage, moderate damage, severe damage, and complete collapse.
Then, the Bayesian-based prediction model is used to evaluate the post-earthquake debris width distributed in the university campus, as shown in Figure 13.
Combining the results presented in Figure 12 and Figure 13, it can be found that under the action of the Wenchuan earthquake, the dormitory building complex (the red area in the figures) will be severely damaged. Furthermore, the falling debris will block 45% of the adjacent roads (shown in Figure 13), meaning that it may be difficult to carry out post-earthquake rescue and evacuation operations. This application highlights the method’s effectiveness in real-world scenarios by quantifying damage states and debris blockage risks.

5. Conclusions

This study presents a novel framework integrating a machine-learning-based surrogate model and a Bayesian probabilistic approach to rapidly assess seismic responses of building clusters and predict post-earthquake debris width. The surrogate model, trained by the XGBoost algorithm based on finite element (FE) simulation data, enables efficient seismic response calculations for multi-story reinforced concrete frame structures. The Bayesian-based prediction model, incorporating uncertainty quantification and virtual debris data generated via physics engines, provides probabilistic estimates of debris width. The main conclusions are as follows:
(1)
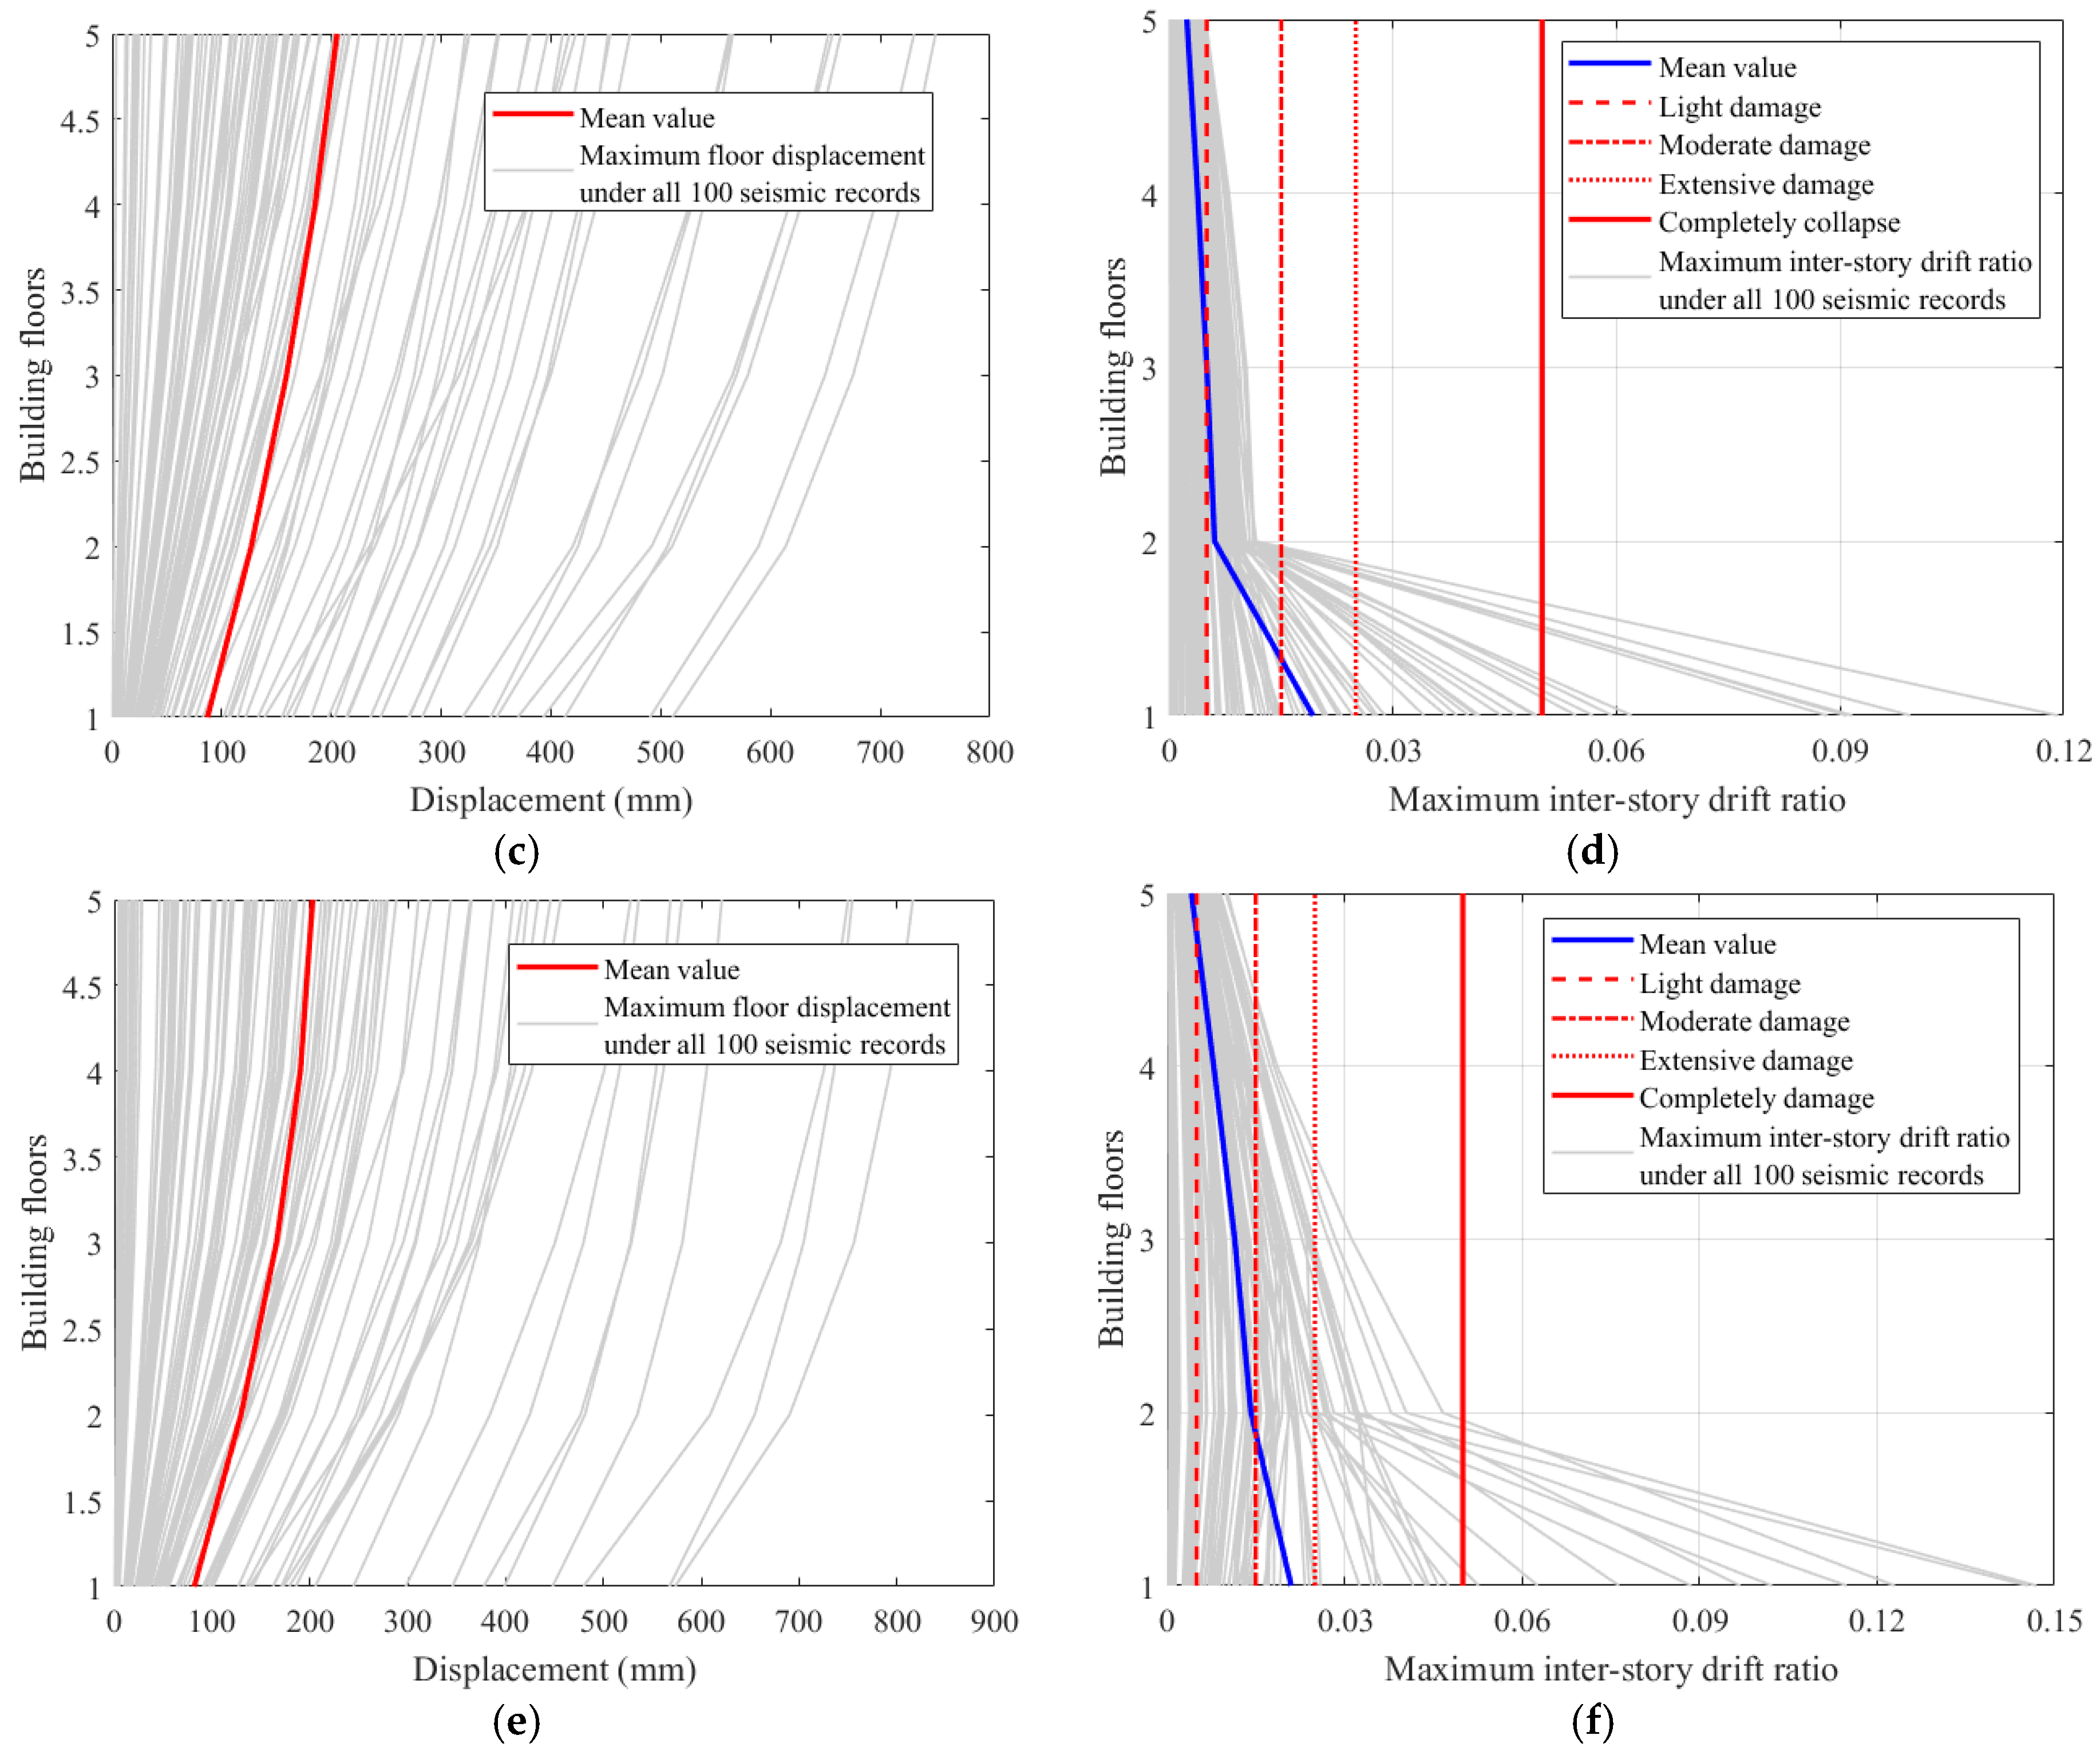
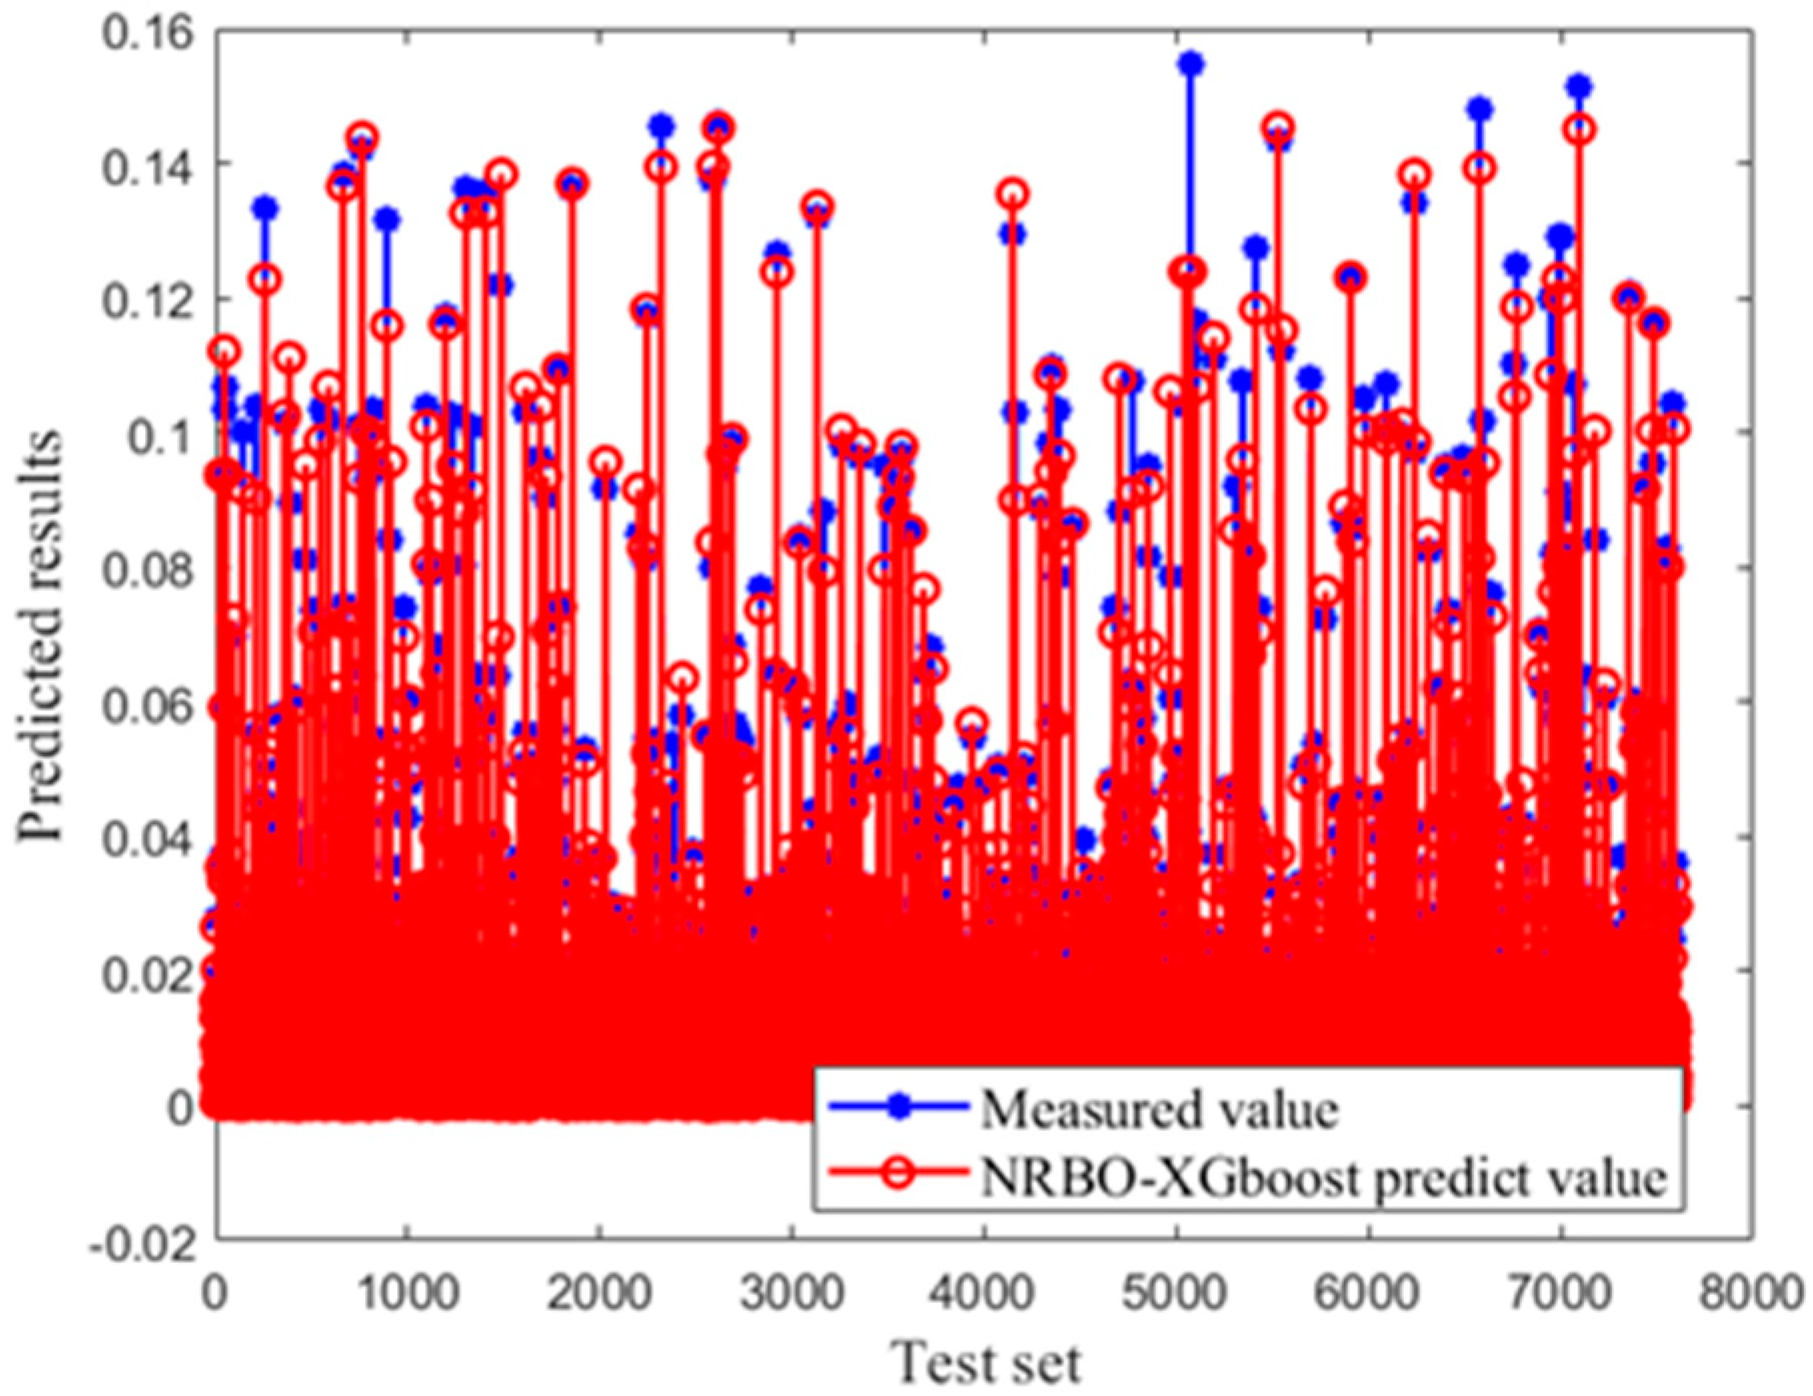
The XGBoost-based surrogate model achieves exceptional accuracy in predicting structural responses (e.g., R2 > 0.99 for floor displacement and R2 = 0.989 for maximum inter-story drift ratio), reducing computational time by over 90% compared to traditional nonlinear time-history analyses. This surrogate model enables rapid damage assessment for large-scale building clusters, which is critical for real-time emergency decision making.
(2)
The Bayesian-updated model significantly reduces uncertainty in debris width prediction, narrowing the standard deviation of model error by 60%, from prior σ = 10.2 to posterior σ = 4.1. This probabilistic approach outperforms deterministic methods, providing 95% confidence intervals for debris blockage distances, which is essential for evacuation route planning.
(3)
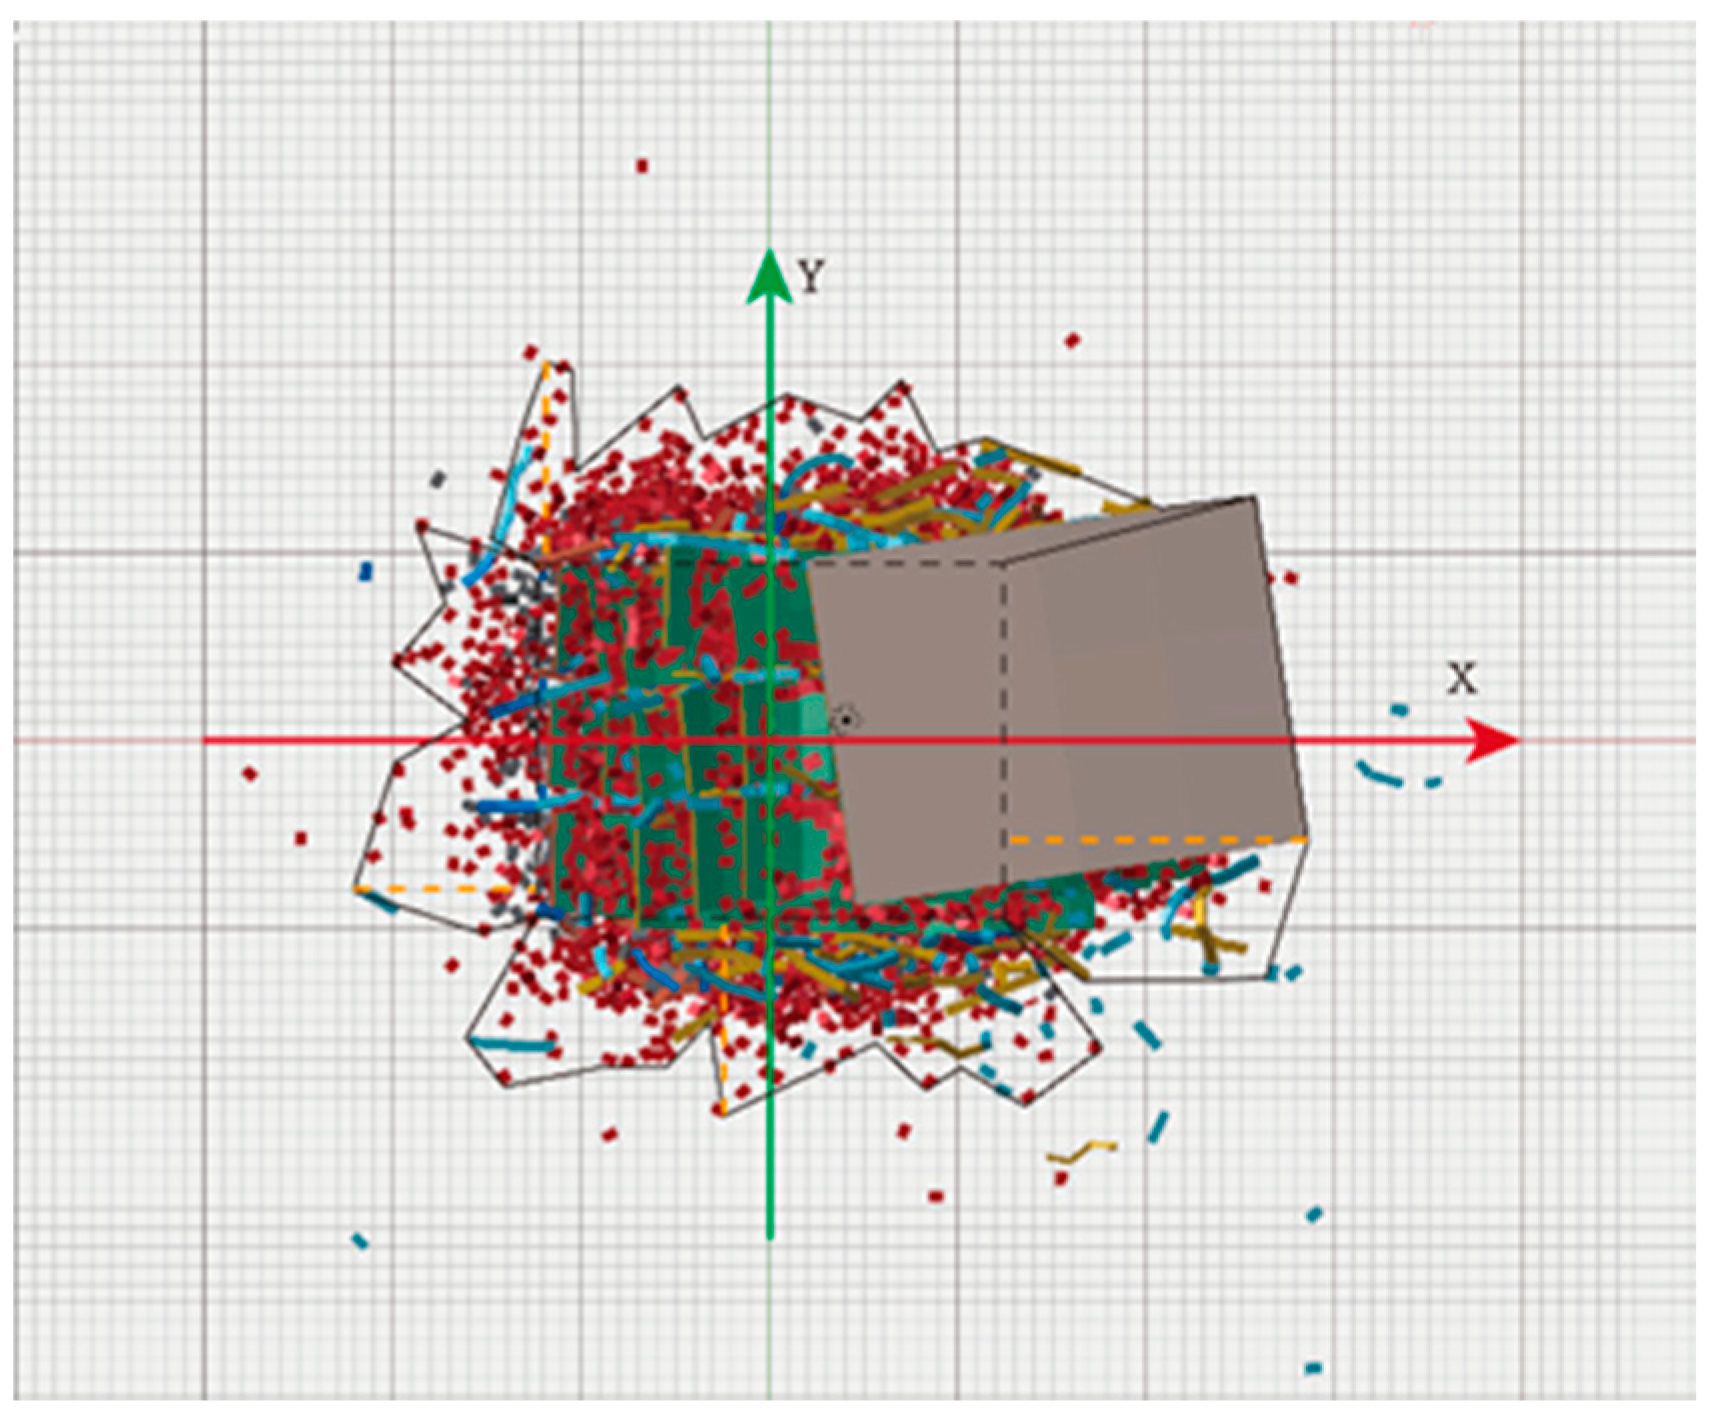
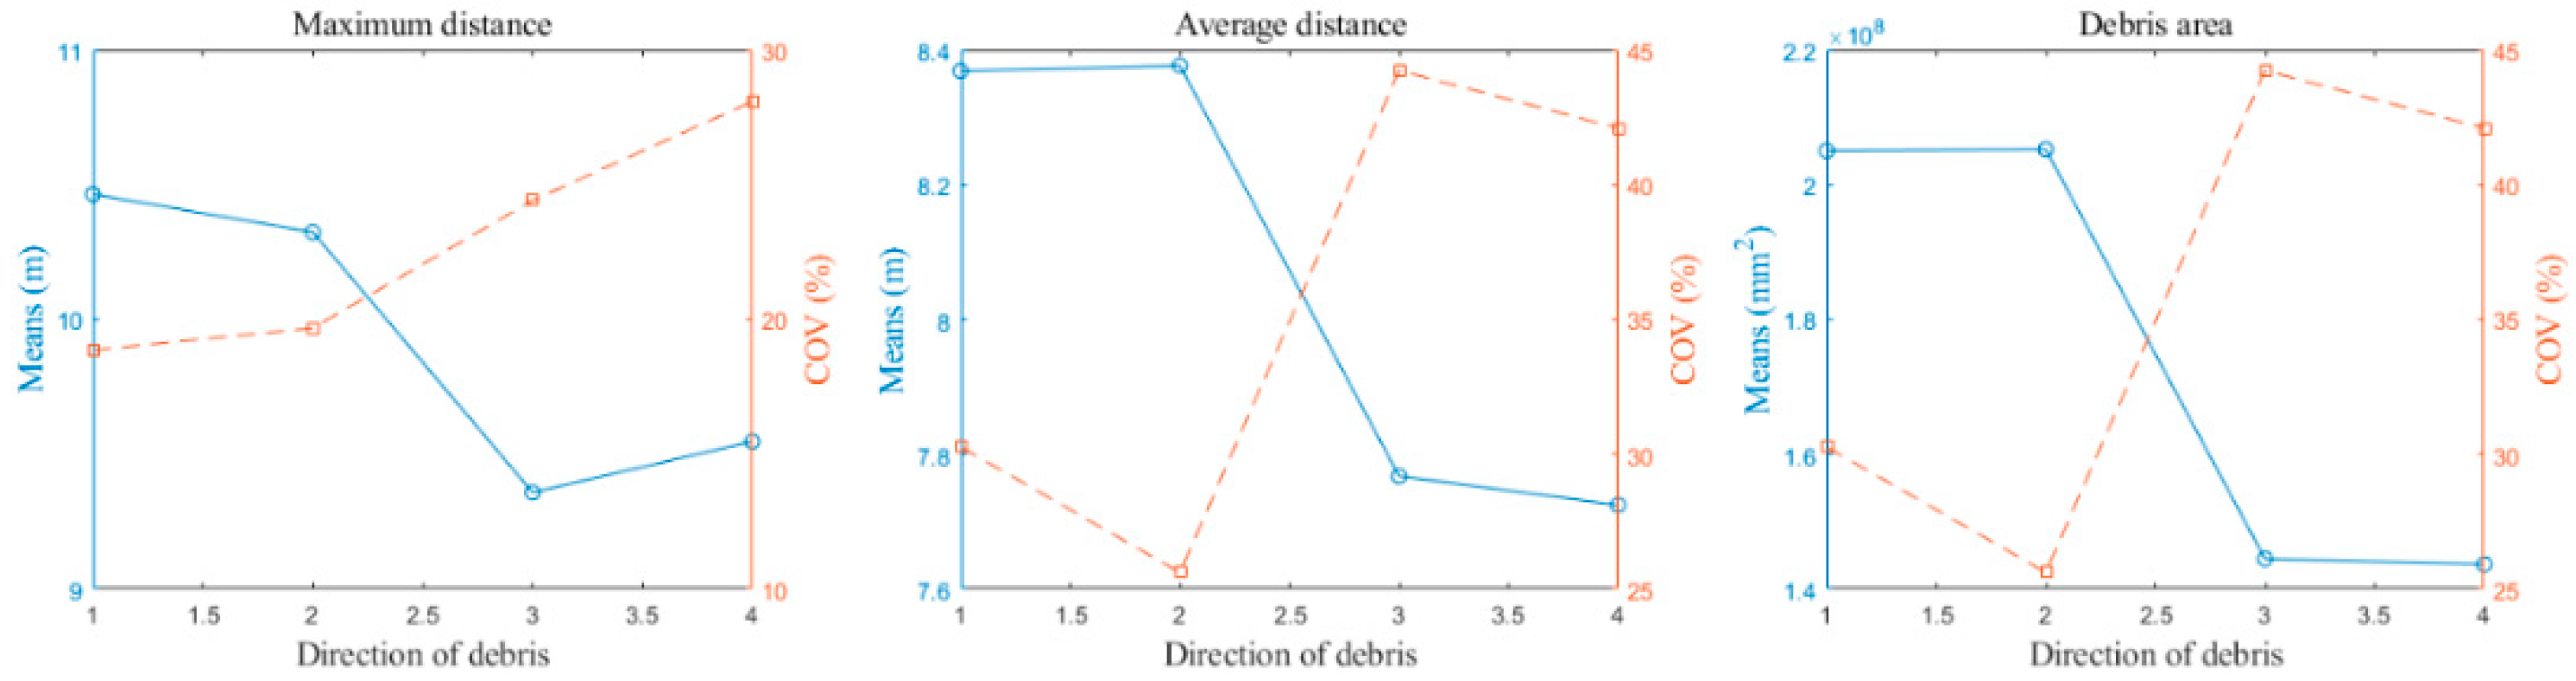
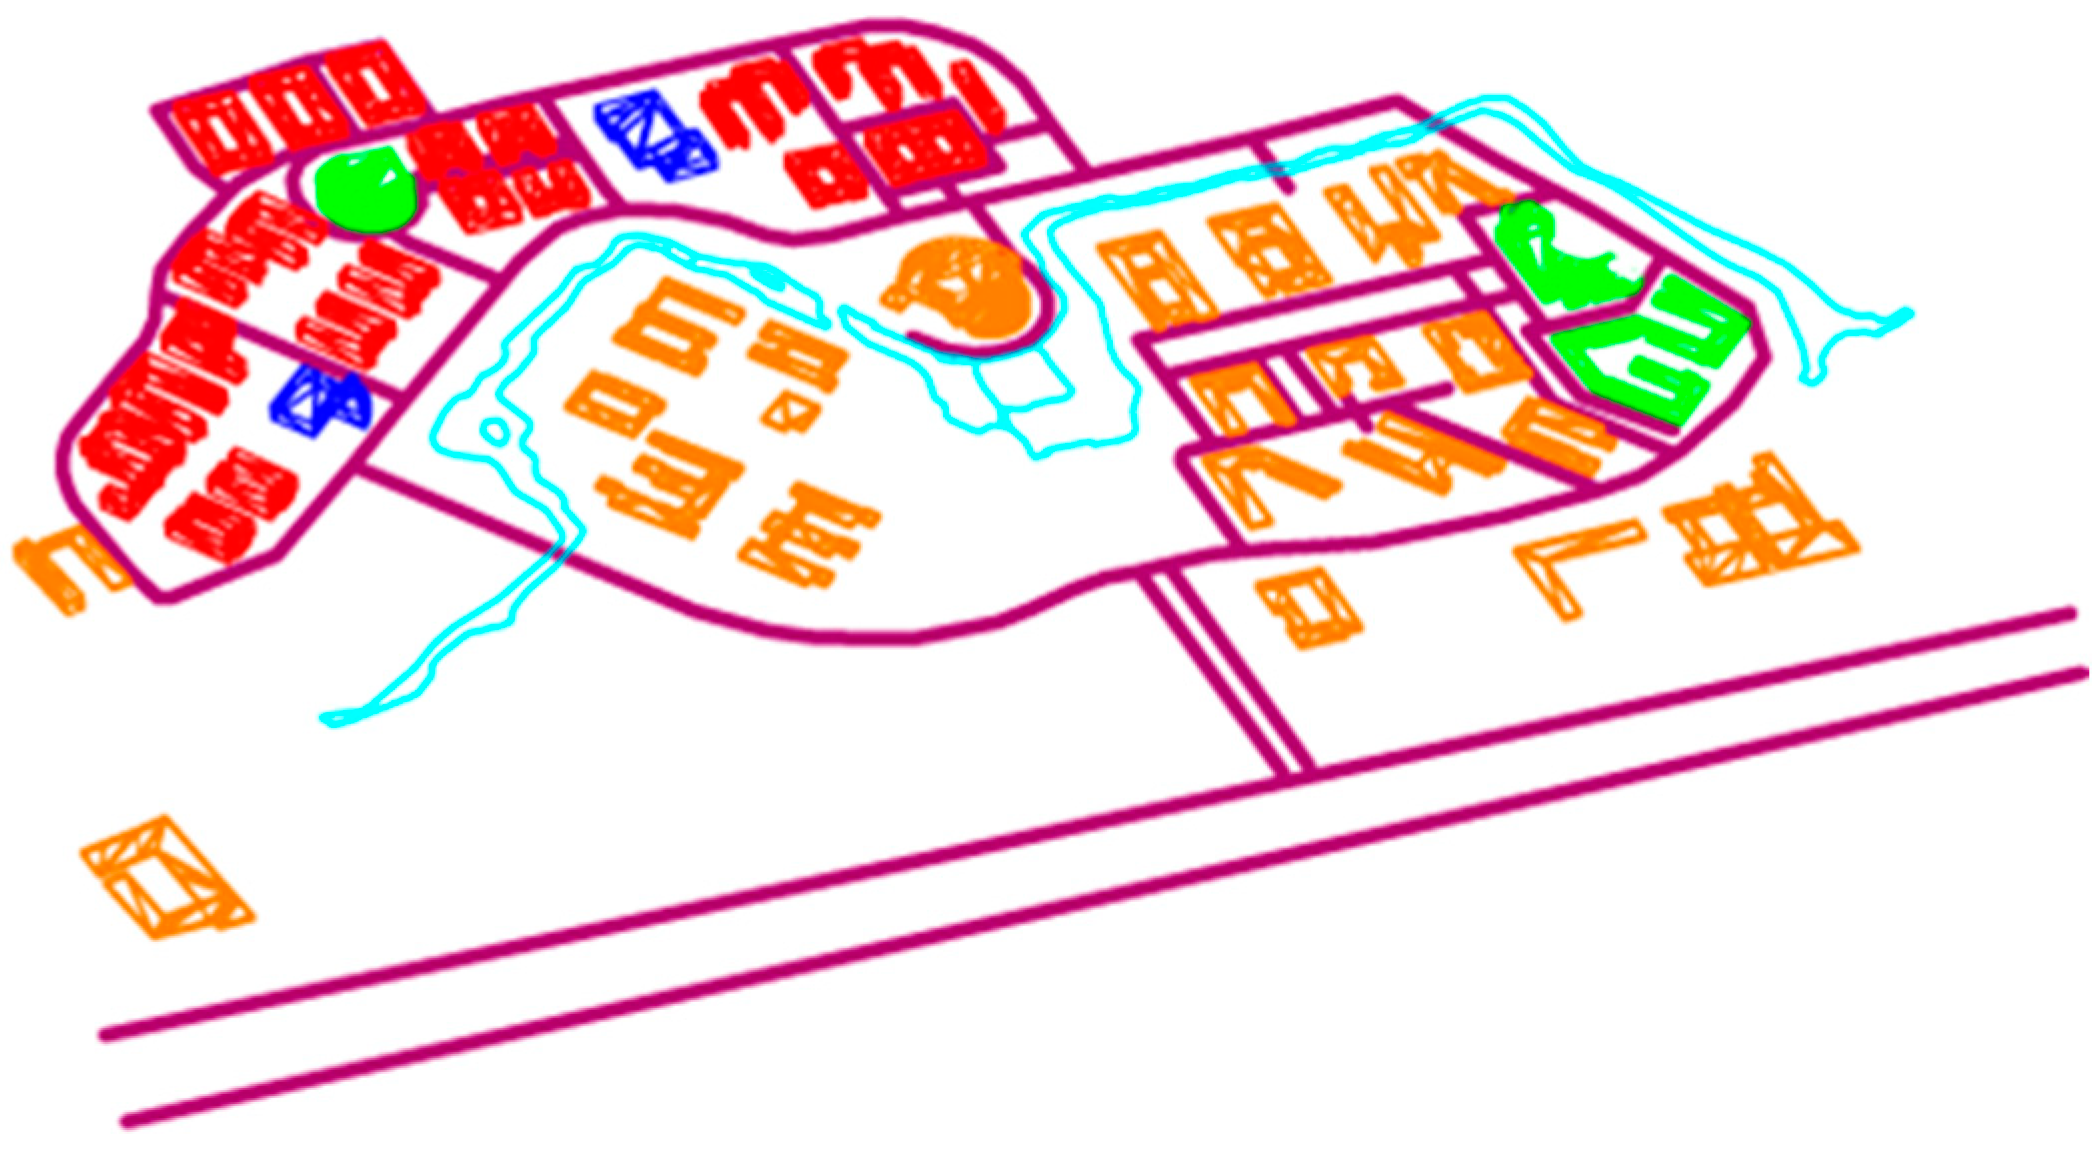
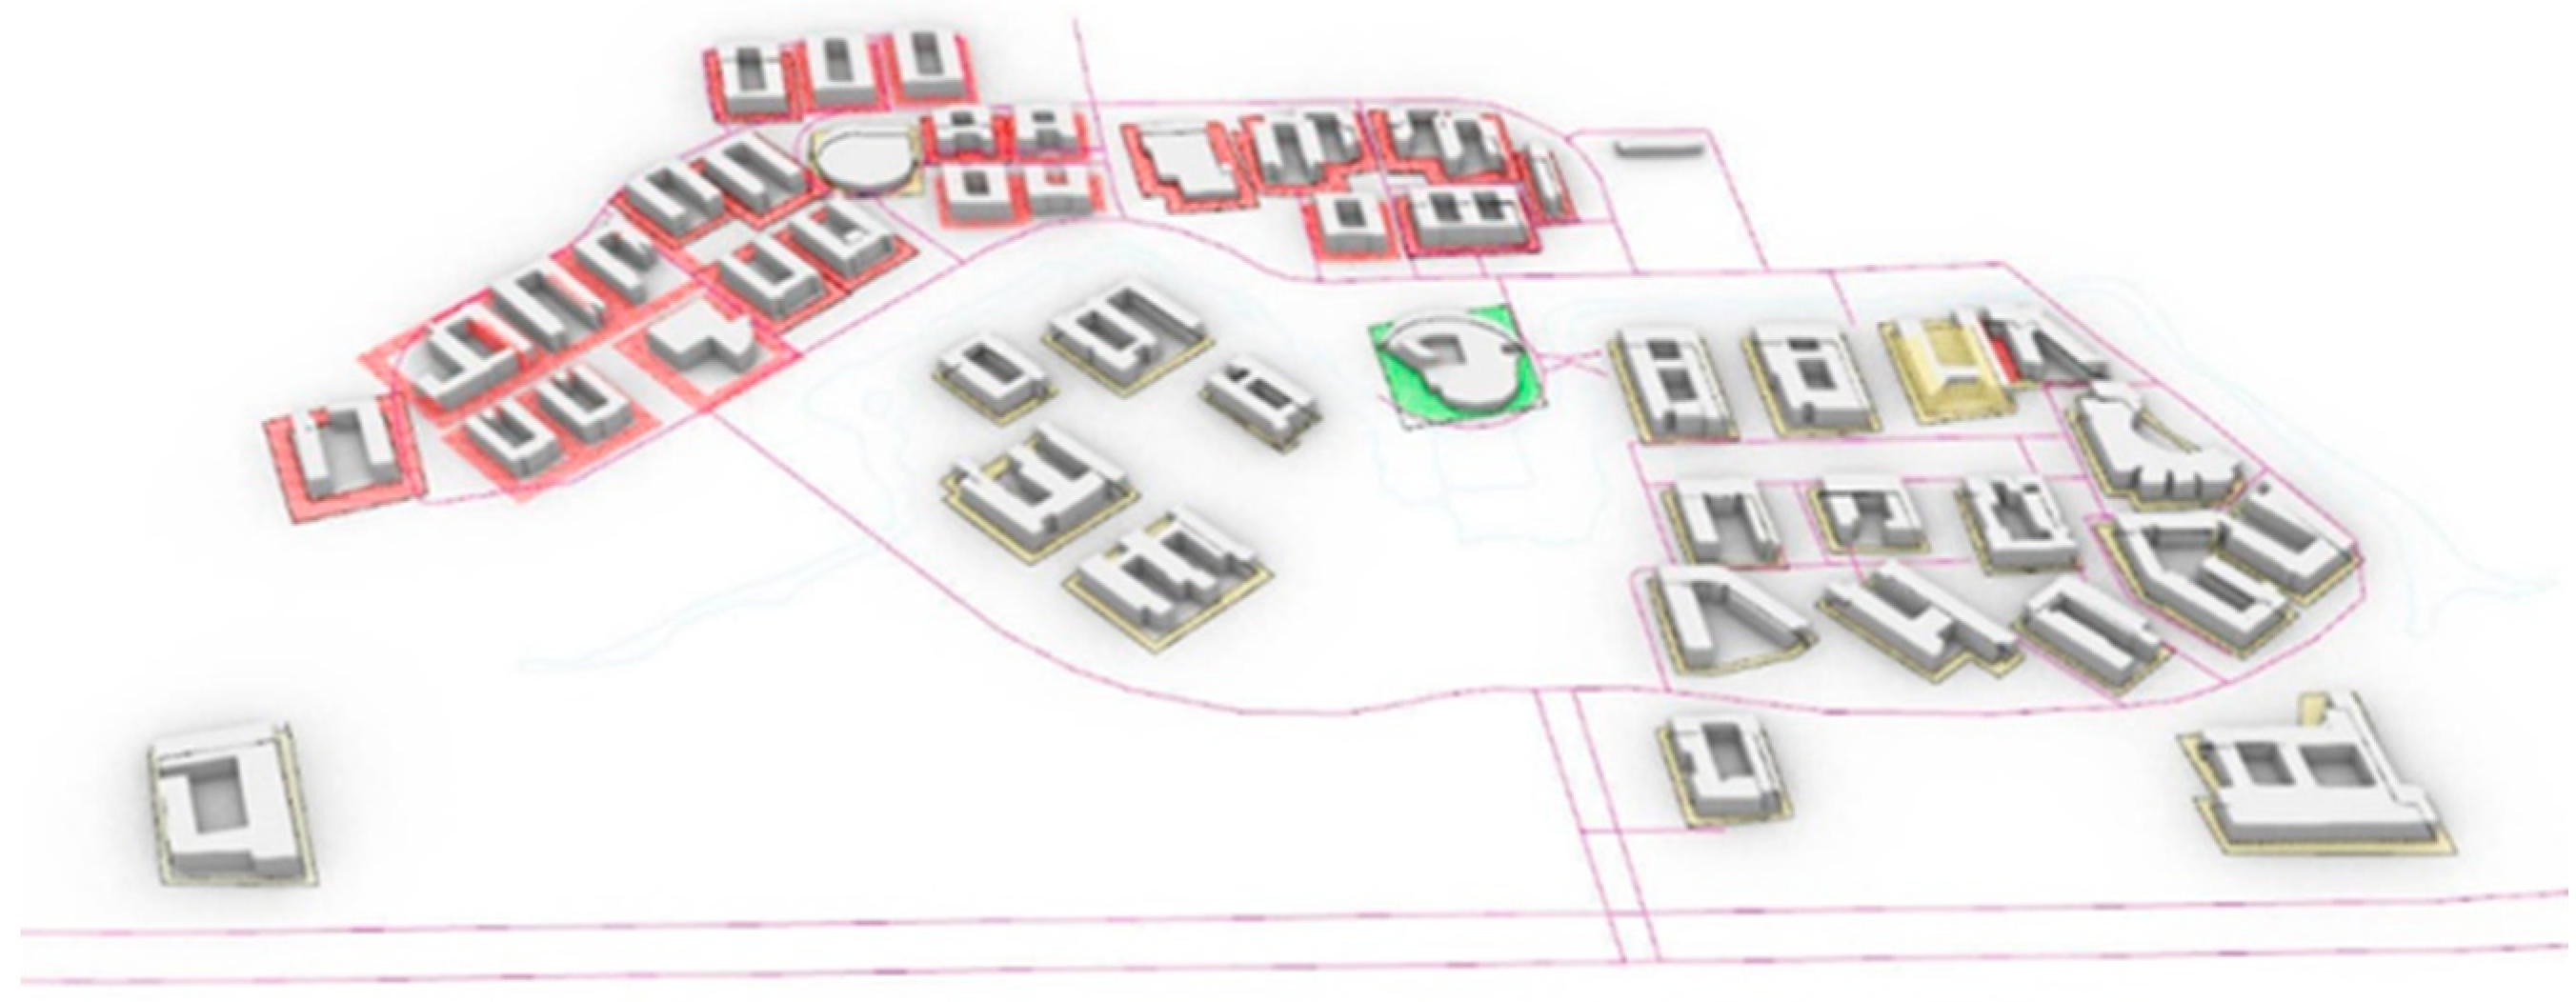
Application to a campus building cluster under the Wenchuan earthquake event with PGA = 203.45 cm/s2 reveals severe damage (MIDR > 2.5%) in 35% of dormitory buildings, with debris blocking 45% of adjacent roads. These results highlight the utility of this presented framework in identifying high-risk zones and optimizing post-disaster rescue strategies.
In future research, we will expand the virtual data for buildings with various characteristics to enlarge the virtual data pool, and the LSTM or Transformer algorithms will be applied to update the trained surrogate model that can obtain the real-time responses of structures. In addition, the experimental results and satellite image data of collapsed buildings will be used to enhance the realism and suitability of debris prediction models in various urban settings.

Author Contributions

Conceptualization, methodology, resources, analysis, and writing: X.Z.; data curation: Y.H., J.C., and S.X.; constructive comments: W.W. All authors have read and agreed to the published version of the manuscript.

Funding

The authors sincerely appreciate the financial support of the National Natural Science Foundation of China (no. 52208511).

Data Availability Statement

Some or all data, models, or codes that support the findings of this study are available from the corresponding author upon reasonable request.

Conflicts of Interest

The authors declare that there are no conflicts of interest.

References

  1. Feng, K.; Li, Q.; Ellingwood, B.R. Post-earthquake modelling of transportation networks using an agent-based model. Struct. Infrastruct. Eng. 2020, 16, 1578–1592. [Google Scholar] [CrossRef]
  2. Byun, J.-E.; D’Ayala, D. Urban seismic resilience mapping: A transportation network in Istanbul, Turkey. Sci. Rep. 2022, 12, 8188. [Google Scholar] [CrossRef] [PubMed]
  3. Sediek Omar, A.; El-Tawil, S.; McCormick, J. Seismic Debris Field for Collapsed RC Moment Resisting Frame Buildings. J. Struct. Eng. 2021, 147, 04021045. [Google Scholar] [CrossRef]
  4. FEMA-P-58; Seismic Performance Assessment of Buildings, Methodology and Implementation. Federal Emergency Management Agency (FEMA): Washington, DC, USA, 2018.
  5. Zhang, B.; Xiong, F.; Lu, Y.; Ge, Q.; Liu, Y.; Mei, Z.; Ran, M. Regional seismic damage analysis considering soil–structure cluster interaction using lumped parameter models: A case study of Sichuan University Wangjiang Campus buildings. Bull. Earthq. Eng. 2021, 19, 4289–4310. [Google Scholar] [CrossRef]
  6. Xu, Z.; Wu, Y.; Lu, X.Z.; Jin, X.L. Photo-realistic visualization of seismic dynamic responses of urban building clusters based on oblique aerial photography. Adv. Eng. Inform. 2020, 43, 101025. [Google Scholar] [CrossRef]
  7. Hayashi, K.; Saito, T.; Horioka, T.; Sato, E. Implementation of real-time seismic diagnostic system on emergency management center buildings: System introduction and operational status on municipal government office buildings. J. Civ. Struct. Health Monit. 2019, 9, 529–541. [Google Scholar] [CrossRef]
  8. Morfidis, K.; Stefanidou, S.; Markogiannaki, O. A Rapid Seismic Damage Assessment (RASDA) Tool for RC Buildings Based on an Artificial Intelligence Algorithm. Appl. Sci. 2023, 13, 5100. [Google Scholar] [CrossRef]
  9. Kalakonas, P.; Silva, V. Seismic vulnerability modelling of building portfolios using artificial neural networks. Earthq. Eng. Struct. Dyn. 2022, 51, 310–327. [Google Scholar] [CrossRef]
  10. Chen, C.S. Seismic performance assessments of school buildings in Taiwan using artificial intelligence theories. Eng. Comput. 2020, 37, 3321–3343. [Google Scholar] [CrossRef]
  11. Ruggieri, S.; Liguori, F.S.; Leggieri, V.; Bilotta, A.; Madeo, A.; Casolo, S.; Uva, G. An archetype-based automated procedure to derive global-local seismic fragility of masonry building aggregates: META-FORMA-XL. Int. J. Disaster Risk Reduct. 2023, 95, 103903. [Google Scholar] [CrossRef]
  12. Stojadinovic, Z.; Kovacevic, M.; Marinkovic, D.; Stojadinovic, B. Rapid earthquake loss assessment based on machine learning and representative sampling. Earthq. Spectra 2022, 38, 152–177. [Google Scholar] [CrossRef]
  13. Zhang, C.; Wen, W.; Zhai, C.; Jia, J.; Zhou, B. Structural nonlinear seismic time-history response prediction of urban-scale reinforced concrete frames based on deep learning. Eng. Struct. 2024, 317, 118702. [Google Scholar] [CrossRef]
  14. Zhou, Y.; Meng, S.; Lou, Y.; Kong, Q. Physics-Informed Deep Learning-Based Real-Time Structural Response Prediction Method. Engineering 2024, 35, 140–157. [Google Scholar] [CrossRef]
  15. ASCE7-22; Minimum Design Loads and Associated Criteria for Buildings and Other Structures. American Society of Civil Engineers (ASCE): Reston, VA, USA, 2022.
  16. GB/T51327-2018; Standard for Urban Planning on Comprehensive Disaster Resistance and Prevention. China Architecture & Building Press: Beijing, China, 2018.
  17. Lu, X.; Yang, Z.; Chea, C.; Guan, H. Experimental study on earthquake-induced falling debris of exterior infill walls and its impact to pedestrian evacuation. Int. J. Disaster Risk Reduct. 2020, 43, 101372. [Google Scholar] [CrossRef]
  18. Wang, W.; Zhang, N.; Wang, L.; Wang, Z.; Ma, D. A Study of Influence Distance and Road Safety Avoidance Distance from Postearthquake Building Debris Accumulation. Adv. Civ. Eng. 2020, 2020, 1–17. [Google Scholar] [CrossRef]
  19. Zhou, Y.; Chen, H.; Lin, X.; Chen, Z. Research on Emergency Evacuation Route Planning Method based on Building Groups Seismic Damage Simulation. J. Disaster Prev. Mitig. Eng. 2022, 42, 1174–1182. [Google Scholar]
  20. Zheng, X.-W.; Li, H.-N.; Shi, Z.-Q. Hybrid AI-Bayesian-based demand models and fragility estimates for tall buildings against multi-hazard of earthquakes and winds. Thin-Walled Struct. 2023, 187, 110749. [Google Scholar] [CrossRef]
  21. Zheng, X.-W.; Li, H.-N.; Gardoni, P. Hybrid Bayesian-Copula-based risk assessment for tall buildings subject to wind loads considering various uncertainties. Reliab. Eng. Syst. Saf. 2023, 233, 109100. [Google Scholar] [CrossRef]
  22. Zheng, X.-W.; Li, H.-N.; Lv, H.-L.; Huo, L.-S.; Zhang, Y.-Y. Bayesian-based seismic resilience assessment for high-rise buildings with the uncertainty in various variables. J. Build. Eng. 2022, 51, 104321. [Google Scholar] [CrossRef]
  23. Zheng, X.-W.; Li, H.-N.; Gardoni, P. Probabilistic seismic demand models and life-cycle fragility estimates for high-rise buildings. J. Struct. Eng. 2021, 147, 04021216. [Google Scholar] [CrossRef]
  24. Gardoni, P.; Der Kiureghian, A.; Mosalam, K.M. Probabilistic capacity models and fragility estimates for reinforced concrete columns based on experimental observations. J. Eng. Mech. 2002, 128, 1024–1038. [Google Scholar] [CrossRef]
  25. Berg, B.A.; Billoire, A. Markov Chain Monte Carlo Simulations; John Wiley & Sons, Inc.: New York, NY, USA, 2008. [Google Scholar]
  26. GB50011-2010; Code for Seismic Design of Buildings. China Architecture and Building Press: Beijing, China, 2016.
  27. Melchers, R.E. Structural Reliability Analysis and Prediction; John Wiley: New York, NY, USA, 1999. [Google Scholar]
  28. Barbato, M.; Gu, Q.; Conte, J.P. Probabilistic Pushover analysis of structural and soil-structure systems. J. Struct. Eng. 2010, 136, 1330–1341. [Google Scholar] [CrossRef]
  29. Porter, K.A.; Beck, J.L.; Shaikhutdinov, R.V.; Earthquake, P. Investigation of Sensitivity of Building Loss Estimates to Major Uncertain Variables for the Van Nuys Testbed; Pacific Earthquake Engineering Research Center: Berkeley, CA, USA, 2002. [Google Scholar]
  30. Wen, Y.K.; Kang, Y.J. Minimum building life-cycle cost design criteria. I: Methodology. J. Struct. Eng. 2001, 127, 330–337. [Google Scholar] [CrossRef]
  31. Sowmya, R.; Premkumar, M.; Jangir, P. Newton-Raphson-based optimizer: A new population-based metaheuristic algorithm for continuous optimization problems. Eng. Appl. Artif. Intell. 2024, 128, 107532. [Google Scholar] [CrossRef]
  32. He, Y.; Zhai, C.; Wen, W. Probabilistic prediction of post-earthquake rubble range for RC frame structures. Soil Dyn. Earthq. Eng. 2023, 171, 107927. [Google Scholar] [CrossRef]
Figure 1. General concept of this presented framework.
Buildings 15 01481 g001
Figure 2. The elastic response and code-specified spectra of these ground motion records.
Buildings 15 01481 g002
Figure 3. The FE models of typical building structures. (a) Teaching building. (b) Office building. (c) Dormitory building.
Buildings 15 01481 g003
Figure 4. Structural response of representative buildings under all seismic records. (a) Dormitory building: maximum lateral floor displacement. (b) Dormitory building: maximum inter-story drift ratio. (c) Office building: maximum lateral floor displacement. (d) Office building: maximum inter-story drift ratio. (e) Teaching building: maximum lateral floor displacement. (f) Teaching building: maximum inter-story drift ratio.
Buildings 15 01481 g004aBuildings 15 01481 g004b
Figure 5. Regression results of surrogate models.
Buildings 15 01481 g005
Figure 6. Comparison of predicted and target values obtained by surrogate models.
Buildings 15 01481 g006
Figure 7. The design information and discrete element model of this 6-story RCF structure. (a) Dimension and reinforcement details. (b) Discrete element model.
Buildings 15 01481 g007
Figure 8. Distribution of post-earthquake building falling debris.
Buildings 15 01481 g008
Figure 9. Statistical characteristics of post-earthquake debris width.
Buildings 15 01481 g009
Figure 10. Comparison between prior and posterior probability density functions.
Buildings 15 01481 g010
Figure 11. Bayesian-based prediction model for the maximum debris width.
Buildings 15 01481 g011
Figure 12. Damage distribution of campus buildings.
Buildings 15 01481 g012
Figure 13. The debris extent distribution in the university campus.
Buildings 15 01481 g013
Table 1. Profile of representative building structures.
CategoriesFunctionHeight (m)Section (mm)
Five floors structuresTeaching buildingGround floor: 3.9
Other floors: 3.6
Total height: 18.3
Beams: 350 × 500
Reinforcement ratio: 2.285%
Columns: 600 × 600
Reinforcement ratio: 1.111%
Five floors structuresOffice buildingGround floor: 4.5
Other floors: 3.6
Total height: 18.9
Beams: 600 × 800
Reinforcement ratio: 1.308%;
Columns: 800 × 800
Reinforcement ratio: 0.981%;
Six floors structuresDormitory buildingGround floor: 3.6,
Other floors: 3.3
Total height: 23.4
Beams: 400 × 600
Reinforcement ratio: 1.667%;
Columns: 700 × 700
Reinforcement ratio: 0.816%
Table 2. The preceding six-order natural periods of the school building obtained by ETABS and OpenSees.
Natural Period of Vibration123456
Te0.9720.8650.8360.8070.7910.756
To0.9970.8900.8570.8350.8340.750
ɛ2.54%2.90%2.48%3.39%5.49%4.50%
Table 3. Probabilistic description of the uncertain parameters.
ParameterMean ValueCOV/%Probability DistributionUpper LimitLower LimitSource
fy (MPa)363.85Lognormal1.1 fy,mean0.9 fy,meanMelchers [27]
αs (−)0.0320Lognormal0.040.02Barbato et al. [28]
E (Mpa)201,0003.3Lognormal214,266187,734Barbato et al. [28]
ξ (−)0.0540Normal1.4 ξmean0.6 ξmeanPorter et al. [29]
Table 4. Input features of network.
Eigenvalue TypeParameterData Format
EarthquakePGA, Δt, duration.Numeric data
Uncertainty parametersDamping ratio, modulus of elasticity, yield strength, post-yield stiffness ratio.Numeric data
Architectural informationUse function.Text data
X and Y direction natural period of vibration, maximum column spacing, span number, beam-column reinforcement ratio, floor height, number of building floors.Numeric data
Table 5. Goodness of fit for these surrogate models.
Output CharacteristicSetMAEMSERMSEMAPER2
Floor displacementTraining3.18622.8904.7840.0500.9990
Testing5.04865.9988.1240.0720.9972
MIDRTraining3.252 × 10−43.727 × 10−76.105 × 10−40.0540.9983
Testing6.042 × 10−42.509 × 10−61.584 × 10−30.0750.9890
Table 6. Posterior statistics of unknown parameters.
ParametersAverage ValueStandard DeviationCorrelation Coefficient Matrix
θ1θ2σ
θ1−8.2264.1981−0.98−0.01
θ216.1618.322−0.9810.01
σ4.1160.289−0.010.011
Disclaimer/Publisher’s Note: The statements, opinions and data contained in all publications are solely those of the individual author(s) and contributor(s) and not of MDPI and/or the editor(s). MDPI and/or the editor(s) disclaim responsibility for any injury to people or property resulting from any ideas, methods, instructions or products referred to in the content.

