Article

Construction and Analysis of Social Structure Model of Public Space in Fuzhou Cangxia Community from Dual Network Perspective

College of Architecture and Urban-Rural Planning, Fuzhou University, Fuzhou 350108, China
*
Authors to whom correspondence should be addressed.
Buildings 2025, 15(9), 1473; https://doi.org/10.3390/buildings15091473
Submission received: 27 March 2025 / Revised: 18 April 2025 / Accepted: 24 April 2025 / Published: 26 April 2025
(This article belongs to the Section Architectural Design, Urban Science, and Real Estate)

Abstract

Under the new normal of China’s development, urban construction has shifted from incremental expansion to the optimization of existing stock. As the focal point of urban stock, old communities have garnered increasingly in-depth research. Recent studies have extended their perspectives from physical spaces to the interactive relationship between “space and behavior”, while also emphasizing the integration of qualitative and quantitative analyses. However, existing research primarily focuses on the static characteristics of material spatial environments, neglecting the dynamic interplay between spatial attributes and social network relationships. This study takes the Cangxia Community in Fuzhou as a case study, employing social network analysis (SNA) to construct a dual-network model of resident behavior and public space. Through a three-level analysis of “overall–subgroup–single point”, the intrinsic relationship between “space and behavior” in old communities is revealed. The model demonstrates that resident behavior characteristics are positively correlated with public space attributes, namely, the better the spatial accessibility and visibility, the higher the frequency of resident behaviors. However, mismatched spatial nodes also exist, limiting the synergistic optimization of the dual-network model. This research aims to provide scientifically effective methods and paradigms for the renewal of old communities and the sustainable development of cities.

1. Introduction

From 1958, when the concept of “urban renewal” was first proposed in The Hague [1], to the first United Nations Conference on Human Settlements [2], which highlighted the need to build sustainable human habitats, and further to the second session’s Istanbul Declaration and Habitat Agenda [3], the importance of creating sustainable human settlements has been consistently reinforced. The 2015 United Nations Sustainable Development Summit introduced Transforming Our World: The 2030 Agenda for Sustainable Development [4], establishing 17 Sustainable Development Goals (SDGs). Among them, Goal 11 focuses on creating inclusive, safe, resilient, and sustainable cities and human settlements. In the same year, China entered a transformative phase in urban development, marked by the government’s issuance of policy documents guiding urban renewal efforts. As a key spatial unit in urban renewal, communities have drawn significant attention. In 2019, the Central Economic Work Conference proposed measures to ensure housing for financially challenged urban populations, strengthen urban renewal, and upgrade housing stocks [5]. In 2021, China’s 14th Five-Year Plan and 2035 Vision Target Outline emphasized accelerating urban renewal and transforming old residential areas, industrial sites, and urban villages [6]. By 2023, Fuzhou, the focal city of this research, had garnered international acclaim, winning the Global Sustainable Development City Award, with the renewal of its old communities serving as a model for sustainable urban development. Enhancing old communities is imperative—not only to meet residents’ aspirations for improved quality of life but also to promote sustainable urban growth.
Community public space, as the primary venue for residents’ public activities and a crucial component of urban public space, directly influences the quality of life for residents and shapes the overall image of the city [7,8]. Research on this topic has evolved from focusing solely on spatial form to considering non-material factors [9,10], emphasizing the interaction between people and their environment. Scholars have explored various dimensions of this relationship. For instance, community perception has been assessed through satisfaction levels with public open spaces (POS) and quality of life (QOL) factors [11]. Other studies have developed POS indicators from the perspectives of health and well-being [12], examining the extent to which public space quality affects residents’ quality of life. Conversely, the continuous maintenance of public spaces and active participation in community activities by residents have been identified as critical factors in ensuring the sustainability and quality of these spaces [13]. In addition, qualitative methods such as interviews and focus groups have been employed to elucidate the vital role of public spaces in fostering community ties, sometimes interpreted through familial concepts [14]. More recently, the field has seen a shift from traditional qualitative approaches toward quantitative analysis or the integration of both methods. Traditional qualitative research often emphasizes the homogeneity of collective behavior, but advancements in information technology and interdisciplinary approaches have enabled more nuanced investigations. Quantitative methods, such as social network analysis (SNA) [15], network analysis function in ArcGIS [16], and principal component analysis method of SPSS 26.0 [17], have been increasingly applied in community studies. These methods allow for the scientific and precise examination of the internal relationships between social dynamics and spatial configurations, leveraging quantitative indicators and visual structural models to uncover deeper insights.
Social network analysis (SNA), an important branch of interdisciplinary sociology, is a structural quantitative analysis method that combines graph theory and mathematical models to study the relationships between actors in social activities [18,19]. Through the systematic analysis of relational data, SNA examines the characteristics and networks of these relationships, revealing the structural features and dynamics of different interactions. SNA has been widely applied across various fields. It has been used to evaluate urban characteristics such as size, location, and mobility patterns [20], to analyze the overlap between commercial and social networks in cities [21], and to investigate how the social networks of residents in different types of public housing influence job search processes [22]. The introduction of SNA into community studies dates back to the 1970s, when Barry Wellman established its interdisciplinary application paradigm [23]. Since then, empirical research has increasingly demonstrated how social networks and residents’ behaviors directly or indirectly impact community development. This study has progressively uncovered the sociological dimensions embedded within the material forms of communities. SNA has since played a significant role in advancing community studies. It provides a framework for understanding the connections between community residents and external networks and for examining the interactions among neighborhood relationships, community spaces, and social dimensions [24,25]. By integrating these social and spatial analyses, SNA has become a valuable tool for exploring the intricate interplay between social networks and community development.
In recent years, Chinese scholars have increasingly applied social network analysis (SNA) to the fields of urban planning and architecture [26,27], moving beyond the study of singular social relationship networks [28,29]. This expansion incorporates both macro- and micro-level quantitative analyses of public space networks, establishing a research paradigm that links social networks with spatial forms. At the macro level, studies have explored various dimensions of urban and regional dynamics. These include the evolution of spatial structures in urban agglomerations [30], the network characteristics of urban infrastructure and living systems [31], and the evaluation of historical urban social network protection [32]. Other topics include park green space accessibility [33], transportation system analyses [34], ecological structures [35], and the functional linkages within urban spatial structures [36]. At the micro level, SNA has been used to examine specific aspects of community and heritage studies. Research has focused on historical heritage protection within the context of urban renewal [37], the correlation between historical block layouts and social networks [38], and the role of social networks in traditional village preservation [39,40]. Additional studies have analyzed the relationship between historical building spatial structures and ethical cultures and examined the spatial hierarchy of traditional settlement forms [41,42]. These findings collectively highlight the critical role that spatial network structures, across various scales, play in shaping the characteristics and functions of urban and rural environments. They demonstrate the inseparable relationship between social networks and physical space, emphasizing the need for integrated analyses in planning and architectural research.
From the perspective of research objects, most existing studies focus on large-scale network spaces characterized by extensive data and complexity. At the meso level, research predominantly examines network spaces with relatively clear population attributes or functional characteristics, such as villages, historical blocks, or residential areas [43]. However, the application of SNA methods to the intricate urban stock spaces of old communities remains underexplored. From the perspective of model construction, prior research paradigms that employed “point-line” semantic models primarily considered only the “direct connections” between points, often overlooking the “indirect correlations” that exist within networks. Moreover, quantitative analyses have largely been confined to the “single point-whole” dual level within a single network [44,45]. This narrow approach poses limitations when dealing with the complex network structures of communities. Consequently, the direct application of these paradigms to old community networks often yields generalized conclusions, which may lack the specificity and precision required for practical applications.
To sum up, this paper reintroduces the social network analysis (SNA) method into the research on the renewal of old communities. First, the research focuses on the Cangxia Community in Fuzhou City, which is representative of the upgraded old communities and also a key area of urban stock improvement in China. In order to clarify the interaction between the complex behaviors of residents and the diverse public spaces and coordinate the development of social networks, it will effectively contribute to sustainable urban development. During the application of the renewal method, the original single network of community public space is subdivided into an accessible and visible double network, and the double level of “single point–overall” is extended to a three-level structure of “single point–subgroup–overall”, corresponding to the spatial form of “node–group–community”. This breaks the limitation of the single-network double level and enables a deep exploration of the indirect relationships between point and line semantics, thus compensating for the shortcoming of only analyzing direct connections. Additionally, the matching degree between the residents’ behavior network and the public space network is further analyzed. The internal causes of network mismatch are identified, the influencing factors and their weights are analyzed layer by layer, and the interaction mode of “space–behavior” is more precisely examined, along with its internal correlation with the social network. This broadens the research perspective of the SNA method and deepens the research conclusions. Finally, a problem-oriented optimization of the community network structure is carried out to guide the reconstruction of the social network in old communities and truly achieve sustainable community development.

2. Materials and Methods

This study introduces the social network analysis (SNA) method into the optimization of public spaces in urban old communities. After reviewing the recent academic literature that employs SNA to analyze similar scales of buildings and settlements and considering the unique structural characteristics of community networks, the study summarizes the appropriate analytical levels and network dimensions for old communities. Specifically, the study focuses on the Cangxia Community in Fuzhou as the research subject. Based on spatial scale, the community is divided into the following three levels from macro to micro: the overall level, subgroup level, and individual node level. These three levels correspond to the following three dimensions of network analysis: stability, connectivity, and integration. According to the characteristics of the dual-network model at these three levels, relevant evaluation metrics are selected and compared to construct a logically comprehensive three-level dual-network analytical framework (Figure 1). This framework guides subsequent quantitative evaluation of metrics and comparative analysis of matching degrees, forming a systematic research outcome. The study aims to promote the alignment of community stock enhancement with residents’ living needs, thereby achieving a harmonious balance between spatial optimization and quality of life.

2.1. Research Cases

Based on the selected concept of “old communities”—referring to unit-based communities built from the founding of the People’s Republic of China to the 1990s and centralized commercial housing communities constructed between 1990 and 2000—a preliminary survey was conducted on communities within the central urban area of Fuzhou (within the Third Ring Road). A total of 283 communities were identified, of which 169 were classified as old communities. The classification of old communities in Fuzhou adheres to China’s standards for old neighborhood renovation, which are divided into the following three categories:
  • Basic Category: Focused on safety and essential living guarantees, this category includes upgrades to municipal facilities such as water supply, power supply, roads, and fire safety, as well as repairs to public areas of buildings.
  • Improvement Category: Emphasizing convenience and functional optimization, this category covers environmental improvements, energy-saving renovations, elevator installations, and the addition of parking and charging facilities.
  • Enhancement Category: Aimed at quality improvement and service expansion, this category prioritizes the construction of public service facilities such as education, healthcare, and elderly care, as well as the promotion of smart community upgrades.
In this study, the Cangxia Community in Fuzhou City was selected as the specific research object (Figure 2), which is a typical representative community in Fuzhou City, which is the core direction of the national old reform policy (classified under the enhancement category), and has a certain exemplary effect on the same type of community [46,47]. The details are as follows:
(1)
Typicality of Community Space
The physical layout of the Cangxia Community features a typical checkerboard pattern, characterized by both open roads and enclosed groups. This design is largely dictated by administrative boundaries and reflects the planning layout found in many older communities in Fuzhou. The Cangxia Community includes diverse types of public spaces that serve residential, commercial, and educational functions. However, there are significant contradictions regarding accessibility and visibility, such as ground-floor shops obstructing sightlines and a lack of connectivity between different areas. These spatial issues are common in similar older communities, providing rich scenarios for analyzing and constructing public space network models.
(2)
Exemplary Nature of Community Transformation
As one of the first upgraded old communities in Fuzhou to complete a comprehensive renovation, the Cangxia Community has undergone several renewal initiatives, including road widening and the enhancement of public facilities. Nevertheless, the public space network still suffers from a mismatch between its functions and the behavioral needs of residents. This partially updated community has been chosen as a case study for in-depth analysis, allowing for discussion of the practical application value of the network model developed in this research. The goal is to offer a replicable optimization path for the renewal of other aging communities in Fuzhou City.

2.2. Data Source and Processing

2.2.1. Community Data

By reviewing a large number of academic journals, master’s theses, and doctoral dissertations, the research trends and future directions in this field were identified. Subsequently, the study focused on Fuzhou, consulting the extensive literature on old communities and visiting local street offices, community committees, planning bureaus, archives, and relevant design institutions to systematically collect and organize data on the construction status, renewal progress, and planning of old communities in Fuzhou. Based on this, an in-depth field investigation was conducted in the Cangxia Community to gather residents’ feedback and assess the current state of the community.

2.2.2. Network Node Data

Field research was conducted in the Cangxia community using a multi-source data collection approach that combined traditional methods with information data collection. This involved on-site surveys, “six feet” trajectory recording, questionnaire surveys, and GPS personal positioning tracking. We employed a method that used artificial photography in conjunction with the “cat’s eye quadrant” technique to map public spaces. Through this process, we identified various metrics such as pedestrian and vehicle flow, sky visibility rate, and green visibility rate based on the images captured. This allowed us to assess the activity levels of crowds in these spaces. Ultimately, we identified 15 public space nodes, which include four community road nodes, four overhead layer space nodes, four active green space nodes, two residential green space nodes, and one riverside trail node.

2.2.3. Spatial Network Data

Google aerial maps were used to obtain the geographical location of the Cangxia Community and determine the overall relationships between public spaces. Measurements of roads, buildings, green spaces, and other elements within the community were conducted. The “Six Feet” app was used to observe path connections between public space nodes, and the accessibility of these paths was translated into a binary matrix of accessibility relationships. Additionally, the ground-floor plan of the Cangxia Community was drawn and imported into Depthmap 0.8.0, a spatial syntax software, to generate a visual step depth map between public space nodes. Based on actual visual observations, the visibility of paths was assessed and translated into a binary matrix of visibility relationships.

2.2.4. Behavioral Network Data

This study employed stratified random sampling to recruit 360 resident volunteers from the Cangxia Community, categorized into the following four age groups: 18–30 (90 participants), 31–45 (108 participants), 46–60 (90 participants), and over 60 (72 participants). The gender distribution among participants was 47% male and 53% female, with volunteers selected from the following five community clusters: Jiahui Garden, Jiahe Garden, Jiahua Garden, Jiaxing Garden, and Jiasheng Garden. Volunteers were equipped with GPS trackers for seven consecutive days, during which they recorded their activities every 15 min. The GPS trajectory data collected from the volunteers was imported into the ArcGIS 10.8 platform for overlay analysis. By examining the intersections and proximity distributions between the volunteer trajectory lines and 15 spatial nodes, we matched the residents’ trajectory data to these spatial nodes and counted the total number of visits to each node. Finally, the visits to each node were compared to the average number of visits, and the results were transformed into a binary matrix representing the behavioral relationships of the residents.

2.3. Research Procedure

Based on the social network analysis, after completing the preliminary work of establishing the research framework, selecting the research objects, and obtaining network data, the follow-up research process was mainly divided into the following three steps: (1) the abovementioned obtained binary matrix model was input into the Ucinet 6.7 platform, the public space network (Na) and the resident behavior network (Nb) of the Cangxia community were established, and 100 2-value random networks of the same scale (15 public space nodes) were generated, and the average values of the clustering coefficient and the average path length were calculated, which were used as the judgment of Na, a frame of reference for the small-world features of the NB network. (2) The eight evaluation index parameters required for the study were calculated (Table 1), and the network structure topology of Na and Nb was presented in NetDraw. (3) The matching degree analysis was carried out according to the characteristics of Na and Nb networks and the calculation results of indicators, and the network coupling relationship between the two was revealed.

3. Results

3.1. Network Model Generation

(1)
Spatial Accessibility Network (Na1)
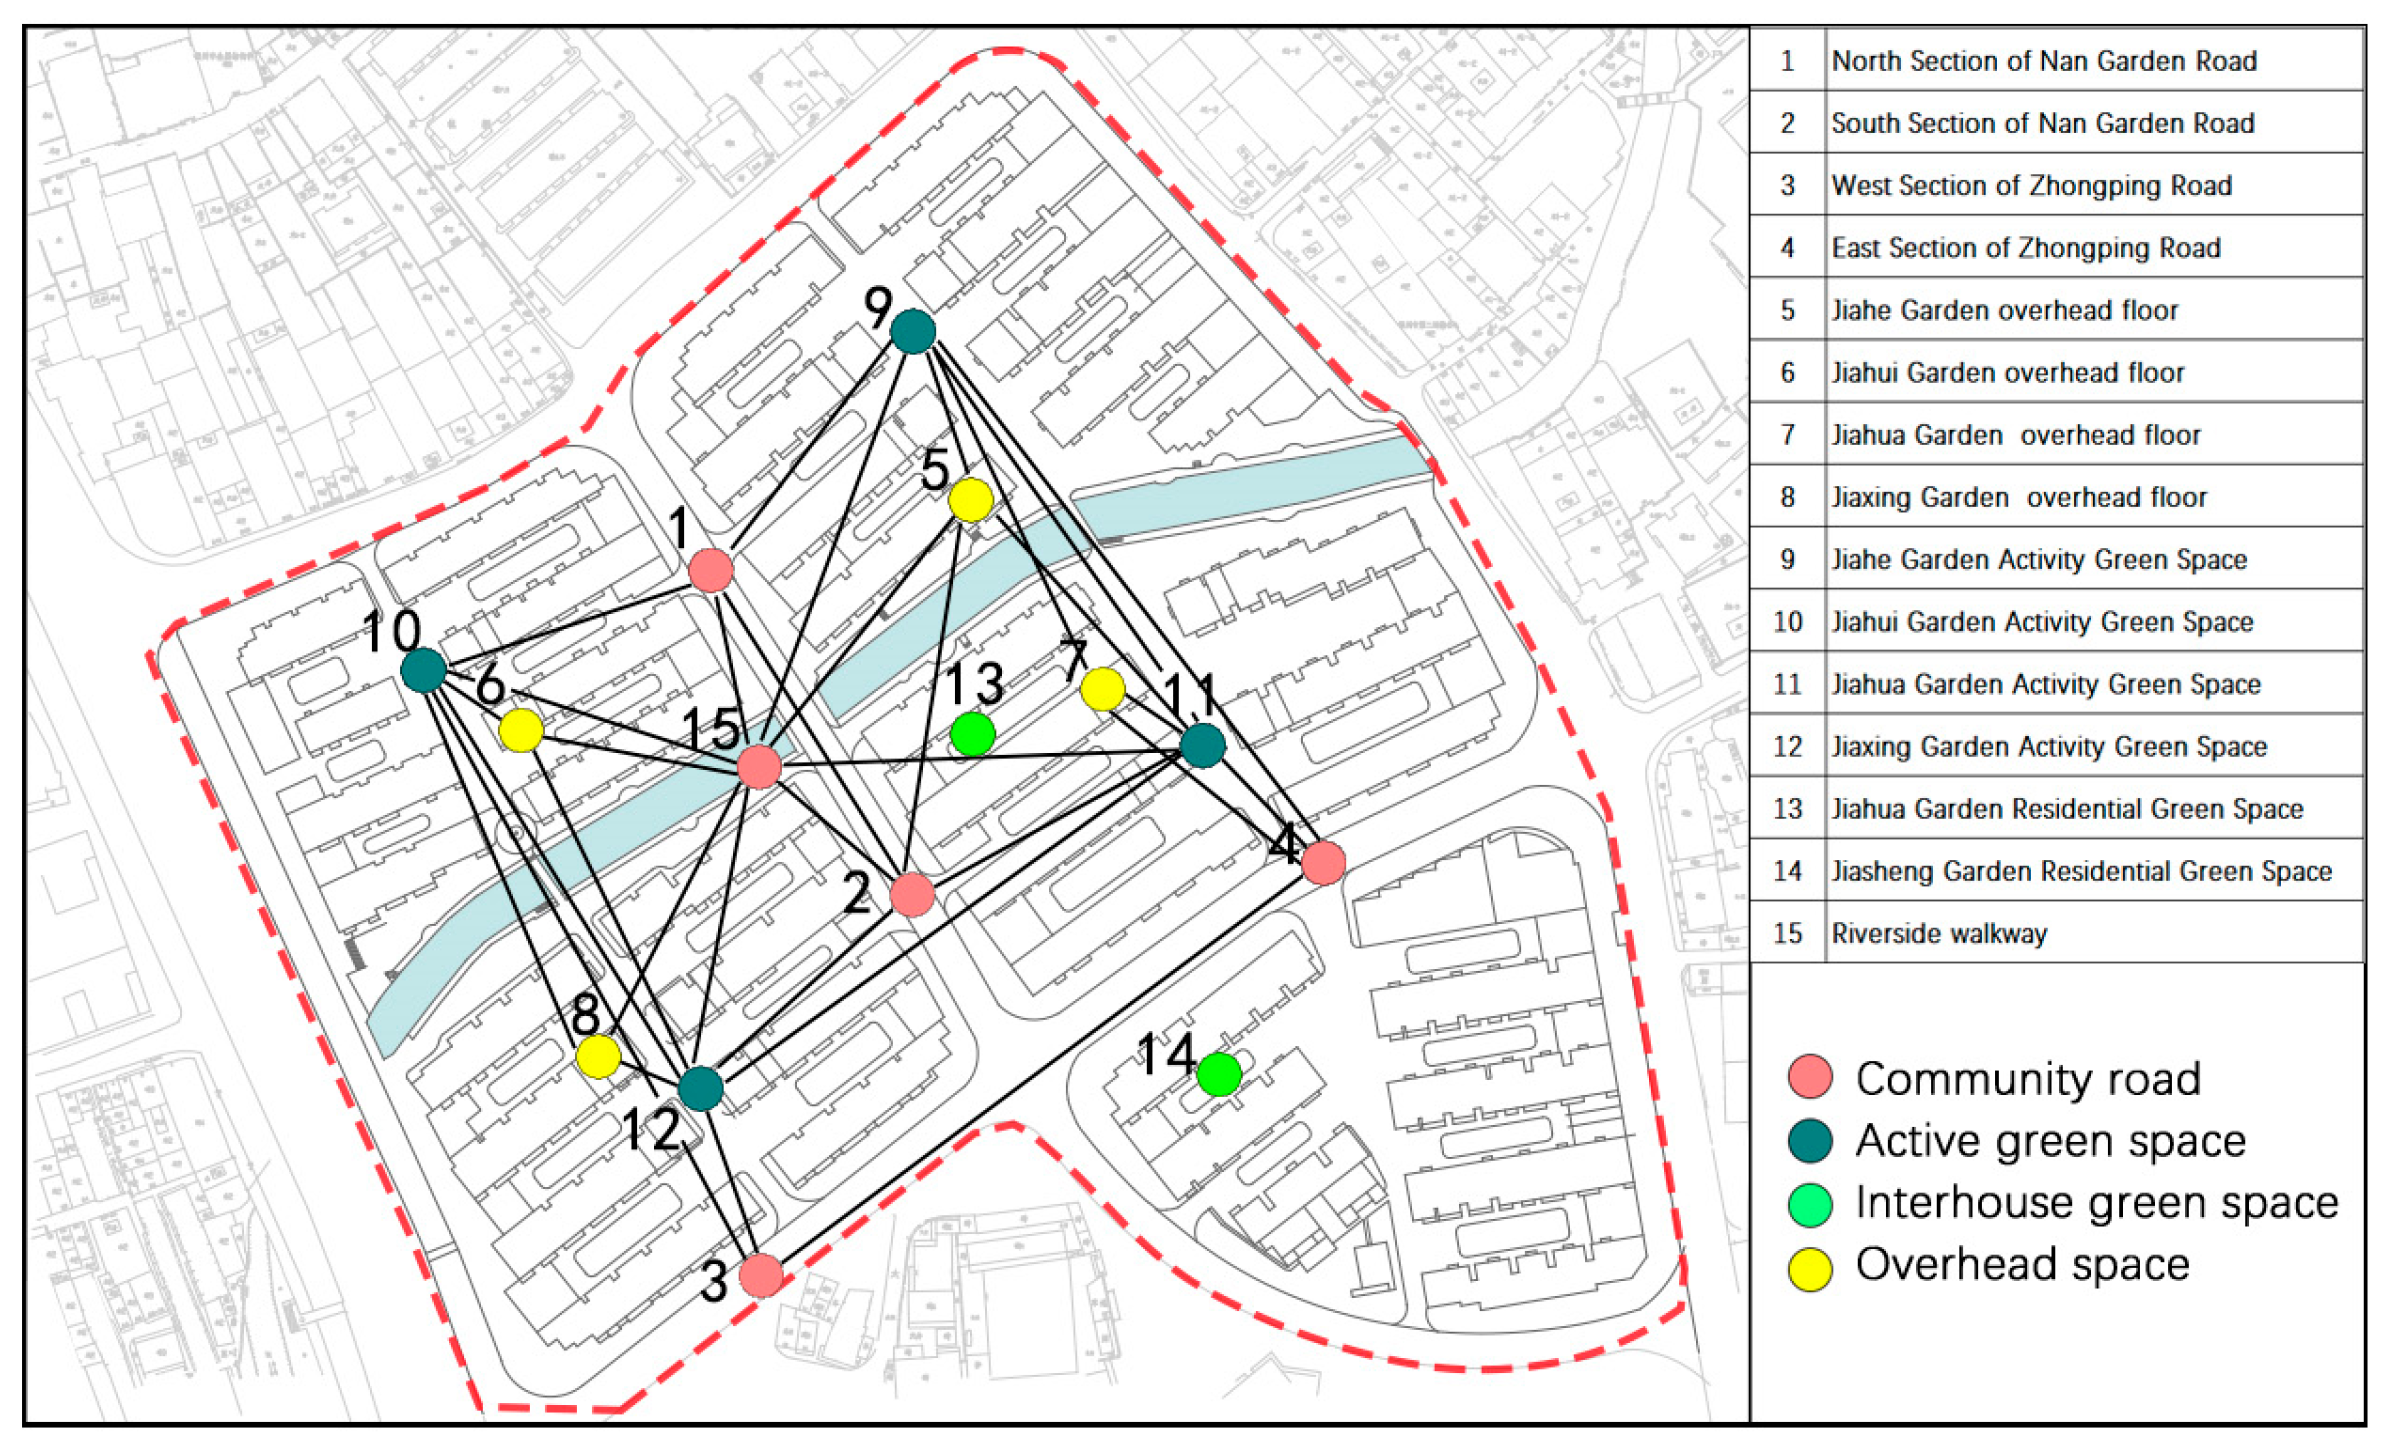
Based on Baidu Maps and surveying drawings, the path connectivity relationships between the 15 selected public space nodes in the Cangxia Community were obtained. Direct path connections were coded as “1”, and the absence thereof as “0”, forming a binary matrix. This matrix was input into the Ucinet 6.7 platform to calculate eight evaluation metrics (Table 2). The node degree and betweenness centrality topology of the spatial accessibility network (Na1) were visualized in NetDraw (Figure 3). A blockmodel analysis was performed on Na1 with a cutting depth of 3 to determine the number of subgroups (where a single subgroup containing one or multiple nodes is considered a block). After generating a partitioned dendrogram, the results were mapped onto the community layout to produce a simplified diagram of the block relational network.
(2)
Spatial Visibility Network (Na2)
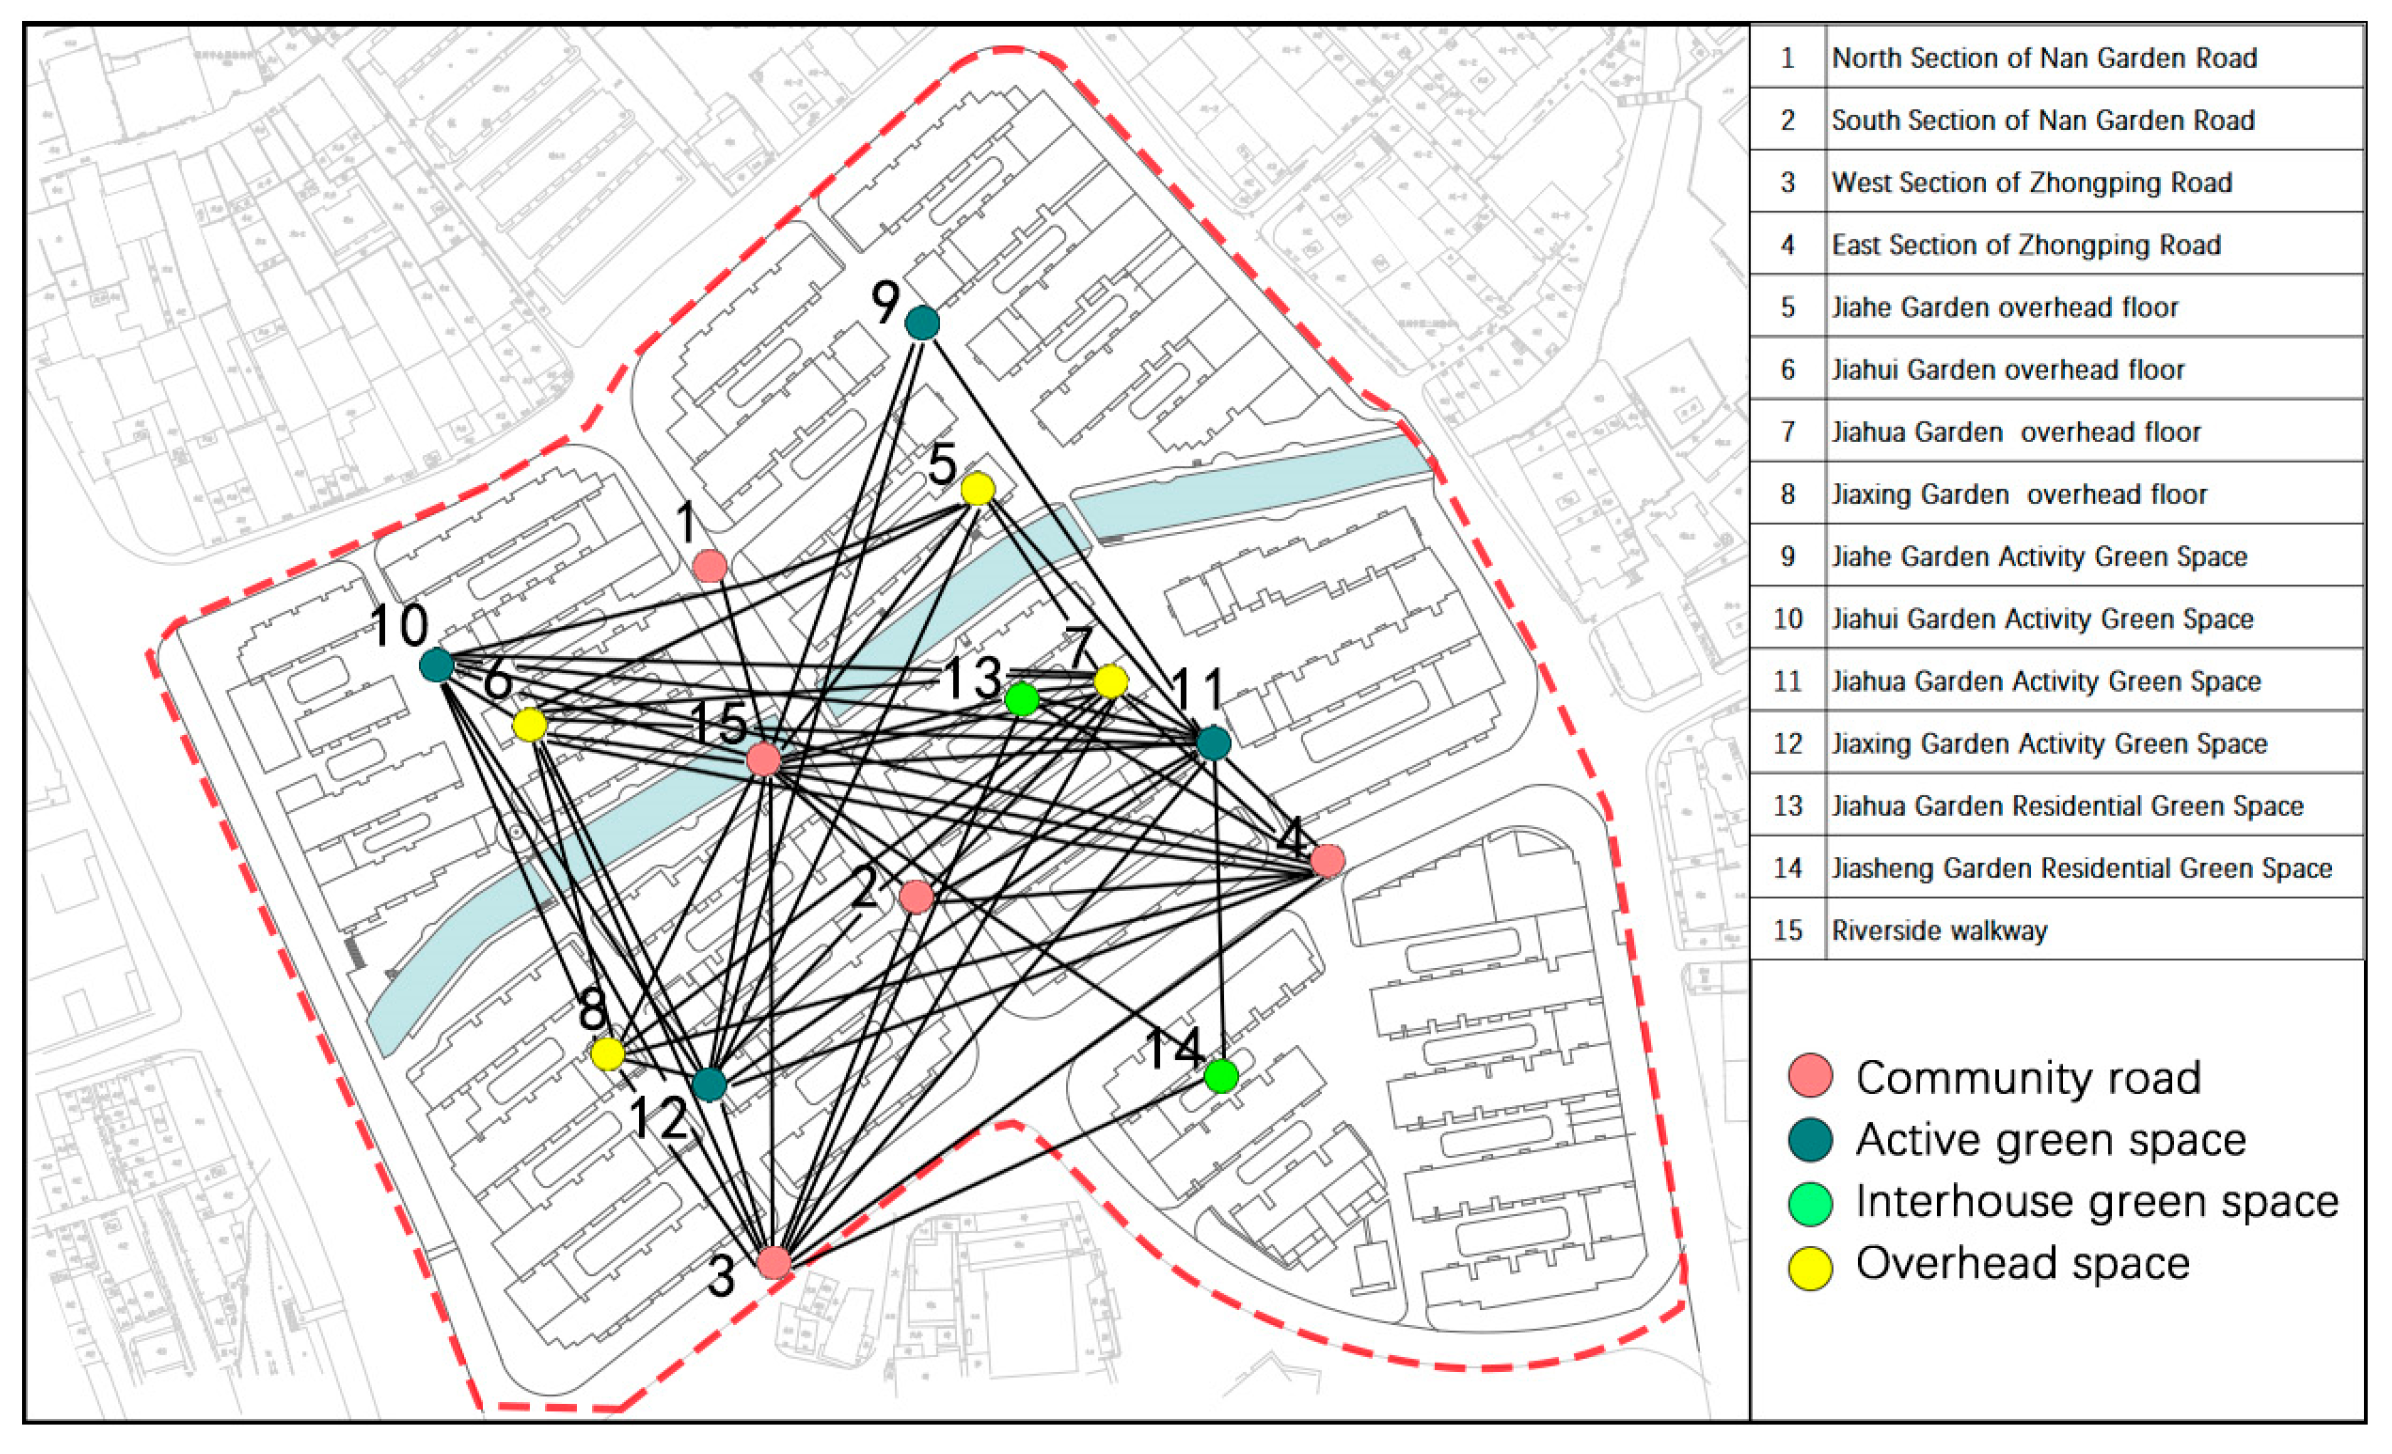
The community layout was imported into the Depthmap 0.8.0 software to obtain the visual step depth between the 15 selected public spaces in the Cangxia Community. Values below the average were coded as “1”, and those above as “0”, forming a binary matrix. This matrix was input into the Ucinet 6.7 platform to calculate eight evaluation metrics, resulting in the parameters of the spatial visibility network (Na2) for the Cangxia Community (Table 3). The node degree and betweenness centrality topology of the Na2 network were visualized in NetDraw (Figure 4). A blockmodel analysis was performed on Na2 with a cutting depth of 3 to determine the number of subgroups. After generating a partitioned dendrogram, the results were mapped onto the community layout to produce a simplified diagram of the block relational network.
(3)
Resident Behavior Network (Nb)
Similar to Na, the resident behavior network (Nb) uses the 15 selected public spaces as network actors. The behavioral relationships and frequencies between nodes were derived from residents’ activity trajectories, which were then converted into a matrix to construct the network. The specific process is as follows: Based on the GPS trajectories of 360 residents, the frequency of resident activities occurring at each of the 15 public space nodes was determined. If the frequency of activities at a single public space node exceeded the mean value across all nodes, it was coded as “1”; otherwise, it was coded as “0”. This binary matrix was input into the Ucinet 6.7 platform to calculate eight evaluation metrics, resulting in the parameters of the resident behavior network (Nb) (Table 4). The node degree and betweenness centrality topology of the Nb network were visualized in NetDraw (Figure 5). A blockmodel analysis was performed on Nb with a cutting depth of 3 to identify subgroups based on resident behaviors. After generating a partitioned dendrogram, the results were mapped onto the community layout to produce a simplified diagram of the block relational network .

3.2. Overall Level: Network Stability Analysis

At the overall level, network density is used to measure the connectivity tightness of community public space. The higher the density value, the more frequent the interaction between nodes and the more stable the network. It can also reflect the accessibility of community public space. The higher the value, the higher the completeness of the road network.
From the perspective of network stability (Table 2, Table 3 and Table 4), the density of Na1 is 0.305, that is, the actual road connections in the Na1 network account for only 30.5% of all theoretical connections. Combined with the data of node degree and intermediate centrality, the network accessibility is highly dependent on a few major roads, such as nodes 4 and 15, and there are few direct path connections between other nodes.
The density of Na2 is 0.314, that is, the actual line-of-sight connections in the Na2 network account for only 31.4% of the total theoretical connections. Combined with the data of node degree and intermediate centrality, the network visibility depends on the green space, such as nodes 9, 10, 11, and 12, and if larger-scale closed structures are added to these nodes, the Na2 of the Cangxia Community will face the dilemma of network breakage, which needs to be paid attention to in the subsequent community renewal design.
In contrast, the density of Nb is 0562, that is, the actual behavior connection of residents in the Nb network accounts for 56.2% of all theoretical behavior connections, indicating that the residents’ behavior connected between the community public space is sufficient, the residents’ use of the community public space covers a wide area, and more public space nodes support the daily life scenes of residents at the level of physical space. The NB network has good stability, and there is no risk of breaking the overall network structure due to the occupation and closure of some public spaces, and the behavior activities between residents can still exist and occur, which has good resilience.

3.3. Subgroup Level: Network Connectivity Analysis

At the subgroup level, cluster coefficient, small-world value, and block model analysis are commonly used indexes in social network analysis, which are used to reflect the overall network connectivity degree, local network stability degree, and distribution uniformity in the spatial network model and behavioral network model of the old community. It reveals the interaction and matching relationship between the spatial structure and residents’ behavior in the community.
From the perspective of network connectivity, the results can be seen in Table 5 as follows:
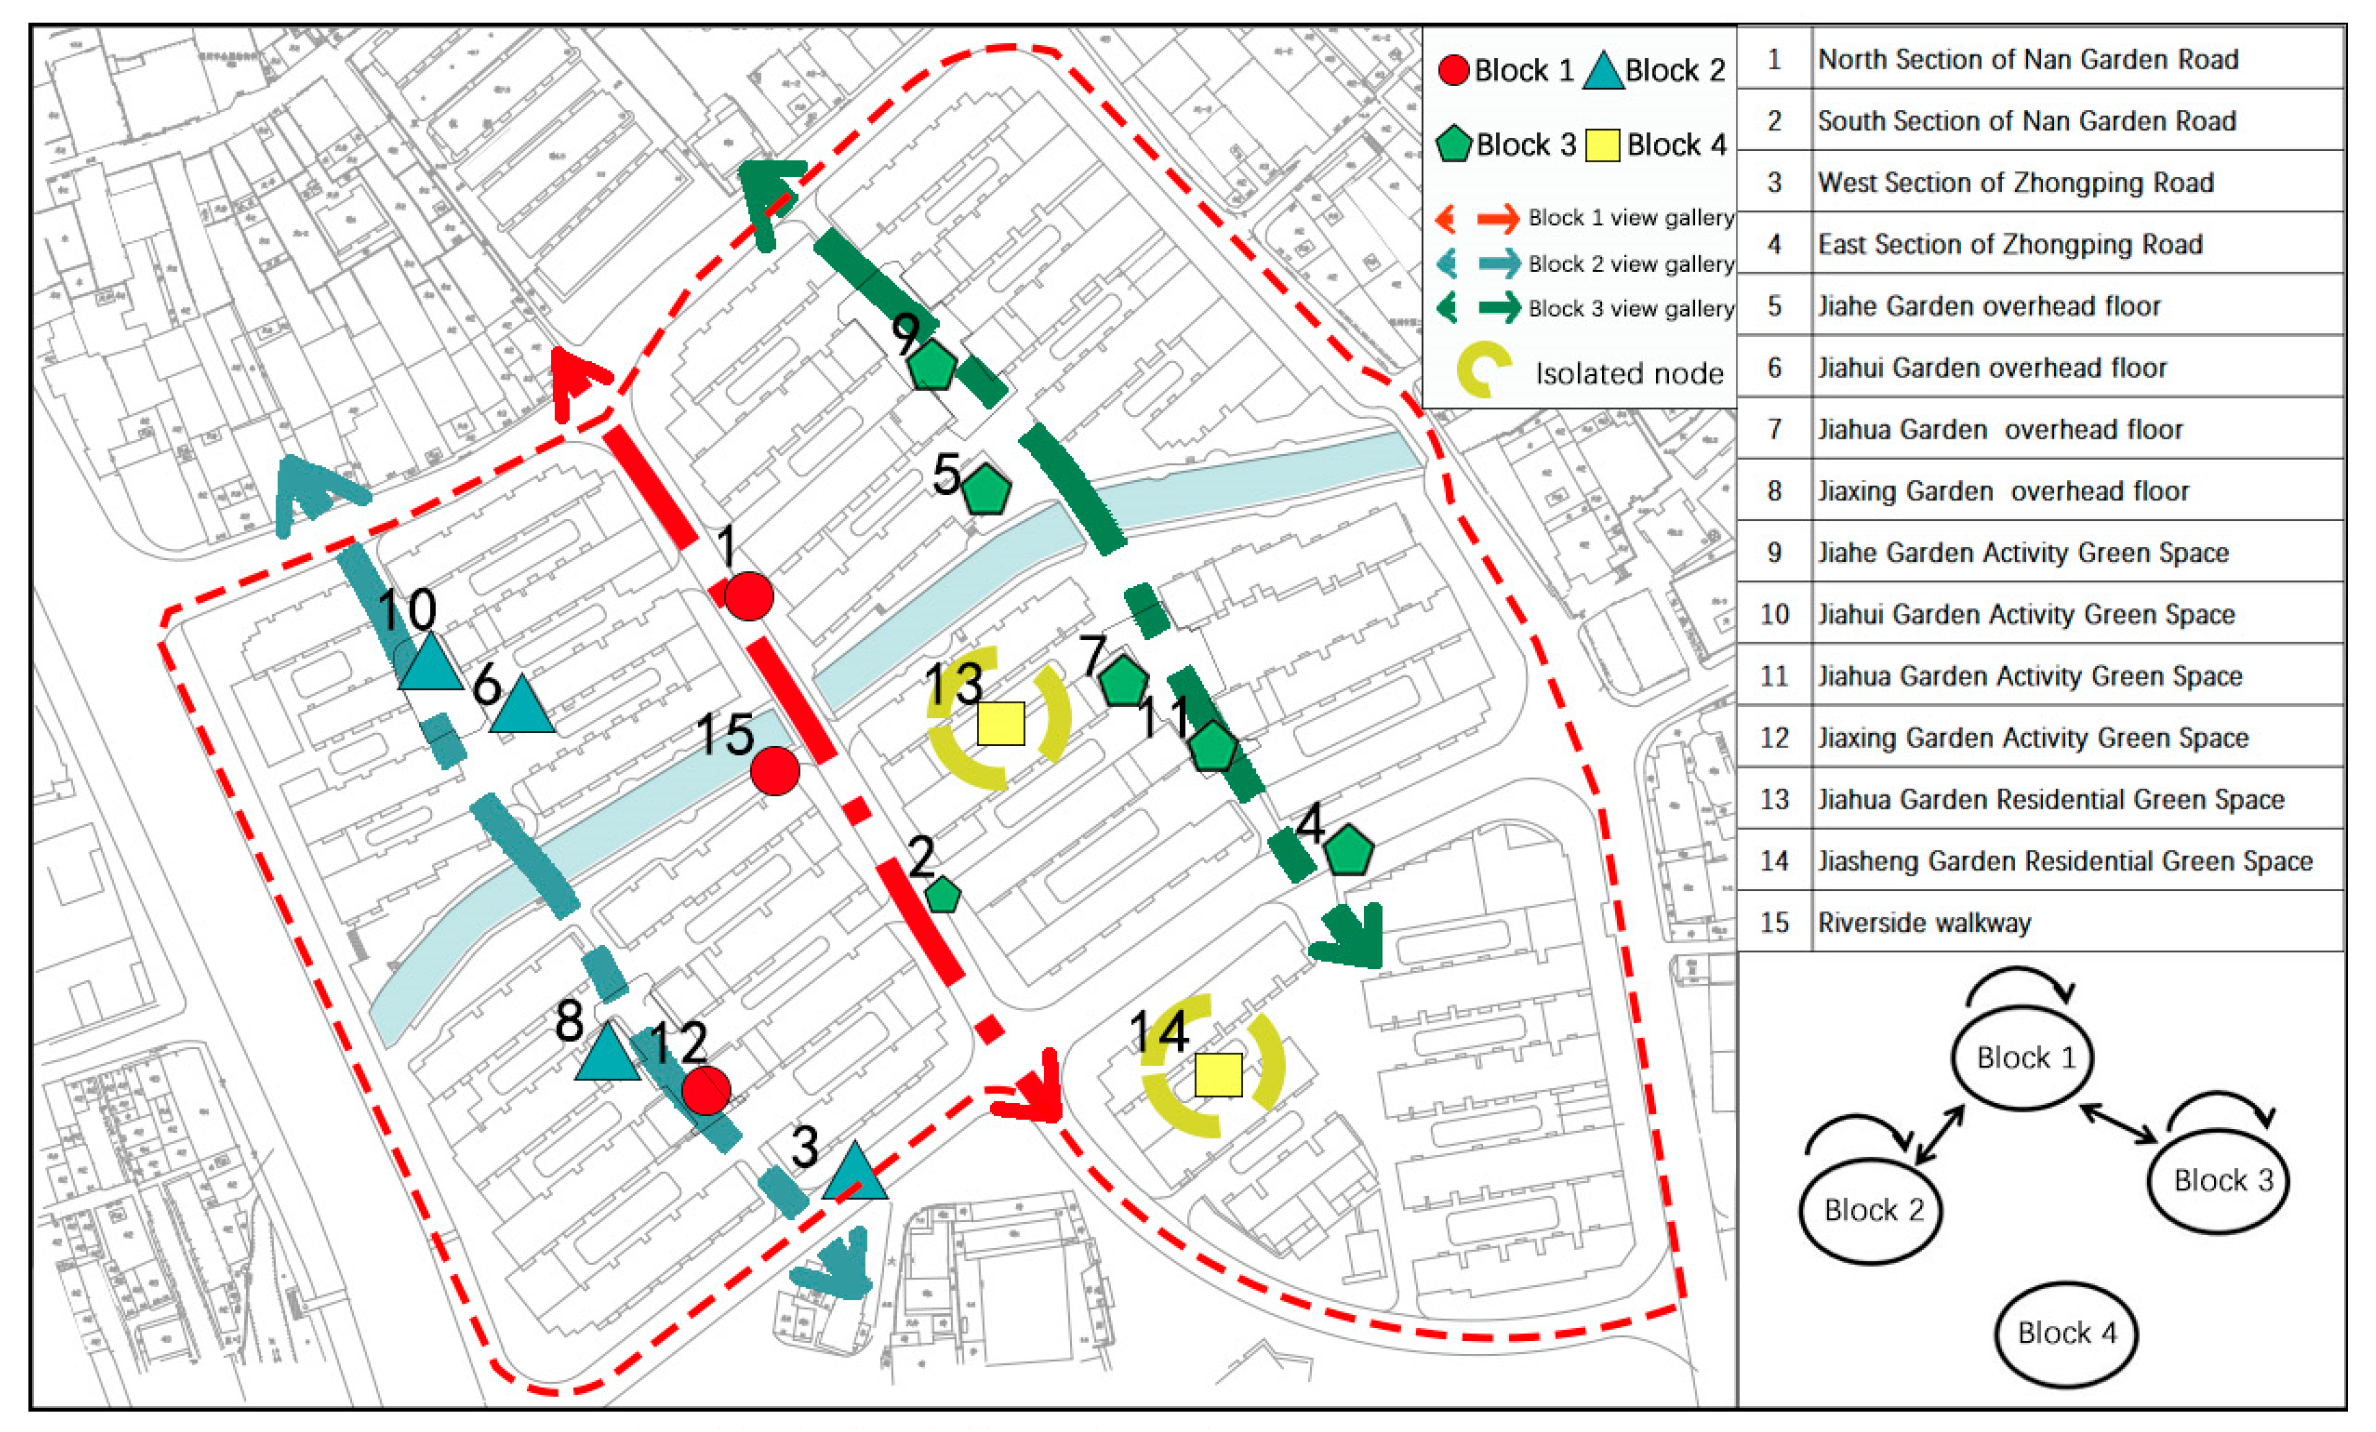
The clustering coefficient of Na1 is 0.715, which exceeds the average clustering coefficient of random networks. However, its average path length (1.933) is greater than that of random networks. Therefore, Na1 does not meet the criteria for small-world characteristics, indicating room for improvement. Based on the planar distribution of Na1 blocks (Figure 6), Na1 can be divided into four “blocks” (including one isolated node, which is also considered a “block” for analytical consistency). The overall structure reflects a partitioned pattern aligned with community clusters:
  • Subgroup 1 members are concentrated in Jiahui Garden and Jiahe Garden.
  • Subgroup 3 members are clustered in Jiahua Garden and Jiasheng Garden.
  • Subgroup 4 members are located in Jiaxing Garden.
This suggests strong accessibility between Jiahui Garden and Jiahe Garden, which belong to the same subgroup. Internally, path connectivity within clusters is tighter than between clusters. Node 15, with high accessibility to all clusters, does not distinctly belong to any subgroup and remains isolated in Na1’s structural layout.
The clustering coefficient of Na2 is 0.61, exceeding the average of random networks, but its average path length (1.615) is also greater. Thus, Na2 similarly fails to meet small-world criteria, highlighting potential optimization opportunities. The planar distribution of Na2 blocks (Figure 7) reveals a partitioned pattern divided by Nanyuan Road, which connects clusters on the eastern and western sides:
  • Subgroup 1 members are concentrated along major roads.
  • Subgroup 2 members span Jiahui Garden and Jiaxing Garden.
  • Subgroup 3 members cover Jiahe Garden and Jiahua Garden.
  • Subgroup 4 corresponds to residential green spaces.
The strong visual connectivity between Jiahui Garden and Jiaxing Garden (Subgroup 2) can be attributed to the absence of street-level shops blocking east-west sightlines and minimal visual obstructions around river channels. Similarly, the clustering of Jiahe Garden and Jiahua Garden (Subgroup 3) reflects the influence of architectural forms and spatial distribution on visibility relationships in Na2.
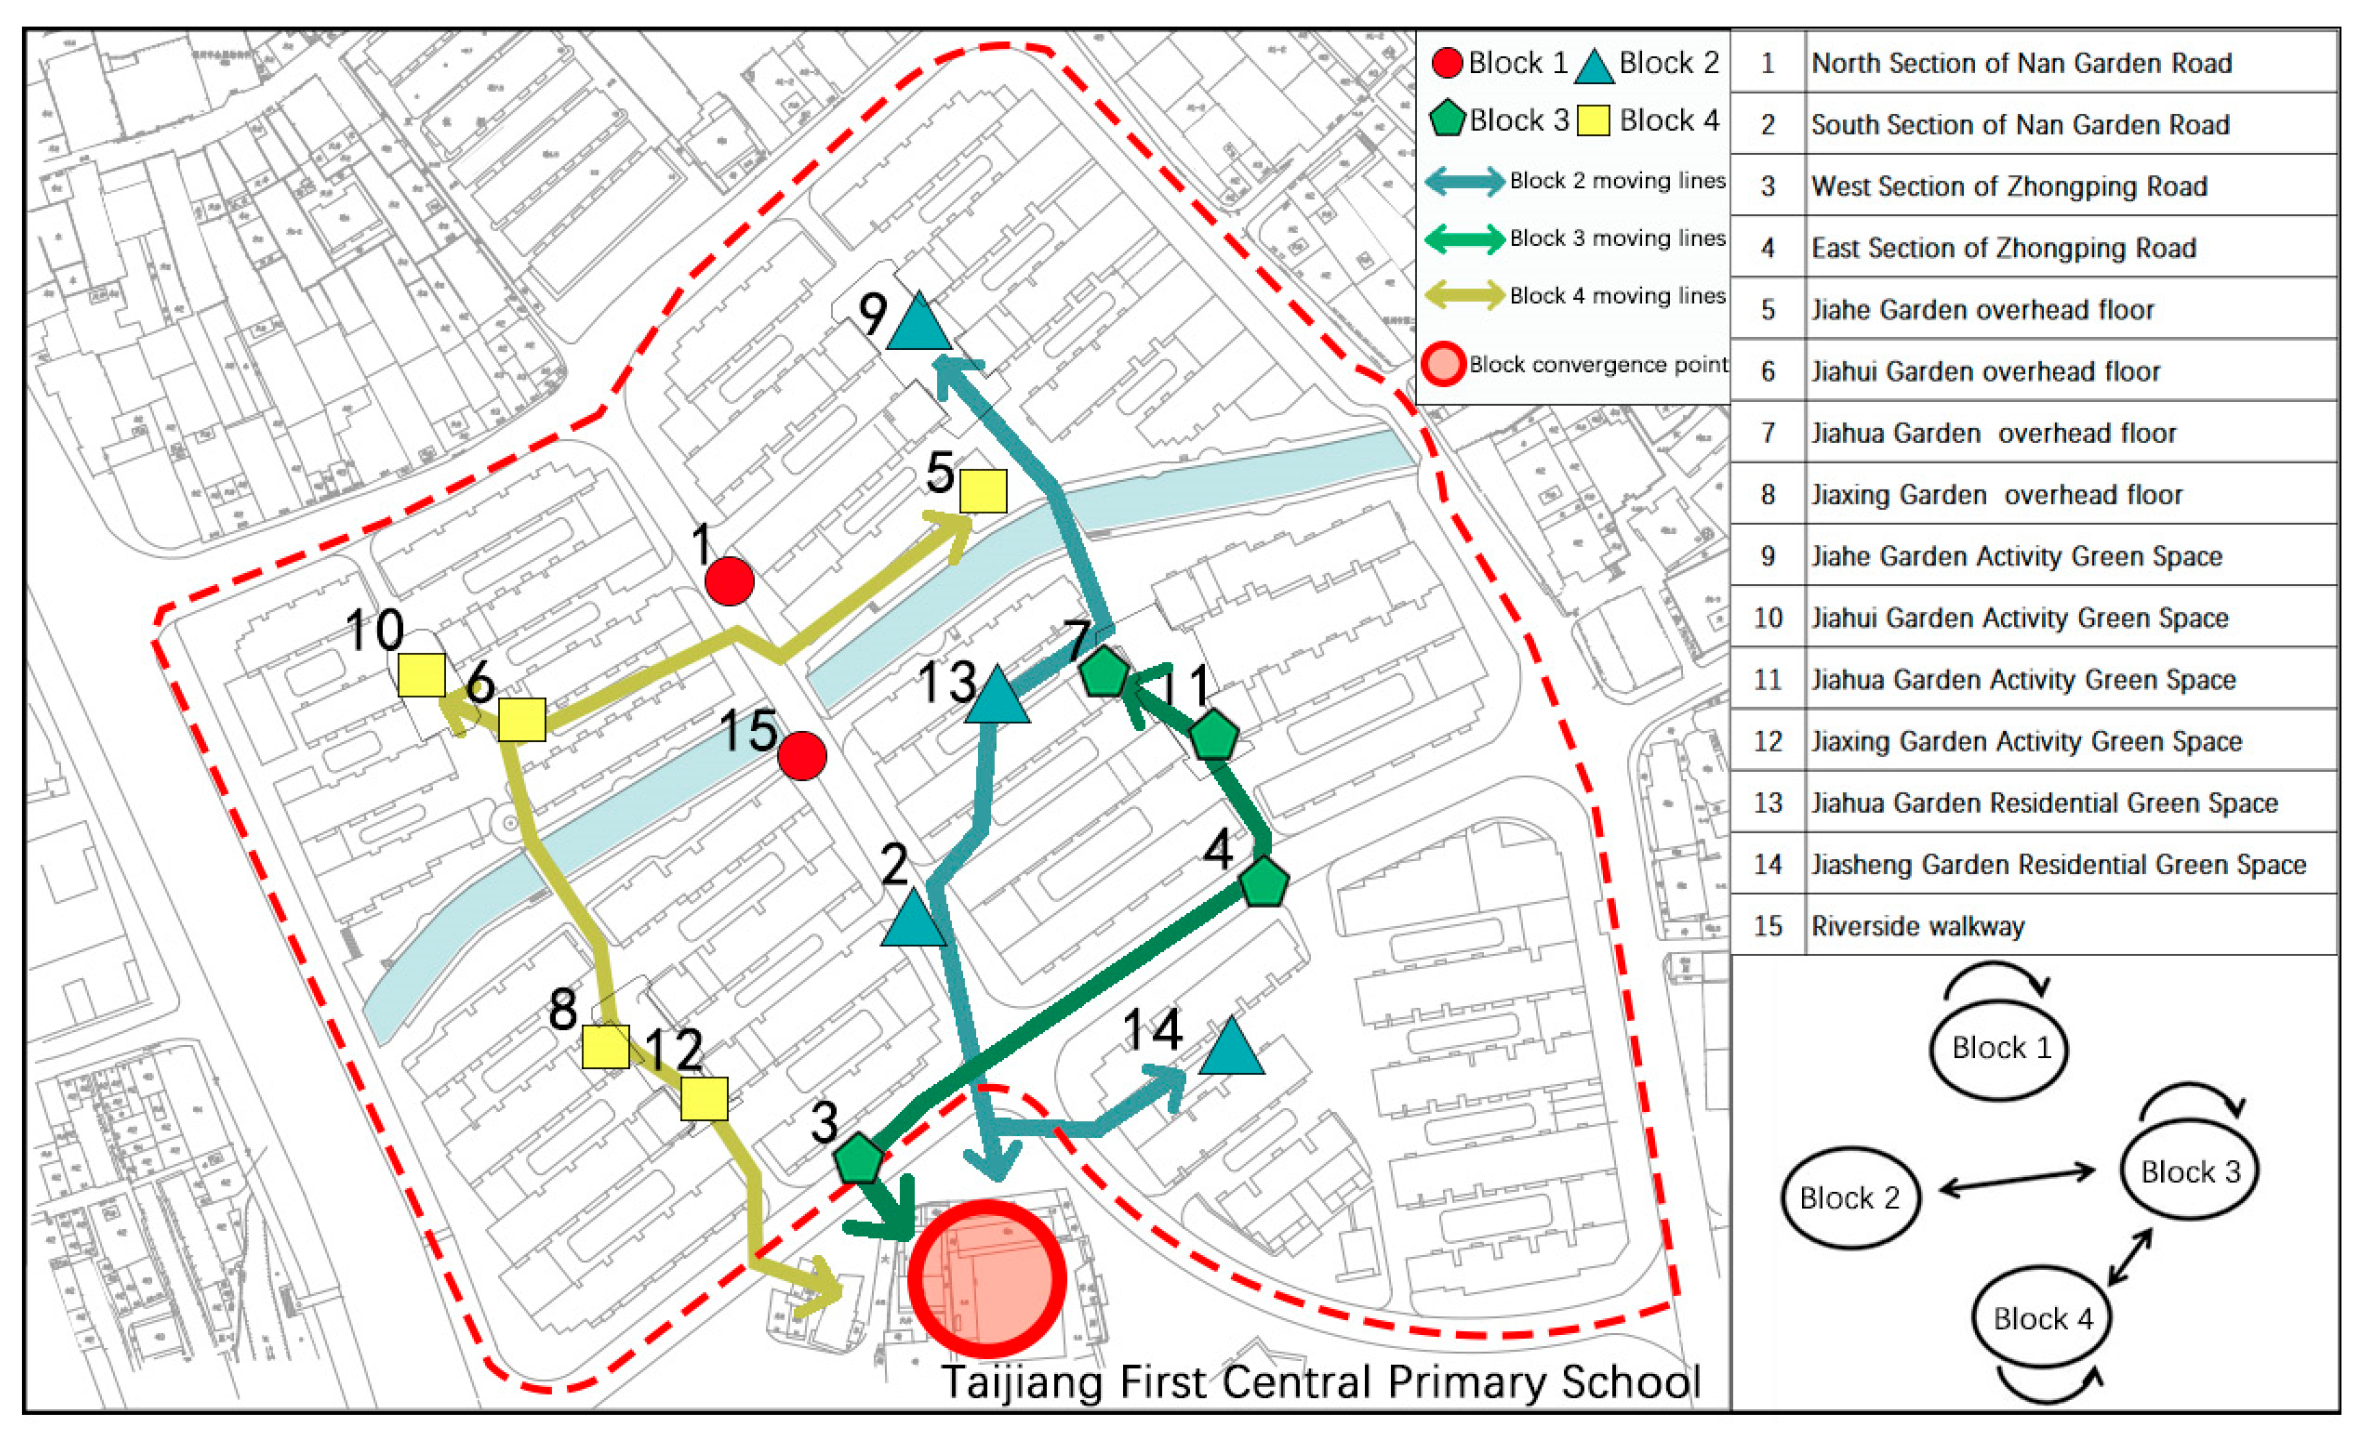
Nb exhibits a clustering coefficient of 0.851 (higher than random networks) and an average path length of 1.438 (shorter than random networks), satisfying the criteria for a small-world network. The planar distribution of Nb blocks (Figure 8) shows a partitioned structure aligned with community clusters and major roads:
  • Subgroup 1 members are located along primary roads.
  • Subgroup 2 members are geographically scattered with low node degrees.
  • Subgroup 3 members cluster around Jiahua Garden and Zhongxi Road.
  • Subgroup 4 members focus on Jiahui Garden and Jiaxing Garden.
Subgroup 3 indicates behavioral synergy between Jiahua Garden and Zhongping Road, where residents’ trajectories frequently link these spaces. Similarly, Subgroup 4 reveals co-occurring activities in Jiahui Garden and Jiaxing Garden, forming a behavioral pattern where multiple clusters converge toward the southern area of Jiaxing Garden.

3.4. Single Point Level: Network Integration Analysis

At the single-point level, three indicators—node degree, betweenness centrality, and closeness centrality—are useful for identifying important nodes, key connection points, and the overall centralization of nodes in the public spaces of old communities. These indicators help analyze the distribution of nodes in relation to residents’ behaviors and can clearly illustrate the contradictions and correlations between public nodes and residents’ activities.
The average node degree of Na1 is 4.267, and there are six spatial nodes that can reach above the mean (Table 6), accounting for only 40%, indicating that the node degree is not evenly distributed within the network. Meanwhile, the types of nodes with node degrees that reach above the mean are mostly major roads within the community (nodes 1, 2, 4, and 15), while the types of nodes with the lowest node degrees are mainly concentrated in the overhead space and green space between homes within the community, indicating that in terms of public space accessibility in the community, the accessibility of major roads is the highest and the accessibility of overhead space and green space between homes is the lowest, and these two types of nodes limit the further integration within the Na1 network. The average intermediate centrality of Na1 is 6.533 (Table 7), and there are three spatial nodes that can reach above the mean, accounting for only 20% of the nodes, and six nodes have an intermediate centrality of 0. This indicates that there are a few core nodes in the Na1 network, which occupy most of the nodes within the network among the inter-nodal path connections. The node types with intermediate centrality above the mean value are all major roads in the community (nodes 2, 4, and 15), and the lowest node types are overhead space, active green space, and green space between houses in the community, which indicates that the community public space in the path connection as a whole presents a major road as a skeleton, which powerfully connects all types of public space, while the path connection between other types of public space is limited, and the intermediate centrality potential of Na1 is 0.555. The intermediate center potential reaches 0.555 (more than half), which also proves this judgment.
The average node degree of Na2 is 4.4, and there are 6 spatial nodes that can reach above the mean (Table 6), accounting for only 40%, indicating that the distribution of node degree within the network is not uniform enough. At the same time, the node types with node degrees above the mean are mostly community group activity green spaces (nodes 9, 11, 12, and 15), while the node types with the lowest node degrees are mainly concentrated in the overhead space and inter-house green spaces within the community, indicating that the visibility of activity green spaces is the highest on the whole, and the accessibility of overhead space and inter-house green spaces is the lowest, with fewer visible interfaces in the former and the latter surrounded by residential buildings in the community, with smaller scales, making it difficult to have a direct line of sight. All of the smaller scales are difficult to reach by direct line of sight. The average median centrality of Na2 is 3.2 (Table 7), and there are five spatial nodes that can reach above the mean, accounting for 33.3% of the total. Most of the node types that reach above the mean value are intra-group activity green space (nodes 9, 10, 11, 12, and 15), followed by the main roads in the community, and the lowest node types are overhead space and inter-house green space. The overall situation is similar to the distribution of node degree, which indicates that the community public space in the line of sight connectivity overall shows a pattern of node 15 and intra-group activity green space as multiple centers, connecting to the other main roads and connecting other spatial nodes in the surrounding area. The overall pattern is similar to the node degree distribution.
The average node degree of Nb is 7.867, and there are 9 spatial nodes that can reach above the mean (Table 6), accounting for 60% of the total, which indicates that higher frequency resident behaviors occur in most nodes. Meanwhile, the types of nodes with node degree above the mean include both the main roads of the community (nodes 3, 4, and 15), as well as group activity green spaces (nodes 10, 11, and 12) and overhead spaces (nodes 6, 7, and 8), with a more diversified distribution. The types of nodes with the lowest node degree also include various types of spaces, such as main roads, activity green spaces, and inter-house green spaces in the community, indicating that the behavioral activities of residents in the community are not limited to a specific type of public space but occur in a relatively diverse manner in various types of spatial nodes. The average intermediate centrality degree of Nb is 3.067 (Table 7), and there are only three spatial nodes that can reach the mean value or above, which accounted for 20% of the total. The spatial types of nodes that reach above the mean are again relatively diverse. The nodes with intermediate centrality degree of 0 amounted to 7 nodes, including the main community road, inter-house green space and overhead space, etc., indicating that although the node types in which residents’ behavioral activities take place are diverse, they are relatively concentrated in a certain number of nodes (nodes 3, 11, and 15), which, combined with the intermediate centrality potential of Nb of 0.495 close to more than half, suggests that the distribution of links in the Nb network is diversified but uneven and that nodes 3, 11, and 15 are the public spaces relatively preferred by residents in their daily behavioral activities, occupying a more critical position in the network structure, and the Nb network as a whole shows a tendency of high concentration towards these core nodes.

3.5. Space Network-Behavior Network Coupling Analysis

3.5.1. At the Overall Level

Both Na1 and Na2 exhibit low network density with high dependency on specific nodes, whereas Nb demonstrates superior network density. This indicates that the connectivity of community public spaces—whether in terms of paths or visual interactions—remains insufficient, constraining further development of the Nb network. Field investigations reveal that the grid-like road layout of Na1 divides every two residential units into a block, with north-south façades often exceeding 60 m in length. Even with partial elevated ground floors in some units, their contribution to enhancing path connectivity is limited. Similarly, in Na2, the elongated and continuous north-south façades of residential units, combined with insufficient elevated spaces and spontaneous modifications by residents (e.g., adding metal barriers, hanging laundry, or parking vehicles), obstruct sightlines at human eye level, leading to inadequate visual guidance in public spaces.

3.5.2. At the Subgroup Level

Neither Na1 nor Na2 displays small-world characteristics, while Nb exhibits distinct small-world properties, creating a significant mismatch. Specifically in Na1, although no isolated subgroups exist, connections between subgroups (excluding Subgroup 2, node 15) remain weak. For example, Nanyuan Road acts as a barrier to path connectivity due to its enclosed street-level commercial interfaces. In Na2, Subgroup 4 (nodes 13 and 14), representing residential green spaces, suffers from limited scale and visual obstructions caused by surrounding buildings. For instance, Node 14, lacking elevated design, completely blocks sightlines. In contrast, Nb demonstrates strong overall connectivity but polarized activity distribution, as follows: high-frequency activities cluster in the southern area near schools, while the northern area, characterized by winding roads and insufficient amenities, experiences minimal resident engagement.

3.5.3. At the Single-Point Level

Public spaces with low node degree alignment between Na and Nb include nodes 1, 2, 3, 4, 6, and 7, while those with low betweenness centrality alignment include nodes 2, 4, 7, and 12. Comparative analysis reveals deviations in most nodes except nodes 3, 11, and 15. Key findings include the following points: spaces with high degrees in Na but low degrees in Nb are concentrated on the southern and northern sections of Nanyuan Road. These areas, located away from riverside zones, suffer from low recognizability and continuous 35–40 m street-level façades that fail to stimulate resident activities. Spaces with low degrees in Na but high degrees in Nb are primarily elevated spaces. Despite hosting spontaneous resident activities, these spaces are hindered by visual obstructions and fragmented paths.
Through a three-scale (“overall-subgroup-single point”) coupling analysis, this study uncovers the synergies and conflicts between the spatial visibility/accessibility networks (Na1 and Na2) and the resident behavior network (Nb) in the Cangxia Community. By mapping data outcomes to the physical characteristics of public spaces, the research links network relationships to spatial nodes, identifying root causes of mismatches. This approach provides a scientifically grounded methodology for guiding community renewal and governance, emphasizing the need to optimize spatial connectivity, enhance visual permeability, and align renewal strategies with resident behavioral patterns to achieve sustainable community development.

4. Discussion

4.1. Spatial Network Dual-Attribute Analysis

In this paper, by constructing a dual network model of spatial accessibility (Na1) and visibility (Na2), we extracted the attribute characteristics of public space and conducted a more in-depth study on the segmentation of the network model in terms of spatial accessibility and visibility, as compared to the study of constructing a spatial network model from path connections only[48,49]. Specifically, node 15 shows high accessibility, while its visibility is more general, and this difference reveals that residents’ activities are more path-dependent than visually appealing to node 15, further confirming the positive correlation between community walking and residents’ activities[50]. Meanwhile, node 15 maintains a high degree of intermediate centrality due to its location in the center of the community, confirming the positive impact of location advantage on the network node capacity[51]. In addition, node 10 has lower accessibility because it is surrounded by neighboring unit buildings, but it has better visibility as a central garden, which attracts the gathering of neighboring residents’ activities, verifying and quantifying the driving effect of environmental spatial visibility on residents’ behaviors[52]. However, compared with using the ML model and calculating the BGVI index to analyze the visibility[53,54], there are some limitations in this study to quantify the weights of spatial visibility by using the SNA. However, based on the SNA, the spatial network is disassembled in two dimensions as follows: accessibility and visibility, which provides a more accurate basis for identifying the spatial contradiction in the community, and this approach is still useful.

4.2. Factors Influencing Network Misalignment

4.2.1. Defects in Spatial Structure

According to the results of this study, there are two main reasons for the low matching of some nodes in the Na1, Na2, and Nb networks, as follows: first, the interface of the ground floor of the buildings in the old neighborhood is closed, which constitutes a double obstacle of accessibility and visibility and is unable to effectively guide the activities of the residents (e.g., nodes 10, 11, and 12); and second, the spontaneous remodeling behavior of the residents enhances the vitality of the local space but reduces the global accessibility and visibility (e.g., nodes 6, 7, and 8). Comparing the tourism network of Beijing’s historic city [38], the similarities are as follows: structural deficiencies in the transportation system hinder the diffusion and association of nodes and limit the development of the network. For the Beijing tourism network, route development can be used to enhance connectivity between the core and peripheral nodes, while road development in the community network will lead to spatial fragmentation [55], so it is more appropriate to adopt the strategy of opening up the interface of the ground floor of the unit building and remedying the chaos of the elevated floors in order to improve the visual permeability and accessibility to the routes.

4.2.2. Impact of Demographic Characteristics

The Cangxia Community has 3850 households with a total population of about 16,500, of which about 30% of the residents are elderly, and the community is aging seriously. According to the interview results of 360 resident volunteers, the activities of residents over 60 years old are more likely to gather towards green space (nodes 10, 11, 12, and 13) and overhead space (nodes 6, 7, and 8), which also confirms the conclusion that the spatial characteristics of gentle terrain and proximity to green space are more conducive to promoting group activities in an aging community [56]. It is worth noting that the daily activities of the elderly, as a low-income group, are dominated by chess and cards, sitting and talking, and leisure activities, and they rely more on free public facilities (e.g., overhead space, riverfront walkway, and active green space in the community), indicating that residents’ activities are also affected by factors such as age, gender, and socioeconomic status [57,58,59].

4.2.3. Limitations of Planning Policies

The current policies for the transformation of old communities in Fuzhou, such as the Implementation Plan for the Transformation of Old Subdivisions in Fuzhou and the Guidelines for the Construction of Livable Communities in Fuzhou, emphasize the transformation of physical space, such as the widening of roads, the addition of greenery, and the replenishment of facilities. Although the transformation content can improve the current community space predicament and promote the occurrence of residents’ behaviors, it neglects the informal space formed by residents spontaneously, such as the space on the overhead floor of the unit building, which is not included in the focus of the transformation of the old community but carries more daily residents’ behaviors, which is a phenomenon reflecting the contradiction between the rigid governance of the policy and the elastic demand of the residents.

4.2.4. Catalysis of the Neighborhood Effect

Through interviews with resident volunteers, it is understood that some residents are guided to the public space of the community through the recommendation of acquaintances rather than relying on the planning signs. Based on the strong relationship between neighbors and close friends [60], the residents’ behavioral activities generate the “neighborhood interaction effect” [61,62]—high accessibility and low travel costs between units within the cluster—which leads to wider and deeper communication and interaction among internal groups. The above spatial use pattern may also lead to the mismatch between the Na1, Na2, and Nb networks. For example, node 11 is located in the center of the Jiahua Court cluster, and despite poor accessibility and visibility, it has become a high aggregation point for the behavioral activities of residents within the cluster, and at the same time, this phenomenon confirms the conclusion that small-scale social interactions and community formation are very important [63,64].

4.3. Enhancement Strategies

In view of the current situation of the Cangxia community, the following enhancement suggestions are proposed:
(1)
By optimizing the overall structure of community roads and adding pathways for residents’ activities, we can improve accessibility throughout the community. For instance, removing the closed fence between Jiahua Garden and Jiaxing Garden and introducing a pedestrian path will strengthen connections between these areas. Additionally, widening the roads and enhancing the pedestrian street environment will encourage residents to engage in more travel and activities within the community.
(2)
Increasing the number of visual signs within the community will provide residents with better orientation and enhance overall visibility. For example, well-planned guide signs, such as maps and directional indicators, should align with the community’s layout and functional areas. Ensuring these signs are clearly visible will prevent human factors from diminishing their effectiveness.
(3)
Softening the boundaries between community groups can enhance relationships and strengthen functional connections. For example, expanding shared spaces between Jiahui Garden and Jiahe Garden will encourage interaction. By introducing community activity green spaces and sports facilities, as well as regularly organizing community interest activities, we can promote public participation and foster a sense of belonging within the community.
(4)
Improving the spatial quality of community nodes by adding activity facilities and optimizing the environment will increase their vibrancy. For example, equipping the overhead floor space of unit buildings with chess tables, seating for children, and other recreational facilities will encourage residents to engage in activities. Regular maintenance of community green spaces will enhance the environment, and adding seating areas will strengthen community bonds and enrich the interactive experience.
(5)
Establishing a feedback management mechanism for residents, along with adding community service centers and online platforms (such as WeChat group chats), will facilitate timely solutions to residents’ concerns. In areas with low participation and satisfaction, we can encourage residents to engage in community planning and revitalization through meetings and workshops. This involvement will help improve the community’s overall condition, enhance resident satisfaction, and strengthen social networks within the community.

4.4. Limitations and Future Directions

First, when establishing the semantic model of the spatial accessibility network (Na1), the distance between nodes and the width of the road were not considered. However, when establishing the semantic model of the Spatial Visibility Network (Na2), the viewshed analysis only examines the line-of-sight relationship on the two-dimensional plane and does not involve the stereo viewshed analysis.
Second, when analyzing the influencing factors of residents’ behavior network, the influence of the surrounding elements of the community is not considered, and the facilities or places outside the community also affect the behavior of residents’ activities in the community, which affects the spatial and behavioral network of the community to a certain extent.
Third, when comparing the parameters of the dual-network evaluation index, because the intersection between the social network analysis method and the architectural discipline is still incomplete, some spatial evaluation indicators adopt a relatively simple comparison method with the average value, which makes the description of the nature of the dual-network structure not absolutely accurate.
Therefore, the current research still needs to be further considered as follows: based on epistemology, social network analysis can help to analyze the interactive relationship between “public space and residents’ behaviors” in the community and promote the renewal and sustainable development of the community, but it is even more important to guide the public to participate in the renewal of the old community to solve such a complex social problem. However, it is more important to guide the public’s active participation in solving such complex social problems. Based on methodology, social network analysis has become a research paradigm by analyzing the network structure, summarizing the problems and characteristics, and then deriving community renewal strategies. In the process of network construction, the external social environment and internal personnel changes also affect the network relationship between people and space in the community. Therefore, research on community renewal should also be dynamic and open-ended, requiring continuous and regular observation and active intervention. Meanwhile, based on the current situation of the Cangxia Community, the future research direction should focus on the following points: after the renewal and transformation, we need to evaluate whether the community’s spatial network and behavioral network have improved and whether the existing mismatch between the two networks has been resolved. It would be beneficial to compare the network relationships before and after the transformation to assess the impact of the transformation measures on both the spatial and behavioral networks. This comparison could enhance our understanding of the value of social network analysis in the revitalization of old communities. Therefore, research on community renewal should be dynamic and open-ended, requiring continuous observation and proactive intervention.

5. Conclusions

Based on the interaction between physical space and residents’ behavior in the old community, this paper decides to follow the interaction theory of “space-behavior” and social network analysis (SNA) to establish a dual network semantics of public space and residents’ behavior in Cangxia Community and collect the corresponding data after reading and organizing the related literature and cutting-edge research results. Residents’ behavior, dual network of point and line semantics, and conduct corresponding data collection. Second, the dual network model is constructed according to the analytical framework of dual networks, three levels, and eight indicators, and the overall characterization of the model is conducted, as well as the judgment of the structural characteristics of the respective networks. Then, under the analysis of the matching degree of the dual network model, the relevance of “physical space–behavioral activities” is explored; the influence weights of spatial visibility and accessibility in the phenomenon of misalignment of the dual network and the tendency of residents’ behavior are analyzed so as to provide precise solutions to the public space dilemma of the Cangxia Community and to coordinate the public space of the Cangxia Community. We will also analyze the influence weights of spatial visibility, accessibility, and residents’ behavioral tendencies in the phenomenon of dual network mismatch so as to provide a precise strategy for the Cangxia Community’s public space dilemma in order to coordinate the network contradictions and cultivate the endogenous power to drive the sustainable development of the old community.
The conclusions obtained mainly contain the following three points:
(1) Summary of the characteristics of the Na network: there are some differences in the network integration between Na1 and Na2 in the public space network Na, and the network connectivity is insufficient, while the stability can be improved. Comparing the average node degree, average intermediate center degree, and intermediate center potential three indicators, Na1 and Na2 have uneven node spatial distribution, and node aggregation characteristics are not the same phenomenon, indicating that there are differences in network integration. At the same time, Na1 has weak road accessibility across clusters, and some roads in Na2 have limited permeability and inter-house green space visibility, resulting in poor network connectivity. Second, the Na network is not rich enough in both path connections and visual connections, and the poor openness of the first floor space of the community and the limited mobility of residents between public spaces lead to the lack of network stability.
(2) Summary of Nb network characteristics: the integration of residents’ behavioral network Nb is relatively average, and the network connectivity and stability are relatively good. Comprehensive average node degree and average intermediate center degree, intermediate center potential of three indicators, namely, most nodes in Nb have a higher frequency of resident behavior; the connection is diversified but not balanced; the existence of core nodes and the presentation of the characteristics of core node aggregation that indicate that the network integrality performance is still good. Second, Nb subgroups show a pattern of zoning by internal clusters and street boundaries, with good network connectivity. Meanwhile, the highest density of the Nb network proves that the behavioral activities of the residents in the community cover a wide range and the network stability is good.
(3) Analysis of Na and Nb network correlation: the interrelationship between community public space and residents’ behavioral activities, the overall match between the two is mostly positively correlated, i.e., the better the accessibility and visibility of the public space nodes in the community, the higher the frequency of residents’ behavioral activities, and the relationship between the two is mutually reinforcing. However, there are also some nodes where the attributes of the dual network do not match, and these nodes affect the overall match between the dual network and hinder the further synergistic development of the dual network structure.
The main contributions of this paper are as follows: (1) theoretical methods: The research refined the spatial network to create a “space-behavior” analysis framework. By conducting a comparative analysis of the dual network model, the study examined the degree of alignment between space and behavior, thereby expanding the theoretical foundations of social network analysis (SNA). Additionally, it validated the adaptability and scientific rigor of constructing an SNA dual network model for studying community update timelines, addressing the limitations of quantitative research in community studies. (2) practical application: Based on the quantified results of the matching degree and guided by the coordination of the dual network structure, the paper proposed strategies to enhance community public spaces. This approach established a comprehensive research loop, encompassing “theoretical understanding—internal mechanisms—model construction—comparative verification—practical application”. It offers visual tools and a scientific basis for community renewal practices.

Author Contributions

Conceptualization, W.W.; methodology, W.W. and M.C.; software, W.W.; validation, W.W., Z.W. and X.H.; formal analysis, W.W. and M.C.; investigation, W.W.; resources, W.W.; data curation, W.W. and M.C.; writing—original draft preparation, W.W. and M.C.; writing—review and editing, Z.W. and X.H.; visualization, W.W.; supervision, Z.W. and X.H.; project administration, M.C.; funding acquisition, W.W. All authors have read and agreed to the published version of the manuscript.

Funding

This research was funded by the National Natural Science Foundation of China (grant number: 51808123).

Data Availability Statement

The original contributions presented in the study are included in the article; further inquiries can be directed to the corresponding author.

Conflicts of Interest

The authors declare no conflicts of interest.

References

  1. van Bortel, G.; Elsinga, M. A Network Perspective on the Organization of Social Housing in the Netherlands: The Case of Urban Renewal in The Hague. Hous. Theory Soc. 2007, 24, 32–48. [Google Scholar] [CrossRef]
  2. Nations, U. United Nations Conference on Human Settlements—Habitat I. Available online: https://www.un.org/en/conferences/habitat/vancouver1976 (accessed on 18 December 2024).
  3. Nations, U. United Nations Conference on Human Settlements—Habitat II. Available online: https://www.un.org/en/conferences/habitat/istanbul1996 (accessed on 18 December 2024).
  4. Nations, U. Transforming Our World: The 2030 Agenda for Sustainable Development. Available online: https://digitallibrary.un.org/record/803352?v=pdf#files (accessed on 20 December 2024).
  5. China, The People's Government of the People's Republic. The Central Economic Work Conference Was Held in Beijing. Available online: https://www.gov.cn/xinwen/2019-12/12/content_5460670.htm (accessed on 21 December 2024).
  6. China, The People's Government of the People's Republic. The Outline of the 14th Five-Year Plan and the Long-Range Objectives Through the Year 2035. Available online: https://www.gov.cn/xinwen/2021-03/13/content_5592681.htm (accessed on 21 December 2024).
  7. Liang, S.; Leng, H. Residents’ seasonal behavior patterns and spatial preferences in public open spaces of severely cold regions: Evidence from Harbin, China. Habitat Int. 2025, 156, 103279. [Google Scholar] [CrossRef]
  8. Dong, X.; Zhang, X.; Jing, Y.; Zhou, Q.; Bai, L.; Du, S. Does every public open space (POS) contribute to sustainable city development? An assessment of inefficient POS in Beijing. Sustain. Cities Soc. 2024, 117, 105980. [Google Scholar] [CrossRef]
  9. Feng, L.; Wang, J.; Liu, B.; Hu, F.; Hong, X.; Wang, W. Does Urban Green Space Pattern Affect Green Space Noise Reduction? Forests 2024, 15, 1719. [Google Scholar] [CrossRef]
  10. Chu, S.; Weizhen, X.; Danyin, Z.; Jingsong, L.; Jiang, L.; Shuhu, L.; and Hong, X.-C. Urban Blue-Green Spaces and tranquility: A comprehensive review of noise reduction and sensory perception integration. J. Asian Archit. Build. Eng. 2025, 1–22. [Google Scholar] [CrossRef]
  11. Nasution, A.D.; Zahrah, W. Community Perception on Public Open Space and Quality of Life in Medan, Indonesia. Procedia—Soc. Behav. Sci. 2014, 153, 585–594. [Google Scholar] [CrossRef]
  12. Villanueva, K.; Badland, H.; Hooper, P.; Koohsari, M.J.; Mavoa, S.; Davern, M.; Roberts, R.; Goldfeld, S.; Giles-Corti, B. Developing indicators of public open space to promote health and wellbeing in communities. Appl. Geogr. 2015, 57, 112–119. [Google Scholar] [CrossRef]
  13. Ismail, W.A.W.; Said, I. Integrating the Community in Urban Design and Planning of Public Spaces: A Review in Malaysian Cities. Procedia—Soc. Behav. Sci. 2015, 168, 357–364. [Google Scholar] [CrossRef]
  14. Aghazadeh, S.A. Exploring leisure and municipal government public relations for community: A case example of parks and recreation. Public Relat. Rev. 2024, 50, 102410. [Google Scholar] [CrossRef]
  15. Wang, W.; Xu, C.; Lin, Z. The Renewal of Old Community Public Space in the Context of Social Network: A Case Study of Xingang Community in Fuzhou. New Archit. 2022, 3, 112–116. (In Chinese) [Google Scholar]
  16. Nugroho, A.G.; Herwangi, Y.; Ogawa, K. Will gated community affect public transit service coverage? Transp. Res. Interdiscip. Perspect. 2024, 24, 101050. [Google Scholar] [CrossRef]
  17. Su, Y.Q.; Zhang, X.Y.; Chen, X.H. How to alleviate alienation from the perspective of urban community public space-Evidence from urban young residents in China. Habitat Int. 2023, 138, 102836. [Google Scholar] [CrossRef]
  18. Russell Bernard, H. The Development of Social Network Analysis: A Study in the Sociology of Science, Linton C. Freeman, Empirical Press, Vancouver, BC (2004). Soc. Netw. 2005, 27, 377–384. [Google Scholar] [CrossRef]
  19. Scott, J. What is Social Network Analysis? Bloomsbury Academic: London, UK, 2012. [Google Scholar]
  20. Stanley, B. Middle East city networks and the “new urbanism”. Cities 2005, 22, 189–199. [Google Scholar] [CrossRef]
  21. Colvin, A. Why the Garden Club Couldn’t Save Youngstown: The Transformation of the Rust Belt; Harvard University Press: Cambridge, MA, USA, 2009. [Google Scholar]
  22. Kleit, R.G. The role of neighborhood social networks in scattered-site public housing residents’ search for jobs. Hous. Policy Debate 2001, 12, 541–573. [Google Scholar] [CrossRef]
  23. Wellman, B. The Community Question: The Intimate Networks of East Yorkers. Am. J. Sociol. 1979, 84, 1201–1231. [Google Scholar] [CrossRef]
  24. Bridge, G. The Neighbourhood and Social Networks. 2002. Available online: https://www.researchgate.net/publication/238745662_The_Neighbourhood_and_Social_Networks (accessed on 23 April 2025).
  25. Piselli, F. Communities, Places, and Social Networks. Am. Behav. Sci. 2007, 50, 867–878. [Google Scholar] [CrossRef]
  26. Jia, X.; Yan, B.; Fang, L.; Wang, J.; Pang, S.; Liu, Y.; Xu, M. Comparative analysis of urban underground public space and user walking paths based on the social network model. Neural Comput. Appl. 2023, 35, 24981–24999. [Google Scholar] [CrossRef]
  27. Song, J.; Zhu, Y.; Chu, X.; Yang, X. Research on the Vitality of Public Spaces in Tourist Villages through Social Network Analysis: A Case Study of Mochou Village in Hubei, China. Land 2024, 13, 359. [Google Scholar] [CrossRef]
  28. Pudjajana, A.M.; Manongga, D.; Iriani, A.; Purnomo, H.D. Identification of Influencers in Social Media using Social Network Analysis (SNA). In Proceedings of the 2018 International Seminar on Research of Information Technology and Intelligent Systems (ISRITI), Yogyakarta, Indonesia, 21–22 November 2018; pp. 400–404. [Google Scholar]
  29. Del-Fresno-García, M.; Daly, A.; Segado, S. Identifying the new Influencers in the Internet Era: Social Media and Social Network Analysis. Reis. 2016. Available online: https://www.academia.edu/20223007/Identifying_the_new_Influencers_in_the_Internet_Era_Social_Media_and_Social_Network_Analysis (accessed on 23 April 2025).
  30. Zhang, P.F.; Zhao, Y.Y.; Zhu, X.H.; Cai, Z.W.; Xu, J.X.; Shi, S. Spatial structure of urban agglomeration under the impact of high-speed railway construction: Based on the social network analysis. Sustain. Cities Soc. 2020, 62, 102404. [Google Scholar] [CrossRef]
  31. Halder, A. Social network analysis of stakeholder governance landscapes in infrastructure mega projects: A case of the Delhi-Mumbai Industrial Corridor project. Innov. Infrastruct. Solut. 2024, 9, 209. [Google Scholar] [CrossRef]
  32. Shi, Y.L.; Huang, Y.; Hu, D.Y.; Wan, D. Evaluation of social network conservation in historical areas of mountainous towns in Chongqing, China. J. Mt. Sci. 2020, 17, 1763–1775. [Google Scholar] [CrossRef]
  33. Chen, J.Y.; Chang, Z. Rethinking urban green space accessibility: Evaluating and optimizing public transportation system through social network analysis in megacities. Landsc. Urban Plan. 2015, 143, 150–159. [Google Scholar] [CrossRef]
  34. Chen, X.; Zhang, Y.; Hu, X. Analysis of Regional Freeway Traffic Safety Based on Social Network. 2020. Available online: https://ascelibrary.org/doi/10.1061/9780784483053.220 (accessed on 23 April 2025).
  35. Raj, U.; Banerjee, A.; Ray, S.; Bhattacharya, S. Structure of higher-order interactions in social-ecological networks through Q-analysis of their neighbourhood and clique complex. PLoS ONE 2024, 19, e0306409. [Google Scholar] [CrossRef]
  36. Gan, C.; Voda, M.; Wang, K.; Chen, L.; Ye, J. Spatial network structure of the tourism economy in urban agglomeration: A social network analysis. J. Hosp. Tour. Manag. 2021, 47, 124–133. [Google Scholar] [CrossRef]
  37. Xiang, H.; Xie, M.; Fang, Y. Study on the architecture space-social network characteristics based on social network analysis: A case study of Anshun Tunpu settlement. Ain Shams Eng. J. 2024, 15, 102333. [Google Scholar] [CrossRef]
  38. Liu, Z.; Wang, S.; Wang, F. Isolated or integrated? Planning and management of urban renewal for historic areas in Old Beijing city, based on the association network system. Habitat Int. 2019, 93, 102049. [Google Scholar] [CrossRef]
  39. Li, Q.; Lv, S.; Cui, J.; Liu, Y.; Chen, Z. Research on the Public Environment Renewal of Traditional Villages Based on the Social Network Analysis Method. Sustainability 2024, 16, 1006. [Google Scholar] [CrossRef]
  40. Lin, J.; Hu, J.; Tang, R.; Cui, J. Cluster spatial identification of traditional villages under social solidarity: From the perspective of contiguous protection. J. Cent. China Norm. Univ. Nat. Sci. Ed. 2024, 58, 359–370. [Google Scholar]
  41. Yan, B.; Xu, M. Research on the Construction of Network Cognitive Feedback Model in Historical and Cultural Space:A Case Study of Tangjiawan Ancient Town in Zhuhai. J. Hum. Settl. West China 2023, 38, 89–95. [Google Scholar]
  42. Shi, Y.; Huang, Y.; Yang, L.; Li, J. the Commercialization Mechanism of Traditional Settlements from the Perspective of Social Network Evolution: An Example of Ancient Towns in Southwest China. Urban Stud. 2023, 30, 133–144. [Google Scholar]
  43. Zhao, J.; Peng, Z.H.; Liu, L.B.; Yu, Y.; Shang, Z.R. Public Space Layout Optimization in Affordable Housing Based on Social Network Analysis. LAND 2021, 10, 955. [Google Scholar] [CrossRef]
  44. Liu, Q.; Hao, W.; Xia, M. Spatial association of coastal towns and villages in Funing District, Qinhuangdao: A study using social network analysis. J. Rural Stud. 2024, 107, 103261. [Google Scholar] [CrossRef]
  45. Hawken, S.; Sunindijo, R.Y.; Sanderson, D. The critical role of community networks in building everyday resilience—Insights from the urban villages of Surabaya. Int. J. Disaster Risk Reduct. 2023, 98, 104090. [Google Scholar] [CrossRef]
  46. He, Z.; He, J.; Chen, X. Community public space under network thinking: An analysis of the effectiveness of community public space in Jiefang Middle Road, Yuexiu District, Guangzhou. New Archit. 2014, 4, 102–106. (In Chinese) [Google Scholar]
  47. Song, J.; Chen, J.; Hu, Y. Spatial Transformation Strategy of Industrial Heritage from the Perspective of Social Network Analysis: A Case Study of Sanlinqiao Community Center Project. South Archit. 2024, 3, 32–41. (In Chinese) [Google Scholar]
  48. Lin, G.; Yu, X.; Li, Y. Social network dynamics in rural public spaces of multi-ethnic settlements: A case study from Tongren, China. Alex. Eng. J. 2024, 102, 132–148. [Google Scholar] [CrossRef]
  49. Luo, Y.; Lai, B.; Zhang, Y.; Liu, J. Village leadership, social networks and collective actions in indigenous communities: Case of Hani rice terrace social-ecological system in Southwest China. J. Rural Stud. 2024, 106, 103237. [Google Scholar] [CrossRef]
  50. Barnett, D.W.; Barnett, A.; Nathan, A.; Van Cauwenberg, J.; Cerin, E. Built environmental correlates of older adults’ total physical activity and walking: A systematic review and meta-analysis. Int. J. Behav. Nutr. Phys. Act. 2017, 14, 103. [Google Scholar] [CrossRef]
  51. Park, S.; Roh, S.; Yeo, I. Analysis of the Liner Shipping Network Structure of the Asia–Europe Main Trunk Route Using Social Network Analysis. Sustainability 2024, 16, 7414. [Google Scholar] [CrossRef]
  52. Vervoort, P.; Vanderheiden, S.; Hambsch, L.; Poelmans, L.; Vandermoere, F.; Loots, I. Greenness visibility in urban living environments as pathway to promote health and well-being: Mapping spatial differentiation in Flanders (Belgium) based on viewshed analysis. Nat.-Based Solut. 2024, 6, 100187. [Google Scholar] [CrossRef]
  53. Le, Q.H.; Kwon, N.; Nguyen, T.H.; Kim, B.; Ahn, Y. Sensing perceived urban stress using space syntactical and urban building density data: A machine learning-based approach. Build. Environ. 2024, 266, 112054. [Google Scholar] [CrossRef]
  54. Qi, L.; Hu, Y.; Bu, R.; Xiong, Z.; Li, B.; Zhang, C.; Liu, H.; Li, C. Spatial-temporal patterns and influencing factors of the Building Green View Index: A new approach for quantifying 3D urban greenery visibility. Sustain. Cities Soc. 2024, 111, 105518. [Google Scholar] [CrossRef]
  55. Muñoz, C.A.M.; Ramos, F.J.M. Informal / formal morphogenesis in Latin American settlements: A response to the problem of urban fragmentation. J. Urban Manag. 2024, 13, 497–520. [Google Scholar] [CrossRef]
  56. Nouri, M.; Chaudhury, H. Individual and Neighborhood Characteristics of Walking Activity in People Living With Dementia: A Proof of Concept for Quantitative Spatial Analysis. J. Aging Phys. Act. 2025, 1–16. [Google Scholar] [CrossRef] [PubMed]
  57. Lindström, M. Social capital, desire to increase physical activity and leisure-time physical activity: A population-based study. Public Health 2011, 125, 442–447. [Google Scholar] [CrossRef]
  58. Kim, J.-R.; Jeong, B.; Park, K.-S.; Kang, Y.-S. Association of social capital at the individual level with physical activity in communities with high mortality in Korea. Health Promot. Int. 2017, 32, 850–859. [Google Scholar] [CrossRef]
  59. Fu, C.; Wang, C.; Yang, F.; Cui, D.; Wang, Q.; Mao, Z. Association between social capital and physical activity among community-dwelling elderly in Wuhan, China. Int. J. Gerontol. 2018, 12, 155–159. [Google Scholar] [CrossRef]
  60. Islam, M.K.; Merlo, J.; Kawachi, I.; Lindström, M.; Gerdtham, U.G. Social capital and health: Does egalitarianism matter? A literature review. Int. J. Equity Health 2006, 5, 3. [Google Scholar] [CrossRef]
  61. Liu, P.; Qin, Y.; Luo, Y.; Wang, X.; Guo, X. Structure of low-carbon economy spatial correlation network in urban agglomeration. J. Clean. Prod. 2023, 394, 136359. [Google Scholar] [CrossRef]
  62. Liang, Z.; Chen, J.; Jiang, D.; Sun, Y. Assessment of the spatial association network of green innovation: Role of energy resources in green recovery. Resour. Policy 2022, 79, 103072. [Google Scholar] [CrossRef]
  63. Chase, A.S.Z. Reconstructing and testing neighborhoods at the Maya city of Caracol, Belize. J. Anthropol. Archaeol. 2023, 70, 101514. [Google Scholar] [CrossRef]
  64. Kamp-Whittaker, A. Social networks and community features: Identifying neighborhoods in a WWII Japanese American incarceration center. J. Anthropol. Archaeol. 2023, 70, 101507. [Google Scholar] [CrossRef]
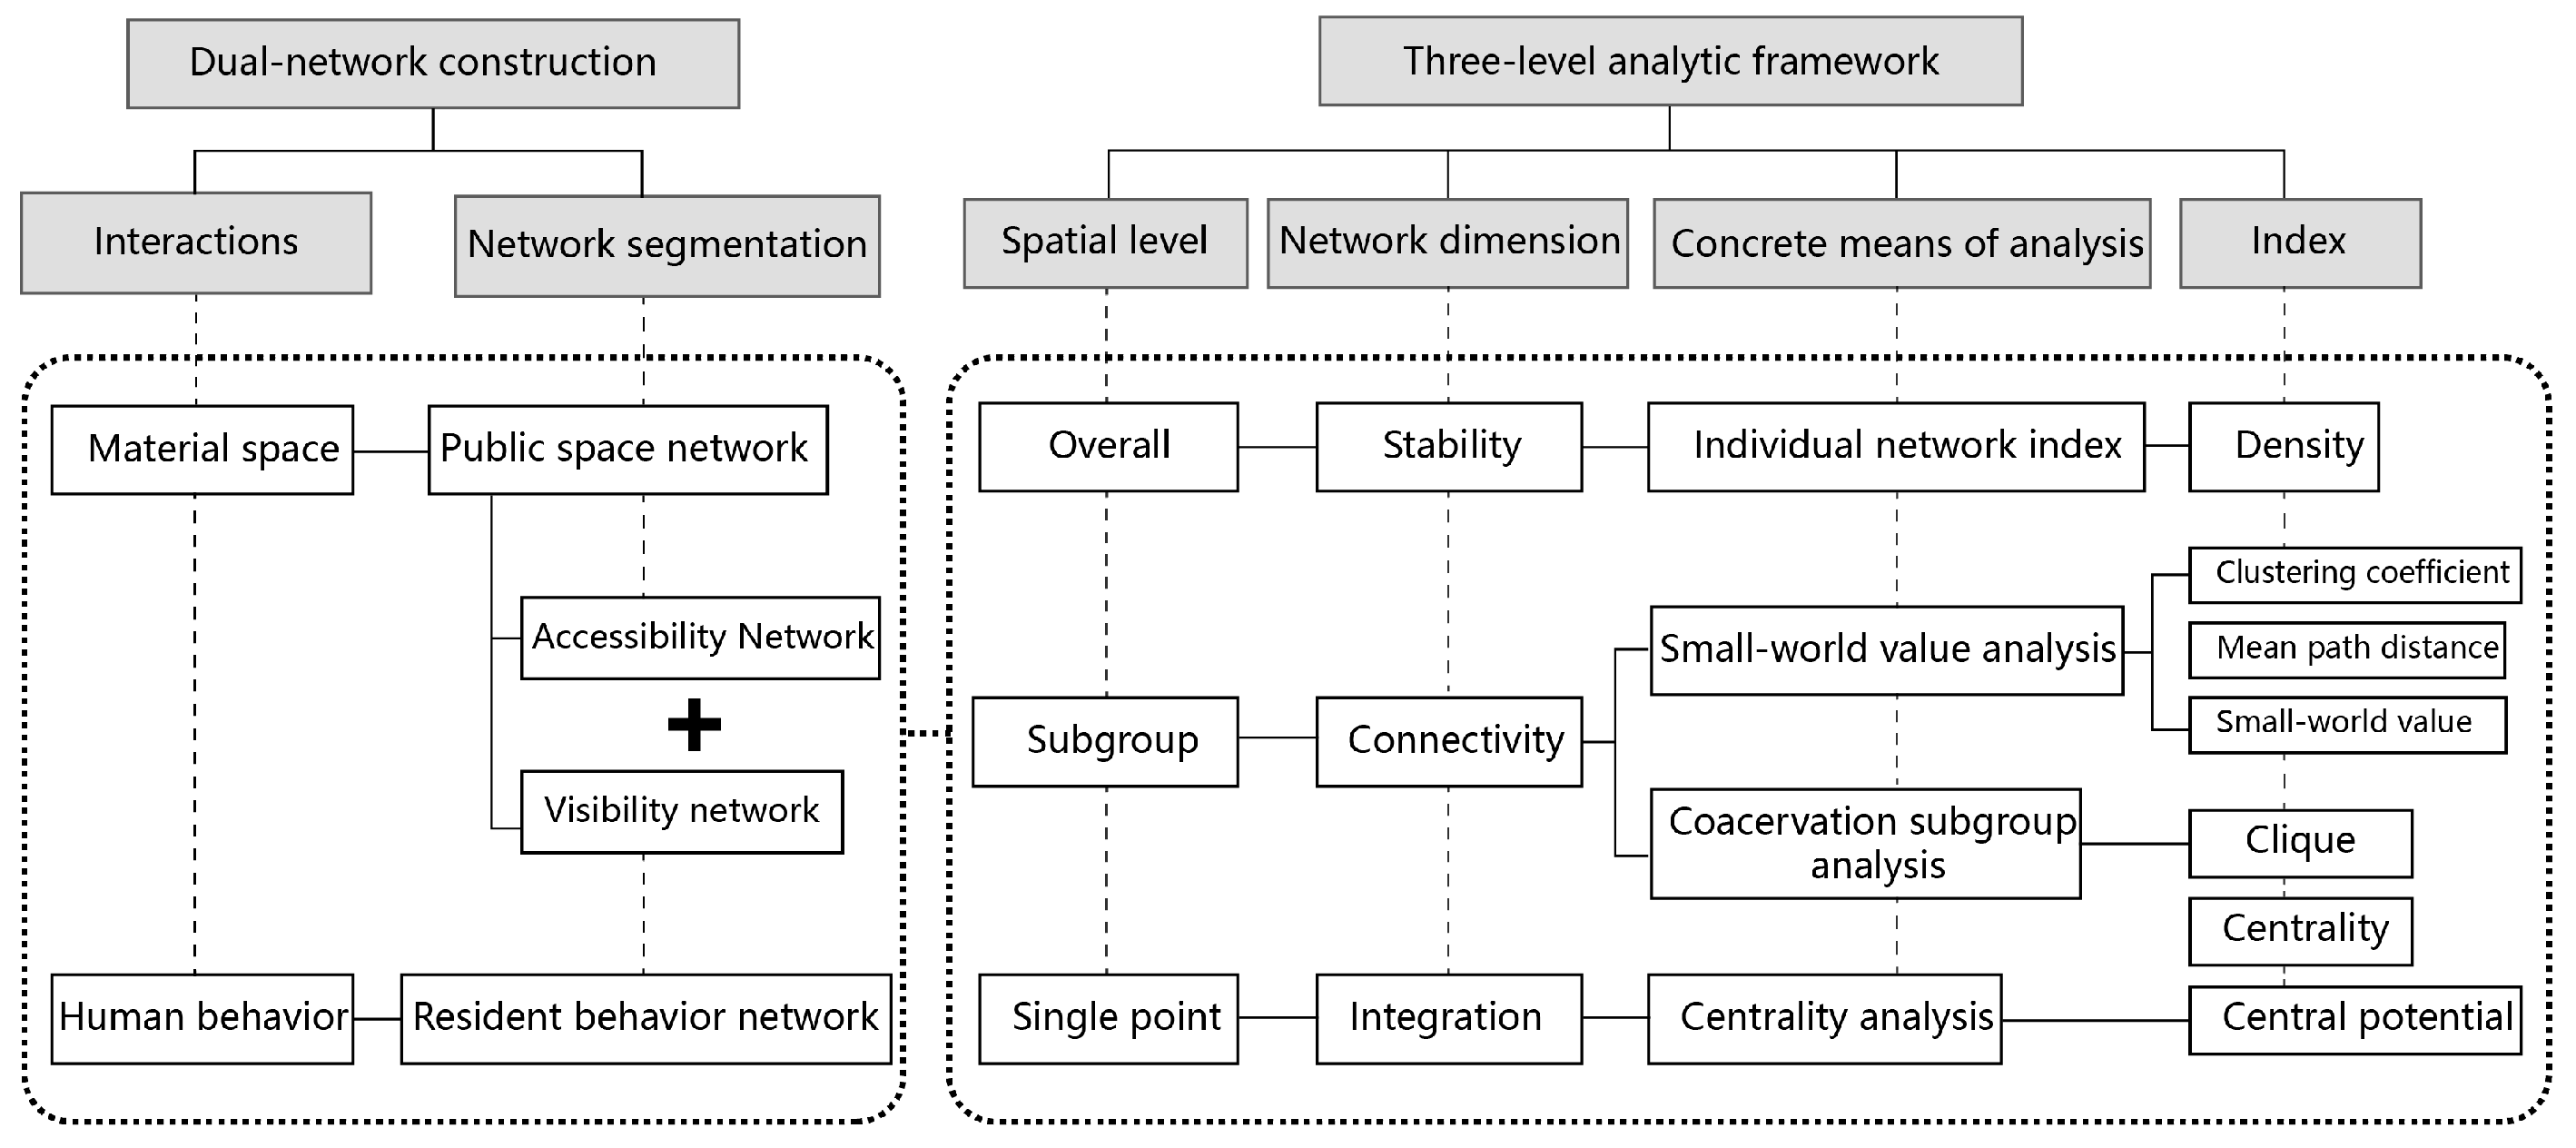
Figure 1. Dual-network three-level research framework diagram.
Buildings 15 01473 g001
Figure 2. Locations of the Cangxia community.
Buildings 15 01473 g002
Figure 3. Na1 network model.
Buildings 15 01473 g003
Figure 4. Na2 network model.
Buildings 15 01473 g004
Figure 5. Nb network model.
Buildings 15 01473 g005
Figure 6. Plane distribution of Na1 blocks.
Buildings 15 01473 g006
Figure 7. Plane distribution of Na2 blocks.
Buildings 15 01473 g007
Figure 8. Plane distribution of Nb blocks.
Buildings 15 01473 g008
Table 1. Definition of evaluation indicators and calculation formula table.
Network DimensionEvaluation IndexCalculation FormulaFormula Specification
OverallDensity P = 2 m / n n 1 P is the network density, m is the actual number of connections, and n is the actual number of nodes.
Subgroup Clustering coefficient C = C x / n Cx is the number of connections that actually exist in these y nodes, and n is the number of nodes in the network.
Average path length L = d ab / 1 / 2 * n * n 1 a b The shortest path distance between nodes a and b is dab, n represents the number of nodes, and L represents the average path length.
Small-world
value
σ = C / C r L / L r C is the average aggregation coefficient of the network, Cr is the aggregation coefficient of a random network of the same size, L is the average shortest path length of the network, and Lr is the shortest path length of a random network of the same size.
Block
model
r i j = x k i x i ¯ x k j x j ¯ + x i k x i ¯ x j k x j ¯ x k i x i ¯ 2 + x i k + x i ¯ 2 x k j x j ¯ 2 + x j k x j ¯ x k j x j ¯ 2 x i ¯   is   the   average   number   of   relationships   pointing   to   node   I ,     x j ¯ is the average number of relations directed to node j, and k is the number of nodes in the entire network.
Single pointNode
degree
C D n i = d n i d(ni) Indicates the number of nodes that directly generate a line segment connected to the node, n indicates the total number of nodes in the entire network.
Intermediate
centrality
CABi = ΣnΣn b (i), jki, j < kCABi is the middle centrality of the network. b is the probability that node i is on the shortest path between node j and node k, and n is the number of nodes.
Intermediate central potentialCB =Σ (CRB maxCRB i) /n − 1n represents the number of nodes, CB represents the center potential of the middle of the network, CRB i represents the centrality of the node relative to the middle, and CRB max represents the maximum centrality of the node relative to the middle.
Table 2. Na1 network metrics evaluation results.
Network DimensionEvaluation IndexNumerical Result
IntegrationNode degreeIn Table 6
Intermediate centralityIn Table 7
Intermediate central potential0.5549
ConnectivityClustering coefficient0.715
Average path length1.933
Small-world value1.239
Block modelIn Figure 6
StabilityDensity0.305
Table 3. Na2 network metrics evaluation results.
Network DimensionEvaluation IndexNumerical Result
IntegrationNode degreeIn Table 6
Intermediate centralityIn Table 7
Intermediate central potential0.4615
ConnectivityClustering coefficient0.61
Average path length1.615
Small-world value1.266
Block modelIn Figure 7
StabilityDensity0.314
Table 4. Nb network metrics evaluation results.
Network DimensionEvaluation IndexNumerical Result
IntegrationNode degreeIn Table 6
Intermediate centralityIn Table 7
Intermediate central potential0.4945
ConnectivityClustering coefficient0.851
Average path length1.438
Small-world value1.983
Block modelIn Figure 8
StabilityDensity0.562
Table 5. Comparison of dual-network small-world characteristic parameters.
Mean Shortest PathClustering CoefficientSmall-World ValueIs Not Small World Characteristic
Nb network1.4380.8511.983 Yes
Na1 network 1.9330.7151.239 No
Na2 network1.6150.6101.266 No
100 random networks1.5950.476/
Table 6. Comparison of dual network node degree.
Spatial NodesNbNa1Na2
Node 15 141110
Node 11 1357
Node 3 1143
Node 71154
Node 4 1054
Node 12 1047
Node 6 933
Node 10936
Node 8 833
Node 5634
Node 2 565
Node 13 530
Node 9 336
Node 14 310
Node 1 154
Average7.8674.2674.4
Table 7. Comparison of dual networks intermediate centrality.
Spatial NodesNbNa1Na2
Node 15 22.96753.09517.917
Node 11 9.9675.6195.75
Node 3 4.4673.3332.167
Node 7 2.9675.6190.667
Node 12 2.8332.4767.333
Node 4 1.814.2862.833
Node 10 0.504.667
Node 6 0.500
Node 14 000
Node 13 000
Node 9 003.833
Node 8 02.1430
Node 5 000.25
Node 2 09.4291.5
Node 1 021.083
Average3.0676.5333.200
Disclaimer/Publisher’s Note: The statements, opinions and data contained in all publications are solely those of the individual author(s) and contributor(s) and not of MDPI and/or the editor(s). MDPI and/or the editor(s) disclaim responsibility for any injury to people or property resulting from any ideas, methods, instructions or products referred to in the content.