1. Introduction
The construction industry is an integral component of global economies, contributing significantly to the global gross domestic product (GDP). By 2030, the industry is expected to be worth approximately USD 15 trillion, accounting for 13.5% of the global GDP [
1]. In Qatar, the construction sector has experienced considerable growth, becoming a vital part of the nation’s economy. In 2015, the sector was responsible for 5.1% of the country’s GDP, making it the third-largest contributor [
2]. The sector began expanding around 2000 and peaked in 2014. Despite a gradual decline from 2017 to 2019 due to the completion of many major infrastructure projects, it is projected to experience 3% annual growth between 2024 and 2027 [
3], with a compound growth rate of 10.5% from 2021 to 2026 [
4].
The COVID-19 pandemic of 2020 and 2021 caused a slowdown in the industry, delaying the launch of new projects and hindering progress on ongoing developments. Growth in Qatar’s construction industry is also closely linked to developments in the North Field Expansion project, which is expected to further stimulate the sector [
5].
The key factors of project management include time, cost, and scope, commonly known as the “Project Management Triangle” [
6]. Cost is often considered the most important factor, especially in the early stages of a project, where estimation helps determine the project’s feasibility; thus, effective cost management is critical to construction project success. Materials account for a large portion of construction costs, ranging from 30% to 70% of the total project budget [
7]. Studies have revealed that in some cases, material costs can exceed 55% of total project expenditures [
8].
Price fluctuations in construction materials constitute a common challenge worldwide and are among the leading causes of cost overruns. For instance, a study in Malaysia found that material price instability was the leading factor contributing to cost increases in construction projects [
9]. In Oman, rising material costs have led to delays and cost overruns in both public and private projects [
10]. Similarly, research from India, Botswana, Egypt, and Nigeria has underscored the role that material price fluctuations play a role in construction costs [
11,
12,
13].
In Qatar, material price instability remains a significant issue, with fluctuations driven by a variety of local, regional, and global factors. Bitumen prices have recently surged after temporary disruptions in supply chains, and diesel and steel prices have also been subject to volatility in recent years. Despite price adjustment clauses in many construction contracts, there is no established index for monitoring and managing material price fluctuations in Qatar, making it difficult to predict and mitigate these changes [
14].
While prior research had linked cost overruns and delays in Qatar’s construction projects to material scarcity and price volatility, the underlying causes of such volatility remained unexplored. This study investigated these drivers to fill this critical gap.
Understanding the drivers of construction material price volatility is critical for Qatar’s construction sector, where supply chain vulnerabilities and market uncertainties significantly impact project delivery. This study systematically investigated the key factors influencing price fluctuations through Generalized Structured Component Analysis (GSCA). These evidence-based insights will empower policymakers to refine import policies, contractors to optimize procurement strategies, and developers to enhance budget contingency planning, ultimately strengthening Qatar’s construction resilience.
2. Literature Review
Numerous studies have explored the factors driving the volatility of construction material prices. This review focuses on research linking such fluctuations to supply–demand imbalances, technological limitations, and economic pressures. These studies provided a broad understanding of the key issues involved in pricing volatility across diverse regions.
The Dedoose (SocioCultural Research Consultants, LLC, 2022) tool was used to analyze 25 research studies, focusing on the determinants of construction material prices. Journal articles comprised 76% of the reviewed literature while conference proceedings comprised 24%. Regarding the studies’ geographical distributions, 60% were conducted in Africa (with the majority in Nigeria) and 28% in Asia, with notable contributions from Malaysia, China, and India.
In terms of research methodology, 88% of the reviewed studies employed quantitative methods, with others using qualitative or mixed methods. The most frequently studied factors influencing material price fluctuations were exchange rates (11%), fiscal policy and interest rates (10% each), inflation (10%), and supply–demand imbalances (9%). Other contributors included transportation costs, fuel and energy costs (8% each), and raw material scarcity (6%).
A quantitative study was conducted in Adanawa State, Nigeria, focusing on material price fluctuations from 2014 to 2016 [
15]. The researchers identified key factors such as high exchange rates, transportation costs, and petrol prices as the primary drivers of price instability. A sample size of 210 respondents, comprising private residential owners, building professionals, and suppliers, highlighted the broad impacts of these factors on real estate and the economy. Similarly, a study of price volatility was conducted in Aboja, Nigeria, identifying 17 factors, with inflation, crude oil prices, and high import duties being the most influential [
16].
Adegbembo and Adeniyi focused on macroeconomic indicators such as inflation, exchange rates, and interest rates in Nigeria. Their results indicate a positive correlation between these variables and material price fluctuations [
17]. Similarly, Oladipo and Oni found that inflation and exchange rates had the most significant influence on construction materials in Nigeria [
18]. Musarat et al. further confirmed inflation’s impact on material prices in Pakistan, finding strong correlations between inflation and the prices of cement, steel, sand, and other materials. Their study recommended the use of strategic approaches for managing inflation rates to stabilize construction costs [
19].
In the Malaysian context, Samsir et al. examined price fluctuations in Johor, concluding that inflation plays a critical role in determining material costs, alongside interest rates and energy costs. Their analysis demonstrated a strong correlation between these factors and the price volatility of construction materials [
20].
In South Africa, Windapo and Cattell identified eight factors that influence material prices, including transportation, energy costs, and raw material availability. Their study revealed that rising transportation and fuel costs, alongside labor expenses, significantly impact material prices [
21].
Lastly, the study by Abdel-Wahab et al. in Egypt showed that exchange rates, raw material shortages, and supplier monopolies are the most significant contributors to construction cost overruns [
12].
The underlying causes of this volatility had not been examined, despite prior research linking material scarcity and price fluctuations to cost overruns and delays in Qatar’s construction projects. This study investigated these drivers in order to close this important gap. While many factors affect construction material prices, this paper compiles only the relevant factors pertaining to the Qatari construction industry and the views of local industry professionals.
Table 1 lists the identified factors and the corresponding references.
3. Data Collection and Research Methodology
The research process followed a systematic approach, beginning with the identification of the core research problem and concluding with a detailed analysis of the results. The field of study chosen for this research was construction material price volatility, a topic that has gained increasing relevance due to market fluctuations and their impact on the construction industry.
Following identification of the problem, an extensive literature review was conducted. The aim was to analyze existing studies, reports, and academic articles discussing construction material prices and the variables that affect them. The literature review played a crucial role in forming the study’s theoretical framework as the factors influencing material price volatility were identified through the review process. These factors were systematically grouped into three broad categories based on their nature and impact. This classification was instrumental in designing the next stage of the research: data collection.
A survey was then developed to capture industry professionals’ perspectives and perceptions regarding the identified factors. The survey was distributed exclusively among industry professionals, encompassing a diverse range of roles, including manufacturers, suppliers, consultants, contractors, and clients, and it was structured to ensure that respondents could provide feedback on the probability and potential impact of each identified factor.
Once the survey data were collected, they was subjected to a thorough analysis using both descriptive statistical methods and Generalized Structured Component Analysis (GCSA). The descriptive analysis provided an overview of the data, highlighting general trends and patterns. Meanwhile, GCSA was employed to delve deeper into the relationships between the identified factors, offering a more comprehensive understanding of the dynamics at play.
Generalized Structured Component Analysis (GSCA) is a component-based structural equation modeling technique that offers robust analysis of complex relationships between observed and latent variables. GSCA accommodates both reflective and formative measurement models while requiring smaller sample sizes and fewer distributional assumptions [
39]. The method employs alternating least squares optimization to estimate (1) component weights for latent constructs, (2) path coefficients for structural relationships, and (3) fit indices (FIT/AFIT) for model evaluation.
GSCA offers significant advantages for studies with smaller sample sizes and non-normal data distributions, and is designed to yield robust outcomes even when the number of observations is limited. In addition, GSCA does not rely on the assumption of multivariate normality; this makes it a more adaptable approach for analyzing various types of data, including those with skewed or non-normally distributed characteristics [
39]. This adaptability makes GSCA particularly useful for exploratory research, especially when the data do not fulfill the assumptions typically required for SEM [
40]. Additionally, as GSCA approximates latent variables through weighted composites of observed variables, it can represent abstract concepts without the strict assumptions of SEM.
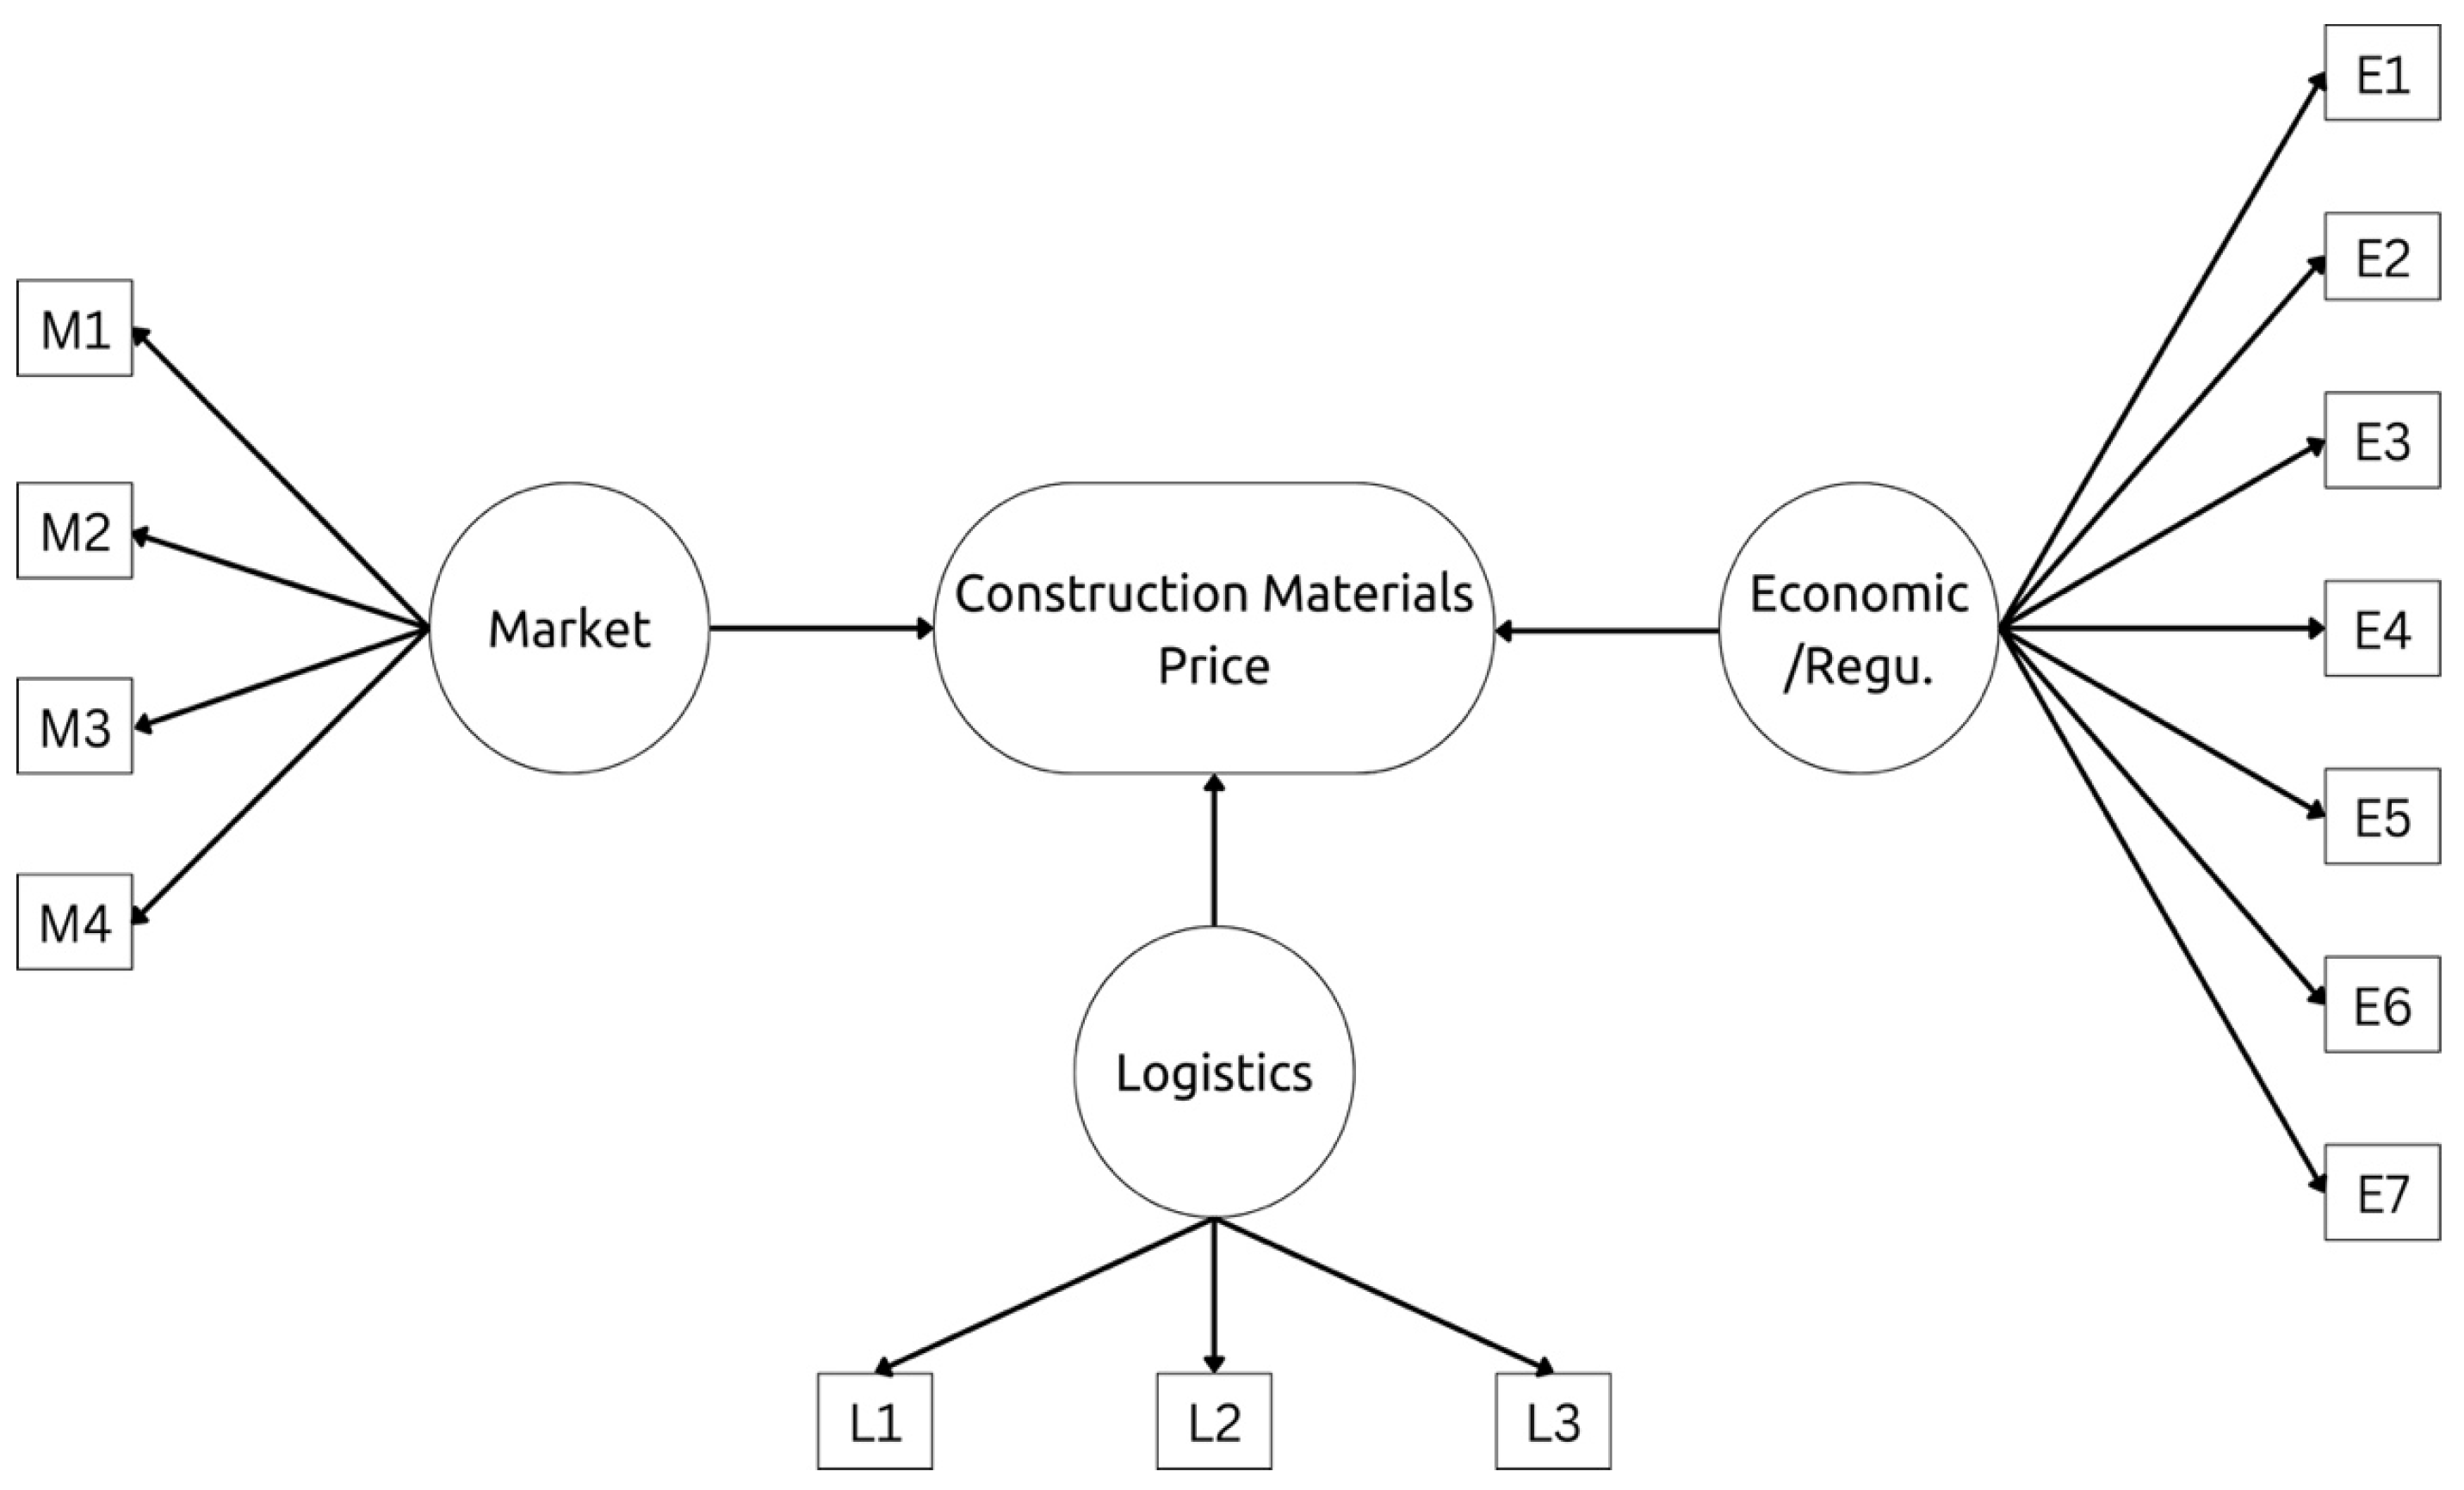
It was assumed that the factors derived from the literature review exhibited a positive impact on their respective categories/constructs. These three constructs, in turn, had a positive influence on unforeseen conditions affecting the construction material prices in Qatar, as shown in
Figure 1. The following hypotheses were thus formulated:
Hypothesis I. Market factors have a positive impact on construction material prices in Qatar.
Hypothesis II. Logistic factors have a positive impact on construction material prices in Qatar.
Hypothesis III. Economic and regulatory factors have a positive impact on construction material prices in Qatar.
The online questionnaire was developed using Google Forms, which provided the option to customize the questionnaire according to the needs of the data analysis.
The data collection period of the questionnaire took almost four months. The total number of completed responses was 207, of which 195 were found to be responsive and acceptable. The demographics of the sample are presented in the following sections.
3.1. Sample Size
To ensure sufficient confidence in the results, the minimum acceptable sample size was set to 100 survey respondents. This threshold was higher than the minimum sample size required for GSCA, which can effectively be applied to smaller samples, even as low as 50 respondents [
39]. G*Power 3.1 was also used to calculate the sample size with the setting, as in [
41]. The total required sample size was 77.
3.2. Respondent Profiles
The first part of the survey collected general information about the respondents’ profiles, including their organization, position, years of experience, area of expertise, and specialization. This categorization of the respondents facilitated the comparison of various groups during the data analysis.
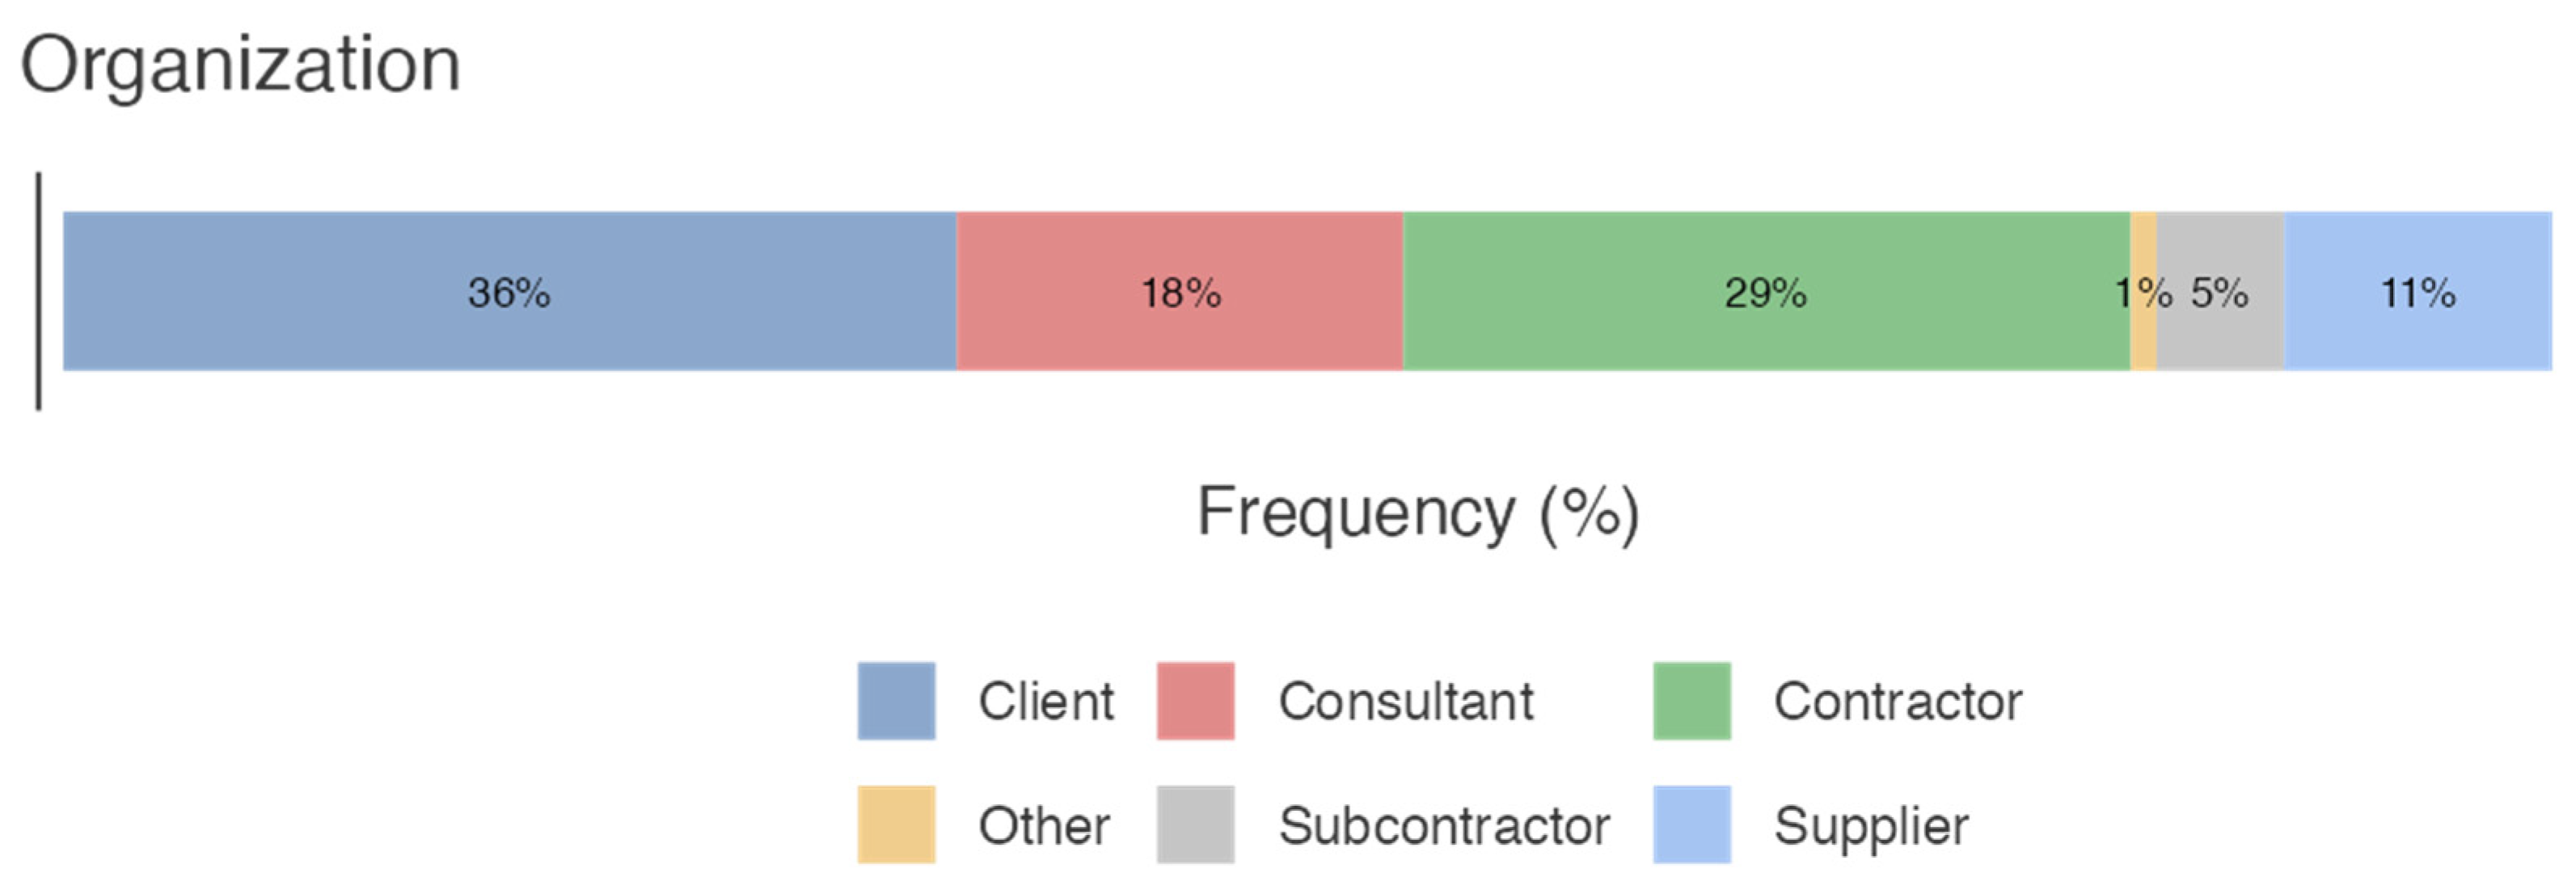
In terms of organizational distribution, clients represented the largest portion at 36% of the respondents, followed by contractors at 29.0%, consultants at 18%, suppliers at 11%, subcontractors at 5%, and others at 1%, as shown in
Figure 2.
In terms of the positions held by the respondents, the data showed a diverse range. The most common positions, as shown in
Figure 3, were of a senior engineer at 25% and engineer or supervisor at 17%. Other positions included department managers, executive managers, quantity surveyors, project managers, and a category labeled “other.”
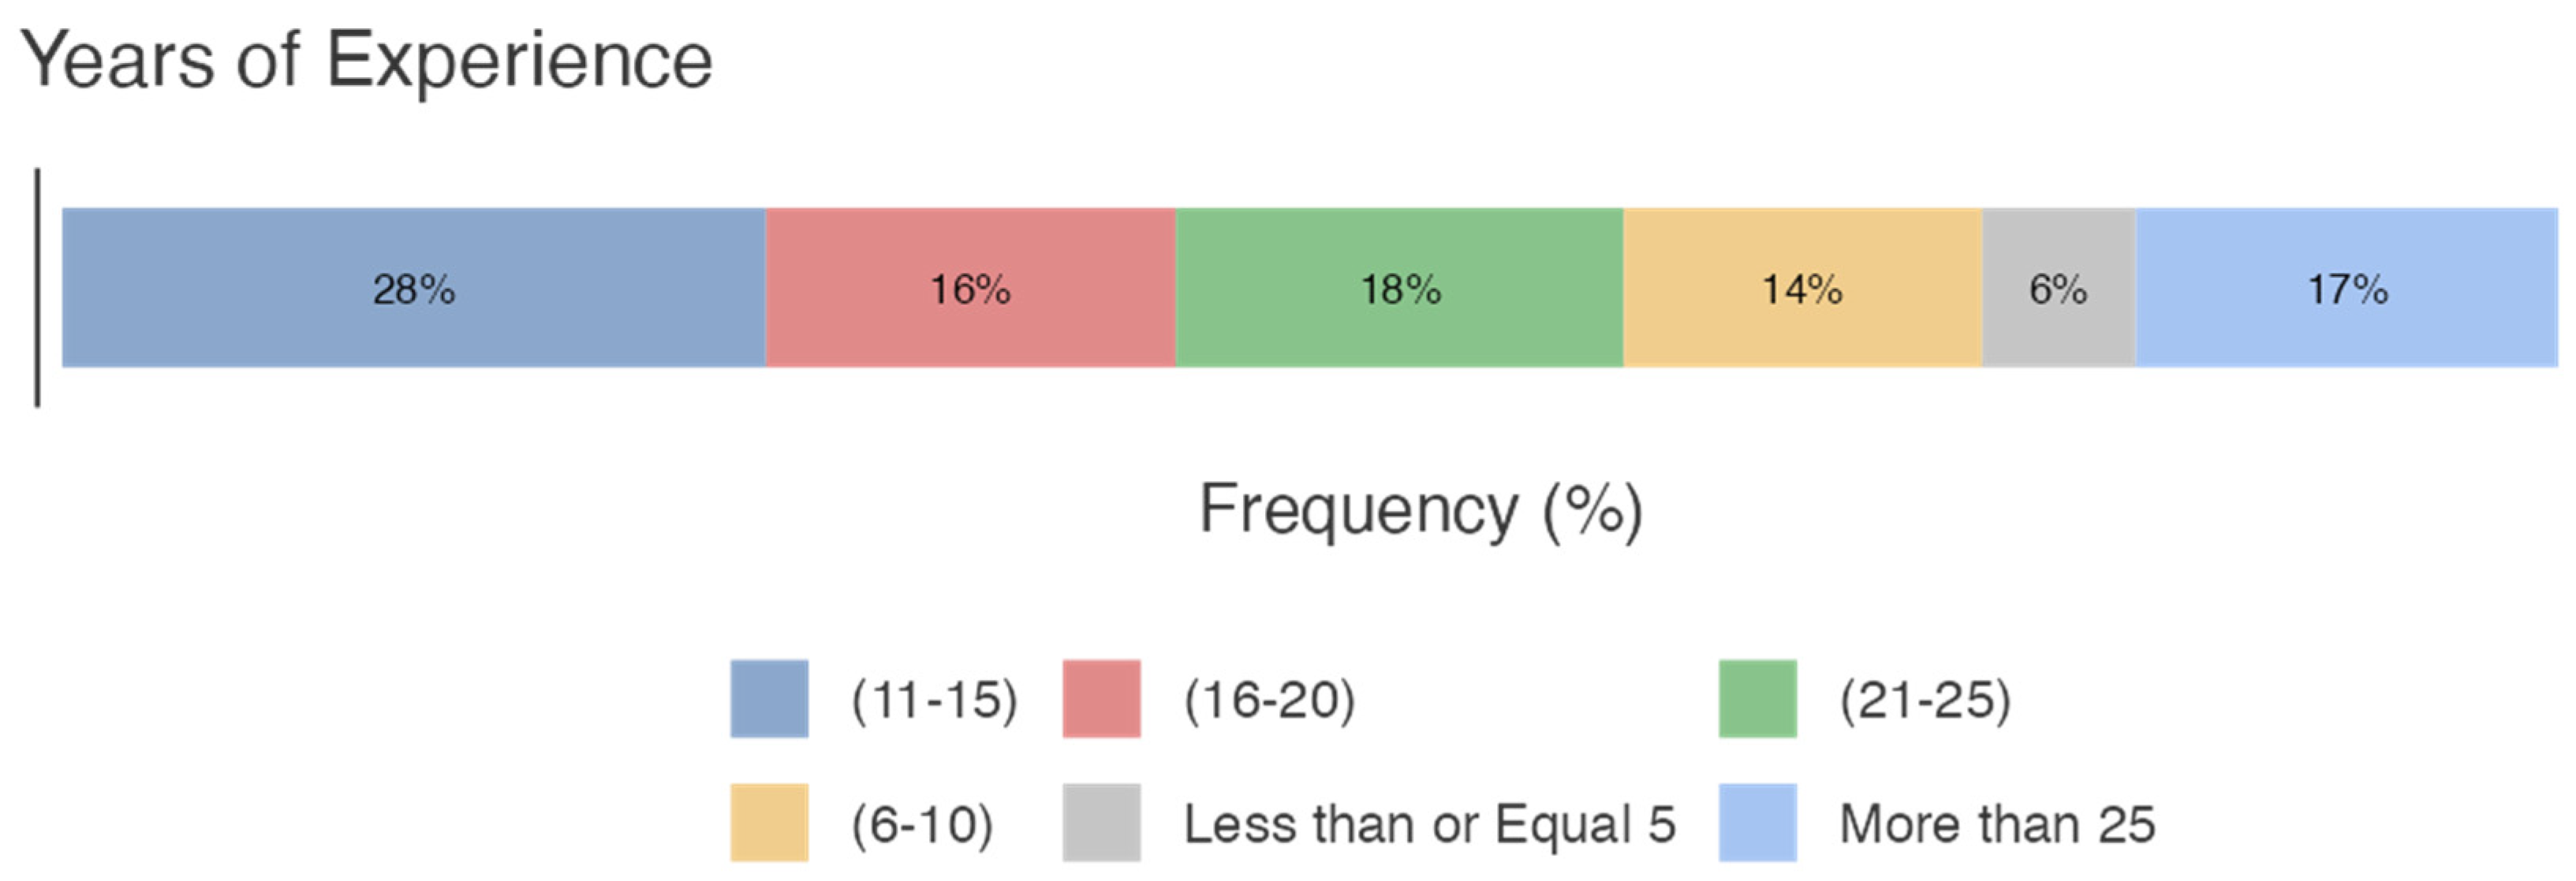
The respondents also varied in terms of their years of experience. The largest group comprised individuals with between 11 and 15 years of experience, accounting for 28% of the sample. Respondents with five or fewer years of experience equated to only 6% of the surveyed individuals. There was also a relatively even distribution of respondents across different experience levels, ranging from six years to more than twenty-five years, as depicted in
Figure 4.
The respondents’ areas of expertise were categorized into various fields within the construction industry, as detailed in
Figure 5. The most common area of expertise was contracts and procurement, accounting for 28% of the respondents. Other areas included project management, engineering and design, project control, quality control, construction supervision, site execution, and a category labeled “other.”
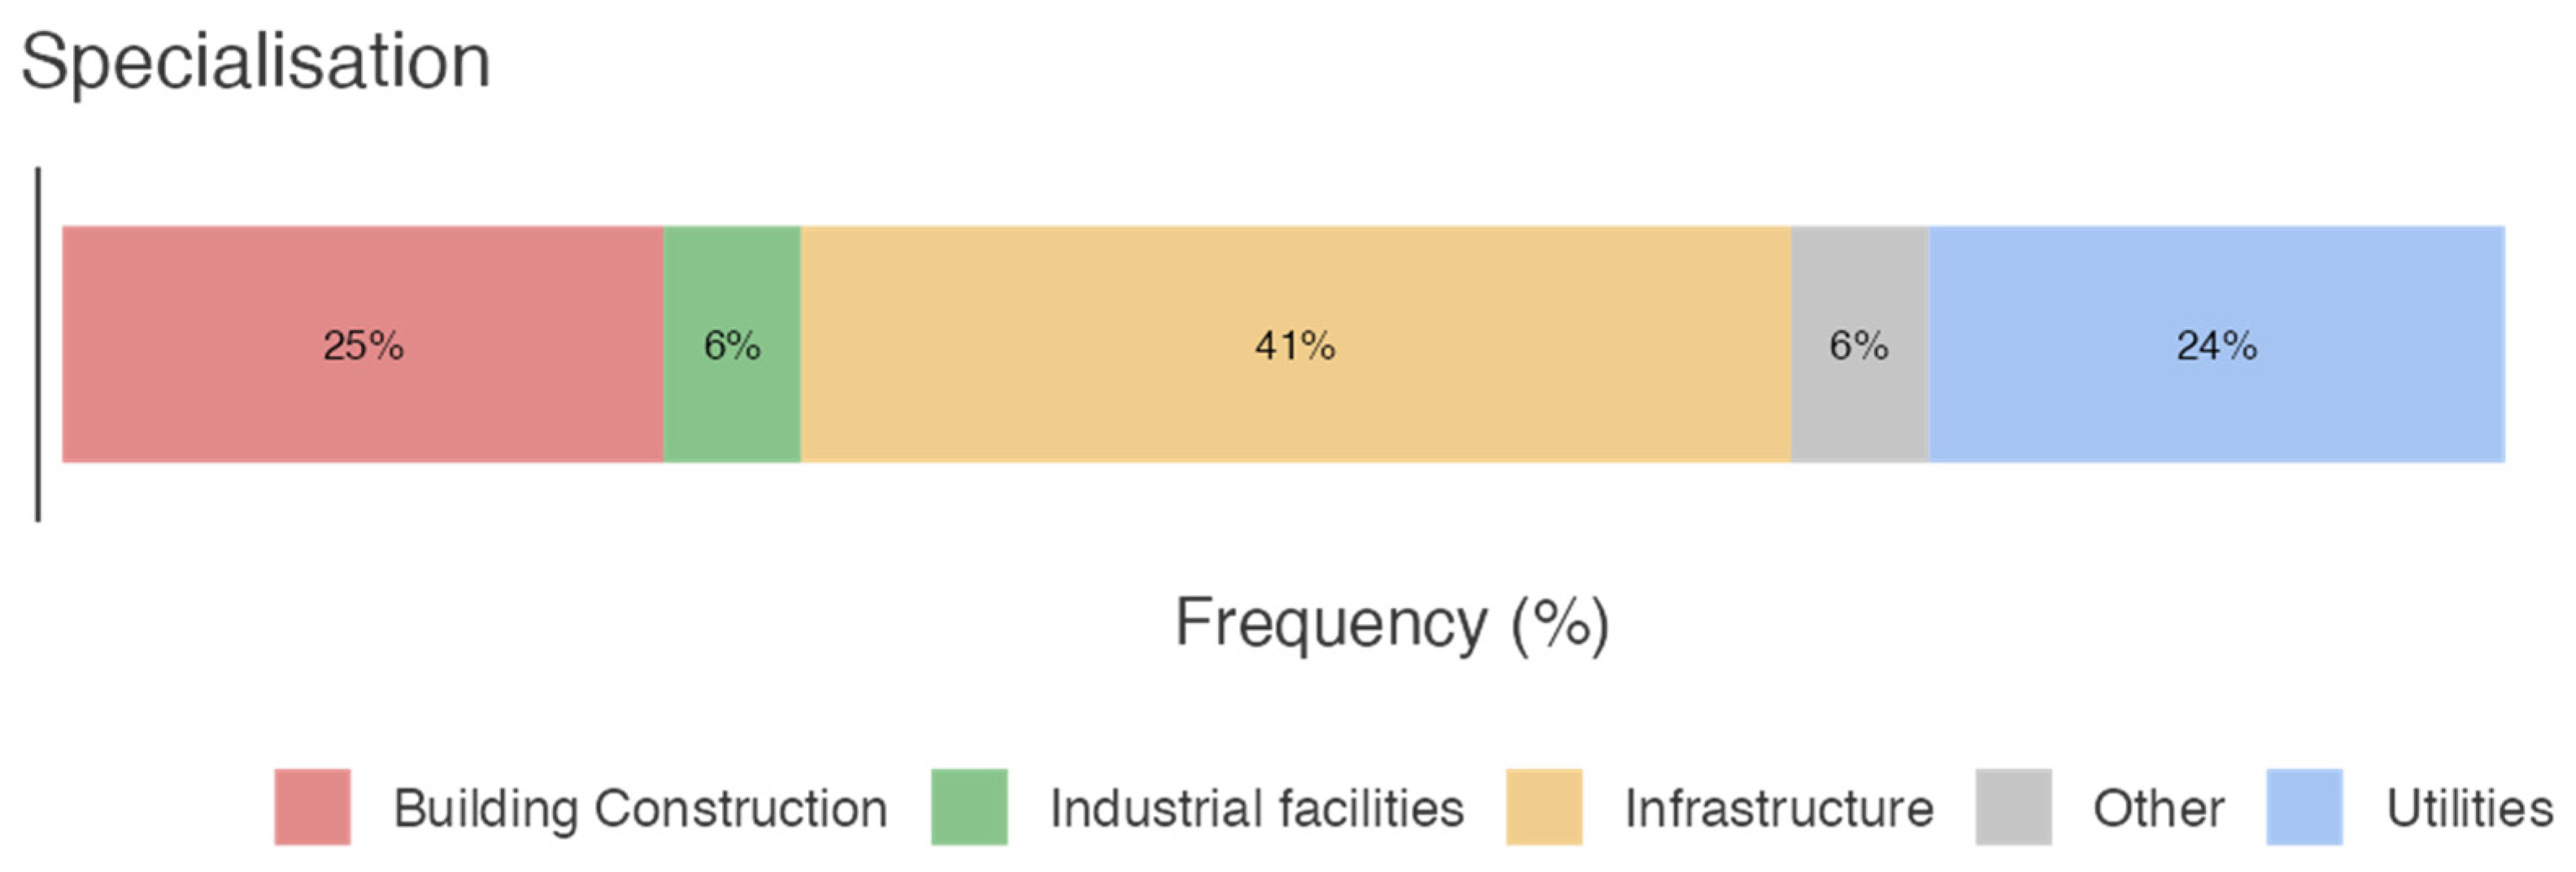
Lastly, the respondents’ specializations within the construction industry are presented in
Figure 6. Most respondents specialized in infrastructure, representing 41% of the total, while 25% and 24% of the respondents specialized in building construction and utilities, respectively. The remainder of the respondents specialized equally in industrial facilities and a category labeled “other.”
These characteristics provide an overview of the composition of the respondents in terms of their organizational affiliation, position, experience level, area of expertise, and specialization within the construction industry, as shown in
Table 2.
3.3. Analysis of Factors
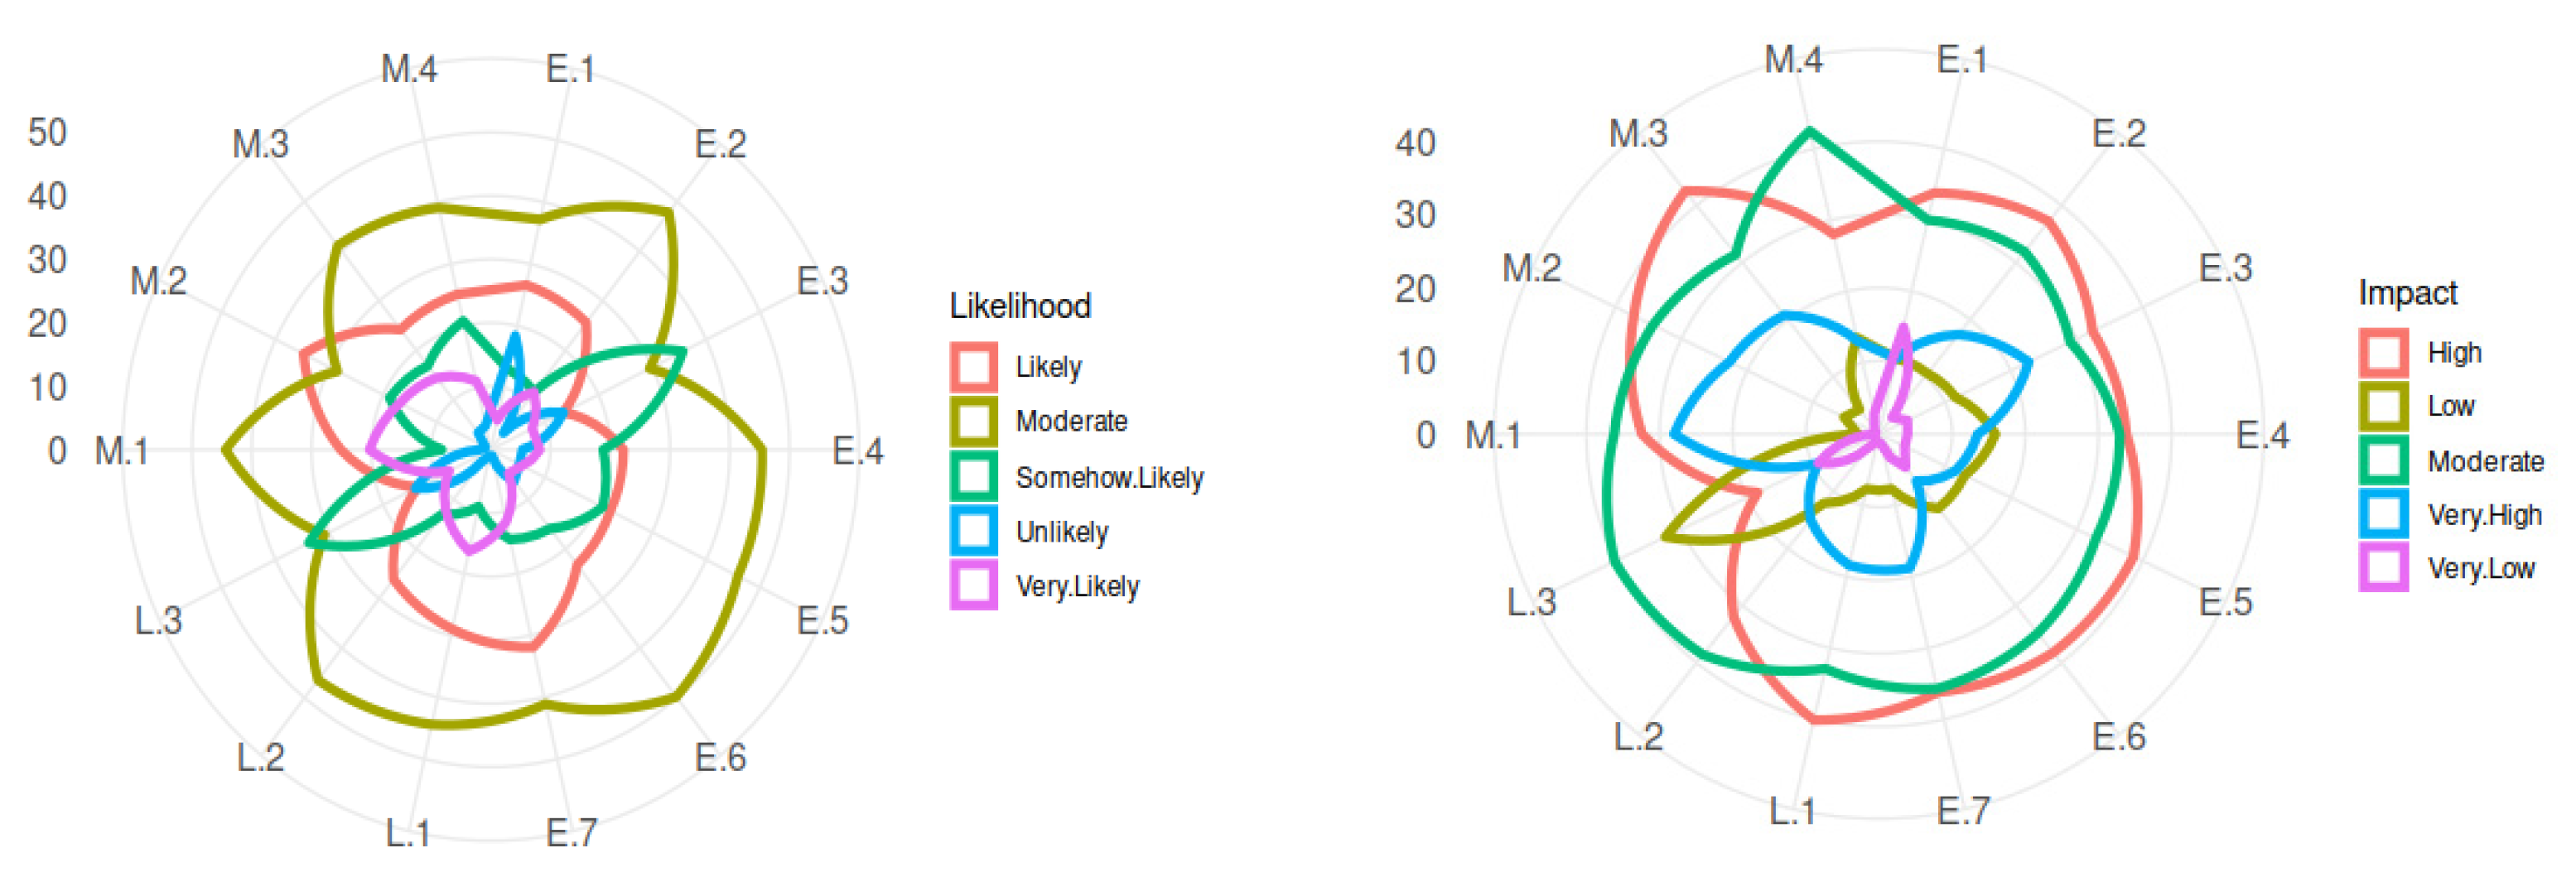
The participants were asked to rate each factor and category’s probability of occurrence and potential impact on a five-point Likert scale.
The likelihood was broken down thus—1. UN: Unlikely, 2. SL: Somehow Unlikely, 3. ML: Moderate, 4. L: Likely, and 5. VL: Very Likely. The potential impact was broken down thus—1. VL: Very Low, 2. L: Low, 3. Medium, 4. H: High, and 5. VH: Very High.
Table 3 shows the respondents’ ratings of the likelihood and potential impact of the Market factors. M.1 [Imbalance between supply and demand] scored 44.4% for moderate likelihood, and M.4 [Low level of technology used for production] was the second highest response at 41.1% for moderate likelihood. In terms of impact, M.3 [Scarcity of raw material] had the highest response with 42.2% for high impact, and M.4 [Low level of technology] scored the same percentage for medium impact.
The respondents’ ratings of Logistics factors are shown in
Table 4. L.2 [Increase in fuel and energy costs] had the highest response at 46.4% for moderate likelihood, followed by L.1 [Increase in transportation costs] by 44.4% for moderate likelihood. L.1 and L.3 [Inadequate infrastructure facilities] scored 40.1% for high and medium impact, respectively.
For the Economic and Regulatory factors,
Table 5 shows that E.6 [Government fiscal policy on interest rates] scored 49.8% for moderate likelihood, followed by E.2 [Increase in inflation rates] with 47.8%. On the other hand, ratings for impact were quite similar and mostly for medium and high impacts. E.5 [Changes in government policies and legislation] scored 38.6% for high impact, followed by E.6 with 38.2%.
Figure 7 summarizes the likelihood of occurrence and the potential impact for all the factors using radar charts.
The participants were also asked to rank the potential impact of each category. The results are shown in
Table 6.
4. Data Analysis
The GSCA method was used to analyze the data obtained from the respondents. GSCA is a versatile multivariate statistical technique used to analyze complex structural relationships among variables. Unlike traditional methods, GSCA simultaneously evaluates measurement models, which link observed factors to latent variables, and structural models, which define relationships between these latent variables. Additionally, GSCA assesses the overall model fit, ensuring a comprehensive understanding of the data [
40].
The GSCA model evaluation was conducted in three stages:
Evaluation of the measurement model (outer model);
Evaluation of the structural model (inner model);
Overall model evaluation (goodness of fit).
4.1. Normality Assessment
Table 7 lists the skewness and kurtosis of each factor. For each factor, skewness lay within the range of −1 and 1, which was excellent; a value of 2 was generally considered acceptable. Meanwhile, kurtosis was also considered normal for each factor, falling within the range of −2 to 2. Values closer to 0 for both skewness and kurtosis were better and were considered to show a normal distribution [
42].
4.2. Evaluation of the Measurement Model (Outer Model)
This stage consisted of testing the relationship between the factors and the latent variables using the following methods:
4.2.1. Convergent Validity
This test was intended to check the estimated loading values of each factor. The loadings had to exceed 0.5, as established by previous studies [
43]. The results in
Table 8 show that all factors had a loading above 0.5, confirming validity. The critical ratio was a measure for assessing the significance of factor loading within each construct, and it was calculated as the estimate (loading) divided by its standard error.
All the factors under the Market construct had a significant effect. However, M2 [Shortage of locally manufactured/available materials] was the dominant factor, with a loading of 0.849 and a critical ratio of 37.3.
L1 [Increase in transportation costs] and L2 [Increase in fuel and energy costs] had almost the same loading, and the critical ratio of L1 and L2 was the highest, indicating its determining effect within the construct. L3 [Inadequate infrastructure facilities] had a much lower loading of 0.691 and a critical ratio of 12, which suggests that this factor was less significant within the construct.
E3 [Force majeure] had the weakest association while E6 [Government fiscal policy on interest rates] was the most influential factor within the Economic and Regulatory construct. Within this construct, Logistics Impact had the highest loading.
4.2.2. Convergent Reliability
Convergent reliability refers to the degree to which multiple factors of a specific construct share a high proportion of variance, demonstrating that they consistently represent the same underlying concept. This ensures the internal consistency of the construct, typically assessed using measures such as composite reliability (rho), Cronbach’s alpha, and proportion of variance explained (PVE). Alpha and rho values of 0.7 or higher and a PVE value of 0.5 or higher are generally considered to indicate good convergent reliability, signifying that the construct reliably explains more than half of the variance of its factors. The alpha, rho, and PVE values of the model are presented in
Table 9.
As shown above, the alpha, rho, and PVE values of each latent variable met or exceeded the criteria; hence, the variables used were reliable.
4.2.3. Discriminant Validity
Three tests were conducted to verify the validity of the latent variables.
Table 10 shows that each latent variable had a positive relation with the rest of the variables. Additionally, the value of √AVE for each latent variable exceeded the correlation value of the remainder latent variables. Therefore, the discriminant validity was found to be satisfactory.
4.3. Evaluation of the Structural Model (Inner Model)
The structural model was assessed by examining collinearity (VIF), estimated parameter coefficients, and the model’s R-square value. The purpose of evaluating a structural model is to understand the relationships between the constructs (latent variables).
The variance inflation factor (VIF) was used to reveal any multicollinearity in the model. The ideal value is <3, and a VIF value of between 3 and 5 indicates possible collinearity issues [
44]. As shown in
Table 11, the VIFs in this study were all below 3; hence, collinearity was not a significant issue.
Path coefficient is the significance of the impact between the constructs, which was assessed by examining the t-value (T-statistics), as shown in
Table 12. According to [
45], it is acceptable if the t-values of a two-tailed test are above 1.65 (significance level = 10%), 1.96 (significance level = 5%), and 2.58 (significance level = 1%).
The results in
Table 11 indicate that Market factors had no significant impact on construction material prices. However, Logistics factors had a medium impact, and Economic and Regulatory factors had the highest impact.
Hypothesis I is rejected as the Market score t-value was 0.099, which was lower than the critical value of 1.96. Hypotheses II and III are accepted as both Logistics and Economic and Regulatory factors had a positive influence on construction material prices, with t-values higher than the critical value of 1.96.
The overall effect weight of the factors was calculated by multiplying the factor’s outer loading by the construct path coefficient. The results are shown in
Table 12, whereby E6 [Government fiscal policy on interest rates], E4 [Increase in import duties], and E5 [Changes in government policies and legislation] were the top three with the highest overall effect weights.
The model’s R-square value of 0.41 indicates that the Market, Economic and Regulatory, and Logistics latent variables accounted for 41% of the causes of material price changes. The remaining 59% was influenced by factors not included in the model, suggesting that future analyses should consider additional variables affecting construction material prices. The R-square value was found to be acceptable and exceeded the minimum of 0.26 set by Cohen et al [
46].
Figure 8 presents the relationships between each construct, the related factors, and the path coefficients among the constructs.
4.4. Evaluation of the Overall Model (Goodness of Fit)
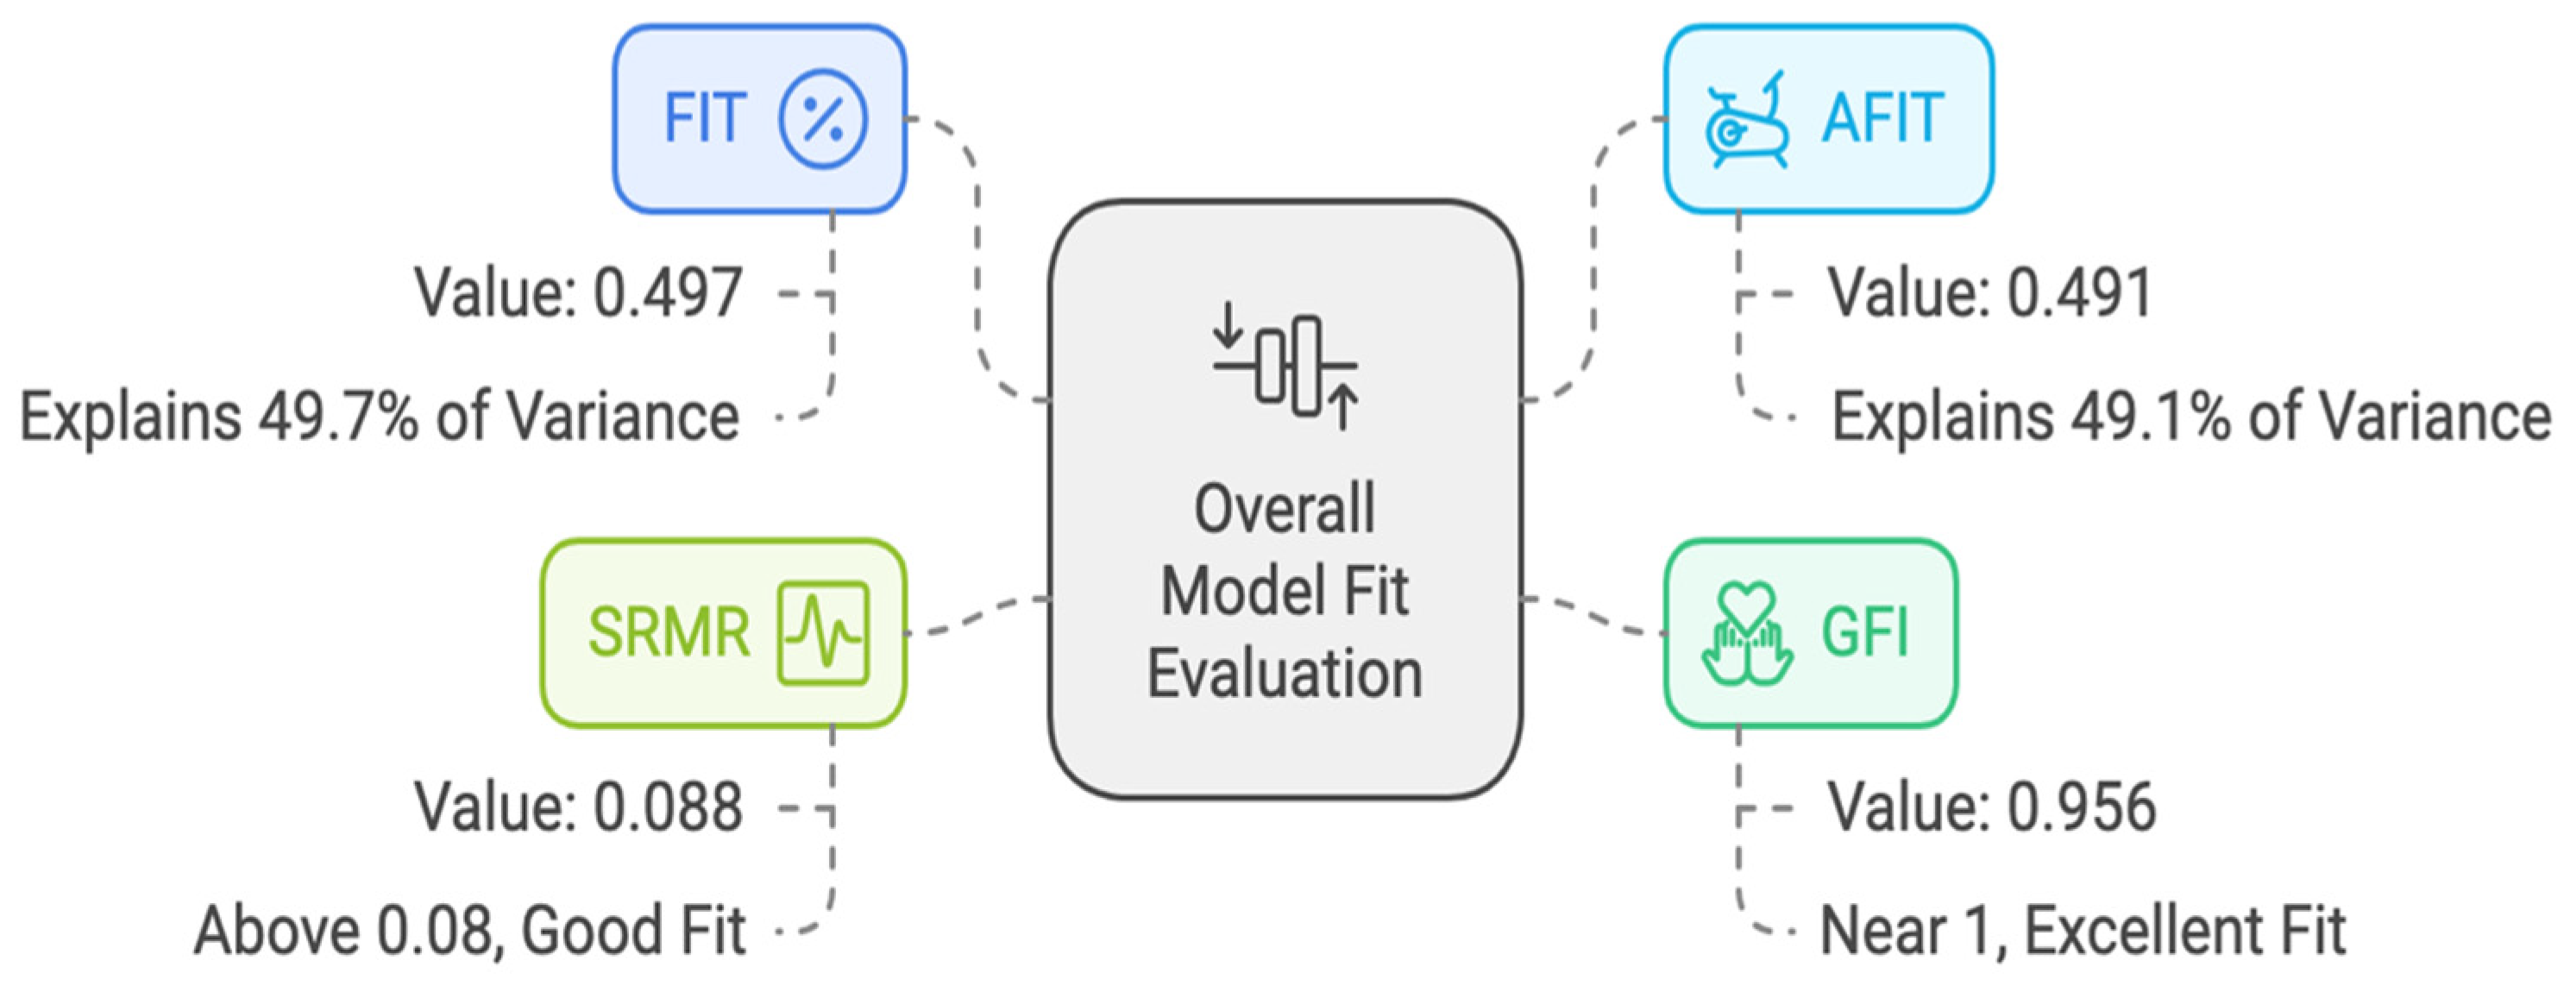
The model’s overall goodness of fit was assessed by examining the FIT, AFIT, GFI, and SRMR values.
Table 13 presents the estimation results for the overall model. The FIT value was 0.497, meaning that the model explained 49.7% of the diversity of data from all variables. Additionally, the AFIT value obtained was 0.491, meaning that 49.1% of the variance could be explained by the model and the rest by other factors.
GFI values near 1 and SRMR values close to 0 both indicate a good fit. For this model, the GFI value was 0.956, which was very close to 1, signifying an excellent fit. The SRMR value was 0.088, which was marginally above the acceptable cutoff of 0.08, suggesting a good fit.
According to Gyeongcheol Cho et al [
47], when the sample size exceeds 100, the recommended cutoff values for the GFI and SRMR are 0.93 and 0.08, respectively. Their study also suggested that neither is one measure preferred over the other nor can one differentiate between the use of both collectively or individually.
In summary, the GFI value of 0.956 reflected a very good overall fit. The FIT and AFIT SRMR values shown in
Figure 9 indicated that the model generally had a good fit.
5. Recommendation
Based on the GSCA structural equation model, the following recommendations should be considered to better forecast and control the price fluctuations of construction materials.
5.1. Market Factors
The Market construct had the lowest path coefficient and the least effect on construction material prices. However, the effect was positive, and thus, whenever it increased, construction material prices also increased. Shortages of locally manufactured or available materials had the greatest effect within the construct while low levels of technology used in production scored the lowest loading, which may be attributed to the industry preference for using more labor-based production processes or retaining the existing level of technology. The factor loadings were relatively similar, and all factors should be considered by relevant stakeholders seeking improvement and risk avoidance effect minimization.
As the major client for construction projects, the government plays an important role in controlling these effects by planning the initiation and staging of projects effectively, avoiding adverse effects relating to supply and demand or locally available materials. The government can also import and store strategic construction materials in bulk to avoid the effects of the factors included in this construct and other factors such as force majeure.
The enhancement of production technology and use of green and recycled materials should also be encouraged through government incentives as adopting these can improve production capacity and reduce running costs. The use of locally available materials should be promoted by the government and designers when planning new projects.
5.2. Logistics Factors
The Logistics construct had the second greatest impact on construction material prices. Increases in fuel and energy costs had the highest loading within the construct, but were equal in t-value to increases in transportation costs. These factors were influenced by many variables such as the price of crude oil, government fees, and modes of transportation.
Fuel price regulation, tariff and tax reduction, easing customs clearance, and improving the transportation infrastructure are some of the key strategic approaches that can help control these factors. Stakeholders should properly plan their supply arrangements and consider these factors to avoid any price volatility and the subsequent impact on the project’s financial and temporal requirements.
5.3. Economic and Regulatory Factors
The factors within this construct had the highest effect weight on construction material prices in Qatar, so the following recommendations can be made. Clients should consider other forms of contract based on partnership and risk-sharing by the parties involved in the project. Contractors and suppliers should consider the effect of government policy on interest rates in their proposals.
Increases in import duties and changes in government policies have the second-highest impact and should be accounted for in final proposals by suppliers and contractors. The government should implement a construction material index to track the volatility of construction material prices and support the industry. The index will serve as a reference for the adoption of price adjustment clauses in construction contracts.
6. Conclusions
This study pursued three key objectives to address construction material price volatility in Qatar’s dynamic market. First, we systematically identified and categorized price-influencing factors through an extensive literature review and expert validation, ultimately distilling them into three constructs: (1) Market factors, (2) Logistics factors, and (3) Economic and Regulatory factors.
Second, employing Generalized Structured Component Analysis (GSCA), we quantified each construct’s relative impact, revealing that Economic and Regulatory factors had the highest and most significant impact on the construction materials price in Qatar. This was a finding that underscored the urgent need for policy interventions to stabilize Qatar’s construction market. The validated model demonstrated good explanatory power (FIT = 49.7% and GFI = 95.6%).
Our third objective translated these findings into actionable mitigation strategies, including a proposed policy framework for streamlined material approvals and a risk-sharing mechanism for long-term projects. Based on the GSCA structural equation model findings, strategic interventions were proposed to mitigate construction material price volatility in Qatar. Market factors, while having the lowest impact (path coefficient = 0.007), require government-led initiatives such as bulk material stockpiling and technology adoption incentives to address local material shortages and production inefficiencies. For Logistics factors—the second most influential construct—fuel price regulation and infrastructure improvements emerge as key solutions to counter transportation cost volatility. Most critically, Economic and Regulatory factors demand immediate policy attention, evidenced by their dominant path coefficient (0.473). We recommend the following: (1) implementing a national construction material price index, (2) adopting risk-sharing contract models, and (3) stabilizing import duty policies. These measures offer stakeholders a comprehensive framework for cost forecasting and risk mitigation. The government’s dual role as market regulator and primary client positions it to effectively implement these strategies through policy reforms and project planning interventions.
This study was conducted by identifying the factors of construction material price volatility from a literature review of relevant studies. More data should be collected to identify other factors influencing construction material prices. The outcome of this study could lead to the development of risk assessment models for the identified factors.
