Abstract
The use of envelope structures is crucial in enhancing the safety and stability of foundation pits. However, excavation activities in the foundation pit can result in deformations affecting the envelope structure. To investigate the impact of the excavation process on the envelope structure and surrounding soil, the Midas GTS NX 2022R1 (64-bit) finite element software was employed to model the excavation process of Nantong East Railway Station. The settlement of the soil around the envelope structure and the horizontal displacement of the underground diaphragm wall (UDW) were compared with field measurements. The analysis demonstrated that the numerical analysis results exhibited a similar trend to the data obtained from field monitoring. This comparison provided valuable insights for selecting an optimal excavation method for the foundation pit and offered guidance for addressing similar challenges in the future. Additionally, a new method using metamaterials as a frame to improve the stability of continuous walls is proposed. The method relies on the excellent mechanical properties of metamaterials, improves the integrity and stability of the underground diaphragm wall, and provides a new way to solve the stability problem of underground diaphragm walls.
1. Introduction
During subway construction, the deformation of the envelope structure can cause significant issues. Excavating the foundation pit disrupts the equilibrium of the soil mass, leading to stress release and deformation. To address this, maintenance structures must be constructed around the foundation pit [1]. The envelope structure serves several purposes. It can resist earth pressure and transfer it to the inner support system, controlling the pit’s deformation. It also acts as a waterproofing and throttling mechanism, withstanding soil–water pressure in a bottomless foundation pit. It creates a water curtain effect and provides vertical bearing capacity. However, deformation and damage to the envelope structure can greatly affect the deep foundation pit’s stability [2]. Therefore, accurately predicting the envelope structure’s deformation is crucial to ensure the stability and integrity of the pit during subway construction. By accurately forecasting the deformation, appropriate measures can be implemented to maintain the pit’s stability throughout the construction process.
Scholars have realized a lot of achievements in the study of deformation rules of deep foundation pit excavation in different regions [3]. Hashash et al. [4] introduced a new method called SelfSim, which combines the numerical modeling of deep foundation pits with in situ observations. This method enhances engineering simulations by incorporating self-learning capabilities. Large-scale three-dimensional numerical simulations of an urban deep foundation pit were carried out using the finite element method. The simulations aimed to optimize the structure [5]. The finite element software ABAQUS 6.10 was used to establish a 3D numerical model that simulated the actual construction process of a technique called DAEM. The numerical results were compared and analyzed based on field data [6] by investigating the effects of key factors, such as the distance between existing subway stations and newly excavated foundation pits, and the depth of the excavations. The study aimed to control the response of existing subway stations to adjacent excavations and examined the influence of existing subway stations on the deformation of nearby excavation obstacles [7]. Hu et al. [8] conducted a study on the stability of a deep foundation pit excavations near water by using the Biot three-dimensional seepage and stress coupling model. The research included an engineering field test carried out on the south bank of the Jinan Huanghe River Tunnel [8]. Li et al. [9] conducted a study on the response of a subway line to deep mining in Shanghai using a three-dimensional numerical model established with the finite difference software FLAC3D v5.0. The study compared the results obtained from field monitoring to those obtained through numerical simulation using various types of software [9].
However, these studies did not take into account specific geological conditions. Most of the economically developed areas are in coastal areas, and the soil in these cities is mostly formed by river and marine sediments with a high-compressibility soft soil layer, which will cause unfavorable conditions for the settlement of buildings and the excavation of foundation pits. Therefore, this study mainly takes Nantong, a city located at the mouth of the Yangtze River Delta in China, as an example to discuss the impact of foundation pit excavation under this geological condition through the combination of numerical simulation and field detection. Nantong City is located in the Yangtze River Delta area at the confluence of the river and the sea; the whole area was formed during different river–marine sedimentary plain periods. The outline of Nantong is longer from east to west than from south to north, and it is surrounded by water on three sides and land on one side, in an irregular diamond shape. The terrain is low and flat, and the surface fluctuation is slight. Driven by Shanghai and Suzhou, Nantong has seen rapid economic development in recent years and has planned several subway lines. Among them, the Nantong East Subway Station is a vital subway hub. Nantong East Railway Station is located in the new Delta Plain of Chonghai (II3 region). The area is between 2.5 m and 4.5 m above sea level, with low terrain and dense ditches; it is often threatened by floods and high tides, and the surface is mainly sandy. So, we needed a more realistic soil environment and surrounding environment, more detailed soil meshing, and more constraints and support conditions. Therefore, better methods need to be proposed.
Midas GTS NX 2022R1 (64-bit), the finite element software, has advantages that can provide more convenience for our research [10]. Some scholars have used a new portable sand settling machine to prepare soil samples with a more stable relative density (Dr), effectively improving the reliability of soil stress–strain response and geotechnical structure response in physical simulations. In terms of numerical simulation, researchers have used a variety of software such as MIDAS GTS NX, FLAC3D v5.0, and ABAQUS 6.10 to predict foundation settlement in engineering. However, compared with FLAC3D v5.0, MIDAS GTS NX allows for the accurate creation of model calculations [11]. The limitations of the Abaqus model regarding contact friction simulation mean that there is a possibility that phenomena such as liquefaction cannot be studied in some cases [12]. As an efficient piece of software for foundation settlement analysis during excavation, Midas GTS NX has a user-friendly interface that can help analyze complex problems [10,13]. It can simulate soil in different situations and automatically add constraints to soil and various enclosure structures. In addition, the drilling data can be used to simulate a more realistic soil-layer boundary, and the raft and pile foundations of surrounding buildings can be added to simulate the impact of the surrounding environment on the soil and foundation pits. The key is that it can also clearly express simulation results through cloud diagrams and tables. Therefore, in recent years, many people have used Midas GTS NX finite element analysis to simulate the foundation pit of the subway station and analyze its forces and maintenance. For example, Zhang used Midas GTS NX to analyze the changes in the envelope itself and the soil, and Gan also used finite element software to study the deformation laws of the soil.
Previous studies, such as the one conducted by Houhou et al. [14], did not specifically analyze the horizontal displacement changes and deformation rules of the top of the underground diaphragm wall (UDW) at different monitoring points. To address this gap, our study aimed to analyze the horizontal displacement of the UDW around the foundation pit. For this purpose, we utilized the Midas GTS NX software to simulate the displacements at various monitoring points. This analysis allowed us to gain insights into the horizontal displacement behavior of the UDW in relation to the foundation pit excavation. These monitoring points were set to align with the horizontal displacement monitoring points of the UDW. By comparing the horizontal displacements at different monitoring points, we identified variations and investigated the reasons behind them. Furthermore, we examined the general trend of horizontal displacement as the depth increased at specific monitoring points. The analysis revealed that the horizontal displacement exhibited a characteristic “bow” shape. Understanding this pattern provides valuable insights for subsequent on-site construction monitoring and facilitates a meaningful comparison with finite element simulations.
We found that a deep foundation pit structure with a long main structure may have a particular impact on the horizontal displacement of the UDW during excavation [15]. Thus, the numerical simulation method is employed to analyze the impact of different excavation methods on the subway station and observe the resulting displacement of UDW. By refining the excavation method of the subway station, the most favorable scheme is selected from multiple options to minimize the deformation of the envelope structure. Moreover, the project is divided into blocks, and the order of block excavations is studied to find the construction method that significantly reduces the envelope’s deformation.
Additionally, we propose a construction optimization method utilizing a three-dimensional metamaterial structure. This innovative approach effectively enhances the stability of UDW and reduces horizontal displacement. The aim is to provide a novel concept for improving the stability of supporting structures in deep foundation pits, potentially contributing to advancements in envelope structure development.
2. Project Profile
2.1. The Station’s Envelope
We use the Nantong East Railway Station subway station as the research object for this paper. Nantong East Railway Station is the 16th station of Line 2 of the Nantong Rail Transit Project. It is an island-style station on the second underground floor, and an open construction method is adopted. The subway station is in the southeastern quadrant at the intersection of Qingnian Middle Road and Tongshanda Road. It is positioned underground, running along the east–west direction. The overall dimensions of the subway station are 202.6 m in length. Based on the varying structural types of the station, it is divided into an end healthy section and a standard section [16]. The standard section of the subway station has a width of 20.7 m, while the end well section has a width of 25.2 m. The primary structure of Nantong East Railway Station is constructed using a cast-in-place reinforced concrete box structure. To carry out comprehensive waterproofing, the envelope structure forms a composite wall structure in conjunction with the main structure.
The enclosure structure of Nantong East Station subway station adopts an 800-thick UDW + internal support and H-shaped steel joints. The UDW aids anti-floating as part of the permanent structure.
There are four supports in the enclosure structure of this subway station, as shown in Figure 1. The first support adopts a concrete support (primary support 700 × 900 + rib support 600 × 600). The second support at the end well is supported by reinforced concrete (primary support 800 × 1000 + rib support 600 × 600). The waist beam size is 1100 × 1000. The standard section of the subway station utilizes two different types of steel supports for reinforcement. The second and third steel supports have a diameter of φ800 and a thickness of t = 20, offering enhanced strength and stability. The remaining sections of the standard section are supported by φ609 steel supports with a thickness of t = 16, ensuring sufficient structural support across the entire station.
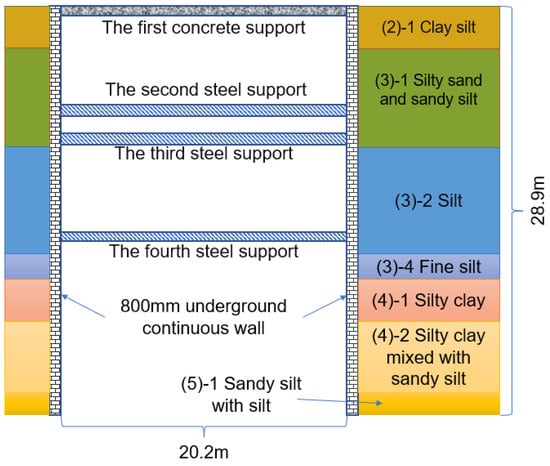
Figure 1.
Support layout of the subway station.
2.2. Geological Conditions
The station is located in the new flushing-sea delta plain (II3 area). The elevation of this area is between 2.5 m and 4.5 m; the terrain is low and flat, densely covered with ditches, and often threatened by floods and high tide levels, and the surface layer is dominated by sandy soil.
Based on the project’s nature and the geological conditions of the site, the soil layer within the exploration depth range can be simplified into six primary layers and ten sub-layers. These sub-layers, listed from top to bottom, include the following: ① miscellaneous fill; ②-1 clay silt; ③-1 silty sand with sandy silt; ③-2 silt; ③-4 fine silt; ④-1 silty clay with sandy silt; ⑤-1 sandy silt with silt; ⑤-3 clayey silt with silt; ⑥ silty sand with sandy silt.
2.3. Hydrological Conditions
Based on the survey of the formation structure and groundwater occurrence conditions, as well as regional hydrogeological data, the groundwater types that impact this project can be classified into two categories: phreatic water and the first confined water. These two types of groundwater play a significant role in influencing the hydrological conditions and stability of the project site.
- (1)
- The phreatic water
Phreatic water is primarily found in the following layers: ① the shallow layer of miscellaneous fill; ②-1 layer of clay silt; ③-1 layer of silt mixed with sandy silt; and ③-2 layer of silt. The recharge sources for phreatic water mainly include atmospheric precipitation, pipeline leakage, and lateral runoff from off-site aquifers. The main methods of phreatic water discharge are evaporation and lateral runoff.
During the survey, the measured phreatic water level was observed to be buried at a depth of 1.73–2.01 m, with an elevation ranging from 1.30 to 2.50 m. Based on regional hydrological data, the highest recorded elevation of the phreatic water level in the past 3 to 5 years at the site is approximately 3.00 m, while the lowest recorded elevation is around 0.00 m. The annual variation range of the phreatic water level generally falls within 1–2 m.
- (2)
- The first Confined water
The first confined water is predominantly present in the following layers: ⑤-1 sandy silt with silt; ⑤-3 clayey silt with silt; ⑥ silt with sandy silt; and ⑥ silt with sandy silt below the ④ layer (which can be considered as an interconnected layer of confined water). The ④-2 silty clay mixed with sandy silt acts as the waterproof roof for this confined water. Its primary source of recharge is lateral groundwater recharge, and it is discharged through artificial mining and lateral runoff of groundwater.
During the survey, the measured confined water level was observed to be buried at a depth of 3.30 m (with an elevation of 0.55 m).
3. Simulation and Analysis of Finite Element Software
3.1. Model Establishment
In this study, the numerical model of the foundation pit construction process and the surrounding soil mass of Nantong East Railway Station were established by using the Midas GTS NX software [17]. To reduce the influence of boundary conditions on foundation pit construction simulation, the model should be as large as possible to make it more accurate. Therefore, we set the model size to 400 m × 200 m × 60 m (length, width, and height) [18].
The steps to build the model are as follows: The first step is the establishment of all soil materials. The soil is then divided into soil layers. Then, the soil in the foundation pit is divided according to the working conditions [19], and Boolean operations are used in time to make a coupled-state model; the harmonic load is added to reduce the impact of dynamic effects on the prediction accuracy of the model. Establishing UDW and various maintenance supports will also be carried out. The next step is to divide the soil grid, making the model more detailed [20]. Then, elastic constraints, fixed constraints, and rotation constraints are applied to the sides, bottom, and columns of the model, respectively, to divide the foundation pit’s construction stages. Subsequently, the model was simulated and analyzed according to different construction conditions, and the final schematic diagram of the model is shown in Figure 2.
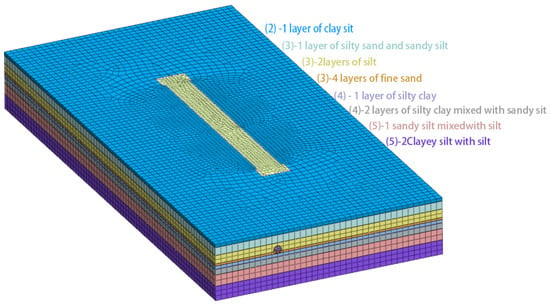
Figure 2.
Subway station deep foundation pit simulation diagram and detailed soil-layer division.
There are nine layers of soil from the top to the bottom. To make the model reflect the deformation and force of the foundation pit more accurately, the Mohr–Coulomb model is used to simulate soil [21]. Reinforced concrete structures are simulated using elastic structures [22]. We imported local soil parameters, such as internal friction angle, Poisson’s ratio, gravity, etc., into Midas GTS NX to align the soil with the actual soil. The parameters of the specific soil layer are shown in Table 1.

Table 1.
Basic parameters of layers.
3.2. Working Conditions
According to the construction conditions of the foundation pit, the construction conditions of the model are divided into five types, as shown in Table 2. When the foundation pit is excavated to 1.5 m, the concrete support is established as working condition 1. When it is excavated to 7 m, a second inner support is established as working condition 2. When it is excavated to 9 m, a third steel support is established as working condition 3. When it is excavated to 16 m, a fourth steel support is established as working condition 4. When it is excavated to the bottom, the depth of the foundation pit is 28.9 m, which is regarded as working condition 5.

Table 2.
Division of construction conditions.
3.3. Layout of Each Monitoring Point
The location of each test point in this subway station is shown in Figure 3. A total of 26 inclinometer holes are arranged around the UDW, numbered CX1-CX26. A total of 26 horizontal displacement monitoring points, numbered QW1-QW26, are set up outside the UDW for monitoring the horizontal displacement of the UDW. In total, 26 groups of surface settlement monitoring points are set up in the direction of the UDW perpendicular to the foundation pit, and their numbers are D1-1 to D26-5. Each group has five monitoring points, such as D20-1 to D20-5. Each monitoring point is on the same horizontal line, but the distance from the edge of the pit is different. According to the distance, it is divided into 1, 2, 3, 4 and 5 points to better measure the amount of surface subsidence at different locations. This makes the measurement data more specific, which is helpful for subsequent analyses. Monitoring points ZH\ZG are also set up on the concrete and steel supports to monitor the stress of the same point relative to different supports [23].
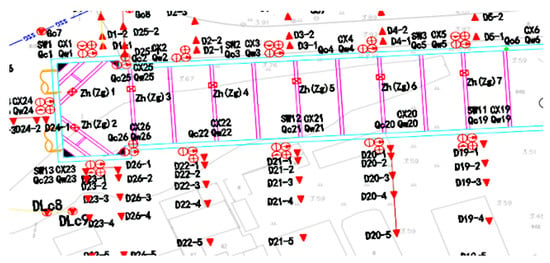
Figure 3.
Location layout of each measuring point.
3.4. Numerical Simulation Calculation
Some scholars have numerically simulated the horizontal displacement of the UDW before. Since the soil quality in each region is different, the surrounding construction conditions are also different, so we adopt Midas to see whether the horizontal displacement in this region conforms to the law proposed by predecessors.
3.4.1. Surface Subsidence
After the establishment of the model was completed, we chose working condition 5, for which its settlement is close to the final surface settlement for analyses [24]. Then, based on the simulation analysis results of working condition 5, we first simulated the settlement cloud map of the surrounding soil when the excavation reached the deepest point. Because of the influence of underground pipelines on the other side, we chose point D7 for measurements. Figure 4 shows the approximate location of the surface settlement monitoring point D7. To see the change rule of land surface settlement more clearly, we use Figure 5 to represent the land surface settlement of the model.
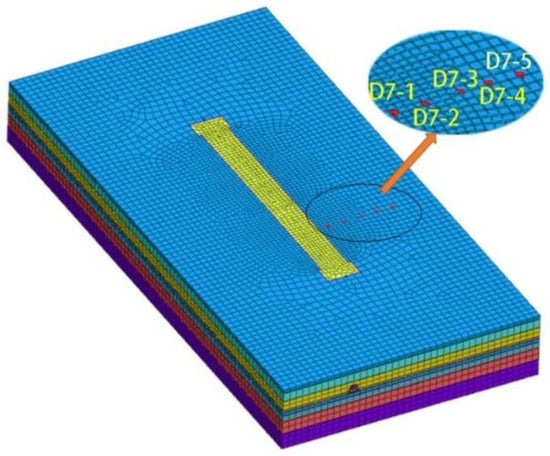
Figure 4.
Layout of D7 monitoring points.
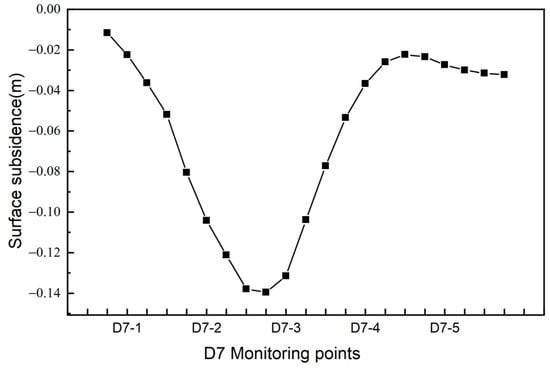
Figure 5.
Surface settlement of D7 monitoring points.
The soil surface settlement first increases, along with the distance from the foundation pit. When the distance from the foundation pit is certain, the settlement reaches the maximum value, as shown in Figure 5 [25]. The location of this point is roughly near monitoring point D7-3. However, after it reaches the peak value, the surface subsidence becomes smaller as the distance from the foundation pit growth [26]. It increases slightly until it reaches the lowest point and then tends to be stable.
It can be seen that the settlement of the soil becomes groove-shaped as the distance increases from Figure 6 [27]. The maximum settlement occurs near monitoring point D7-2, with a value of 0.147 m. This is mainly because during the excavation of the foundation pit, the soil mass moves toward the foundation pit, but because the area near the pit is restricted by the retaining wall, the main lateral deformation of the soil mass occurs at a certain distance from the foundation pit. With the increase in distance, the settlement in the far pit area tends to be stable and is almost unaffected by the excavation of the foundation pit. As the excavation depth increases, it can be observed that in condition 5, when the excavation reaches the bottom of the foundation pit, the surface settlement at each monitoring point reaches its corresponding maximum value. Additionally, there is a significant difference between the settlement values of condition 5 and those of conditions 1, 2, 3, and 4. This difference may be attributed to the absence of internal support between the two conditions, resulting in a cliff-shaped decline. Furthermore, there is a substantial difference in excavation depth between the two working conditions, leading to a noticeable gap in settlement values [28].
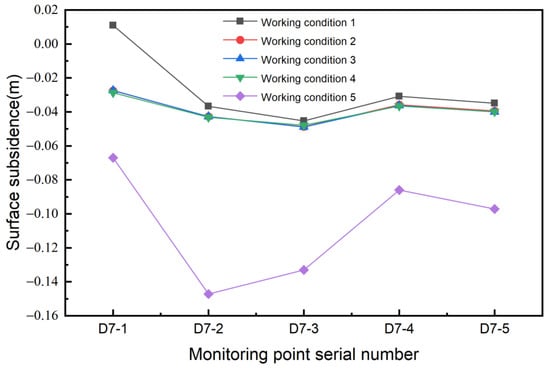
Figure 6.
Settlement simulation of D7 monitoring points under various working conditions.
3.4.2. Horizontal Displacement of UDW
When there is a soil pressure difference on both sides of the excavation, the UDW will produce horizontal displacements [28,29]. The pressure is most significant near the excavation face. Therefore, the maximum displacement is generally near the excavation face [30]. Thus, our monitoring points are set near the excavation surface to measure its horizontal displacement. The simulation results of the horizontal displacement of the top of the UDW at each monitoring point of the UDW are shown in Figure 7.
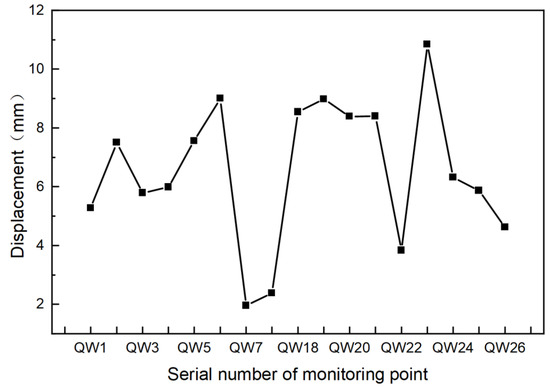
Figure 7.
Simulation of the horizontal displacement of the ground connecting wall’s top at each monitoring point.
It can be seen in Figure 7 that the horizontal displacement of the top of the UDW at most monitoring points is between 6 and 10 mm. Moreover, there are a few monitoring points where the displacement of the top of the wall is within 2 mm. The horizontal displacement of the top of the wall varies significantly in the three QW6-QW7, QW21-QW22, and QW22-QW23 locations; the support condition of this point is too different from that caused by the situation. However, all inclinometer points moved toward the pit. This is because excavation is an unloading process. Then, the excavation of the foundation pit caused the difference in earth pressure between the outside and inside of the UDW [17]. With the deeper excavation of the foundation pit, the earth pressure difference will become larger and larger, and the UDW will move to one side with the lower earth pressure value; that is, it will move to the foundation pit.
The horizontal displacement of the UDW at the same monitoring point varies with the depth, as shown in Figure 8.
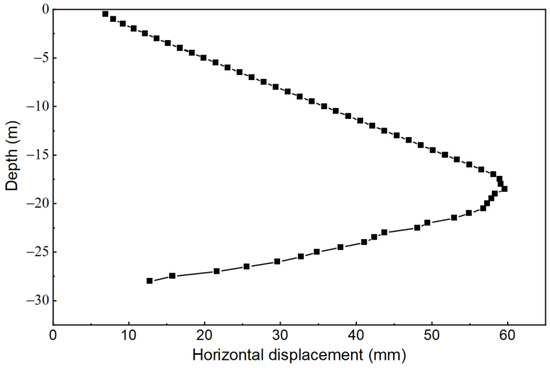
Figure 8.
Cumulative horizontal displacement of UDW at CX22 points.
The results depicted in Figure 8 indicate that the horizontal displacement of the UDW follows a pattern of “significant displacement in the middle and smaller displacements at both ends” as the depth increases. The horizontal displacement of the UDW exhibits a non-uniform distribution along its depth. Specifically, the intermediate depths experience higher levels of horizontal displacement, while the displacements at the upper and lower ends of the wall are relatively smaller. This pattern indicates that the horizontal displacement is not evenly distributed along the entire depth of the UDW [31]. The horizontal displacement at the top and bottom sections of the wall is relatively insignificant compared to the displacement observed in the middle portion of the wall. In other words, the middle part of the wall experiences more significant horizontal displacement compared to the upper and lower sections [32]. The horizontal displacement at the top of UDW is less than 10 mm. However, as the foundation pit is excavated to a depth of 18.5 m, the maximum horizontal displacement of the UDW reaches 59.7 mm. The most significant position of horizontal displacement within the UDW is located approximately one-third of the distance from the bottom of the foundation pit. This indicates that the area around this particular location experiences the highest level of horizontal displacement compared to other sections of the UDW. This point has also been made by scholars before [33], indicating that the observed influence of soil quality on the horizontal displacement of the UDW aligns with previous research findings. The horizontal displacement of the UDW at the bottom of the pit, which is approximately 15 mm, can be attributed to variations in the degree of soil consolidation or hardening. These differences in soil characteristics can lead to variations in the exerted earth pressure on the UDW, resulting in differences in horizontal displacement along the wall. Therefore, the variation in soil quality plays a significant role in the observed horizontal displacements of the UDW.
4. Comparison Between Actual Monitoring Data and Simulated Data
We have carried out long-term data monitoring, such as monitoring the surface settlement and horizontal displacement of UDW, through various on-site monitoring points. Then, through analysis and sorting, charts were made to compare with the numerical simulation results of the Midas GTS NX software. A few characteristic points are selected from it for comparison and analyses.
4.1. Surface Settlement
To better compare the on-site monitoring data and numerical simulation data of surface subsidence, the on-site monitoring points selected are also D7-1~D7-5 for the comparison of surface settlements. The comparison results are shown in Figure 9.
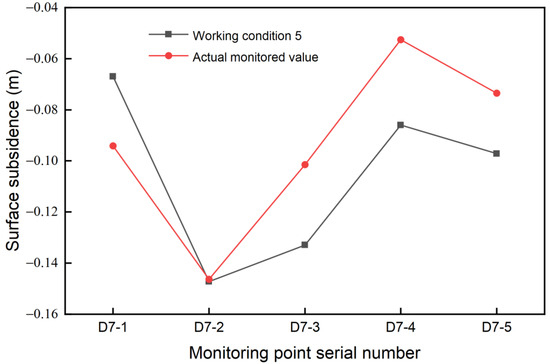
Figure 9.
Comparison between field monitoring data and the numerical simulation of surface settlements at D7 monitoring points.
We chose working condition 5, the final value of the surface settlement when the foundation pit is excavated to the bottom of the pit, to compare with the actual settlement of on-site monitoring. The figure shows that the data variation law of the actual monitoring condition 5 and the numerical simulation is roughly the same [34]. The largest settlement occurred at the D7-2 monitoring point; the maximum settlement was 14.63 mm, and the numerical simulation maximum settlement was 14.72 mm. The remaining four monitoring points have relatively large gaps: D7-1 site monitoring data are 28.9% higher than numerical simulation data, D7-3 site monitoring data are 23.5% lower than numerical simulation data, D7-4 data are 38.8% lower, and D7-5 data are 25.2% lower. However, generally speaking, the actual settlement is smaller than the simulated settlement [35], which meets the requirements. One reason for such a large gap might be that the compressive modulus of the soil layer in actual engineering may be larger than assumed in the simulation process, thereby resulting in smaller settlement. In addition, the loading speed is slow during construction such that the soil has more time to complete consolidation, and it also has a certain impact on the surface settlement in a later period.
4.2. Horizontal Displacement of UDW
The horizontal displacement of the top of the wall is where the displacement is relatively small and can even be minimal [14]. Its displacement is greatly affected by internal supports and other reasons [36], such as the magnitude of earth pressure. Therefore, we first selected some monitoring points on the top of the wall to compare on-site monitoring data with simulated data for the horizontal displacement of the top. The horizontal displacement of the top of the UDW can be viewed as a whole, and the comparison results are shown in Figure 10.
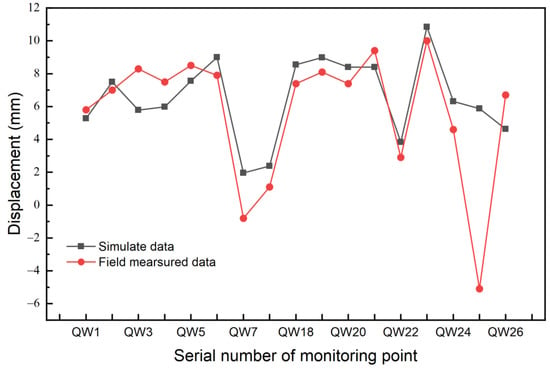
Figure 10.
Comparison between the results of field detection and the numerical simulation of the horizontal displacement of the wall top at some QW monitoring points.
The field-measured data of the horizontal displacement of the top of the UDW are basically consistent with the simulated data, as shown in Figure 10. Moreover, the horizontal displacement of all points is around 10 mm. Only a few monitoring points have significant differences, such as QW25. The numerical simulation data of QW25 points is 5.87 mm, while the field monitoring data is −5.1 mm. The data of the two monitoring points are similar in size, but the direction of the horizontal displacement is different. This may be due to the high earth pressure caused by construction around the monitoring site, which is transmitted to the other side through the support. The same problem also appeared at the QW7 point. However, the difference is that the displacement of the QW7 point is much smaller than other points in terms of absolute value comparisons. The supporting conditions at this point are relatively good; thereby, the horizontal displacement of the top of the wall is relatively small [32].
When the excavation depth increased at the same monitoring point, such as CX22, a comparison between the simulated horizontal displacement data of the UDW and the field-measured data was carried out, as presented in Figure 11. This figure illustrates the agreement or discrepancy between the simulated and measured data, allowing for an assessment of the accuracy and reliability of simulation results. By visually analyzing the plotted data points, patterns or discrepancies can be identified, aiding in the validation of the simulation approach.
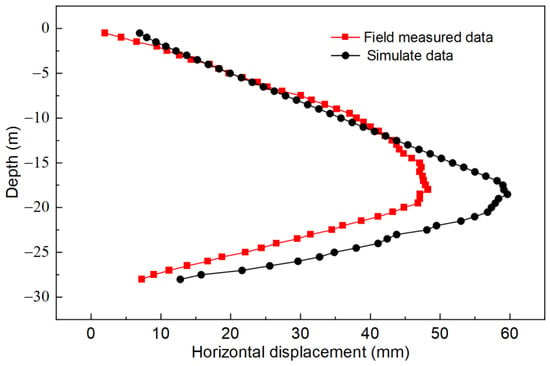
Figure 11.
Comparison between the field detection and numerical simulation of CX22 UDW horizontal displacement variations with respect to depth.
In Figure 11, the horizontal displacement of the UDW obtained via the two methods shows a “bow” change with respect to changes in depth [37]. The shapes of the two curves are similar, and most places are relatively consistent. The maximum horizontal displacement occurs at a depth of −18.5 m. However, in the comparison results, there are notable differences between the measured on-site maximum horizontal displacement of UDW and the numerical simulation results. The measured displacement is approximately 10 mm smaller than the simulation result at its maximum value. At the top of the wall, the numerical simulation data slightly exceed field monitoring data. As the excavation depth increases, the two lines of data almost align. However, at around 13.5 m of excavation depth, field monitoring data gradually become consistently smaller than the numerical simulation data. The difference between the two reaches a maximum of 12.6 mm at approximately 18 m, representing a decrease of 21%. This discrepancy between the two datasets is the largest observed. Subsequently, as the depth increases, the difference progressively decreases until the difference between the wall and ground settles at 5.51 mm.
Although the trend in the two is roughly the same, there is a big gap between the two due to the limited simulation accuracy. Later, we will obtain more detailed soil information through 3D scanning and input more accurate parameters to improve the authenticity of the simulation [38].
5. Optimization and Improvement of the Subway Station from the Perspective of the Excavation Method
With the progress of excavation, the soil pressure of the original soil mass is unloaded, the stability of the original soil mass is destroyed, and the original static soil pressure area becomes an active soil pressure area [39,40]. The soil will move toward the direction of the foundation pit, which will also cause significant lateral displacement of the retaining structure, such as the UDW [41]. Since the deep foundation pit excavation method adopted by the Nantong East Railway Station is stratified excavation, we are still determining whether this method is adopted because of the local soil mass. Therefore, we used numerical simulations and local soil-layer data to add two separate excavation methods to simulate this subway station. In order to see whether this method can effectively improve the subway station’s stability and provide a reference for the future construction of surrounding subway stations. Therefore, the excavation method will have a particular influence on the deformation of the retaining structure of the foundation pit [19]. Therefore, we built a finite element model to simulate different excavation methods and compare which one is more suitable for the excavation of Nantong East Railway Station.
The conditions for the establishment of the model are as follows:
- (1)
- All established models should meet the Mohr–Coulomb law. In addition, the Modified Cam Clay criterion is adopted for clay [42,43], and the soil is an elastoplastic medium.
- (2)
- The soil parameters, supporting methods, and materials of the two excavation models should be the same.
- (3)
- During the establishment of the model, the establishment of various supports belongs to the elastic stage.
- (4)
- The mesh size of the two models should be the same, but the sequence of construction stages is different.
5.1. Layered Excavation Method
The excavation method adopted by Nantong East Station is the layered excavation method. When we build the model, the excavated soil mass is stratified, and then the corresponding construction stage is established according to the sequence of each layer [44]. Then, the boundary conditions of the soil mass and the constraint conditions of each support are established, and then, the construction stage of the model is analyzed.
Figure 12 illustrates the horizontal displacement in the X direction of the subway station’s envelope structure during layered excavation. The bottom of the UDW experiences significant horizontal displacement due to the lack of corresponding supports, with the maximum displacement occurring at the center of the UDW [45]. The size is 14.7 cm, and the displacement of the entire floor wall fluctuates around 4 cm.
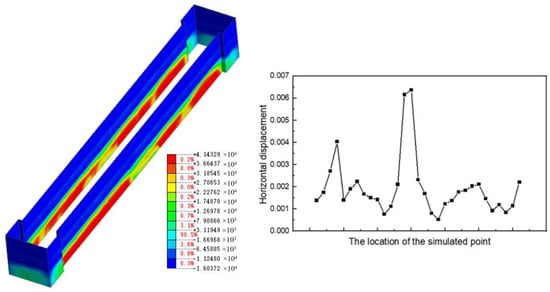
Figure 12.
Horizontal displacement of UDW with the stratified excavation method.
5.2. Block Excavation Method
During the previous simulation, it was observed that the length of the subway station has an impact on the horizontal displacement of UDW during excavation. The UDW’s horizontal displacement can be affected to a certain extent due to the considerable length of the station, which can potentially compromise the safety of the structure [46]. Therefore, we carried out block excavation based on layered excavation.
As shown in Figure 13, we divided the end well and the main structure into three parts: A, B, and C. We excavated two sequences. In the first sequence, stratified excavation was carried out from the first two wells, B and C. Then, stratified excavation was carried out on block A after the excavation was completed. The second sequence is to first excavate the central part, block A, and then excavate the B and C sections at both ends. Then, we used the same model to simulate and compare two sequential construction methods for this model.
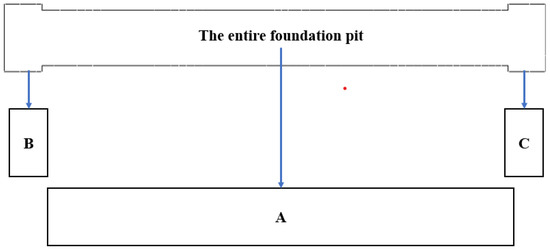
Figure 13.
Area division of block excavation.
Figure 14 compares the horizontal displacement of the ground connecting wall in area A during construction, specifically in the XY plane direction. The displacement is analyzed under the block excavation method in section A, followed by sections B and C. Comparing Figure 14 to Figure 12, implementing a combined block excavation and stratified excavation approach and building upon the previous stratified excavation effectively reduce the horizontal displacement of the UDW caused by foundation pit excavation. This reduction in displacement improves the overall safety and reliability of the foundation pit.
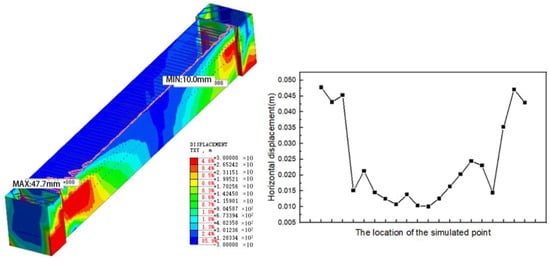
Figure 14.
Horizontal displacement of UDW during the excavation of the BC zone and then the A zone.
Figure 15 also shows the results of the excavation method that combines block excavation and stratified excavation. However, different from the method used in Figure 14, the method used in Figure 15 first excavates the foundation pit of part A and then excavates the foundation pits of part B and part C. By comparing the two pictures, we can see that the horizontal displacement of the UDW in Figure 15 is smaller. The horizontal displacement of the UDW at most points is between 0 mm and 20 mm, and the range of change is relatively small. Compared to the model in Figure 14, the horizontal displacement of the monitoring point in the middle of the model in Figure 15 is 0.002 m, which is about 0.009 m lower. In addition, the horizontal displacements of several monitoring points in the model shown in Figure 15 are close to 0 mm, which is more likely to cause smaller displacements than excavating parts B and C first, and excavating the middle part first will cause smaller displacements. Moreover, the distribution is unstable; therefore, the excavation of part A first can play a better role in reducing the horizontal displacement of a UDW than that of excavating part BC first. Therefore, this subway station can first adopt the excavation method in part A. Then, the excavation methods in parts B and C are combined with stratified excavation and block excavation.
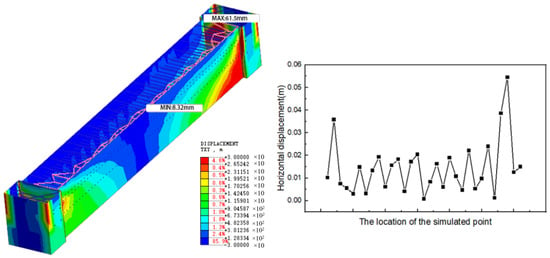
Figure 15.
Horizontal displacement of UDW during the excavation of zone A and then zone BC.
Later, for similar excavation problems, we can also excavate the middle part first and then the two sides by combining stratified excavation and block excavation. In this method, the unexcavated soil on both sides can effectively limit the deformation of the excavation of the foundation pit so that the deformation of the whole structure can be well controlled. This makes the overall structure more stable.
6. Optimization of Construction Technology of Underground Diaphragm Wall
Through monitoring and previous rules, we know that the horizontal displacement of the UDW in the reverse practice is distributed in a bow shape with the depth of excavation, and the maximum displacement appears at one-third of the distance from the bottom of the wall. Effectively reducing the displacement of the UDW can improve the overall stability of the foundation pit and reduce the excavation influence on the surrounding soil.
The displacement in the horizontal direction of UDW varies with the excavation depth because of the poor supporting conditions in the middle part. Given this, we propose a new construction technique to introduce a new type of support structure into the steel mesh and then reinforce the area. The constraints of the structure are mainly divided into self-weight constraints, completely fixed constraints applied at the bottom, and rigid connections applied at the top.
Metamaterials have some characteristics that are not available in nature, such as a negative Poisson’s ratio. They are designed based on a honeycomb structure so that they have ultra-high strength and stiffness and are lightweight. Compared to conventional structures, auxetic structures have better shear and fracture resistance, as well as higher hardness and indentation resistance. When the reentry angle of the structure is α = 65° and when the real strain of the structure increases from 0.1 mm to 0.5 mm, the stress of the structure increases five times. In addition, the structure adopts a porous support design, which enhances material efficiency and helps lower overall production costs. Its structural unit is shown in Figure 16a. Due to its unique structural characteristics, auxetic structure can be expanded in multiple directions to form a three-dimensional regular structure, as shown in Figure 16b [47]. Therefore, we added it to the steel cage at nearly one-third of the height of the underground continuous wall from the bottom of the wall in order to enhance the compressive strength and integrity of the wall and reduce the horizontal displacement of the ground connecting wall [48], as shown in Figure 16c.
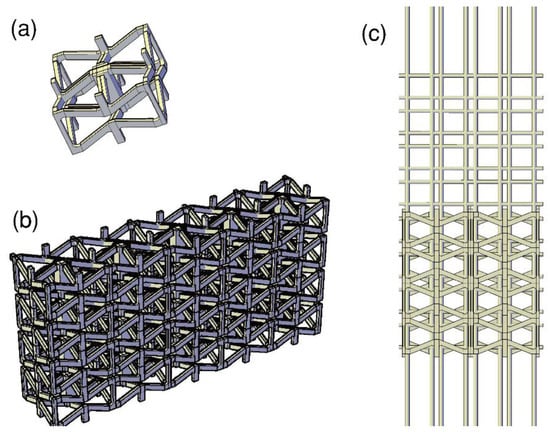
Figure 16.
Schematic diagram of the auxetic structure used for the ground connection wall. (a) Schematic diagram of the auxetic structure. (b) Auxetic structure expansion diagram. (c) The auxetic structure is applied to the steel cage of the UDW.
Due to its light weight and high strength, the structure added to the large displacement area of the UDW can enhance the resistance to earth pressure in the area, improve the stiffness of the wall, reduce the deformation of the wall, improve the overall stability of the foundation pit, reduce the impact on the surrounding buildings, and control the settlement of the surrounding soil. In addition, there have been previous examples of the use of 3D-printed metamaterials in building materials [49], but the metamaterials in this paper do not require nanoscale accuracy; moreover, because the special pore structure used during production is relatively material-saving, mass production in the factory is feasible.
7. Analysis and Discussion of Results
By comparing field measurements and numerical simulations, we found that the general trend of the results is the same, but there are still gaps in some places. Based on these results, we conducted some analyses.
- (1)
- Surface settlement
It is worth noting that although the data comparison between the on-site monitoring and numerical simulation of surface subsidence generally shows the same trend, there are some differences in the data size. The reasons for this may be as follows: ① When using the Midas GTS NX finite element software for analyses, the interface of the soil layer is regarded as a uniform plane, which leads to failure in simulating the natural soil layer. Hence, there are some differences in the results. ② When imposing soil constraints, they are not applied in detail but in general; hence, there are some errors. ③ When adding soil parameters, because various parameters of the soil, such as the elastic modulus, cannot be applied to the local accurate value, there are some differences in the results. ④ When building the subway model, there are no exact data for simulating the local surrounding conditions, such as buildings, etc., on the impact on the soil during foundation pit excavation.
Therefore, a more realistic simulation of the soil should be performed in subsequent simulations. More accurate soil data, such as the elastic modulus of the soil, the angle of internal friction, and so on, are needed. Moreover, more local drilling data are needed to simulate the local soil interface more realistically. More consideration should be given to local surrounding conditions, such as constructing other surrounding buildings and stacking other building materials, existing buildings, etc. In this way, a more realistic local construction site can be simulated.
- (2)
- The displacement in the horizontal direction of UDW
First, in terms of the horizontal displacement of the top of the wall, there is a relatively large gap between the QW25 point and the on-site monitoring data and even the opposite direction of displacement. The reasons for this may be as follows: ①The earth pressure on the opposite side of the foundation pit is too substantial. Then, the pressure is transmitted to the support so that the support force at this point is greater than the external earth pressure, and this point is subjected to passive earth pressure, so the support moves to the outside. ② Because the change point appears at the corner, it will squeeze outward when the walls on both sides move inward. Hence, it will move in the opposite direction. ③ It may be that the soil on the lower side of the point collapsed, causing the soil to settle and the upper part to bulge; therefore, the wall moved toward the outside.
The comparison of the depth variation of UDW at the same monitoring point is obtained. Depth-dependent deformation data obtained via both methods show a “bow” shape. This shape is due to a specific internal support at the top of the continuous wall, for which its horizontal displacement is relatively small. After excavating the foundation pit, the belly of the wall moves into the pit, but the bottom of the UDW experiences strong winds. The displacement is not significant because of the rock layer; therefore, the “bow” shape is formed. Moreover, their maximum displacements all appeared at −18.5 m, roughly one-third of the distance from the bottom of the pit. However, there is still a particular gap between the two values. After analysis, the possible reasons are as follows: ① The supporting methods differ. There may be a particular gap between the simulated support conditions and the on-site monitoring support conditions and support positions. ② The inhomogeneity of the soil and the pressure of the soil may also be the reasons for the difference between reality and simulations. It is worth noting that, from the above figure, we can see that the values of the on-site monitoring data are almost all lower than the numerical simulation values, which shows that our construction situation is relatively reasonable.
Based on the horizontal displacement of the UDW after excavation, we conducted a comparative analysis of the original subway station by changing the excavation method and found the following.
Based on layered excavation, block excavation can effectively reduce the horizontal displacement of the UDW. The reason may be that the one-time excavation structure needs to be shorter than the original excavation method, resulting in a more significant impact on the UDW during the excavation process. However, after excavation in blocks was introduced based on layered excavation, the excavation length of each part was effectively reduced so that the soil unloaded on the UDW is reduced accordingly. Furthermore, when area A is excavated first, the soil in areas B and C has a specific resistance to the surrounding soil—which plays a particular role in effectively reducing the deformation of the envelope. Therefore, we can adopt the method of “first the middle, then both sides” layering and block excavation to reduce the deformation of the enclosure structure accordingly.
After auxetic structure is added to the large displacement area of the UDW, resistance to earth pressure in the area can be enhanced, the stiffness of the wall can be improved, and the deformation of the wall can be reduced to improve the overall stability of the foundation pit, reduce the impact on surrounding buildings, and control the settlement of the surrounding soil.
However, most of the model constraints in this paper are simple constraints, and more detailed boundary conditions are not taken into account. More intensive soil analysis is needed to improve the accuracy of the entire model. In addition, the underground diaphragm wall optimized for metamaterials is currently only in the proposal stage, and the impact of its practical application needs to be verified by laboratory tests and field tests.
8. Conclusions
The results obtained by comparing the numerical simulation of the bottomless foundation pit of Nantong East Subway Station to numerical on-site monitoring are consistent. The results show that the comparison between numerical simulations and field monitoring is feasible. From the comparison of most field monitoring data and numerical simulation data, it can be concluded that numerical simulation data are generally more significant than field monitoring data. This is in line with the requirements for construction, indicating that the safety of the construction buildings meets the standards.
In addition, from the perspective of excavation methods, a combination of zoned and stratified excavation can be adopted to excavate long and narrow foundation pits. When excavating in blocks, we can excavate the middle first and gradually expand to both sides. In this way, the soil’s pressure on both sides can effectively reduce the horizontal displacement of the UDW in the middle. It can effectively stabilize the main structure, improving stability and integrity.
At the same time, we can apply lightweight and high-strength structures to the skeleton of the UDW to improve its overall stability. However, the actual engineering application effect of this structure needs further research. These efforts will contribute to the development of future building envelope structures.
Author Contributions
Conceptualization, G.H. Methodology, G.H., Y.Z. and H.Z. Visualization, G.H., Y.Z. and H.Z. Data curation, J.Z. Investigation, J.Z. Writing—original draft, Y.Z. Writing—review and editing, G.H., J.Z. and H.Z. All authors have read and agreed to the published version of the manuscript.
Funding
This research was funded by the National Natural Science Foundation of China (Grant no. 52304096).
Data Availability Statement
The data are contained within the article.
Acknowledgments
The project data are provided by Jindong Zhang of Nantong Rail Transit Group Co., LTD.
Conflicts of Interest
The authors have declared that no competing interests exist.
References
- Mao, Z.; Ding, T.; Hu, F.; Ye, S.; Ding, L.; Zhang, X.; Li, P.; Li, N. The Impact of Different Excavation Support Structures on the Deformation and Stability of Adjacent Station and Tunnels. Buildings 2025, 15, 493. [Google Scholar] [CrossRef]
- Huang, J.; Liu, J.; Guo, K.; Wu, C.; Yang, S.; Luo, M.; Lu, Y. Numerical Simulation Study on the Impact of Deep Foundation Pit Excavation on Adjacent Rail Transit Structures—A Case Study. Buildings 2024, 14, 1853. [Google Scholar] [CrossRef]
- Huang, G.; Liu, Z.; Wang, Y.; Yang, Y. A Multi-Objective Prediction XGBoost Model for Predicting Ground Settlement, Station Settlement, and Pit Deformation Induced by Ultra-Deep Foundation Construction. Buildings 2024, 14, 2996. [Google Scholar] [CrossRef]
- Hashash, Y.M.; Marulanda, C.; Ghaboussi, J.; Jung, S. Novel approach to integration of numerical modeling and field observations for deep excavations. J. Geotech. Geoenviron. Eng. 2006, 132, 1019–1031. [Google Scholar] [CrossRef]
- Obrzud, R.; Preisig, M. Large scale 3D numerical simulations of deep excavations in urban areas-constitutive aspects and optimization. Geotech. Suisse 2013, 167, 57–68. [Google Scholar]
- Li, M.-G.; Chen, J.-J.; Wang, J.-H.; Zhu, Y.-F. Comparative study of construction methods for deep excavations above shield tunnels. Tunn. Undergr. Space Technol. 2018, 71, 329–339. [Google Scholar] [CrossRef]
- Liao, S.-M.; Wei, S.-F.; Shen, S.-L. Structural responses of existing metro stations to adjacent deep excavations in Suzhou, China. J. Perform. Constr. Facil. 2016, 30, 04015089. [Google Scholar] [CrossRef]
- Hu, Z.; Wang, Q.; Yang, S.; Shi, Z.; Liu, B.; Song, H.; Wang, F. Numerical simulation of soil displacement and settlement in deep foundation pit excavations near water. Geofluids 2021, 2021, 5559009. [Google Scholar] [CrossRef]
- Li, M.-G.; Xiao, X.; Wang, J.-H.; Chen, J.-J. Numerical study on responses of an existing metro line to staged deep excavations. Tunn. Undergr. Space Technol. 2019, 85, 268–281. [Google Scholar] [CrossRef]
- Zhou, B.; Zhong, H.; Yang, K.; Yang, X.; Cai, C.; Xiao, J.; Liu, Y.; Yuan, B. A Study on the Factors Influencing High Backfill Slope Reinforced with Anti-Slide Piles under Static Load Based on Numerical Simulation. Buildings 2024, 14, 799. [Google Scholar] [CrossRef]
- Rădulescu, N.; Oancea, G. Mathematical modelling for micropiles embedded in salt rock. Math. Model. Civ. Eng. 2016, 12. [Google Scholar] [CrossRef]
- Fadaei, S.; Hamidi, A. Numerical Evaluation of Liquefaction During Vibratory Pile Driving in Saturated Sand. Transp. Infrastruct. Geotechnol. 2024, 11, 3969–3991. [Google Scholar] [CrossRef]
- Saini, S.; Goyal, E.T. Analysis of piled raft foundation using MIDAS GTS NX. Int. Res. J. Eng. Technol. 2019, 6, 5491–5499. [Google Scholar]
- Houhou, M.N.; Emeriault, F.; Belounar, A. Three-dimensional numerical back-analysis of a monitored deep excavation retained by strutted diaphragm walls. Tunn. Undergr. Space Technol. 2019, 83, 153–164. [Google Scholar] [CrossRef]
- Feng, Z.; Xu, Q.; Xu, X.; Tang, Q.; Li, X.; Liao, X. Deformation characteristics of soil layers and diaphragm walls during deep foundation pit excavation: Simulation verification and parameter analysis. Symmetry 2022, 14, 254. [Google Scholar] [CrossRef]
- Zhang, L.; Zhu, J. Numerical Simulation and Field Monitoring Analysis for Deep Foundation Pit Construction of Subway Station. Struct. Durab. Health Monit. (SDHM) 2022, 16, 397. [Google Scholar] [CrossRef]
- Fan, S.; Song, Z.; Xu, T.; Wang, K.; Zhang, Y. Tunnel deformation and stress response under the bilateral foundation pit construction: A case study. Arch. Civ. Mech. Eng. 2021, 21, 109. [Google Scholar] [CrossRef]
- Zhang, L.; Zhou, X.; Pan, Y.; Zeng, B.; Zhu, D.; Jiang, H. Design of groundwater extraction in open cut foundation pit and simplified calculation of ground subsidence due to dewatering in sandy pebble soil strata. Adv. Civ. Eng. 2020, 2020, 1046937. [Google Scholar] [CrossRef]
- Zhang, X.; Wei, G.; Jiang, C. The study for longitudinal deformation of adjacent shield tunnel due to foundation pit excavation with consideration of the retaining structure deformation. Symmetry 2020, 12, 2103. [Google Scholar] [CrossRef]
- Liu, L.; Wu, R.; Congress, S.S.C.; Du, Q.; Cai, G.; Li, Z. Design optimization of the soil nail wall-retaining pile-anchor cable supporting system in a large-scale deep foundation pit. Acta Geotech. 2021, 16, 2251–2274. [Google Scholar] [CrossRef]
- Robert, D. A modified Mohr-Coulomb model to simulate the behavior of pipelines in unsaturated soils. Comput. Geotech. 2017, 91, 146–160. [Google Scholar] [CrossRef]
- Fan, W.; Zhong, Z.; Huang, X.; Sun, W.; Mao, W. Multi-platform simulation of reinforced concrete structures under impact loading. Eng. Struct. 2022, 266, 114523. [Google Scholar] [CrossRef]
- Zhang, J.; Cheng, Z. Prediction of Surface Subsidence of Deep Foundation Pit Based on Wavelet Analysis. Processes 2022, 11, 107. [Google Scholar] [CrossRef]
- Ye, X.-W.; Jin, T.; Chen, Y.-M. Machine learning-based forecasting of soil settlement induced by shield tunneling construction. Tunn. Undergr. Space Technol. 2022, 124, 104452. [Google Scholar] [CrossRef]
- Zhu, C.; Yan, Z.; Lin, Y.; Xiong, F.; Tao, Z. Design and application of a monitoring system for a deep railway foundation pit project. IEEE Access 2019, 7, 107591–107601. [Google Scholar] [CrossRef]
- Wei, H. Influence of foundation pit excavation and precipitation on settlement of surrounding buildings. Adv. Civ. Eng. 2021, 2021, 6638868. [Google Scholar] [CrossRef]
- Lu, P.; Chen, F.; Nie, D.; Han, J. Analysis of Strata Deformation Patterns Induced by Vertical Shaft Sinking Machine Based on Soil Deformation Zoning: A Case Study of the Zhuyuan Bailonggang Sewage Connecting Pipe Project in Shanghai, China. Appl. Sci. 2025, 15, 1705. [Google Scholar] [CrossRef]
- Zhang, J.-F.; Chen, J.-J.; Wang, J.-H.; Zhu, Y.-F. Prediction of tunnel displacement induced by adjacent excavation in soft soil. Tunn. Undergr. Space Technol. 2013, 36, 24–33. [Google Scholar] [CrossRef]
- Zeng, C.-F.; Zheng, G.; Zhou, X.-F.; Xue, X.-L.; Zhou, H.-Z. Behaviours of wall and soil during pre-excavation dewatering under different foundation pit widths. Comput. Geotech. 2019, 115, 103169. [Google Scholar] [CrossRef]
- Do, N.-A.; Dias, D.; Oreste, P.; Djeran-Maigre, I. Three-dimensional numerical simulation of a mechanized twin tunnels in soft ground. Tunn. Undergr. Space Technol. 2014, 42, 40–51. [Google Scholar] [CrossRef]
- Wang, J.; Ma, G.; Zhuang, H.; Dou, Y.; Fu, J. Influence of diaphragm wall on seismic responses of large unequal-span subway station in liquefiable soils. Tunn. Undergr. Space Technol. 2019, 91, 102988. [Google Scholar] [CrossRef]
- Han, H.; Shi, B.; Zhang, L.; Chen, Q.; Wang, C.; Ding, L.; Wang, R. Deep displacement monitoring and foundation base boundary reconstruction analysis of diaphragm wall based on ultra-weak FBG. Tunn. Undergr. Space Technol. 2021, 117, 104158. [Google Scholar] [CrossRef]
- Jiang, X.; Lu, Q.; Chen, X.; Liu, J.; Li, P. Numerical analysis of deep foundation pit excavation process. In IOP Conference Series: Earth and Environmental Science; IOP Publishing: Bristol, UK, 2021; p. 032051. [Google Scholar]
- Zhou, N.; Vermeer, P.A.; Lou, R.; Tang, Y.; Jiang, S. Numerical simulation of deep foundation pit dewatering and optimization of controlling land subsidence. Eng. Geol. 2010, 114, 251–260. [Google Scholar] [CrossRef]
- Fenton, G.A.; Griffiths, D. Probabilistic foundation settlement on spatially random soil. J. Geotech. Geoenviron. Eng. 2002, 128, 381–390. [Google Scholar] [CrossRef]
- Ye, S.; Zhao, Z.; Wang, D. Deformation analysis and safety assessment of existing metro tunnels affected by excavation of a foundation pit. Undergr. Space 2021, 6, 421–431. [Google Scholar] [CrossRef]
- Li, G.; Li, Q.; Wang, J.; Dong, J.; Sun, Q. The deformation characteristics of a 40-m-deep excavation supported by a suspended diaphragm wall in rock and soil composite ground. KSCE J. Civ. Eng. 2022, 26, 1040–1050. [Google Scholar] [CrossRef]
- Liu, B.; Zhang, D.-W.; Yang, C.; Zhang, Q.-B. Long-term performance of metro tunnels induced by adjacent large deep excavation and protective measures in Nanjing silty clay. Tunn. Undergr. Space Technol. 2020, 95, 103147. [Google Scholar] [CrossRef]
- Cui, J.; Yang, Z.; Azzam, R. Field measurement and numerical study on the effects of under-excavation and over-excavation on ultra-deep foundation pit in coastal area. J. Mar. Sci. Eng. 2023, 11, 219. [Google Scholar] [CrossRef]
- Gao, Y.; Yu, Z.; Yin, Q.; Sui, H.; Feng, T.; Liu, Y. Deep-learning analysis of microstructural deterioration in rocks exposed to high temperatures. J. Rock Mech. Geotech. Eng. 2024. [Google Scholar] [CrossRef]
- Tan, Y.; Wang, D. Structural behaviors of large underground earth-retaining systems in Shanghai. I: Unpropped circular diaphragm wall. J. Perform. Constr. Facil. 2015, 29, 04014058. [Google Scholar] [CrossRef]
- Kavvadas, M.; Amorosi, A. A constitutive model for structured soils. Géotechnique 2000, 50, 263–273. [Google Scholar] [CrossRef]
- Savvides, A.A.; Papadrakakis, M. A computational study on the uncertainty quantification of failure of clays with a modified Cam-Clay yield criterion. SN Appl. Sci. 2021, 3, 659. [Google Scholar] [CrossRef]
- Zhu, L.; Zhang, C.; Li, M.; Pan, X.; Sun, J. Building 3D solid models of sedimentary stratigraphic systems from borehole data: An automatic method and case studies. Eng. Geol. 2012, 127, 1–13. [Google Scholar] [CrossRef]
- Ou, C.-Y.; Liao, J.-T.; Lin, H.-D. Performance of diaphragm wall constructed using top-down method. J. Geotech. Geoenviron. Eng. 1998, 124, 798–808. [Google Scholar] [CrossRef]
- Li, M.-G.; Zhang, Z.-J.; Chen, J.-J.; Wang, J.-H.; Xu, A.-J. Zoned and staged construction of an underground complex in Shanghai soft clay. Tunn. Undergr. Space Technol. 2017, 67, 187–200. [Google Scholar] [CrossRef]
- Şerban, D.A. Variation of Poisson’s ratio with axial strain for three-dimensional reentrant auxetic structures. Mater. Des. Process. Commun. 2022, 2022, 2623601. [Google Scholar] [CrossRef]
- Gao, Y.; Cheng, Z.; Yu, J.; Guo, X.; Liu, Y.; Chen, W. Mechanical performance enhancement of UHPC via ITZ improvement using graphene oxide-coated steel fibers. Cem. Concr. Compos. 2025, 157, 105931. [Google Scholar] [CrossRef]
- Cheng, Z.; Gao, Y.; Zhang, Y.; Wang, S.; Mao, X.; Feng, L.; Liu, Q.; Liu, Y. Influence of the graphene oxide on heat conduction characteristics of cement-based honeycomb scaffolds. Case Stud. Constr. Mater. 2025, 22, e04282. [Google Scholar] [CrossRef]
Disclaimer/Publisher’s Note: The statements, opinions and data contained in all publications are solely those of the individual author(s) and contributor(s) and not of MDPI and/or the editor(s). MDPI and/or the editor(s) disclaim responsibility for any injury to people or property resulting from any ideas, methods, instructions or products referred to in the content. |
© 2025 by the authors. Licensee MDPI, Basel, Switzerland. This article is an open access article distributed under the terms and conditions of the Creative Commons Attribution (CC BY) license (https://creativecommons.org/licenses/by/4.0/).