
Multi-Objective Optimization of Envelope Structures for Rural Dwellings in Qianbei Region, China: Synergistic Enhancement of Energy Efficiency, Thermal Comfort, and Economic Viability

Abstract
1. Introduction
1.1. Background
1.2. Indoor Thermal Environment and Energy Consumption of Rural Dwellings
1.3. Research on Rural Dwellings in Guizhou Province
1.4. Multi-Objective Optimization of Building Performance

| Reference | Year | Region | Parameters | Simulation Tools | Optimization Algorithms | Simulation Objectives |
|---|---|---|---|---|---|---|
| Attia S. et al. [27] | 2013 | Review | Building envelope | MATLAB™ | ACOA, NSGA | Zero energy buildings |
| Longo S. et al. [28] | 2019 | Review | Building envelope | CFD, DragonFly | NSGA-II | Cost-optimal, Low-energy |
| Lizana J. et al. [29] | 2016 | Southwest of Europe | Roof, wall insulation | DOE, EnergyPlus | Multi-criteria assessment | Energy efficiency |
| Ehsan A. et al. [30] | 2012 | Portuguese | Envelope parameters | MATLAB | Tchebycheff | Energy saving, Retrofit cost |
| Jermyn D. et al. [31] | 2016 | Toronto, Canada | Building envelope | EnergyPlus | Estimated using a hybrid method | Deep energy retrofits, Cost estimation |
| Naderi E. et al. [32] | 2020 | Six different climatic regions of Iran | Shading control strategy | JEPl, EnergyPlus | NSGA-II | Thermal comfort, Visual comfort, Building energy |
| Zhu et al. [33] | 2011 | China (multi-climate) | Thickness, Material of insulation layers | EnergyPlus | Analytical Formula Method | Life-cycle, Reduced heating, Cooling demand |
| Duan et al. [34] | 2024 | Cold regions, China | Geometry, Envelope | OpenStudio, EnergyPlus, Radiance | Octopus, Genetic Algorithm | Energy demand, Thermal comfort, Daylighting |
| Wang et al. [35] | 2023 | Southeastern coastal areas of China | Envelope parameters | DesignBuilder, EnergyPlus | NSGA-II | Energy-saving, Comfort |
| Molake et al. [36] | 2023 | Kezhou, China | Flat skylight, Clerestory window | Rhino-Grasshopper, EnergyPlus | NSGA-II | Daylight performance, Thermal comfort, Energy-saving |
| Gao et al. [38,39] | 2022 | Hebei, China | Envelope design variables | Rhino-Grasshopper | NSGA-II | Low-carbon retrofit, Renovation cost |
| Zhang et al. [40] | 2024 | Liaoning, China | Thickness of insulation layers | Grasshopper, EnergyPlus | NSGA-II | Renovation cost, Energy-saving |
| Liu et al. [41] | 2024 | China | Envelope design variables | Grasshopper | NSGA-II | Energy consumption, Economic efficiency |
| Zhai et al. [42] | 2025 | Severely cold region of China | Envelope parameters | EnergyPlus | NSGA-II | Energy consumption, Thermal comfort, Cost-effectiveness |
1.5. Research Objectives
- Methodically categorize the architectural types and present conditions of representative rural dwellings in the Qianbei Region and elucidate their distribution patterns and structural variations.
- Methodically identify the deficiencies in the thermal performance of the building envelope and elucidate their primary causes by analyzing the indoor thermal environment characteristics indicated by actual measured data and questionnaire surveys conducted in winter and summer.
- A multi-objective optimization algorithm was employed to investigate the overall influence of design variables for retrofitting the building envelope on performance and economics. The algorithm aimed to attain an optimal equilibrium among energy consumption, occupant comfort, and financial viability.
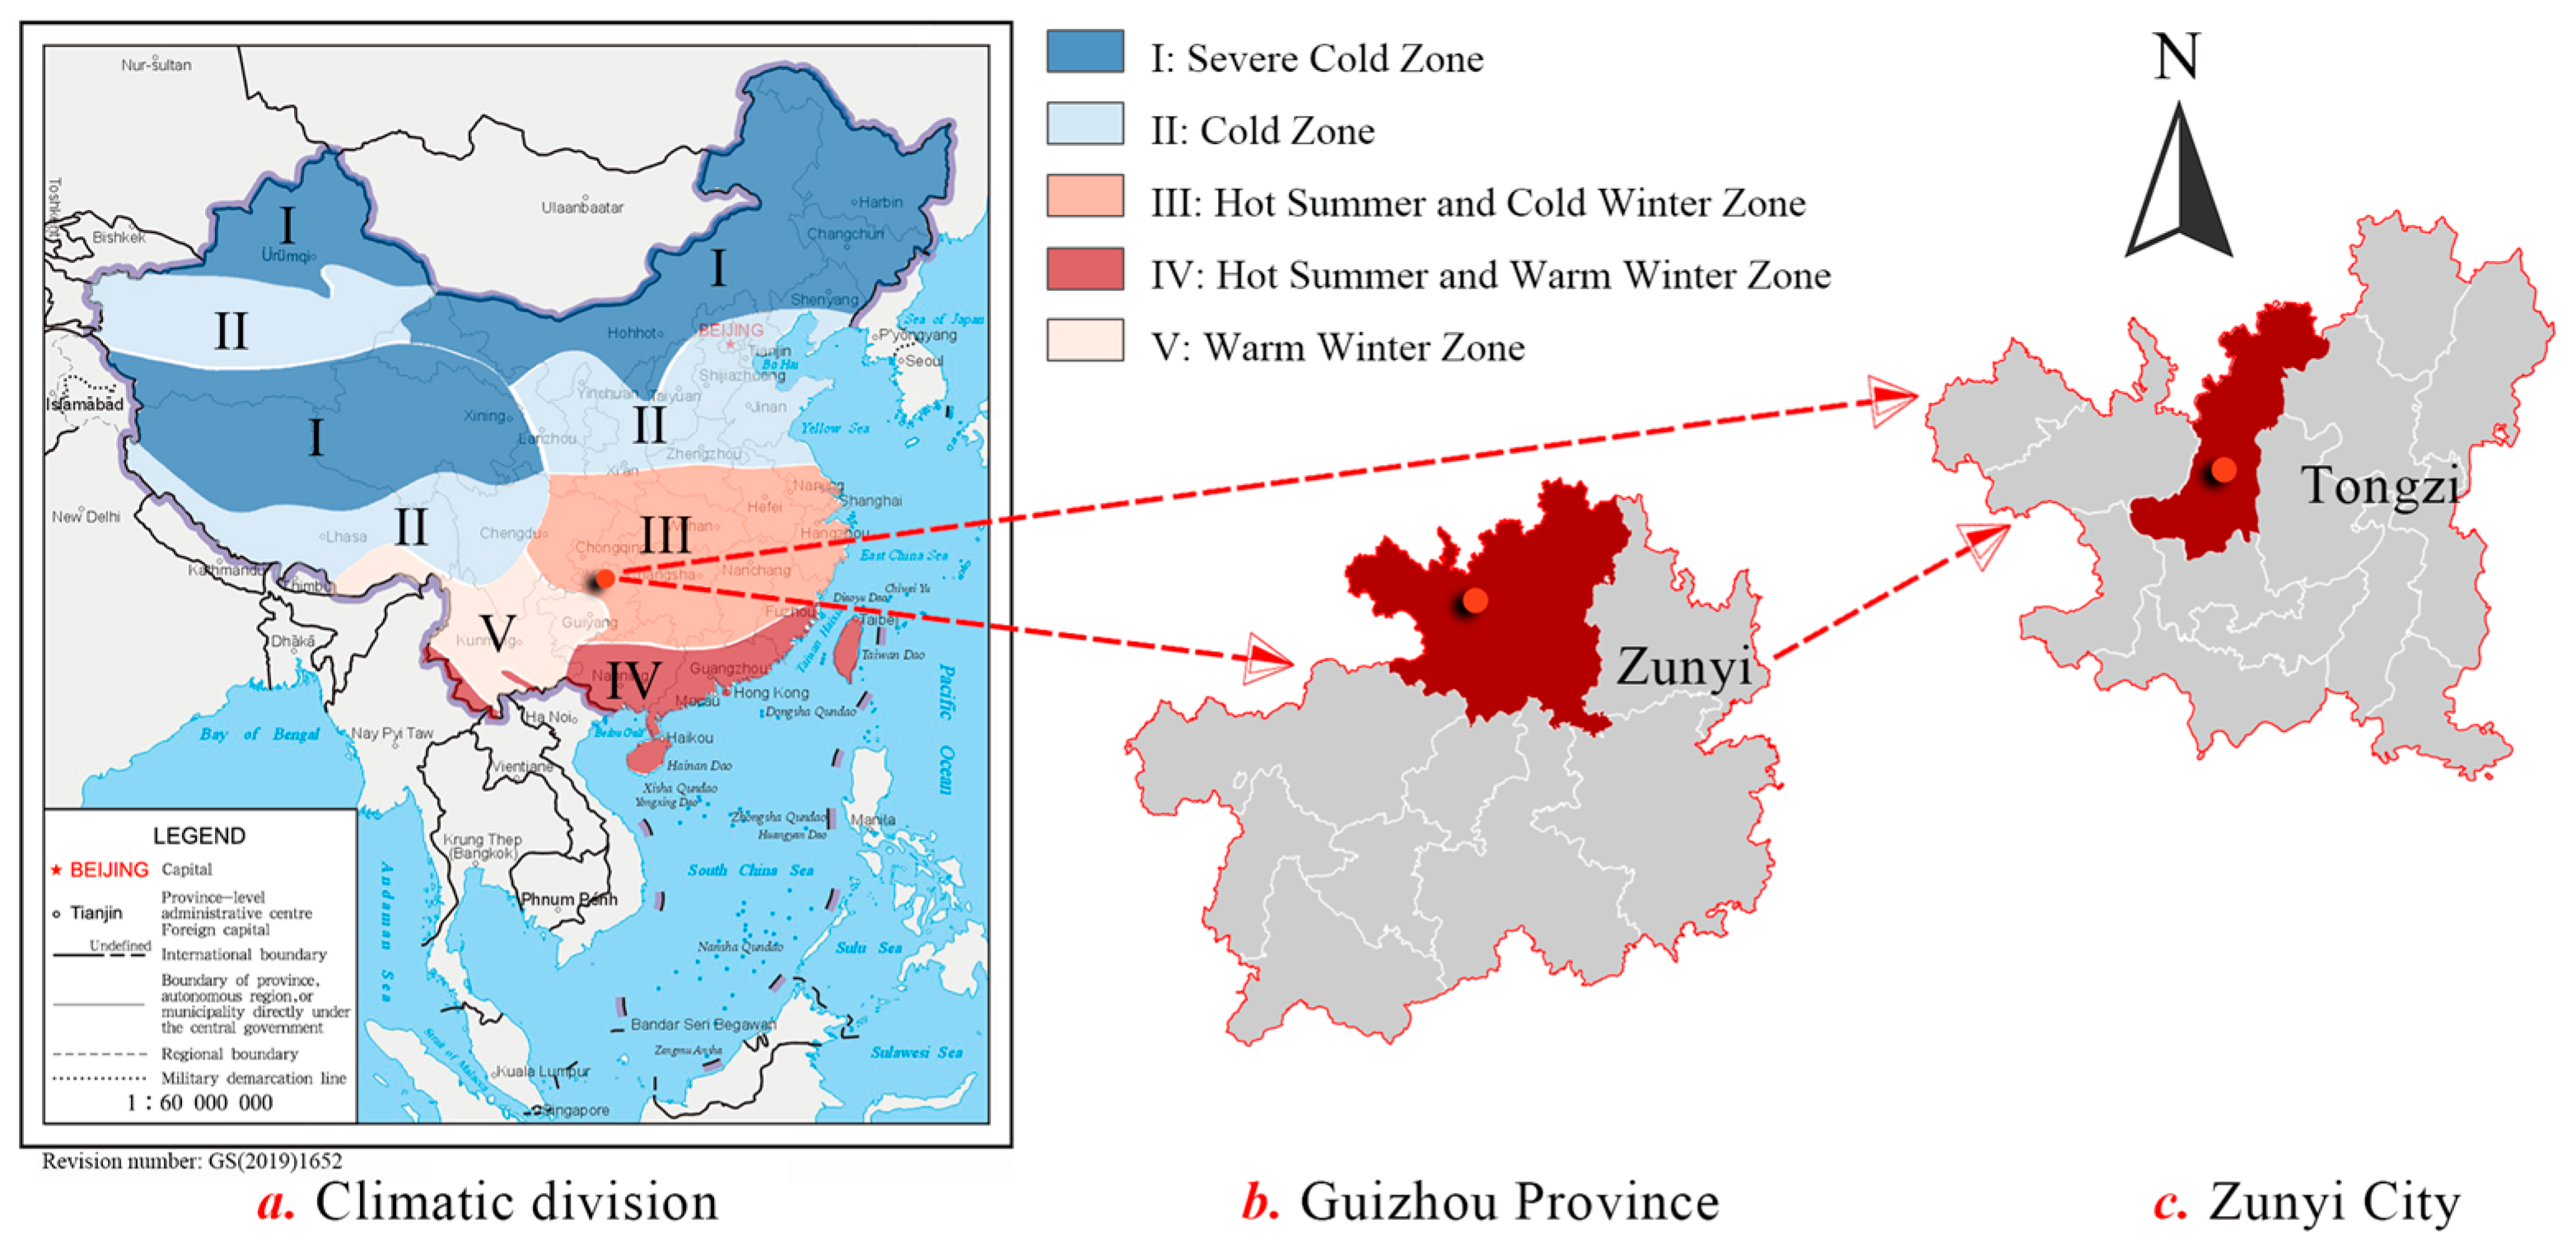
2. Research Region and Object
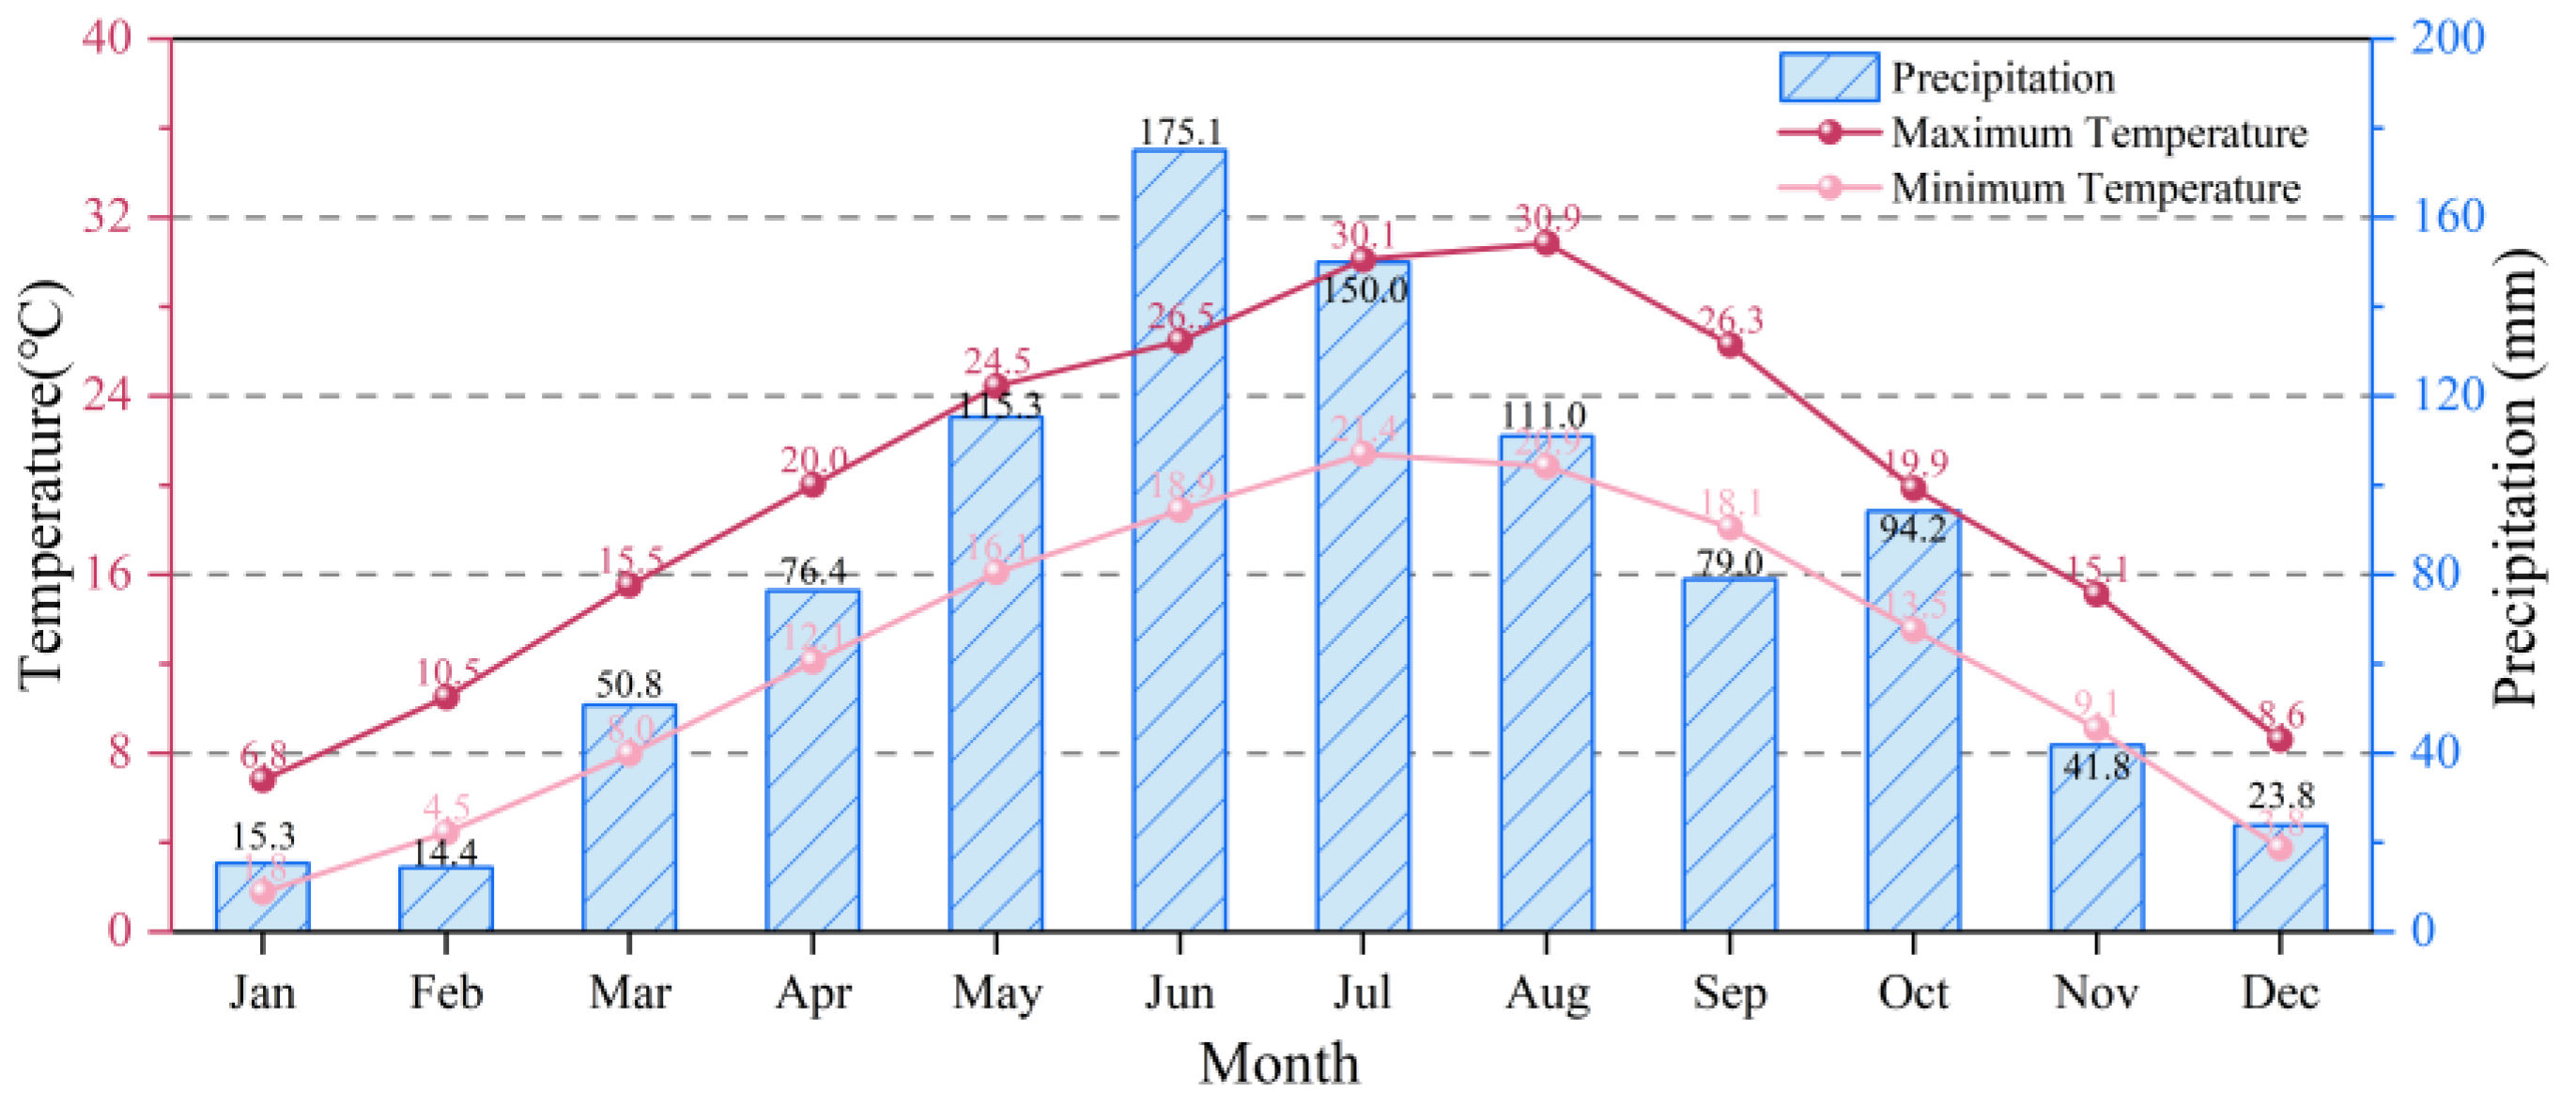
2.1. Geography and Climate
2.2. Characteristics of Rural Dwellings in Qianbei Region
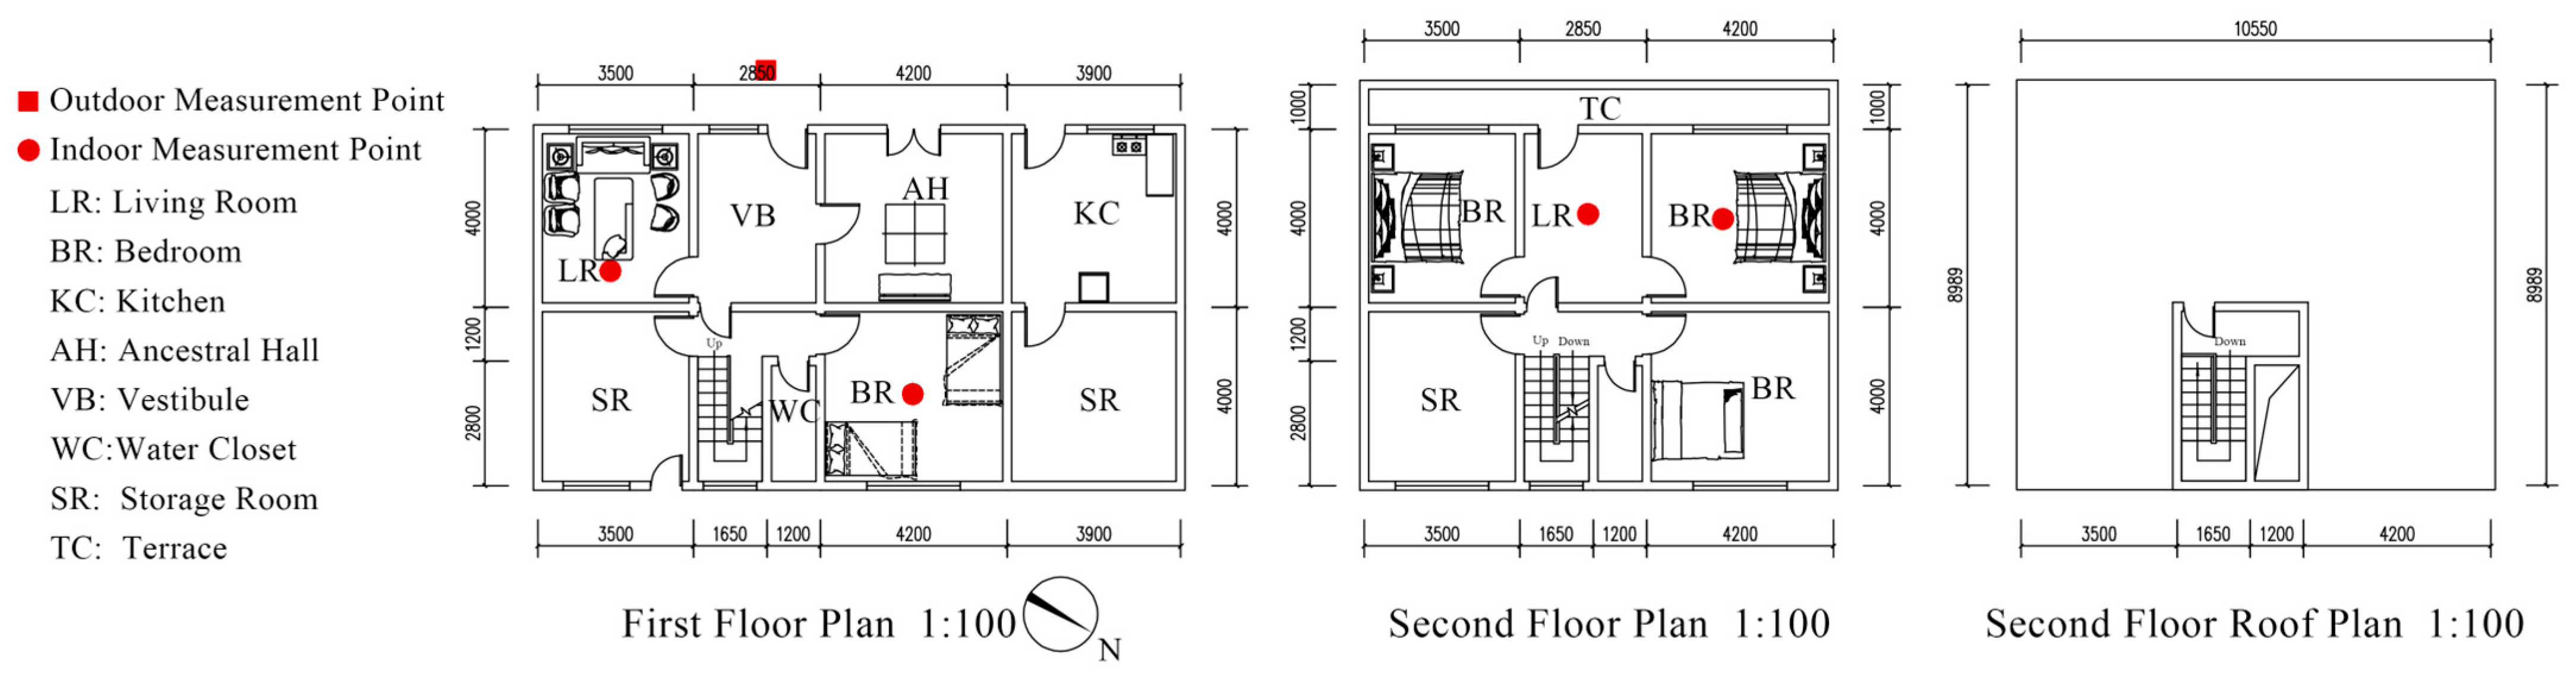
2.3. Profile of the Research Object
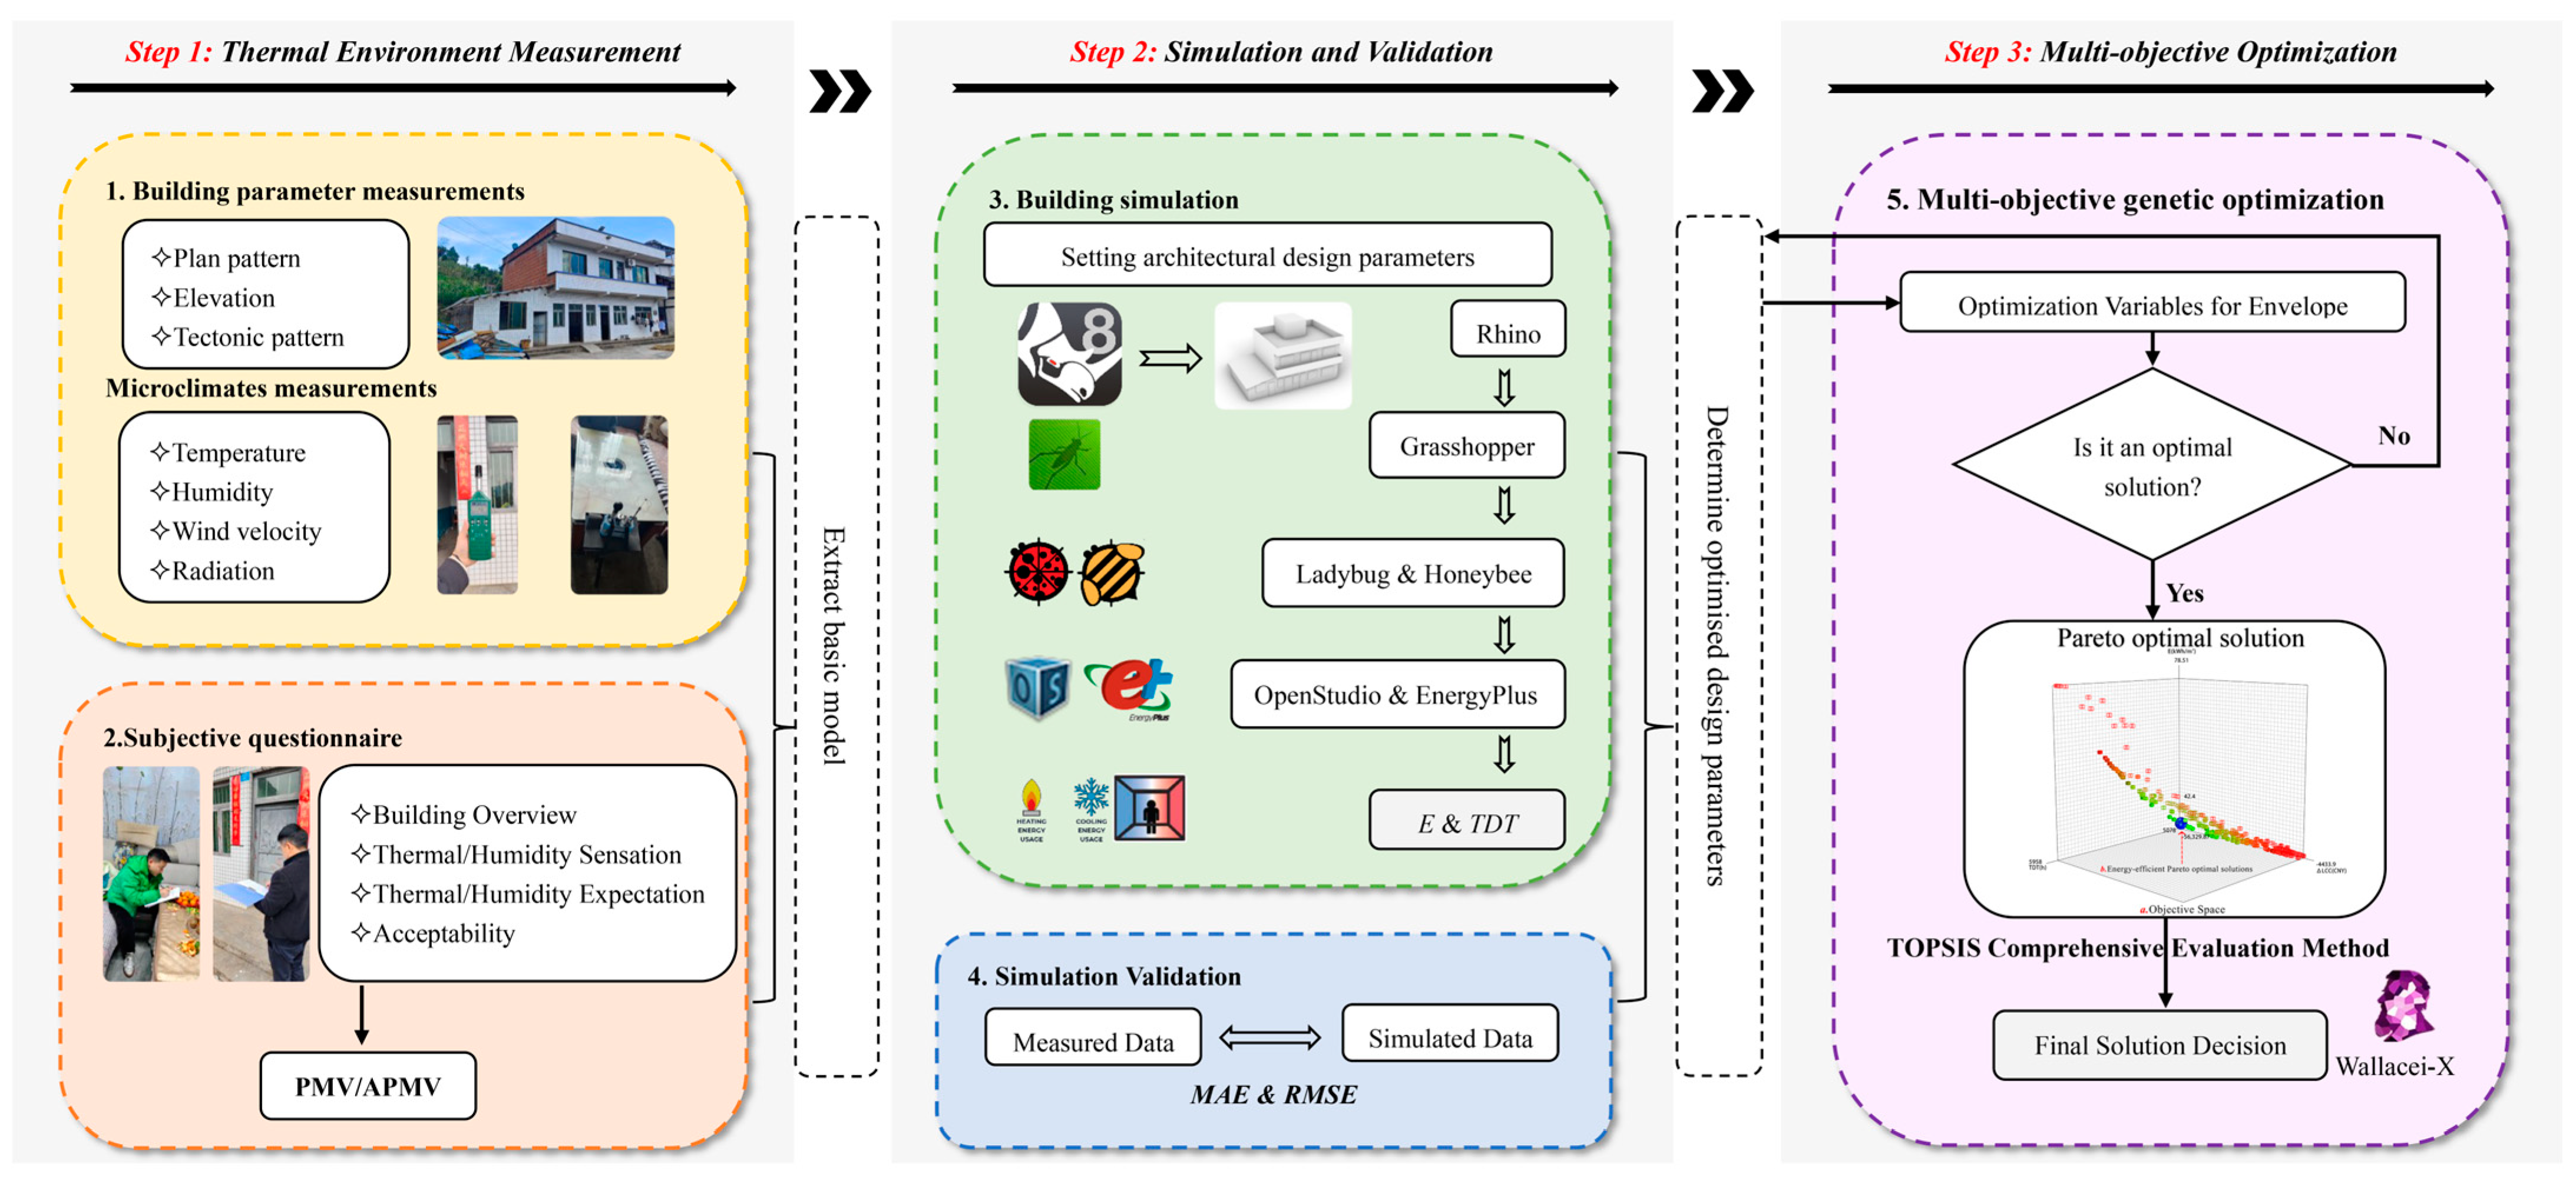
3. Methodology
3.1. Field Measurement and Questionnaire Survey of Sample Buildings
3.1.1. Measurement Time
3.1.2. Measurement Content
3.1.3. Measurement Method
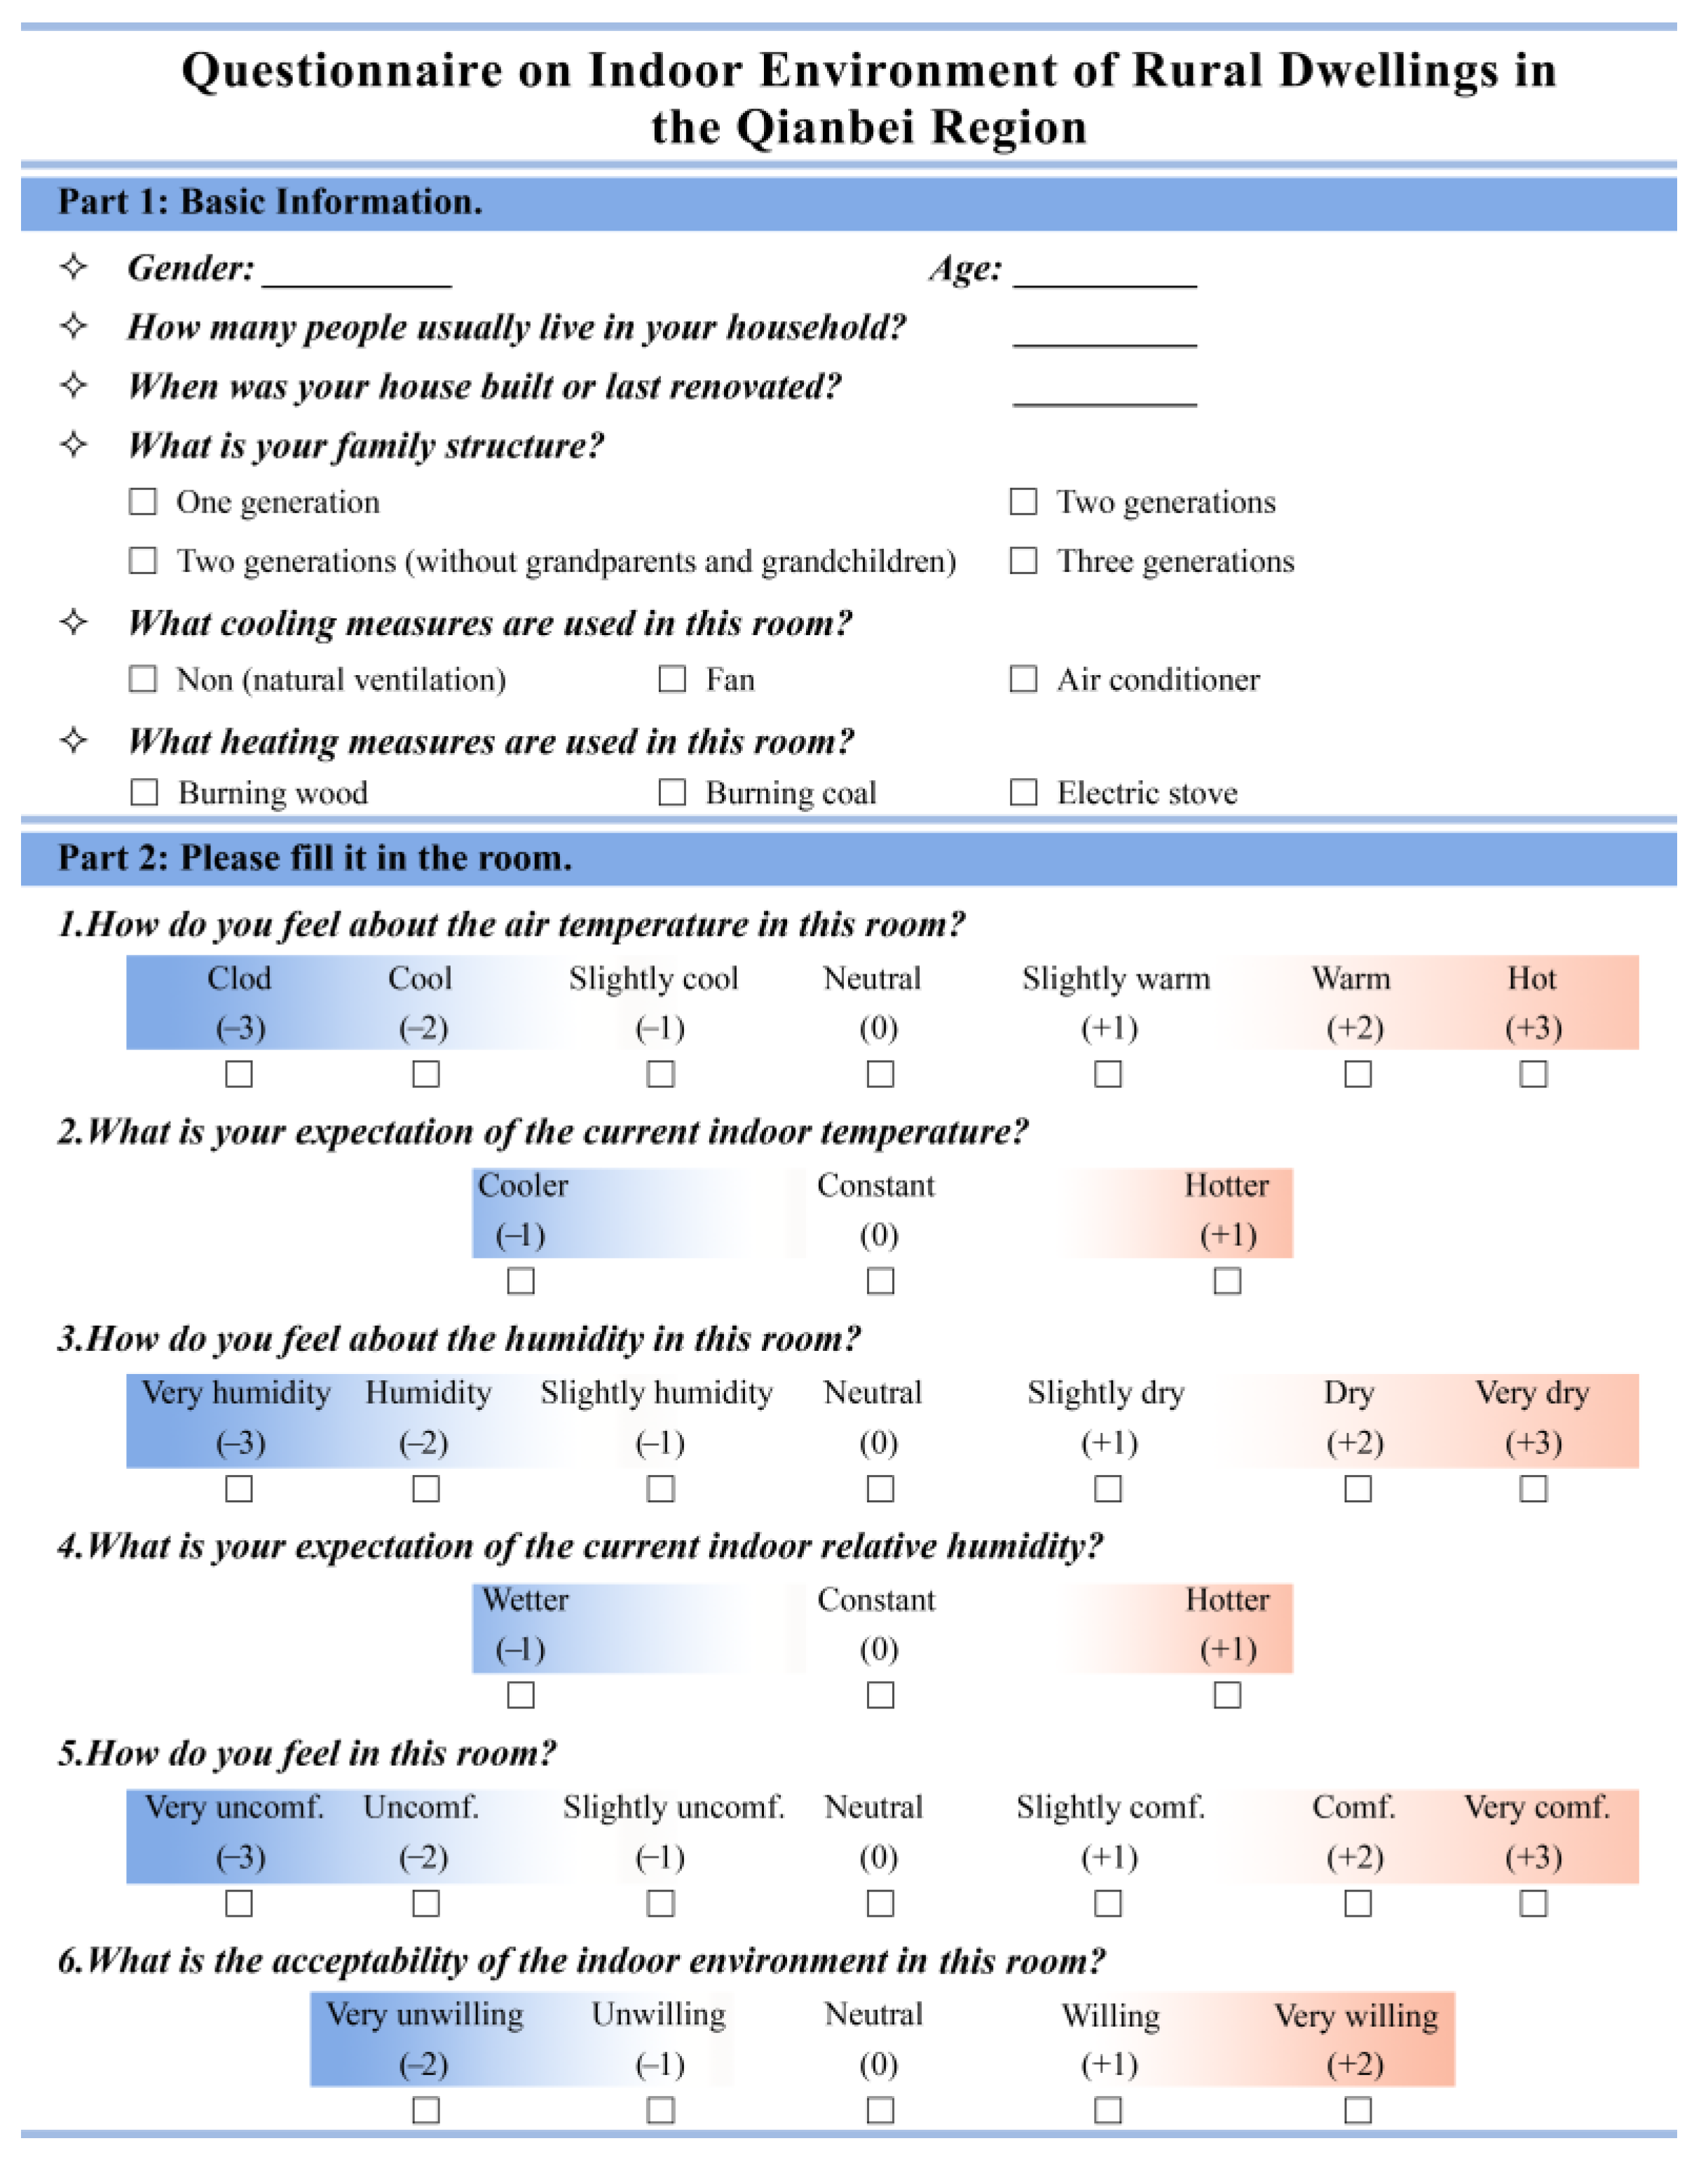
3.1.4. Questionnaire Survey
3.2. Building Performance Simulation and Validation
3.2.1. Simulation Method
- Geometric modeling: Based on measured data, Rhinoceros 8 was used to accurately construct a 3D geometric model of rural dwellings in the Qianbei Region, covering components such as walls, doors, and windows, to provide a spatial benchmark for subsequent analysis;
- Parametric design: The Grasshopper visual programming platform was used to dynamically adjust the variable parameters of the building envelope, enabling it to quickly generate hundreds of retrofit schemes and automatically transfer the parameters to the performance simulation module;
- Climate data analysis: Using Ladybug to analyze typical meteorological data for the Zunyi area for a typical year. The climate data comes from the EPW Map website. The Zunyi EPW weather file used is CHN_GZ_Zunyi.577130_CSWD.epw [49];
- Energy model construction: Honeybee was used to construct the building energy simulation model and connect it to the simulation engine. The building operating parameters shown in Table 5 were set with reference to the “General Code for Energy Efficiency of Buildings and Utilization of Renewable Energy GB55015-2021” [50];
- Dynamic simulation: The energy simulation engine OpenStudio and EnergyPlus were called to perform hourly simulations for 8760 h throughout the year to simulate the annual energy consumption and thermal comfort of the building [51].
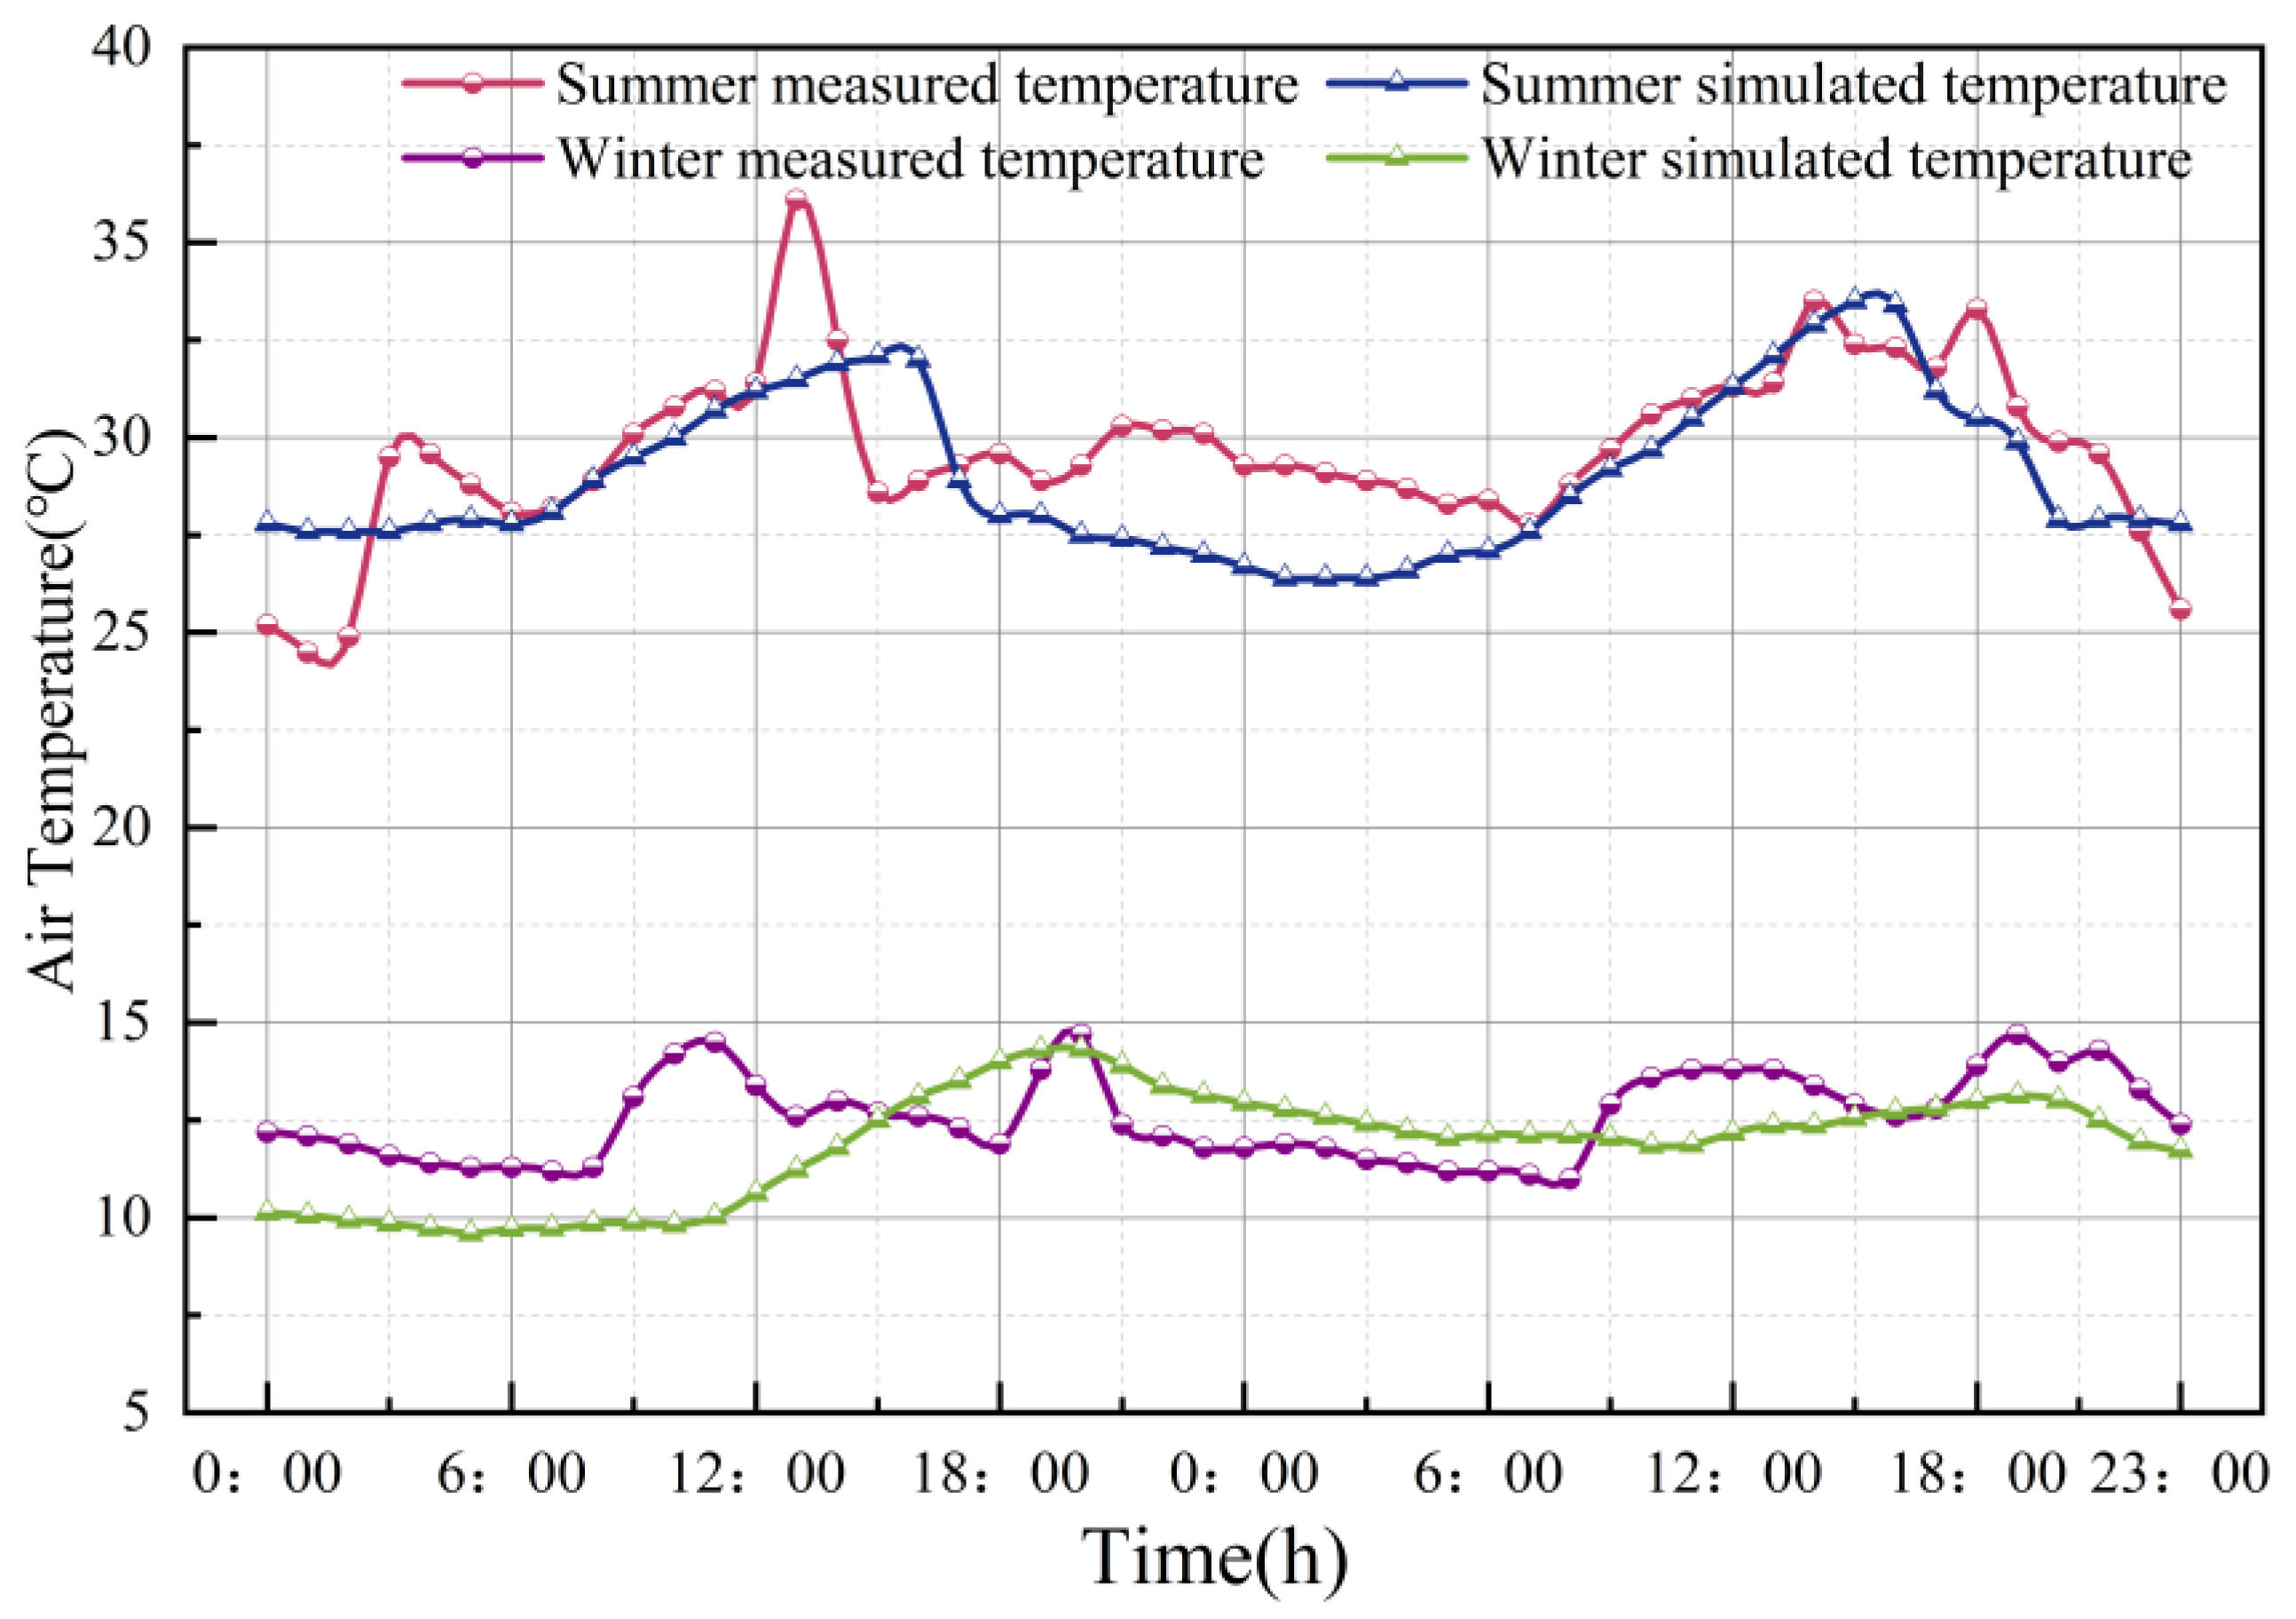
3.2.2. Simulation Verification
3.3. Multi-Objective Optimization
3.3.1. Multi-Objective Optimization Approaches
3.3.2. NSGA-II Algorithm
3.3.3. Optimization of Objective Function Setting
- Sub-objective Function f1(x) = E
- 2.
- Sub-objective Function f2(x) = TDT
- 3.
- Sub-objective Function f3(x) = ΔLCC
3.3.4. Optimization Variables
4. Results and Analysis
4.1. Analysis of Field Test Results
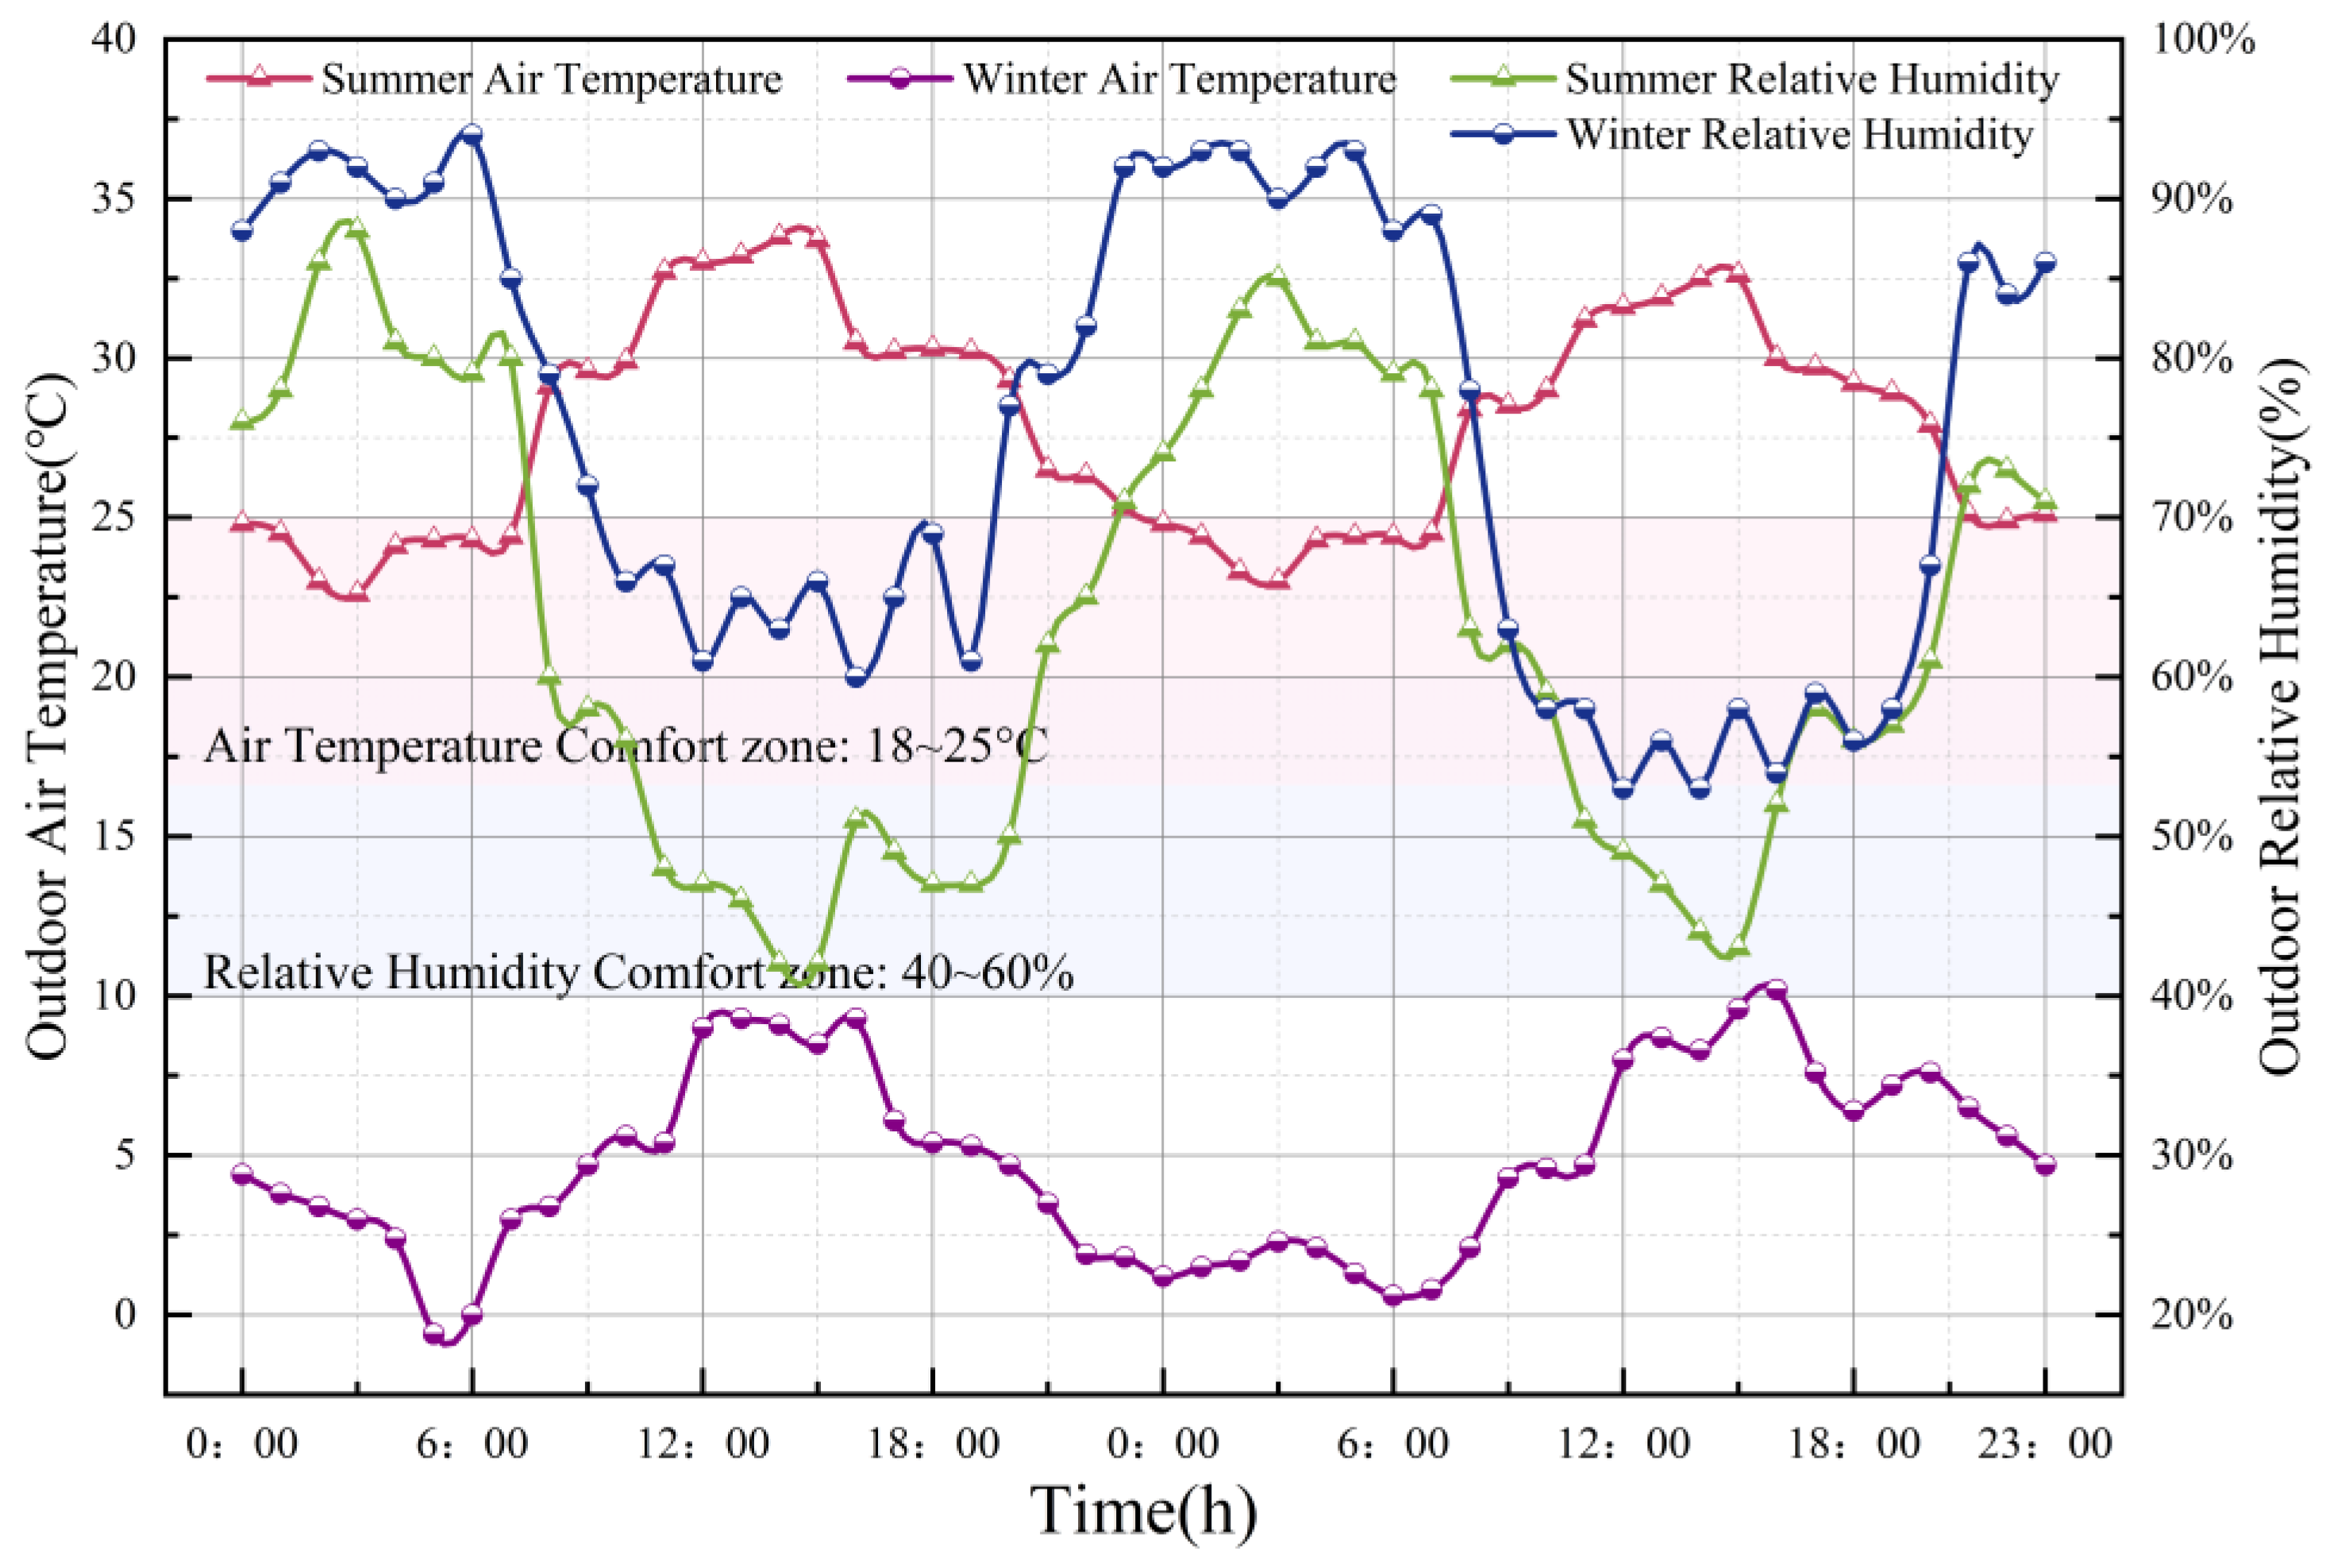
4.1.1. Outdoor Test Results
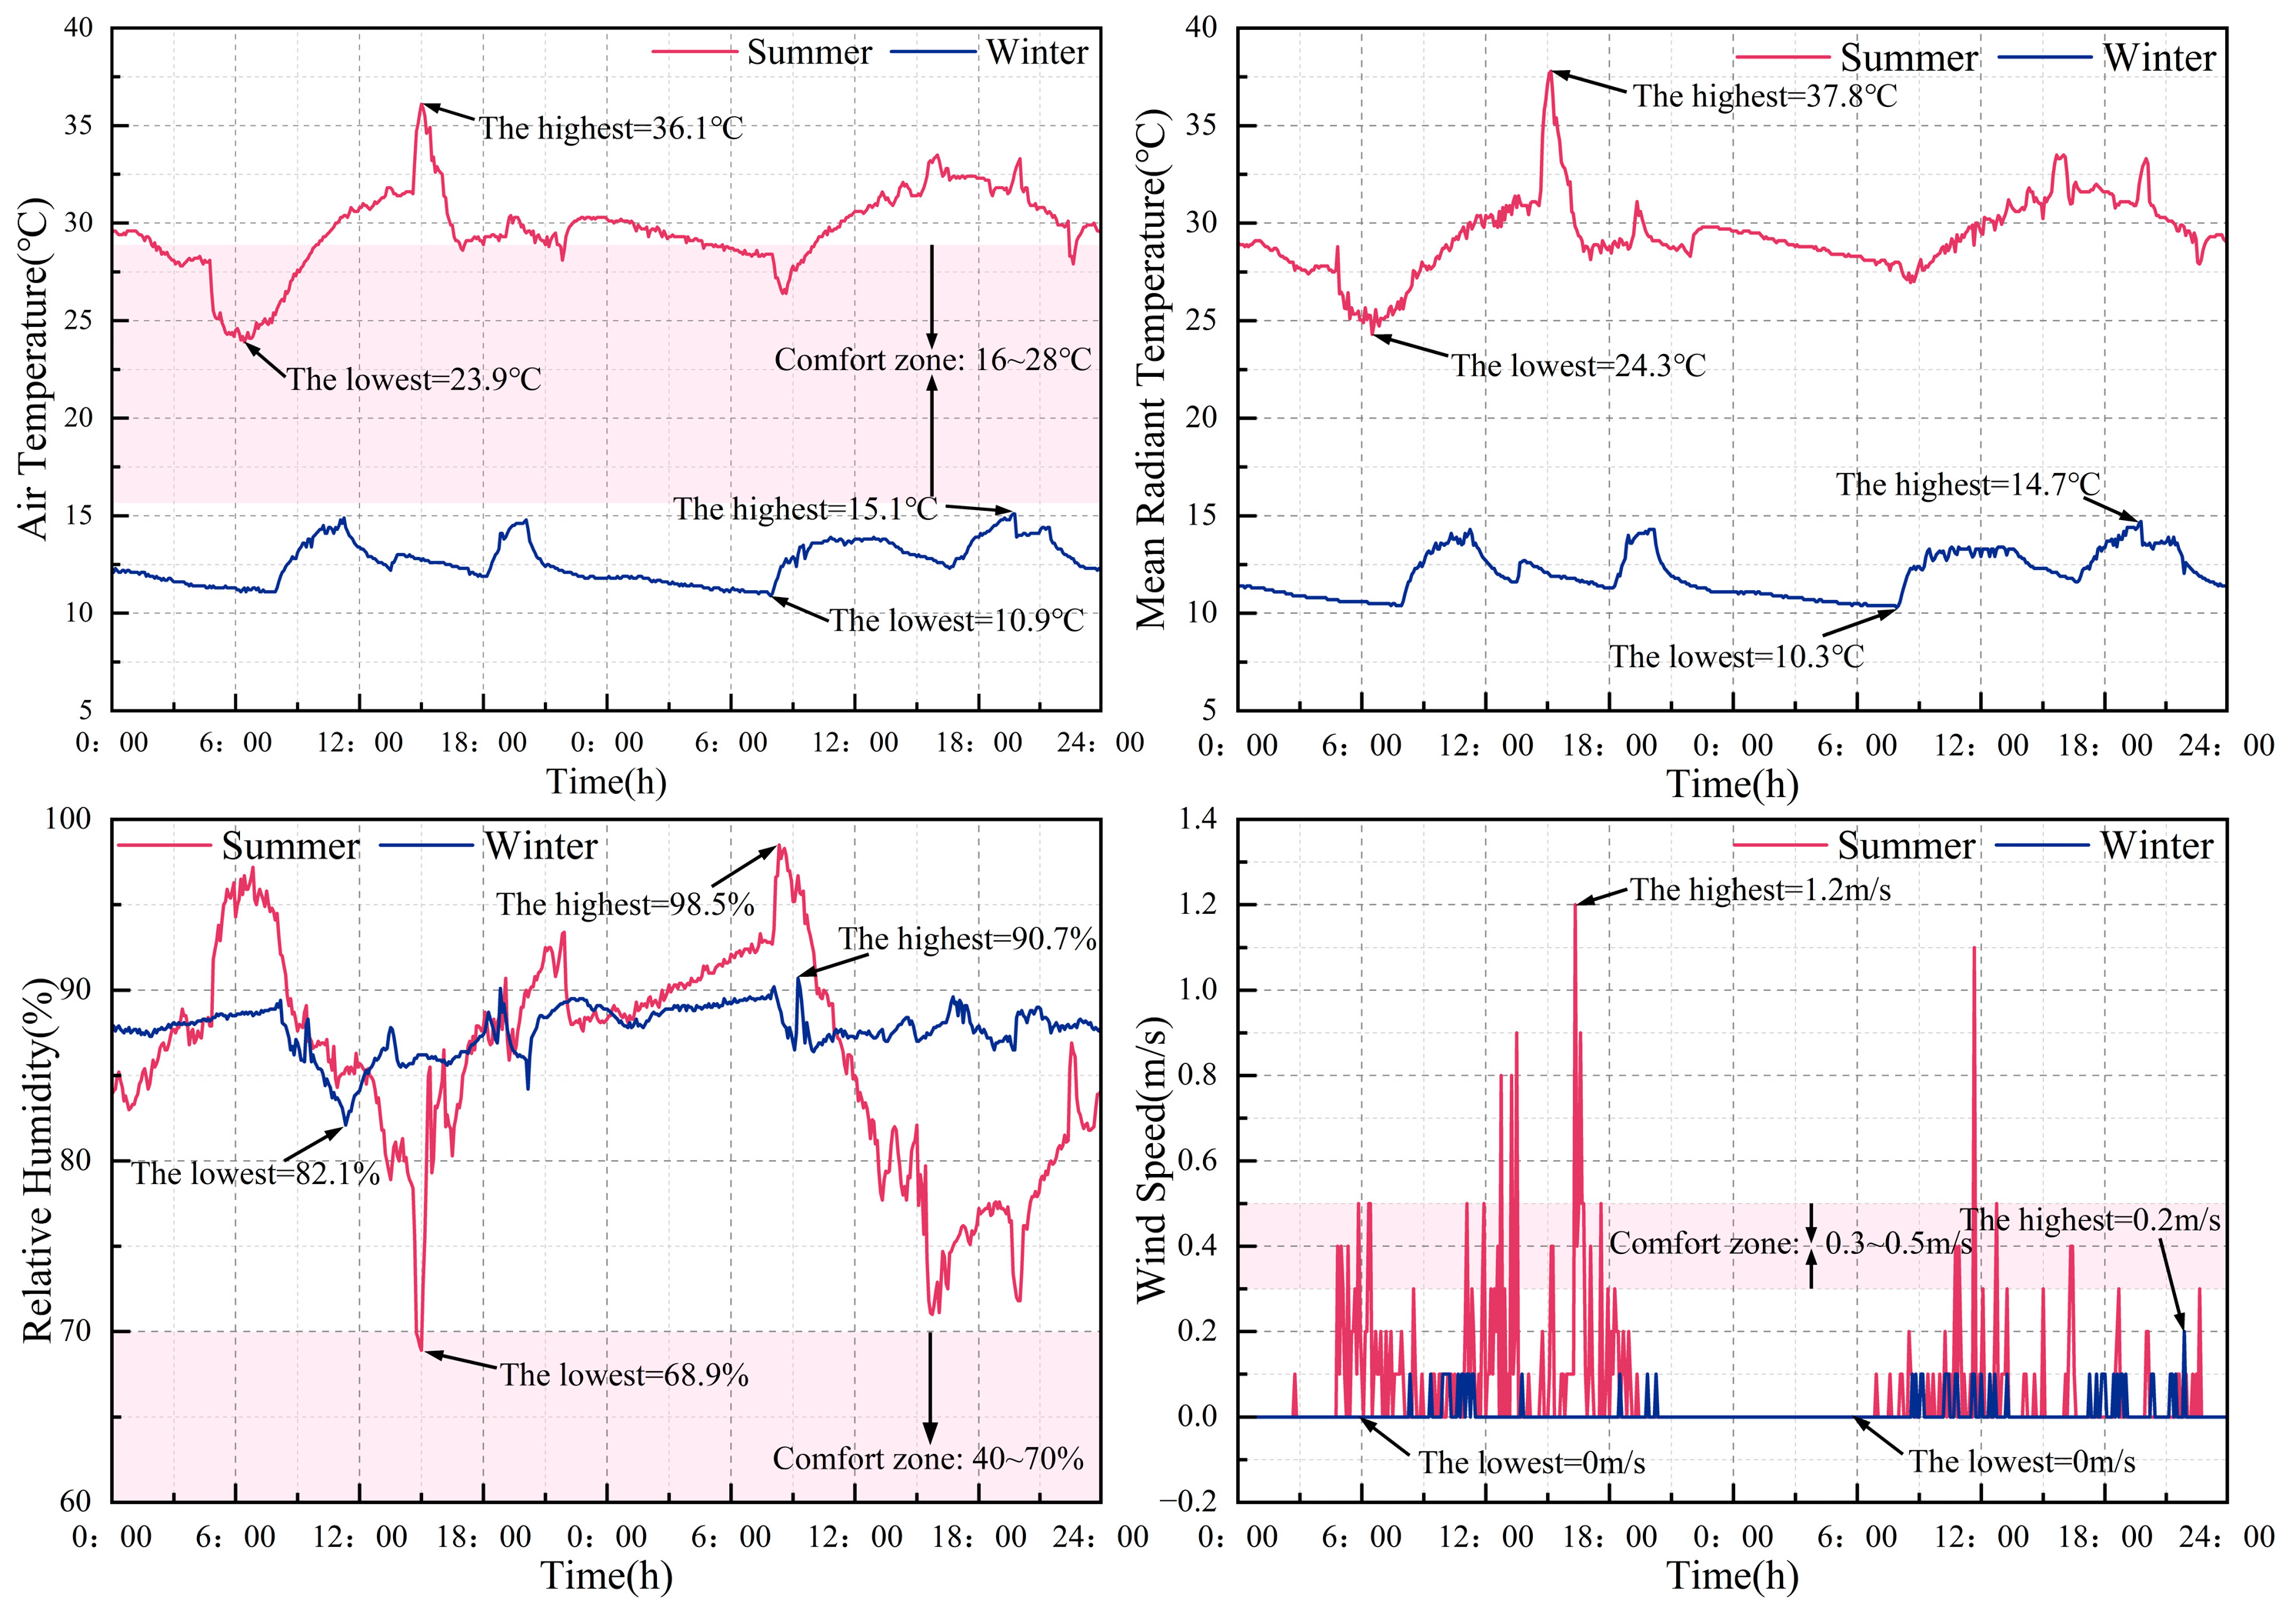
4.1.2. Indoor Test Results
4.1.3. Results of the Questionnaire Survey
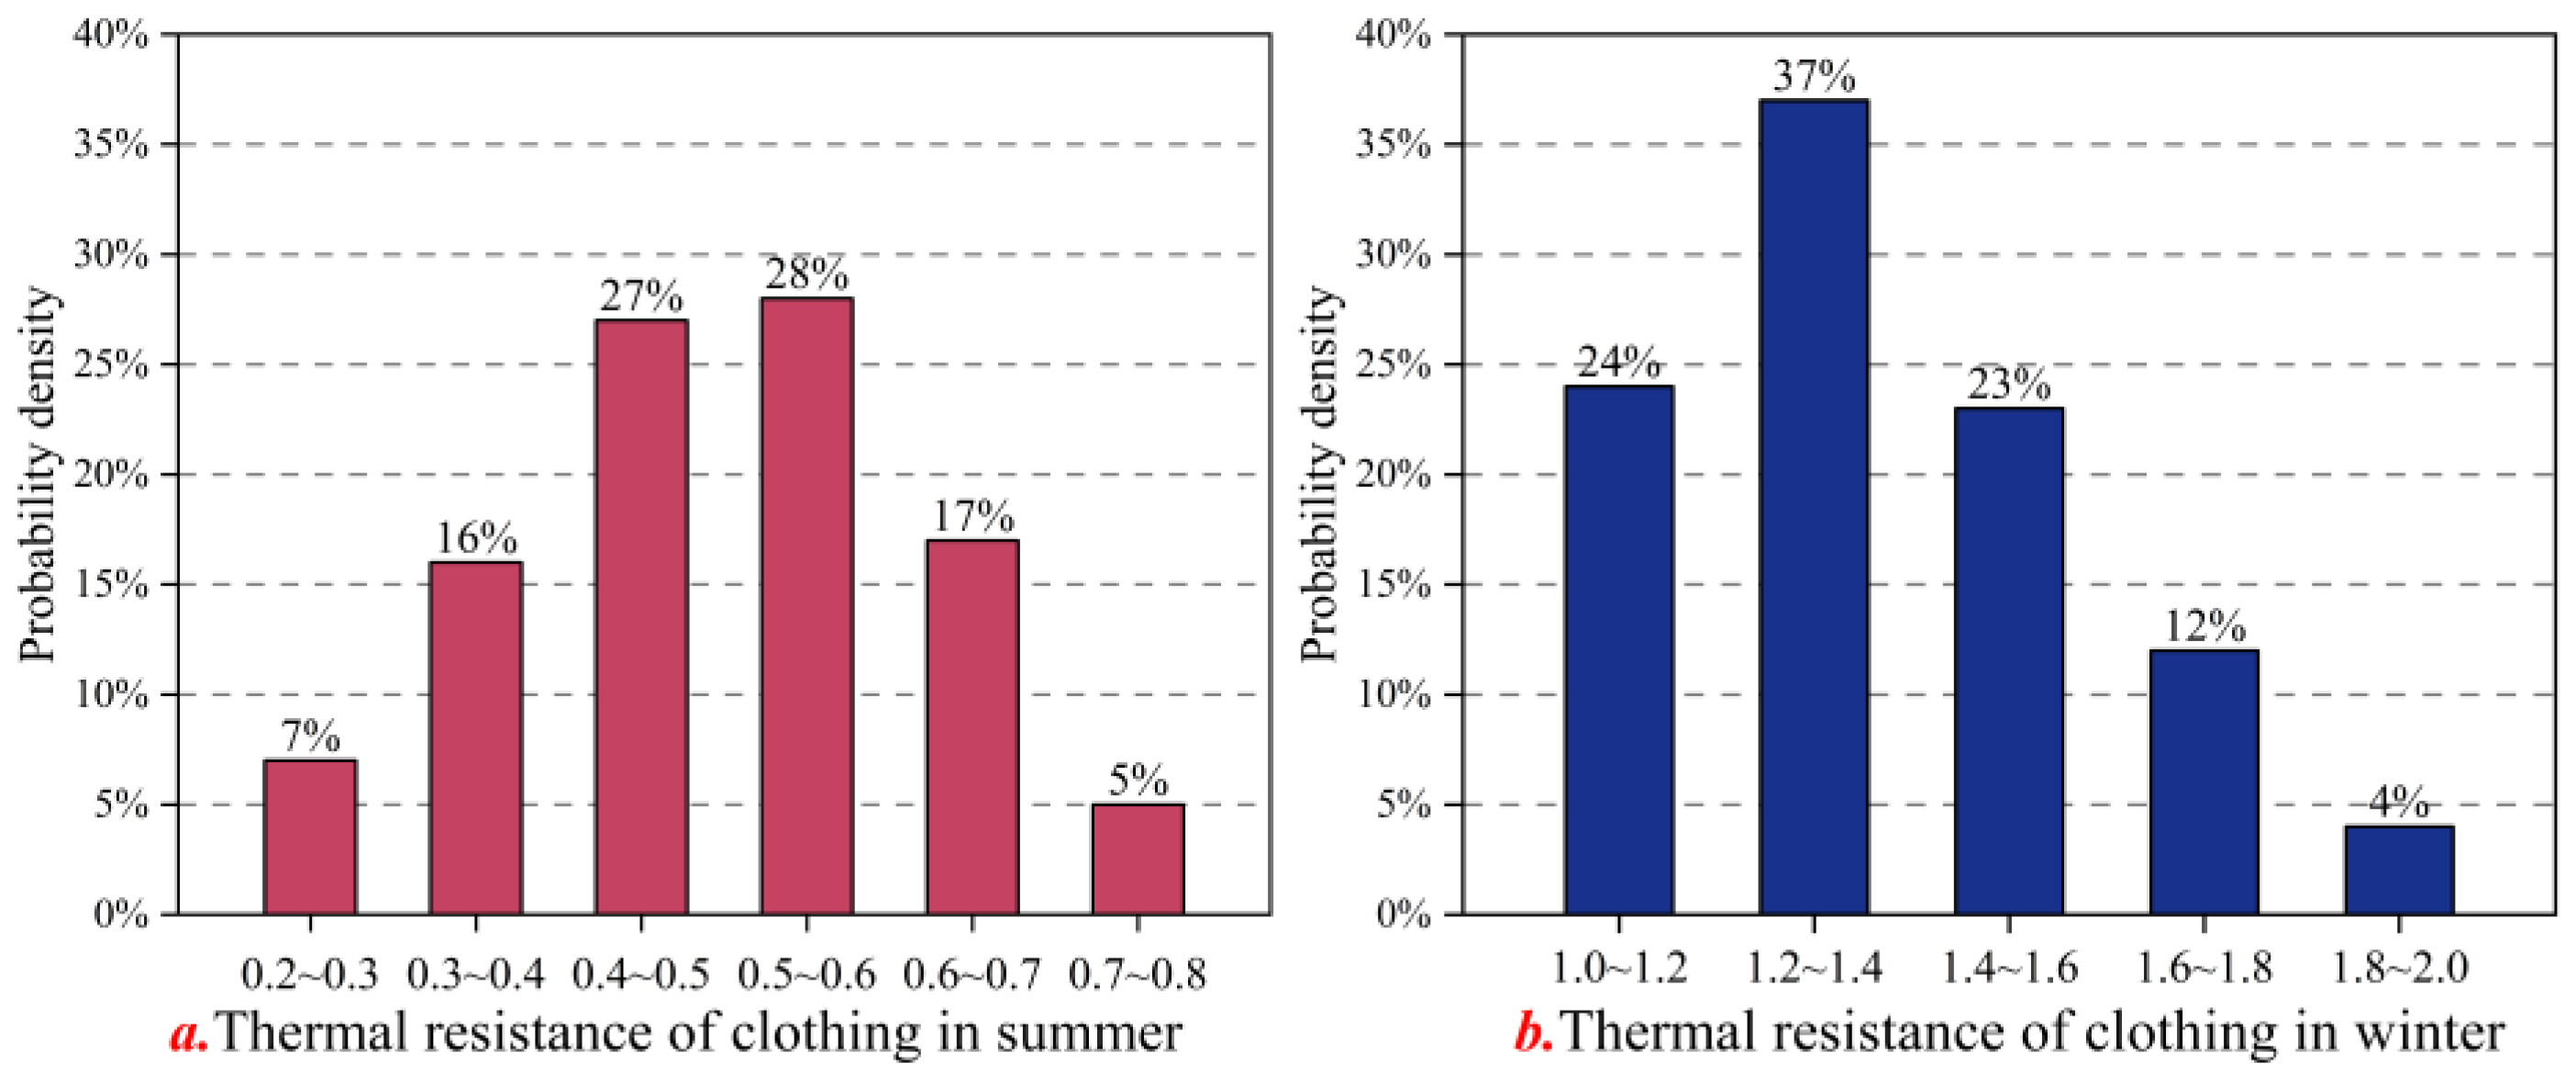
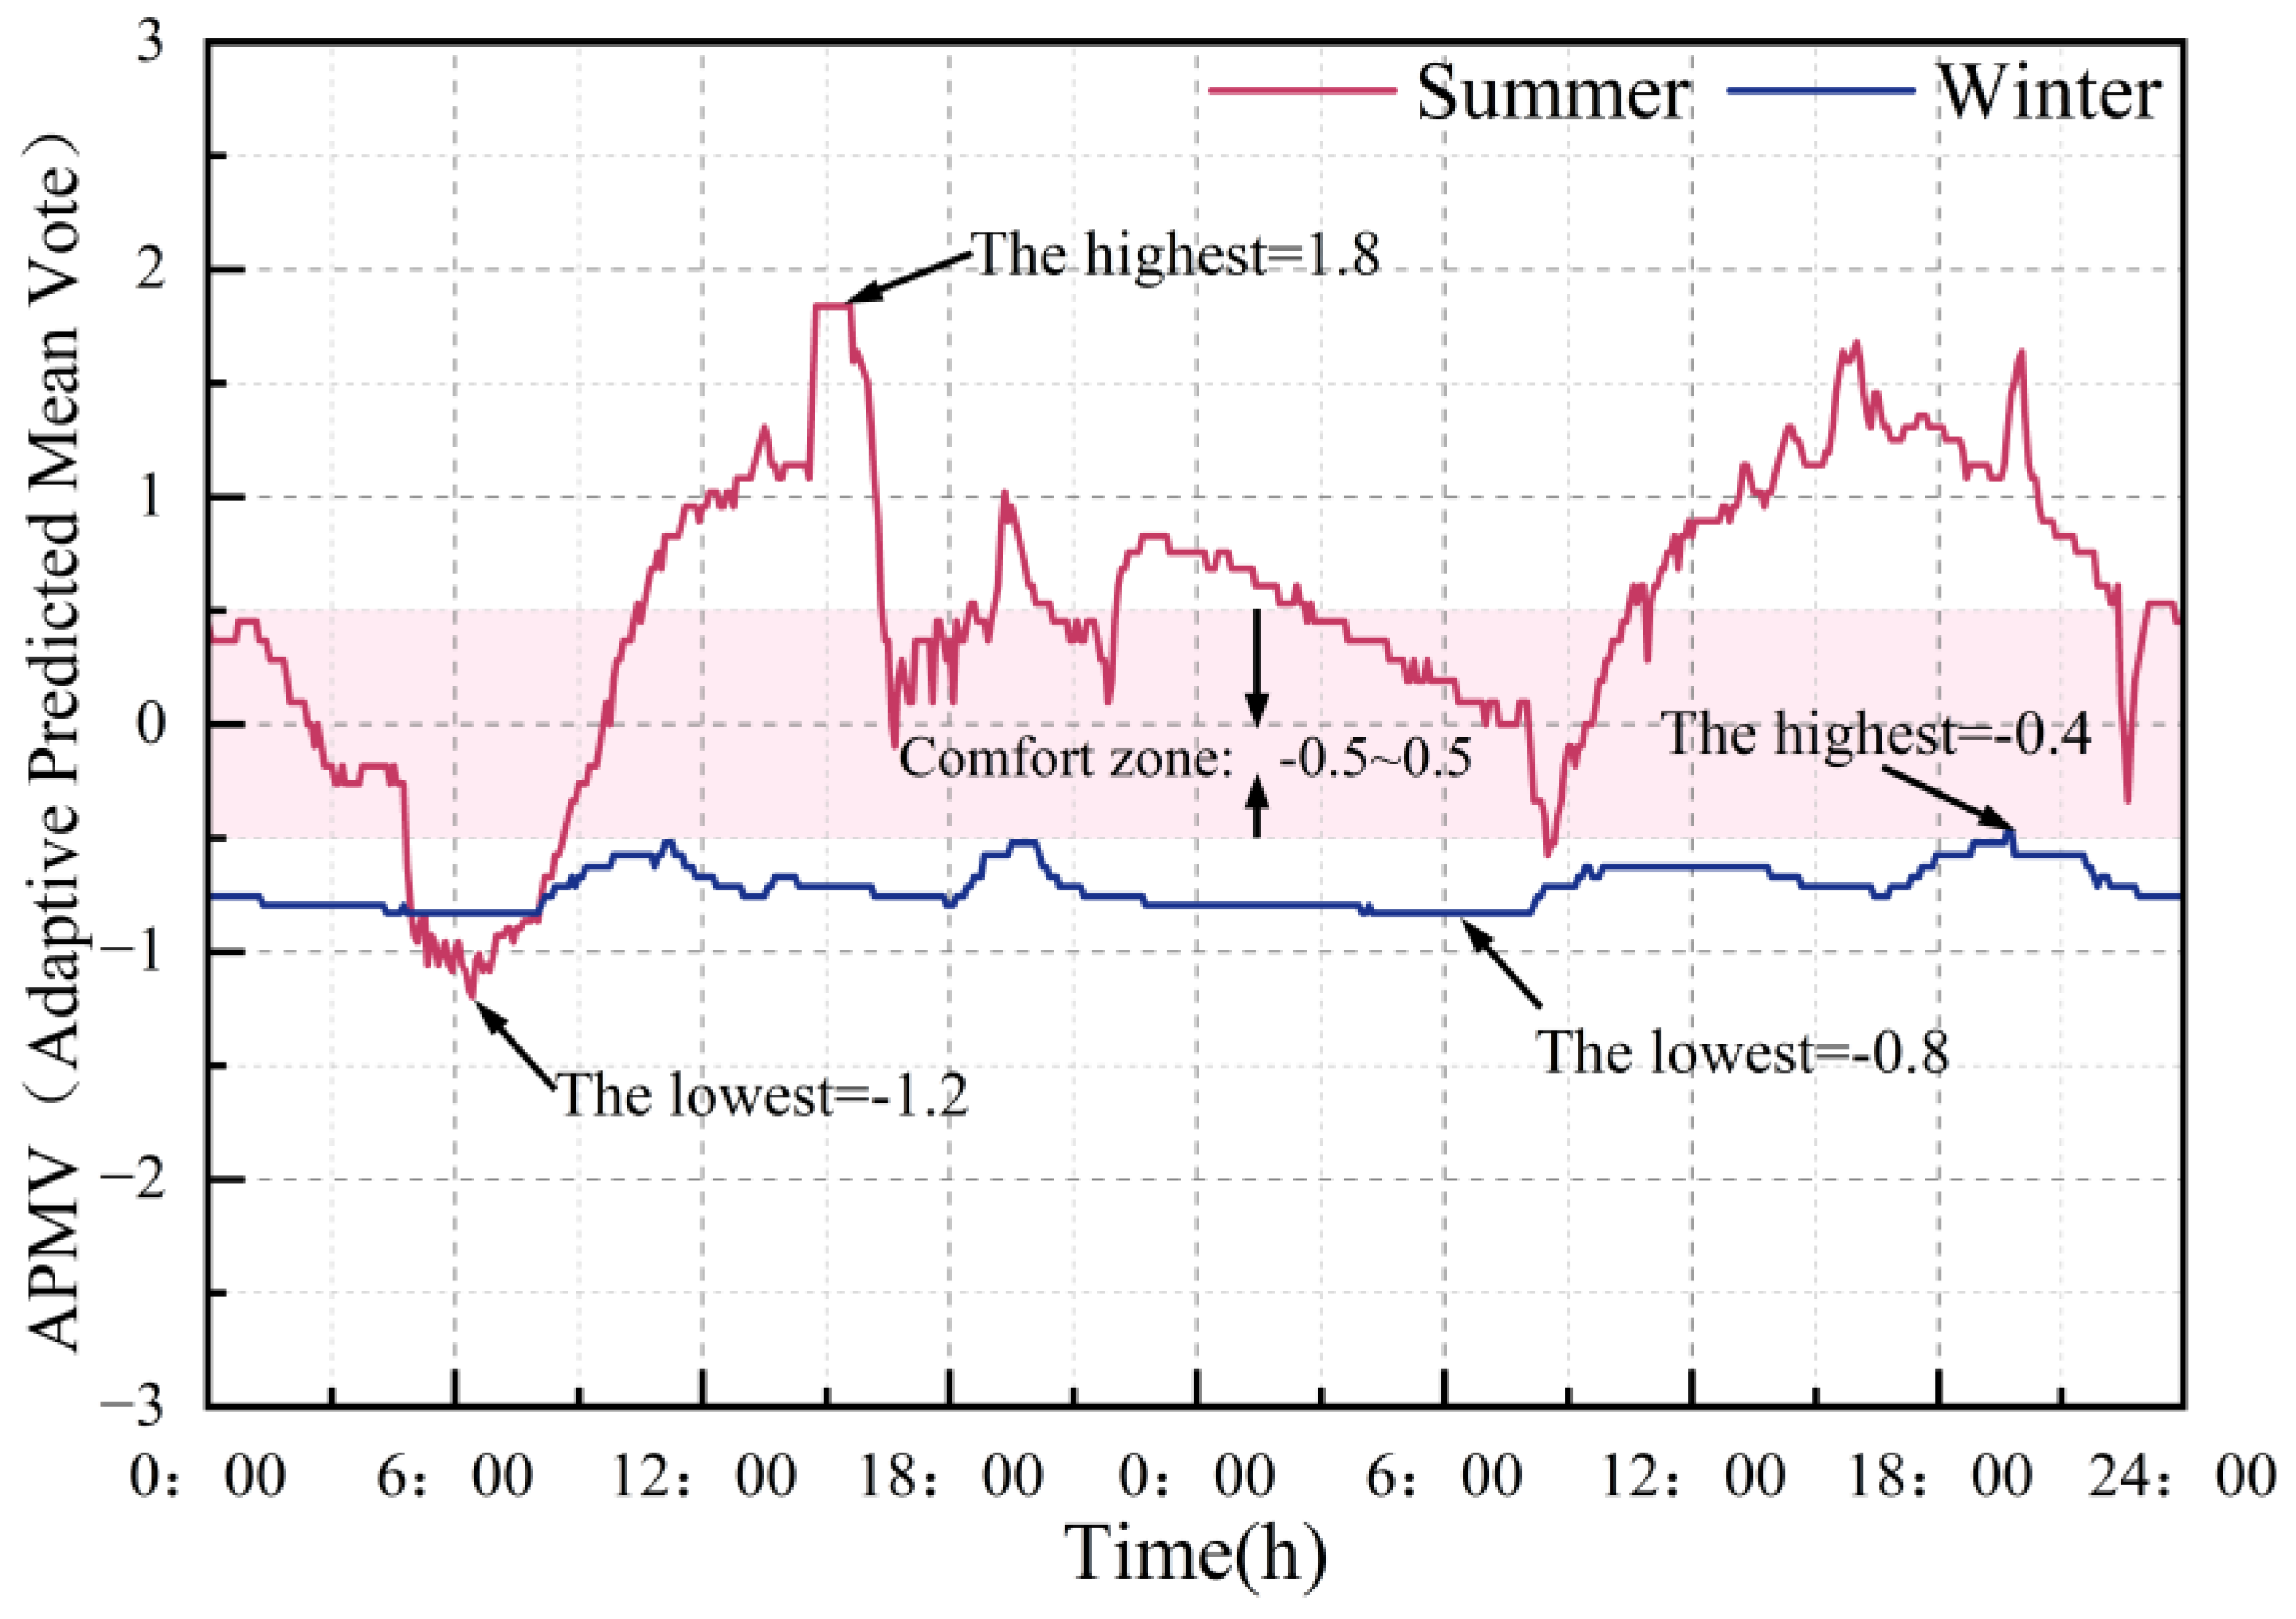
4.1.4. Analysis of Indoor Thermal Comfort
4.2. Verification and Analysis of Simulation Results
4.3. Analysis of Multi-Objective Optimization Results
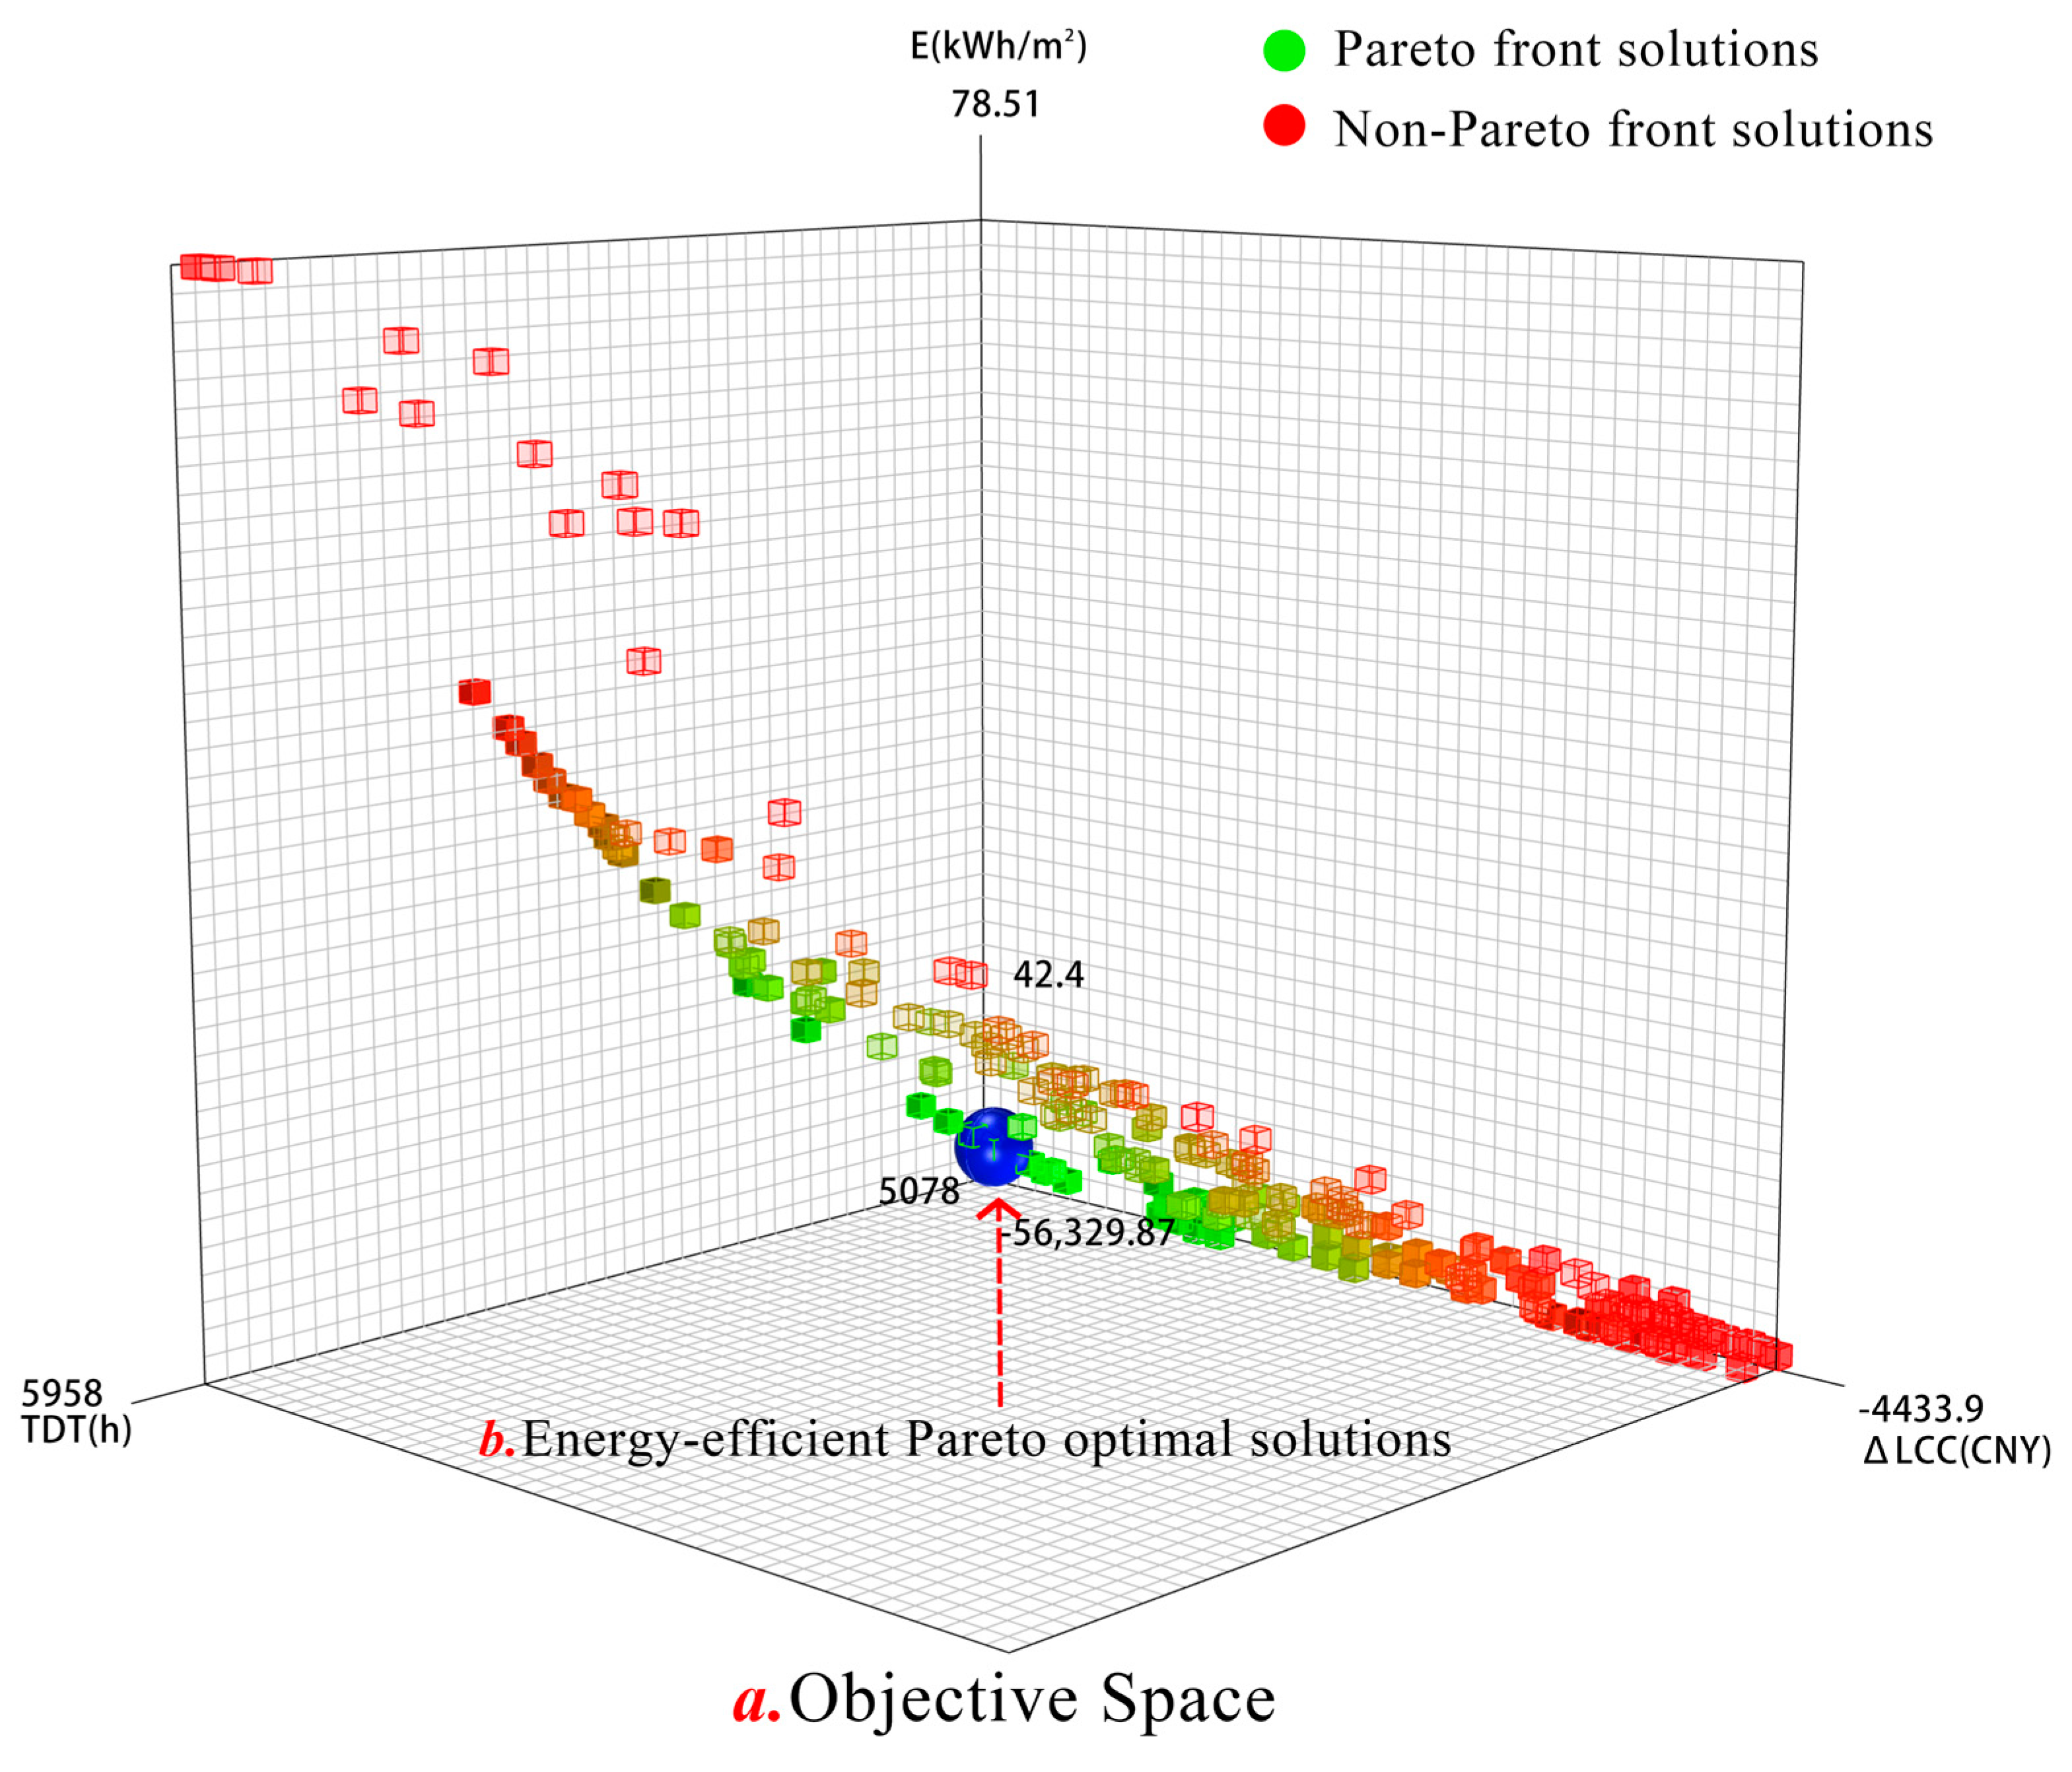
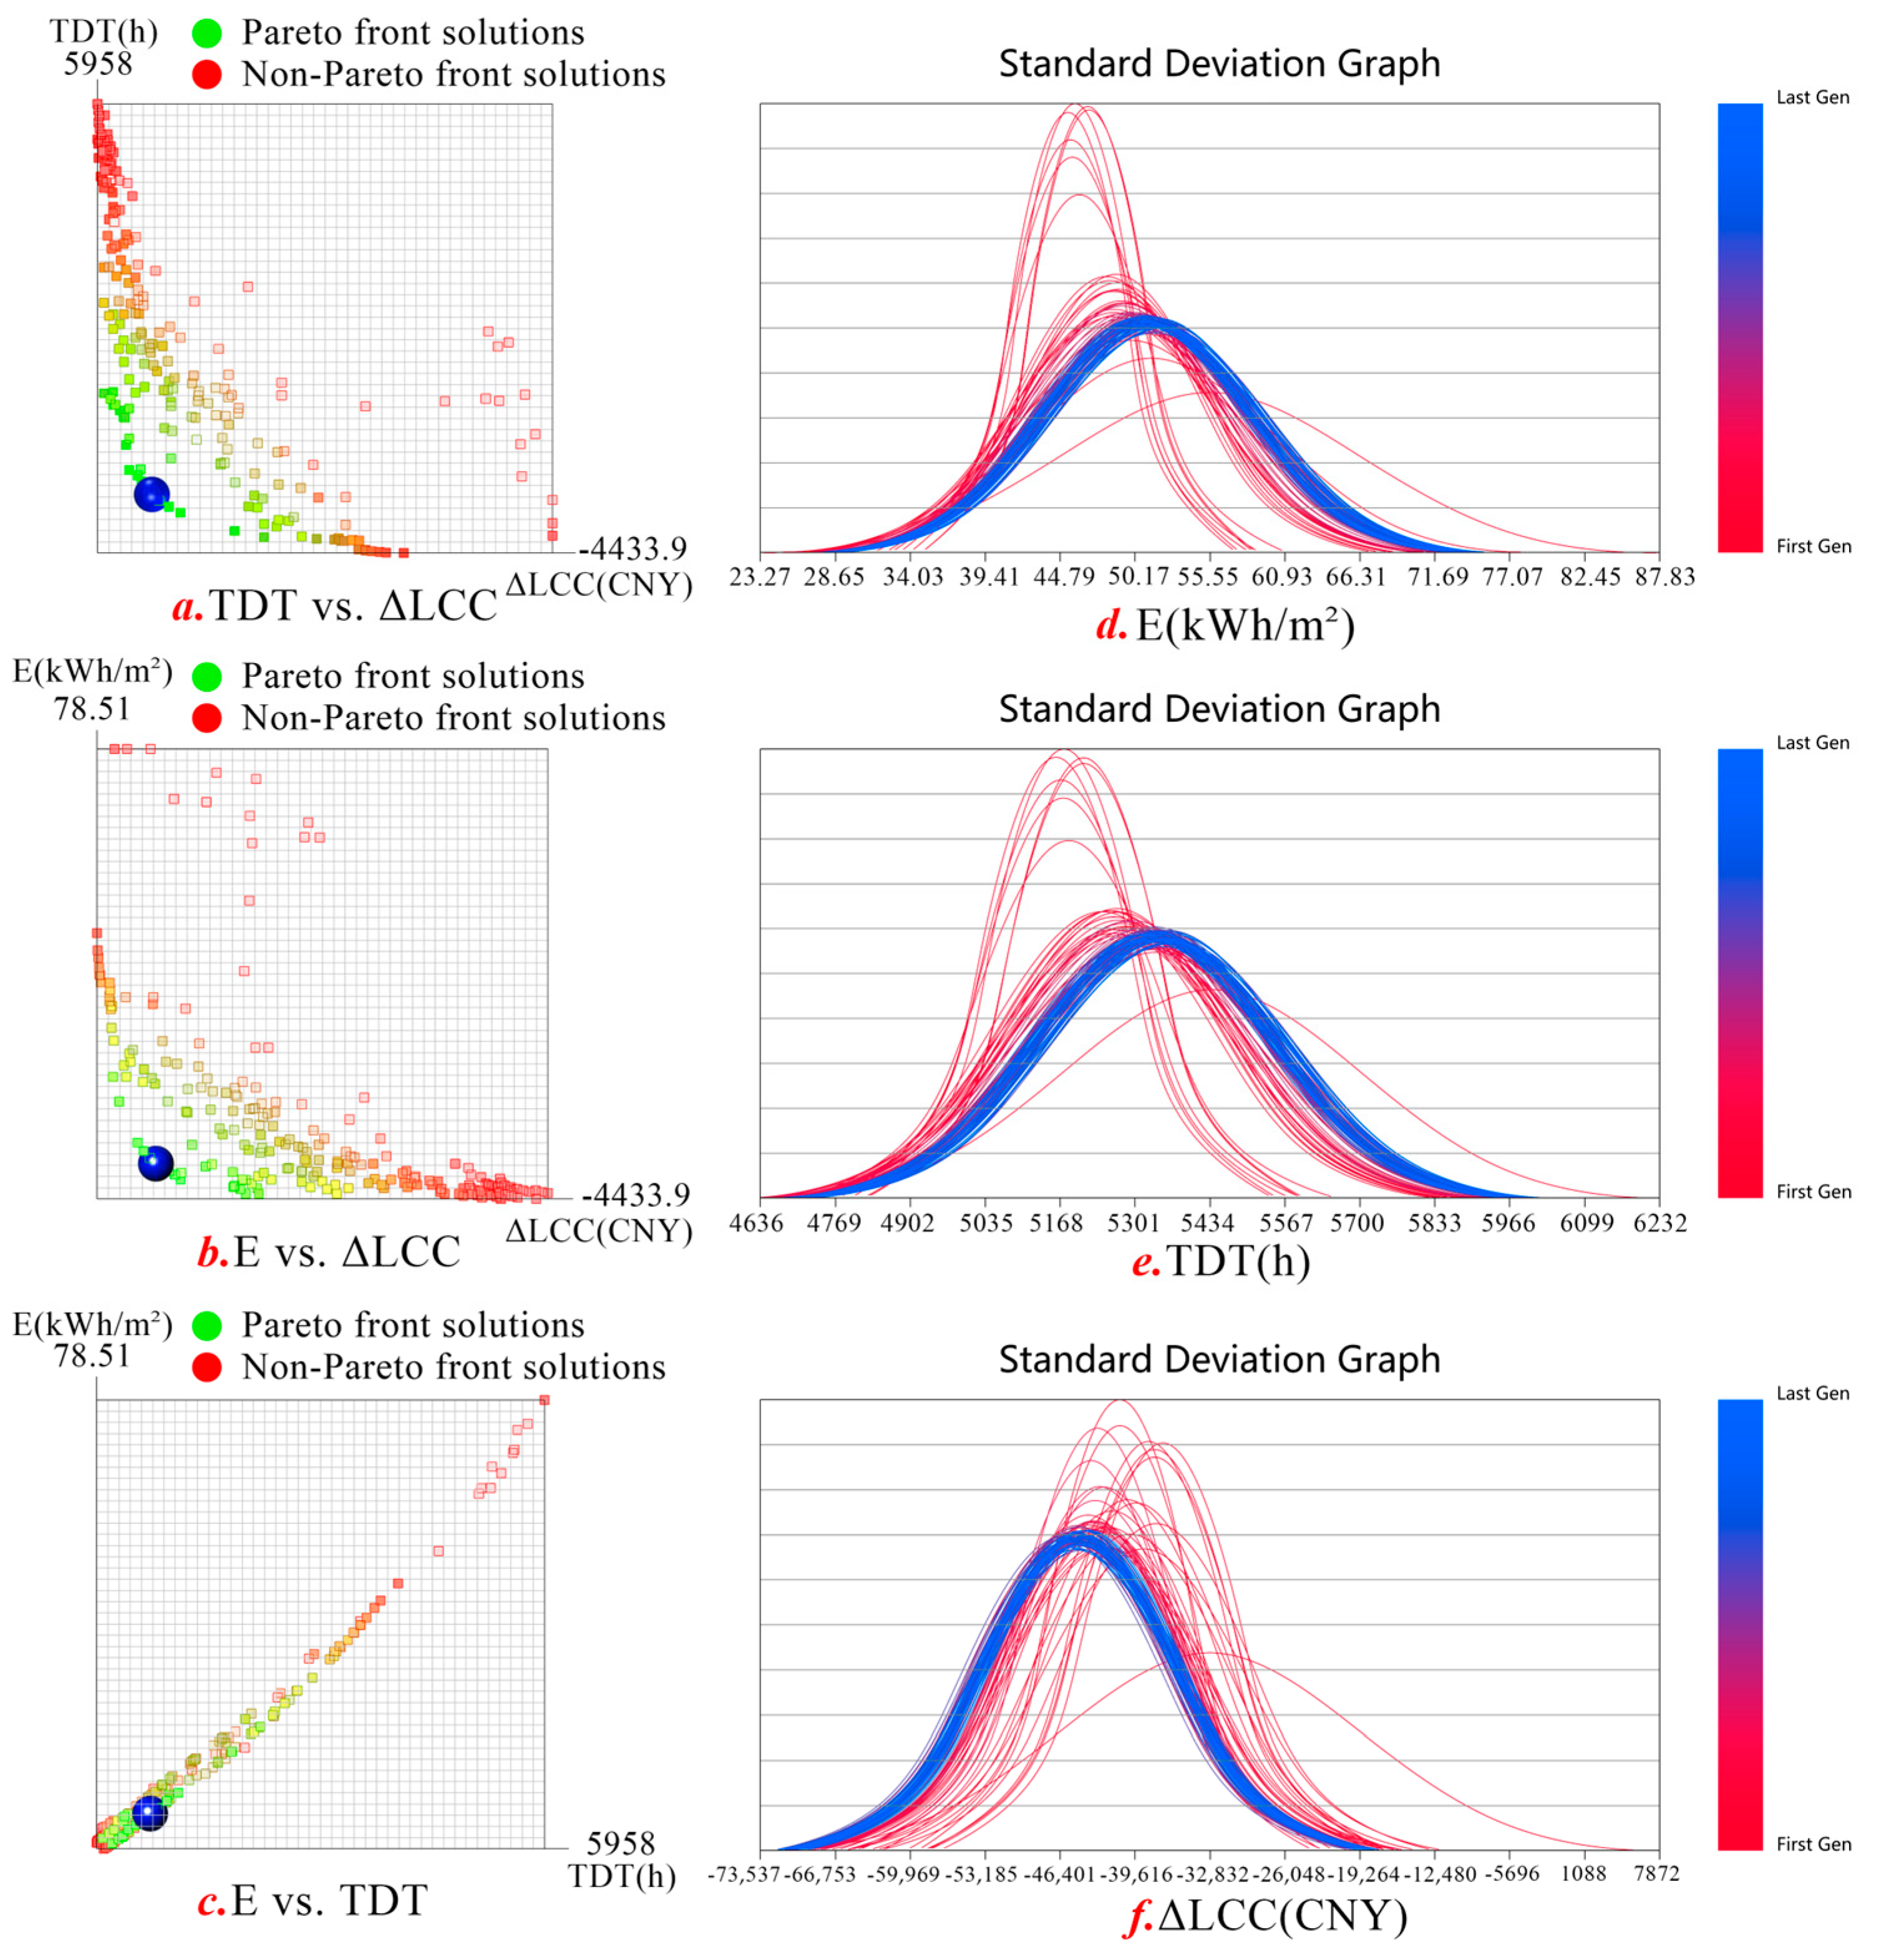
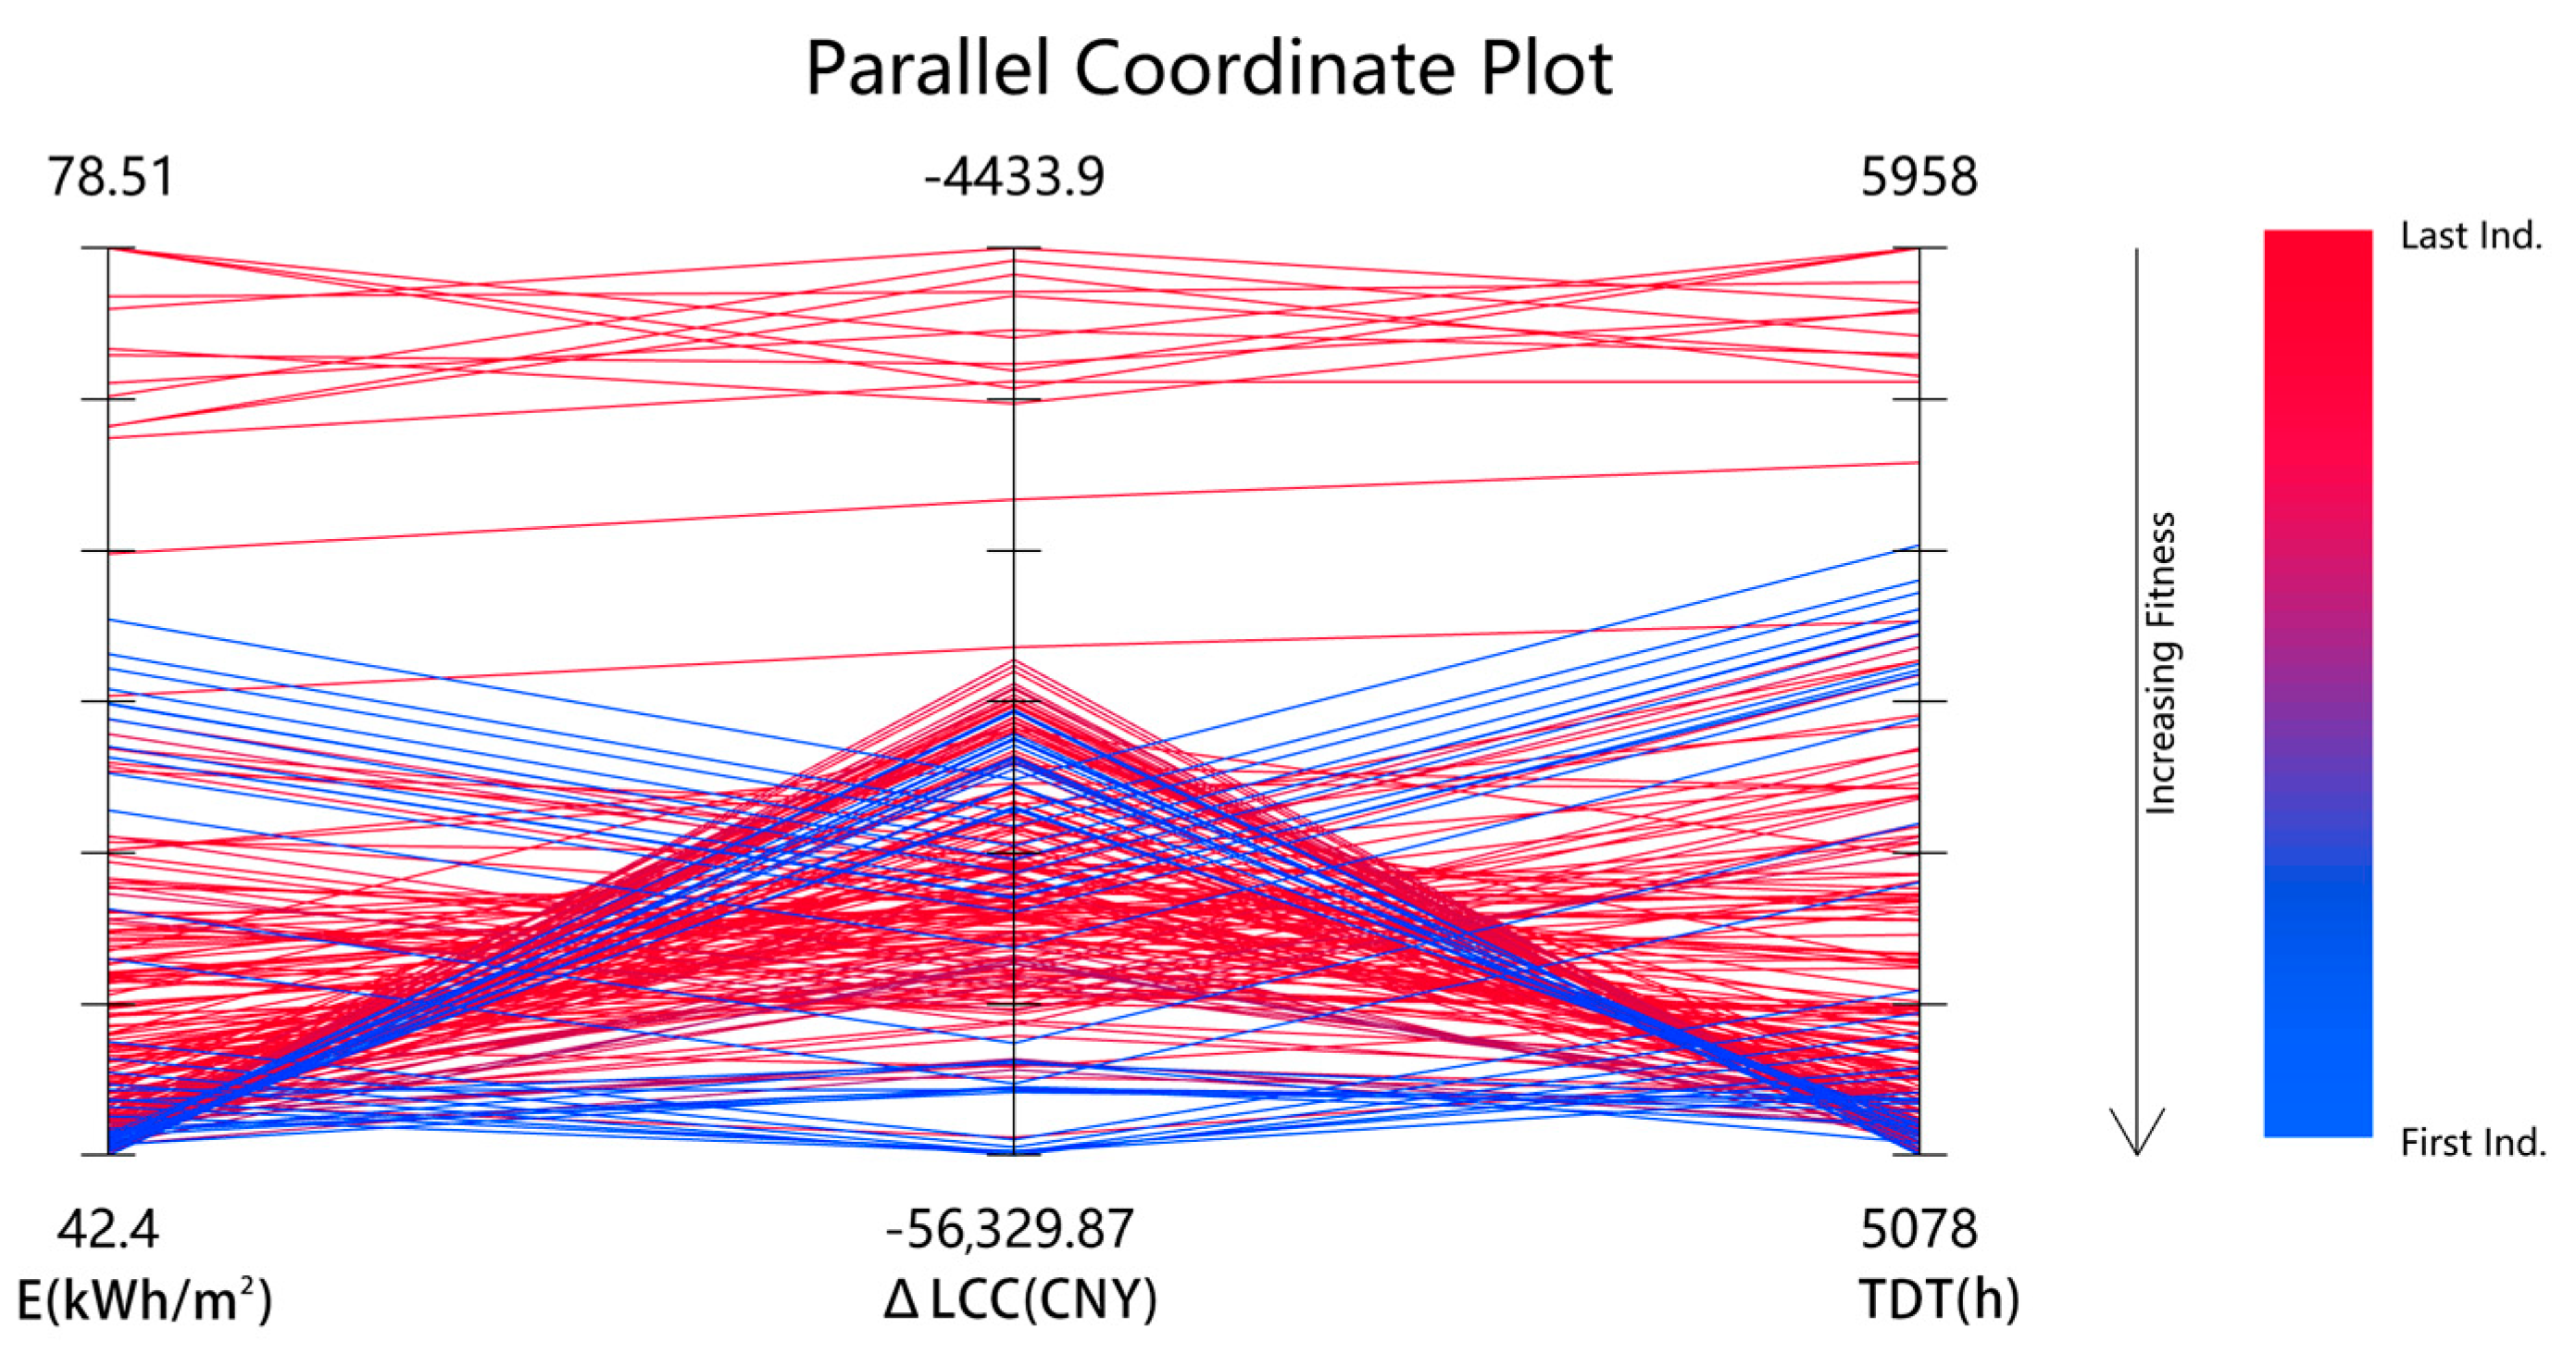
4.3.1. Pareto Optimal Solutions and Distribution in Objective Space
4.3.2. Comparative Analysis of the Performance of Optimal Solution Transformation Schemes
- The retrofit scheme 1 for achieving the optimal E value of the building envelope incorporates 150 mm rock wool board on the exterior wall, 150 mm XPS board on the roof, 5Low-E + 9A + 5 transparent glass with a PVC frame, and a gypsum board ceiling. This scheme achieves the lowest E value of 42.40 kWh/m2, resulting in a 56.0% energy saving compared to the sample building (E = 96.41 kWh/m2). Its TDT is 5092 h (ranked 588/5000), representing a 17.5% reduction from the sample building. The ΔLCC is −29,566.94 CNY (ranked 4894/5000), indicating potential economic benefits. However, the retrofit cost is 47,073.58 CNY, underscoring that achieving high energy efficiency requires a significant initial investment.
- The retrofit scheme 2 for achieving the optimal TDT value of the building envelope comprises 150 mm rock wool board on the exterior wall, 150 mm XPS board on the roof, 5Low-E + 9A + 5 transparent glass with a broken-bridge aluminum frame, and a gypsum board ceiling. This scheme achieves the lowest TDT value of 5078 h, reducing it by 17.7% compared to the sample building (TDT = 6173 h). It demonstrates the best thermal comfort performance among all schemes. Its E value is 42.87 kWh/m2 (ranked 501/5000), close to Scheme 1 (42.40 kWh/m2), maintaining high energy efficiency. The ΔLCC is −27,966.58 CNY (ranked 4969/5000), with a retrofit cost of 48,007.11 CNY, highlighting that enhancing thermal comfort also requires a substantial initial investment.
- The retrofit scheme 3 for achieving the optimal ΔLCC value of the building envelope involves 20 mm XPS board on the exterior wall, 110 mm XPS board on the roof, 5Low-E glass with a PVC frame, and no ceiling. This scheme achieves the optimal ΔLCC value of −56,329.87 CNY, with a retrofit cost of only 16,297.20 CNY. Its E value is 45.23 kWh/m2 (ranked 1366/5000), achieving a 53.1% energy saving compared to the sample building. The TDT is 5183 h (ranked 2003/5000), improving thermal comfort by 16.0%. This scheme realizes economic optimization through moderate reductions in thermal performance, reflecting a typical “low-cost, low-performance” Pareto frontier characteristic.
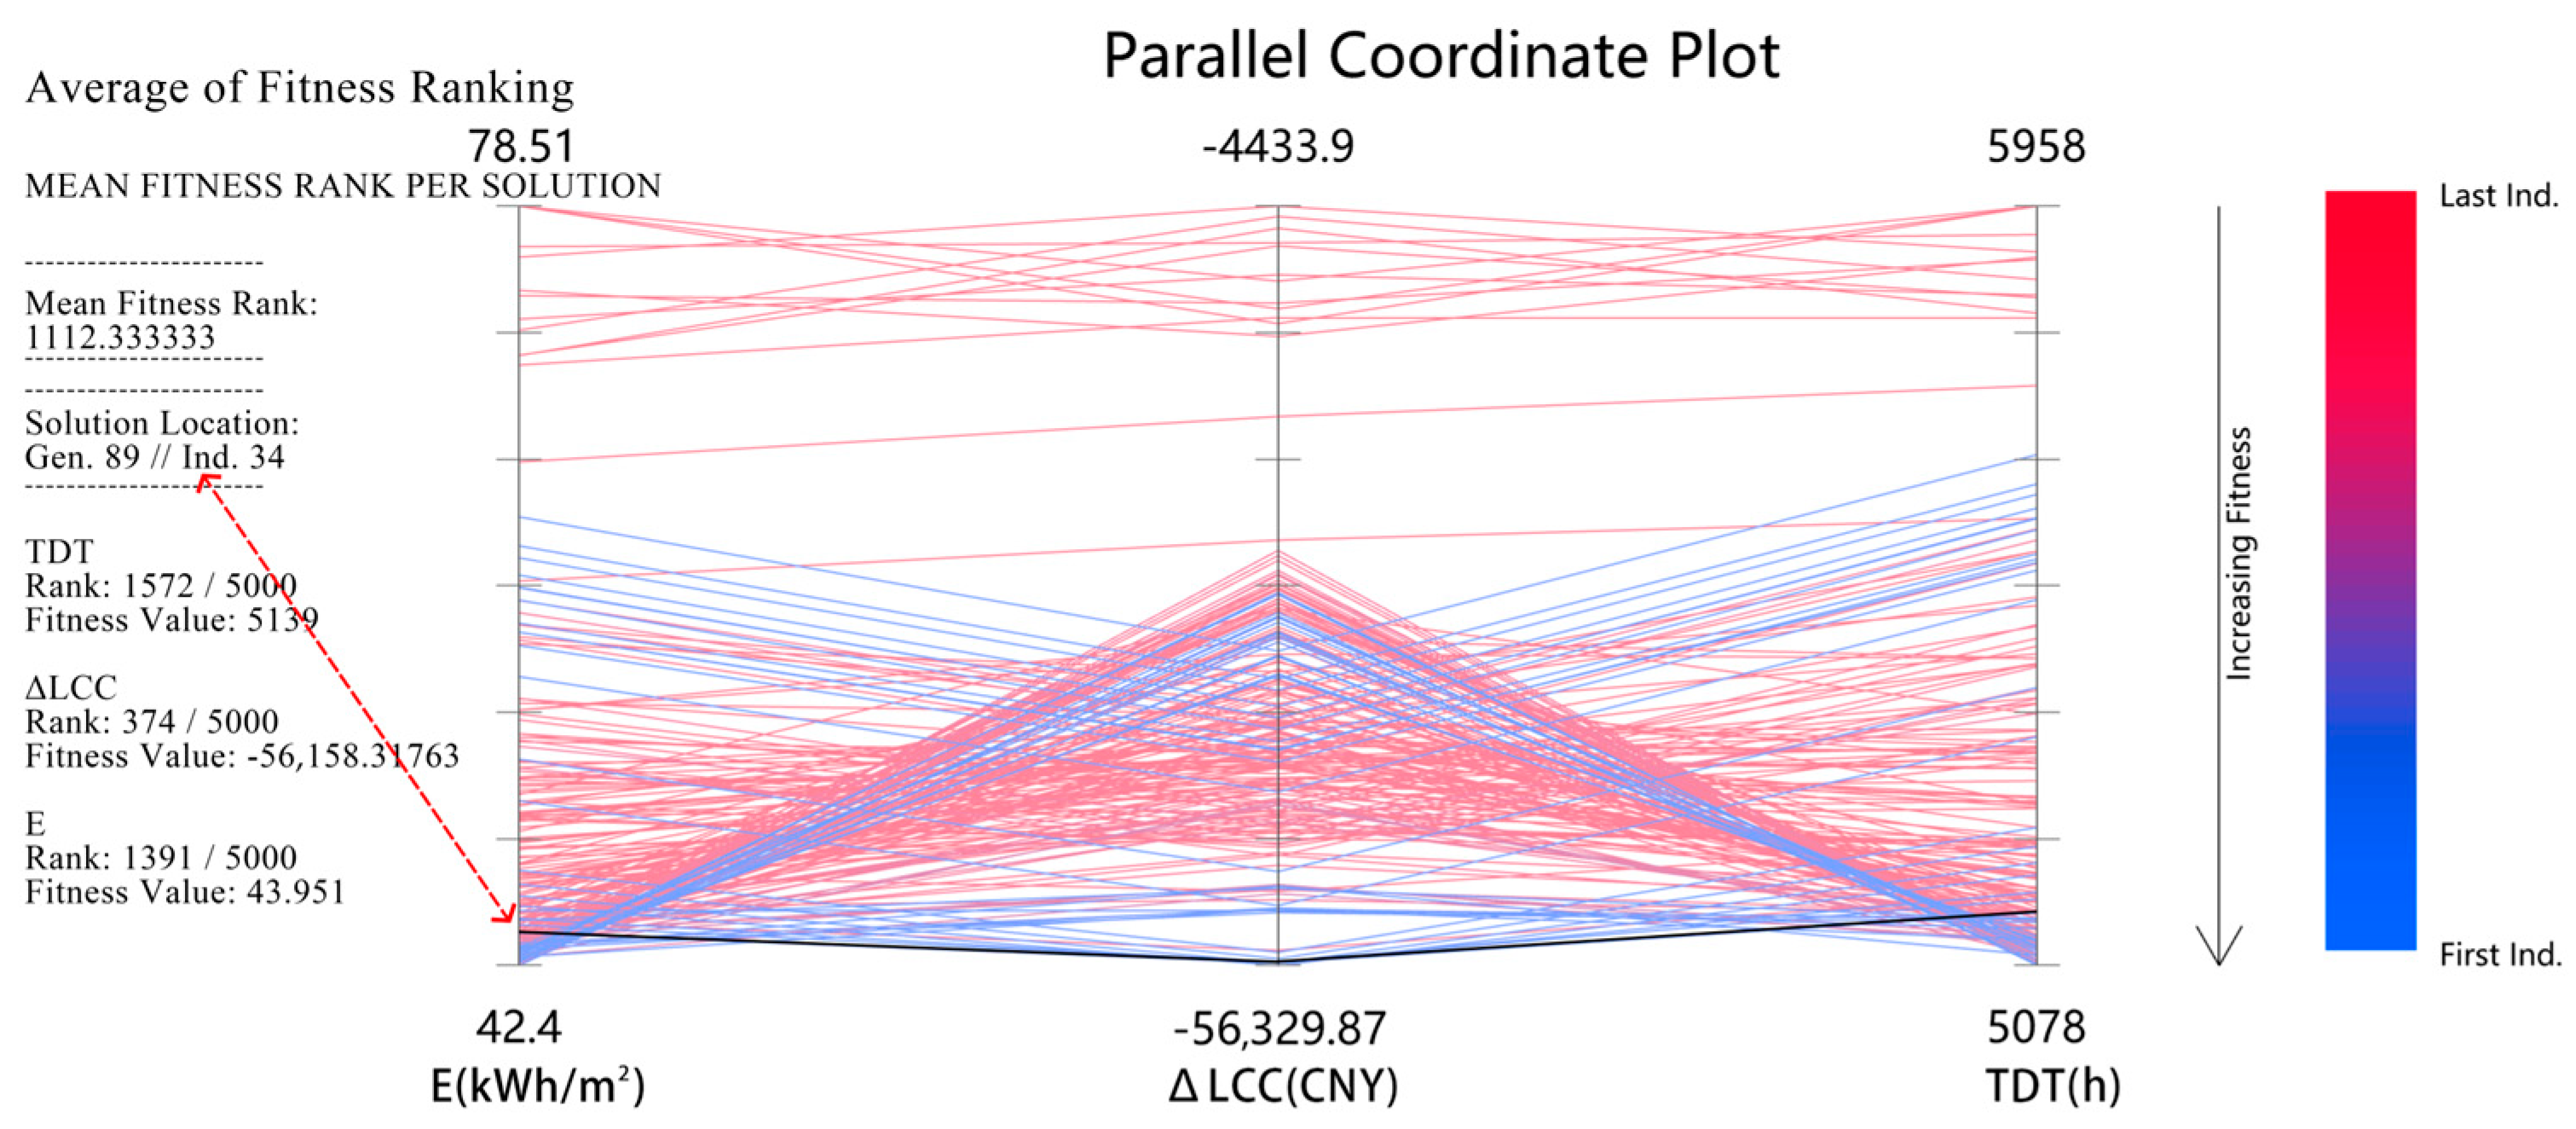
- Based on the TOPSIS multi-objective decision-making model, the retrofit scheme 4 was selected based on the optimal Average of Fitness Ranks (where no other solution outperforms it across all objectives). The balanced optimal solution corresponds to the 34th individual of the 89th generation (Figure 15). This scheme employs a strategy of 20 mm XPS board on the exterior wall, 150 mm XPS board on the roof, 5Low-E glass with a PVC frame, and no ceiling, aiming to balance E, TDT, and ΔLCC. Its E value is 43.95 kWh/m2 (ranked 1366/5000), representing a 54.4% reduction compared to the sample building. The TDT is 5139 h (ranked 1571/5000), reducing it by 16.8%. The ΔLCC is −56,158.32 CNY (ranked 324/5000), with a retrofit cost of 18,274.56 CNY. This solution ranks 1148.33 in terms of fitness (average), illustrating a dynamic balance among the three-dimensional objectives of energy efficiency, comfort, and economy.
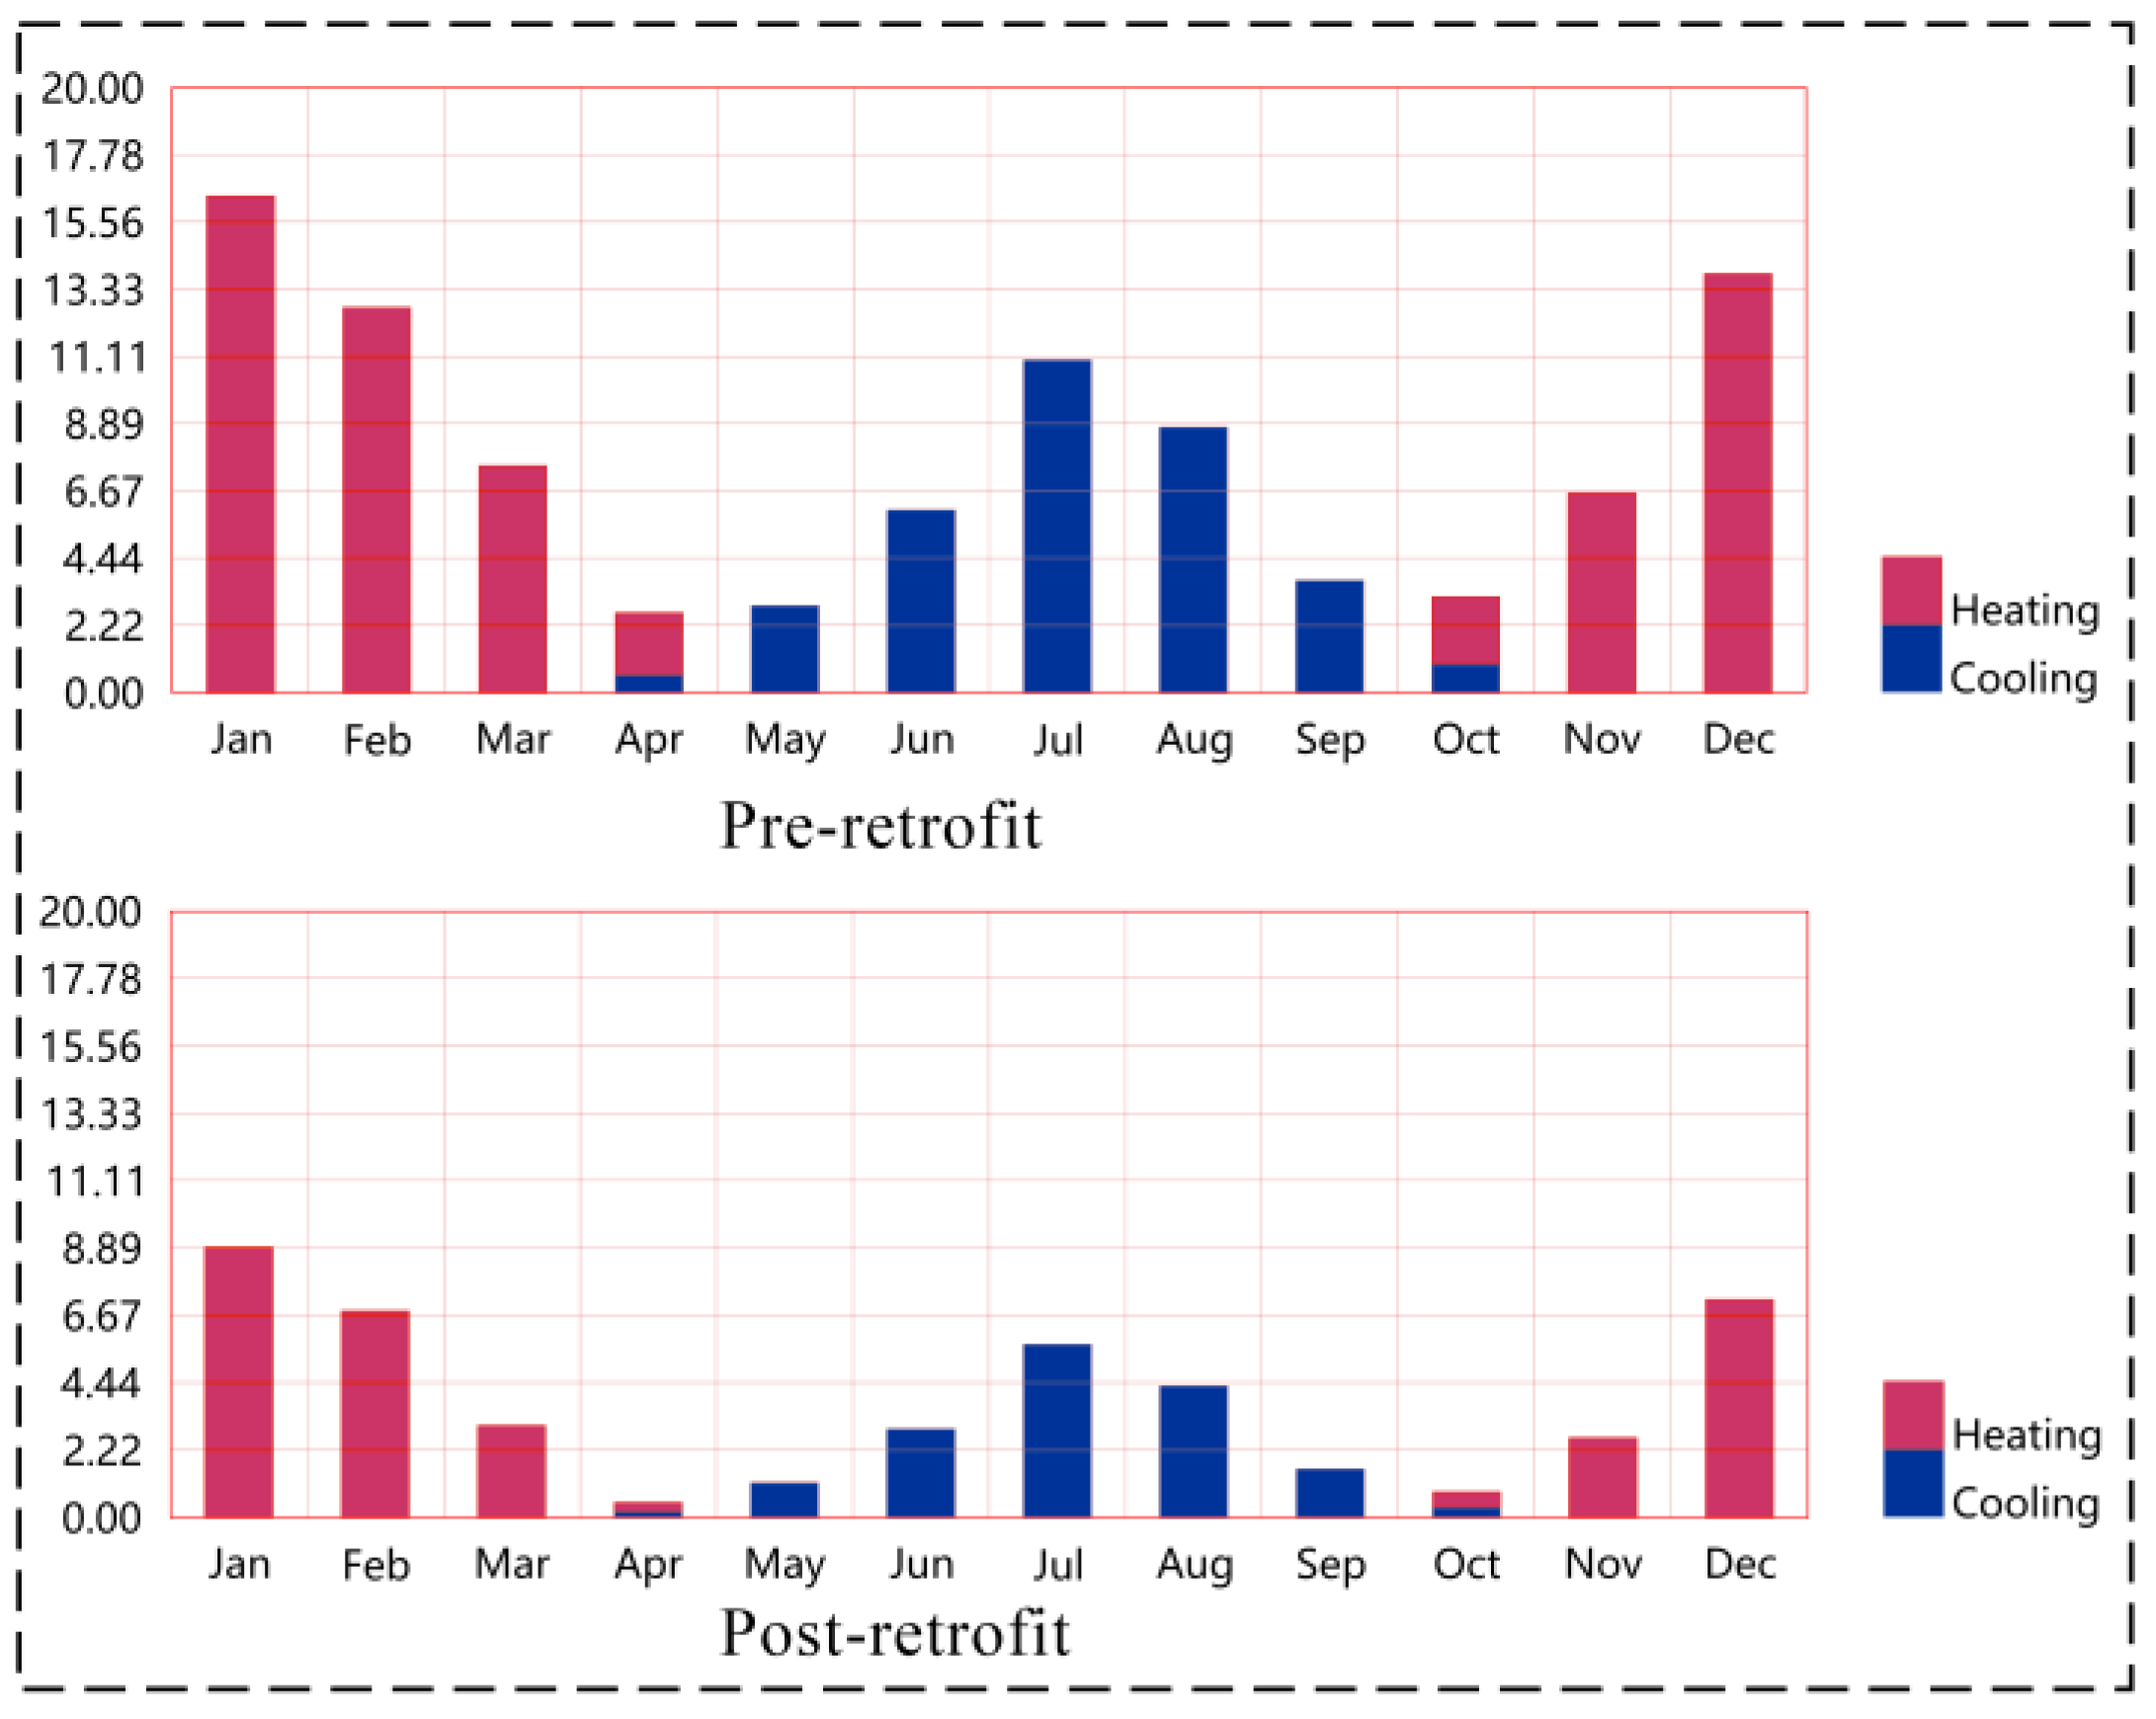
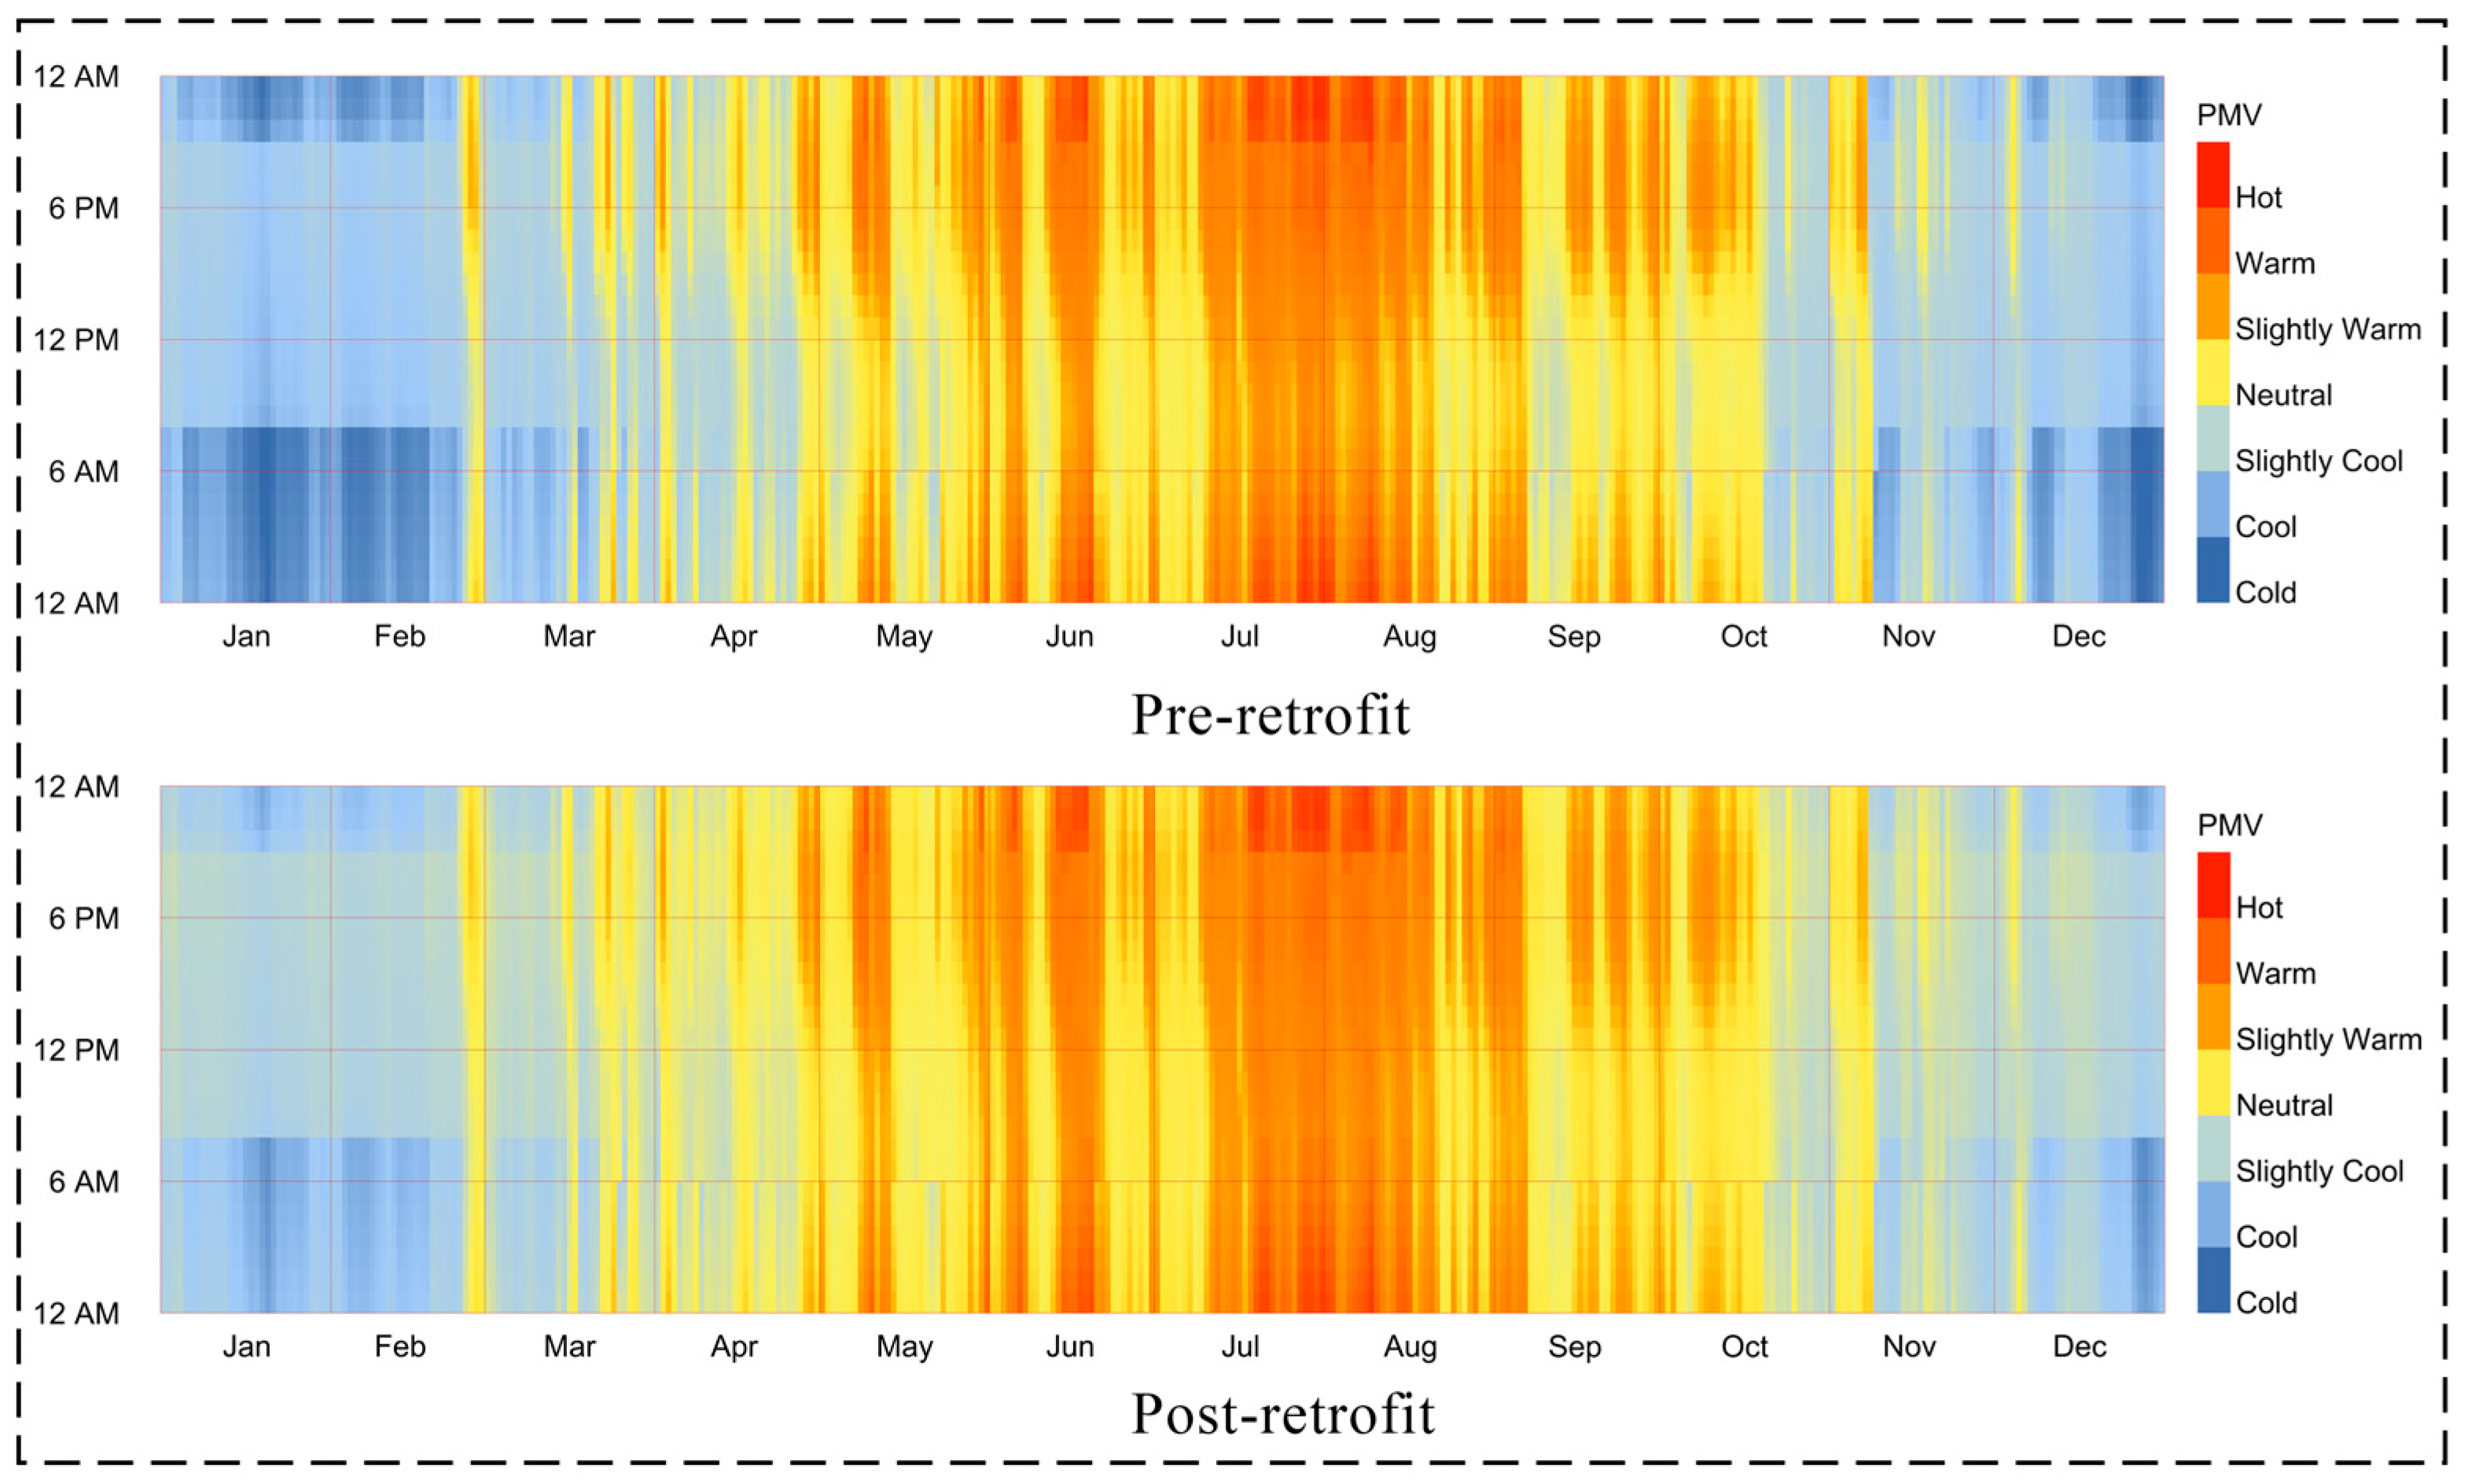
4.3.3. Comparative Analysis of Energy Consumption and Thermal Comfort Performance Before and After Retrofit in the Sample Building
5. Discussion
- Priority of energy efficiency (prevalence of energy conservation awareness): This option targets the lowest energy consumption (42.40 kWh/m2, 56% more energy efficient than the baseline building), incurring higher initial retrofit expenses (47,073.58 CNY), yet yielding substantial long-term energy savings (ΔLCC = −29,566.94 CNY). It is appropriate for regions with elevated electricity tariffs or fuel expenses. The advantages of energy conservation can rapidly offset the retrofit expenses. Integrating energy-saving technologies at the outset of a building’s entire life cycle planning is advisable to prevent the extra expenses associated with piecemeal retrofits in the future.
- Priority of comfort (motivated by health requirements): This solution targets the minimal TDT (5078 h, representing a 17.7% decrease). The upfront retrofit expense is substantial (48,007.11 CNY), yet the long-term energy savings are considerable (ΔLCC = −27,966.58 CNY). It can diminish long-term energy consumption costs (42.87 kWh/m2) by decreasing the frequency of heating and cooling system usage, while enhancing residents’ health and quality of life, thereby indirectly lowering medical and living expenses. It is appropriate for mountainous regions characterized by cold, humid winters or hot, humid summers. It must prioritize user experience and be implemented initially in households of the elderly and dwellings of left-behind children. The conventional notion of prioritizing economy over comfort must be dispelled by enhancing the intuitive thermal environment, such as by decreasing the indoor temperature differential by 5–8 °C.
- Priority of economy (short-term cost constraints): This solution seeks optimal cost-effectiveness (ΔLCC = −56,329.87 CNY). The retrofit expense amounts to 16,297.20 CNY, with energy savings of 53.1% (45.23 kWh/m2) and a 16.0% reduction in TDT. This strategy compromises energy efficiency and thermal comfort, making it appropriate for impoverished countries or villages with constrained budgets, prioritizing the fulfilment of fundamental living requirements. During the initial phases of technology promotion, economical solutions are employed to foster trust and engagement among residents, highlighting “affordable immediate advantages” (e.g., a 3–5 year return on investment).
- Balanced strategy (dynamic adaptive orientation): The balanced solution (E = 43.95 kWh/m2, a 54.4% reduction; TDT = 5139 h, a 16.8% reduction; ΔLCC = −56,158.32 CNY) achieves multi-dimensional synergistic optimization between energy consumption, comfort, and economy (mean fitness ranking 1148.33), with a moderate retrofit cost (18,274.56 CNY), to achieve a global balance of comprehensive performance. This strategy is relevant to two contexts: firstly, as a universal benchmark framework for retrofitting; secondly, in extensive government-initiated retrofits, where consistent technical standards and subsidy policies are essential to mitigate the risk of technological fragmentation.
6. Conclusions
- The thermal deficiencies of the building envelopes of rural dwellings in the Qianbei Region are obvious. Indoor temperature and humidity in summer are high (peak 37.8 °C/98.5% RH), and in winter, they are low (minimum 10.9 °C/90.7% RH). During the test period, thermal discomfort accounted for more than 70% of the time. Questionnaire surveys showed that the local residents’ demand for retrofits showed significant seasonal differences. They were relatively satisfied with the indoor thermal environment in summer, but expressed a strong willingness to retrofit the indoor thermal environment in winter.
- The Pareto optimal solution set shows that retrofitting the building envelope can achieve a maximum reduction in E of 56% (96.41 → 42.4 kWh/m2), a reduction in TDT of 17.7% (6173→5078 h), and a ΔLCC of −56,329.87 CNY (net profit). The use of low-cost measures such as XPS boards and 5Low-E glass can achieve a positive economic return without policy subsidies.
- The retrofit scheme that balances the optimal solution achieves a dynamic balance between E (43.95 kWh/m2), TDT (5139 h), and ΔLCC (−56,158.32 CNY). Compared to the reference building, it has a 54.4% lower E, 16.8% lower TDT, and a negative ΔLCC (net benefit). This solution balances economy and performance improvement, and is suitable for ordinary farmers who have no clear preferences but need comprehensive improvement. It can be used as a benchmark for multi-objective coordinated optimization.
Author Contributions
Funding
Data Availability Statement
Acknowledgments
Conflicts of Interest
Abbreviations
| NSGA-II | Non-dominated Sorting Genetic Algorithm II |
| TOPSIS | Technique for Order Preference by Similarity to Ideal Solution |
| MAE | Mean Absolute Error |
| RMSE | Root Mean Square Error |
| APMV | Adapted Predicted Mean Vote |
| PMV | Predicted Mean Vote |
| EPW | EnergyPlus Weather |
| TDT | Thermal Discomfort Time |
| ΔLCC | Life Cycle Cost Increment |
| PWF | Present Worth Factor |
| EPS | Expanded Polystyrene |
| XPS | Extruded Polystyrene |
| RW | Rock Wool |
| PU | Polyurethane |
| PVC | Polyvinyl chloride |
References
- National Bureau of Statistics of China. China Statistical Yearbook 2024; China Statistics Press: Beijing, China, 2024. [Google Scholar]
- Statistical Communiqué of the People’s Republic of China on the 2022 National Economic and Social Development. Available online: https://www.caivd-org.cn/en/detail.asp?id=2166 (accessed on 23 February 2025).
- Li, Y.; Zhou, T.; Wang, Z.; Li, W.; Zhou, L.; Cao, Y.; Shen, Q. Environment Improvement and Energy Saving in Chinese Rural Housing Based on the Field Study of Thermal Adaptability. Energy Sustain. Dev. 2022, 71, 315–329. [Google Scholar] [CrossRef]
- Tsinghua University Building Energy Conservation Research Center. 2024 Annual Development Report of Building Energy Efficiency in China; China Architecture & Building Press: Beijing, China, 2024. [Google Scholar]
- Zhu, B.; Zhang, W.; Du, J.; Zhou, W.; Qiu, T.; Li, Q. Adoption of Renewable Energy Technologies (RETs): A Survey on Rural Construction in China. Technol. Soc. 2011, 33, 223–230. [Google Scholar] [CrossRef]
- Ministry of Housing and Urban-Rural Development of China (MOHURD). The 14th Five-Year Plan for Building Energy Efficiency and Green Building Development; MOHURD: Beijing, China, 2022. Available online: https://www.gov.cn/zhengce/zhengceku/2022-03/12/content_5678698.htm (accessed on 8 March 2025).
- Building Energy Efficiency Research Center, Tsinghua University. Annual Report on China Building Energy Efficiency Development 2023; Tsinghua University Press: Beijing, China, 2023; Available online: https://www.scirp.org/reference/referencespapers?referenceid=3402908 (accessed on 8 April 2025).
- National Bureau of Statistics of China. China Statistical Yearbook 2023; China Statistics Press: Beijing, China, 2023. [Google Scholar]
- Shan, M.; Wang, P.; Li, J.; Yue, G.; Yang, X. Energy and Environment in Chinese Rural Buildings: Situations, Challenges, and Intervention Strategies. Build. Environ. 2015, 91, 271–282. [Google Scholar] [CrossRef]
- Tsinghua University Building Energy Research Center. 2020 Annual Development Report of Building Energy Efficiency in China; China Architecture & Building Press: Beijing, China, 2020. [Google Scholar]
- Ugwoke, B.; Corgnati, S.P.; Leone, P.; Pearce, J.M. Adapting the European Typology Approach for Building Stock Energy Assessment (TABULA) Concept for the Developing World: The Nigerian Case Study. Energy Strategy Rev. 2024, 51, 101293. [Google Scholar] [CrossRef]
- Chicherin, S.; Zhuikov, A.; Junussova, L. District Heating for Poorly Insulated Residential Buildings—Comparing Results of Visual Study, Thermography, and Modeling. Sustainability 2023, 15, 14908. [Google Scholar] [CrossRef]
- Cao, P.; Sun, Q.; Li, H.; Jiao, Y. Optimization Analysis of an Energy-Saving Renovation Scheme for Building Envelopes of Existing Rural Houses Based on a Comprehensive Benefit Evaluation. Buildings 2024, 14, 454. [Google Scholar] [CrossRef]
- Liu, H.; Yang, L.; Deng, R. Thermal Adaptability of Miao Traditional Dwellings in Southeast Guizhou. Build. Sci. 2013, 29, 50–53. [Google Scholar] [CrossRef]
- Li, Z.; Zeng, S.; Zhao, Q.; Xing, H. Impact of Envelope Retrofitting on Indoor Thermal and Humidity Environment in Traditional Dwellings of Dimen Dong Village, Guizhou. J. Xi’an Univ. Archit. Technol. Nat. Sci. Ed. 2016, 48, 908–911. [Google Scholar] [CrossRef]
- Wu, C.; Shan, J.; Kong, D. Field Investigation on Winter Thermal Comfort in Stilted Dwellings of Miao Ethnic Group in Guizhou. HVAC 2019, 49, 117,135–141. [Google Scholar] [CrossRef]
- Luo, X. Thermal Environment and Adaptive Design Strategies of Tujia Traditional Dwellings. Master’s Thesis, Guizhou University, Guiyang, China, 2021. [Google Scholar]
- Liu, X. Optimization of Indoor Environment in Dong Traditional Dwellings Based on Natural Ventilation Strategies. Master’s Thesis, Xi’an University of Architecture and Technology, Xi’an, China, 2023. [Google Scholar]
- Li, S. Energy Consumption Characteristics and Passive Energy-Saving Retrofitting Strategies of Traditional Slate Dwellings in Central Guizhou. Master’s Thesis, Guizhou University, Guiyang, China, 2024. [Google Scholar]
- Wang, J.; Zhu, W. Energy-Saving Retrofitting Measures for Existing Vernacular Architecture in Guizhou. Archit. J. 2012, 118–122. [Google Scholar]
- Zhou, Z. BIM-Based Energy-Saving Retrofitting Strategies for Rural Dwellings in Northern Guizhou. Master’s Thesis, Guizhou University, Guiyang, China, 2021. [Google Scholar]
- Xiao, G. Research on Vernacular Dwellings in Northern Guizhou. Master’s Thesis, Chongqing University, Chongqing, China, 2007. [Google Scholar]
- Liu, J.; Emmanuel, E.; Cai, T. Assessment of Occupants’ Adaptive Capacity: A Case Study in Northern Guizhou of China. Proc. Inst. Civ. Eng. Smart Infrastruct. Constr. 2024, 177, 246–251. [Google Scholar] [CrossRef]
- Notice on the Issuance of the Carbon Peak Implementation Plan in the Field of Urban and Rural Construction in Guizhou Province. Available online: https://www.guizhou.gov.cn/zwgk/zcjd/bmwj/202301/t20230113_77927106.html (accessed on 3 January 2025).
- Measures to Promote Green Buildings in Guizhou Province. Available online: https://www.guizhou.gov.cn/zwgk/zdlygk/jjgzlfz/cxjs/zcwj/202001/t20200102_40586849.html (accessed on 3 January 2025).
- Fang, Y.; Cho, S. Design Optimization of Building Geometry and Fenestration for Daylighting and Energy Performance. Sol. Energy 2019, 191, 7–18. [Google Scholar] [CrossRef]
- Attia, S.; Hamdy, M.; O’Brien, W.; Carlucci, S. Assessing Gaps and Needs for Integrating Building Performance Optimization Tools in Net Zero Energy Buildings Design. Energy Build. 2013, 60, 110–124. [Google Scholar] [CrossRef]
- Longo, S.; Montana, F.; Riva Sanseverino, E. A Review on Optimization and Cost-Optimal Methodologies in Low-Energy Buildings Design and Environmental Considerations. Sustain. Cities Soc. 2019, 45, 87–104. [Google Scholar] [CrossRef]
- Lizana, J.; Barrios-Padura, Ÿ.; Molina-Huelva, M.; Chacartegui, R. Multi-Criteria Assessment for the Effective Decision Management in Residential Energy Retrofitting. Energy Build. 2016, 129, 284–307. [Google Scholar] [CrossRef]
- Asadi, E.; da Silva, M.G.; Antunes, C.H.; Dias, L. Multi-Objective Optimization for Building Retrofit Strategies: A Model and an Application. Energy Build. 2012, 44, 81–87. [Google Scholar] [CrossRef]
- Jermyn, D.; Richman, R. A process for developing deep energy retrofit strategies for single-family housing typologies: Three Toronto case studies. Energy Build. 2016, 116, 522–534. [Google Scholar] [CrossRef]
- Naderi, E.; Sajadi, B.; Behabadi, M.A.; Naderi, E. Multi-objective simulation-based optimization of controlled blind specifications to reduce energy consumption, and thermal and visual discomfort: Case studies in Iran. Build. Environ. 2020, 169, 106570. [Google Scholar] [CrossRef]
- Zhu, P.; Huckemann, V.; Fisch, M.N. The optimum thickness and energy saving potential of external wall insulation in different climate zones of China. Procedia Eng. 2011, 21, 608–616. [Google Scholar] [CrossRef]
- Duan, Y.; Zhang, T.; Yang, Y.; Li, P.; Mo, W.; Jiao, Z.; Gao, W. A Multi-Objective Approach to Optimizing the Geometry and Envelope of Rural Dwellings for Energy Demand, Thermal Comfort, and Daylight in Cold Regions of China: A Case Study of Shandong Province. Energy Convers. Manag. 2024, 322, 119128. [Google Scholar] [CrossRef]
- Wang, M.; Chen, C.; Fan, B.; Yin, Z.; Li, W.; Wang, H.; Chi, F. Multi-Objective Optimization of Envelope Design of Rural Tourism Buildings in Southeastern Coastal Areas of China Based on NSGA-II Algorithm and Entropy-Based TOPSIS Method. Sustainability 2023, 15, 7238. [Google Scholar] [CrossRef]
- Molake, A.; Zhang, R.; Zhou, Y. Multi-Objective Optimization of Daylight Performance and Thermal Comfort of Enclosed-Courtyard Rural Residence in a Cold Climate Zone, China. Sustainability 2023, 15, 7953. [Google Scholar] [CrossRef]
- Shimeng, H. Climate Adaptation Study of Habitat; Tsinghua University Press: Beijing, China, 2019. [Google Scholar]
- Gao, Y.; Chi, J.; Luo, S.; Hu, k.; Yuan, J.; Yue, X. A Multi-objective Optimisation Evaluation Method for the Low-carbon Renovation of Rural Houses. South Archit. 2022, 4, 61–68. [Google Scholar]
- Gao, Y.; Luo, S.; Chi, J.; Yuan, J. Renovation of “Double Substitution” Rural Houses in Hebei Province Based on Multi-dimensional Objectives and Dual-carbon Scenario Simulation. Build. Sci. 2022, 38, 179–190. [Google Scholar] [CrossRef]
- Zhang, X.; Zhang, X.; Chen, B.; Zhao, J.R.; Sun, J.; Zhao, J.; Wei, B.; Zhu, J. Thermal Performance Optimization of Building Envelopes in a Low-Cost and Energy-Saving Rural Dwelling in Severe Cold Region—Taking Central Area of Liaoning as an Example. Buildings 2024, 14, 2505. [Google Scholar] [CrossRef]
- Liu, R.; Wang, G.; Deng, Q. Multi-Objective Optimization of Rural Residential Envelopes in Cold Regions of China Based on Performance and Economic Efficiency. Case Stud. Therm. Eng. 2024, 61, 104937. [Google Scholar] [CrossRef]
- Zhai, X.; He, Z.; Wang, R.; Lu, S.; Zhang, L. Multi-Objective Optimization of Building Envelope of Rural Housing in the Severely Cold Region of China Based on Energy Consumption, Thermal Comfort and Cost-Effectiveness. Indoor Built Environ. 2025, 34, 627–643. [Google Scholar] [CrossRef]
- Standard Map Service. Available online: http://bzdt.ch.mnr.gov.cn/index.html (accessed on 24 February 2025).
- GB 50176-2016; China National Standard. Thermal Design Code for Civil Buildings. China Standards Press: Beijing, China, 2016.
- GB/T 50785-2012; Evaluation Standard for Indoor Thermal Environment in Civil Buildings. China Construction Industry Press: Beijing, China, 2012.
- Fanger, P.O. Analysis and Applications in Environmental Engineering; Danish Technical Press: Vanloese, Denmark, 1970. [Google Scholar]
- JGJ/T 347-2014; Standard for Testing Methods of Building Thermal Environment. China Architecture & Building Press: Beijing, China, 2013.
- ANSI/ASHRAE Standard 55-2023; Thermal Environmental Conditions for Human Occupancy. Refrigerating and Air-Conditioning Engineers. ASHRAE: Peachtree Corners, GA, USA, 2023.
- EPW Weather Files Map. Available online: https://www.ladybug.tools/epwmap/ (accessed on 12 January 2025).
- GB 55015-2021; General Specification for Energy Efficiency and Renewable Energy Utilization in Buildings. China Architecture & Building Press: Beijing, China, 2021.
- Crawley, D.B.; Lawrie, L.K.; Winkelmann, F.C.; Buhl, W.F.; Huang, Y.J.; Pedersen, C.O.; Strand, R.K.; Liesen, R.J.; Fisher, D.E.; Witte, M.J.; et al. EnergyPlus: Creating a New-Generation Building Energy Simulation Program. Energy Build. 2001, 33, 319–331. [Google Scholar] [CrossRef]
- EPW Climate File Data Modifier. Available online: https://epweditor.gbuilding.online/ (accessed on 10 March 2025).
- Camara, M.V.O.; Ribeiro, G.M.; Tosta, M.d.C.R. A pareto optimal study for the multi-objective oil platform location problem with NSGA-II. J. Pet. Sci. Eng. 2018, 169, 258–268. [Google Scholar] [CrossRef]
- Nguyen, A.-T.; Reiter, S.; Rigo, P. A Review on Simulation-Based Optimization Methods Applied to Building Performance Analysis. Appl. Energy 2014, 113, 1043–1058. [Google Scholar] [CrossRef]
- Hou, D. Comparative Study on Complex Multi-objective Optimization Methods for Building Performance. Build. Energy Effic. Chin. Engl. 2023, 51, 14–23. [Google Scholar]
- Deb, K.; Pratap, A.; Agarwal, S.; Meyarivan, T. A Fast and Elitist Multi-objective Genetic Algorithm: NSGA-II. IEEE Trans. Evol. Comput. 2002, 6, 182–197. [Google Scholar] [CrossRef]
- Razmi, A.; Rahbar, M.; Bemanian, M. PCA-ANN Integrated NSGA-III Framework for Dormitory Building Design Optimization: Energy Efficiency, Daylight, and Thermal Comfort. Appl. Energy 2022, 305, 117828. [Google Scholar] [CrossRef]
- Bre, F.; Fachinotti, V.D. A computational multi-objective optimization method to improve energy efficiency and thermal comfort in dwellings. Energy Build. 2017, 154, 283–294. [Google Scholar] [CrossRef]
- Harkouss, F.; Fardoun, F.; Biwole, P.H. Multi-Objective Optimization Methodology for Net Zero Energy Buildings. J. Build. Eng. 2018, 16, 57–71. [Google Scholar] [CrossRef]
- Si, B.; Wang, J.; Yao, X.; Shi, X.; Jin, X.; Zhou, X. Multi-objective optimization design of a complex building based on an artificial neural network and performance evaluation of algorithms. Adv. Eng. Inform. 2019, 40, 93–109. [Google Scholar] [CrossRef]
- Fuller, S.; Petersen, S. LIFE-CYCLE COSTING MANUAL for the Federal Energy Management Program; NIST Handbook 135; 1995 edition; NIST: Gaithersburg, MD, USA, 1996.
- ISO 15686-5:2017; Buildings and Constructed Assets—Service Life Planning—Part 5: Life-Cycle Costing. ISO: Geneva, Switzerland, 2017. Available online: https://www.iso.org/standard/61148.html (accessed on 5 March 2025).
- Xue, Q.; Wang, Z.; Chen, Q. Multi-Objective Optimization of Building Design for Life Cycle Cost and CO2 Emissions: A Case Study of a Low-Energy Residential Building in a Severe Cold Climate. Build. Simul. 2022, 15, 83–98. [Google Scholar] [CrossRef]
- Guizhou Provincial Construction Project Cost Information. Available online: http://www.gzszj.com/home/policiesdetail/1670 (accessed on 24 February 2025).

| Category | First Type of Dwellings | Second Type of Dwellings | Third Type of Dwellings |
|---|---|---|---|
| Construction Year | Before 1990 | 1990–2015 | After 2015 |
| Representative Photos | 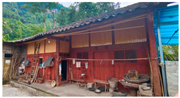 | 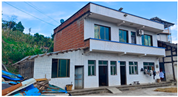 | 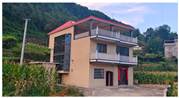 |
| Heating Method | Wood or Coal | Coal or Electric Stove | Electric Stove |
| Heating Tools | 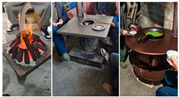 | 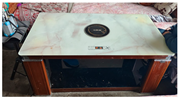 |  |
| Structural Materials | Board Wall and Pier-Beam Structure | Brick and Concrete Structure | Concrete Frame Structure |
| Thermal Performance | No insulation layer, and severe heat loss | Partial exterior wall tiles, insufficient insulation | Exterior wall tiles, energy-saving windows |
| Existing Problems | Rotten, leaky, poor ventilation | Cold in winter and hot in summer, high energy consumption | High construction cost, low popularity |
| Retrofit Potential | Low (Need to preserve the style) | High (Exterior wall insulation + Roof retrofit) | Low (Advanced technology but high cost, limited retrofit benefits) |
| Part | South Facade Wall | Roof | Slab |
| Real Photos | 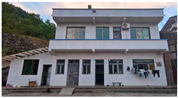 | 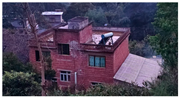 |  |
| Structure | 10 mm white tiles + 10 mm cement mortar + 120 mm red bricks + 10 mm cement mortar + 2 mm plastering mortar | 20 mm cement mortar + SBS waterproof membrane + 20 mm cement mortar leveling layer + reinforced concrete cast-in-place slab + 2 mm plastering mortar | Common floor tiles + 20 mm cement mortar + 20 mm cement mortar leveling layer + cement slurry + reinforced concrete cast-in-place slab + 2 mm plastering mortar |
| Part | Other Exterior Walls | Floor | Doors and Windows |
| Real Photos | 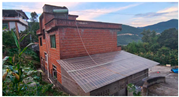 | 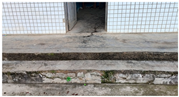 | 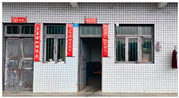 |
| Structure | 120 mm red bricks + 10 mm cement mortar + 2 mm plastering mortar | 20 mm cement mortar leveling layer + cement slurry + compacted natural soil | 80 mm wooden door + single-layer wooden frame with 5 mm single glass |
| Measurement Parameter | Testing Instrument | Testing Range | Testing Accuracy | Recording Method | Interval |
|---|---|---|---|---|---|
| Outdoor Air Temperature | TES-1360A | −20~60 °C | ±0.8 °C | Manual | 1 h/Time |
| Outdoor Relative Humidity | 10~95% | ±3% | Manual | 1 h/Time | |
| Indoor Air Temperature | JT-IAQ-50 | −20~120 °C | ±0.5 °C | Automatic | 5 min/Time |
| Indoor Relative Humidity | 0~100% | ±1.5% | Automatic | 5 min/Time | |
| Indoor Wind Velocity | 0.05~2 m/s | ±0.03 m/s | Automatic | 5 min/Time | |
| Indoor Black Globe Temperature | −20~120 °C | ±0.5 °C | Automatic | 5 min/Time |
| Parameters | Settings | |
|---|---|---|
| Simulation period | From 1 January to 31 December | |
| Population density | 25 m2/p | |
| Calculated number of air changes for winter heating | 1.0 H−1 | |
| Metabolic rate per inhabitant for home activities | Sitting/Sleeping | 2.45 mL/(kg·min) |
| Standing/Relaxing | 3.5 mL/(kg·min) | |
| Cooking | 6.475 mL/(kg·min) | |
| Cleaning the room | 6.475 mL/(kg·min) | |
| Lighting density per area | 5.0 W/m2 | |
| Heating, ventilation, and Air Conditioning parameters | Winter heating temperature | 18 °C |
| Air conditioning temperature in summer | 26 °C | |
| Cooling and heating coefficient of performance | 2.5 | |
| Name | Variable Type | Range | Step Size | Unit Price | |
|---|---|---|---|---|---|
| Type of Thermal Insulation Materials | EPS Board 1 | Discrete Variable | 0.039 W/(m2·K) | — | 400 CNY/m3 |
| XPS Board 2 | 0.030 W/(m2·K) | 420 CNY/m3 | |||
| RW Board 3 | 0.041 W/(m2·K) | 380 CNY/m3 | |||
| PU Board 4 | 0.024 W/(m2·K) | 600 CNY/m3 | |||
| Thickness of Thermal Insulation Layer | Exterior walls | Continuous Variable | 20–150 mm | 10 mm | — |
| Roof | |||||
| Type of Exterior Windows | 5 mm Low-E Glass, PVC Frame 5 | Discrete Variable | 3.4 W/(m2·K)) | — | 280 CNY/m2 |
| 5 mm Clear Glass + 9A (Air Gap) + 5 mm Clear Glass, Standard Aluminum Frame | 3.0 W/(m2·K) | 360 CNY/m2 | |||
| 5 mm Clear Glass + 9A (Air Gap) + 5 mm Clear Glass, PVC Frame | 2.8 W/(m2·K) | 390 CNY/m2 | |||
| 5 mm Clear Glass + 9A (Air Gap) + 5 mm Clear Glass, Thermal Break Aluminum Frame | 1.9 W/(m2·K) | 480 CNY/m2 | |||
| 5 mm Low-E Glass + 9A (Air Gap) + 5 mm Clear Glass, PVC Frame | 2.0 W/(m2·K)) | 450 CNY/m2 | |||
| Indoor Ceiling | 9 mm Gypsum Board | Discrete Variable | 0/1 (Boolean Value) | — | 40 CNY/m2 |
| Objective | E (kWh/m2) | Rank | TDT (h) | Rank | ΔLCC (CNY) | Rank | Retrofit Cost (CNY) | |
|---|---|---|---|---|---|---|---|---|
| Sample building | 96.41 | - | 6173 | - | - | - | - | |
| Scheme 1 | Optimal Solution for E 1 | 42.40 | 1/5000 | 5092 | 588/5000 | −29,566.94 | 4894/5000 | 47,073.58 |
| Scheme 2 | Optimal Solution for TDT 2 | 42.87 | 501/5000 | 5078 | 1/5000 | −27,966.58 | 4969/5000 | 48,007.11 |
| Scheme 3 | Optimal Solution for ΔLCC 3 | 45.23 | 1979/5000 | 5183 | 2003/5000 | −56,329.87 | 1/5000 | 16,297.20 |
| Scheme 4 | The average value of the fitness ranking’s optimal solution | 43.95 | 1366/5000 | 5139 | 1571/5000 | −56,158.32 | 324/5000 | 18,274.56 |
Disclaimer/Publisher’s Note: The statements, opinions and data contained in all publications are solely those of the individual author(s) and contributor(s) and not of MDPI and/or the editor(s). MDPI and/or the editor(s) disclaim responsibility for any injury to people or property resulting from any ideas, methods, instructions or products referred to in the content. |
© 2025 by the authors. Licensee MDPI, Basel, Switzerland. This article is an open access article distributed under the terms and conditions of the Creative Commons Attribution (CC BY) license (https://creativecommons.org/licenses/by/4.0/).
Share and Cite
Chu, Y.; Li, J.; Zhao, P. Multi-Objective Optimization of Envelope Structures for Rural Dwellings in Qianbei Region, China: Synergistic Enhancement of Energy Efficiency, Thermal Comfort, and Economic Viability. Buildings 2025, 15, 1367. https://doi.org/10.3390/buildings15081367
Chu Y, Li J, Zhao P. Multi-Objective Optimization of Envelope Structures for Rural Dwellings in Qianbei Region, China: Synergistic Enhancement of Energy Efficiency, Thermal Comfort, and Economic Viability. Buildings. 2025; 15(8):1367. https://doi.org/10.3390/buildings15081367
Chicago/Turabian StyleChu, Yan, Junjun Li, and Pengfei Zhao. 2025. "Multi-Objective Optimization of Envelope Structures for Rural Dwellings in Qianbei Region, China: Synergistic Enhancement of Energy Efficiency, Thermal Comfort, and Economic Viability" Buildings 15, no. 8: 1367. https://doi.org/10.3390/buildings15081367
APA StyleChu, Y., Li, J., & Zhao, P. (2025). Multi-Objective Optimization of Envelope Structures for Rural Dwellings in Qianbei Region, China: Synergistic Enhancement of Energy Efficiency, Thermal Comfort, and Economic Viability. Buildings, 15(8), 1367. https://doi.org/10.3390/buildings15081367