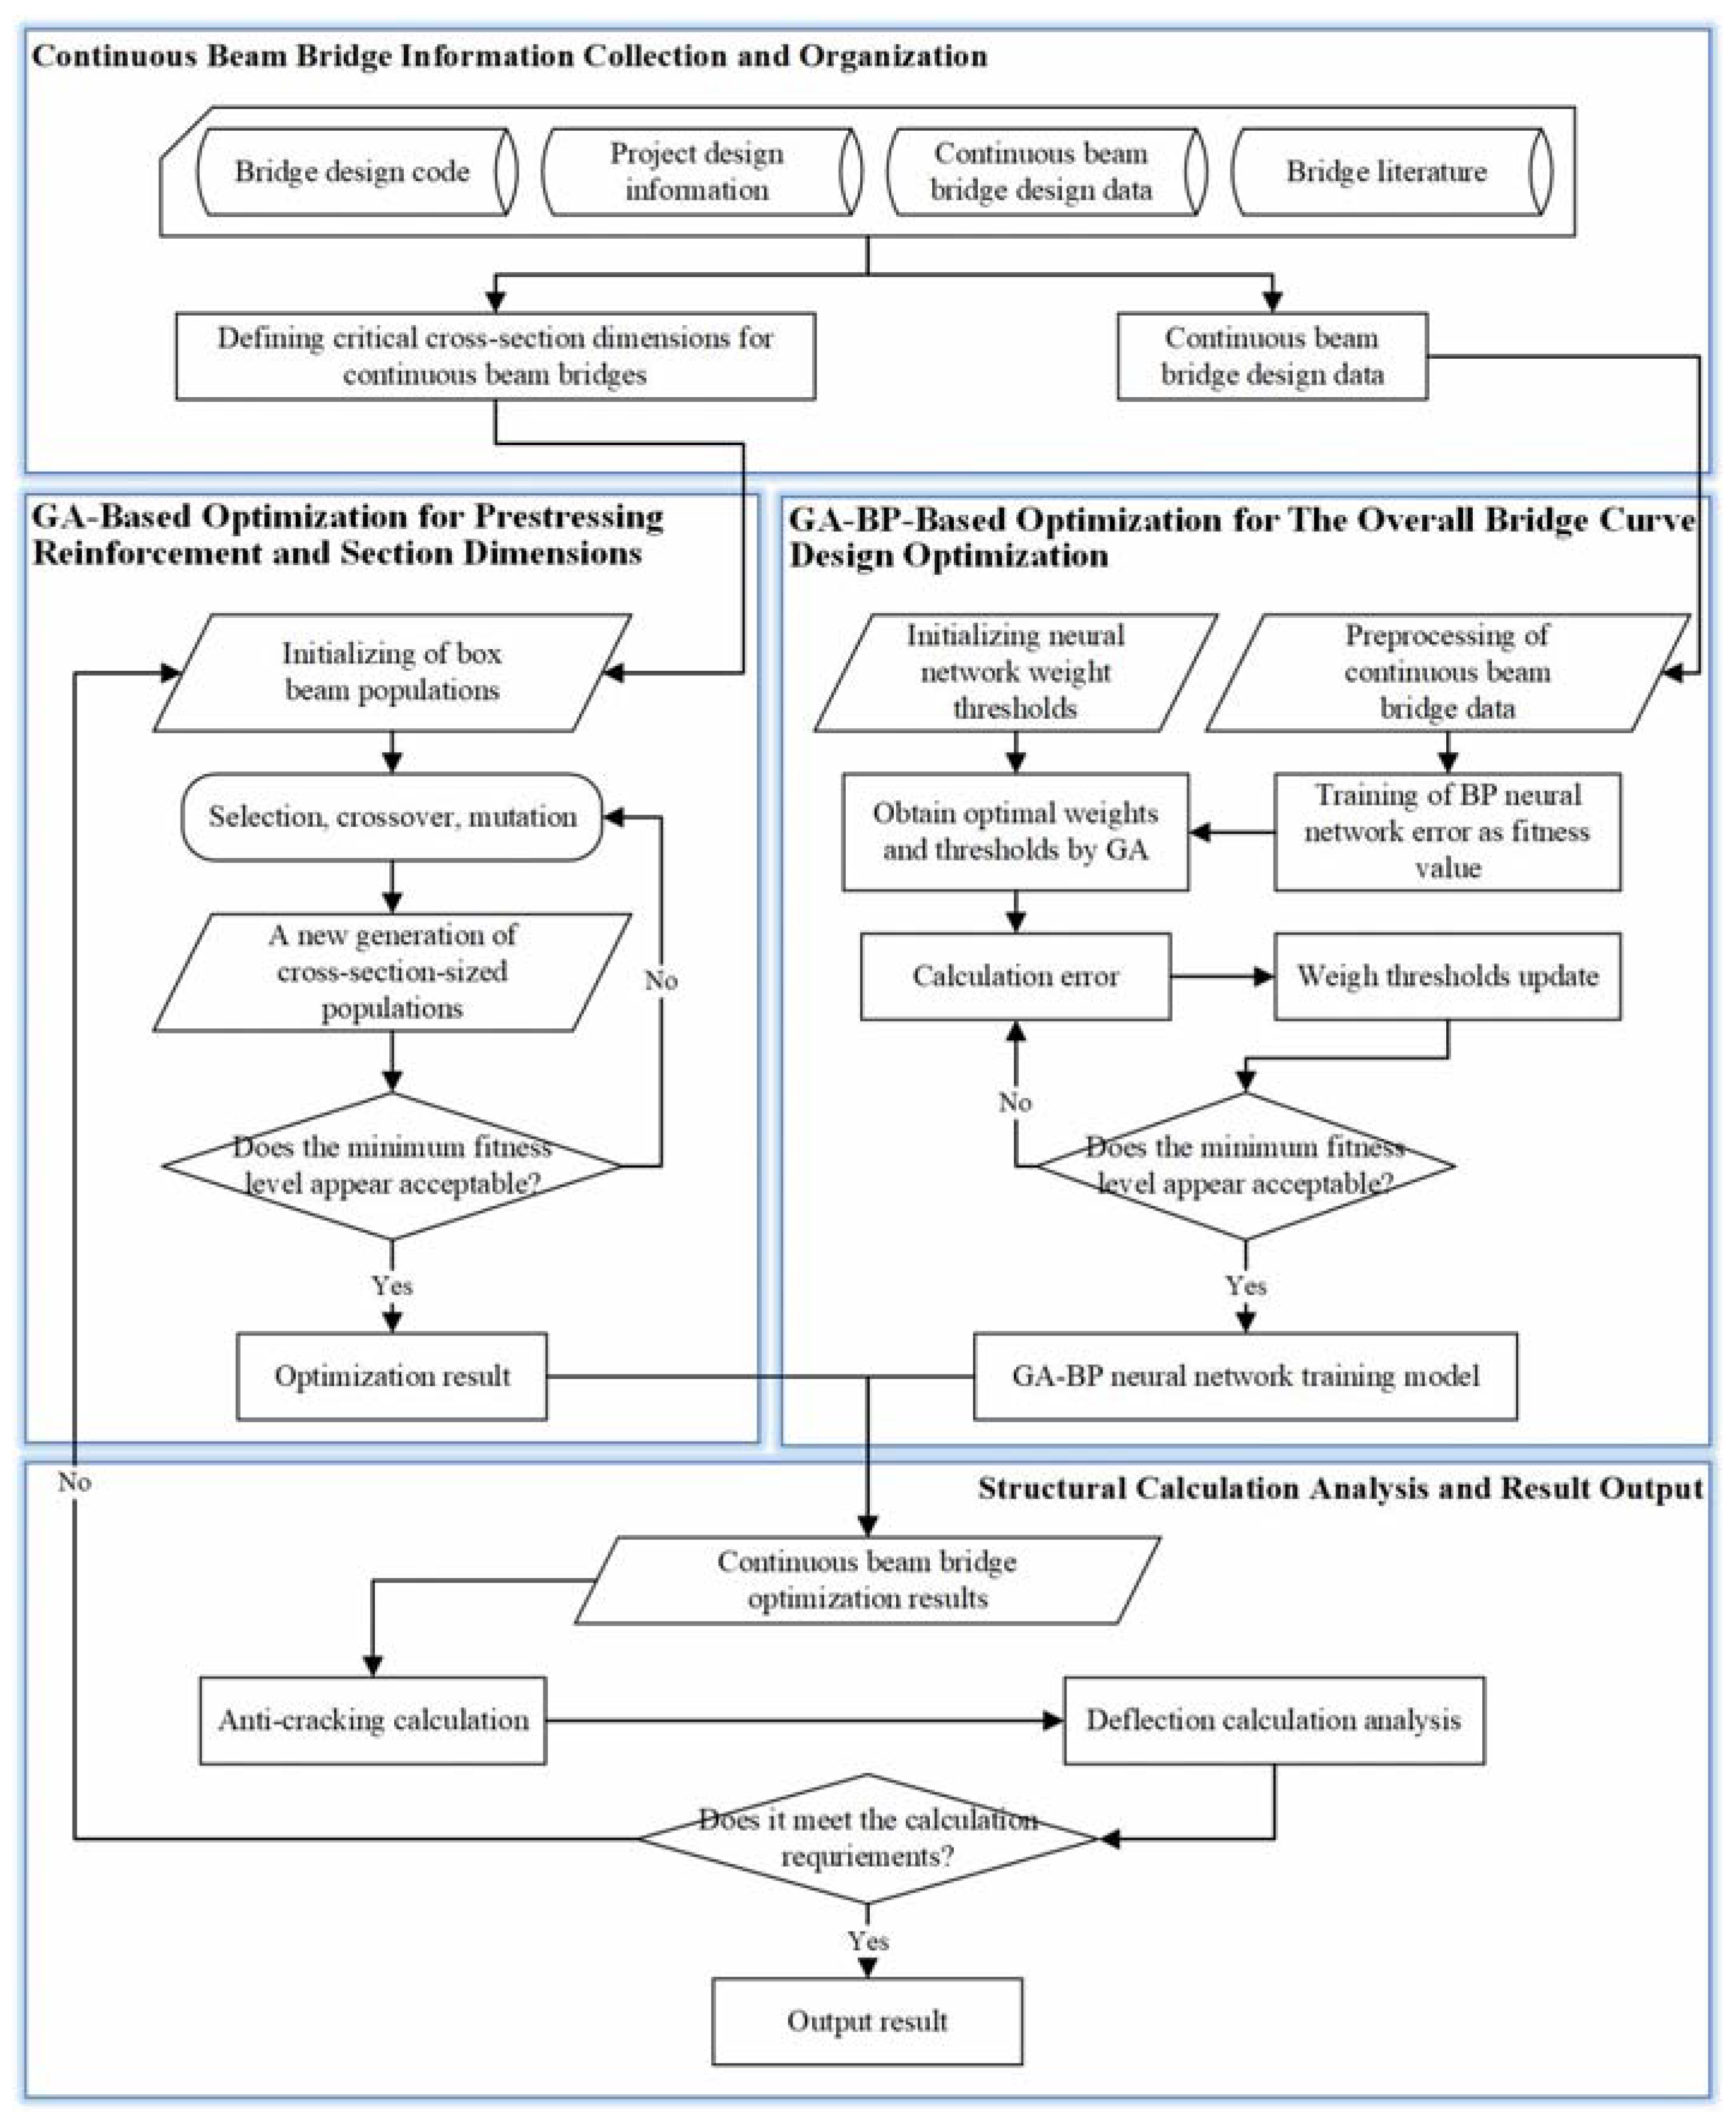
According to the project requirements, continuous beam bridge construction will be carried out by hanging basket cantilever casting. The design optimization calculation was conducted using Matlab 2021b, through which the structural parameters were optimized to improve the safety and economy of the structure. The final results were checked and calibrated by Midas Civil 2022 to ensure the performance and stability of the design solution under various loading conditions.
4.2. Overall Bridge Curve Design Optimization
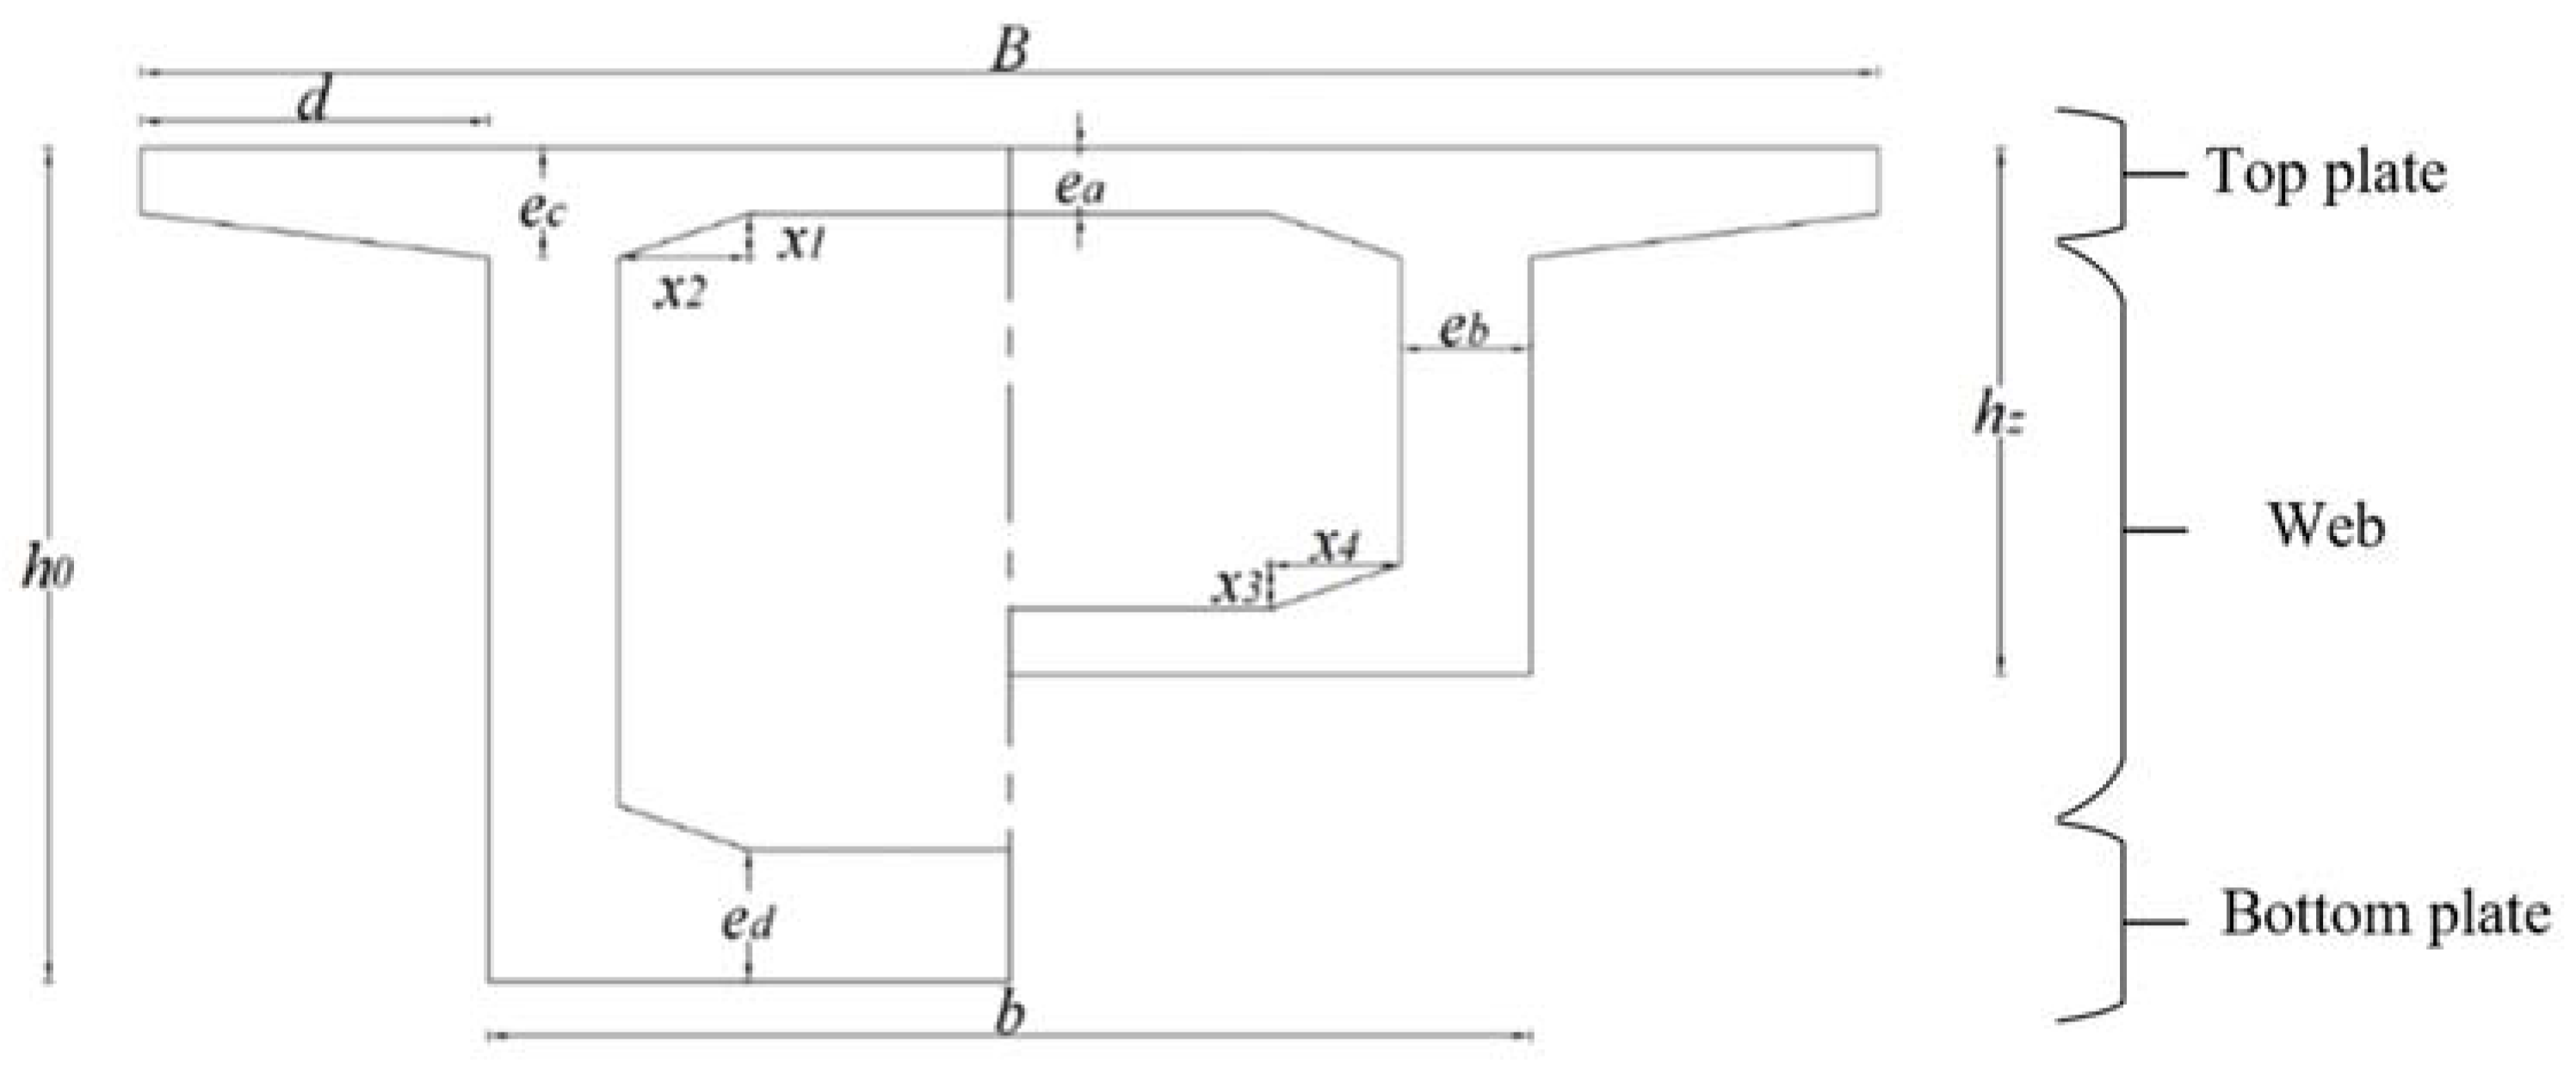
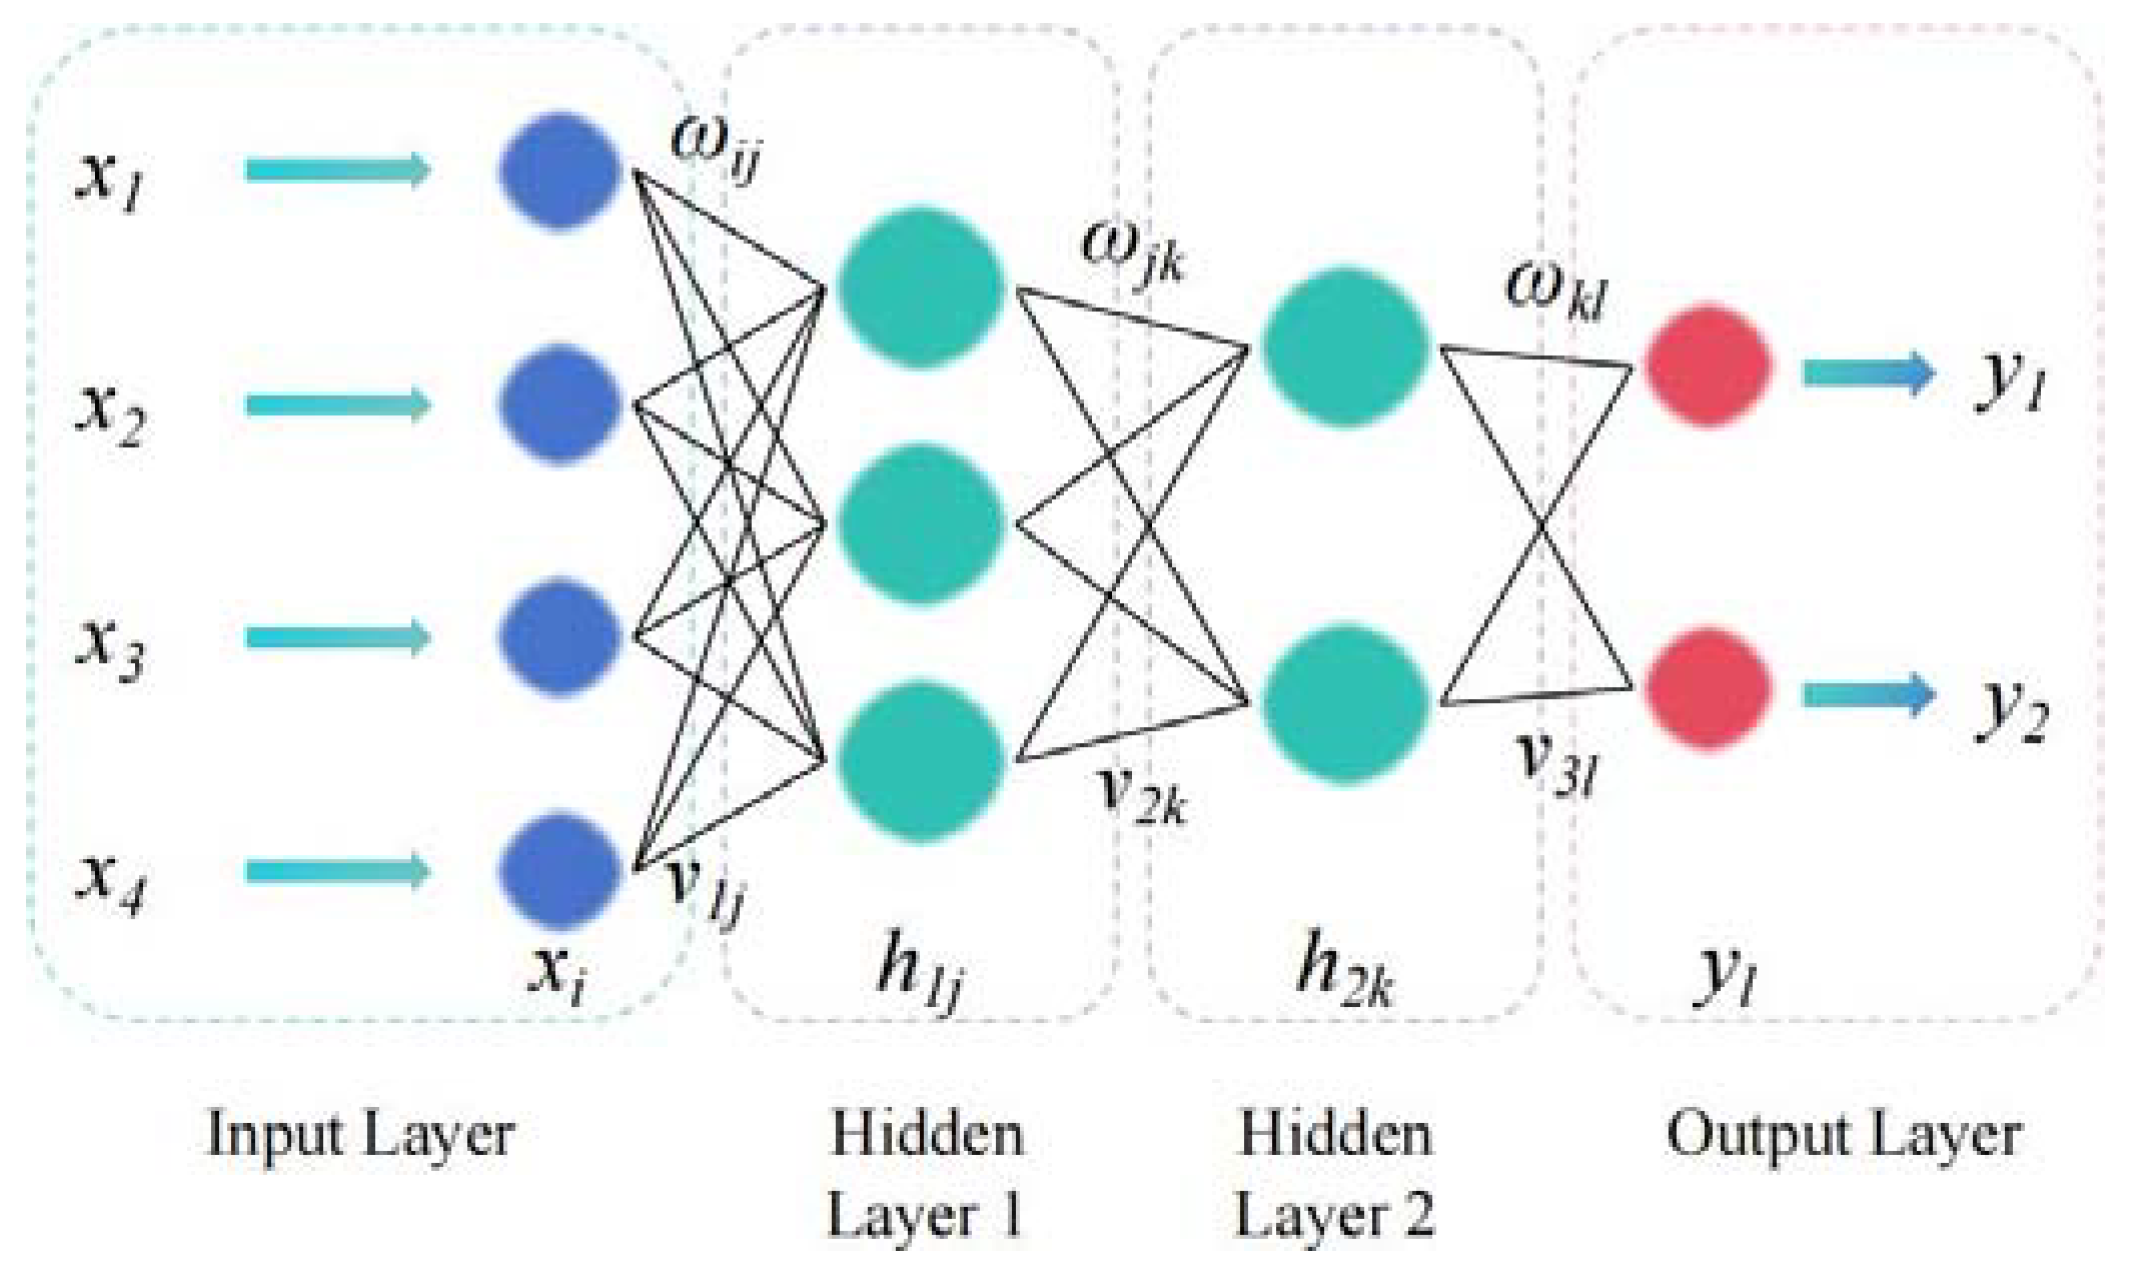
To obtain optimization results for the continuous beam bridge, this study employs a novel approach: using a GA-BP neural network prediction model instead of optimizing designs for multiple sections of the continuous beam bridge. This prediction model forecasts the curves of the beam height and bottom plate thickness of the continuous beam bridge. To ensure the accuracy of the predictions, we gather data from numerous continuous beam bridges domestically and internationally, including total span (
S), side span length (
Ls), mid-span length (
Lz), pivot beam height (
h0), mid-span beam height (
hz), etc., as input data. The beam height curve (
xl) and bottom plate thickness curve (
xd) of the continuous beam are designated as output data. To enhance model accuracy, we extensively collect data from continuous beam bridges as training samples and employ neural network algorithms for learning to obtain precise prediction models. During training, we observe a correlation between the bottom plate thickness curve and the beam height curve of the continuous beam bridge. Consequently, we separately train and predict the exponentials of the two curves to obtain more accurate prediction models. Furthermore, before training begins, we preprocess variables to extract additional data features for training purposes. This study delves into the neural network models of continuous beam height curves and comprehensively evaluates their performance by comparing standard BP neural networks with GA-BP neural networks optimized through genetic algorithms.
Table 5 shows the parameter configurations used during model training.
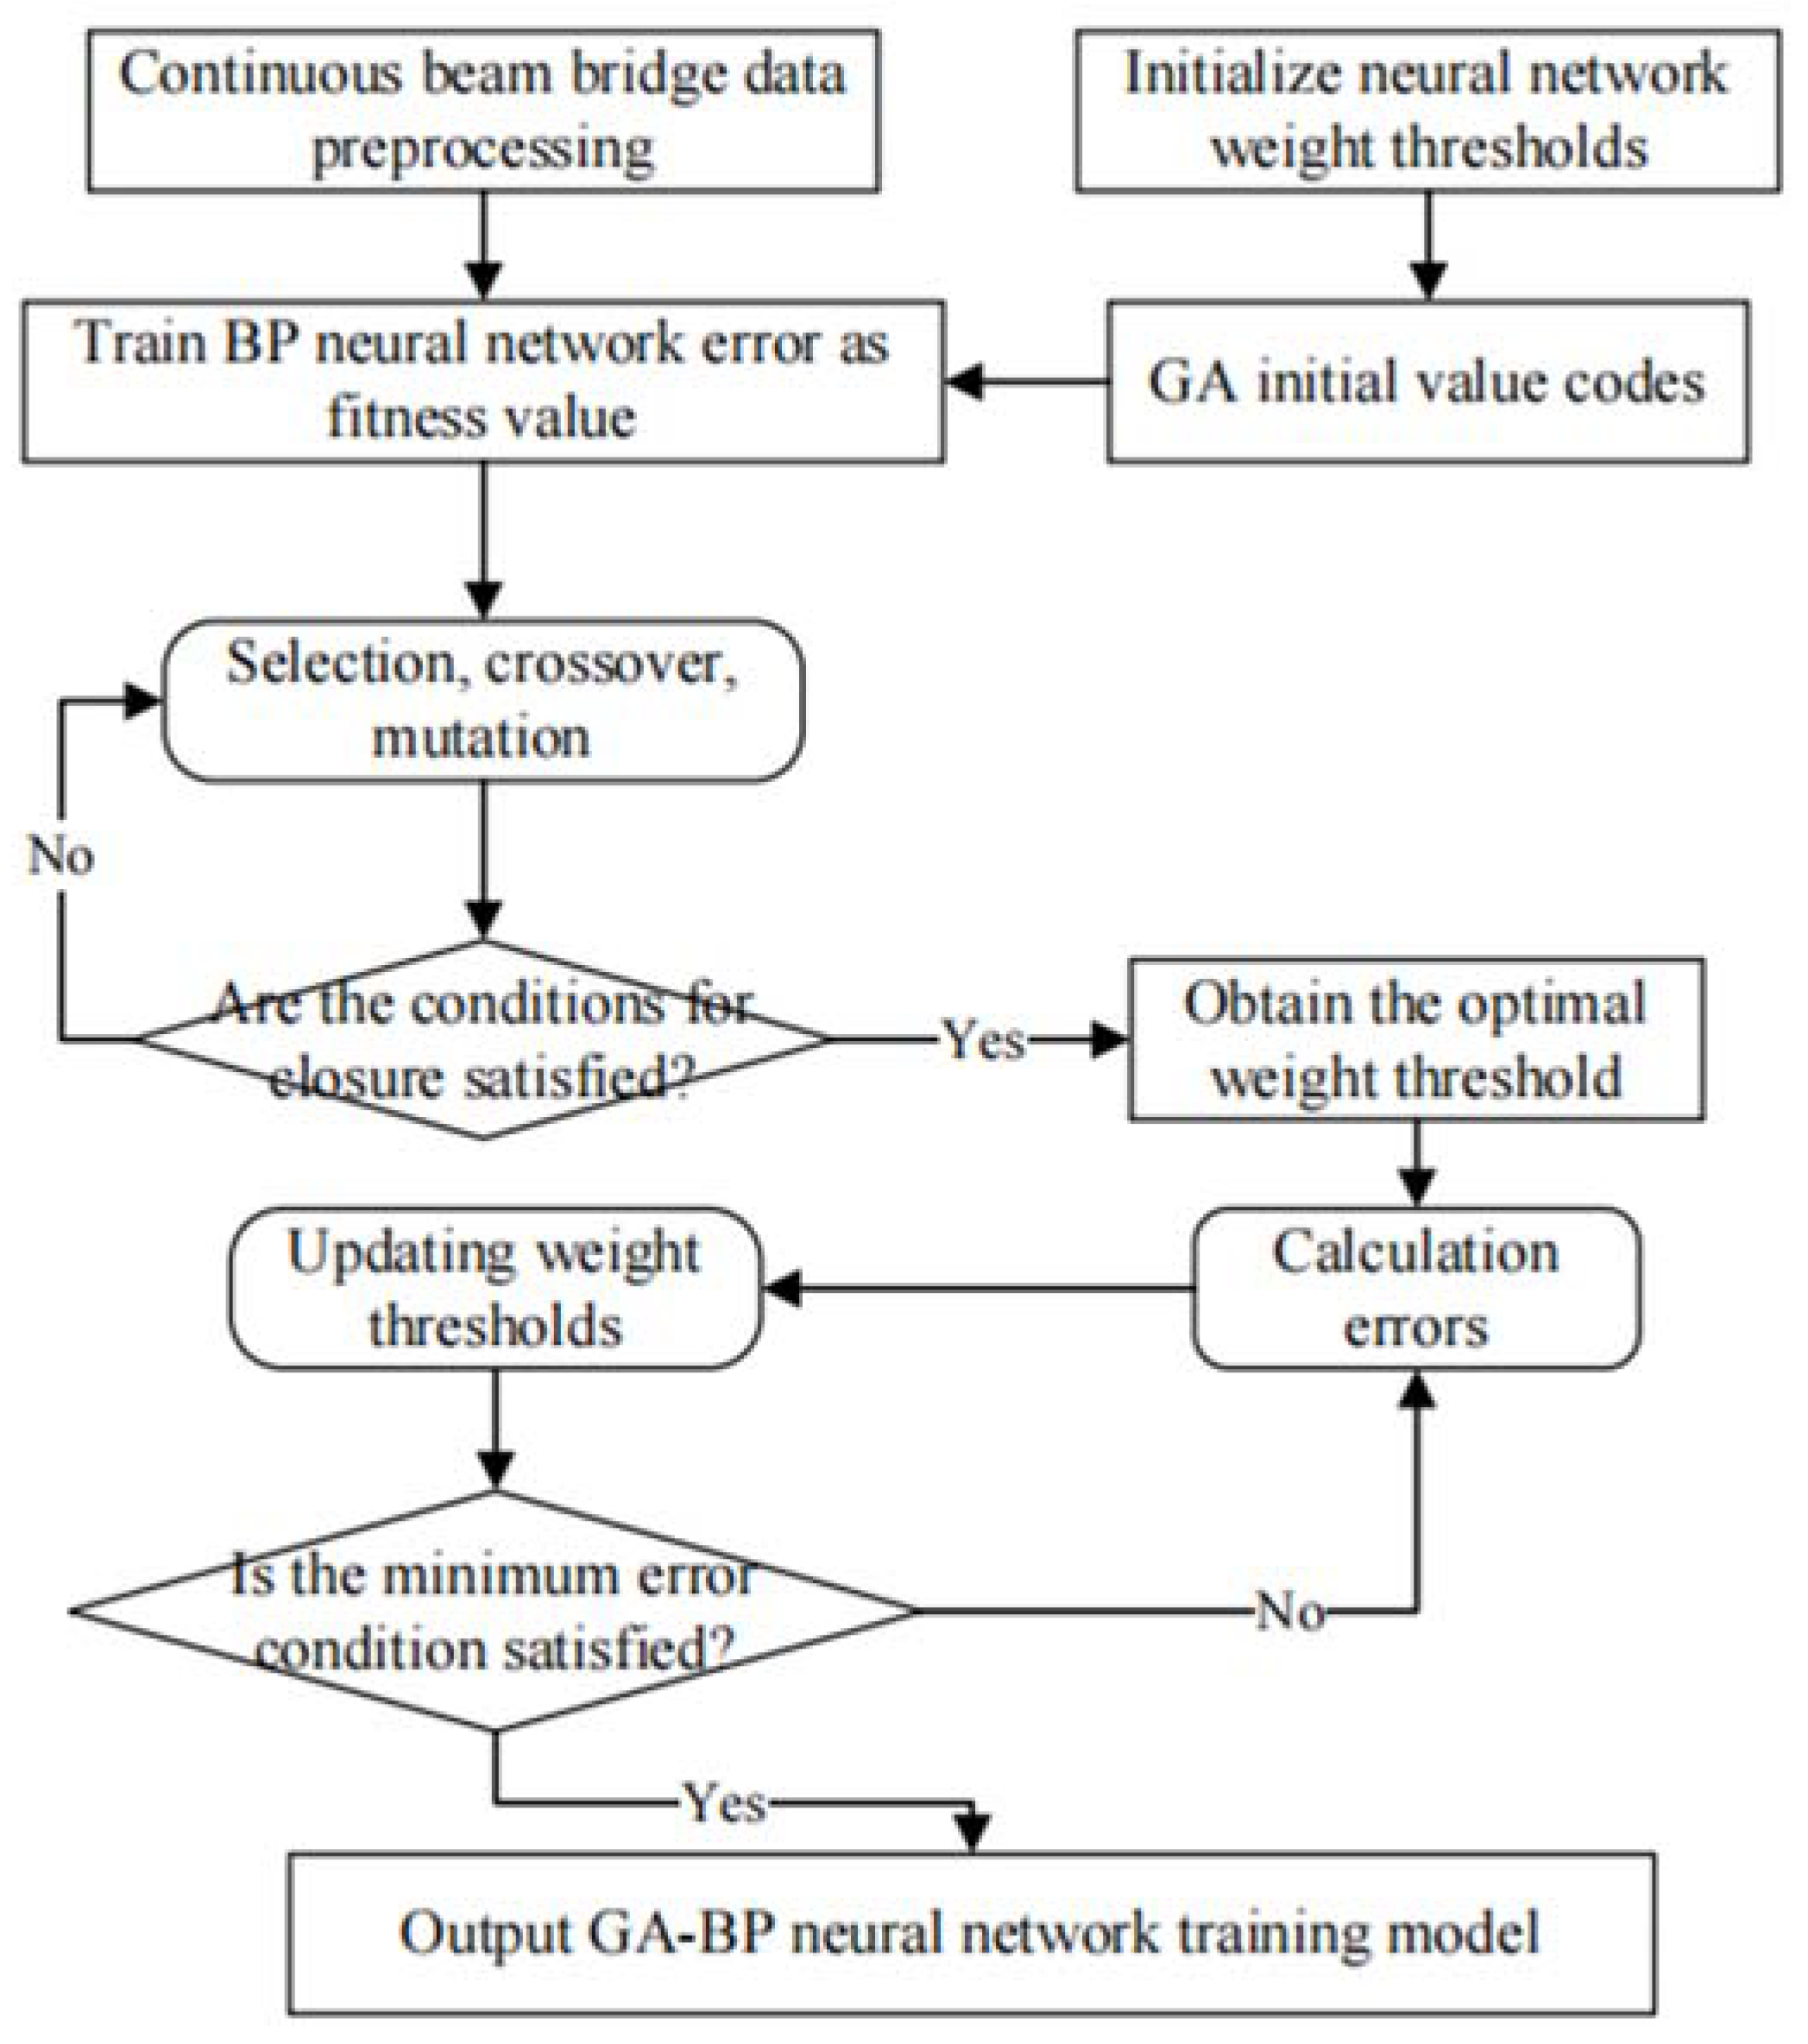
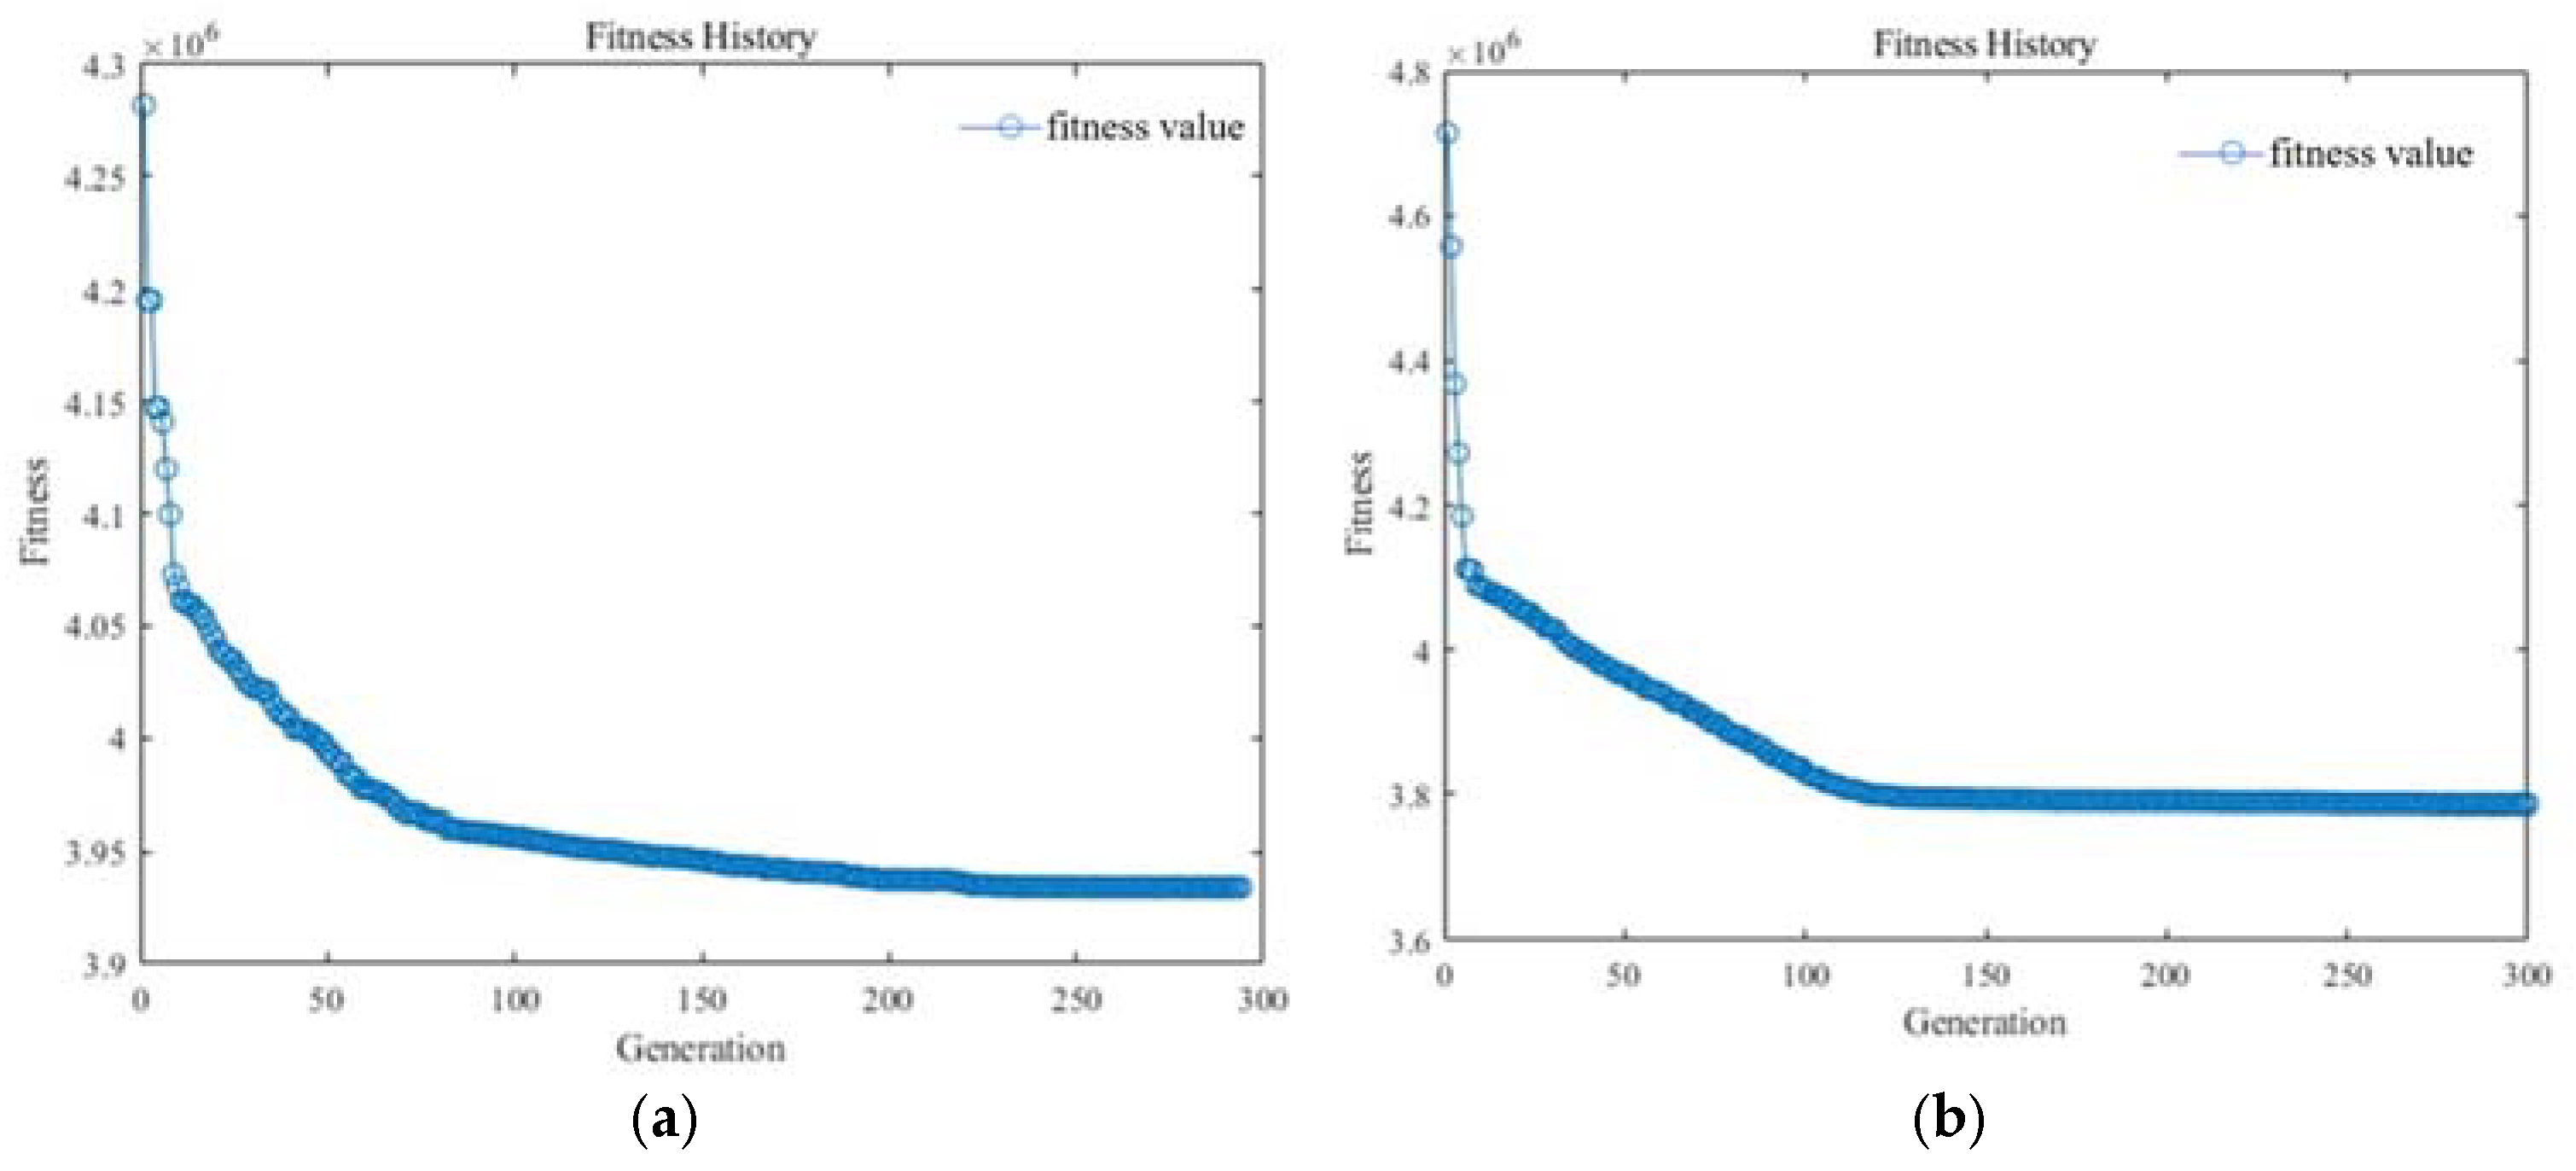
At this stage, the GA-BP neural network training process involves two key steps: first, the convergence of the standard BP neural network training, and second, the optimization of the network using a genetic algorithm (GA). The GA performs crossover and mutation operations, using the error from the BP neural network as the fitness value for optimization. This process identifies the optimal weights and thresholds, which are then used to update and retrain the network for enhanced performance.
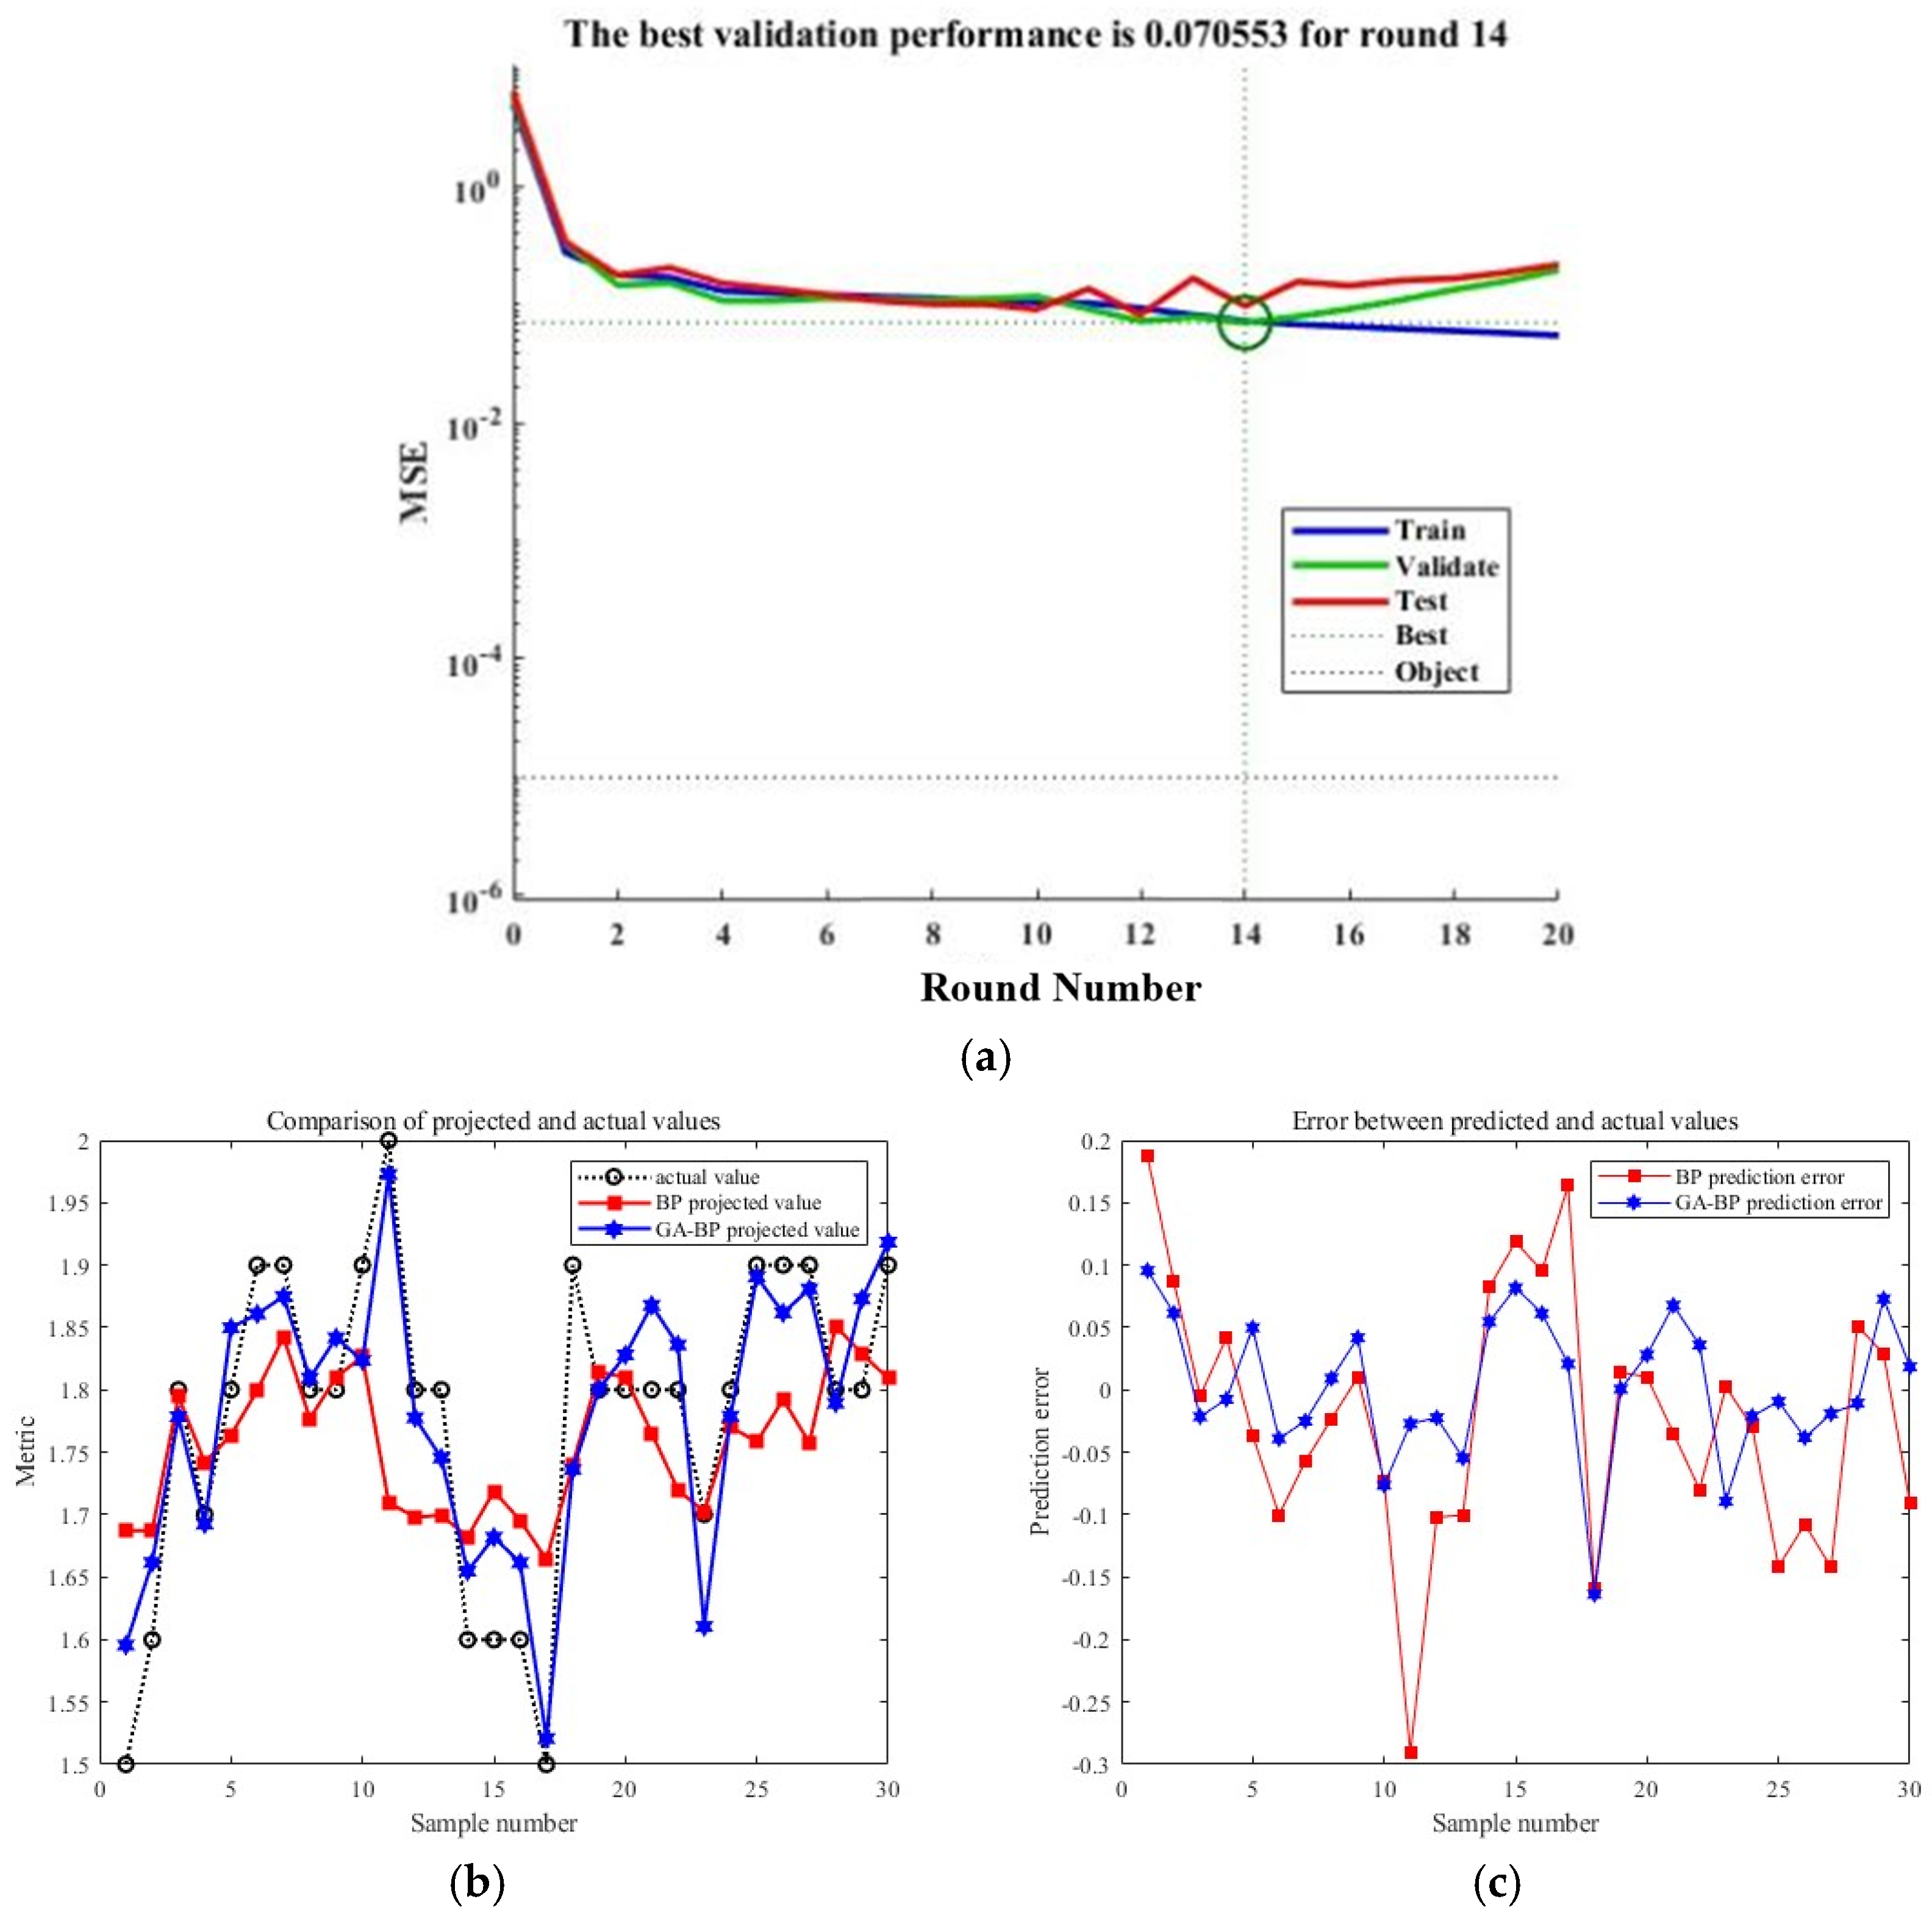
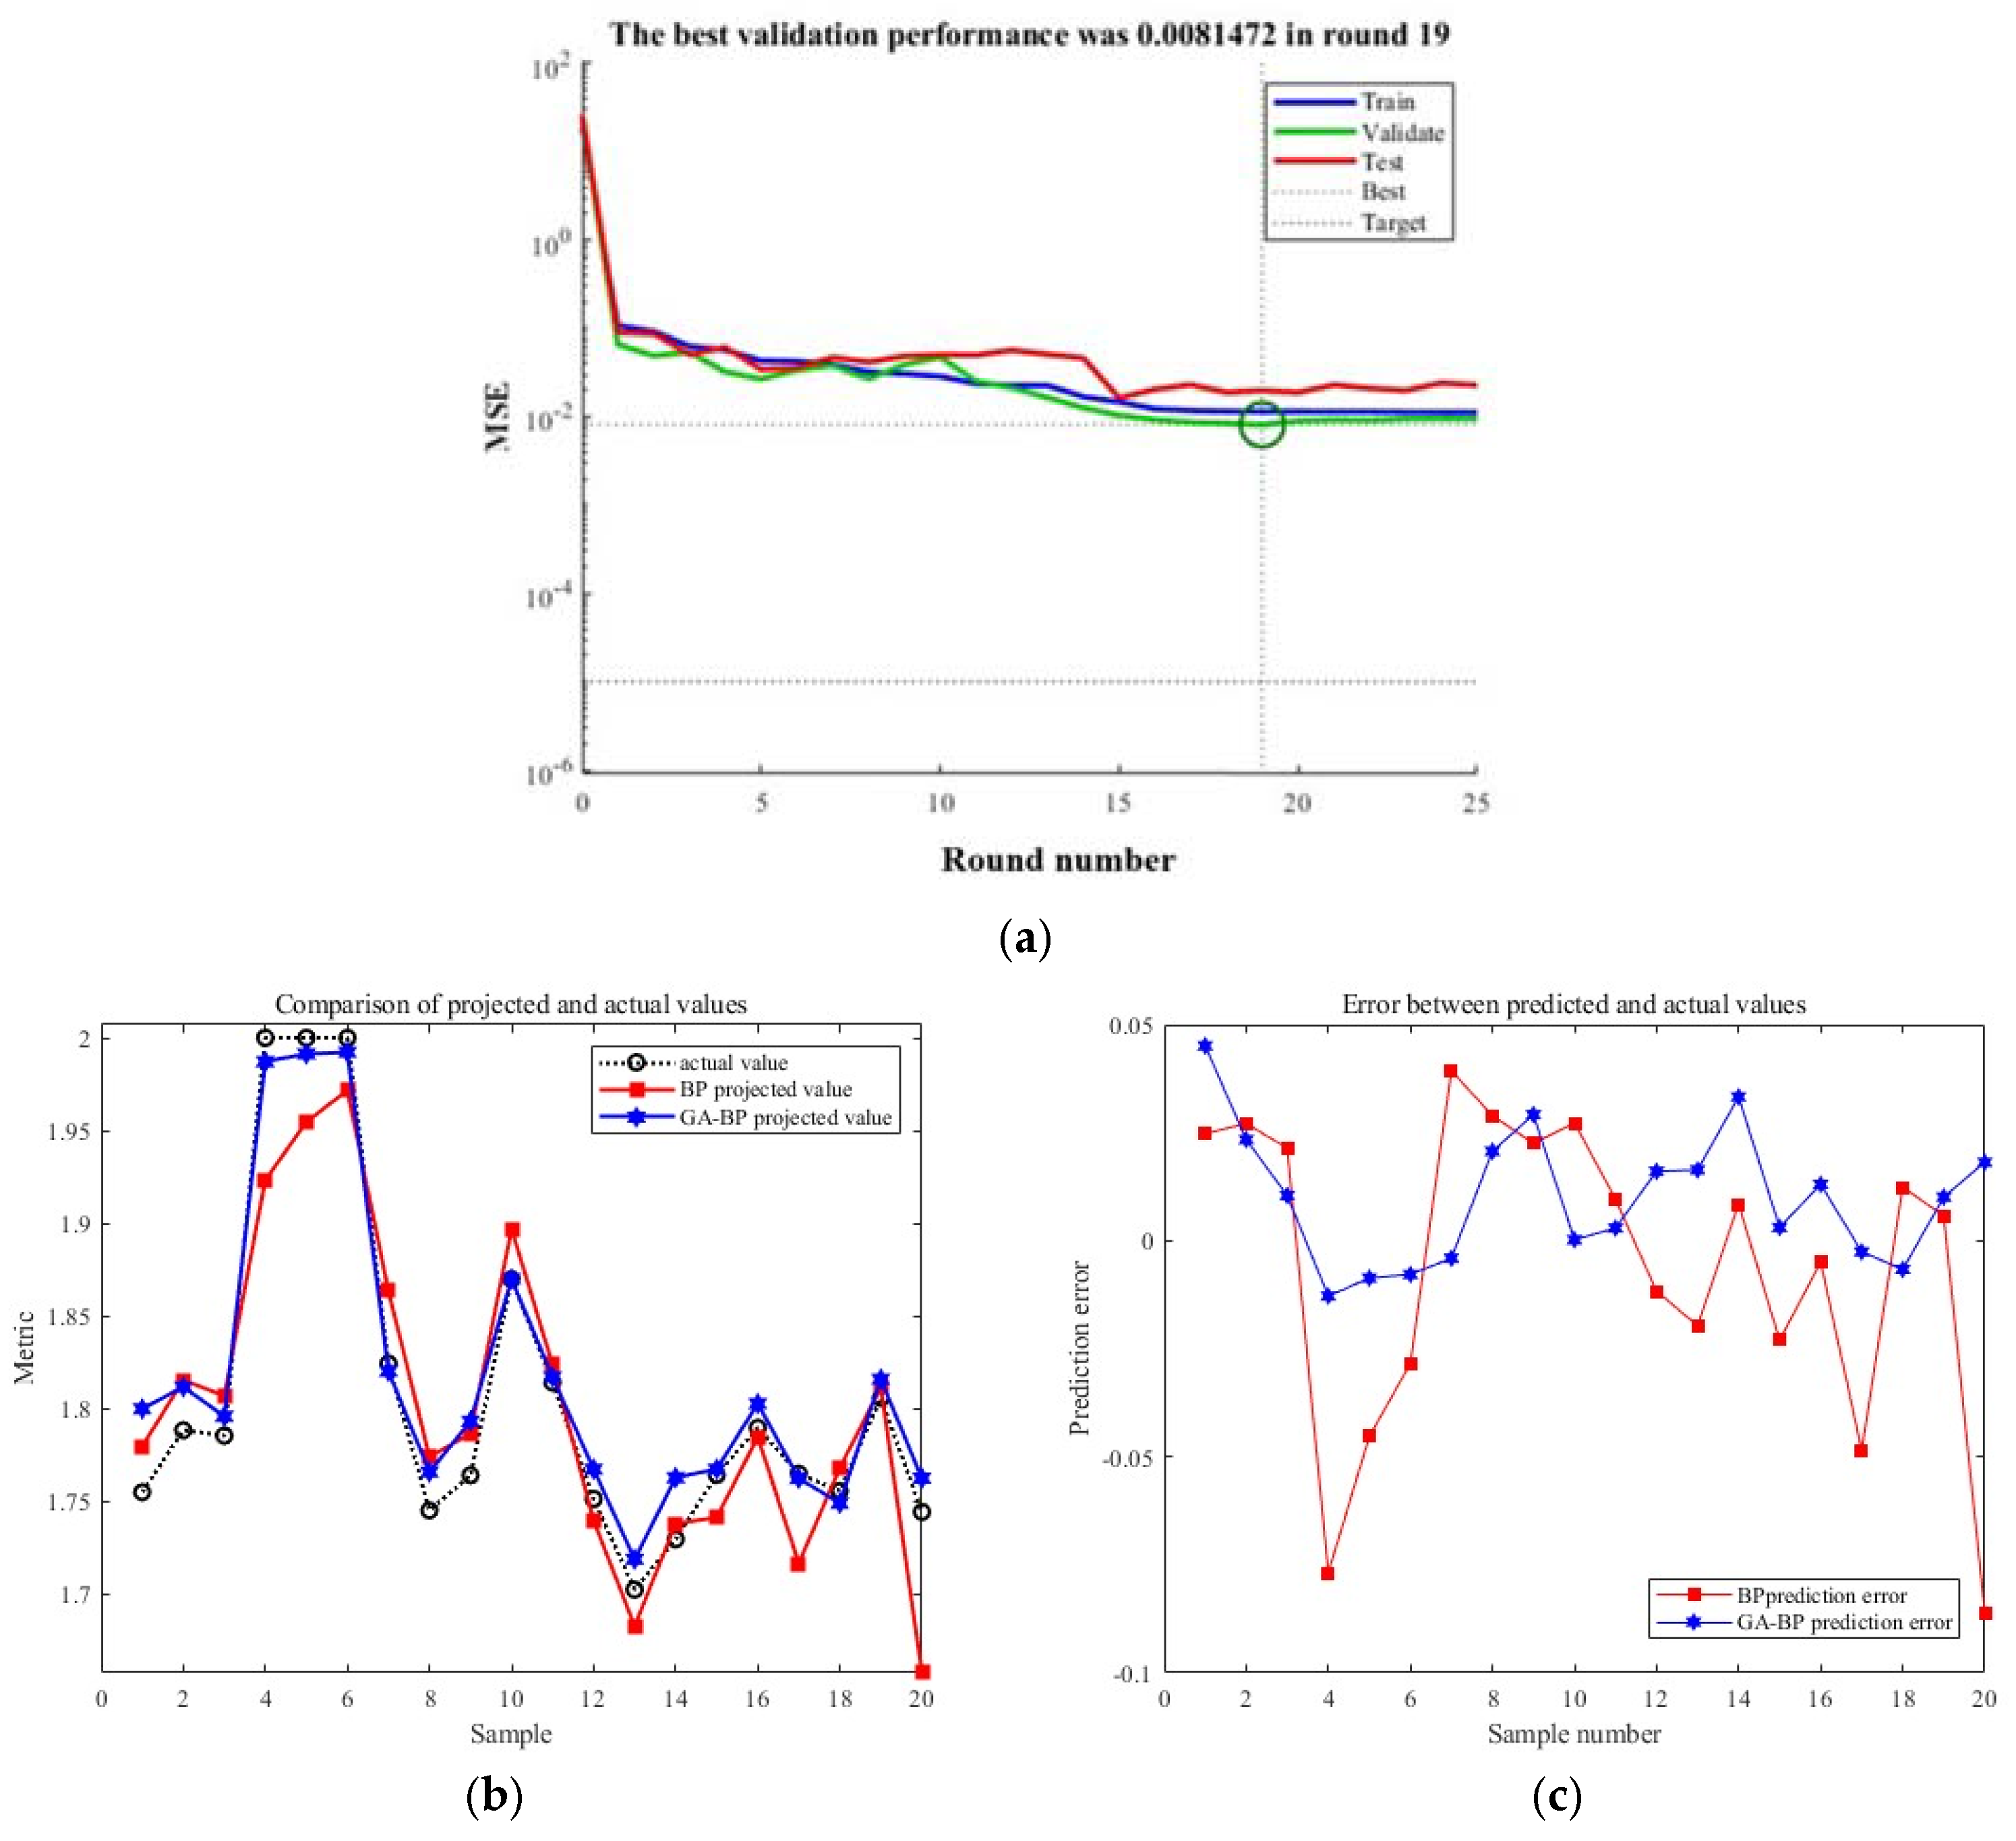
At the current stage, the training process of the GA-BP neural network comprises two key steps: the convergence of the standard BP neural network training and the optimization of the neural network by genetic algorithms. Genetic algorithms utilize operations such as crossover and mutation, using the error obtained from training the standard BP neural network as the optimization fitness value. This process determines the optimal weights and thresholds and subsequently updates and retrains the network accordingly. By the 14th training iteration, the system successfully reaches the predetermined target error, as depicted in
Figure 7a. Meanwhile,
Figure 7b illustrates the corresponding predictions of the continuous beam height curve. Additionally, it can be observed from
Figure 7c that the error range of the GA-BP neural network remains relatively stable. Compared to the standard BP neural network, the GA-BP neural network exhibits a better trend in fitting the actual values. The results in
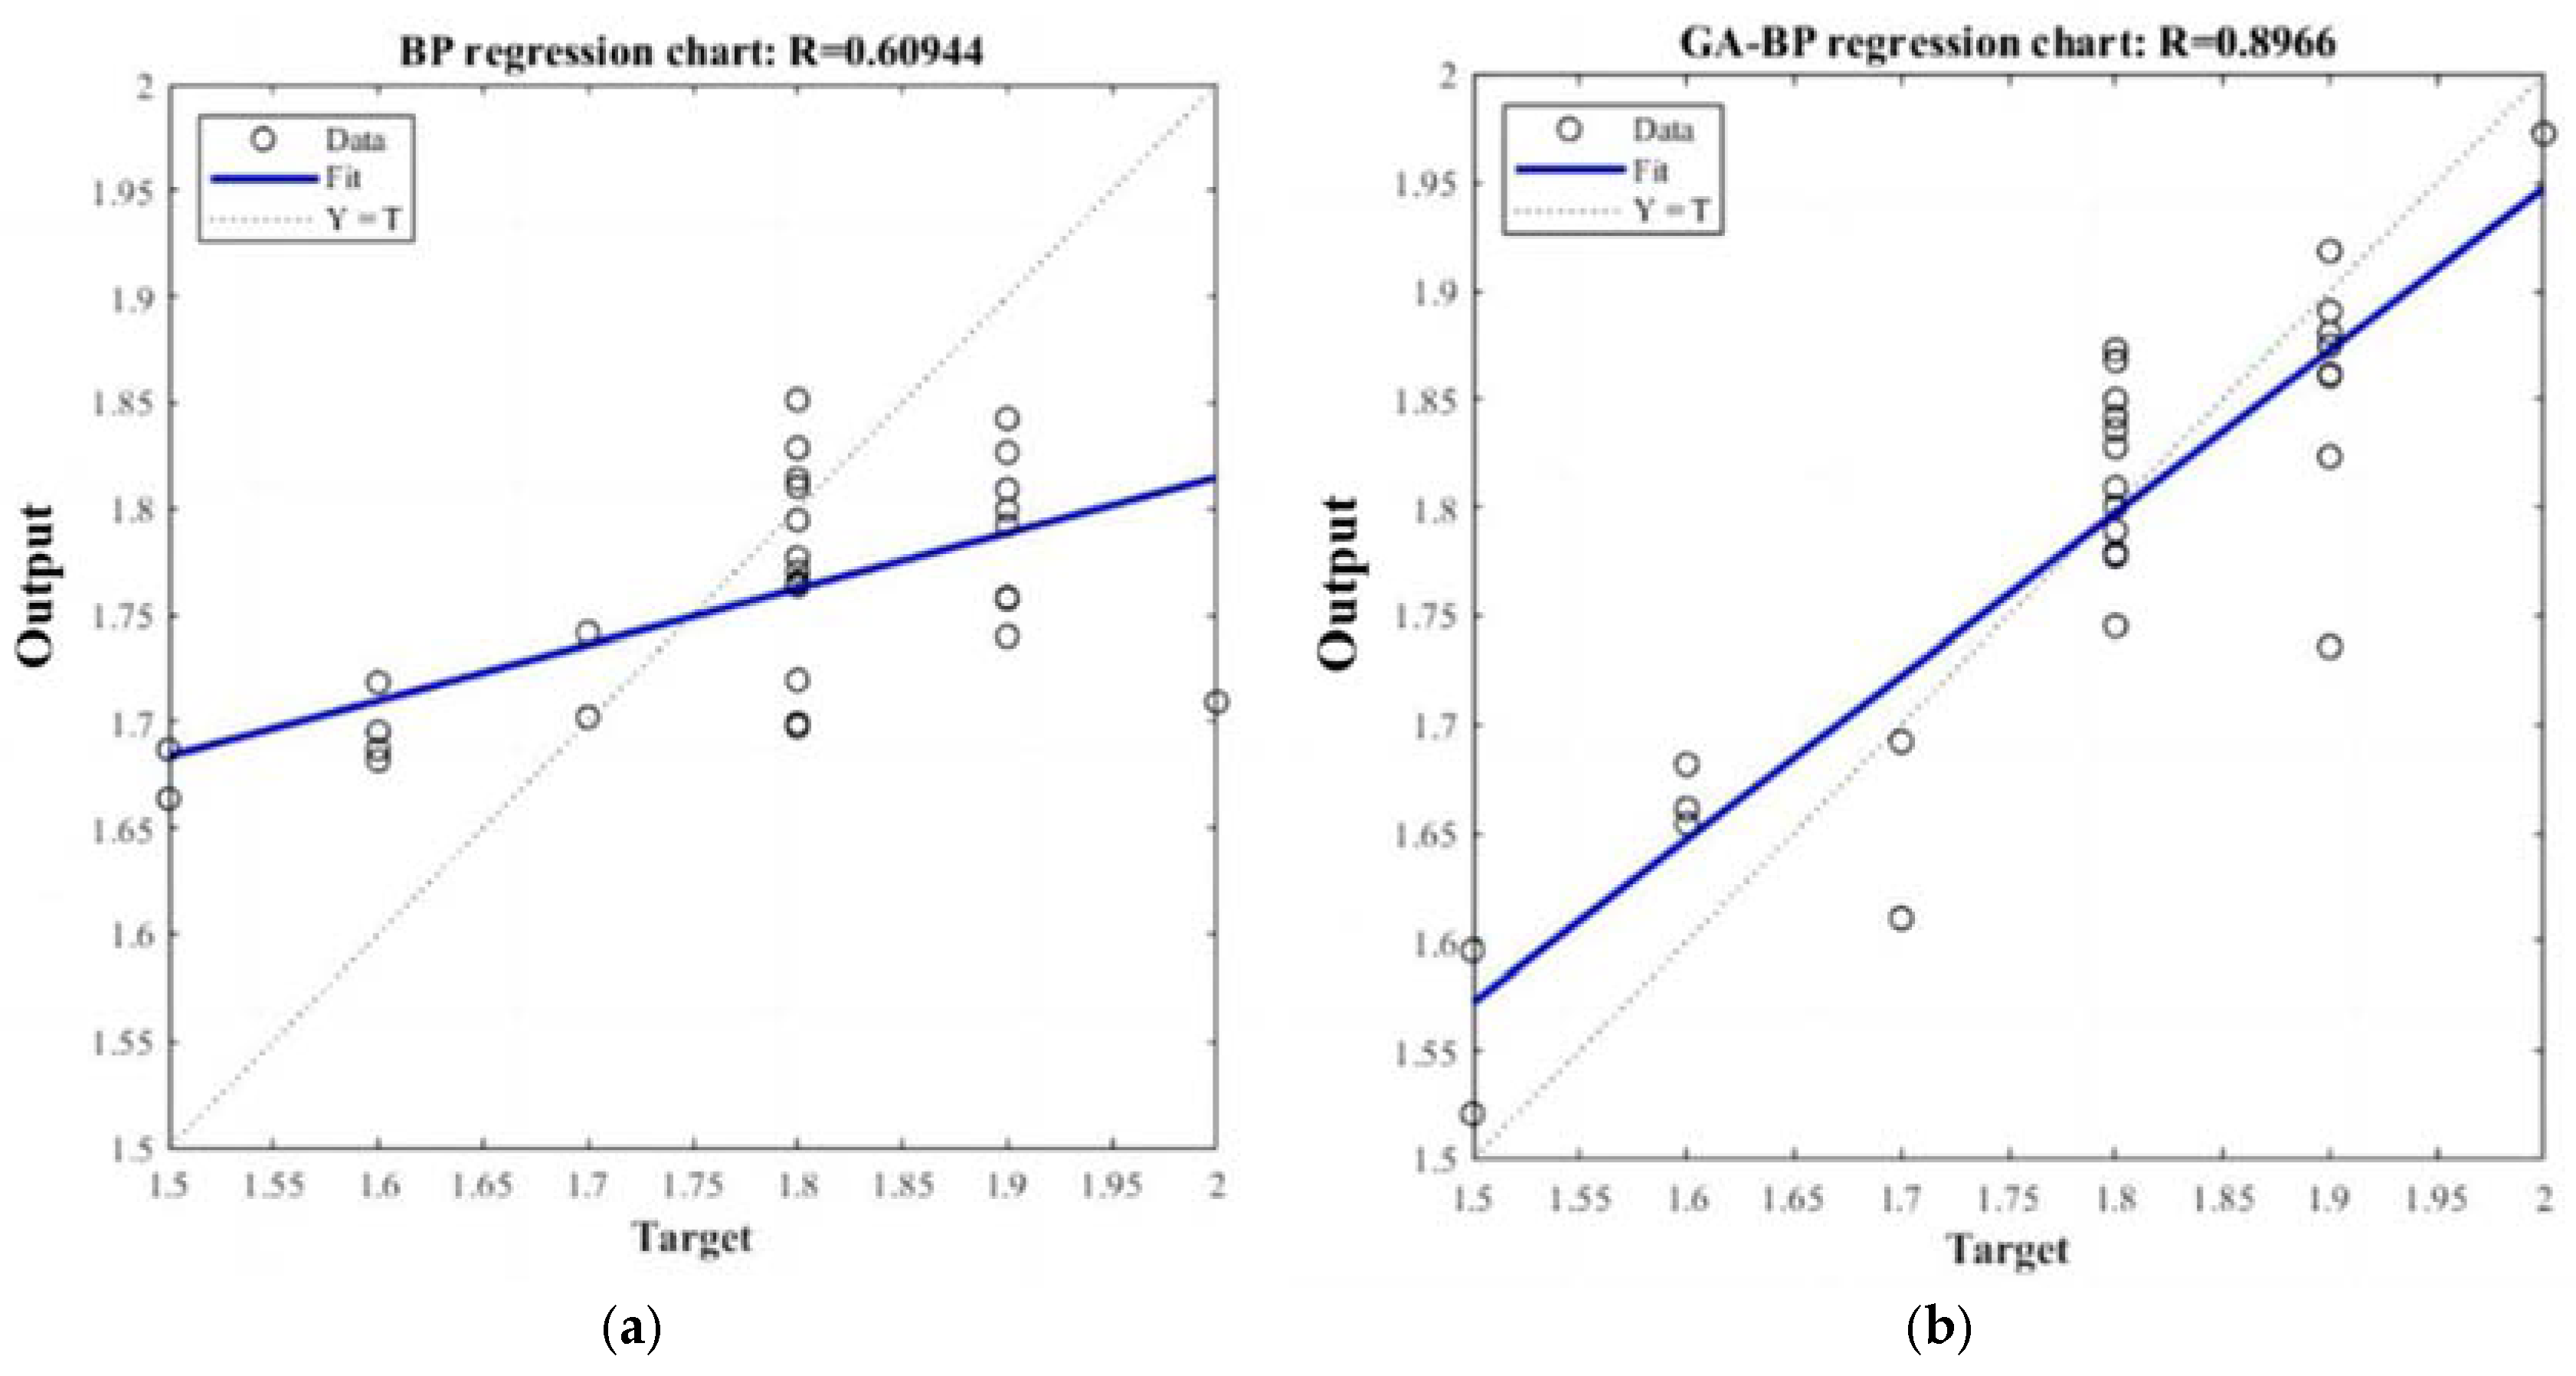
Figure 8 demonstrate that the regression coefficient of the GA-BP neural network model improved by 29% compared to the standard BP neural network model.
In this study, a performance comparison between the GA-BP neural network and the traditional BP neural network for predicting the height curve of continuous beams was conducted using 10 test groups (as shown in
Table 6 and
Table 7). The average results, presented in
Table 8 indicate that the GA-BP neural network significantly outperformed the BP model. Specifically, the Mean Absolute Error (MAE) was reduced by 46.3% (from 0.0823 to 0.0442), demonstrating a substantial reduction in average prediction deviation. The Mean Squared Error (MSE) dropped by 71.2% (from 0.0108 to 0.0031), and the Root Mean Squared Error (RMSE) was reduced by 46.4% (from 0.1041 to 0.0558), indicating that extreme prediction error fluctuations were effectively suppressed. Additionally, the Mean Absolute Percentage Error (MAPE) decreased by 45.8% (from 4.6578% to 2.5265%), confirming the model’s enhanced adaptability to beam height curves of different magnitudes.
The prediction accuracy improved to 97.47%, representing a 2.13% increase over the BP network’s 95.34%, highlighting the higher proportion of reliable predictions within the allowable error range. Statistical significance tests using paired t-tests for all evaluation metrics (p < 0.001) rejected the null hypothesis, confirming that the improvements achieved by the GA-BP model are statistically significant. Moreover, a large effect size further validates the practical relevance of the differences observed.
The GA-BP neural network enhances the BP model by optimizing initial weights and structure through a genetic algorithm, effectively avoiding the common issue of local minima in traditional BP models. This results in substantial improvements in both accuracy and stability for predicting continuous beam height curves. The simultaneous reduction in MAE and RMSE demonstrates that the model minimizes average deviation while suppressing extreme errors, and the significant drop in MAPE highlights its robustness across varying data scales. The improved prediction accuracy further supports the GA-BP model’s reliability in engineering applications, providing a solid theoretical foundation for its use in scenarios such as bridge health monitoring.
Upon completion of the training for the exponentials of the continuous beam height curve variations in the previous stage, the parameter configuration for the continuous beam bottom plate thickness curve variations in the GA-BP neural network is outlined in
Table 5. Similarly, through comparison between the standard BP neural network and the GA-BP neural network optimized by genetic algorithms, the performance is comprehensively evaluated.
During the current stage of computation, as depicted in
Figure 9a, the system achieved the predetermined target error by the 26th training iteration. Simultaneously,
Figure 9b illustrates the corresponding predictions of the continuous beam height curve.
Figure 9c shows that the error range of the GA-BP neural network remains relatively stable. While the predictions of the standard BP neural network exhibit a reasonable fit with the actual values, those of the GA-BP neural network demonstrate a better trend in fitting the actual values. Moreover, the results from
Figure 10 indicate that the regression coefficient of the GA-BP neural network model improved by 7.196% compared to the standard BP neural network model. Additionally, it can be observed from
Figure 9c that the error range of the GA-BP neural network is relatively stable.
In this study, ten sets of computations were conducted to compare the performance of the GA-BP neural network and the traditional BP neural network in predicting the height curve of continuous beam bridges (as shown in
Table 9 and
Table 10). The final averaged results, presented in
Table 11, demonstrate that the GA-BP model significantly outperformed the BP model. Specifically, the mean absolute error (MAE) was reduced by 50.27% (from 0.0286 to 0.0142), indicating a notable decrease in average prediction deviation. The mean squared error (MSE) dropped by 74.08% (from 0.00127 to 0.000329), and the root mean squared error (RMSE) decreased by 49.09% (from 0.0356 to 0.0181), confirming improved overall prediction stability. Furthermore, the mean absolute percentage error (MAPE) was reduced by 49.29% (from 1.5671% to 0.7944%), highlighting the model’s enhanced adaptability to height data across varying magnitudes. The prediction accuracy increased to 99.20%, an improvement of 0.77% over the BP model (98.43%), indicating a higher proportion of reliable predictions in high-precision applications (e.g., within an allowable error margin of δ = 1%). These findings confirm that the GA-BP neural network, by globally optimizing the initial weights and network topology of the BP model through genetic algorithms, effectively overcomes issues such as local minima and unstable convergence commonly seen in traditional BP networks. This significantly improves both the accuracy and robustness of the predicted beam height curves.
The simultaneous reductions in MAE and RMSE indicate that the model not only lowers average error but also suppresses the volatility of extreme errors. The substantial drop in MAPE further underscores its strong adaptability to complex engineering data distributions. The near-perfect prediction accuracy of 99.2%, along with the results of the statistical significance tests (p < 0.001), provides solid evidence for the model’s potential in high-precision applications such as bridge health monitoring and structural safety assessment. Additionally, the substantial reductions in MAE and RMSE (by over 50% and 49%, respectively) indicate a marked improvement in both error control and stability. The exceptionally low MAPE (below 0.8%) further demonstrates the model’s reliability in precision-demanding scenarios, confirming that nearly all predictions fall within acceptable error margins.
Following the optimization results of the continuous beam section dimensions, after data processing, they are inputted into a pre-trained neural network model to obtain the exponentials of the overall bridge curves (detailed in
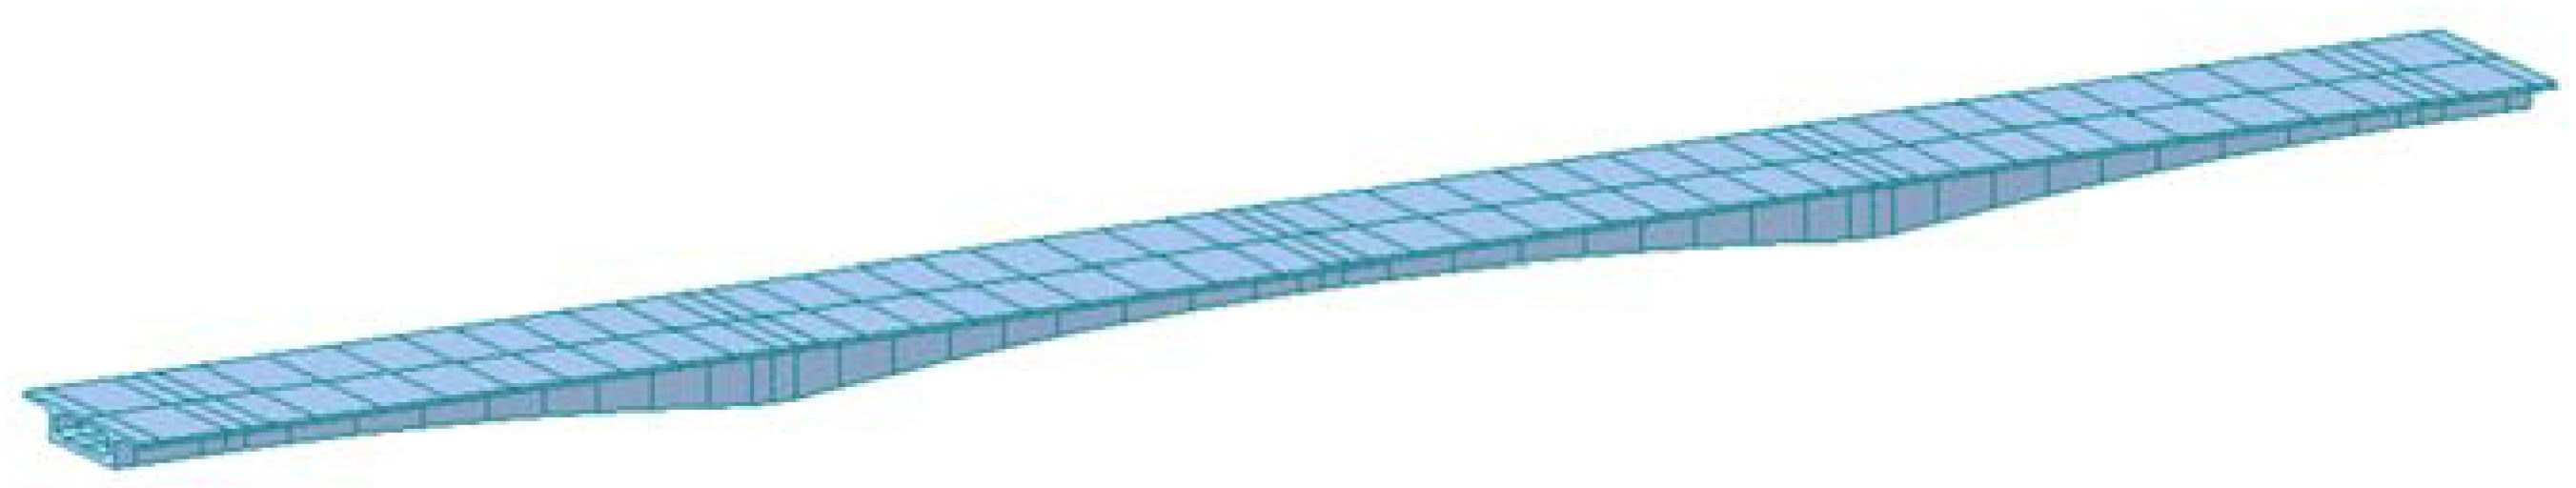
Table 12). Through this step, we can derive the mathematical formula for the overall bridge curves. Subsequently, the modeling process of the entire bridge can be conducted using Midas Civil 2021 v2.1 software (as illustrated in
Figure 11, the Midas model of the continuous beam bridge), for structural analysis and verification.
According to the computational results from the Midas bridge model, the stress of the continuous beam bridge under long-term and short-term load combinations complies with the requirements of bridge design specifications. Additionally, both the crack resistance performance of the positive section and the inclined section are adequately met. Through meticulous calculations, the deflection of the continuous beam bridge under the standards specified by the regulations is only 34 mm, significantly below the specified L/600 = 81.7 mm in the regulations. This indicates that the deflection values of the continuous beam bridge during operational use, after detailed optimization, fully satisfy the regulatory requirements.
4.3. Comparative Analysis
Compared to conventional design methods, our optimization approach demonstrates significant advantages in both computational efficiency and results. Firstly, in terms of computational efficiency, the design of the entire continuous beam typically involves preliminary planning, conceptual design, and detailed design stages. Our optimization design framework primarily focuses on the preliminary design stage, which is the longest phase in the entire design process. We surveyed five designers with bridge design experience, and their average time spent is approximately 7 days. In contrast, our optimization framework only requires 10 h in the preliminary design stage, including data organization, resulting in a 94% increase in computational efficiency.
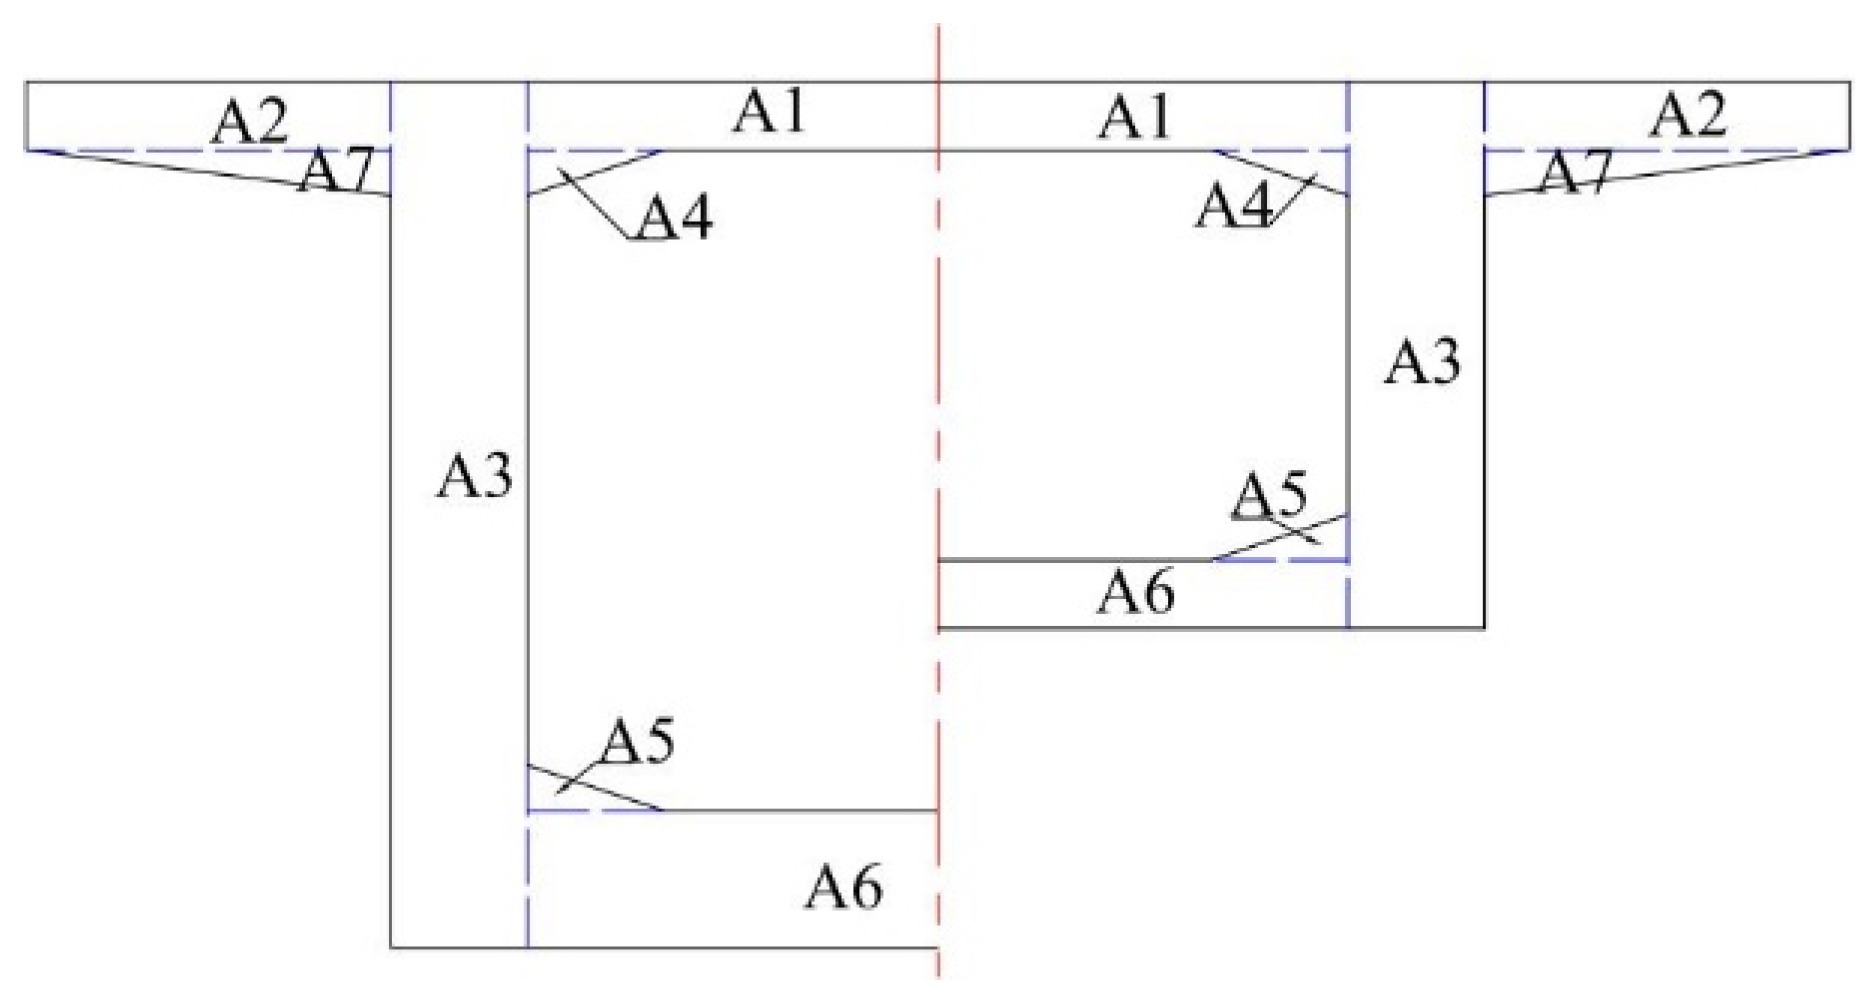
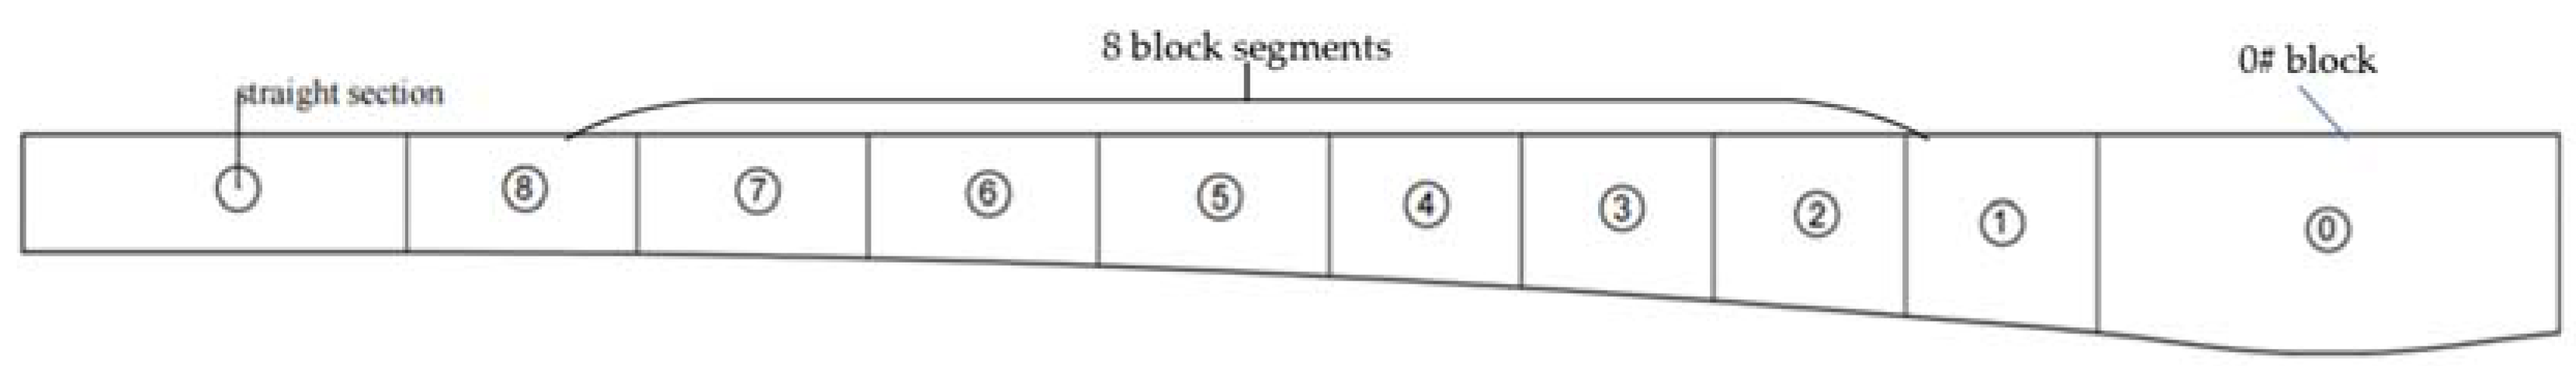
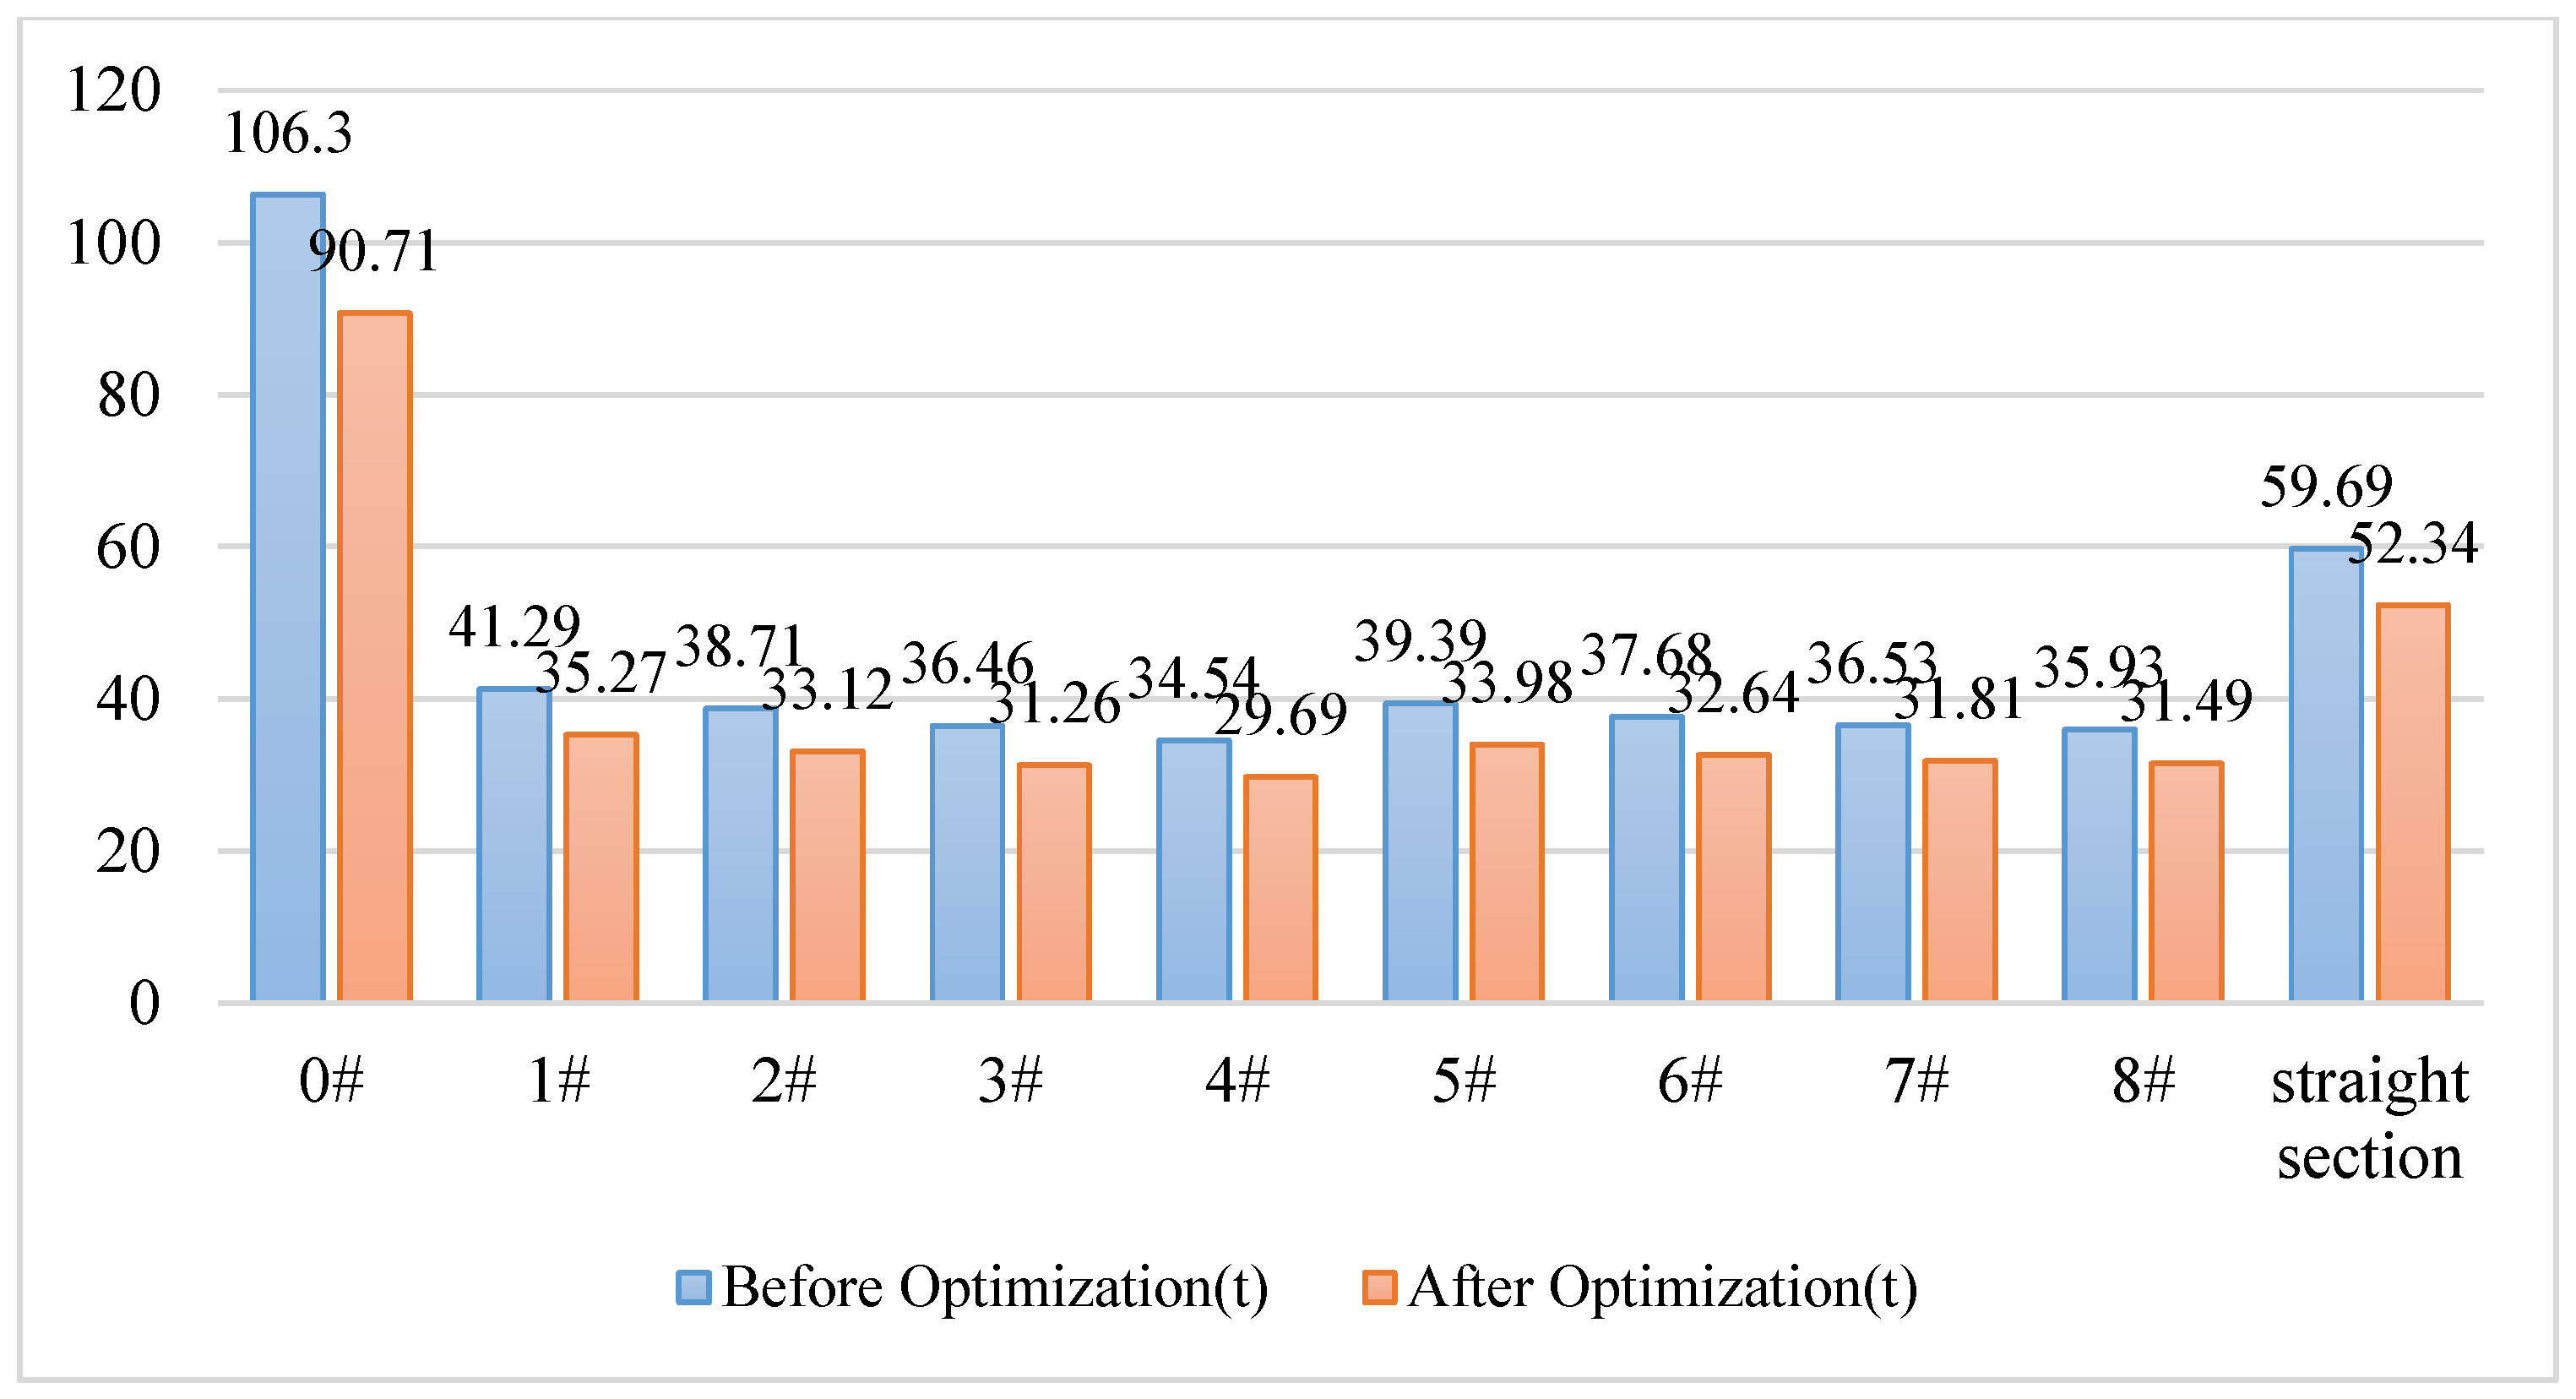
Regarding optimization results, our continuous beam bridge optimization method substantially reduces the consumption of concrete and prestressed steel bars. To show the optimization results more intuitively, the weight of each segment of the continuous beam is counted in this study, which contains 0# block and 8 block segments as well as straight segments (the continuous beam segments are shown in
Figure 12). Specifically, the changes in concrete consumption for each segment before and after optimization are illustrated in
Figure 13. The data in the figure indicate a significant reduction in concrete consumption for each segment of the continuous beam bridge after optimization. For instance, the concrete consumption of segment 0# decreased by 14.6% after optimization. Similarly, the concrete consumption for other segments also decreased after optimization. This suggests that selecting the pivot section and mid-span section as key sections for calculation in continuous beam bridge optimization yields significant optimization effects overall.
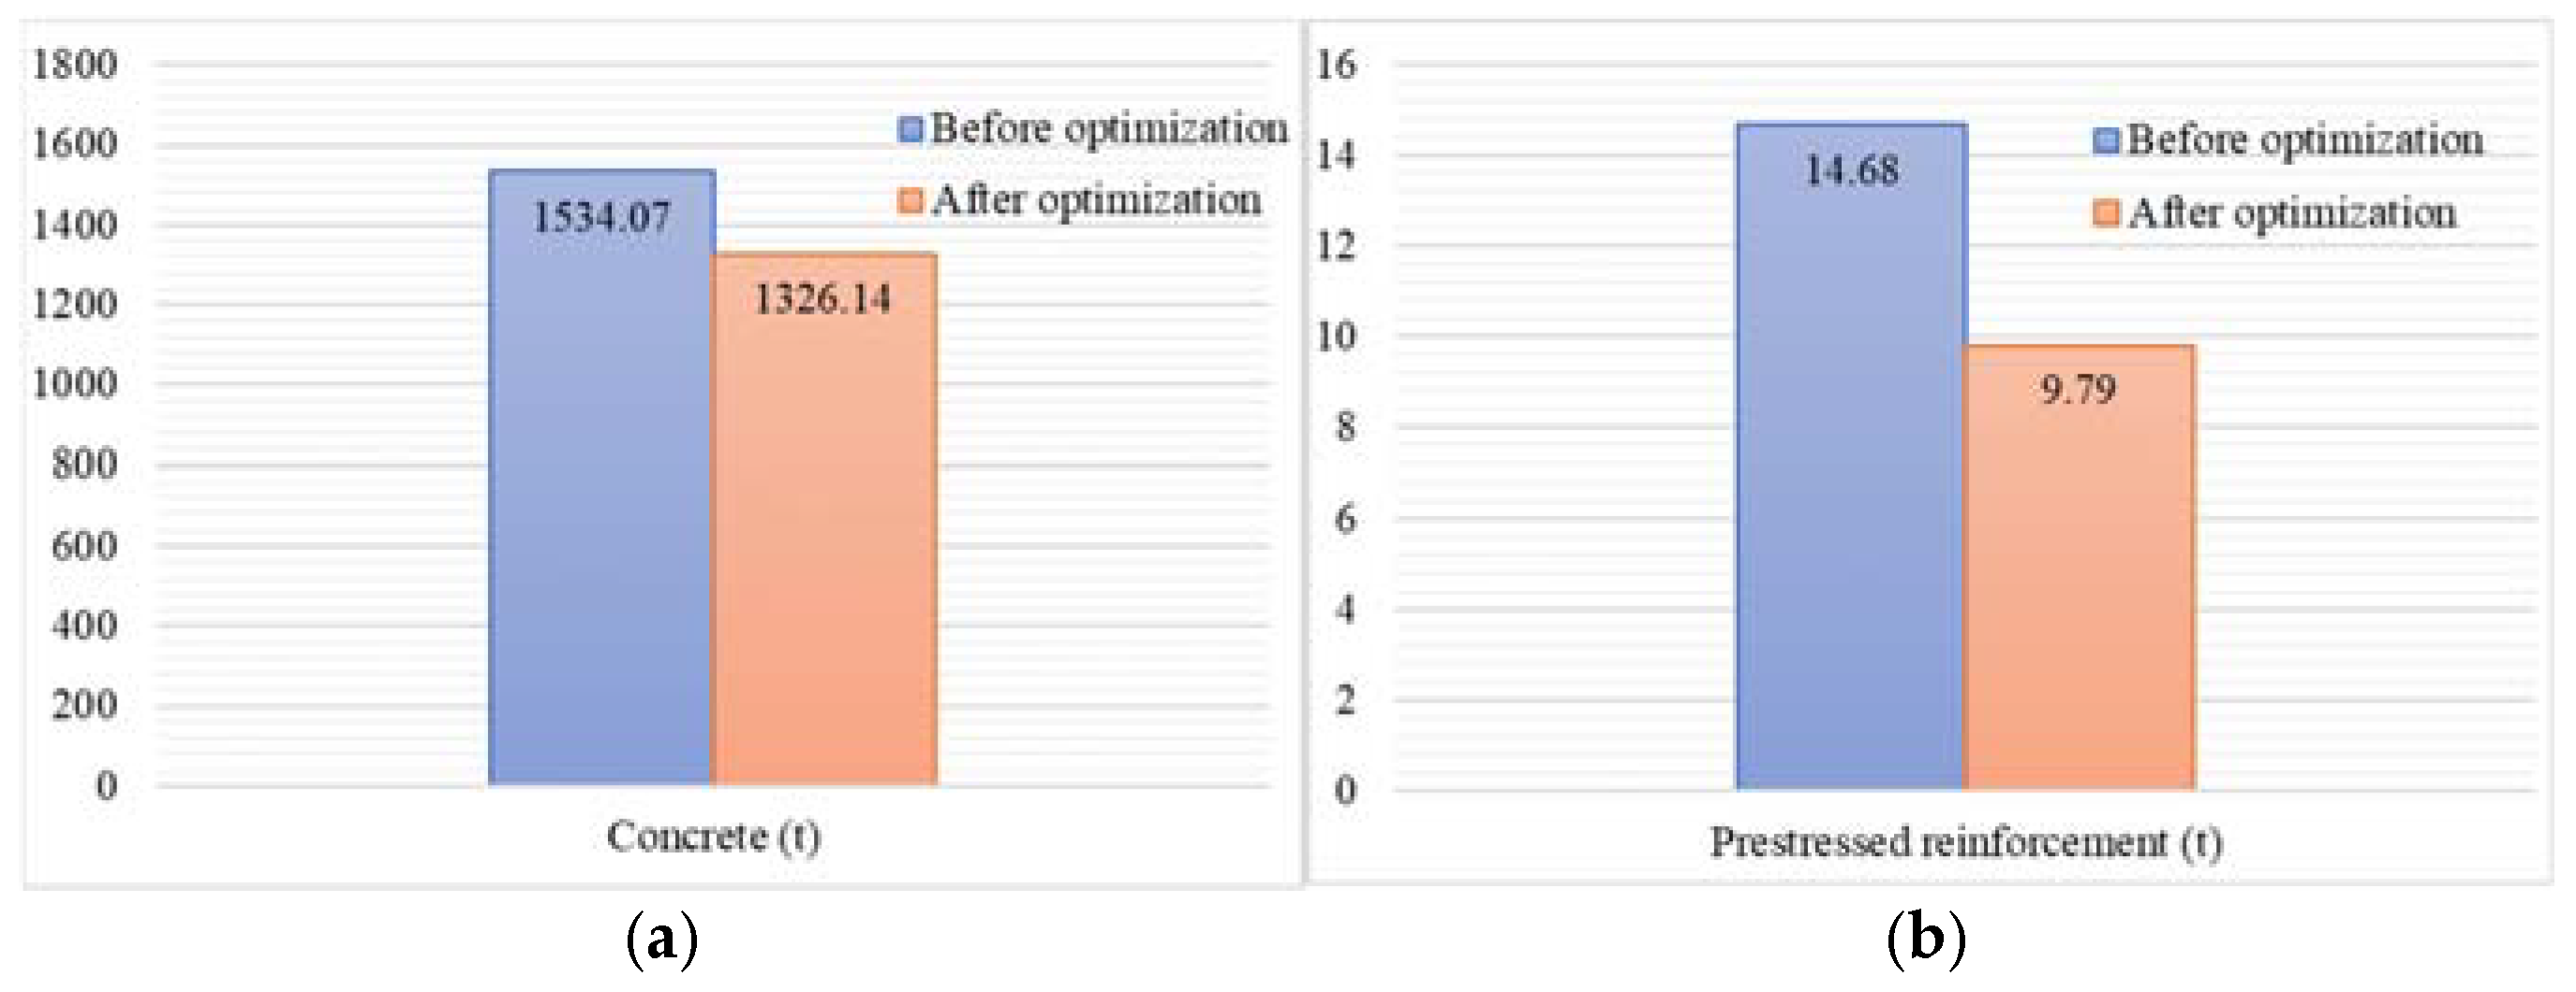
By comparing the total concrete consumption (see
Figure 14a) and prestressed steel bar consumption (see
Figure 14b) of the entire bridge before and after optimization, we conclude that the total concrete consumption decreased from 1534.07 t to 1326.14 t, a reduction of 14%; while the top and bottom prestressed steel bar consumption decreased from 14.68 t to 9.79 t, a reduction of 34%. This further confirms the effectiveness of our optimization framework in reducing material consumption.


