Article

Multi-Criteria Analysis of Steel–Concrete–Steel Slab Performance: Dynamic Response Assessment Under Post-Fire Explosion

1
School of Civil Engineering, University of South China, Hengyang 421001, China
2
China Nuclear Industry Key Laboratory of High-Performance Concrete, University of South China, Hengyang 421001, China
3
Hunan Provincial Key Laboratory of High-Performance Special Concrete, University of South China, Hengyang 421001, China
*
Authors to whom correspondence should be addressed.
Buildings 2025, 15(8), 1340; https://doi.org/10.3390/buildings15081340
Submission received: 22 February 2025 / Revised: 7 April 2025 / Accepted: 15 April 2025 / Published: 17 April 2025

Abstract

:
Steel–concrete–steel (SCS) composite slabs are widely used in critical infrastructures such as nuclear power plants, where systematic performance evaluation through multiple criteria is crucial due to their safety functions. During their use, fires may occur due to fuel or gas leaks, leading to explosions. This article uses ABAQUS 2020 finite element software and combines the different advantages of the implicit heat transfer algorithm and explosion display algorithm to establish a numerical simulation method for dynamic analysis of SCS slab under explosion after fire. Based on different fire conditions and the propagation laws of explosion shock waves, some key dynamic indicators and failure modes of the slab were studied. The results reveal progressive damage mechanisms with increasing fire duration, characterized by expanding damage areas, significant stress fluctuations, and increasing displacement rates. Additionally, the fire surface shows greater vulnerability than the back fire surface. The results provide multiple evaluation criteria for assessing structural performance, including temperature distribution, stress evolution, and damage patterns, which can support engineering decision-making in structural safety management.

1. Introduction

The SCS slab is a new type of combined structure, which combines steel plate and concrete through the inner connectors so that the structure can give full play to the tensile properties of steel and the compressive properties of concrete, and the concrete of the interlayer has good thermal insulation properties, especially suitable for resisting the accidental loads such as explosions, impacts, and fires. It is widely used in infrastructures such as nuclear power plants [1,2,3], and it has been considered in the design of the equipment support structure inside the containment vessel and the inner containment wall structure in a double shell. However, accidents often occur during the process of the structure being put into use. For example, there may be leaks of fuel or gas, which can lead to fires and subsequently cause explosions. The effect of the post-fire explosion on the structure will then play a dominant role, resulting in a serious reduction in the load-bearing capacity of the structure, with the wall panels being the main load-bearing element in the whole building, which will reduce the service life of the building structure.
Currently, the research content of domestic and foreign scholars mainly focuses on the fire resistance performance of steel plate concrete slabs at high temperatures and their blast resistance performance at room temperature. When conducting fire resistance analysis, researchers [4] typically follow the ISO 834 standard [5] temperature–time curve for heating. Zhou et al. [6] studied the effects of no fireproofing structure, a fireproofing structure of autoclaved lightweight concrete panels, a thick-coated fireproofing structure, and a new composite fireproofing structure on the fire resistance of steel plate concrete composite walls. The results show that the fire resistance of the four specimens complies with the 3-h fire resistance limit of the main load-bearing components in the code, which suggests a reasonable fireproofing method for the steel-plate concrete modular wall in the actual project. Wei et al. [2] studied the fire resistance of a new double steel plate concrete composite infill wall, and the results showed that the axial compression ratio, axial load eccentricity, and bond strength of shear nails to concrete had a significant effect on the fire resistance limit of the double steel plate concrete composite infill wall, and that the axial load eccentricity of the unexposed side had a much greater effect on the fire resistance limit of the double steel plate concrete composite infill wall than that of the exposed side. Du et al. [7] studied the fire resistance of sandwich composite walls with truss connectors, and the results showed that the walls could maintain sufficient load-bearing capacity, and the fire resistance of the walls was controlled by their thermal insulating materials, and the steel plates exposed to fire showed significant localized buckling, and the larger the ratio of truss spacing to thickness, the more pronounced was the buckling of the steel plates in the fire. Chen et al. [8] studied the damage behavior and blast resistance of air-supported steel–concrete–steel (SCS) composite slabs under underwater contact blast conditions. Both experimental and numerical results show that the SCS slab suffered total damage. The core concrete absorbed more than 80% of the blast energy, and the confinement of the steel plate effectively reduced the spalling damage of the core concrete. SCS slabs take full advantage of concrete and steel plates to provide excellent underwater blast resistance. Yu et al. [9] studied the dynamic response characteristics and blast protection mechanism of corrugated steel–concrete (CSPC) composite structures under blast loading, and the results showed that the structures exhibited large deformation and high ductility under near-field blast loading. The presence of corrugated steel plates weakened the spalling effect and localized collapse of concrete, ensuring the safety of the internal space of the structure. Zhu et al. [10] conducted contact explosion tests on steel–concrete (SC) composite plates using different types of concrete slab and steel plate interfaces and different thicknesses of steel plates. The results show that the overall response of the SC composite plate can be divided into a combination phase and a separation phase, the damage mode is very different depending on the type of interface, and increasing the thickness of the steel plate significantly reduces the deformation of the steel plate.
Presently, there are relatively abundant studies [11,12,13,14,15] on the combined effects of elevated temperatures and high strain rates on the material properties of concrete and steel. These studies provide a preliminary basis for calculating and evaluating the material characteristics of SCS slabs under the action of an explosion after a fire. Furthermore, most current research efforts regarding building structures under coupled multi-hazard conditions continue to concentrate primarily on steel structures, concrete-filled steel tubular (CFST) members, and reinforced concrete (RC) structures. Sun et al. [16] analyzed the damage behavior of Q345B steel circular tubes under the combined effects of fire and blast loading. The results indicate that as fire duration increased, the specimens exhibited more significant deformation and damage. Compared with the specimens that have not been exposed to fire, the greater the initiation distance, the greater the increase in the local deflection of the specimens exposed to fire. Al-Thairy [17] developed a novel numerical model using ABAQUS software to predict the performance and failure conditions of steel columns under the action of fire after an explosion. A new simplified method was also proposed to analyze the influence of the action of fire after an explosion on the dynamic response and critical temperature of steel columns. Xi et al. [18] studied the effects of fire and explosion actions on steel beams, developed a unified computational model, and compared the effects of fire and explosion on the structure under different loading sequences. The results indicate that the critical temperature of beams subjected to post-fire explosions is lower than that of beams subjected to post-explosion fires. Ji et al. [19] conducted a numerical study on the performance of concrete-filled steel tubular (CFST) columns subjected to lateral impact damage under fire conditions. The results indicated that impact damage significantly reduced the fire resistance of CFST columns and influenced the development of failure deflection. Hu et al. [20] established a blast-resistant model of concrete-filled steel tubular (CFST) columns under standard fire conditions using ABAQUS finite element software. The results showed that shear failure first occurred at both ends of the column, followed by flexural failure of the entire member. As the fire duration increased, the energy dissipation of the steel tube gradually decreased, while that of the concrete progressively increased. Li et al. [21] investigated the lateral impact resistance of RC columns under two fire scenarios (during high-temperature exposure or after cooling). The results demonstrated that the impact resistance of RC columns during high-temperature exposure was weaker than after cooling. The mid-span peak deflection and residual deflection of the column increase linearly with the increase of the fire exposure time, while the peak impact load and residual impact load of the column increase nonlinearly with the increase of the fire exposure time. Roy et al. [22] developed a new probabilistic framework to study the situation of RC slabs with different thicknesses under the post-blast cascading fire (PBF) scenarios. The results showed that RC slabs would suffer severe damage under the action of cascading disasters. In addition, the system uncertainties have a significant impact on the fire resistance duration of RC slabs in the post-blast fire scenarios. Li et al. [23] studied the dynamic performance of reinforced concrete slabs under post-fire blast loading, taking into account the combined effects of temperature stress, deformation, material degradation, and blast loading, and analyzed the effects of pre-blast fire duration, blast loading conditions, and reinforced concrete slab parameters on the dynamic response of the structure, and compared it with the dynamic response of the structure under the simultaneous effects of fire and explosion.
In summary, research under multi-hazard coupling states has primarily focused on single materials and non-steel plate concrete structures. Studies on steel plate concrete structures have only considered the impact of single load conditions, with particularly scarce investigations into the dynamic response of such structures under post-fire explosion scenarios. Therefore, conducting relevant research holds significant engineering importance and academic value for enhancing the overall safety performance of wall-panel structures. Based on the structural application scenarios, this paper selects SCS slabs as the research subject. Using ABAQUS finite element software, the SCS slab finite element models are established, incorporating the effects of both high temperature and strain rate. Appropriate thermal analysis and explosion simulation methods are adopted to verify the reliability of the material constitutive model under the effects of high temperature and strain rate. Based on this, numerical simulations were conducted to analyze certain key dynamic indices and failure modes of the slabs under different fire exposure conditions, obtaining the dynamic response of SCS slabs under post-fire explosion scenarios.

2. The Constitutive Model of Materials Under High Temperature and Explosion

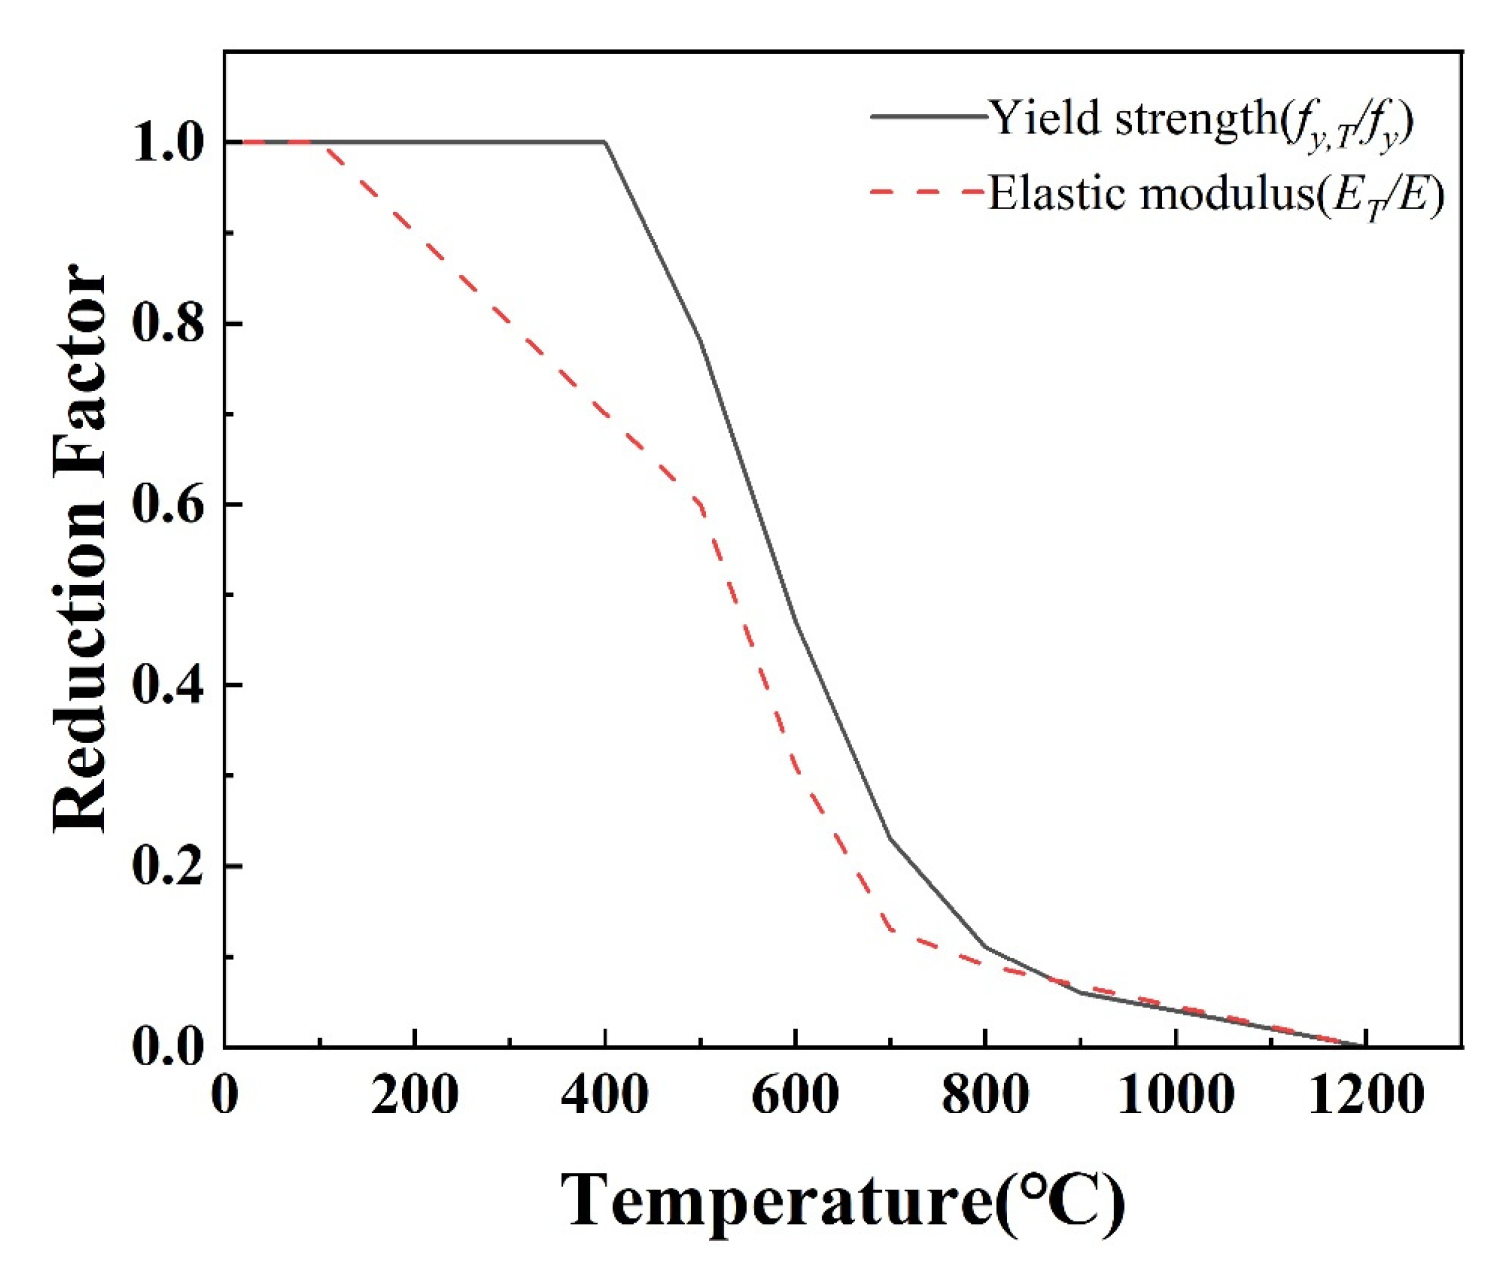
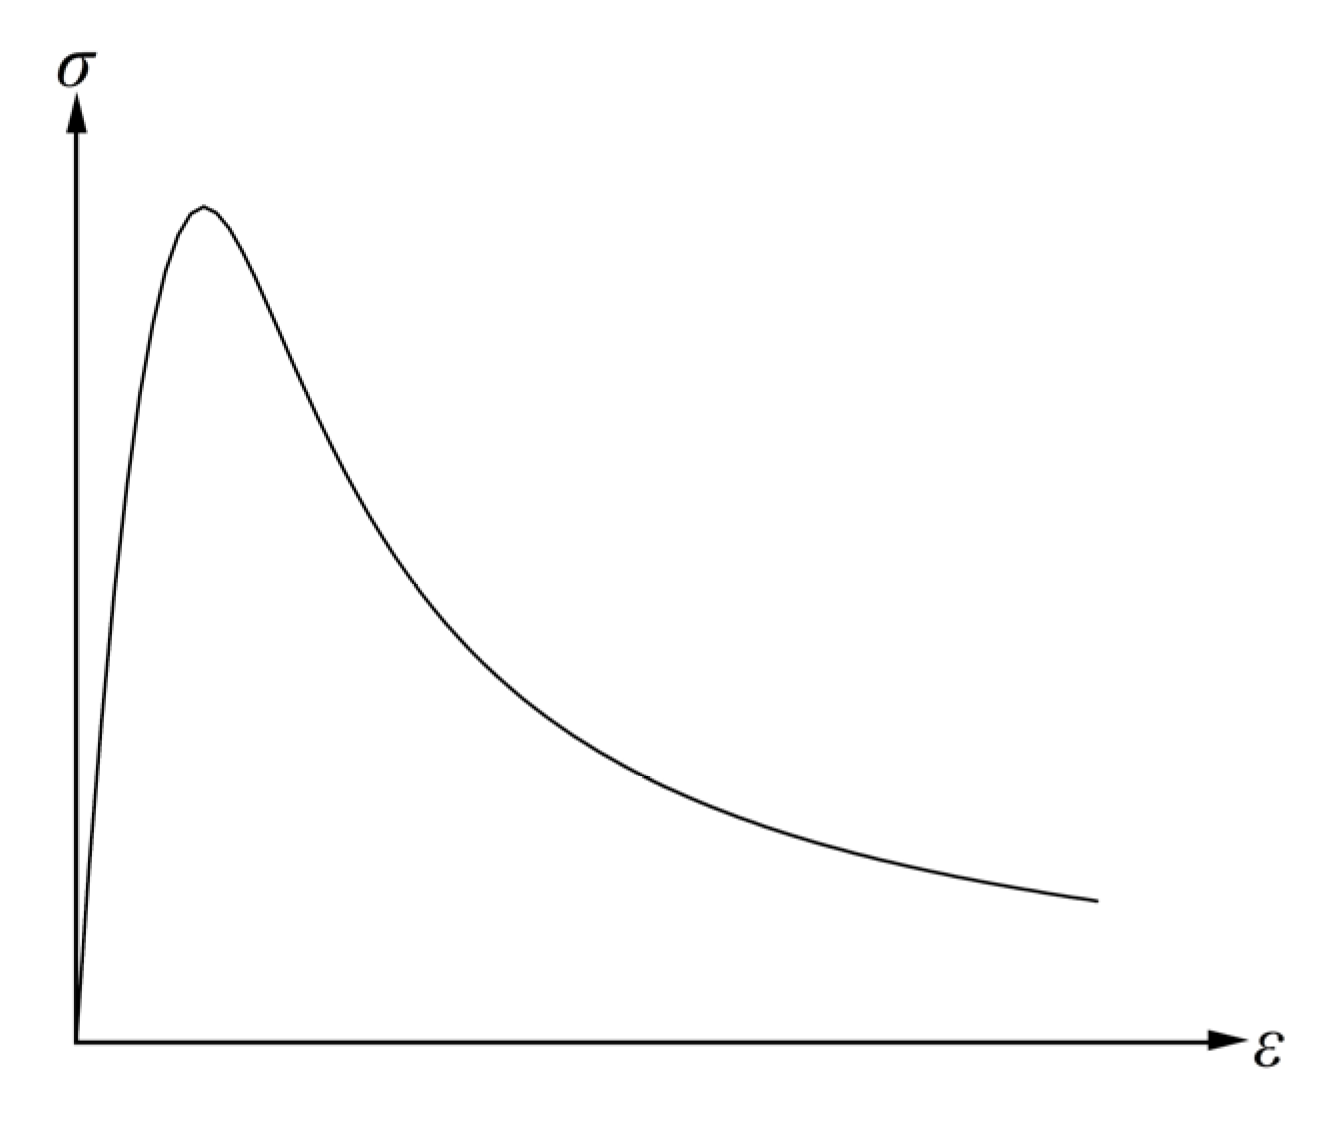
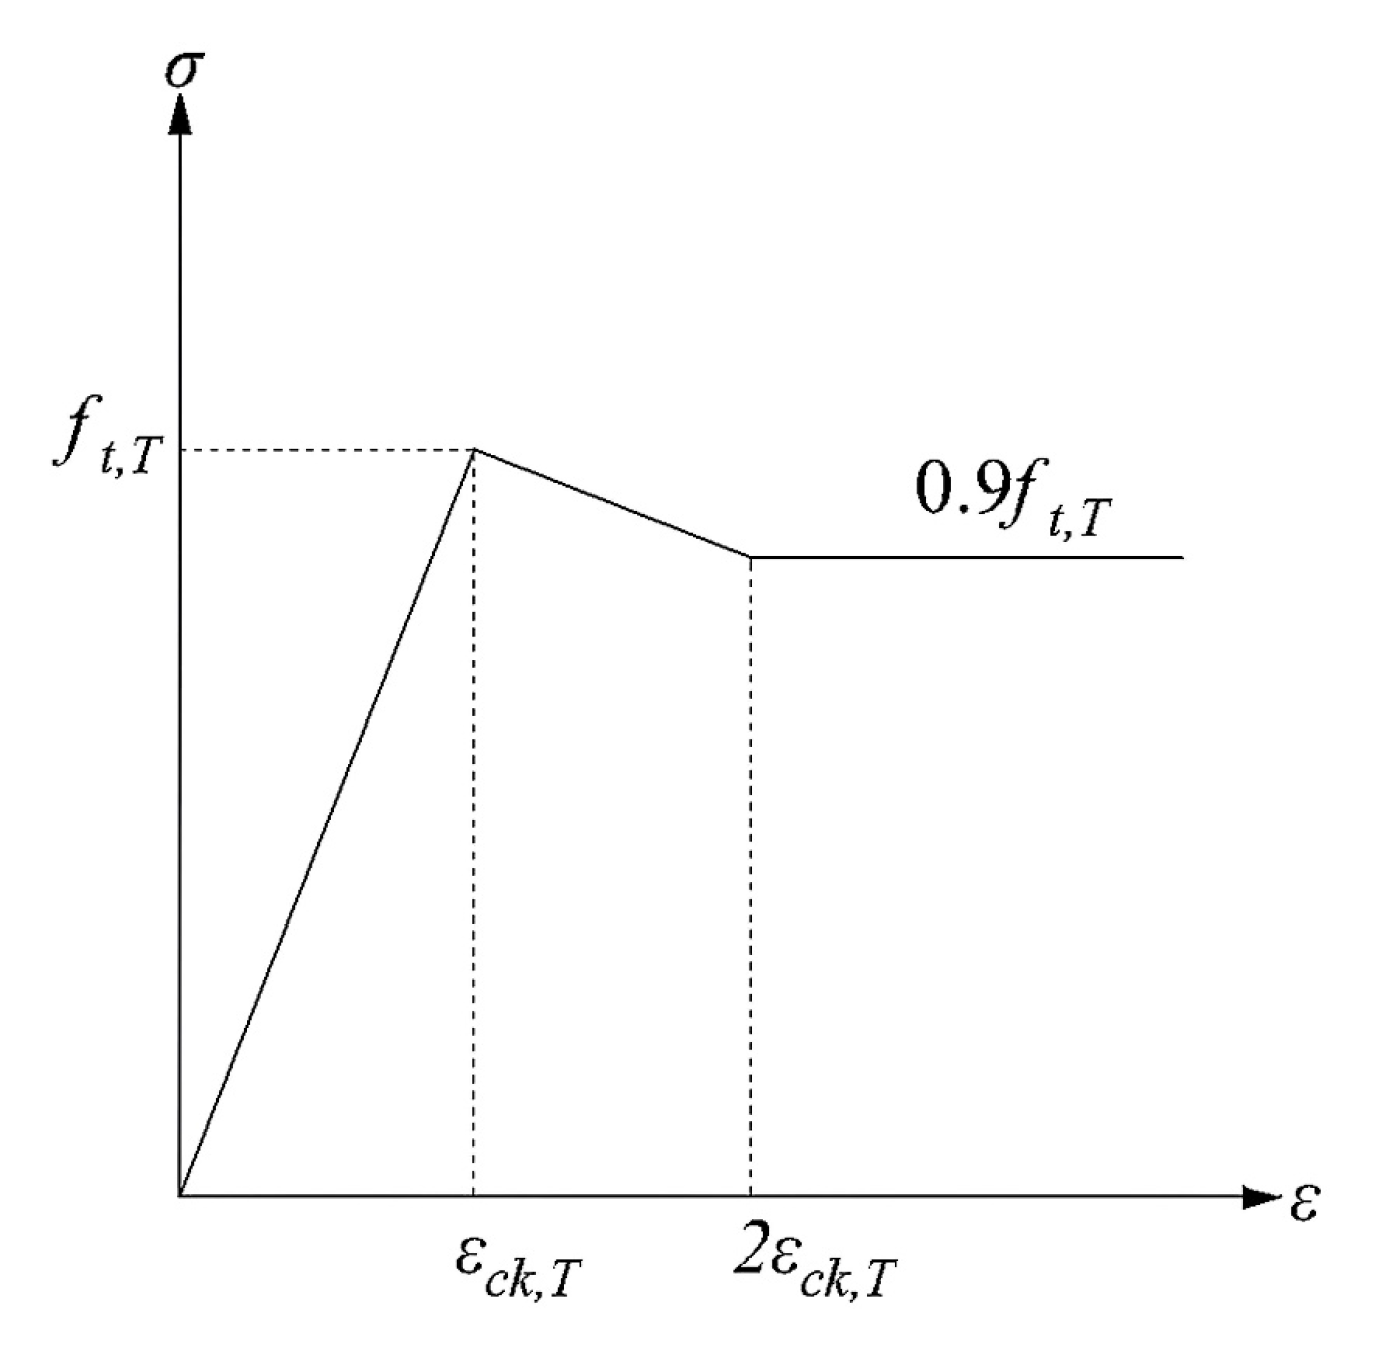
2.1. Thermal Parameters and Constitutive Models of Materials at High Temperatures

The thermal conductivity and specific heat capacity of steel are adopted from the relevant provisions in Eurocode EN1993-1-2 [24], respectively, and the thermal conductivity and specific heat capacity vary with temperature, as shown in the following Equations (1) and (2):
λ s = 54 0.0333 T , 20   ° C T < 800   ° C 27.3 , 800   ° C T 1200   ° C
C s = 425 + 0.773 T 0.00169 T 2 + 2.22 × 10 6 , 20   ° C T < 600   ° C 666 + 13002 738 T , 600   ° C T < 735   ° C 545 + 17820 T 731 , 735   ° C T < 900   ° C 650 , 900   ° C T < 1200   ° C
where λs is the thermal conductivity of steel; Cs is the specific heat capacity of steel; T is the temperature.
The coefficient of thermal expansion of steel is taken from the scholar T.T. Lie [25], written as shown in the following Equation (3):
α s = 0.004 T + 12 × 10 6 , T < 1000   ° C 16 × 10 6 , T 1000   ° C
where αs is the coefficient of thermal expansion of steel and T is the temperature.
The thermal conductivity and specific heat capacity of concrete are adopted from T.T. Lie [26] and both the thermal conductivity and specific heat capacity vary with temperature as shown in the following Equations (4) and (5):
λ c = 1.355 , 0   ° C T 293   ° C 0.001241 T + 1.7162 , T > 293   ° C
ρ c C c = 2.566 × 10 6 , 0   ° C T 400   ° C ( 0.1765 T 68.034 ) × 10 6 , 400   ° C T 410   ° C ( 0.05043 T + 25.00671 ) × 10 6 , 410   ° C T 445   ° C 2.566 × 10 6 , 445   ° C T 500   ° C ( 0.01603 T 5.44881 ) × 10 6 , 500   ° C T 635   ° C ( 0.16635 T 100.90225 ) × 10 6 , 635   ° C T 715   ° C ( 0.22103 T + 176.07343 ) × 10 6 , 715   ° C T 785   ° C 2.566 × 10 6 , T > 785   ° C
where λc is the thermal conductivity of concrete; Cc is the specific heat capacity of concrete; T is the temperature; and ρc is the density of concrete (ρc = 2400 kg/m3).
The coefficient of thermal expansion was taken from T.T. Lie [25], as shown in the following Equation (6):
α c = 0.008 T + 6 × 10 6
where αc is the coefficient of thermal expansion of concrete and T is the temperature.
The steel adopts the classic bilinear constitutive mechanics model, as shown in Figure 1, which considers the elastic and plastic stages of the steel to determine the yield strength and ultimate strength of the steel at different temperatures. The reduction factors for yield strength and modulus of elasticity of plain carbon steel are taken in accordance with the recommendations of Eurocode EN1993-1-2 [24], as shown in Figure 2, where fy is the yield strength of the steel at room temperature and E is the elastic modulus of the steel at room temperature; fy,T is the yield strength of steel at high temperature, and ET is the elastic modulus of steel at high temperature.
At high temperatures, the ultimate strength of steel is obtained by regression of Equation (7) using the corresponding experimental method by Faxing Ding [27] and others:
f u , T f u = 1 5 × 10 5 T 20 100 4 , T 1000   ° C
where fu,T is the ultimate strength of steel at high temperature; fu is the ultimate strength of steel at room temperature; T is the temperature.
Based on the constitutive model of concrete at normal temperature, Zhenhai Guo and Wei Li et al. [28] experimentally investigated the compressive stress–strain relationship of concrete under high temperatures. This study adopts their experimentally derived Equation (8):
σ f c , T = 2.2 x 1.4 x 2 + 0.2 x 3 , x 1 x 0.8 ( x 1 ) 2 + x , x > 1
x = ε ε p , T ,   ε p , T ε p = 1 + ( 1500 T + 5 T 2 ) × 10 6 ,   f c , T f c = 1 1 + 2.4 ( T 20 ) 6 × 10 17
where fc,T is the compressive strength of concrete at high temperature; fc is the compressive strength of concrete at room temperature; εp,T is the peak compressive strain of concrete at high temperature; εp is the peak compressive strain of concrete at room temperature; T is the temperature of the concrete.
The tensile strength of concrete at high temperatures is still calculated according to Equation (9) obtained by Zhenhai Guo, Wei Li et al. [28]:
f t , T f t = 1 0.001 T
where ft,T is the tensile strength of concrete at high temperature, ft is the tensile strength of concrete at room temperature, and T is the temperature.
Based on Equation (8), the compressive stress–strain constitutive curve of concrete is obtained as shown in Figure 3. For the tensile stress–strain relationship, the constitutive model proposed by Hong [29] is adopted, which, combined with Equation (9), yields the constitutive curve presented in Figure 4.
The expression for the change in modulus of elasticity of concrete with temperature at elevated temperatures was adopted using the following experimental Equation (10) from Zhu, B. L. [30]:
E c , T E c = 1 1.5 × 10 3 T , 0   ° C < T 200   ° C 0.87 0.82 × 10 3 T , 200   ° C < T 700   ° C 0.28 , 700   ° C < T 800   ° C
where Ec,T is the modulus of elasticity of concrete at high temperature, Ec is the modulus of elasticity of concrete at room temperature, and T is the temperature.

2.2. Strain Rate Effects on Materials Under Explosive Loading

Under the action of explosive loads, steel bars and concrete can withstand strain rate effects of up to 10–1000 s−1 [31]. The strength of steel bars increases by 50% under high strain rate conditions, and the compressive strength of concrete can even increase to 100% [32] under high strain rate conditions. Therefore, under blast loading, the effect of strain rate effect on the material itself should be considered. At present, research on the strain rate effect of concrete and steel after high temperature is very scarce, there is no mature and unified formula for strain rate effects. It is only possible to consider the strain rate effect at room temperature based on the existing studies and specifications for this topic [33].
In this paper, the Cowper–Symonds model is used to consider the strain rate effect of steel, and the yield stress of the steel is as in Equation (11):
σ y = σ 0 + β E p ε e f f 1 + ε ˙ C 1 p
where σ0 is the initial yield stress; β is the hardening parameter; Ep is the plastic hardening strain modulus; εeff is the equivalent plastic strain; ε ˙ is the strain rate; C = 40.4 s−1; and P = 5 [34].
The strain rate effect of concrete in this article is characterized by the dynamic amplification factor (CDIF) of compressive strength and the dynamic amplification factor (TDIF) of tensile strength of concrete using the formulas given in CEB [35], as shown in the following Equations (12) and (13):
C D I F = f c f c 0 = ε ˙ c / ε ˙ c 0 0.014 , ε ˙ c 30 s 1 0.012 ε ˙ c / ε ˙ c 0 1 / 3 , ε ˙ c > 30 s 1
where fc is the compressive strength at ε ˙ c strain rate; and fc0 is the static compressive strength, where ε ˙ c 0 = 30 × 10−6 s−1.
T D I F = f t f t 0 = ε ˙ t / ε ˙ t 0 0.014 , ε ˙ t 10 s 1 0.0062 ε ˙ t / ε ˙ t 0 1 / 3 , ε ˙ t > 10 s 1
where ft is the tensile strength at ε ˙ t strain rate, ft0 is the static tensile strength; where ε ˙ t 0 = 10 × 10−6 s−1.

2.3. TNT Explosive and Air Constitutive Equation

The material model for TNT explosives is described by the JWL [36] equation of state as shown in Equation (14). The air is described by a linear US-UP [37] equation of state as shown in Equation (15).
p = A 1 ω R 1 V e R 1 V + B 1 ω R 2 V e R 2 V + ω E 0 V
where p is the burst pressure; V is the relative volume; E0 is the initial volume internal energy; and A, B, R1, R2, and ω are the material constants.
p = ρ 0 c 0 2 η 1 S η 2 1 Γ 0 η 2 + Γ 0 ρ 0 E m
where c0 is the speed of sound in the fluid; Γ0 is Gruneisen’s constant; ρ0 is the density of the fluid; S is the linear coefficient between the speed of sound and the velocity of propagation of the shock wave; Em is the internal energy per unit mass of the fluid; and η is the coefficient of dynamic viscosity.

3. Finite Element Model Validation

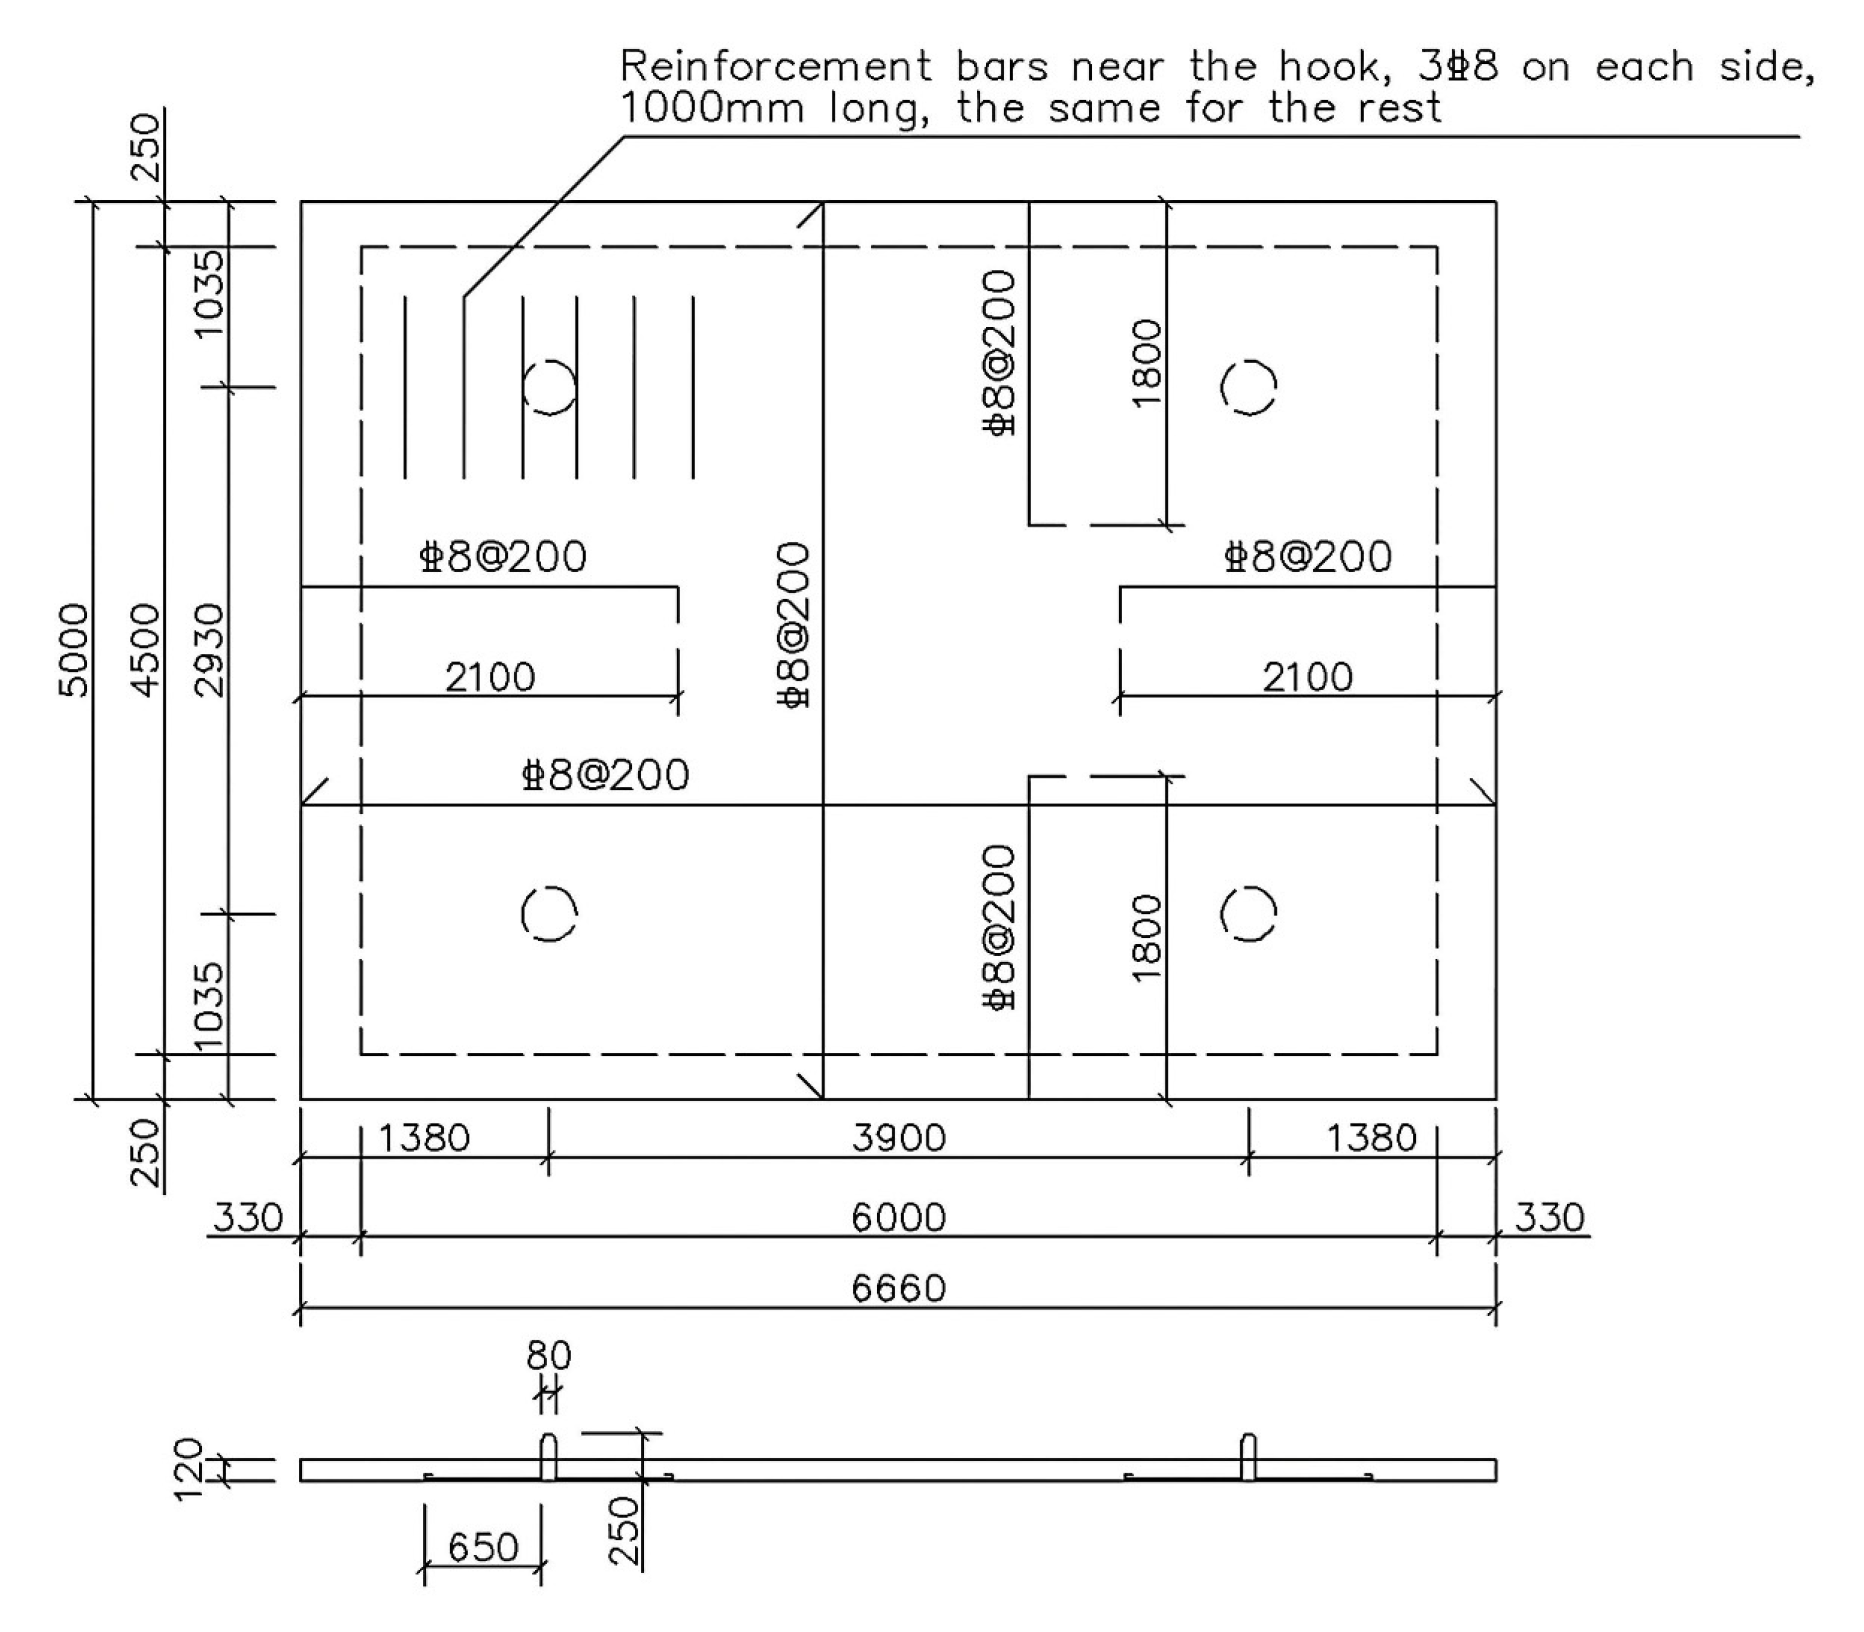
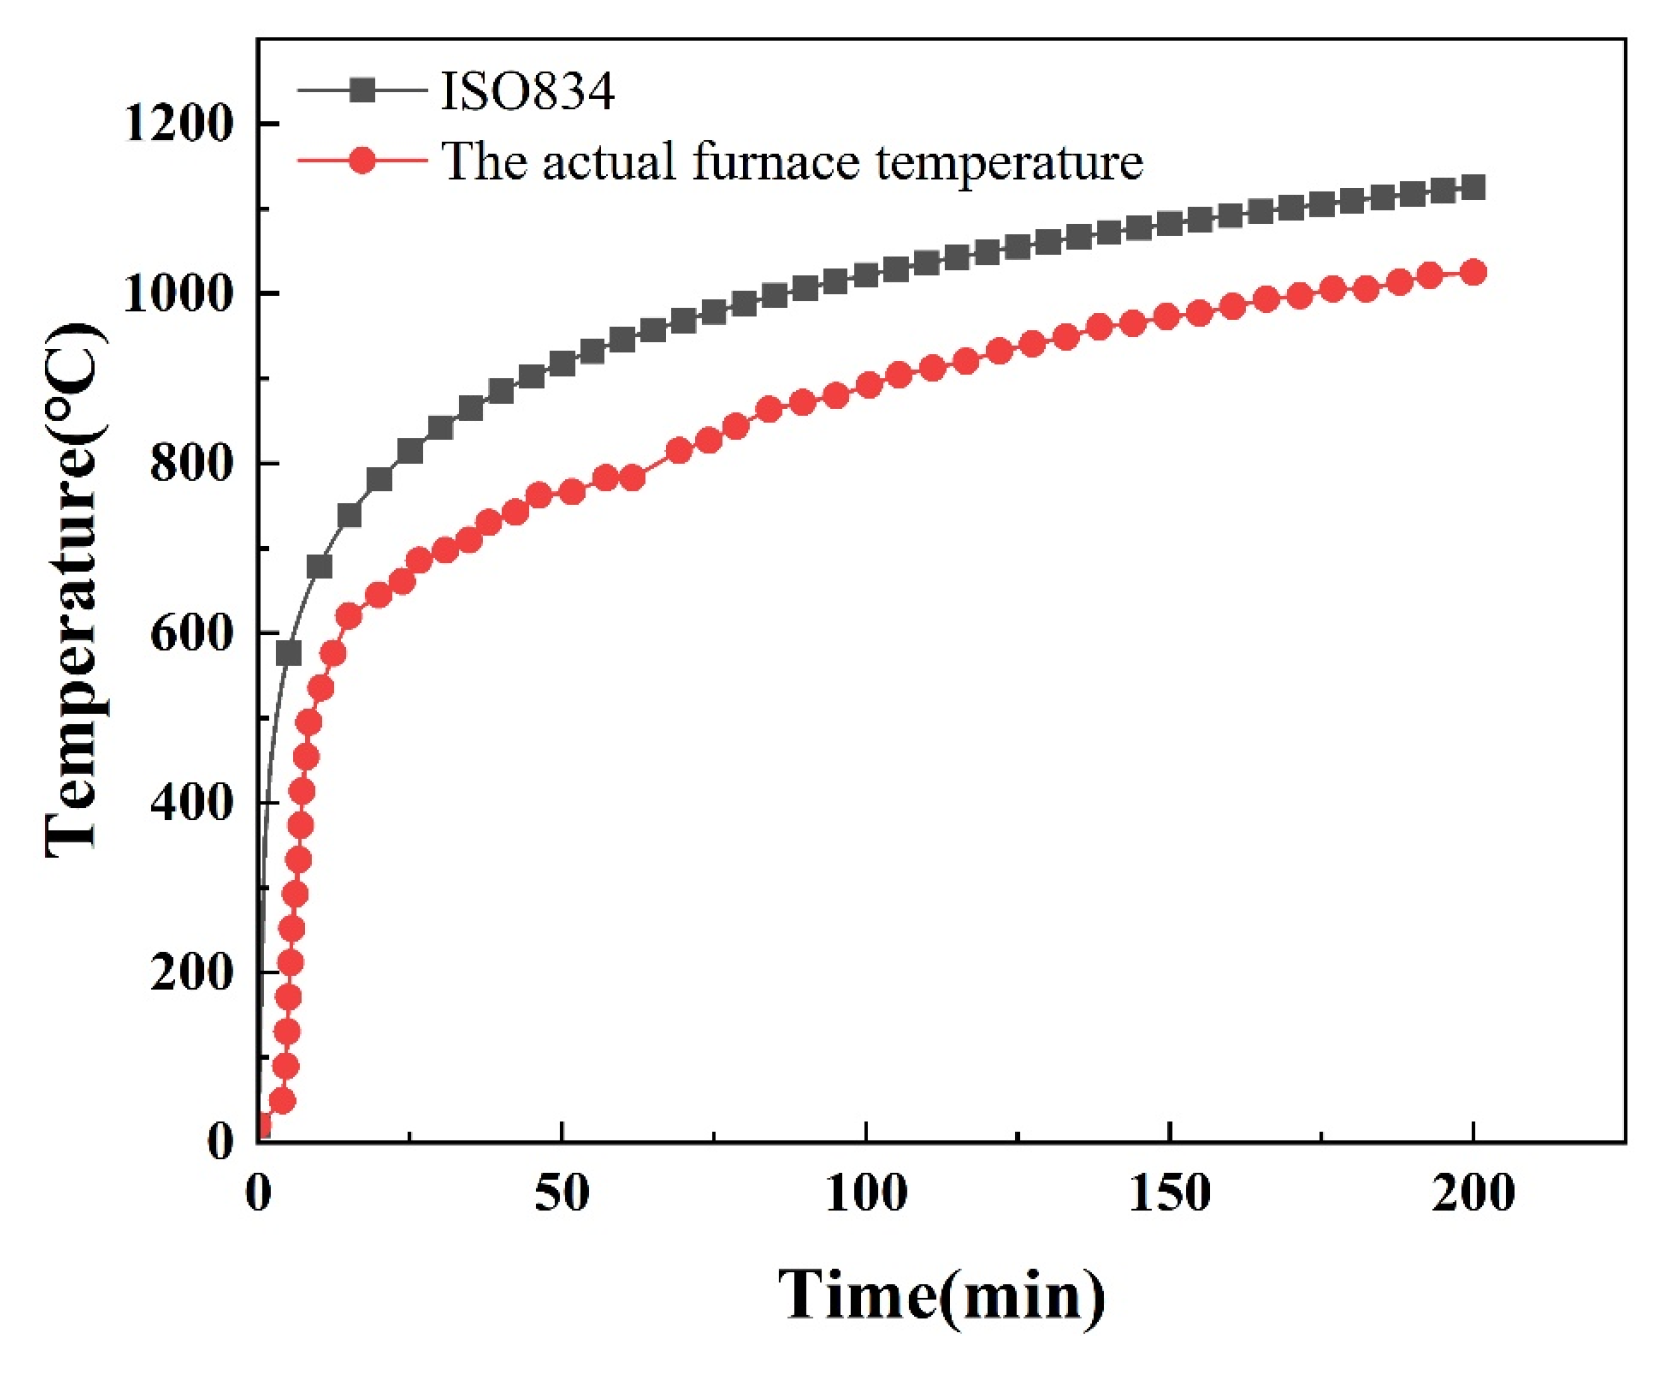
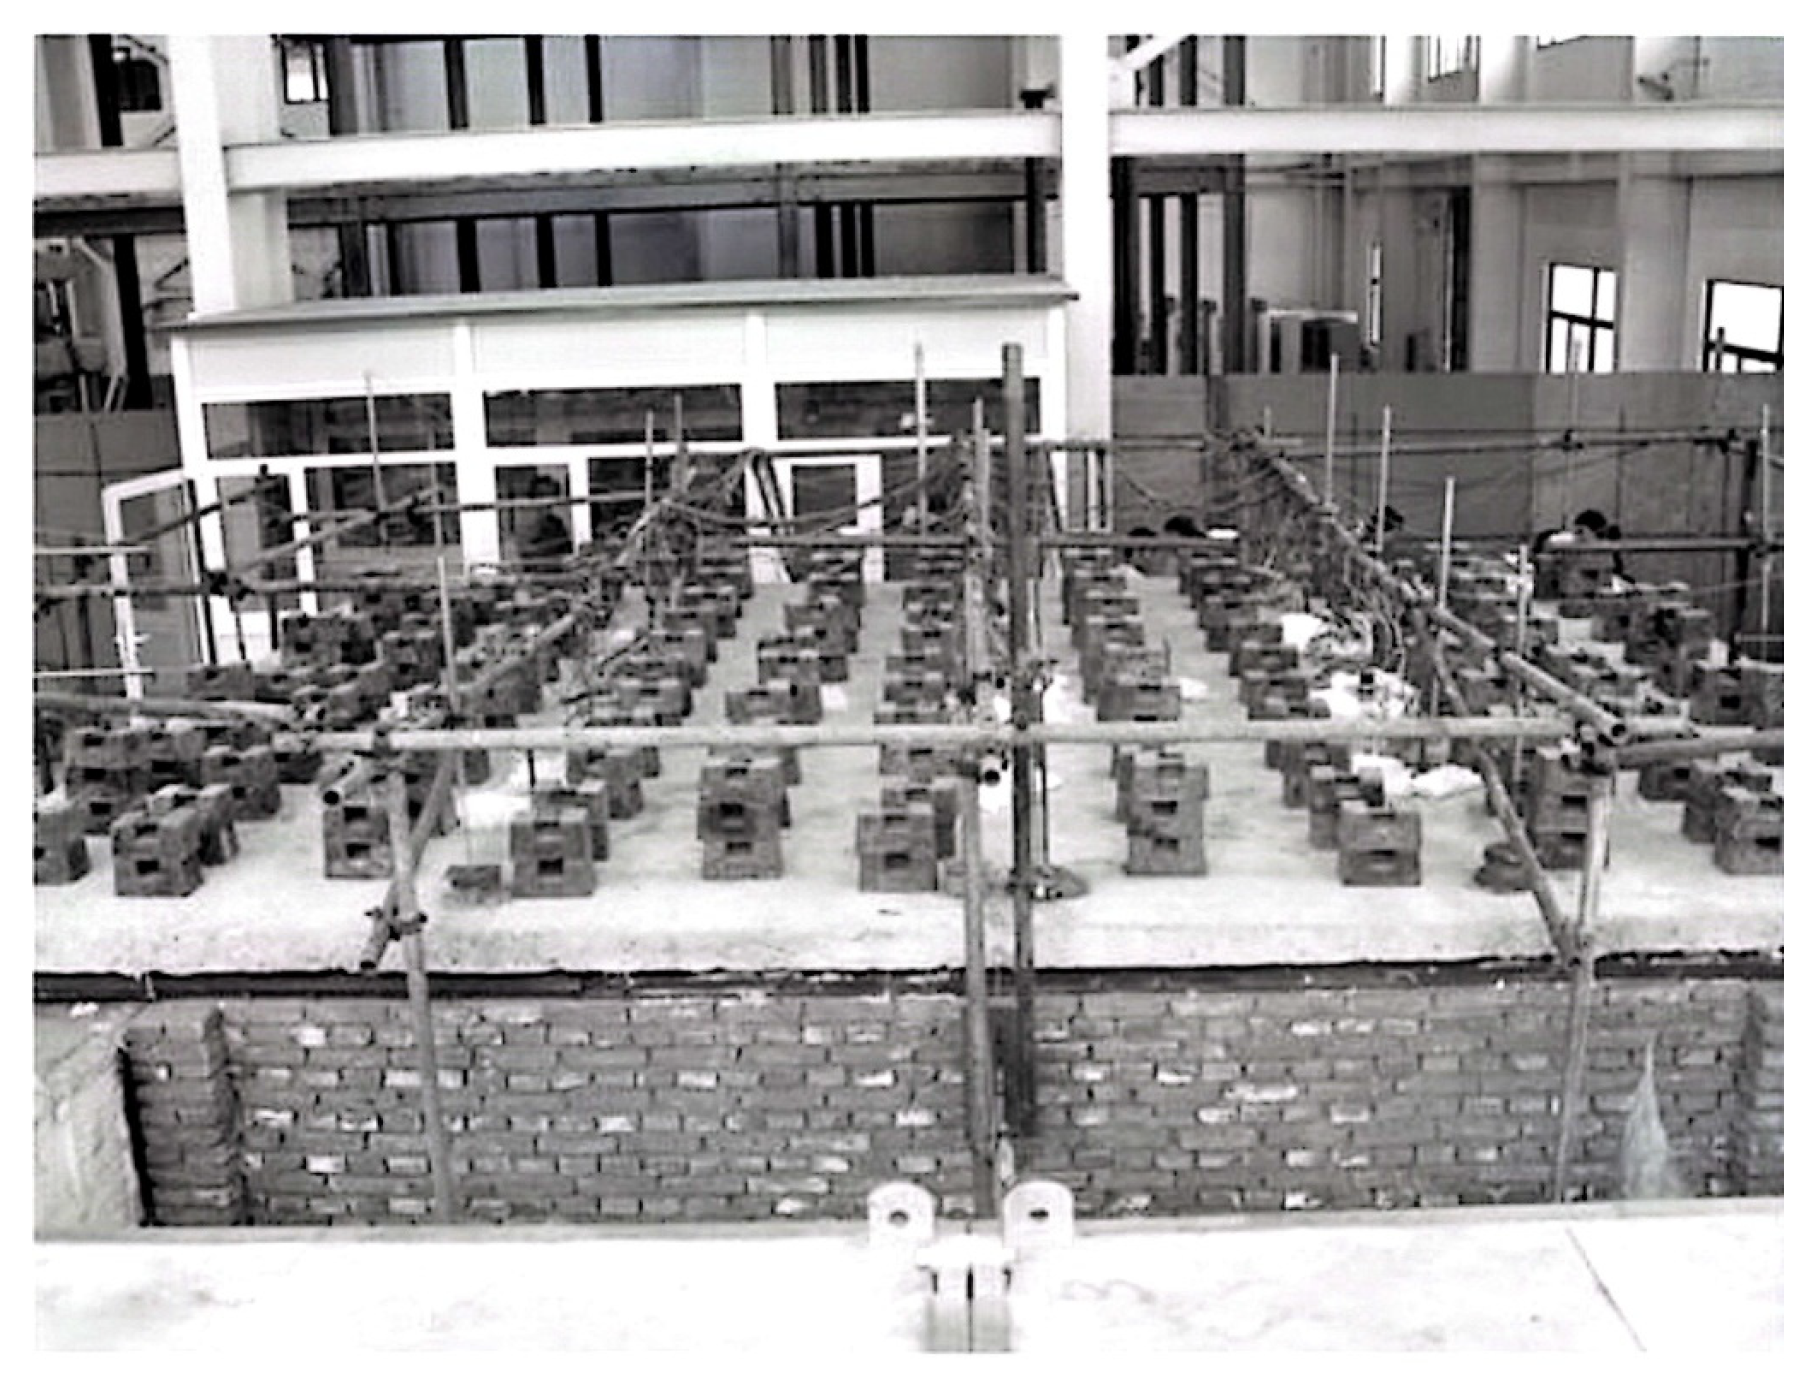
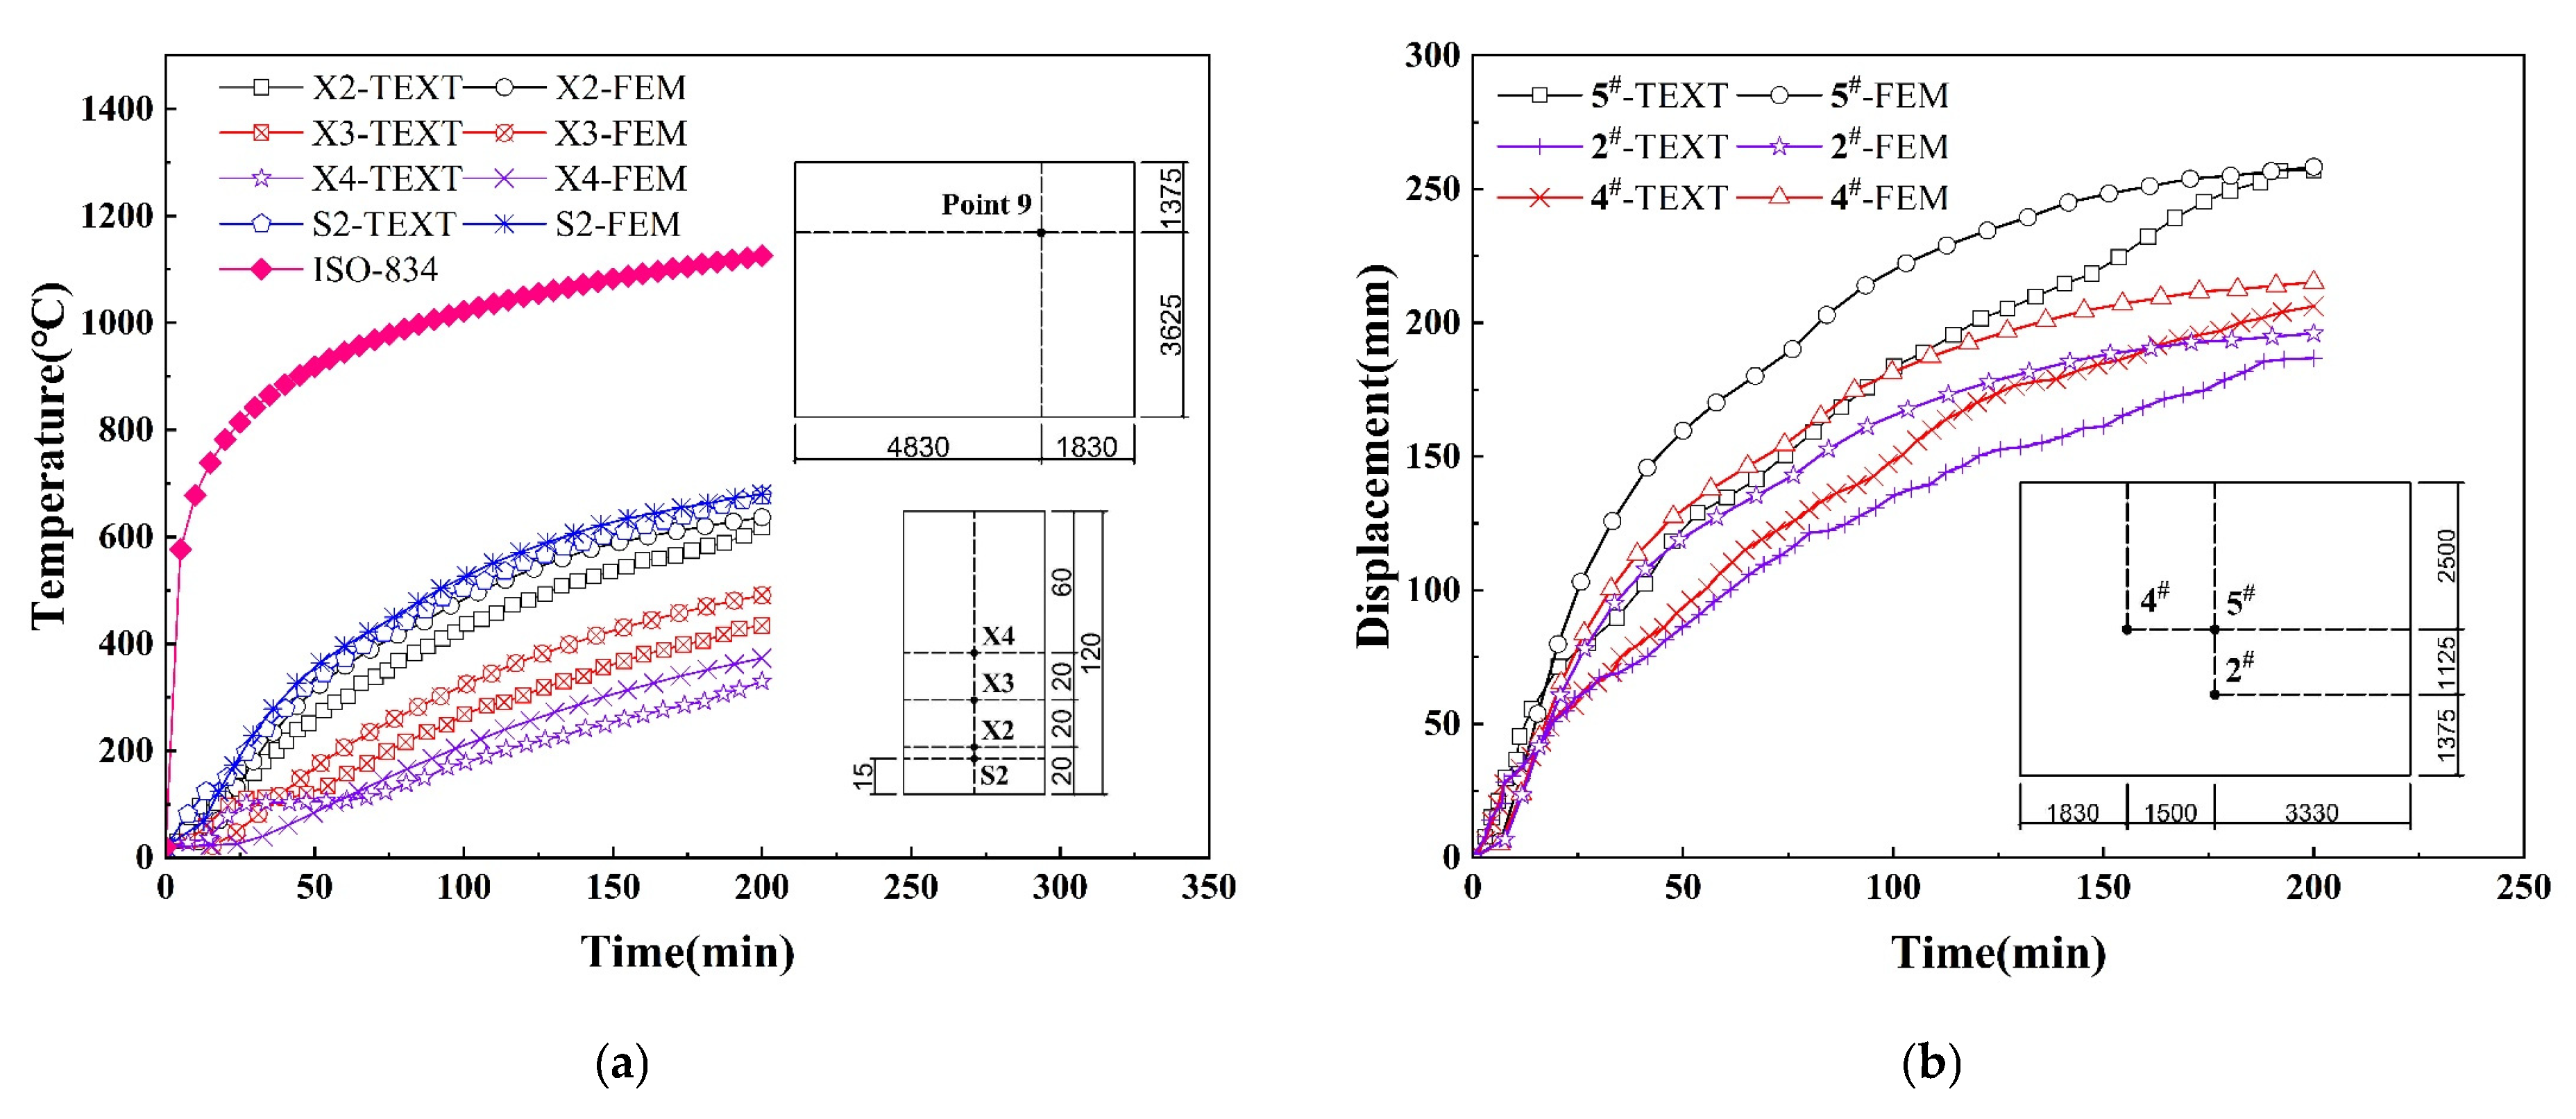
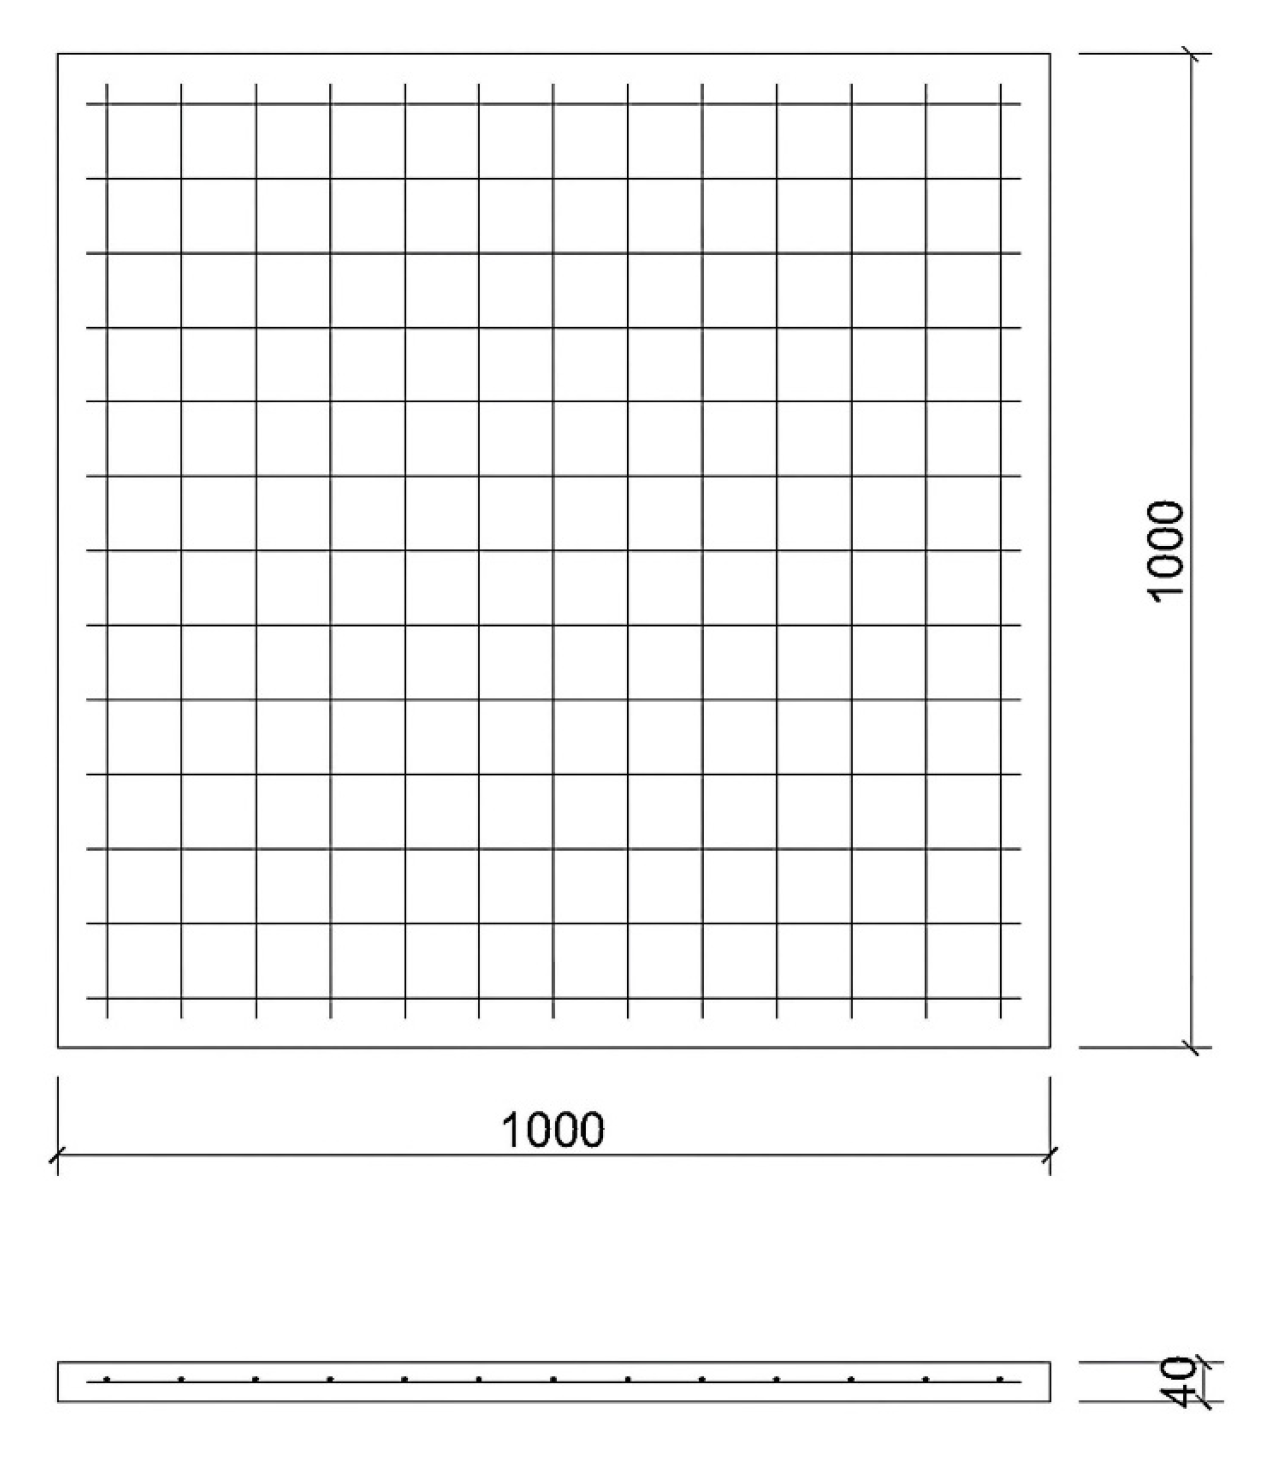
3.1. Experimental Simulation of Fire Performance of RC Slab

By simulating the fire resistance test of the RC slab in reference [38,39], the reliability of the thermal analysis method and the material constitutive model under high-temperature conditions was validated. In this experiment, the slab dimensions are 4500 mm × 6000 mm in plan with a thickness of 120 mm. Due to the presence of fire-resistant brick walls and heat-resistant aluminum acid fibers on the furnace body, the net fire area of the slab was 3800 mm × 5400 mm. In order to prevent the inward sliding caused by the large deformation of the board under the effect of fire and considering the length of the support, the plane dimensions were increased, with the short side increased to 5000 mm and the long side increased to 6660 mm. The cross-sectional dimensions are shown in Figure 5. The experiment was conducted using C30 commercial concrete from the same batch. The average compressive strength of the cube was measured to be 31.5 MPa, and HRB400 steel bars were used. The steel bars were originally from China. The average yield strength and tensile strength were measured to be 435 MPa and 580 MPa, respectively. The thickness of the concrete protective layer was 15 mm.
The support of the four-sided simply supported plate adopts ball bearings and rollers, with steel balls as the ball bearings, and the diameter of both the steel balls and rollers is 100 mm. The experiment adopts a constant load heating scheme, where iron weights are stacked on the plate and uniformly distributed loads are applied. The experiment is conducted in five stages, with each stage being 0.4 kN/m2, for a total of 2.0 kN/m2. The fire temperature rise curve used in the experiment is the ISO 834 standard temperature rise curve, and the test temperature is determined by Equation (16). Additionally, the heating curve from reference [40] can also be used for fire resistance analysis of structural members.
T = 345 lg 8 t + 1 + T 0
where T is the temperature of the furnace from warming to time t, T0 is the initial temperature in the furnace, and t is the time experienced in the test.
The temperature of the RC slab was measured using self-made nickel–chromium/nickel–silicon thermocouples embedded in the slab, with a spacing of 20 mm between them. Seven concrete thermocouples were arranged along the thickness direction at each measuring point, totaling nine embedded measuring points, as shown in Figure 6a,b. In addition, one thermocouple shall be installed on the steel rebars near both the top and bottom of the slab. The thermocouple data was automatically collected by an HP data acquisition unit (Agilent 34970A, Keysight Technologies, Santa Rosa, CA, USA), with the measurement range meeting the requirements of the actual fire curve, the instrument was originally produced in Santa Rosa, California, the United States, and the manufacturer is Keysight Technologies. The out-of-plane displacement of the RC slab was measured using a differential displacement transducer (LVDT) with a measurement range of 200 mm to 500 mm. The arrangement of measurement points is shown in Figure 6c. The RC slab was placed on a horizontal fire resistance furnace for testing. Through the computer-controlled fire testing system, the heating program was executed according to the temperature rise curve specified in Equation (16). The actual furnace temperature curve was obtained via feedback signals from thermocouples installed inside the furnace, which was used to heat the RC slab. As shown in Figure 7, both the standard heating curve and the actual heating curve are presented. It can be observed that the fire curve used in the test essentially meets the heating requirements of the standard fire. The entire experimental scenario of the RC slab is shown in Figure 8.
Using ABAQUS software, a thermal–mechanical coupling method was employed to obtain the temperature and displacement data of the RC slab. The heating curves of the bottom reinforcement (S2) and concrete (X2, X3, and X4) were plotted, and the simulation results (FEM) were compared with the experimental results (TEST), as shown in Figure 9a. The out-of-plane displacement curves of measuring points 2#, 4#, and 5# under high temperature were plotted, and the simulation results (FEM) were compared with the experimental results (TEST), as shown in Figure 9b. Affected by experimental methods, equipment, and material inhomogeneity, there is a certain deviation between theoretical and actual results. During theoretical calculations, the thermal conductivity and specific heat capacity were underestimated, while the thermal expansion coefficient was overestimated. Additionally, the model failed to adequately account for water vapor migration at high temperatures, leading to overall higher predictions for structural temperature and displacement. However, the simulation and test curves show consistent trends with good agreement. Therefore, the thermal coupling simulation method and material constitutive model used in this article can reasonably predict the thermal conductivity and mechanical properties of steel and concrete materials at high temperatures.

3.2. Reinforced Concrete Slab Explosion Test Simulation

By simulating the explosion test of the RC slab in reference [41,42], the effectiveness of the explosion simulation method and strain rate material model is verified. The cross-sectional dimensions and material shape of the RC slab are shown in Figure 10, with a side length of 1000 mm and a thickness of 40 mm. It is reinforced with a single layer with a diameter of 6 mm between the stressed steel bars and the distributed steel bars and a spacing of 75 mm. The uniaxial compressive strength test value of concrete is 39.6 MPa, the tensile strength is 8.2 MPa, and the elastic modulus is 28.3 GPa. The yield stress of steel bars is 501 MPa, and the elastic modulus is 200 GPa. Using an approximate fixed support method, the end of the reinforced concrete slab is fixed with a steel frame, and explosives weighing 0.31 kg and 0.46 kg are suspended 400 mm directly above the slab for explosion testing. In the experiment, the mid-span displacement of the RC slab was measured using a simple steel needle displacement gauge. In the initial state, the steel needle was aligned with the mid-span measurement point on the bottom surface of the RC slab. After the slab deformed, the steel needle penetrated the sand layer, and the displacement change of the measurement point on the slab was recorded based on the depth of the needle’s insertion into the sand.
The author of the literature obtained peak displacements of 15 mm and 29 mm for plate A and plate B at the mid-span after explosion through experiments and 13 mm and 24 mm through numerical simulations. In this paper, the CEL fluid structure coupling method was used to obtain numerical simulation results of 14 mm and 26 mm, respectively. It can be observed that the simulation results are smaller than the experimental results. This discrepancy arises from two main factors: first, the actual test exhibited some looseness in the plate supports, whereas the numerical analysis assumed completely fixed supports; second, potential discrepancies may exist between the actual explosive parameters/detonation locations and those used in the simulation. Figure 11 shows the comparison between the numerical simulation results of ABAQUS finite element software and the numerical simulation results of the authors of the literature using AUTDYN software. As can be seen in Figure 11, the curves are in good agreement, so this paper adopts the strain rate model and the CEL fluid–solid coupling method, which can reasonably predict the mechanical properties of steel and concrete materials under the explosion load.

4. SCS Slab Finite Element Modeling

4.1. Material Parameters

According to the experimental design by Zhao [43], the dimensions of the SCS slab are 1000 mm × 1000 mm × 75 mm. The steel plate has a thickness of 3 mm; the studs have a diameter of 3 mm and a length of 25 mm. The core layer of the SCS slab consists of plain concrete with dimensions of 1000 mm × 1000 mm × 69 mm, designated as grade C30. The axial compressive strength is 20.6 MPa, and the axial tensile strength is taken as 10% of the axial compressive strength, which is 2.06 MPa. The structural configuration of the SCS slab is illustrated in Figure 12, and the mechanical properties of the materials are listed in Table 1.

4.2. Coupling Conditions

In the test, the opposite sides of the experimental plate were approximately fixed to the bracket using G-clamps, a method of approximate fixation. According to document [44], when the proportional distance of the explosion is 0 < Z < 1.2 m·kg−1/3, it is a near-field explosion. Therefore, in order to meet the requirements of proportional distance for near-field explosion, the explosive equivalent of TNT is set to 1 kg. Combined with Zhao’s [45] experiment on the explosive distance of corrugated double steel plate concrete composite wall panels in near-field explosion, the explosive distance is set to 0.65 m. In this paper, four components are designed to be in different coupling conditions to investigate their anti-explosion mechanisms under different working conditions. Specific working condition design parameters are shown in Table 2.

4.3. Model Building

First, complete the modeling of each component of the SCS slab according to the design dimensions. Set the absolute zero to −237.15 °C and the Stefan-Boltzmann constant to 5.67 × 10⁻⁸ W/(m2·K4). Input the material parameters for steel and concrete, then proceed with model assembly. Set the analysis step duration to 5 ms for the model. This is because the software requires considerable computation time until the SCS slab completely stops moving, while the critical structural damage occurs during the initial stage of the explosion. Multiple studies [36,41,43,46] have set the analysis step duration within the range of 0 ms to 6 ms in numerical analyses.
Next, define the contact relationship between the steel plate and concrete. Set “hard contact” in the normal direction and Coulomb friction in the tangential direction, with a friction coefficient of 0.6 [47]. The convective heat transfer coefficients for the fire-exposed surface and back fire surface are set to 25 W/(m2·°C) and 9 W/(m2·°C), respectively, the comprehensive radiation coefficient is set to 0.56, and the thermal contact resistance between the steel plate and concrete is assigned a value of 0.01 (m2·°C)/W. To accurately simulate the actual connection conditions of the SCS slab, the studs and steel plate are bonded together through shared nodes. The studs are embedded in the concrete using the “embedded region” method, while the boundary conditions of the SCS slab are set as fixed at both ends. Finally, a two-stage analysis method is adopted to investigate the dynamic response of the SCS slab after fire exposure. The first phase involves an implicit transient heat transfer analysis (Heat Transfer (Transient)) to obtain the internal temperature distribution field of the SCS slab. The second phase consists of a dynamic explicit analysis (dynamic and explicit). Using the “predefined field” function in the software, the ODB file obtained from the thermal analysis is imported, enabling the transition from implicit transient heat transfer analysis to explicit dynamic analysis. This achieves the coupling of fire and explosion effects. Figure 13 shows the schematic diagram of the CEL (Coupled Eulerian–Lagrangian) fluid–structure interaction algorithm. As can be seen from the figure, the TNT explosive is positioned directly above the SCS slab, surrounded by an air domain.
Finally, meshing was performed on all structural components, with both the element type and size properly configured. During the heat transfer analysis, a 4-node heat transfer quadrilateral shell element (DS4) is used for the steel plate, a 2-node heat transfer link element (DC1D2) is used for the stud, and an 8-node linear heat transfer brick element (DC3D8) is used for the concrete. During the explicit dynamic analysis, a 4-node doubly curved thin shell element (S4R) is used for the steel plate, a 2-node linear 3-D truss element (T3D2) is used for the stud, an 8-node linear brick element (C3D8R) is used for the concrete, an 8-node linear Eulerian brick element (EC3D8R) is used for the air domain, and an 8-node linear brick element (C3D8R) is used for the TNT. To determine the optimal mesh size, a mesh sensitivity analysis was conducted for both the fire-exposed and blast models, testing three different element sizes: 5 mm, 10 mm, and 15 mm. By comparing the results with reference data and images, it was found that mesh sizes within the 5–10 mm range provided excellent fitting accuracy. Considering both computational precision and cost, a final mesh size of 10 mm was selected for this study. To prevent stress wave reflection, the six surfaces of the air domain are meshed using a single sweep mesh pattern, with the sweeping direction oriented toward the infinite boundary. The meshing schemes for both the SCS slab and air domain are illustrated in Figure 14 and Figure 15, respectively.

5. Temperature Field Distribution

Figure 16 shows the temperature–time curve of the member at different positions at the mid-span of the SCS slab. From the figure, it can be seen that the temperature of each measurement point with the increase of the fire time shows a nonlinear increasing trend, and the warming trend is similar. Due to the existence of the contact thermal resistance between the steel plate and the concrete, the junction of the steel plate and the concrete on the fire surface has an obvious hysteresis in the warming trend, and the difference in temperature between the steel plate on the fire surface and the concrete is 128 °C at 90 min. But this hysteresis decreases from the concrete in the core area to the steel plate on the back fire surface, and the temperature difference between the steel plate on the back fire surface and the concrete junction is only 28 °C at 90 min. Figure 17 shows the graph of the peak temperature of the cross-section of concrete as a function of thickness under different fire exposure times. It can be seen that within the same fire exposure time, the cross-section temperature of concrete shows a nonlinear decreasing trend with increasing thickness, and there is an uneven distribution of temperature within the cross-section. Due to the deterioration of the mechanical properties of the material at high temperatures and the uneven distribution of temperature fields, the material undergoes non-isothermal deformation, resulting in a decrease in the blast resistance performance of the SCS slabs.

6. The Propagation Characteristics of Blast Shock Waves in Air

The shock wave propagation process in the air is shown in Figure 18. TNT explosives in the air explosion instantly form a group of explosives to occupy the original space of the high-temperature, high-pressure gas. This group of gases violently pushes the surrounding air, at the same time generating a series of compression wave propagations in all directions, and each compression wave finally superimposes into an incident shock wave. At 0.2 ms, the incident shock wave reaches the blast face. Due to the existence of the SCS slab, shock waves cannot be bypassed on the surface of the slab; the blast-facing surface of the rigid slab will act like the ground. At this time the propagation rate of the explosive shock wave will plummet to zero. At 0.3 ms, a large amount of gas had already accumulated on the blast-facing surface of the slab; gas pressure and density gradually superimposed to a certain extent. The explosion of the shock wave will be diffused in the opposite direction to form a reflection of the shock wave, and when the reflection of the wave and the incident wave overlap, then the formation of the Mach wave occurs. The incident wave, reflected wave, and Mach wave will form three wave points [48] on the blast-facing surface of the slab, and after the three waves intersect on the blast face of the plate, they will continue to spread along the slab face in all directions. At 1.8 ms, this diffusion phenomenon can be clearly observed. The shock wave waveform formed by the target measuring point in the air is shown in Figure 19. It can be seen that when the shock wave reaches the measuring point, the air pressure will quickly rise to the peak overpressure. After the shock wave, the air pressure gradually decreases to the initial pressure state. Subsequently, due to the pulsating effect of the explosive products, a secondary shock wave will be formed here, and this process will be repeated until the initial pressure state is restored again.

7. Dynamic Response Analysis

7.1. Destruction State Analysis

Figure 20 shows the overall damage pattern of the SCS slab at different fire times and moments. The color bars on the left side of the figure show the values of equivalent plastic strain corresponding to the different colors, which gradually increase from blue to red. As shown in the figure, in the whole process of the explosion, the steel plate, due to the action of the tensile wave, the back fire surface, and the fire surface around the obvious warping phenomenon, and this warping phenomenon will be more pronounced with the prolongation of the fire time. The studs embedded in the concrete have separated from the concrete, causing partial detachment between the steel plates on both sides and the concrete. Obvious warping has occurred at the edges of the steel plates, localized damage has developed at the embedment points of the studs in the concrete, and noticeable bulging has appeared at the welded joints between the studs and the steel plates. The size of the equivalent plastic strain of the steel plate on the fire surface gradually expands from the surrounding area to the middle until it is larger than the equivalent plastic strain of the surrounding area, and the bulging degree of the steel plate eventually shows that the middle area is obviously larger than the surrounding area, and with the prolongation of the fire time, the bulging area gradually expands, and the flexural deformation becomes bigger and bigger. However, the explosion impact will not be uniformly propagated in the material and may produce a local stress concentration phenomenon, resulting in a sharp rise in equivalent plastic strain. It can be seen that the maximum value of the equivalent plastic strain does not show a gradual increase with increasing temperature but rather an irregular variation.
Figure 21 shows the damage pattern of concrete under different fire times; the color bar goes from blue to red, the damage factor is increasing, and the mesh cell is moving closer to the failure state. Stress concentration occurs at the embedment interface between the studs and concrete, while the supports also exhibit stress concentration due to restraint effects. This leads to localized damage in the concrete, which becomes increasingly pronounced with prolonged fire exposure time. There is also a relatively concentrated damage in the central area of the concrete back fire surface and the fire surface, and with the spread of the stress wave and the prolongation of the fire time, the damage area will become larger and larger and spread from the central area to the surrounding area. Due to the significant impact of compression waves on the components, there is a tendency for the overall components to bend downwards.

7.2. Stress Variation Analysis

This document stipulates that tensile stresses acting on structural members are defined as positive values, while compressive stresses are defined as negative values. Figure 22 presents the time–history curves of mid-span stress variations in the steel plates on the back fire surface and the fire surface under different fire exposure durations. As shown in Figure 22a, within the time range from 0 ms to 2 ms, the mid-span stress of the steel plate on the back fire surface will not show a large stress difference due to temperature changes. The trend of the curve variation is roughly the same, and the durations of the tensile and compressive stresses are approximately the same. Within the time range from 2 ms to 5 ms, compared with the normal temperature state, the steel plate will have obvious stress fluctuations and generate a larger stress difference in the high-temperature state. However, there will be no obvious stress fluctuations after the steel plate enters the high-temperature state. This indicates that in the early stage of the explosion, the influence of the stress wave on the mechanical properties of the steel plate material on the back fire surface plays a dominant role, and in the middle and late stages of the explosion, the influence of temperature on the mechanical properties of the steel plate material on the back fire surface plays a dominant role. As shown in Figure 22b, the fluctuation trend of the mid-span stress of the steel plate on the fire surface is smoother than that of the steel plate on the back fire surface. There will be no large stress difference, and the overall stress value is also smaller. This is because the steel plate on the fire-exposed surface is less affected by the explosion shock wave. However, compared with the normal temperature state, the steel plate will generate obvious stress fluctuations in the high-temperature state. In the normal temperature state, the steel plate is mainly subject to tensile stress. As the fire exposure time increases, it gradually transitions to compressive stress, and the influence of temperature on the mechanical properties of the steel plate material on the fire surface has always played a dominant role.
Figure 23 shows the time–history curves of the mid-span stress variations of the concrete on the back fire surface and the fire surface under different fire exposure times. As shown in Figure 23a, the concrete on the back fire surface is basically in a compressed state throughout the explosion process. There are relatively obvious peak stresses at 0.2 ms, 1.55 ms, and 5 ms, and the compressive stress increases with the increase of the fire exposure time. As shown in Figure 23b, compared with the concrete on the back fire surface, the concrete on the fire surface is less affected by the stress wave, and there are no obvious stress fluctuations within the time range from 0 ms to 4.5 ms. However, as the fire exposure time increases, within the time range from 4.5 ms to 5 ms, the phenomenon of a sudden increase in the stress value gradually appears, which is closely related to the degradation of the mechanical properties of the concrete material under high-temperature conditions. By comparing the stress values in Figure 22 and Figure 23, it can be seen that the stress experienced by the steel plate is much greater than that experienced by the concrete. This indicates that the steel plate has borne more of the explosion shock wave, effectively preventing the spalling of the core concrete.

7.3. Displacement Change Analysis

The time–distance curves of the mid-span nodal displacements between the back fire and fire surfaces of the combined plate steel sheets at different fire times are shown in Figure 24. The shock wave reaches the back fire surface in a very short time, so there is a small horizontal straight line in the initial stage, and the transmission time from the back fire surface to the fire surface is even shorter, so the back fire surface and fire surface spanwise displacements change almost simultaneously. The mid-span displacements of the fire surface show a gradual increasing trend, and the rise of the displacement curve is gradually increasing. The peak displacements at the working conditions of 0 min, 30 min, 60 min, and 90 min of fire time were 22.77 mm, 39.90 mm, 45.92 mm, and 54.59 mm, respectively. In the initial stage when the shock wave contacts the back fire surface of the steel plate, the stress at the center of the steel plate is less than that at its surrounding positions, causing a brief bulge in the center of the steel plate and resulting in negative displacement. As the shock wave spreads, the stress at the center position gradually increases, and the curve begins to show a rising trend until it exceeds the stress at the surrounding positions. The center position of the steel plate begins to sag downwards, and the displacement shows a positive value. The peak displacements under the working conditions of 0 min, 30 min, 60 min, and 90 min of fire exposure are 6.35 mm, 22.72 mm, 24.29 mm, and 23.24 mm, respectively. The mechanical properties of steel are greatly affected by temperature, so the magnitude of change in the displacement of the back fire surface and fire surface at high temperature is significantly greater than the magnitude of change in displacement at room temperature, and the peak displacement of the back fire surface and fire surface in the fire time of 90 min is 3.7 times and 2.4 times the peak displacement at room temperature, respectively. After entering the high-temperature state, the temperature sensitivity of the steel gradually decreases with the deterioration of the material, so the overall trend of the displacement in the span under the high-temperature state is approximately the same, and there will be no obvious displacement difference, but when the material deteriorates to a certain degree, the change of displacement will show a steeper trend.
Figure 25 analyzes and compares the mid-span displacement of the steel plate’s back fire surface and the fire surface under the same fire exposure time. As the temperature of the fire surface is much higher than that of the back fire surface, the degree of decrease in the material’s mechanical properties is also greater. The composite plate is mainly affected by compression waves during the explosion process, and there is a trend of change along the compression direction as a whole. The concrete material below the steel plate’s back fire surface to some extent hinders the development of its displacement, while there are no obstacles below the fire surface, which is greatly affected by compression waves, and the development of displacement is relatively fast. Therefore, under the same fire exposure time, the variation amplitude of the mid-span displacement curve of the fire surface is significantly greater than that of the back fire surface.

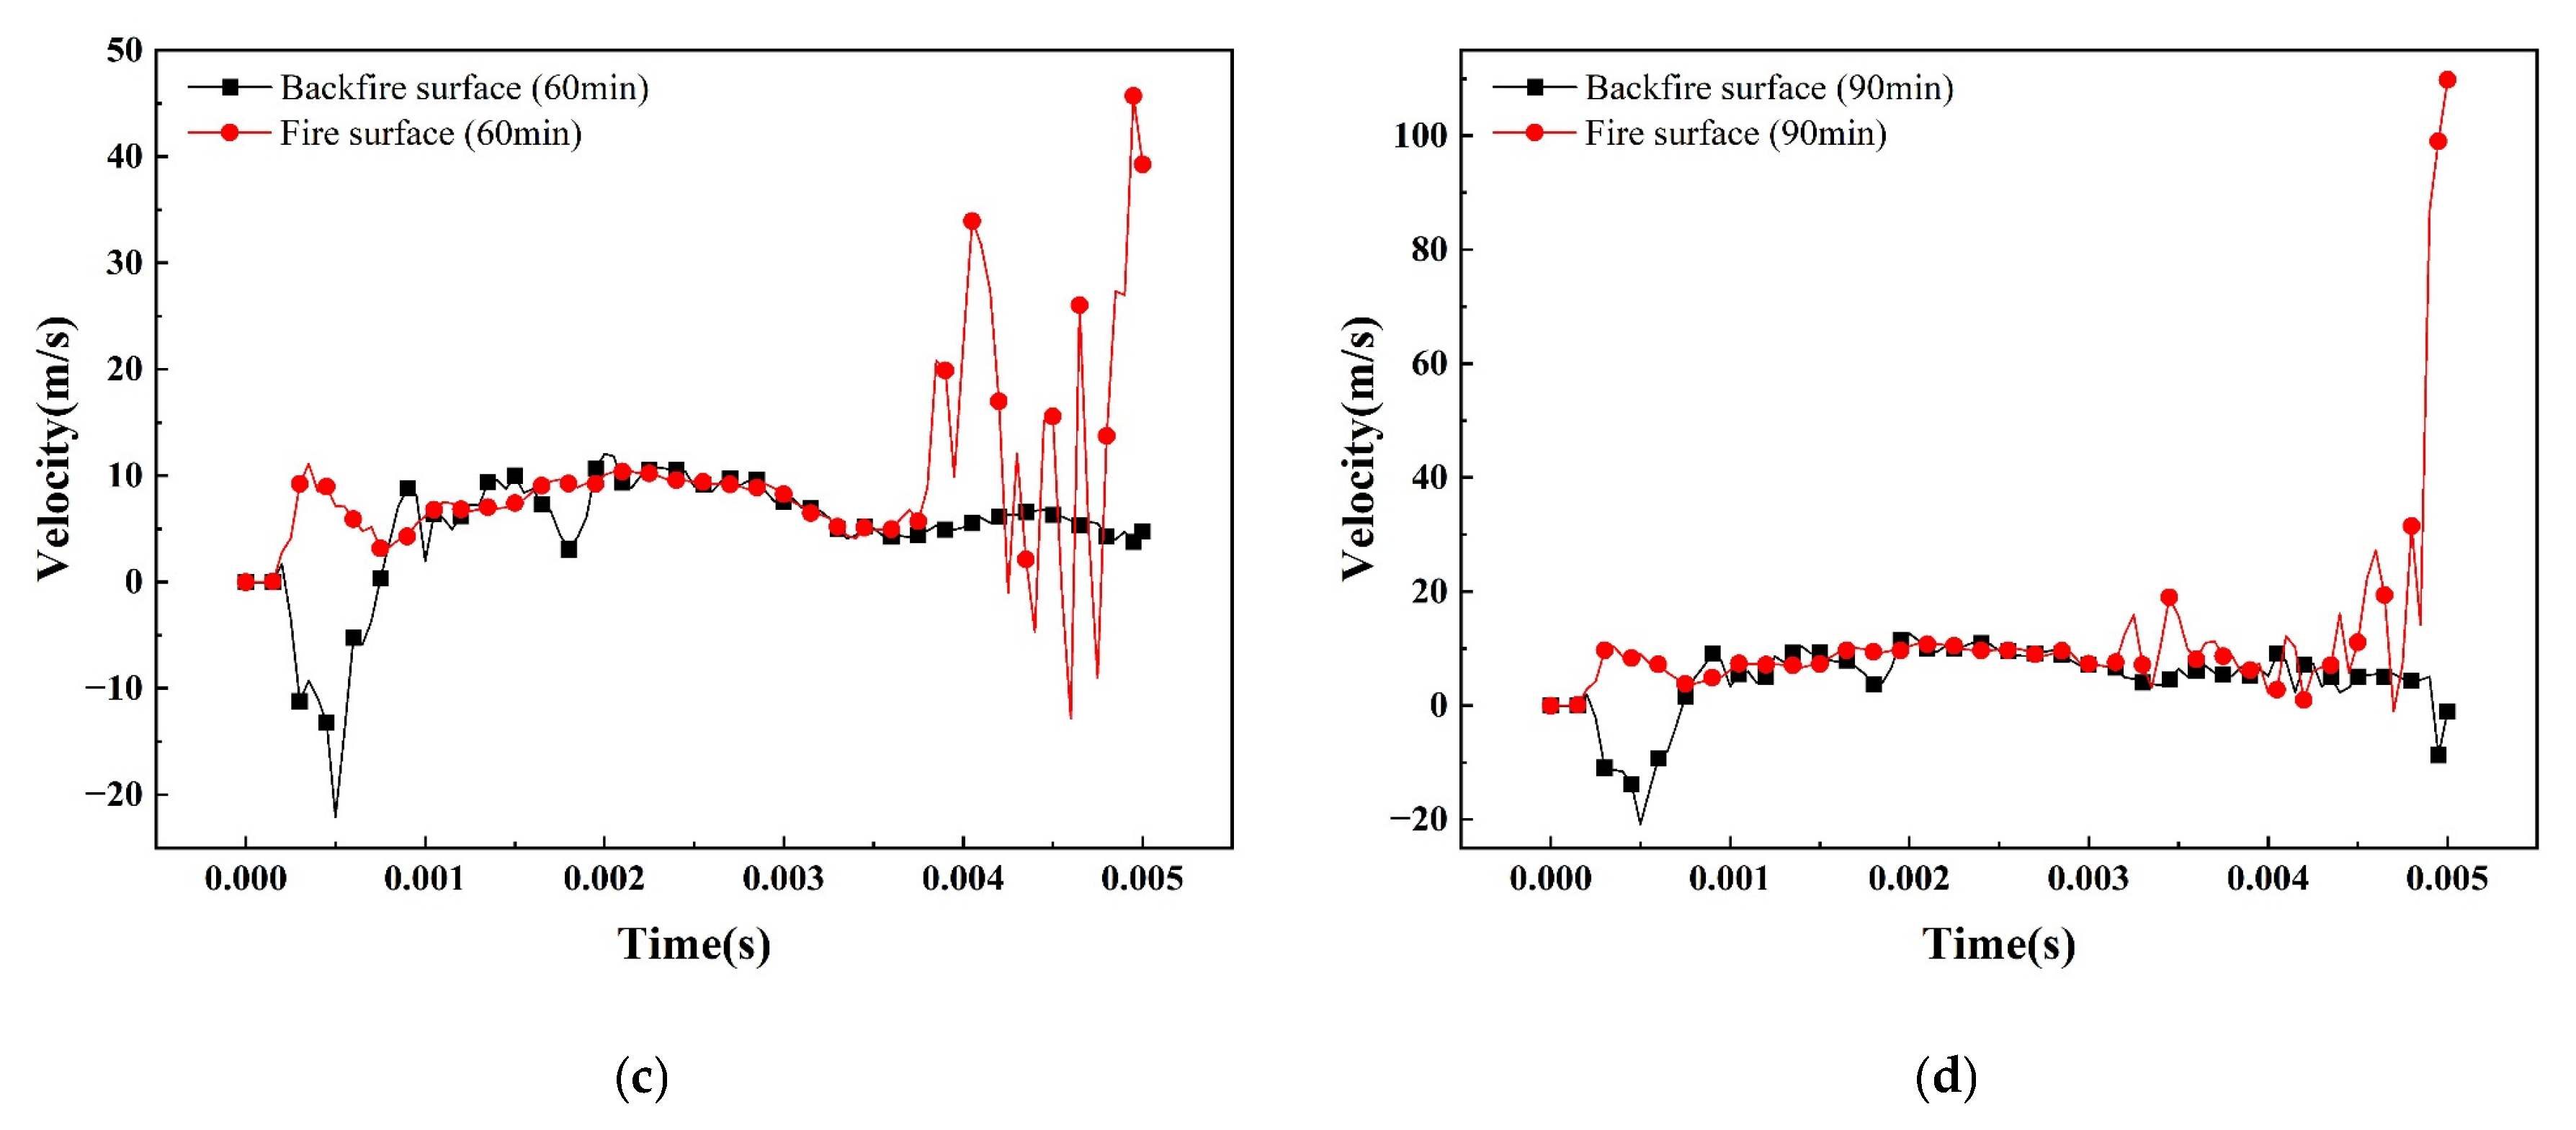
7.4. Analysis of Vibration Velocity Changes

Under explosive loads, the velocity of the explosion point can not only reflect the kinetic energy of the load-bearing material to a certain extent but also determine its damage and deformation. Figure 26 shows the time history of the velocity changes of the steel plate’s back fire surface and the mid-span node of the fire surface at different ignition times. The peak vibration velocities of the steel plate with a back fire surface at room temperature and 30 min of fire exposure are not significantly different, at −14.75 m/s and −13.62 m/s, respectively. The peak vibration velocities at 60 min and 90 min of fire exposure are not significantly different, at −22.07 m/s and −20.84 m/s, respectively. After the peak vibration velocity, the velocity curve shows an overall upward trend, gradually returning to a positive value and tending to stabilize. However, compared with room temperature, the overall increase in velocity is greater at high temperatures. The velocity changes of the steel plate on the fire surface are relatively stable in the early and middle stages. After entering a high-temperature state, the curve fluctuates greatly in the later stage and even shows a steep increase trend at the end of the curve. The peak vibration velocity of the mid-span node is also much higher than that at room temperature. The peak vibration velocities at 0 min, 30 min, 60 min, and 90 min of fire exposure are 15.63 m/s, 51.47 m/s, 45.70 m/s, and 109.83 m/s, respectively. The increase in vibration speed is directly related to the degradation of steel materials at high temperatures, indicating that as the temperature increases, the blast resistance of steel gradually decreases.
Figure 27 compares the mid-span velocities of the steel plate’s back fire surface and the fire surface under the same fire exposure time. It can be seen that the fluctuations in the early and middle stages of the curve are relatively consistent, indicating that the magnitude of kinetic energy absorbed by the back fire surface and the fire surface in the early and middle stages is roughly the same, and the damage and deformation are basically the same. In the high-temperature state, in the late stage, the fluctuation of the fire surface is significantly higher than the back fire surface; the fire surface will absorb more kinetic energy during this period of time, the damage will be more serious, the deformation is greater, and the degree of decline in the overall blast resistance is also greater. So in the same fire time, the surface of the fire by the impact of the explosion shock wave is greater.

8. Conclusions

This article uses ABAQUS numerical simulation software and appropriate numerical simulation methods to verify the accuracy of thermal parameters and strain rate parameters. On this basis, with different fire exposure times as conditions and several important dynamic parameters as research objectives, the dynamic characteristics and failure mechanism of SCS slabs under explosion after fire were explored. The analysis results provide a systematic basis for performance-based design and safety management of SCS slabs in critical infrastructure applications. The following conclusions were obtained:
(1)
There is a contact thermal resistance between the steel plate and the concrete, and there will be a temperature hysteresis at their junction, which will gradually decrease from the fire surface to the back fire surface. When the fire time is 90 min, the temperature difference between the junction of the steel plate and concrete on the fire surface is 128 °C, and the temperature difference between the junction of the steel plate and concrete on the back fire surface is 28 °C. The temperature at each measuring point within the wall panel exhibits a nonlinear increasing trend with prolonged fire exposure time. For the same duration of fire exposure, the concrete section temperature shows a nonlinear decreasing trend with increasing thickness. Consequently, an uneven temperature distribution occurs across the wall panel’s cross-section, inducing non-isothermal deformation of the material and consequently reducing the blast resistance performance of the wall panel.
(2)
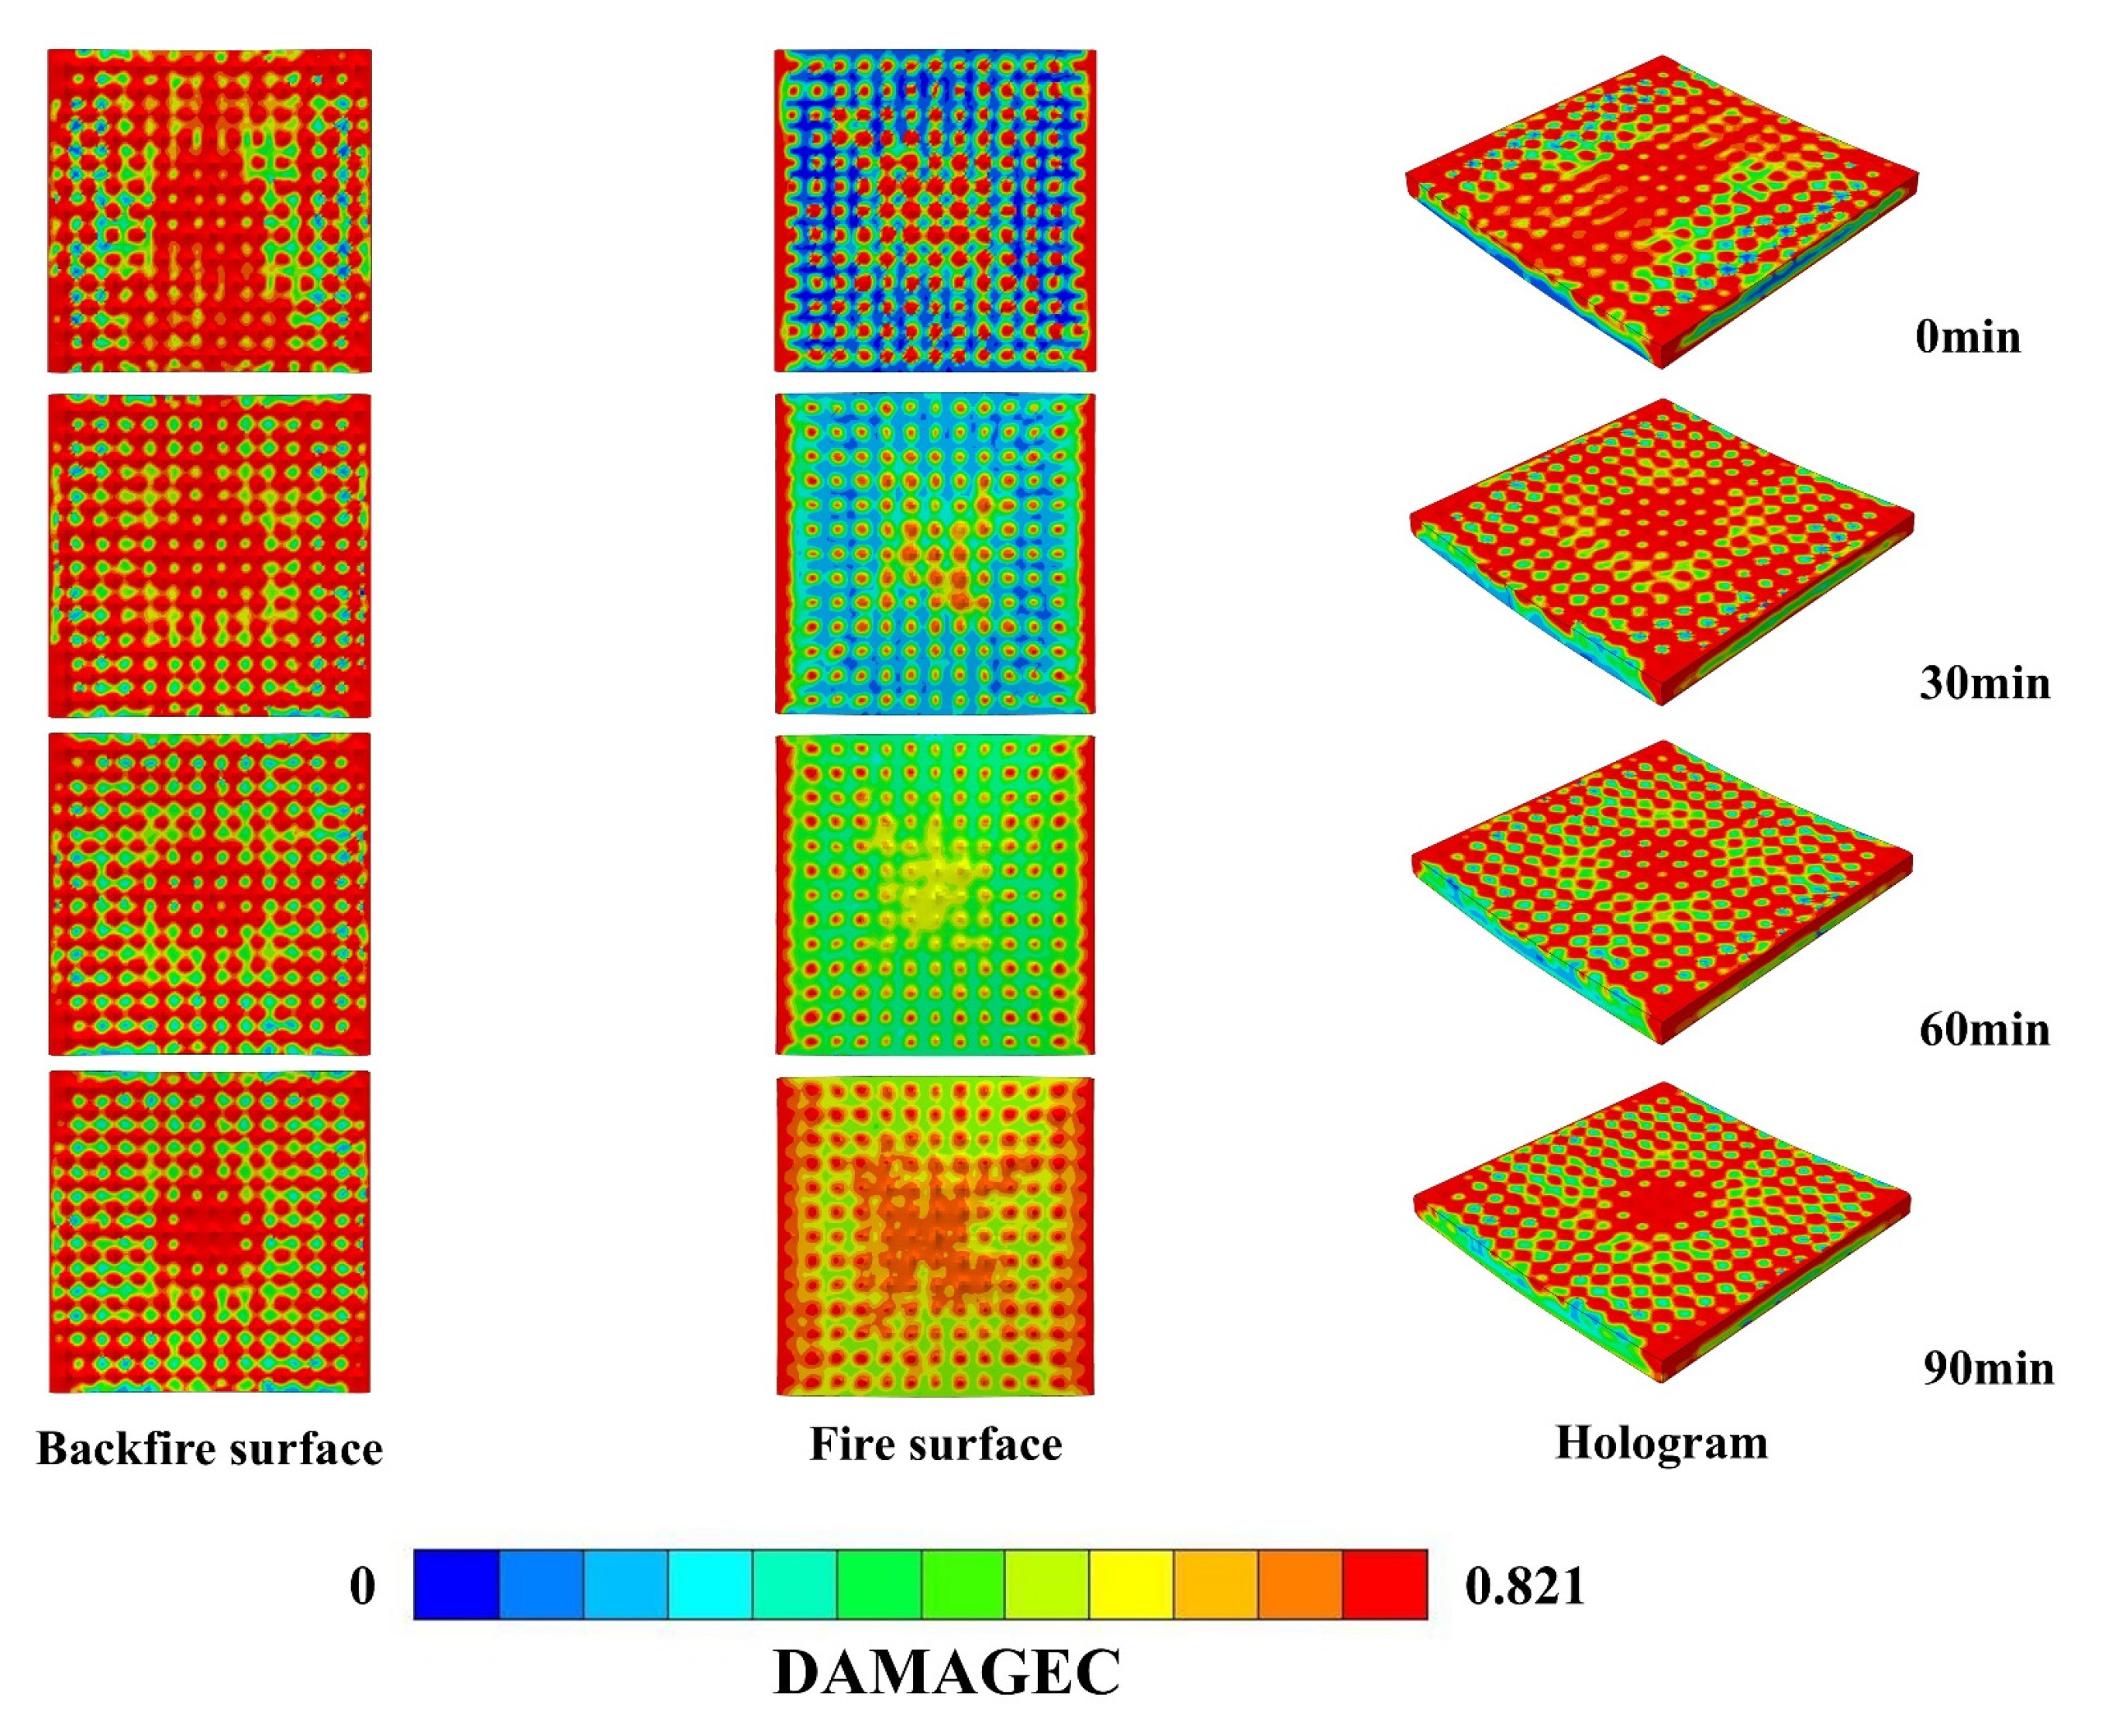
Under post-fire blast effects, there is a significant warping phenomenon around the back fire surface and the fire-receiving surface of the steel plate. The studs are pulled out of the concrete, and the steel plate and concrete are partially separated. The damage to the fire-receiving surface of the steel plate is relatively severe, and the equivalent plastic strain gradually expands from the periphery to the middle, resulting in bulging and deformation. As the duration of exposure to fire increases, the bulging area and flexural deformation of the steel plate are also increasing; the local damage at the junction of concrete and studs, as well as at the support, becomes increasingly evident; and the damage area on the fire and back fire surfaces gradually expands.
(3)
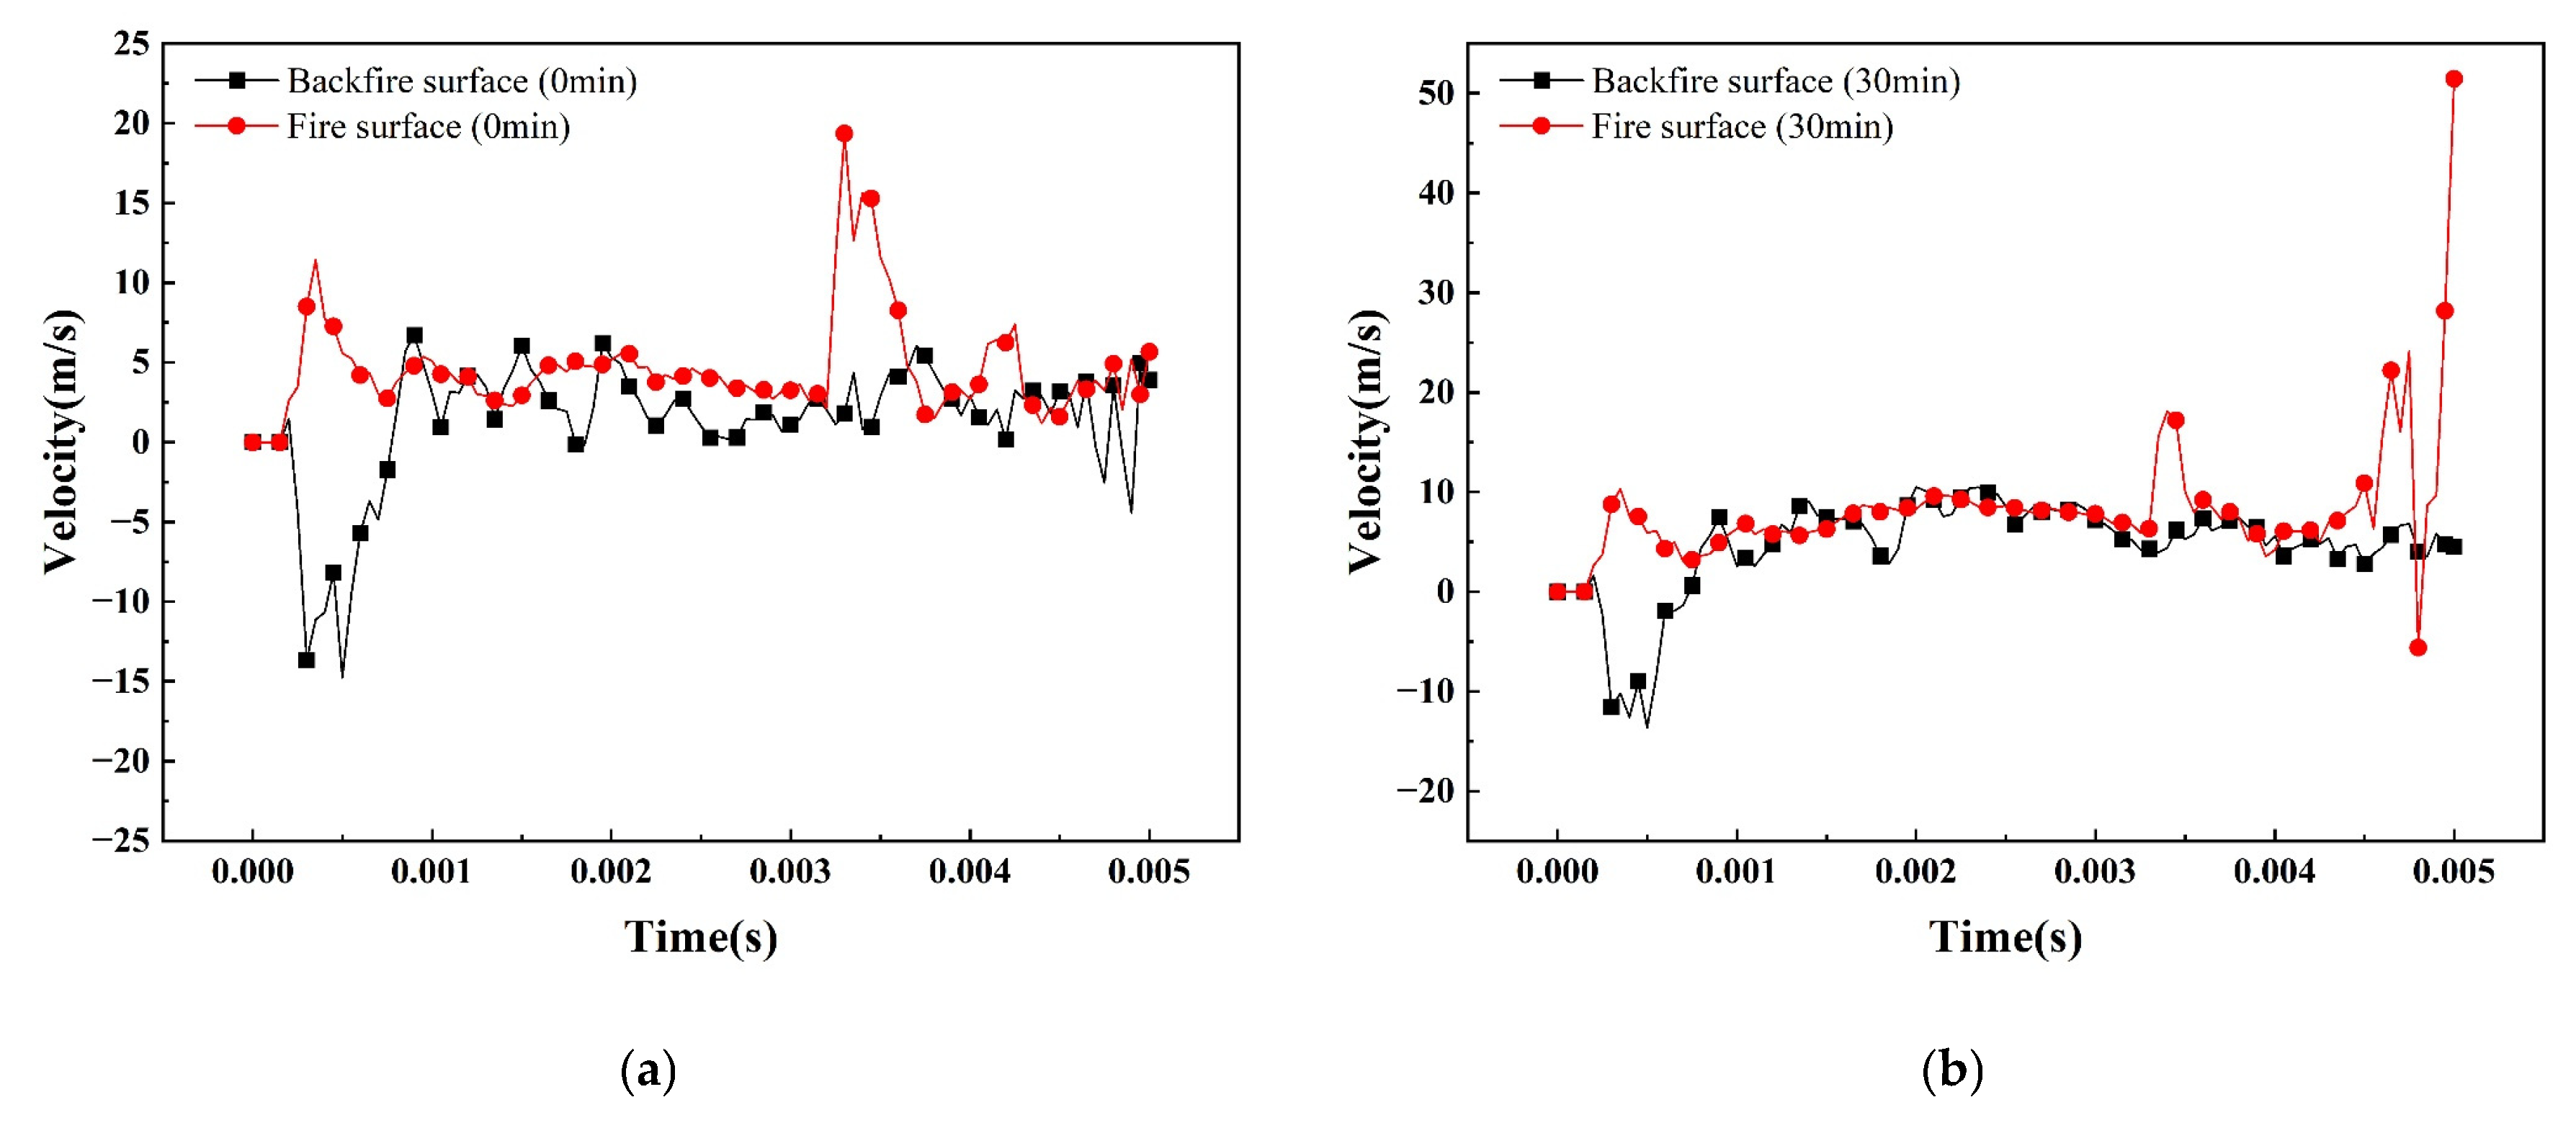
Temperature change and blast shock wave together affect the mechanical properties of the material, but the temperature change throughout the explosion has a greater impact on the mechanical properties of the material. Compared to the fire surface, the back fire surfaces of both concrete and steel plates experience more intense stress fluctuations due to direct exposure to blast shockwaves. When compared to normal temperature conditions, the steel plates and concrete under elevated temperatures exhibit significantly more pronounced stress fluctuations and stress differentials. During the explosion, the steel plates absorbed more energy and endured greater blast wave impact than the concrete, effectively preventing spalling of the core concrete.
(4)
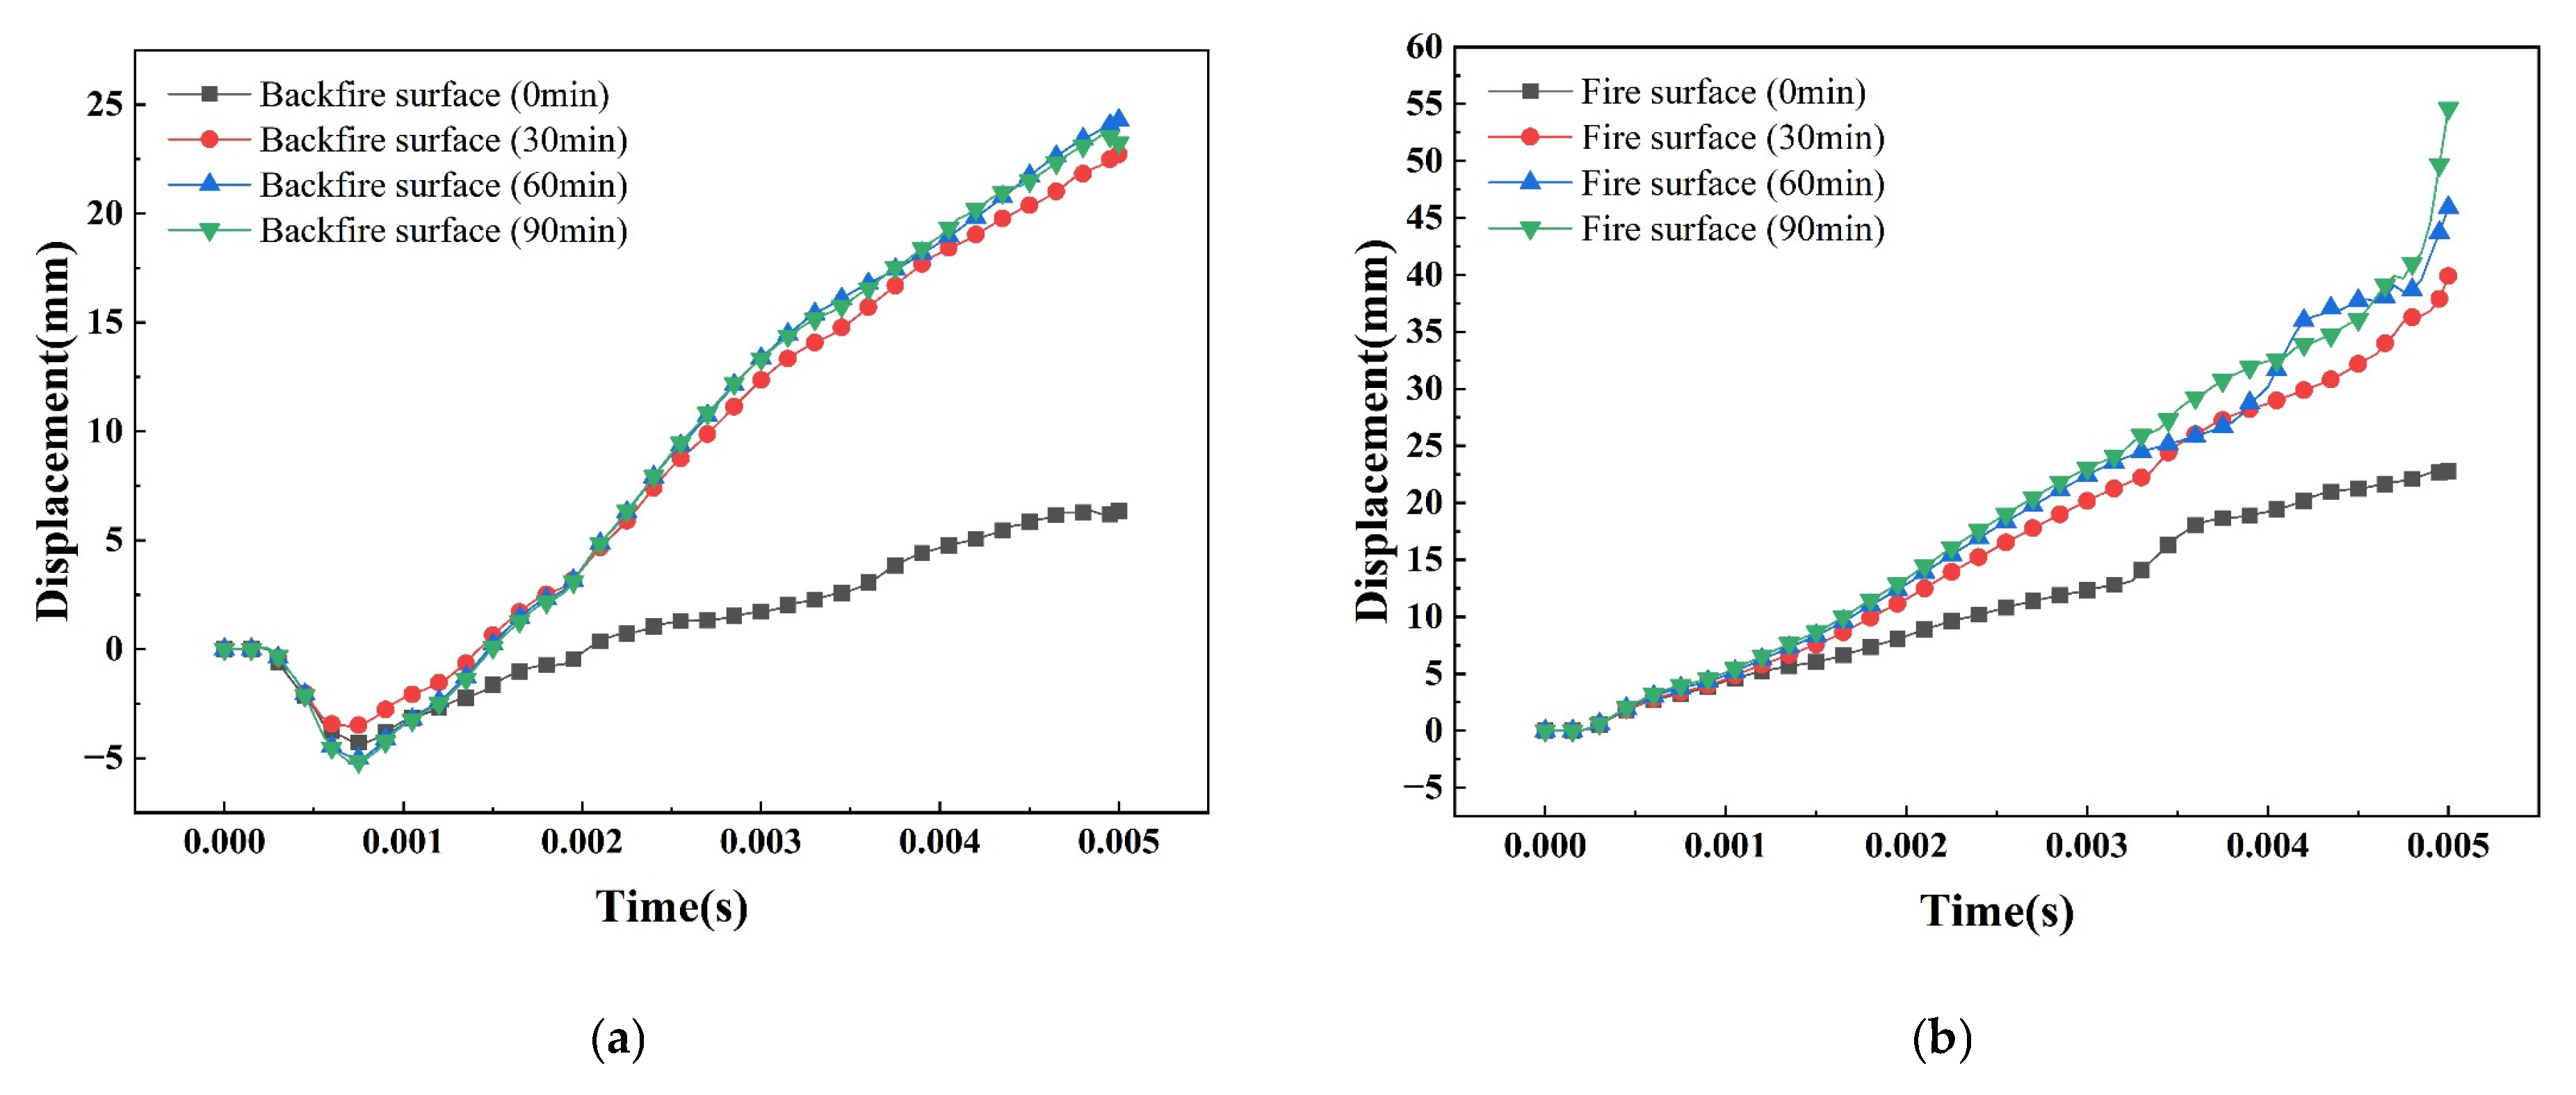
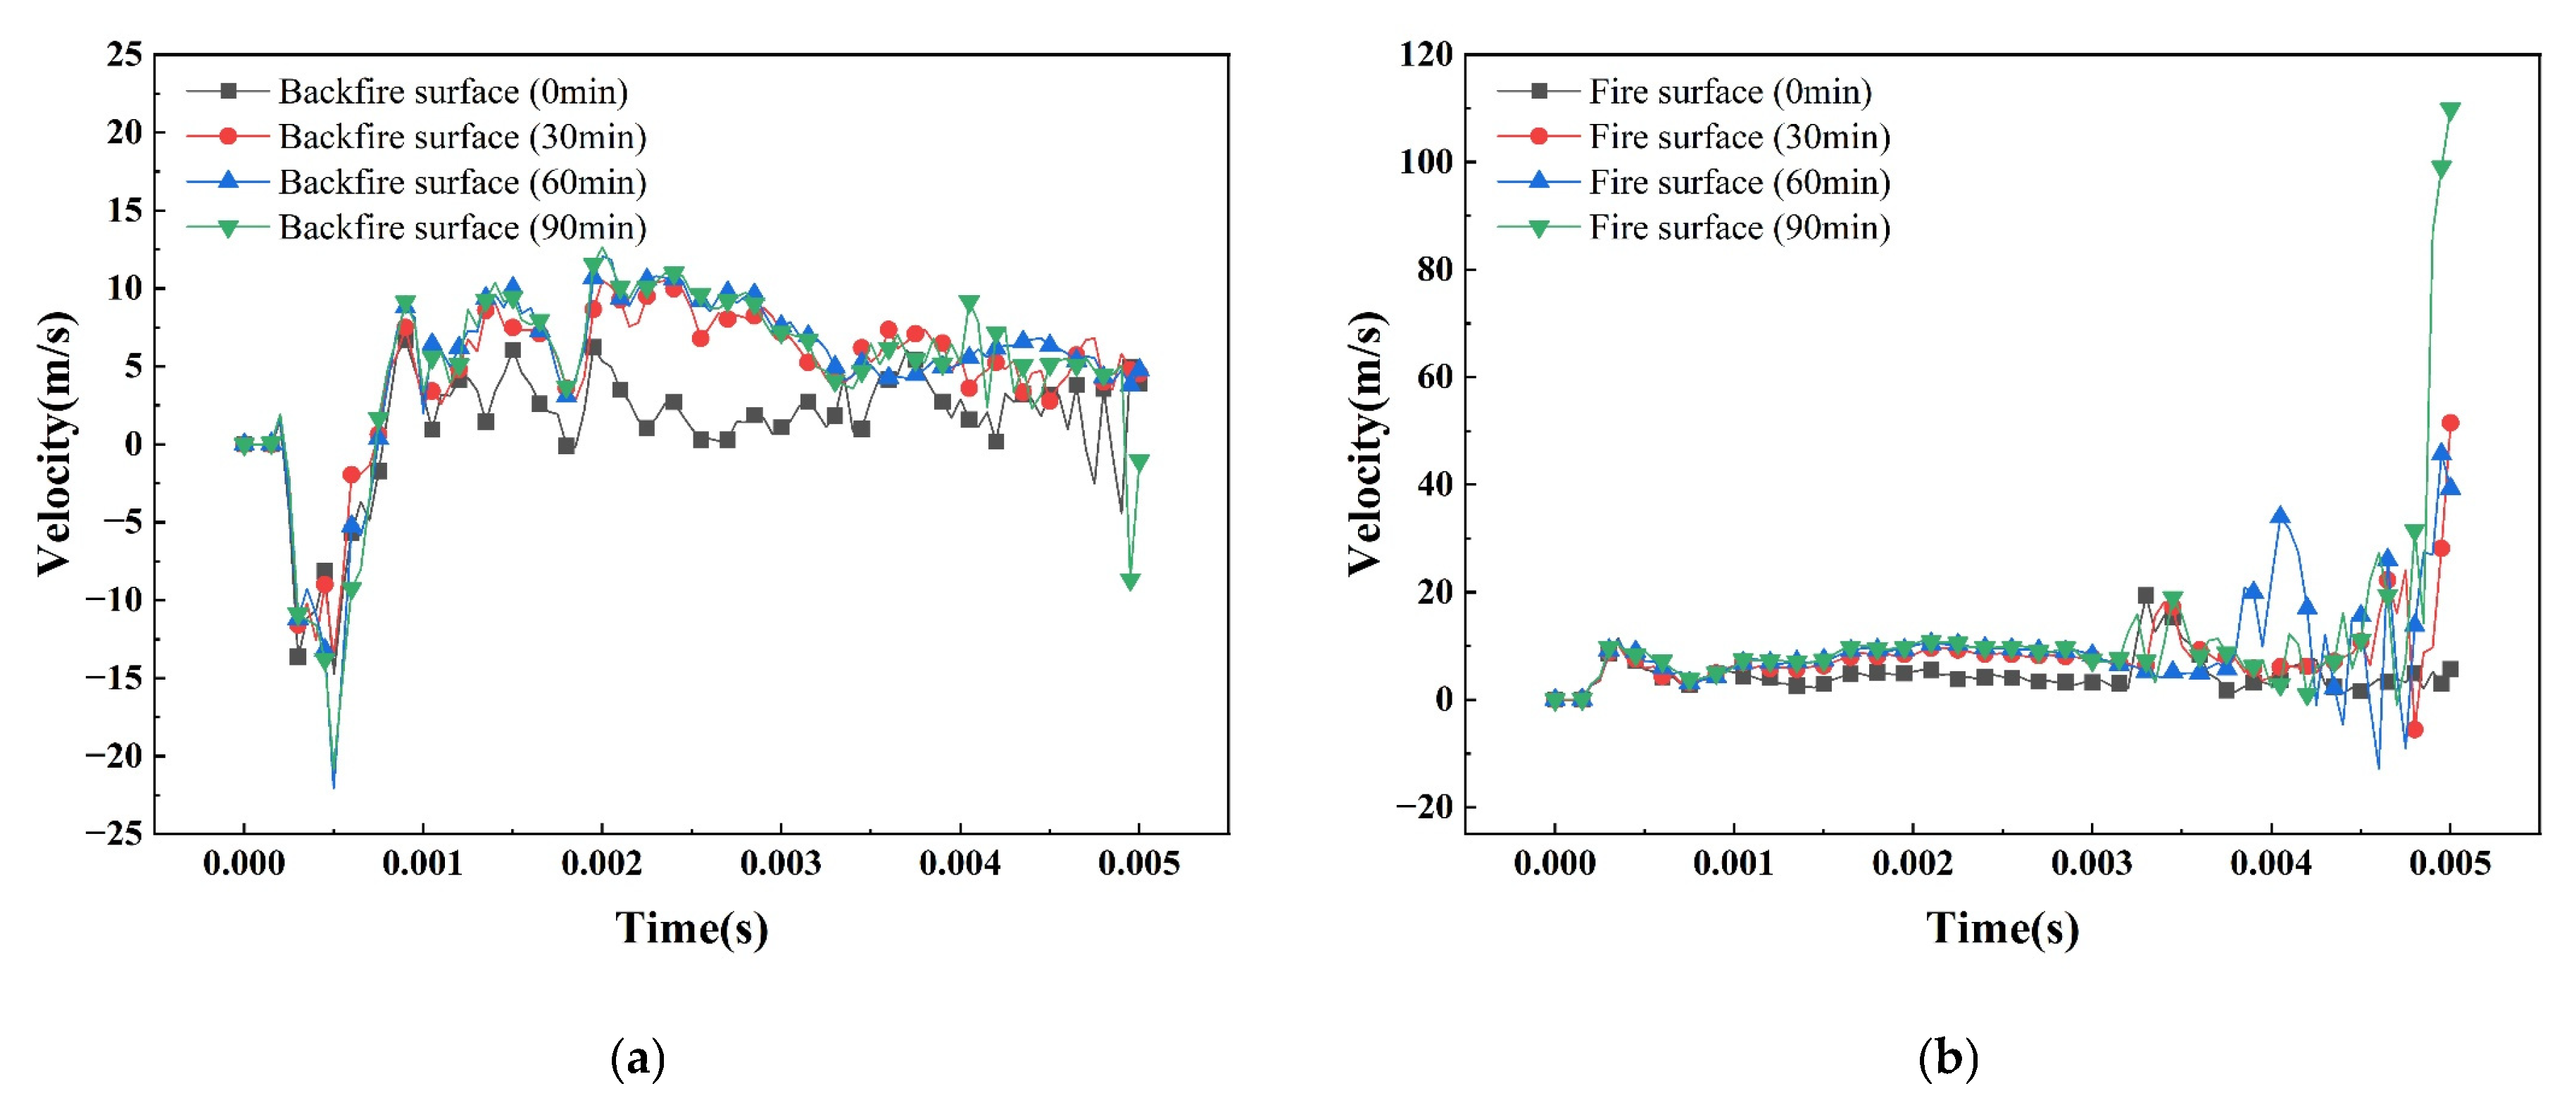
The higher the temperature, the greater the tendency to increase the mid-span displacement of the steel plate, and even a steep increase in the phenomenon, the greater the peak displacement; the magnitude of the change in the spanwise displacement of the fire surface is significantly larger than that of the back fire surface, the fire surface and the back fire surface of the peak displacement of 54.59 mm and 24.29 mm, respectively. The peak vibration velocity of the steel plate at high temperature is larger than that at room temperature. Compared with the back fire surface, the steel plate on the fire surface shows more obvious velocity fluctuation at high temperature, and the peak vibration velocities of the fire surface and the back fire surface are 109.83 m/s and −22.07 m/s, respectively, and the fire surface absorbs more kinetic energy, which results in more serious damage.
The full study provides important engineering basis for enhancing the structural safety of critical infrastructures such as nuclear power plants. Therefore, in practical applications, additional fireproof and blast-resistant design reinforcements should be implemented for potential fire surfaces of SCS slabs. For example, fire-resistant coatings and blast-proof energy-absorbing structures should be added to the outer steel plates. However, during the service life of SCS slabs, they are usually connected to other structures (beams, columns, walls). Therefore, it remains to be studied to consider the influence of the connection structures on the dynamic mechanical properties of SCS slabs under the action of an explosion after a fire.

Author Contributions

S.Z.: data curation, formal analysis, software, investigation, writing—original draft, and writing—review and editing; Z.C.: conceptualization, methodology, writing—review and editing, and funding acquisition; Y.L.: validation, supervision, resources, and writing—review and editing; Q.T.: writing—review and editing; D.W.: writing—review and editing; P.Z.: writing—review and editing. All authors have read and agreed to the published version of the manuscript.

Funding

This research was funded by the National Natural Science Foundation of China [No. 51678286].

Data Availability Statement

The original contributions presented in the study are included in the article; further inquiries can be directed at the corresponding authors.

Conflicts of Interest

The authors declare that they have no known competing financial interests or personal relationships that could have appeared to influence the work reported in this paper.

Abbreviations

ParametersMeaning and Unit
λsThermal conductivity of steel [W/(m·°C)]
CsSpecific heat capacity of steel [J/(kg·°C)]
αsCoefficient of thermal expansion of steel [10−6/°C]
λcThermal conductivity of concrete [W/(m·°C)]
CcSpecific heat capacity of concrete [J/(kg·°C)]
ρcDensity of concrete [kg/m3]
αcCoefficient of thermal expansion of concrete [10−6/°C]
fyYield strength of the steel at room temperature [Pa]
EElastic modulus of the steel at room temperature [Pa]
fuUltimate strength of steel at room temperature [Pa]
fcCompressive strength of concrete at room temperature [Pa]
ftTensile strength of concrete at room temperature [Pa]
EcModulus of elasticity of concrete at room temperature [Pa]
fy,TYield strength of steel at high temperature [Pa]
ETElastic modulus of steel at high temperature [Pa]
fu,TUltimate strength of steel at high temperature [Pa]
fc,TCompressive strength of concrete at high temperature [Pa]
ft,TTensile strength of concrete at high temperature [Pa]
Ec,TModulus of elasticity of concrete at high temperature [Pa]
TTemperature [°C]
σ0Initial yield stress [Pa]
βHardening parameter
EpPlastic hardening strain modulus [Pa]
εeffEquivalent plastic strain
ε ˙ Strain rate [s−1]
CMaterial strain rate parameter
PMaterial strain rate parameter
fc0Static compressive strength [Pa]
ft0Static tensile strength [Pa]
ε ˙ c 0 Static compressive strain rate [s−1]
ε ˙ t 0 Static tensile strain rate [s−1]
pBurst pressure [Pa]
VRelative volume [m3]
E0Initial volume internal energy [J]
AMaterial parameter [Pa]
BMaterial parameter [Pa]
R1Material parameter
R2Material parameter
ωMaterial parameter
c0Speed of sound in the fluid [m/s]
Γ0Gruneisen’s constant
ρ0Density of the fluid [kg/m3]
SLinear coefficient between the speed of sound and the velocity of propagation of the shock wave
EmInternal energy per unit mass of the fluid [J]
ηCoefficient of dynamic viscosity [Pa·s]

References

  1. Li, X.; Li, X. Steel Plates and Concrete Filled Composite Shear Walls Related Nuclear Structural Engineering: Experimental Study for out-of-Plane Cyclic Loading. Nucl. Eng. Des. 2017, 315, 144–154. [Google Scholar] [CrossRef]
  2. Wei, F.; Zheng, Z.; Yu, J.; Wang, Y. Structure Behavior of Concrete Filled Double-Steel-Plate Composite Walls under Fire. Adv. Struct. Eng. 2019, 22, 1895–1908. [Google Scholar] [CrossRef]
  3. Zhao, C.; Lu, X.; Wang, Q.; Gautam, A.; Wang, J.; Mo, Y.L. Experimental and Numerical Investigation of Steel-Concrete (SC) Slabs under Contact Blast Loading. Eng. Struct. 2019, 196, 109337. [Google Scholar] [CrossRef]
  4. Bolina, F.L.; Schallenberger, M.; Carvalho, H. Experimental and Numerical Evaluation of RC Ribbed Slabs in Fire Conditions. Structures 2023, 51, 747–759. [Google Scholar] [CrossRef]
  5. ISO 834-1999; Fire-Resistance Tests—Elements of Building Construction—Part 1: General Requirements. ISO: Geneva, Switzerland, 1999.
  6. Zhou, T.; Liu, X.; Liu, H.; Li, Y.; Zhang, P.; Chen, H.; Chen, Z. Experimental Study on Fire Resistance Performance of Concrete-Filled Steel Plate Composite Walls. Int. J. Steel Struct. 2023, 23, 389–403. [Google Scholar] [CrossRef]
  7. Du, E.; Shu, G.; Qin, L.; Lai, B.; Zhou, X.; Zhou, G. Experimental Investigation on Fire Resistance of Sandwich Composite Walls with Truss Connectors. J. Constr. Steel Res. 2022, 188, 107052. [Google Scholar] [CrossRef]
  8. Chen, Z.; Zong, Z.; Li, J.; Li, J.; Yan, Y.; Wu, C. Experimental and Numerical Study on Damage Behavior of Air-Backed Steel-Concrete-Steel Composite Panels Subjected to Underwater Contact Explosion. Eng. Struct. 2024, 318, 118744. [Google Scholar] [CrossRef]
  9. Yu, S.; Wu, H.; Zhang, G.; Wang, Z.; Yao, J.; Li, H.; Liu, C. Experimental Study on Anti-Shallow-Buried-Explosion Capacity of a Corrugated Steel-Plain Concrete Composite Structure. Int. J. Impact Eng. 2023, 172, 104393. [Google Scholar] [CrossRef]
  10. Zhu, W.; Xiao, Y.; Yu, J.; Jia, J.; Li, Z. Damage Modes and Mechanism of Steel-Concrete Composite Bridge Slabs under Contact Explosion. J. Constr. Steel Res. 2024, 212, 108223. [Google Scholar] [CrossRef]
  11. Huang, R.; Li, S.; Meng, L.; Jiang, D.; Li, P. Coupled Effect of Temperature and Strain Rate on Mechanical Properties of Steel Fiber-Reinforced Concrete. Int. J. Concr. Struct. Mater. 2020, 14, 48. [Google Scholar] [CrossRef]
  12. Alogla, S.M.; Kodur, V. Temperature-Induced Transient Creep Strain in Fiber-Reinforced Concrete. Cem. Concr. Compos. 2020, 113, 103719. [Google Scholar] [CrossRef]
  13. Zhang, H.; Zhang, W.; Chen, Y.; Chen, R.; Liu, Y.; Zhang, Y. Study on the Dynamic Impact Mechanical Properties of High-Temperature Resistant Ultra-High Performance Concrete (HTRUHPC) after High Temperatures. J. Build. Eng. 2024, 91, 109752. [Google Scholar] [CrossRef]
  14. Zhou, Z.; Wang, Y.; Zhai, X.; Zhou, H. Compressive Mechanical Behaviors of Q235B Steel over a Wide Range of Temperatures and Strain Rates. Int. J. Impact Eng. 2025, 198, 105222. [Google Scholar] [CrossRef]
  15. Tian, Y.; Wang, R.; Zhao, H.; Zhang, H.; Lam, D.; Zhu, Y. Dynamic Compressive Behaviours of Stainless-Clad Bimetallic Steel under High Temperatures. J. Constr. Steel Res. 2023, 210, 108055. [Google Scholar] [CrossRef]
  16. Sun, Y.; Wang, X.; Ji, C.; Gao, F.; Yu, Y.; Cheng, L.; Zhang, K.; Jiang, T.; Wu, J. Damage Effect of Steel Circular Tube Subjected to Fire and Blast. J. Constr. Steel Res. 2021, 176, 106389. [Google Scholar] [CrossRef]
  17. Al-Thairy, H. Prediction of Behaviour and Failure of Steel Columns Subjected to Blast Followed by Fire Induced by Explosion. Int. J. Steel Struct. 2021, 21, 1431–1453. [Google Scholar] [CrossRef]
  18. Xi, F. Large Deflection Response of Restrained Steel Beams under Fire and Explosion Loads. Springerplus 2016, 5, 752. [Google Scholar] [CrossRef]
  19. Ji, S.-H.; Wang, W.-D.; Shi, Y.-L.; Wang, J.-X. Numerical Analysis on Fire Behaviour of Concrete-Filled Steel Tubular Columns after Lateral Impact. Eng. Struct. 2025, 327, 119632. [Google Scholar] [CrossRef]
  20. Hu, W.W.; Wang, R.; Zhao, H.; Zhang, L. Study on explosion-resistance performance of concrete-filled steel tubular columns considering the influence of elevated temperatures. Explos. Shock Waves 2021, 11, 58–69. [Google Scholar]
  21. Li, X.; Zhang, R.; Jin, L.; Du, X. Influence of Fire Scenario on Dynamic Behavior of RC Columns in Structures: A Refined Simulation. Structures 2023, 48, 108–124. [Google Scholar] [CrossRef]
  22. Roy, T.; Matsagar, V. A Probabilistic Framework for Assessment of Reinforced Concrete Wall Panel under Cascaded Post-Blast Fire Scenario. J. Build. Eng. 2022, 45, 103506. [Google Scholar] [CrossRef]
  23. Li, H.; Chen, W.; Hao, H. Performance of Reinforced Concrete Slabs Subjected to Simultaneous Fire and Blast Loads. Eng. Struct. 2024, 311, 118133. [Google Scholar] [CrossRef]
  24. BS EN 1993-1-2:2005; Eurocode 3: Design of Steel Structures—Part 1–2: General Rules—Structural Fire Design. British Standards Institution: London, UK; European Committee for Standardization: Bruxelles, Belgium, 2005.
  25. Lie, T.T.; Irwin, R.J. Fire Resistance of Rectangular Steel Columns Filled with Bar-Reinforced Concrete. J. Struct. Eng. 1995, 121, 797–805. [Google Scholar] [CrossRef]
  26. Lie, T.T. Fire Resistance of Circular Steel Columns Filled with Bar-Reinforced Concrete. J. Struct. Eng. 1994, 120, 1489–1509. [Google Scholar] [CrossRef]
  27. Ding, F.X.; Yu, Z.W.; Wen, H.L. Experimental Research on Mechanical of Q235 Steel after High Temperature Treatment. J. Build. Mater. 2006, 9, 245–249. [Google Scholar]
  28. Guo, Z.H.; Li, W. Experimental study on strength and deformation properties of concrete under high temperature. J. Build. Struct. 1993, 14, 8–16. [Google Scholar]
  29. Hong, S.; Varma, A.H. Analytical Modeling of the Standard Fire Behavior of Loaded CFT Columns. J. Constr. Steel Res. 2009, 65, 54–69. [Google Scholar] [CrossRef]
  30. Zhu, B.L.; Lu, Z.D.; Hu, K.X. Constitutive relationship between concrete and steel reinforcement under high temperature (fire). Sichuan Build. Sci. 1990, 16, 37–43. [Google Scholar]
  31. Thomas, R.J.; Sorensen, A.D. Review of Strain Rate Effects for UHPC in Tension. Constr. Build. Mater. 2017, 153, 846–856. [Google Scholar] [CrossRef]
  32. Bischoff, P.H.; Perry, S.H. Compressive Behaviour of Concrete at High Strain Rates. Mater. Struct. 1991, 24, 425–450. [Google Scholar] [CrossRef]
  33. Qian, K.; Tan, X.Y.; Li, Z.; Yu, X.H. Impact performance and the influence factors of reinforced concrete slabs under high temperatures. Eng. Mech. 2023, 40, 132–143+154. [Google Scholar]
  34. Abdul Razak, N.S.; Alias, A.; Mohsan, N.M.; Masjuki, S.A. The Influence of Cowper-Symonds Coefficients on the Response of Stiffened Steel Plates Subjected to Close-In Blast Loads. Key Eng. Mater. 2022, 912, 171–184. [Google Scholar] [CrossRef]
  35. Comité Euro-International du Béton (CEB); the Federation Internationale de la Précontrainte (FIP). CEB-FIP Model Code 1990: Design Code; Thomas Telford Ltd.: London, UK, 1993. [Google Scholar]
  36. Yang, G.; Wang, G.; Lu, W.; Wu, L.; Yan, P.; Chen, M. Experimental and Numerical Study of Damage Characteristics of RC Slabs Subjected to Air and Underwater Contact Explosions. Mar. Struct. 2019, 66, 242–257. [Google Scholar] [CrossRef]
  37. Wang, X.H.; Chu, X.S.; Feng, G. Numerical simulation of sphere’s water-entry based on Coupled Eulerian-Lagrangian method. J. Ship Mech. 2018, 22, 838–844. [Google Scholar]
  38. Wang, B.; Dong, Y.L. Experimental research of four—Edge simple support two—Way reinforced concrete slab under fire. J. Build. Struct. 2009, 30, 23–33. [Google Scholar]
  39. Wang, B.; Dong, Y.L. Experimental study of two-way reinforced concrete slabs under fire. China Civ. Eng. J. 2010, 43, 53–62. [Google Scholar]
  40. Bolina, F.L.; Fachinelli, E.G.; Pachla, E.C.; Centeno, F.R. A Critical Analysis of the Influence of Architecture on the Temperature Field of RC Structures Subjected to Fire Using CFD and FEA Models. Appl. Therm. Eng. 2024, 247, 123086. [Google Scholar] [CrossRef]
  41. Wang, W.; Zhang, D.; Lu, F.Y. Near-field blast resistance of square reinforced concrete slabs. Explos. Shock Waves 2012, 32, 251–258. [Google Scholar]
  42. Wang, W. Study on Damage Effects and Assessments Method of Reinforced Concrete Structural Members Under Blast Loading. Ph.D. Thesis, National University of Defense Technology, Changsha, China, 2012. [Google Scholar]
  43. Zhao, C.F.; He, K.C.; Lu, X. Analysis on the blast resistance of steel concrete composite slab. Explos. Shock Waves 2021, 41, 116–131. [Google Scholar]
  44. American Society of Civil Engineers. Blast Protection of Buildings; American Society of Civil Engineers: Reston, VA, USA, 2011; ISBN 9780784411889. [Google Scholar]
  45. Zhao, C.F.; Zhang, L.; Li, X.J. Damage damage and blast resistance of corrugated double steel plate concrete composite wall slabs under near-field explosion. Chin. J. High Press. Phys. 2024, 38, 88–104. [Google Scholar]
  46. Wang, Y.P.; Wang, W.; Yang, J.C.; Wang, J.H.; Wang, X. Blast resistance of steel plate/POZD composite structures under proximity airburst loading. Chin. J. High Press. Phys. 2023, 31, 74–85. [Google Scholar]
  47. Han, L.-H.; Yao, G.-H.; Tao, Z. Performance of Concrete-Filled Thin-Walled Steel Tubes under Pure Torsion. Thin-Walled Struct. 2007, 45, 24–36. [Google Scholar] [CrossRef]
  48. Yu, J.; Liu, F.Y.; Fang, Q. Distribution pattern and simplified model of blast load for building columns under near-field near-ground explosion. Explos. Shock Waves 2024, 41, 164–180. [Google Scholar]
Figure 1. Bilinear constitutive mechanics model of steel.
Buildings 15 01340 g001
Figure 2. Yield strength and elastic modulus reduction factor of steel at different temperature.
Buildings 15 01340 g002
Figure 3. Compressive stress–strain constitutive curve of concrete.
Buildings 15 01340 g003
Figure 4. Tensile stress–strain constitutive curve of concrete.
Buildings 15 01340 g004
Figure 5. Geometric dimensions and reinforcement of the RC slab (unit: mm).
Buildings 15 01340 g005
Figure 6. Layout diagram of measuring points of the RC slab: (a) layout diagram of the thermocouples; (b) distribution diagram of thermocouples along the thickness of the slab; and (c) layout of the out-of-plane differential displacement sensors (The “#” is the mark of the out-of-plane displacement measuring point).
Buildings 15 01340 g006
Figure 7. Comparison diagram of temperature curves: The ISO834 curve [5,6] is the standard temperature time curve.
Buildings 15 01340 g007
Figure 8. Overall view of the experiment.
Buildings 15 01340 g008
Figure 9. Comparison of experimental and numerical simulation results: (a) temperature time course curve and (b) displacement–time curve (The “#” is the mark of the out-of-plane displacement measuring point).
Buildings 15 01340 g009
Figure 10. Geometric dimensions of RC slab (unit: mm).
Buildings 15 01340 g010
Figure 11. Displacement–time history curve.
Buildings 15 01340 g011
Figure 12. Geometry and cross-sectional dimensions of a SCS slab (unit: mm).
Buildings 15 01340 g012
Figure 13. Schematic diagram of the CEL explosion algorithm.
Buildings 15 01340 g013
Figure 14. SCS slab meshing diagram.
Buildings 15 01340 g014
Figure 15. Air domain meshing diagram.
Buildings 15 01340 g015
Figure 16. Temperature–time course curve: The ISO834 curve [5,6] is the standard temperature time curve.
Buildings 15 01340 g016
Figure 17. Temperature–thickness variation curve.
Buildings 15 01340 g017
Figure 18. Explosion shock wave propagation process.
Buildings 15 01340 g018
Figure 19. Overpressure time course figure.
Buildings 15 01340 g019
Figure 20. Equivalent plastic strain diagrams of SCS slab at different fire temperatures.
Buildings 15 01340 g020aBuildings 15 01340 g020b
Figure 21. Damage pattern of concrete slab under different fire time.
Buildings 15 01340 g021
Figure 22. Time course curves of mid-span stresses in steel slab with different fire times: (a) back fire surface and (b) fire surface.
Buildings 15 01340 g022
Figure 23. Time course curves of mid-span stresses in concrete with different fire times: (a) back fire surface and (b) fire surface.
Buildings 15 01340 g023
Figure 24. Time course curves of mid-span displacements in steel slab with different fire times: (a) back fire surface and (b) fire surface.
Buildings 15 01340 g024
Figure 25. Time course curves of mid-span displacements in steel slab with same fire times: (a) 0 min; (b) 30 min; (c) 60 min; and (d) 90 min.
Buildings 15 01340 g025
Figure 26. Time course curves of mid-span velocities in steel slab with different fire times: (a) back fire surface; (b) fire surface.
Buildings 15 01340 g026
Figure 27. Time course curves of mid-span velocities in steel slab with same fire times: (a) 0 min; (b) 30 min; (c) 60 min; and (d) 90 min.
Buildings 15 01340 g027aBuildings 15 01340 g027b
Table 1. Material mechanical performance parameters.
MaterialModel
Number
Modulus of Elasticity
E/GPa
Compressive Strength fc/MPaYield Strength fy/MPaTensile Strength
ft/MPa
ConcreteC303020.6 2.06
Steel plateQ235200 235370
Welding nailA2-50200 210500
Table 2. Design parameters for working conditions.
Component NumberW/kgR/mZ/(m·kg−1/3)t/min
BF-0010.650.650
BF-3010.650.6530
BF-6010.650.6560
BF-9010.650.6590
Note: W is the explosive equivalent; R is the distance between the object and the center of the explosion; Z is the proportional distance; and t is the time under fire.
Disclaimer/Publisher’s Note: The statements, opinions and data contained in all publications are solely those of the individual author(s) and contributor(s) and not of MDPI and/or the editor(s). MDPI and/or the editor(s) disclaim responsibility for any injury to people or property resulting from any ideas, methods, instructions or products referred to in the content.

