Article

Coupled Vibration Mathematical Model of Special-Shaped Column Structure Considering Ground Rotation Effects

1
Institute of Equipment Management and Support, Chinese People’s Armed Police Force Engineering University, Xi’an 710086, China
2
School of Civil Engineering, Xi’an University of Architecture and Technology, Xi’an 710055, China
*
Author to whom correspondence should be addressed.
Buildings 2025, 15(8), 1300; https://doi.org/10.3390/buildings15081300
Submission received: 18 March 2025 / Revised: 8 April 2025 / Accepted: 12 April 2025 / Published: 15 April 2025
(This article belongs to the Section Building Structures)

Abstract

The establishment of a linear seismic response analysis model that considers ground rotation effects and eccentric torsion informed the investigation of the linear response characteristics of coupled lateral–torsional vibration, considering eccentricity and ground rotation, after which the lateral–torsional coupling linear response pattern of special-shaped column structures is examined. The results show that the torsion angle of a floor is equal to the sum of the interlayer torsion angle caused by eccentric torsion and the pure torsion angle caused by ground rotation, respectively. The natural vibration frequency of the structure considering ground rotation effects is a function of relative eccentricity; the period ratio of translation to torsion caused by ground rotation; and the period ratio of translation to torsion when considering only eccentric torsion. When the translation to torsion period ratio, considering eccentric torsion, is greater than 1.0, the torsional amplitude increases remarkably, but the first-order participation mode is considerably higher under the same conditions. The natural vibration characteristics, translational response, torsional response, and seismic force distribution are obtained for special-shaped columns by conducting the shaking table test on steel-reinforced concrete (SRC) frame structures. After comparative analysis, the maximum ratio of the maximum torsional displacement of the bottom layer of the structure to the horizontal displacement in the X direction is 0.0007. The maximum ratio of the base shear force to the theoretical base shear force of the structure without considering coupling is 0.93. The maximum ratio of the measured shear force of the special-shaped column to the theoretical shear force without considering coupling is 0.65. This indicates that ground rotation has a significant amplification effect on structural response. The research results provide a reference for the seismic design of special-shaped column structures.

1. Introduction

Due to the good function and practicability of special-shaped column structures, the mechanical properties and design methods of special-shaped column structures have been extensively investigated over the past few years, and many scholars have conducted in-depth research on the seismic performance of special-shaped column structures (Shetty et al., 2019; Patel 2020; Zheng et al., 2024; Salah et al., 2022; Liu et al., 2021; Guo et al., 2023; Liang et al., 2023; Jiang et al., 2024; Tao et al., 2024) [1,2,3,4,5,6,7,8,9]. However, for special-shaped columns with cross-shaped, T-shaped, and L-shaped asymmetric sections, the column will bend while twisting when the horizontal load acts on the centroid axis of the asymmetric axis. When the structure is subjected to eccentric torsion, the special-shaped columns bear the torque distributed by the floor, as well as the torque generated by their own torsion. Experimental studies have demonstrated that the torsional phenomenon of special-shaped column structures is more pronounced under multidimensional earthquake conditions, with even axially symmetric special-shaped column structures experiencing torque (Zhang and Far 2021; Li et al., 2023; Sunagar et al., 2021; Wang et al., 2021; Ismail 2020) [10,11,12,13,14]. This underscores that the torsional challenges of special-shaped column structures cannot be overlooked under specific dynamic conditions, such as earthquakes, where ground rotational components significantly amplify structural torsion. For the spatial frame structure with specially shaped columns, the factors affecting its seismic response are the same as those of general frame structures, including seismic components and intensity, structural vibration characteristics, eccentricity, strong column–weak beam failure mechanisms, etc. Due to the limitations of the architectural form, uncertainties in construction, and the influence of irregular cross-sections, the spatial frame structure with specially shaped columns inevitably exhibits eccentric characteristics. Under the multidimensional seismic action, including ground rotation components and planar vibration components, the structure will obviously experience multidimensional seismic responses with coupled translational and torsional motions (Kuang and Liu 2022; Hao 1997; Lai and He 2022; Wen et al., 2024) [15,16,17,18]. The structural engineers are obviously more concerned about the performance of this new structural system under such complex stress conditions, the response patterns at different stages, especially the torsional response patterns, and how they should conduct seismic design.
Consequently, it is imperative to investigate the torsional response behavior of special-shaped column structures influenced by both structural eccentricity and ground rotational components, providing theoretical guidance for the anti-torsion design of columns and structures. The torsional behavior of structures during seismic activity is primarily attributed to their inherent eccentricity and ground rotational components. The current approach to anti-torsion design accounts for rotational components stemming from seismic activity, construction, support disturbances, and accidental eccentricities during structure use, incorporating additional eccentricities due to the absence of precise measurements of ground rotational components. Torsional behaviors induced by structural eccentricity are determined through elastic analysis (Mao et al., 2022; Alam et al., 2023) [19,20]. Nevertheless, this analytical method neglects the coupled effect of ground rotational and translational components and the dynamic impacts on the structure, making it inadequate for predicting torsional outcomes and response patterns of structures under seismic action in practical scenarios.
Therefore, this study emphasizes and considers ground rotational components, applying vibration theory to develop an earthquake response analysis model amenable to analytical calculations. It establishes a methodology for analyzing combined translational and torsional vibrations and investigates the response patterns of structures under such combined vibrations. By simulating seismic response patterns on steel–concrete composite special-shaped column structures, the theoretical analysis results are contrasted to validate the response patterns and dynamic amplification effects of combined lateral–torsional vibrations. Ultimately, this research provides theoretical references for analyzing combined lateral–torsional vibrations in special-shaped column structures.

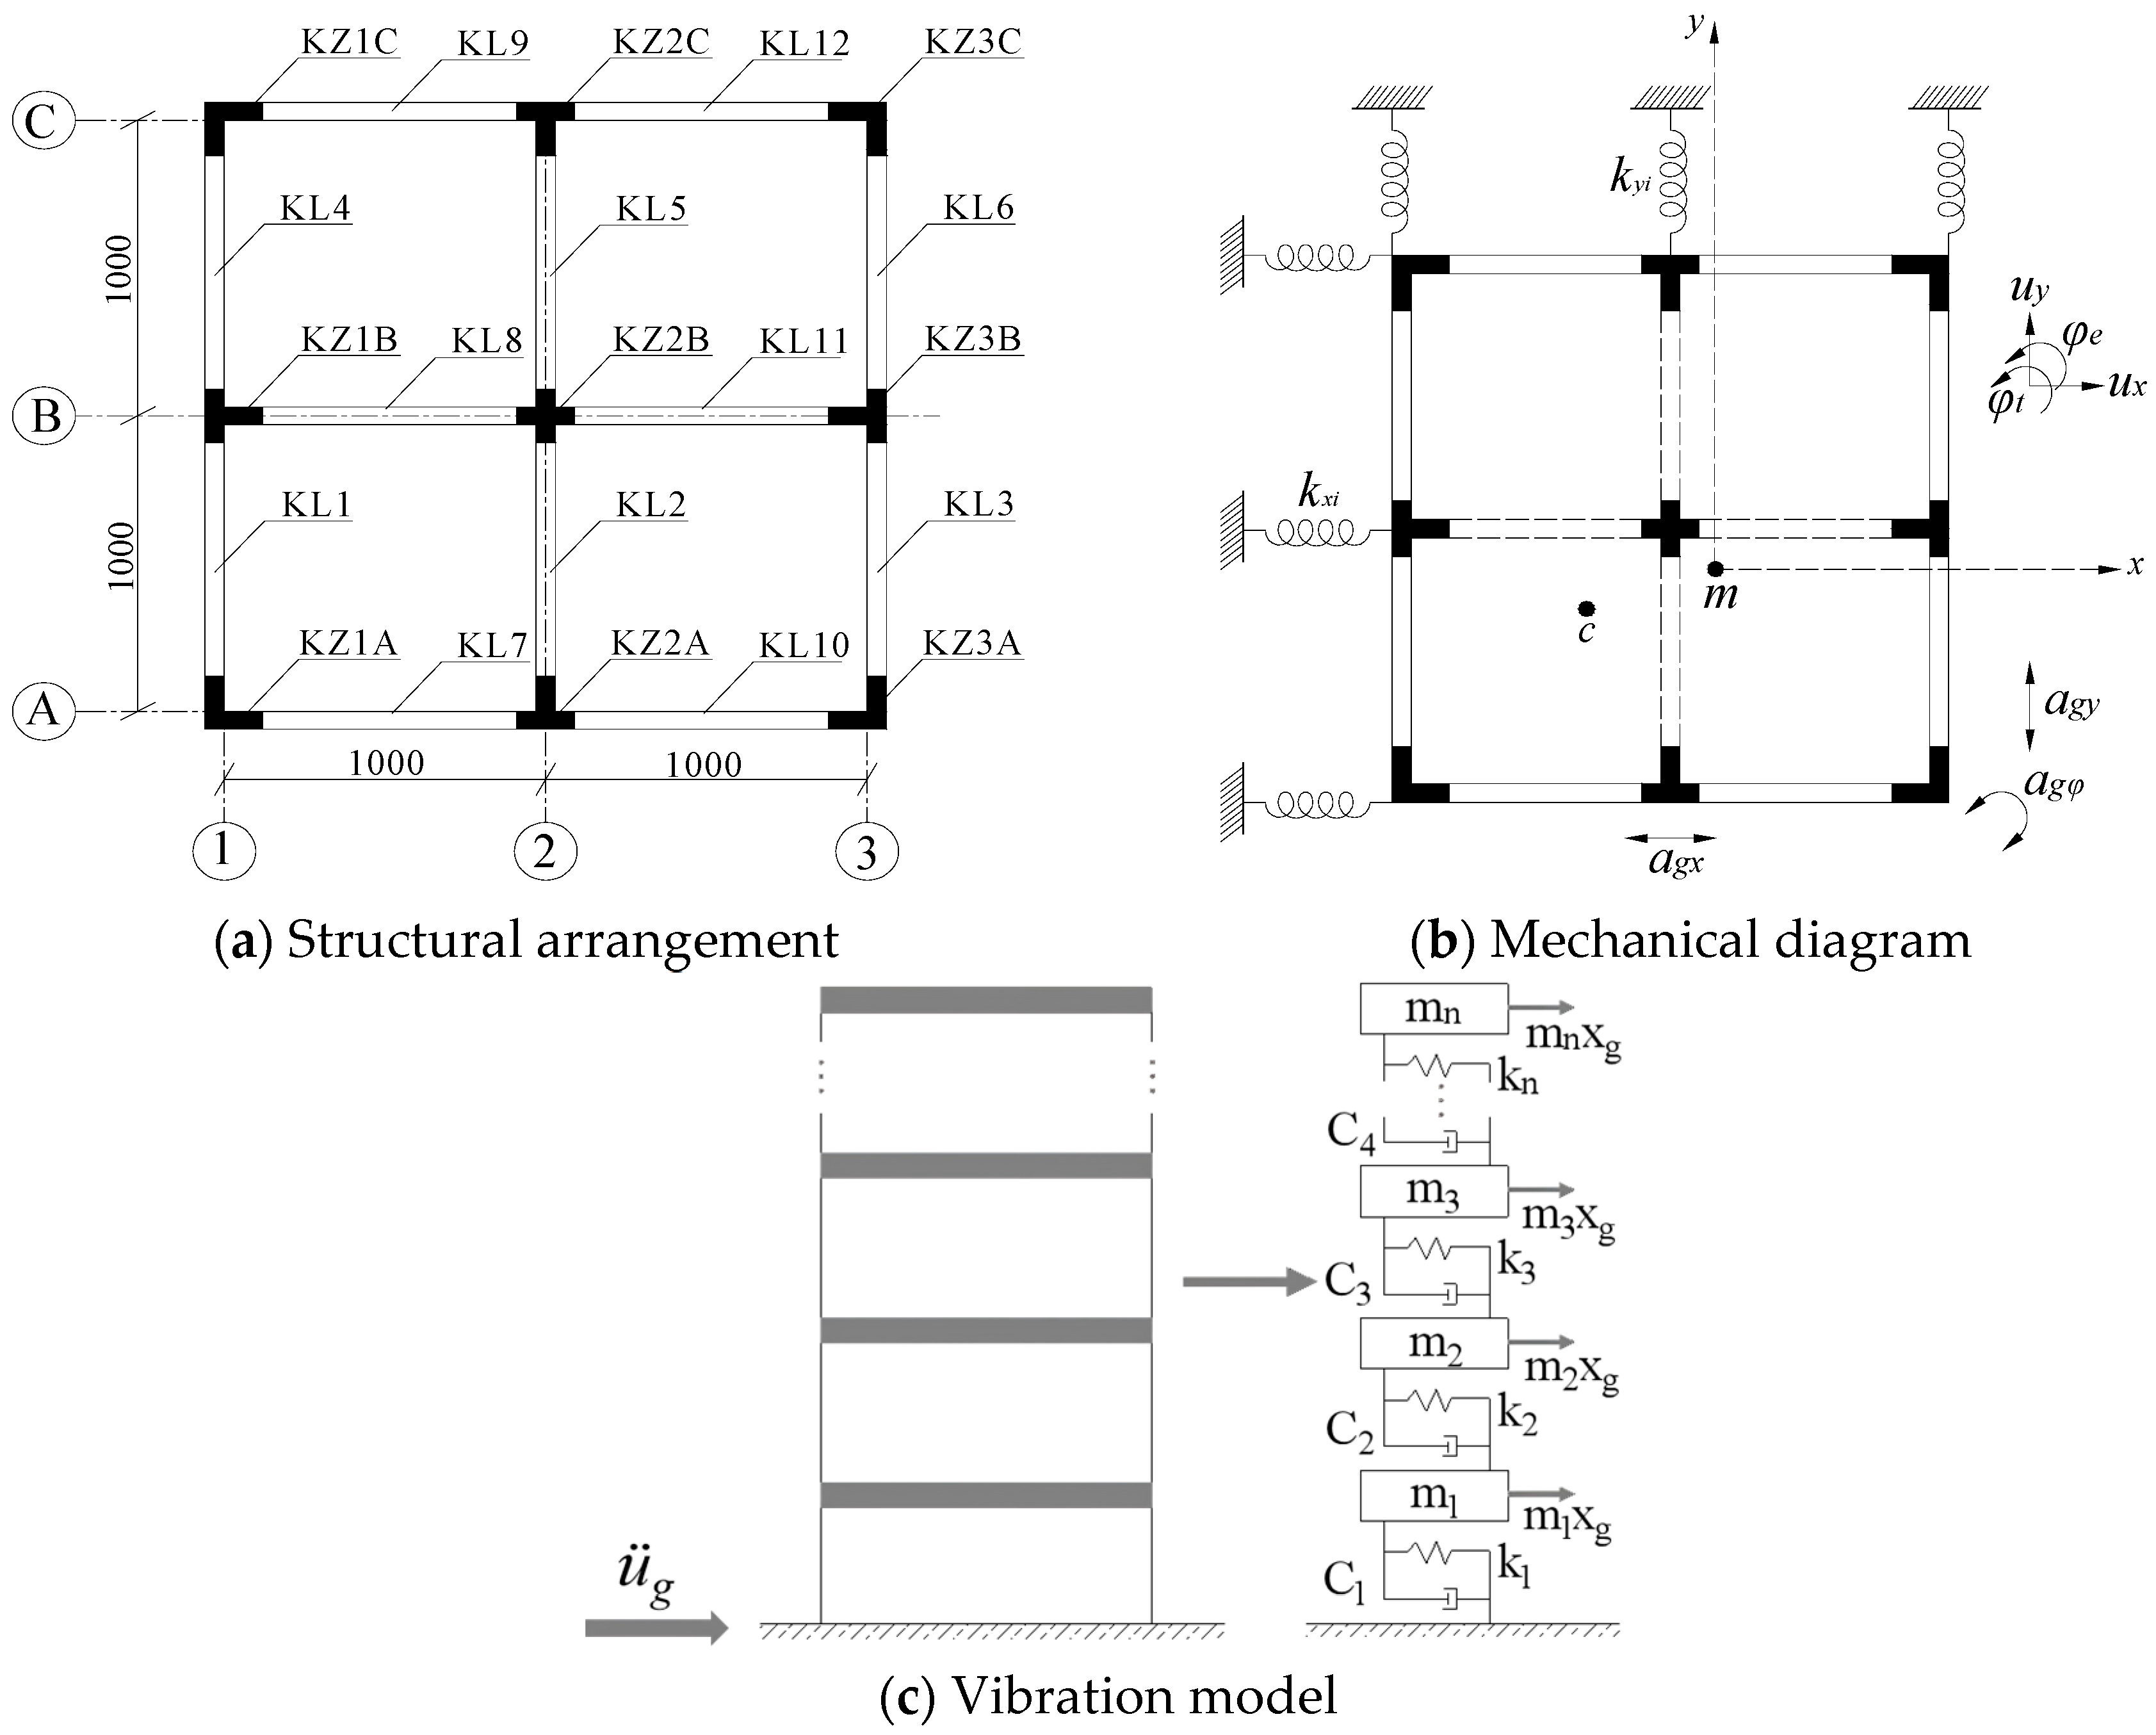
2. Seismic Response Analysis Model Considering Ground Rotational Components

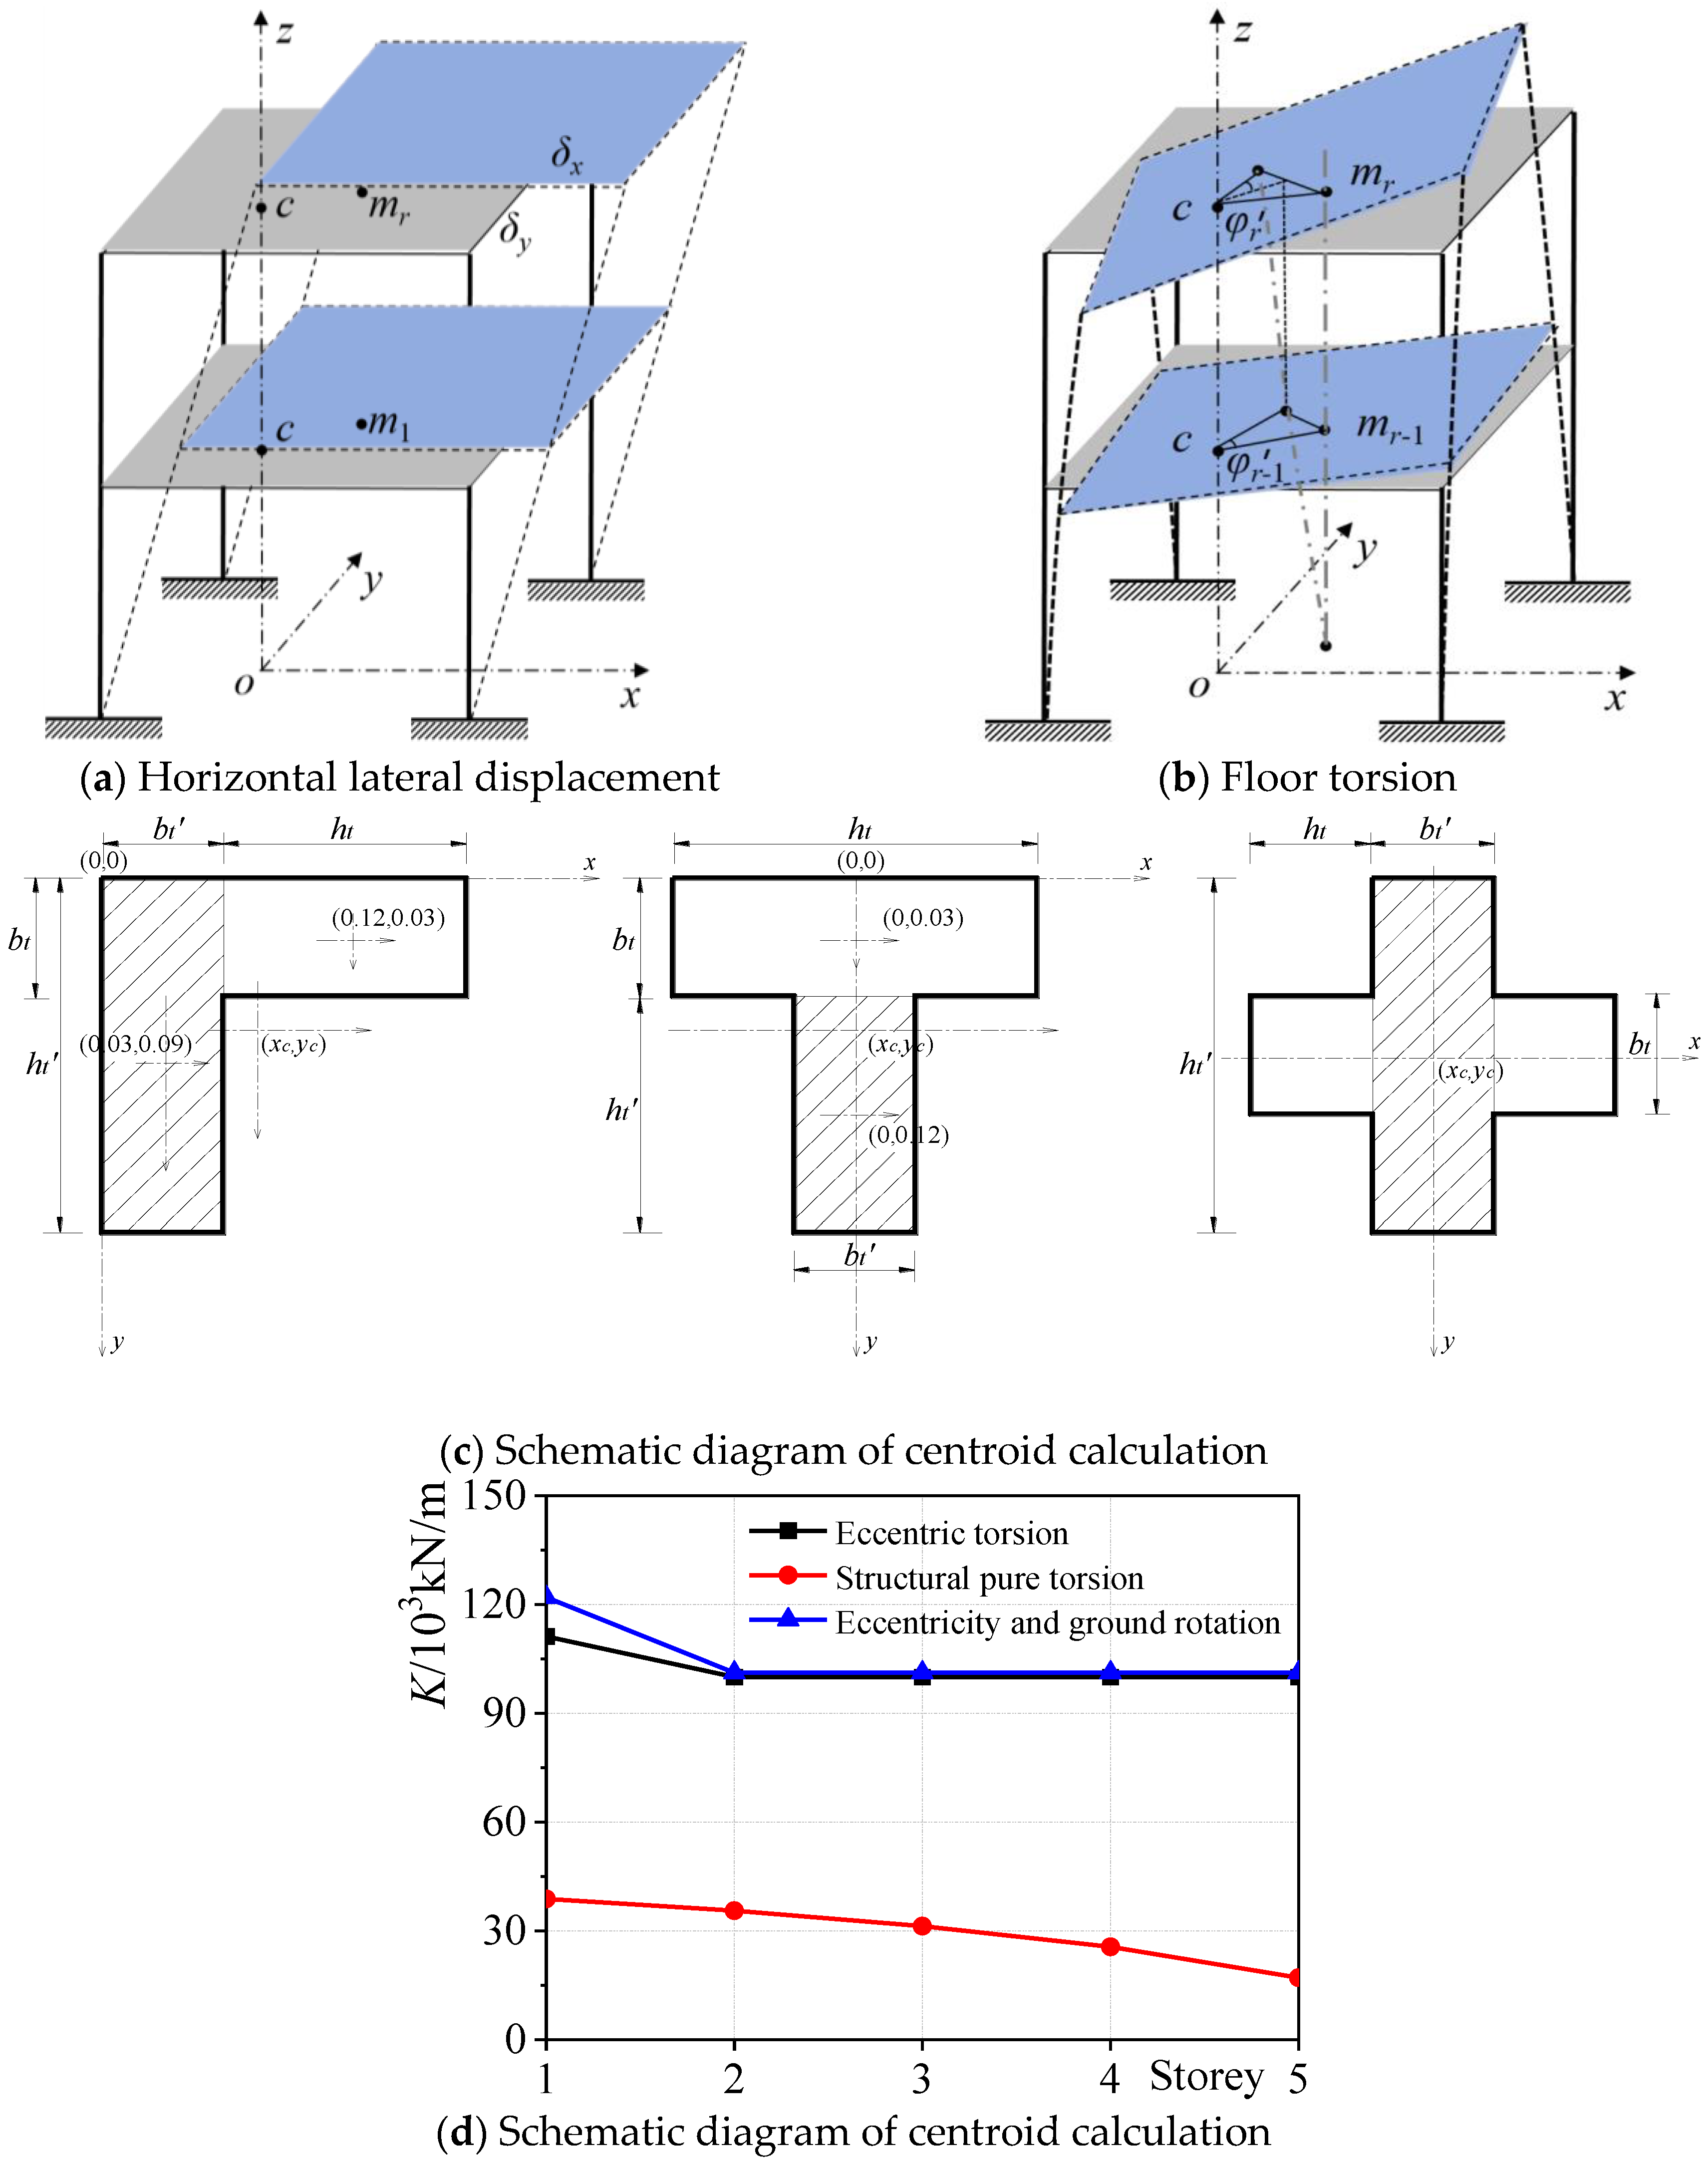
2.1. Dynamics Model Considering Ground Rotational Components

When establishing a dynamic model for a single-story eccentric structure that considers ground rotational components (Figure 1), the following assumptions are made. (1) The ground rotational components are presumed to encompass horizontal components in both the X and Y directions, as well as within the XY plane. The layout of the frame structure is shown in Figure 1, where KL represents the beams of the frame and KZ represents the columns of the frame. For example, 1B, 2C, etc., represent the position of the frame plane axis. (2) It is assumed that the horizontal ground rotational components solely induce pure torsion in the structure, whereas the horizontal displacement component triggers both structural displacement and eccentric torsion. The torsional response of the structure is bifurcated into eccentric torsion and pure torsion, both of which are induced by ground rotation. The displacement response of the structure is a composite of horizontal displacements triggered by ground vibration, along with both eccentric torsion and ground rotation. Furthermore, the seismic response pattern of the structure exhibits both translational and torsional characteristics. (3) For each floor, the torsional rotation angle remains consistent for both the inter-story torsional angle and the floor rotation angle, which are caused by eccentric torsion and pure torsion, respectively, as induced by ground rotation. (4) The rotation of each floor is constrained by equivalent springs and dampers. The seismic torsional moment revolves around the floor’s centroid and the resultant force stemming from the restoring and damping forces caused by seismic torsion acts through the floor’s centroid. The floor’s mass moment of inertia is simplified and is considered to act at the floor’s center of mass.
According to the aforementioned assumptions, the horizontal twist angle of the building floor is determined as follows:
φ = φ e + φ t ,
where φe represents the horizontal torsional angle induced by structural eccentricity and φt denotes the pure torsional angle generated by the horizontal ground rotational components of the structure.
The total torsional angle of the building floor is given by the following:
φ = φ + φ g ,
where φ′ represents the relative torsional angle of the building floor and φg denotes the ground torsional component.
The total displacement of the building floor is expressed as follows:
u x = u x + u g x ,   u y = u y + u g y ,
where ux and uy represent the relative horizontal displacements of the building floor in the X and Y directions with respect to the ground and ugx and ugy denote the horizontal displacement components of the ground in the X and Y directions, respectively.
The lateral force-resisting displacement components in the X and Y directions are expressed as follows:
u x i = u x y i φ   and   u y j = u y + x j φ ,
where yiφ and xiφ represent the displacements caused by the building floor rotation in the X and Y directions, respectively.
Considering the effects of ground rotation on a single-story structure, as illustrated in Figure 1, the dynamic model can be transformed into a motion equation for the structure under horizontal earthquake action, which is expressed as follows:
m u ¨ x + i k x i u x y i φ = m u ¨ g x m u ¨ y + j k y j u y + x j φ = m u ¨ g y J φ ¨ i k x i u x y i φ y i + j k y j u y + x j φ x j = J φ ¨ g ,
Expressing the form of component quantity
m 0 m 0 J u ¨ x u ¨ y φ ¨ + k x x 0 0 0 k y y 0 0 0 k φ φ u x u y φ = m 0 m 0 J u ¨ g x u ¨ g y φ ¨ g
m 0 m 0 J u ¨ x u ¨ y φ ¨ + k x x 0 e y k x x 0 k y y e x k y y e y k x x e x k y y k φ φ u x u y φ = m 0 m 0 J u ¨ g x u ¨ g y φ ¨ g
where m represents the total mass concentrated on the building floor; J denotes the building floor’s moment of inertia around the Z-axis; k x x = i k x i and k y y = j k y j are the translational stiffnesses of the building floor in the X and Y directions, respectively; k φ φ = k φ φ e + k φ φ t represents the torsional stiffness of the building floor; k φ φ e denotes the total torsional stiffness of the anti-lateral force members; and k φ φ t represents the torsional stiffness of the building floor caused by ground rotation.
The dynamic model for multi-story eccentric structures, when considering ground rotation, is assumed to be the same as that for single-story structures. The motion equation for multi-story eccentric structures, taking into account ground rotation, can be derived by referencing the motion equation for multi-story eccentric structures under horizontal earthquake action and the motion equation for single-story eccentric structures considering ground rotation. This equation is expressed as follows:
M u ¨ + C u ˙ + K u = M u ¨ g ,
where the characteristic matrix is
M = m 0 m 0 J m = m 1 0 m 2 0 m n J = J 1 0 J 2 0 J n K = K x x 0 K x φ 0 K y y K y φ K φ x K φ y K φ φ K x φ = K x x 11 e y 1 K x x 12 e y 2 K x x 1 n e y n K x x 21 e y 1 K x x 22 e y 2 K x x 2 n e y n K x x n 1 e y 1 K x x n 2 e y 2 K x x n n e y n ;
the displacement vector is
u = u x u y φ ,   u x = u 1 x u 2 x u n x ,   u y = u 1 y u 2 y u n y ,   φ = φ 1 φ 2 φ n ;
The input vector of seismic acceleration is u ¨ g = u ¨ g x , u ¨ g y , φ ¨ g T .
The calculation of characteristic parameters within the feature matrix remains the same for single-story structures subjected to multidimensional seismic conditions.

2.2. Determination of Floor Torsional Stiffness

The floor torsion of the model presented in Figure 2 illustrates torsion induced by the eccentricity of horizontal seismic forces, as well as pure floor torsion resulting from ground rotation. The floor torsion can be calculated as follows:
T r = M r g + M r t = GI t φ t + ( V y r e x r + V x r e y r ) ,
where the total torsion of the rth floor, denoted as M r t , is equal to the floor moment caused by the eccentric horizontal seismic force, Vr, plus the pure torsion caused by inertial effects, represented by M r g ; φt is the inter-story torsional rotation angle, φe is the eccentric torsional rotation angle, and φ is the total inter-story rotation angle, with positive values indicating counterclockwise rotation. Therefore, the total torsion equation for this floor is expressed as follows:
T r = s = r n T s ,
The shear force generated by the floor rotation can be expressed as follows:
V x i T = ( y i φ ) k x i   V y j T = ( x j φ ) k y j .
By considering moments around the floor centroid, Equation (6) is expressed based on torque equilibrium, T = 0 , as follows:
GI t ( φ t / h ) + ( V y r e x r + V x r e y r ) = ( V y j T x j ) ( V x i T y i ) + GI t ( φ e / h ) ,
where G represents the concrete shear modulus, GI t denotes the elastic torsional stiffness of the component, and It signifies the torsional moment of inertia of the component’s cross-section.
According to Equations (5) and (6), the torsional stiffness of the floor can be expressed as follows:
K r t = ( k y j x j 2 ) + ( k x i y i 2 ) + GI t / h ,
Equation (7) comprehensively considers inter-story torsion caused by ground rotation and eccentricity, as well as the lateral stiffness of structural elements. Moreso, it reflects the influence of the lateral force-resisting elements’ arrangement and floor height.
The section stiffness of special-shaped columns varies, depending on their cross-section, which directly affects the torsional stiffness of columns with different cross-sections. As shown in Figure 2c, according to the method of calculating the centroid of the composite section, the centroid coordinates (xc, yc) of the L-shaped, T-shaped, and decagonal limbs of the structural model are calculated as (0.066, 0.066), (0, 0.066), and (0, 0), respectively.
The formula for calculating the elastic torsional stiffness of the column is as follows:
k φ = G I t
where It is the polar moment of inertia of the column section and G is the shear modulus of the material.
The torque of each column in a pure torsion state can be calculated according to the following formula:
T j = G I t φ j h j
where G I t is the torsional stiffness of the column; φ j is the torsion angle of the column; and h j is the height of the column.
The comparison results of the floor torsional stiffness calculated by different torsion methods for the SRC irregular column spatial frame structure model are shown in Figure 2d. In the figure, it can be seen that the torsional stiffness of the floor where the structure undergoes pure torsion without considering eccentricity is much lower than the torsional stiffness of the floor under horizontal earthquake action and the torsional stiffness of the floor considering ground rotation components and eccentricity effects. The torsional stiffness of the floor considering the effects of eccentricity and ground rotation calculated according to Equation (7) is four times that of the pure torsion state. It can be approximately assumed that the torsional stiffness of the floor considering the effects of eccentricity and ground rotation is generated by pure torsion caused by structural eccentricity and ground rotation components.

3. Lateral–Torsional Vibration Mathematical Mode

3.1. Establishment of Lateral–Torsional Coupled Motion Equations

When considering only seismic action in the main vibration direction along the X-axis and eccentricity along the Y-axis, simplifying Equation (1) yields the plan-torsion-coupled motion equation in the Y direction for a single-story eccentric structure while also accounting for the influence of ground rotational components.
m 0 0 J u ¨ x φ ¨ + C u ˙ φ ˙ + K x e y K x e y K x K φ u φ = m 0 0 J u ¨ g x φ ¨ g ,
It is written in matrix form as m u ¨ + C u ˙ + K u = m u ¨ g , where u is the displacement response time history in the X direction of the building floors; u ¨ g x is the input seismic time history in the X direction; φ ¨ g is the ground rotational component; and K x = i = 1 n k x i , K x φ = K φ x = e y K x = e y i = 1 n k x i , and K φ are the combined torsional stiffness considering the ground rotation and eccentricity effects calculated according to the following:
k φ = k y j x j 2 + k x i y i 2 + G I t / h = K φ e + G I t / h = K φ e + K φ t .
The characteristic equation of this structure is solved as follows:
K ω 2 m = 0 .
The natural vibration frequency of the structure is obtained as follows:
ω 1 , 2 2 = ω x 2 + ω φ 2 2 ± ω x 2 ω φ 2 2 2 + e y 2 r 2 ω x 4 ,
where ωx and ωφ represent the natural vibration frequencies of the structure, considering the effects of ground rotation and eccentricity, respectively.
ω x = K x / m .
ω φ = K φ / J = K φ e + K φ t / J = ω φ e 2 + ω φ t 2 = ω φ e 2 + G I t / h / J .
The vibration modes corresponding to ω1 and ω2 are as follows:
The first vibration mode is ϕ 1 = ϕ 11 , ϕ 12 = e y ω x 2 , ω x 2 ω 1 2 T ;
The second vibration mode is
ϕ 2 = ϕ 21 , ϕ 22 = e y ω x 2 , ω x 2 ω 2 2 T .
By utilizing the orthogonality of vibration modes, the motion equations can be decoupled to obtain the participation coefficients of each vibration mode. Specifically, when a seismic force acts along the X direction and the structure is eccentric in the Y direction, the following applies:
γ x j = ϕ j T m I ϕ j T m ϕ j = m ϕ j 1 m ϕ j 1 2 + J ϕ j 2 2 = ϕ j 1 ϕ j 1 2 + r 2 ϕ j 2 2 ,
The maximum degree of freedom displacement i at mode j can be obtained by applying the principle of superposition, which is expressed as follows:
u j i = γ j ϕ j i S a j / ω j 2 .

3.2. Response Patterns of Lateral–Torsional Coupled Vibration

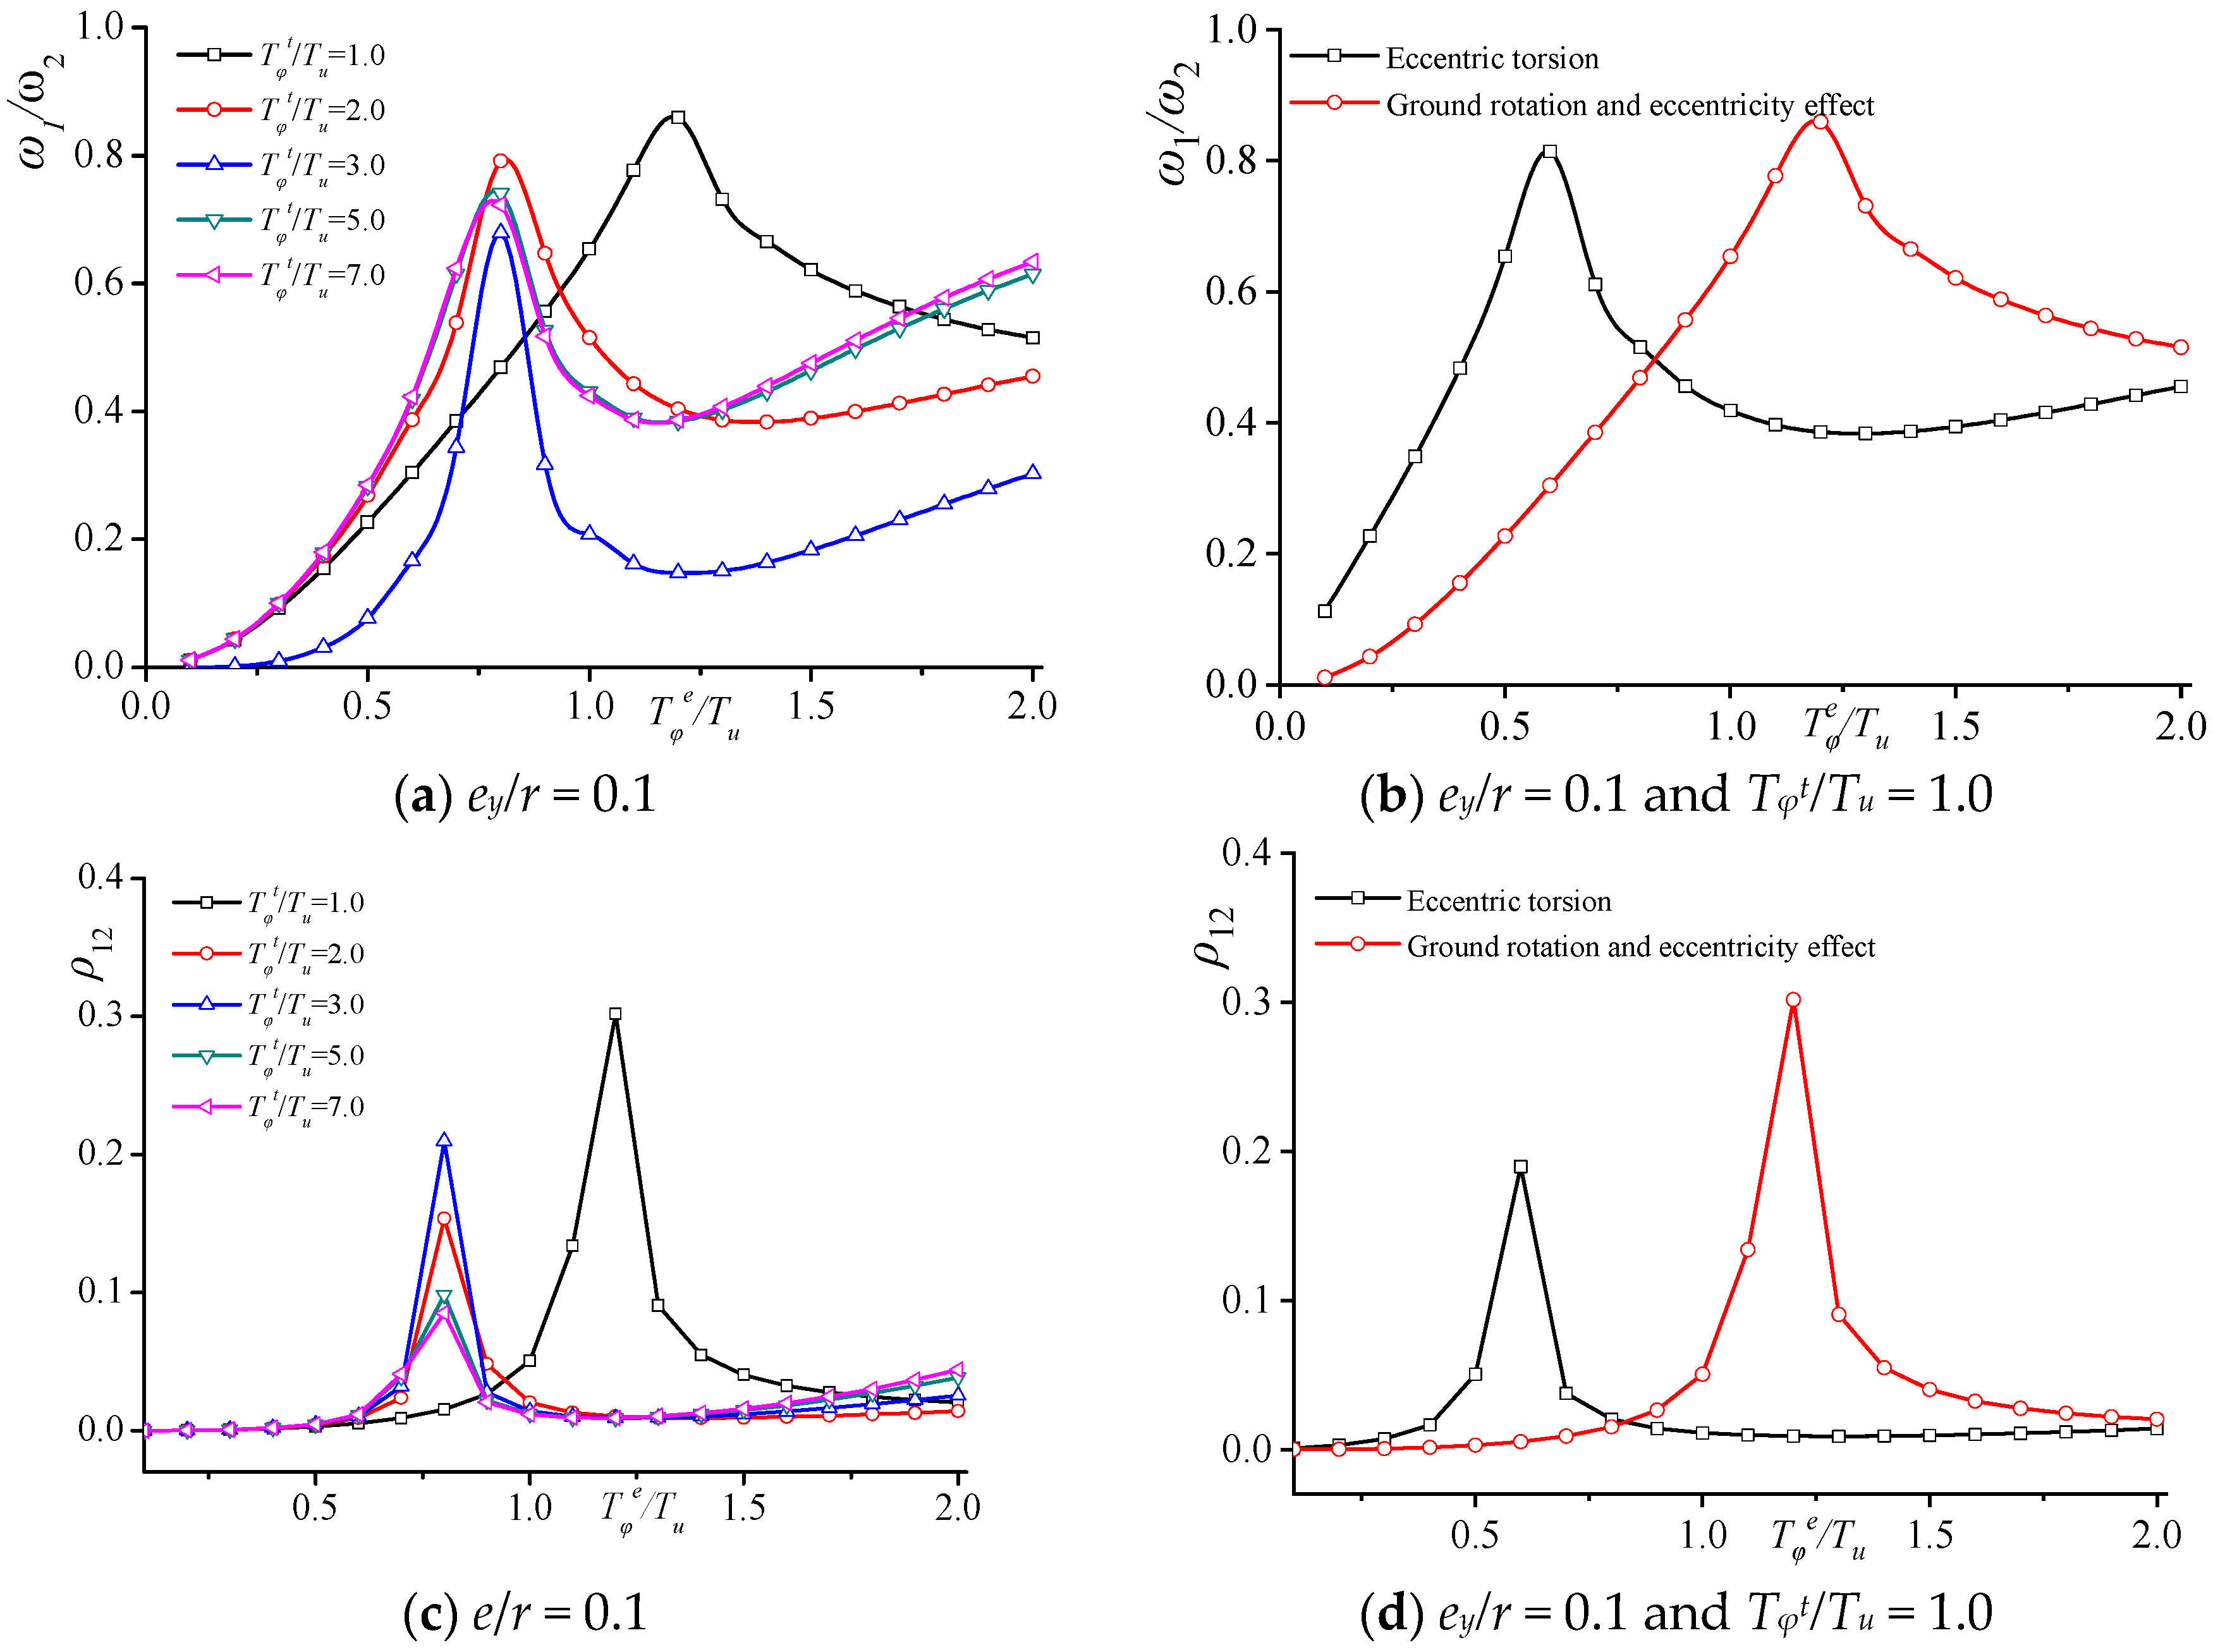
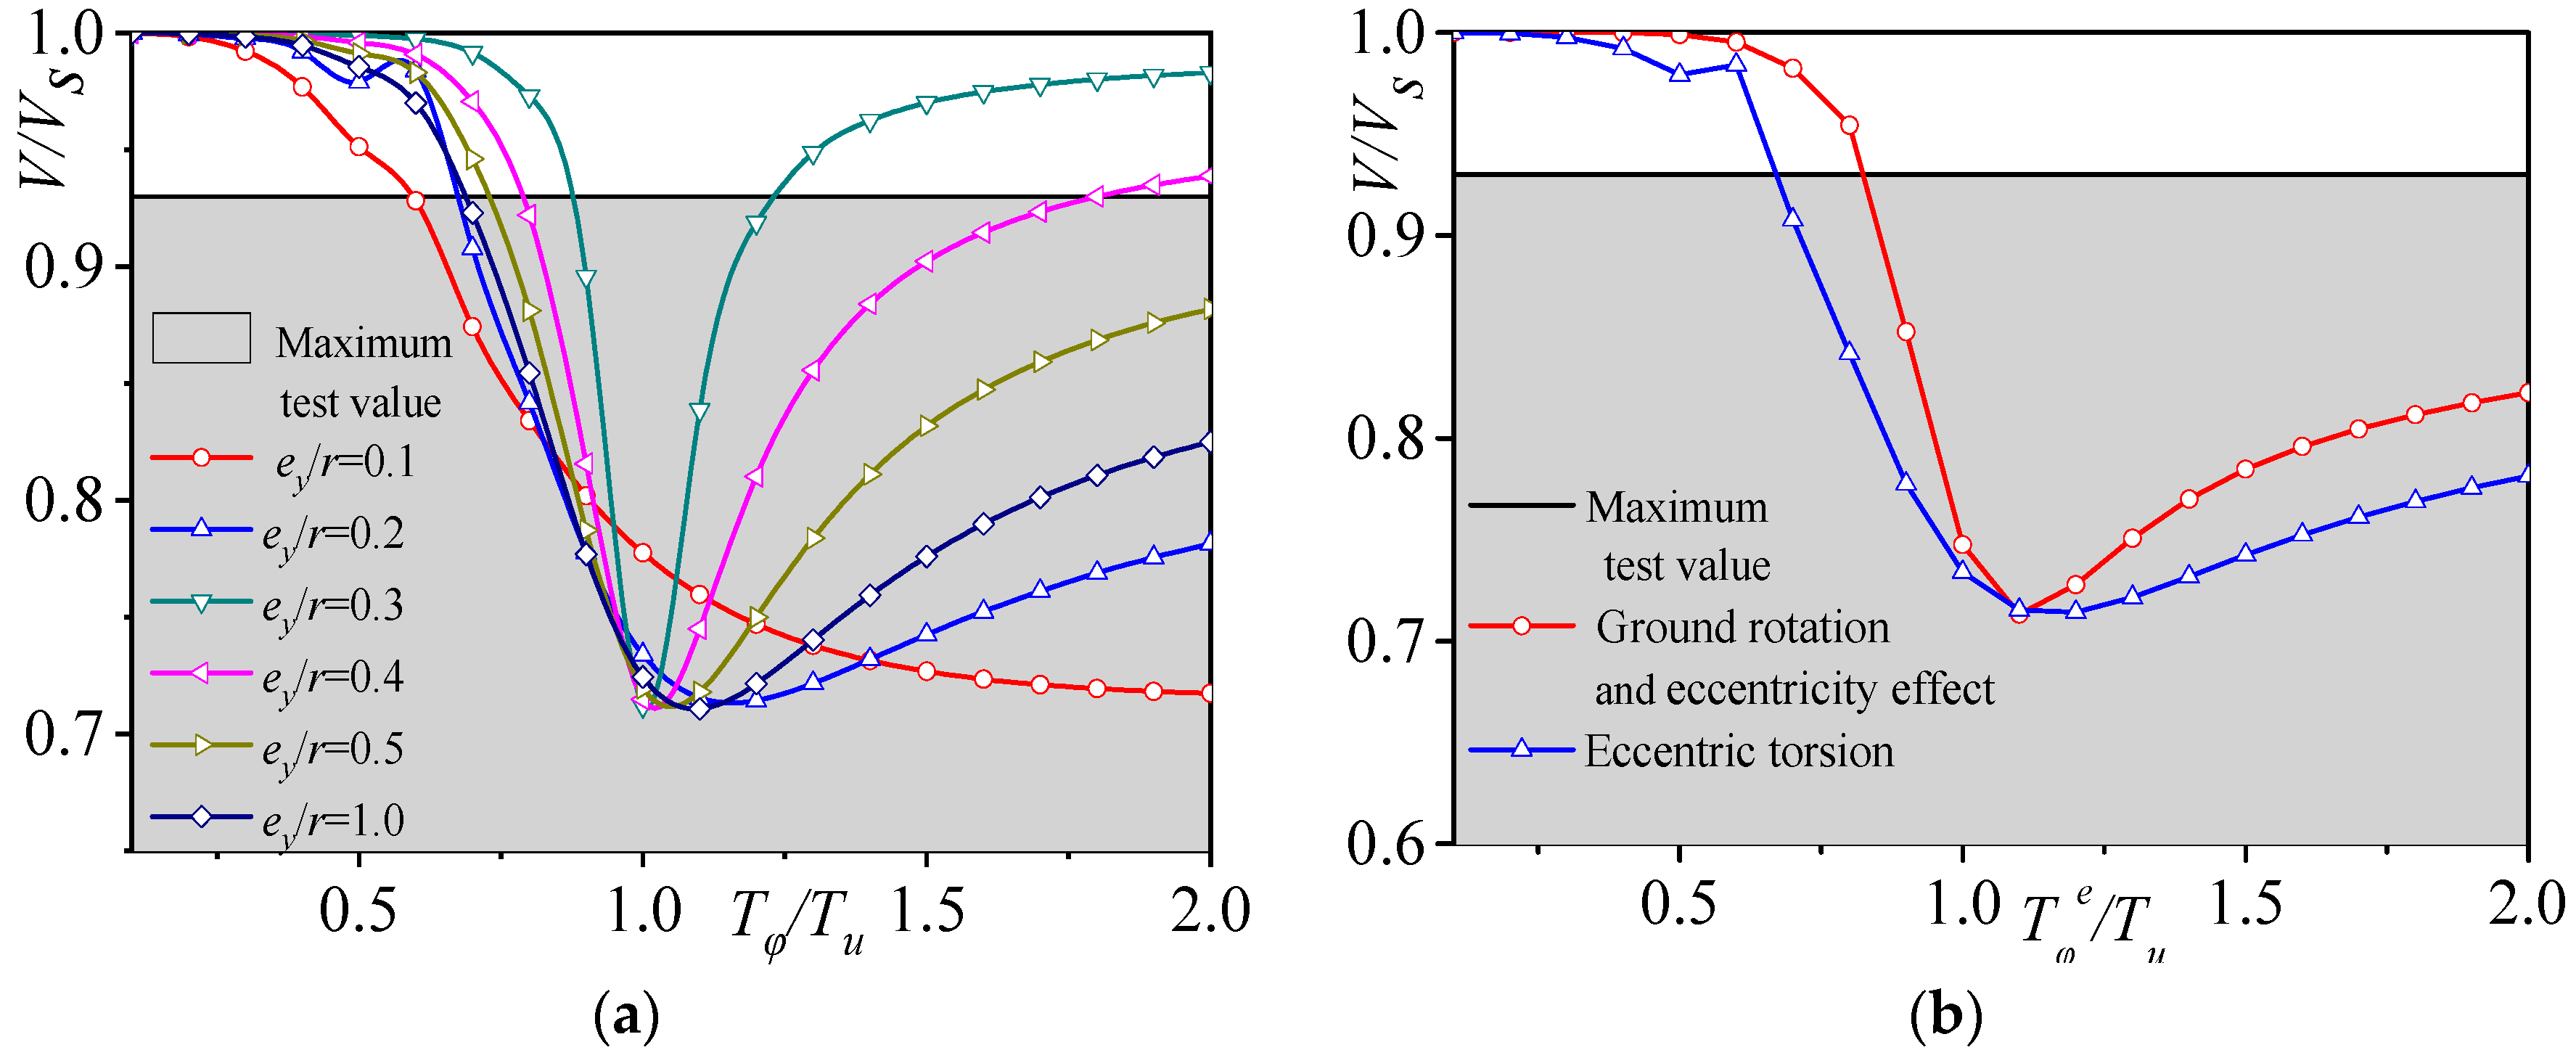
3.2.1. Natural Vibration Frequency Variation

Considering the ground rotation effect, Equation (9) presents the variation of the natural vibration frequency of a structure as a function of the relative eccentricity ey/r, the torsional to axial period ratio induced by ground rotation Tφt/Tu, and the torsional period ratio due to eccentric torsion Tφe/Tu. Figure 3 illustrates the natural vibration frequency variation ratio ω1/ω2 between the first- and second-order modes of the structure. The figure reveals that when solely considering the torsional period ratio with Tφe/Tu < 0.75, the ratio ω1/ω2 increases as the torsional period ratio Tφe/Tu increases. When Tφt/Tu ≥ 2.0 and Tφe/Tu is approximately 0.8, the ratio ω1/ω2 reaches a peak value. Following this, the ratio ω1/ω2 gradually decreases, and the rate of decrease diminishes as the torsional period ratio increases. Additionally, when Tφt/Tu ≤ 1.0 and Tφe/Tu = 1.25, the ratio ω1/ω2 also displays a distinct peak. This indicates that as Tφt/Tu continues to increase, the peak value of ω1/ω2 occurs earlier, and it tends to stabilize when Tφt/Tu ≥ 2.0.
By analyzing the coupling coefficient, it can be observed that the natural frequency ratio and relative eccentricity have an impact on the lateral–torsional coupling vibration response of the structure. The horizontal torsional coupling coefficient considering the influence of ground rotation is calculated according to the following formula:
ρ 12 = 0.02 ω 1 / ω 2 1.5 1 + ω 1 / ω 2 1 ω 1 / ω 2 2 + 0.01 ω 1 / ω 2
where
ω 1 2 ω 2 2 = ω x 2 + ω φ 2 2 + ω x 2 ω φ 2 2 2 + e y 2 r 2 ω x 4 / ω x 2 + ω φ 2 2 ω x 2 ω φ 2 2 2 + e y 2 r 2 ω x 4
= T φ / T u 2 + 1 + e y / r 2 T φ / T u 2 T φ / T u 2 + 1 + e y / r 2 T φ / T u 2 2 4 T φ / T u 2 T φ / T u 2 + 1 + e y / r 2 T φ / T u 2 + T φ / T u 2 + 1 + e y / r 2 T φ / T u 2 2 4 T φ / T u 2 ,
where T φ / T u is the ratio of the period of rotation considering the ground rotation component, which is expressed as follows:
T φ 2 / T u 2 = 1 / T u 2 / T φ e 2 + T u 2 / T φ t 2
where T φ e / T u is the non-coupled aspect ratio considering only the eccentricity effect and T φ t / T u is the ratio of the period of torsion caused by ground rotation.
The torsion of a structure includes torsion caused by eccentricity and pure torsion caused by ground rotation, while translational motion includes horizontal seismic displacement response and horizontal displacement caused by torsion. The degree of horizontal torsional coupling between its vibration modes is represented by the coupling correlation coefficient. According to Figure 3c,d, it can be seen that when the eccentricity ey/r is constant and the ratio of the horizontal to torsional period caused by ground rotation Tφt/Tu remains unchanged, the peak point of the horizontal to torsional coupling coefficient of the structure considering the influence of ground rotation is significantly delayed compared to the peak point considering only the eccentricity effect.

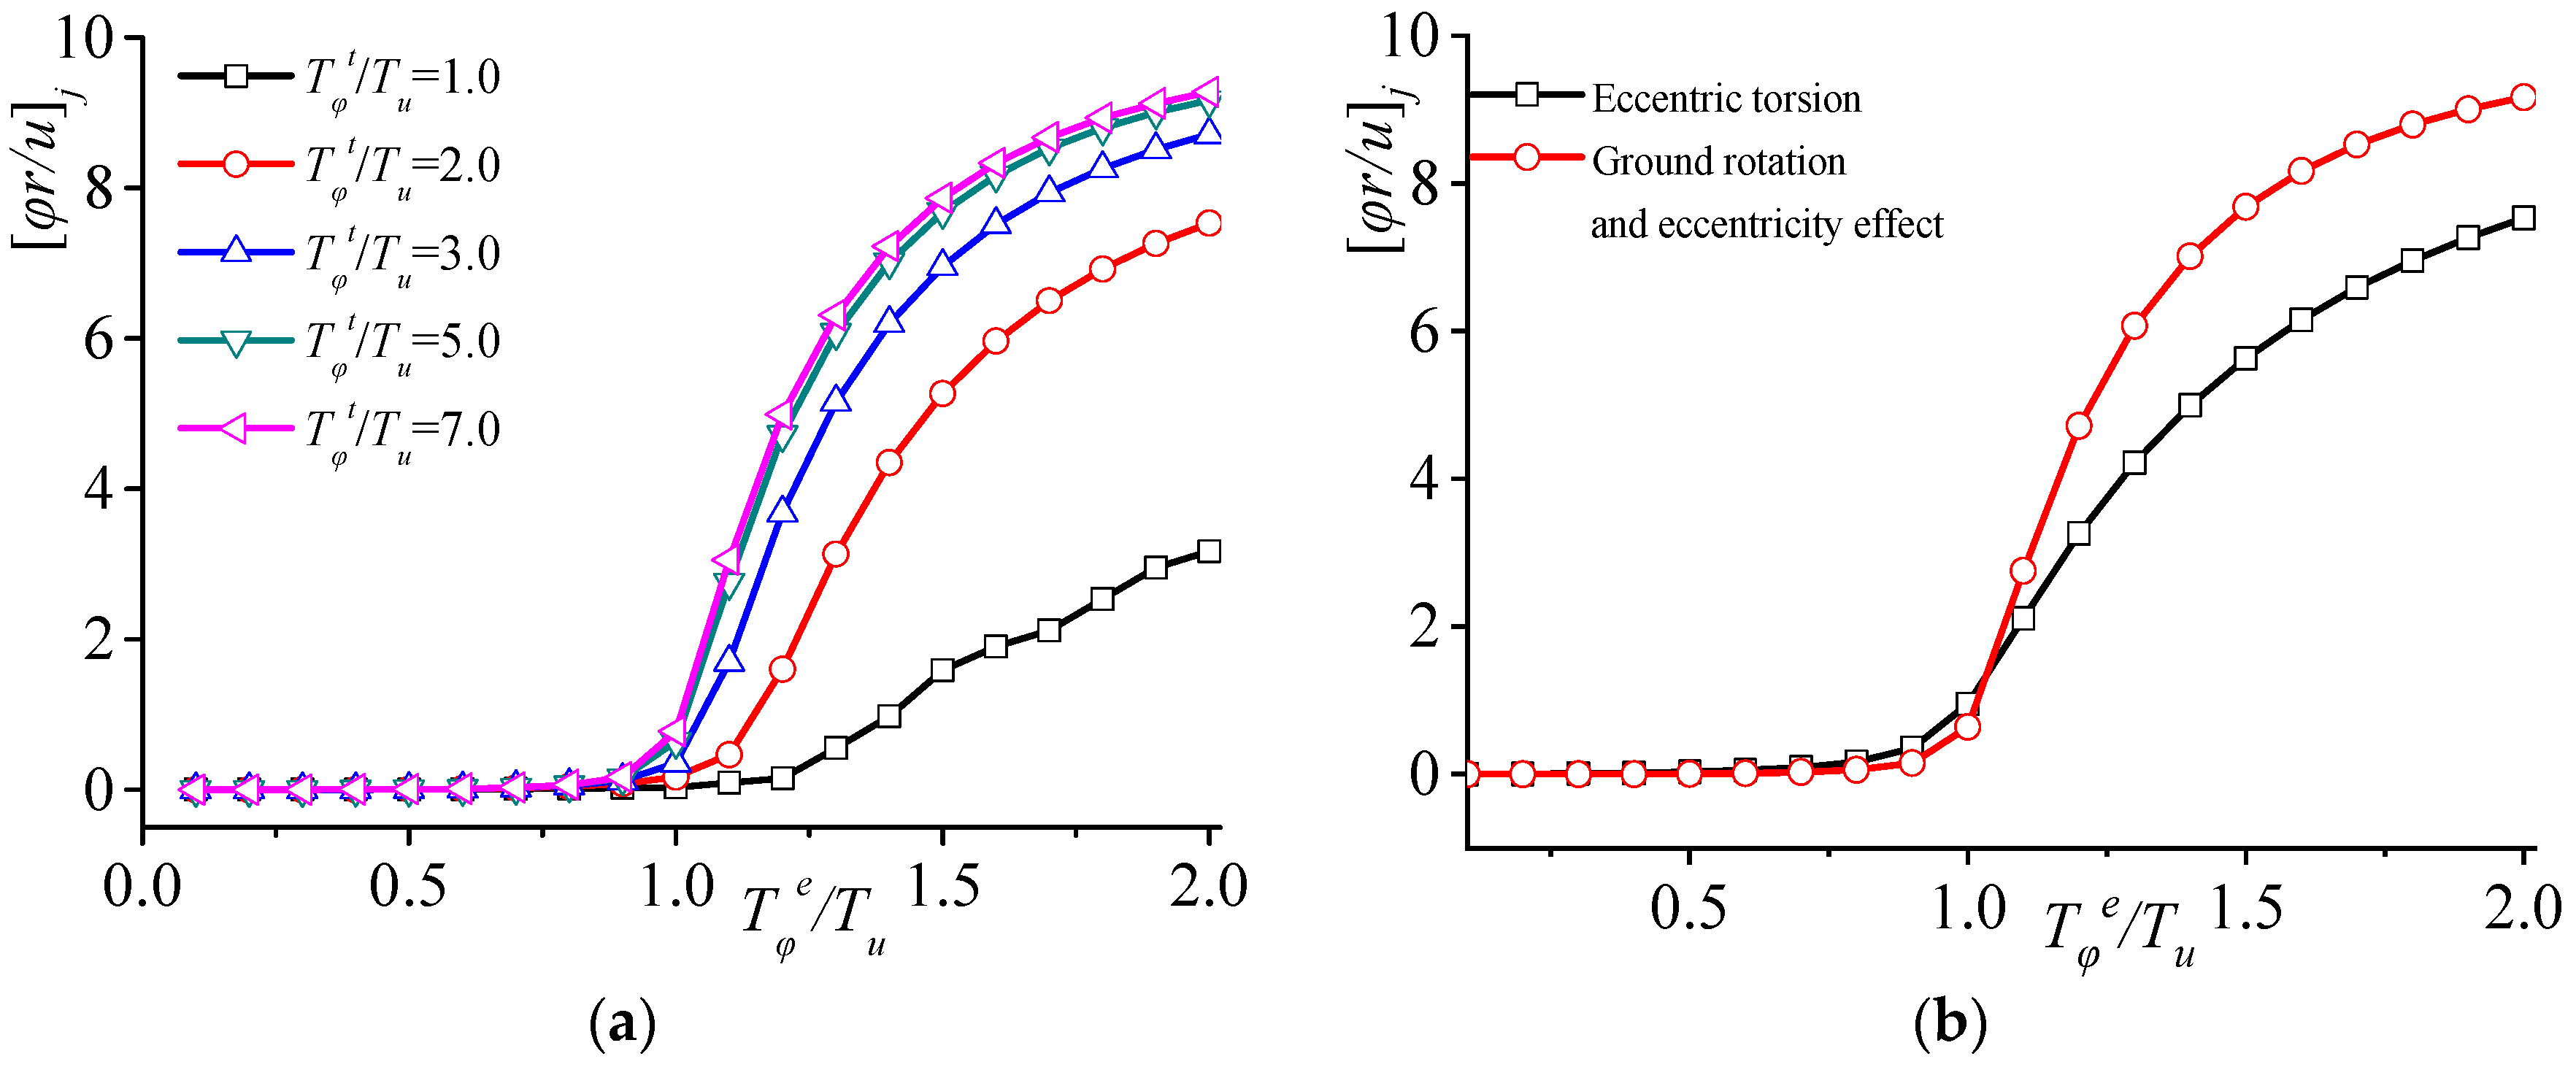
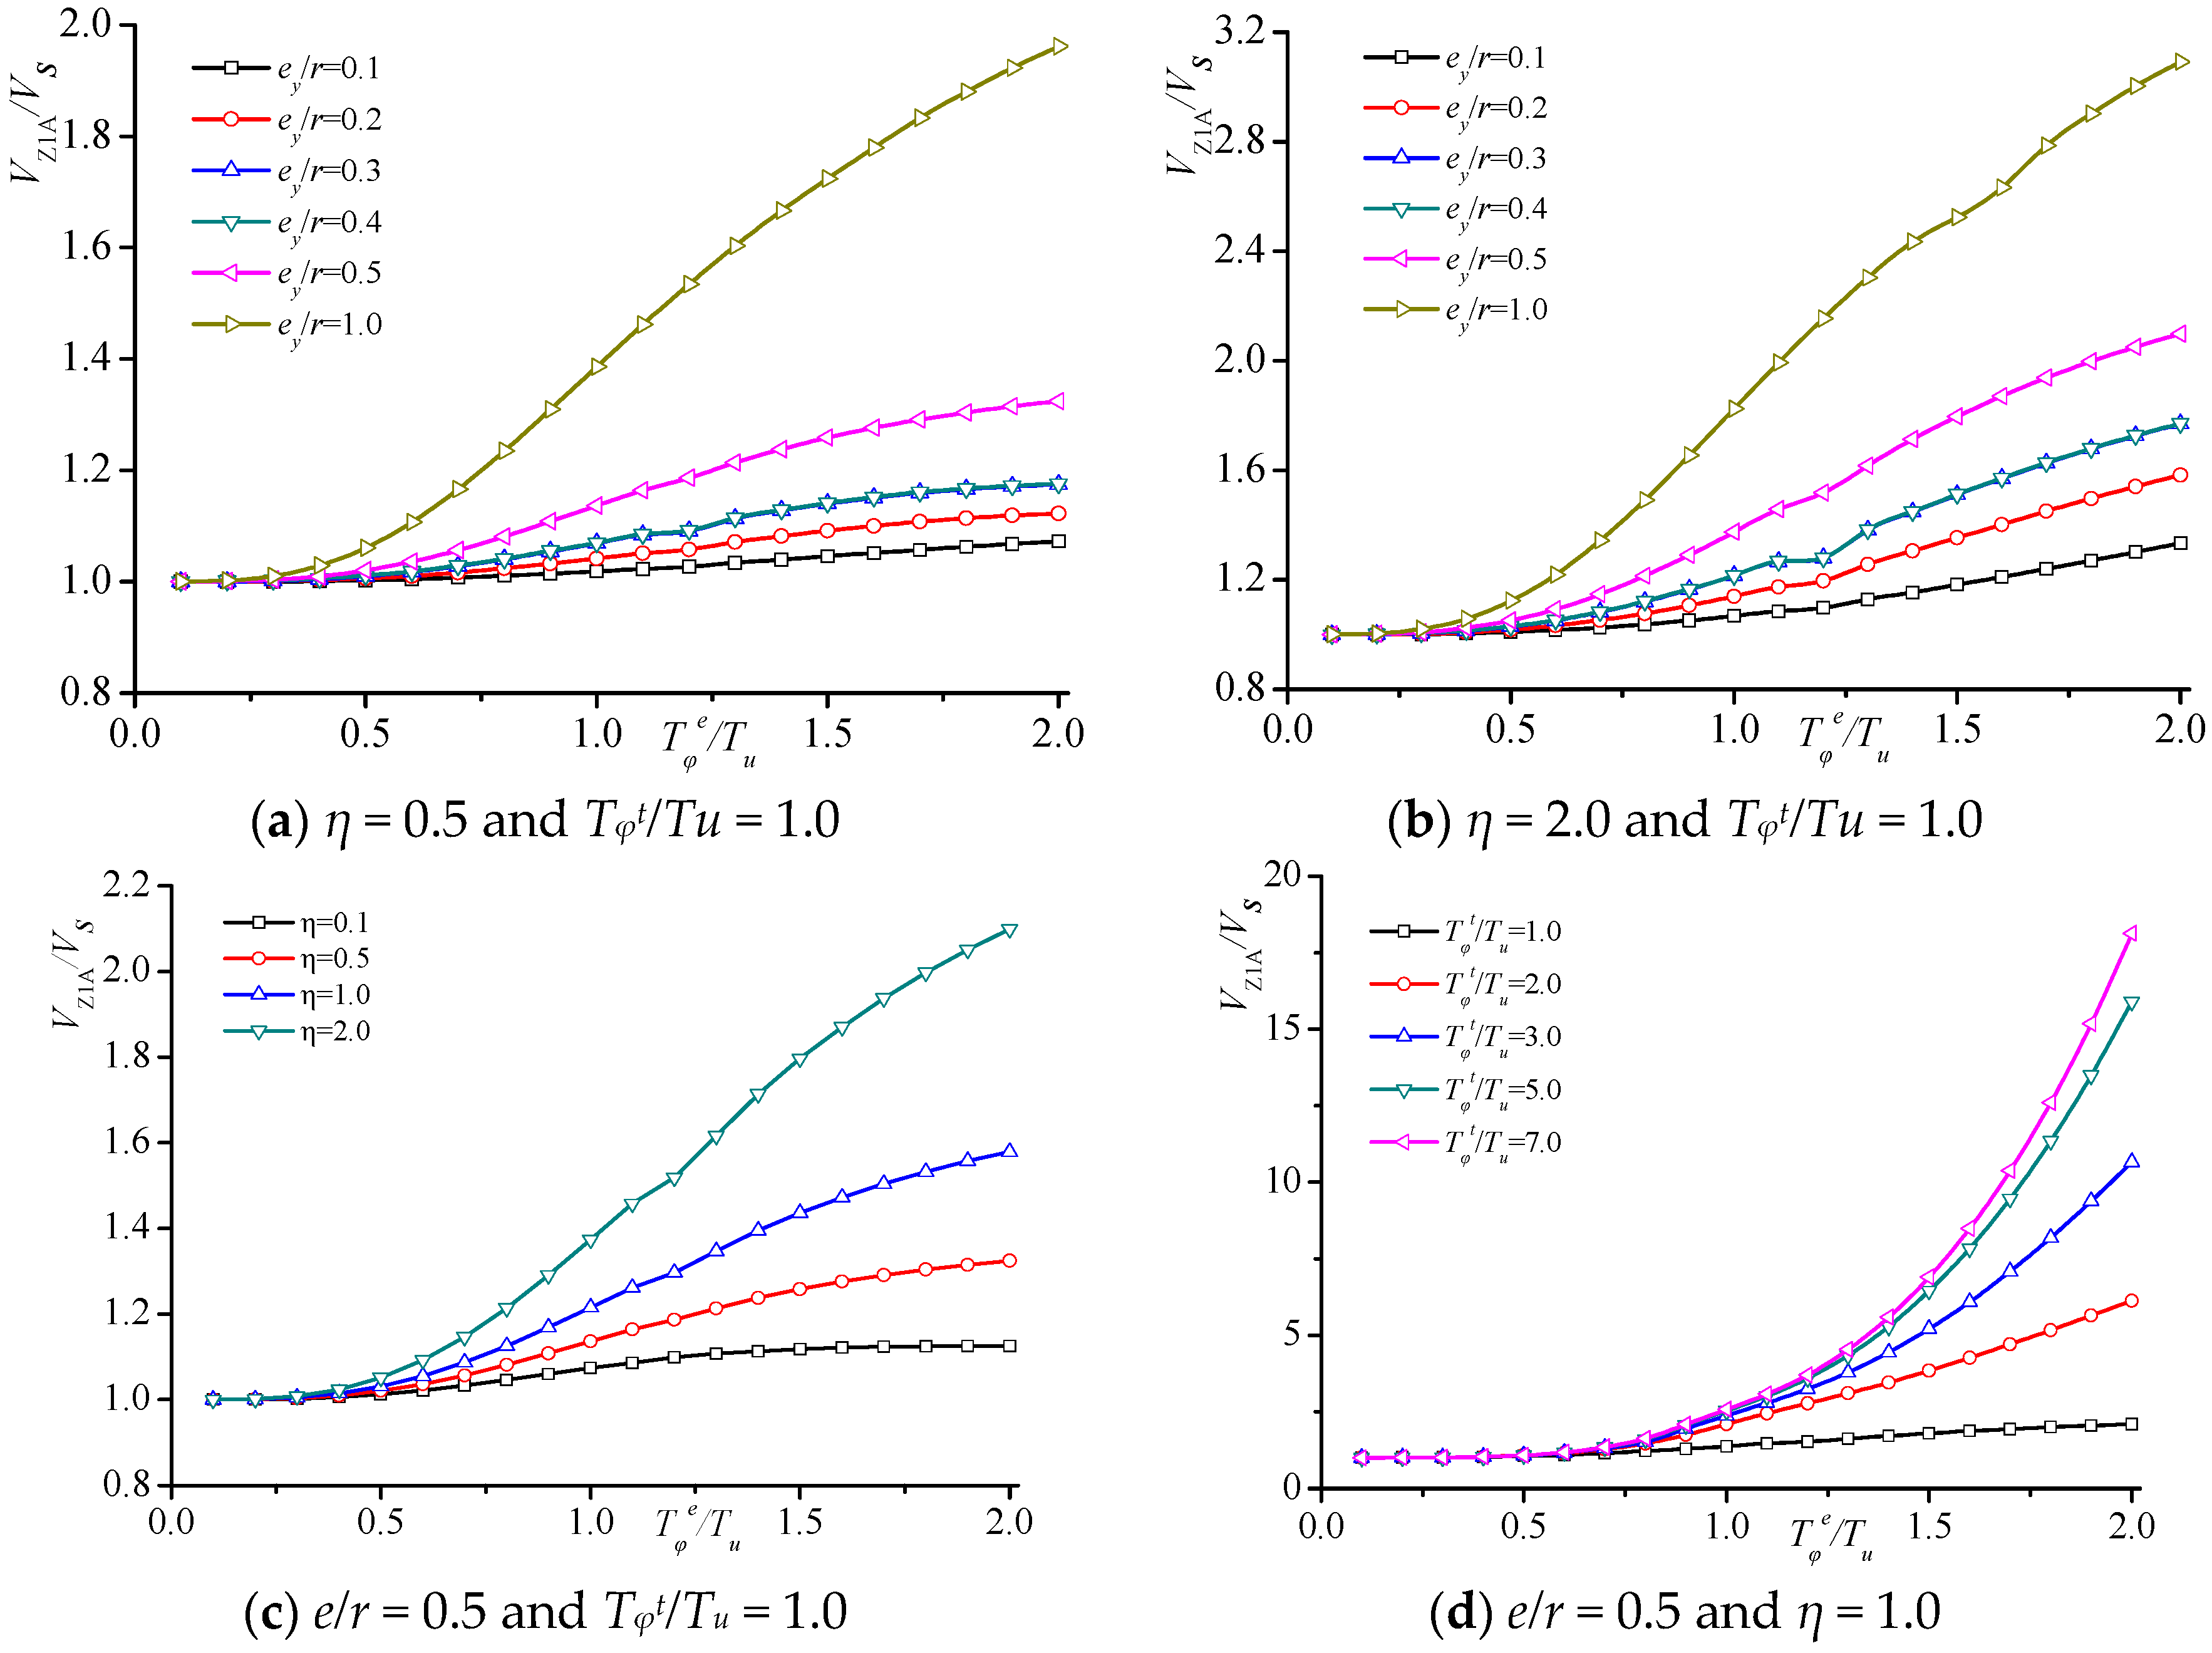
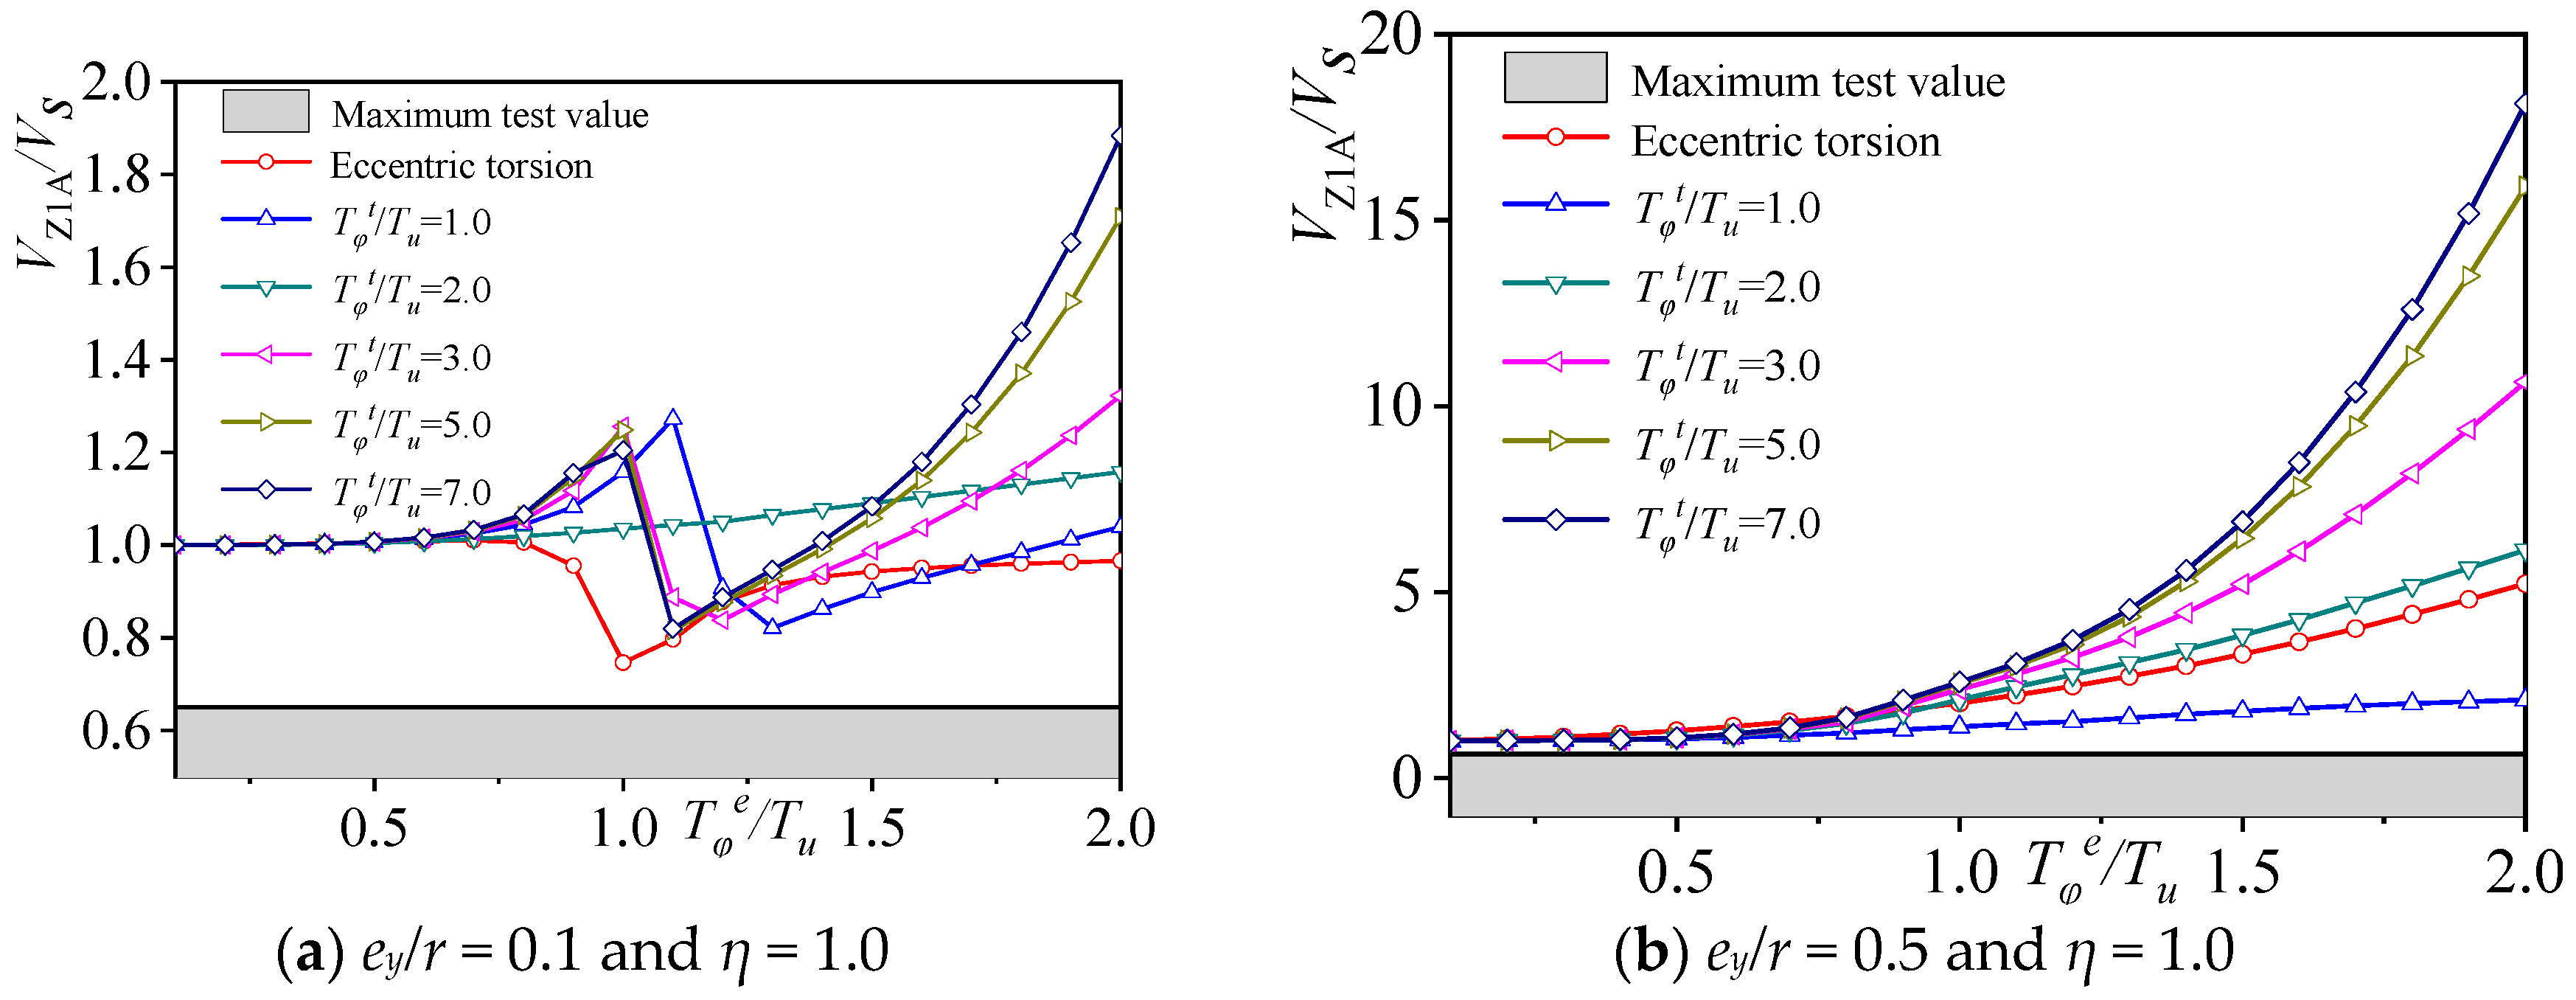
3.2.2. Torsional Amplitude

Considering the ground rotation effect, the ratio of the torsional component amplitude to the translational component amplitude can be derived from Equation (14) as follows:
φ u = 1 ω φ 2 / ω x 2 e y ,
where ωx represents the natural vibration frequency of the structure without considering torsional coupling and ωφ denotes the torsional natural vibration frequency, taking into account the ground rotation effect.
Figure 4 illustrates the variation pattern of the ratio of the torsional component to the translational component amplitude in the structure, taking into account ground rotation. The graph showcases the torsional amplitude variation pattern under the consideration of ground rotation and highlights its consistency patterns when eccentricity is also considered. When the relative eccentricity ey/r remains constant, and the ratio of the torsional period caused by ground rotation to the uncoupled period Tφt/Tu is held constant, the torsional amplitude experiences a significant increase after Tφe/Tu exceeds 1.0.

3.2.3. Participation Coefficient

The participation coefficient of the model during lateral–torsional vibration in the Y direction can be derived from Equation (13) as follows (Kuang and Liu 2022) [15]:
γ j = m ϕ j 1 m ϕ j 1 2 + J ϕ j 2 2 = ϕ j 1 ϕ j 1 2 + r 2 ϕ j 2 2 .
The participation coefficient of the model, considering ground rotation, is expressed as follows:
γ 1 γ 2 = e / r 2 + 1 ω 2 2 / ω x 2 e / r 2 + 1 ω 1 2 / ω x 2 .
where ωx represents the natural vibration frequency in the X direction, disregarding any torsional coupling effects, whereas ω1 and ω2 denote the natural vibration frequencies of the structure, accounting for ground rotation.
Figure 5 illustrates the participation level of the model when the ground rotation effect is taken into account. The figure reveals that the pattern of variation in the participation coefficient when considering ground rotation is consistent with the pattern observed when considering eccentricity. Specifically, when the relative eccentricity ey/r and the ratio of the ground rotation-induced torsional period to the fundamental period Tφt/Tu remain constant after Tφe/Tu > 1.0, the participation level of the first mode is notably higher compared to the case where only eccentricity is considered.

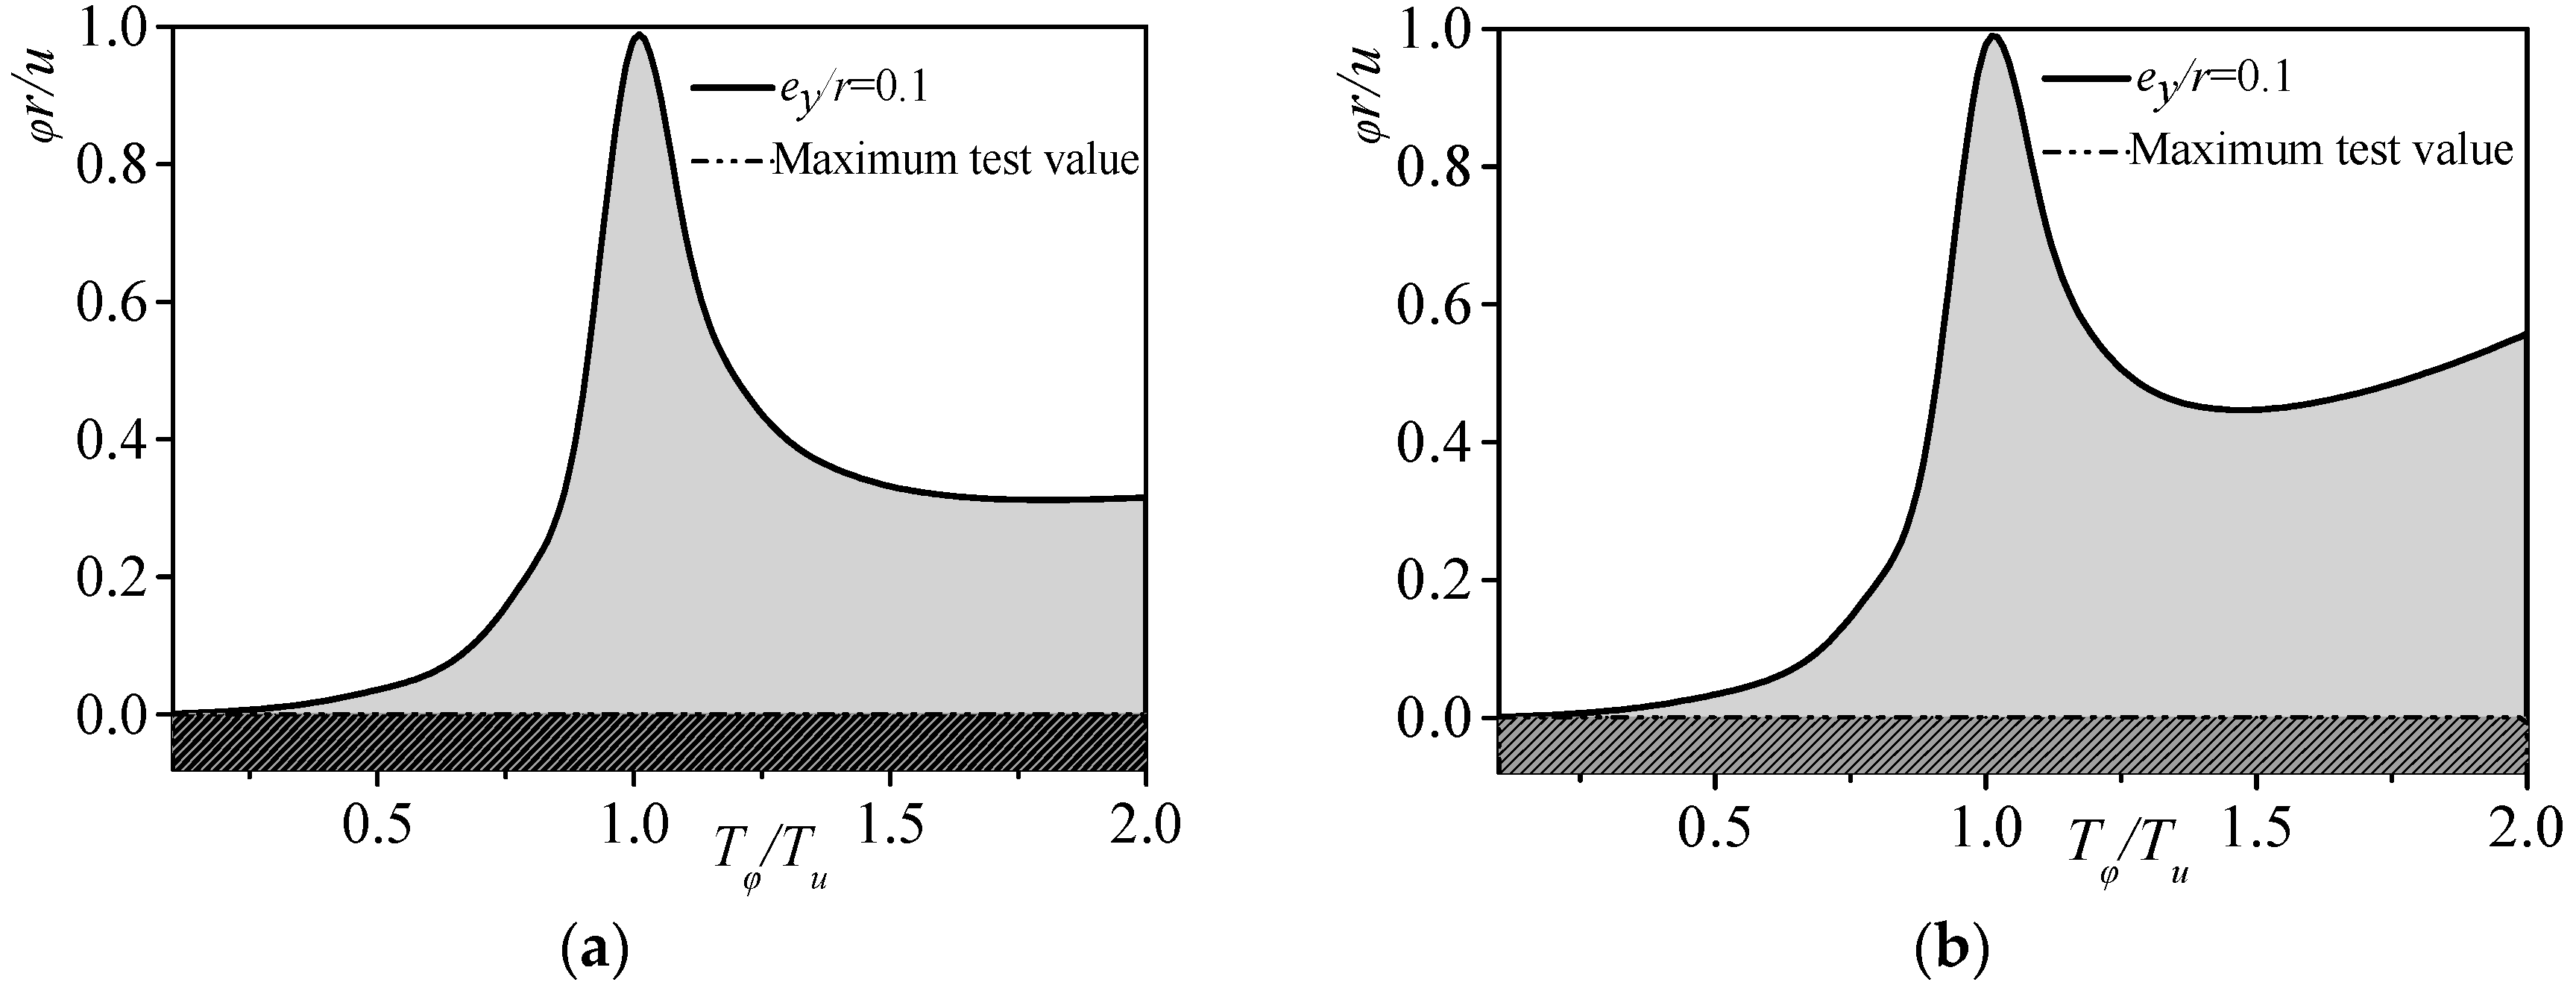
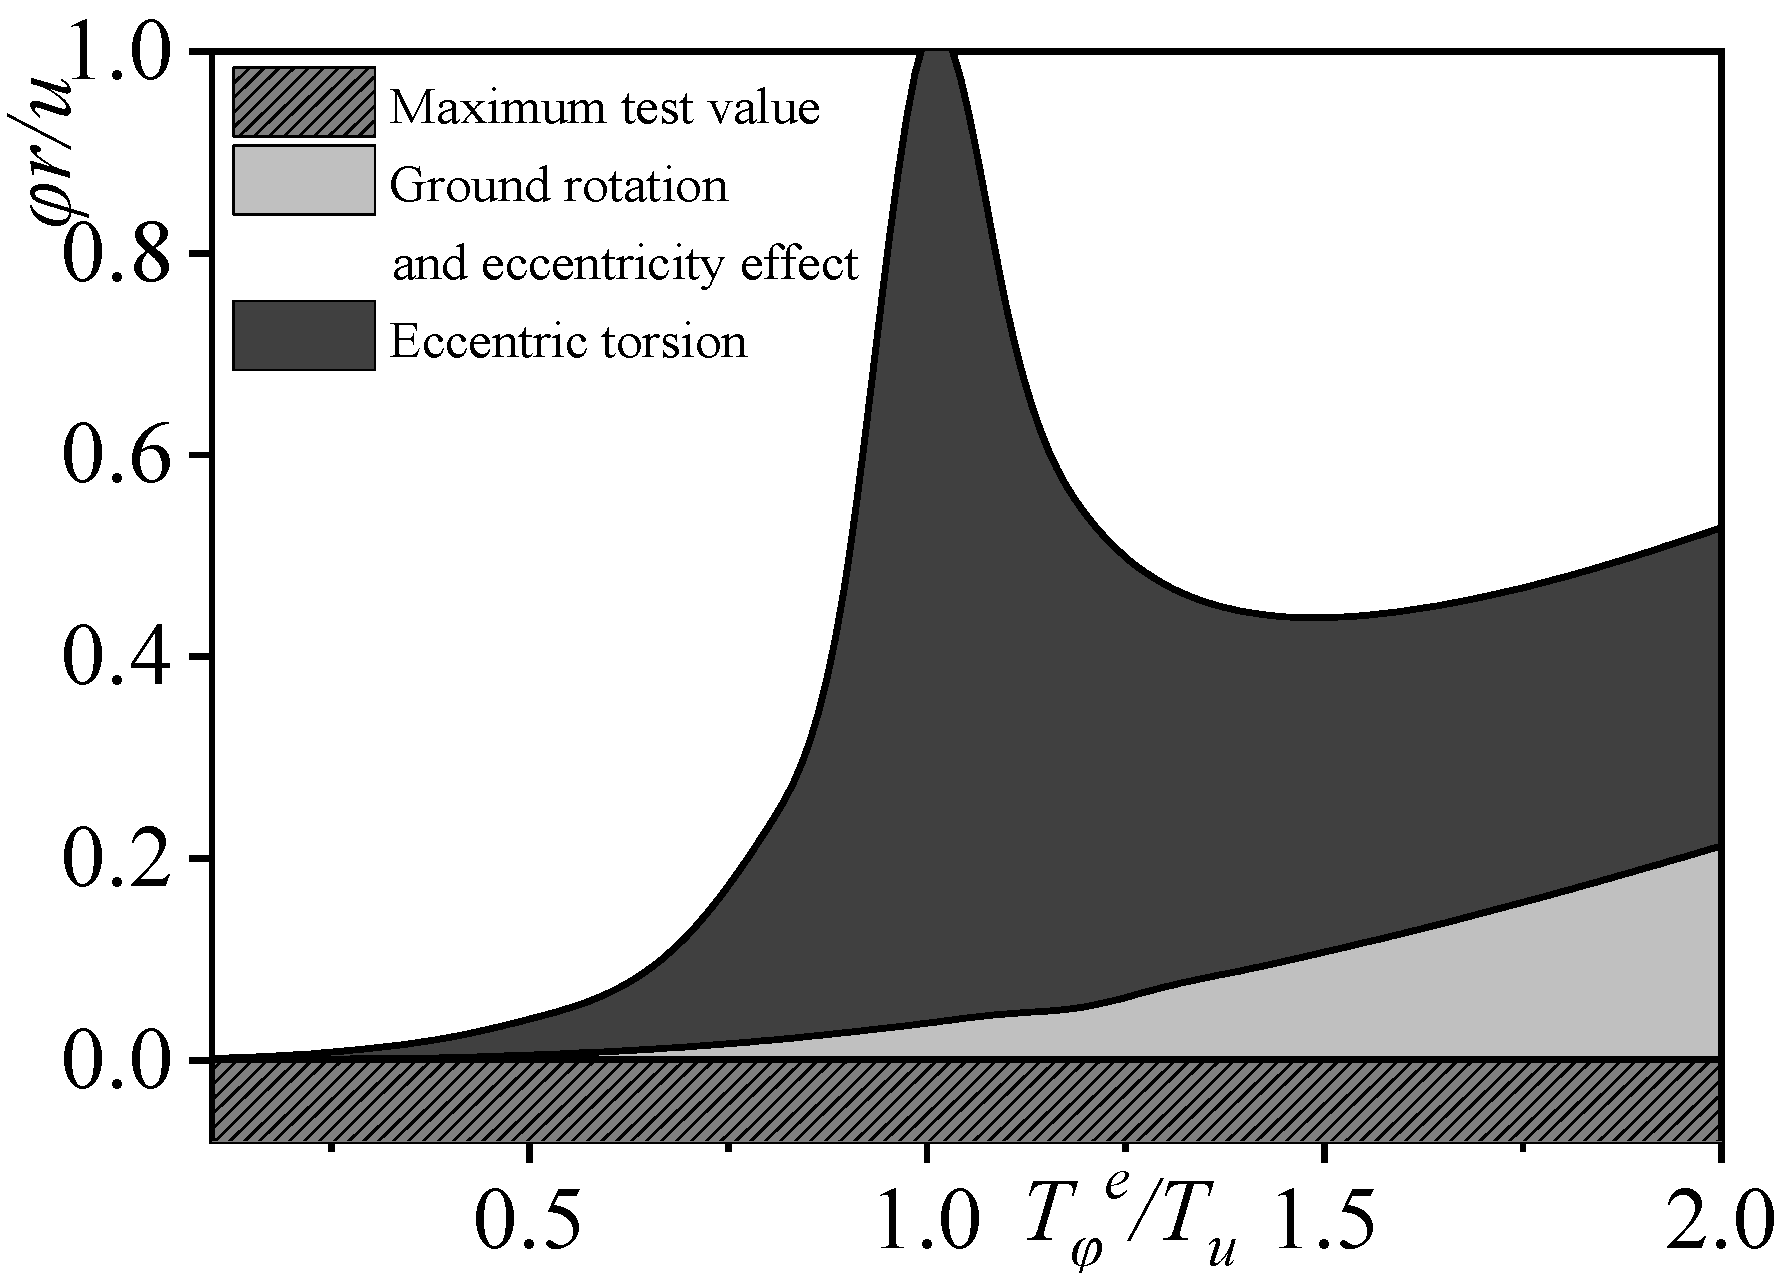
3.2.4. Relative Torsion Effect

By incorporating the amplitude ratio and participation coefficients into Equation (14), the translational and torsional displacements in the X direction for each mode can be determined. The modal analysis is conducted using the modal decomposition response spectrum method, and the seismic response is calculated employing the Complete Quadratic Combination (CQC) method. The resultant relative torsion effect indicator φr/u takes into account the influence of ground rotation.
φ r u = r φ 1 2 + φ 2 2 + 2 ρ 12 φ 1 φ 2 u 1 2 + u 2 2 + 2 ρ 12 u 1 u 2 = Φ e y / r , T φ e / T u , T φ t / T u
where φ and r represent the torsional angles and rotational radius of the floor, respectively; u denotes the center of mass displacement; φr is the rotational radius displacement induced by torsion; Tφe/Tu is the non-coupled lateral–torsional period ratio accounting for eccentricity; and Tφt/Tu is the lateral–torsional period ratio resulting from ground rotation. The coupling coefficients for the first and second modes, denoted as ρ12, are calculated as follows in Formula (15) (Mao et al., 2022) [19].
Figure 6 demonstrates that when Tφt/Tu ≥ 2.0 and Tφe/Tu ≤ 0.75, the relative torsion effect φr/u increases as the relative eccentricity ey/r increases. Conversely, when Tφt/Tu ≥ 1.4, the relative torsion effect φr/u decreases as the relative eccentricity ey/r increases. When the relative eccentricity ey/r is held constant, the relative torsion effect φr/u gradually increases alongside Tφt/Tu. For Tφt/Tu ≤ 1.0, the relative torsion effect φr/u exhibits a linear increase. However, when Tφt/Tu ≥ 2.0, a notable increase in the torsion effect is observed at the “knee point” when Tφe/Tu = 0.75.

3.2.5. Torsional Control Indicator

The primary torsional control indicators for the structure encompass the torsional displacement ratio, relative eccentricity, and torsional period ratio. In accordance with the “Code for Seismic Design of Buildings” (GB50011-2010) [21], this paper utilizes the torsional displacement ratio, which takes into account ground rotation effects as the torsional control indicator for special-shaped column frame structures. The torsional displacement ratio signifies the ratio of the maximum displacement to the average displacement of a vertical structure; it is mathematically expressed as follows (Ministry of Housing and Urban-Rural Development of the People’s Republic of China, 2016) [21]:
α = δ max δ a v e = δ max δ max + δ min / 2 ,
where δmax and δmin represent the floor or inter-story displacements at both ends of the structure under seismic action and δave denotes the average floor or inter-story displacement under seismic action.
By introducing the geometric relationship among relative eccentricity, the centroid of the structural plane, and the shape’s center, and by substituting the relative torsional effect indicator φ r / u into the aforementioned equation while accounting for ground rotation effects, the relationship between the torsional displacement ratio α and the fundamental torsional period ratio caused by eccentricity and ground rotation can be expressed as follows:
α = 1 + a 2 r φ r u = 1 + 3 / ( 1 + 1 / β 2 ) Φ ( e y / r , T φ e / T u , T φ t / T ) ,
where β represents the aspect ratio of the structural plane, defined as β = a/b (where a is the length and b is the width).
Figure 7 illustrates the relationship between the torsional displacement ratio α and the lateral–torsional period ratio caused by eccentricity and ground rotation. The figure indicates that the torsional displacement ratio α increases as the lateral–torsional period ratio caused by eccentricity and ground rotation increases. As the lateral–torsional period ratio increases, the “knee point” of the relationship curve continues to rise. Under constant aspect ratio conditions, eccentricity, and structural dimensions, and when T φ t / T u ≥ 3.0, the increasing trend of the torsional displacement ratio α and the lateral–torsional period ratio caused by eccentricity and ground rotation diminishes; especially, when T φ t / T u ≥ 5.0, the variation curve of the torsional displacement ratio α almost overlaps.

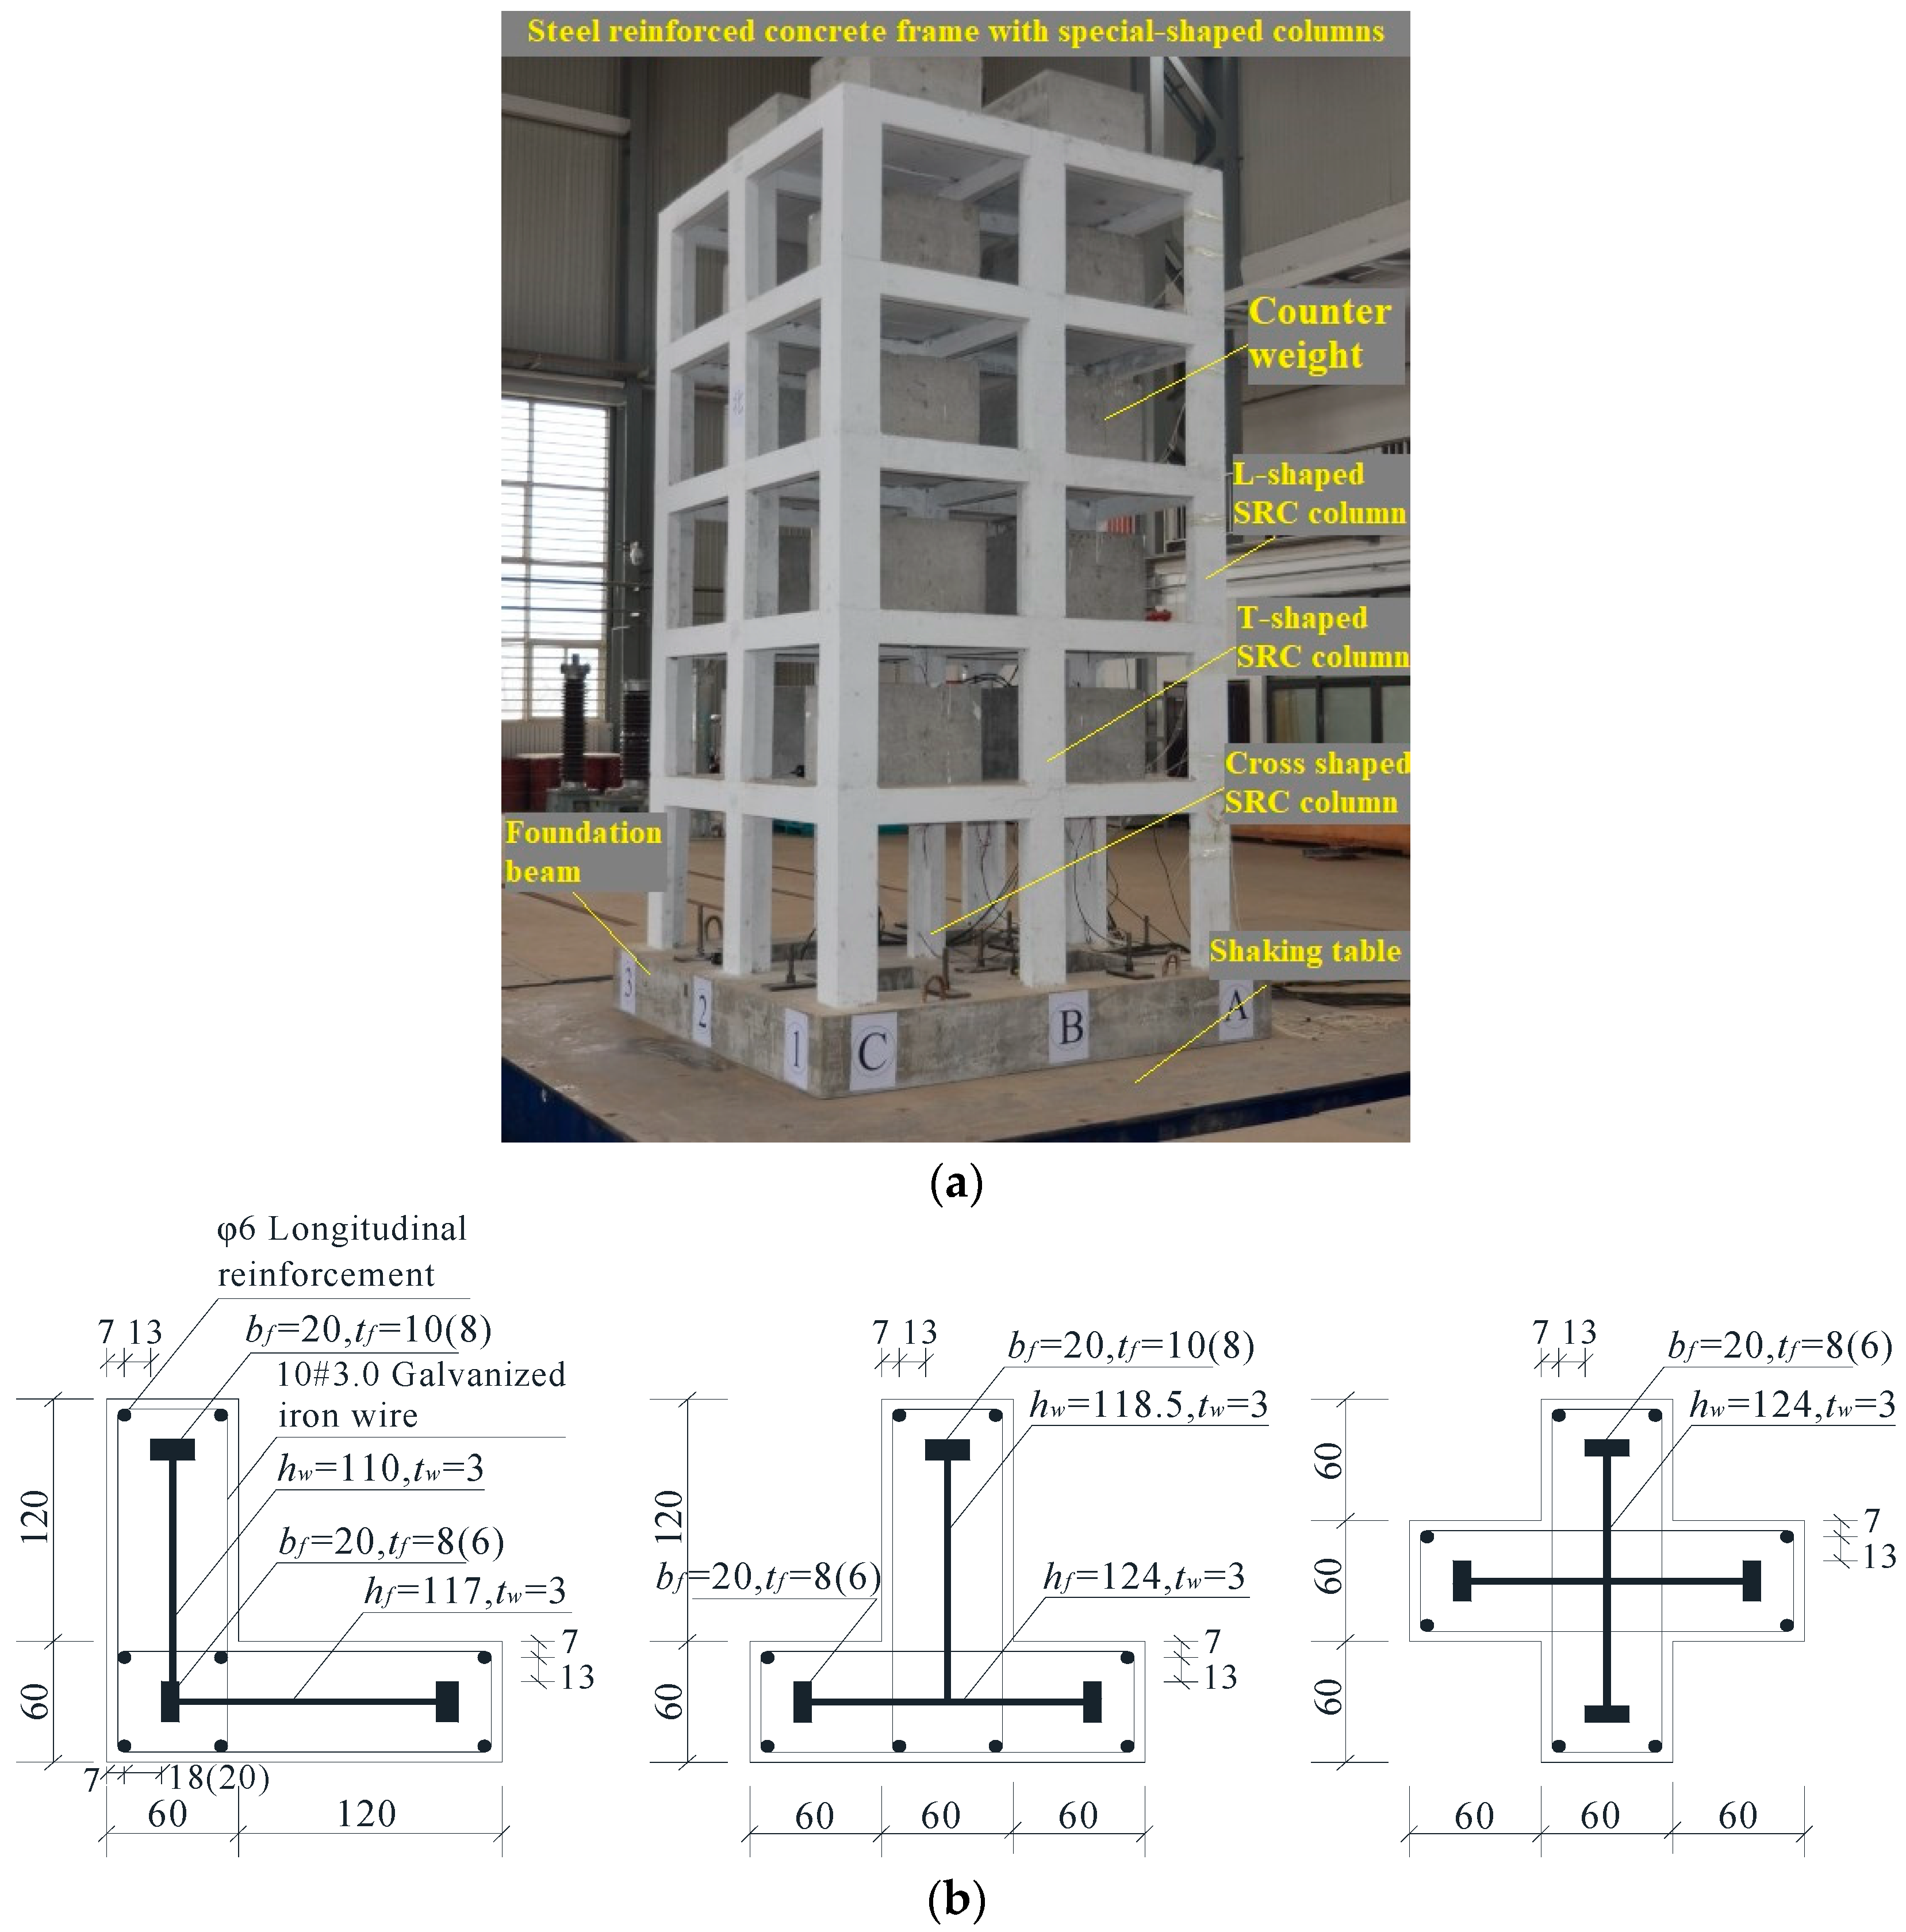
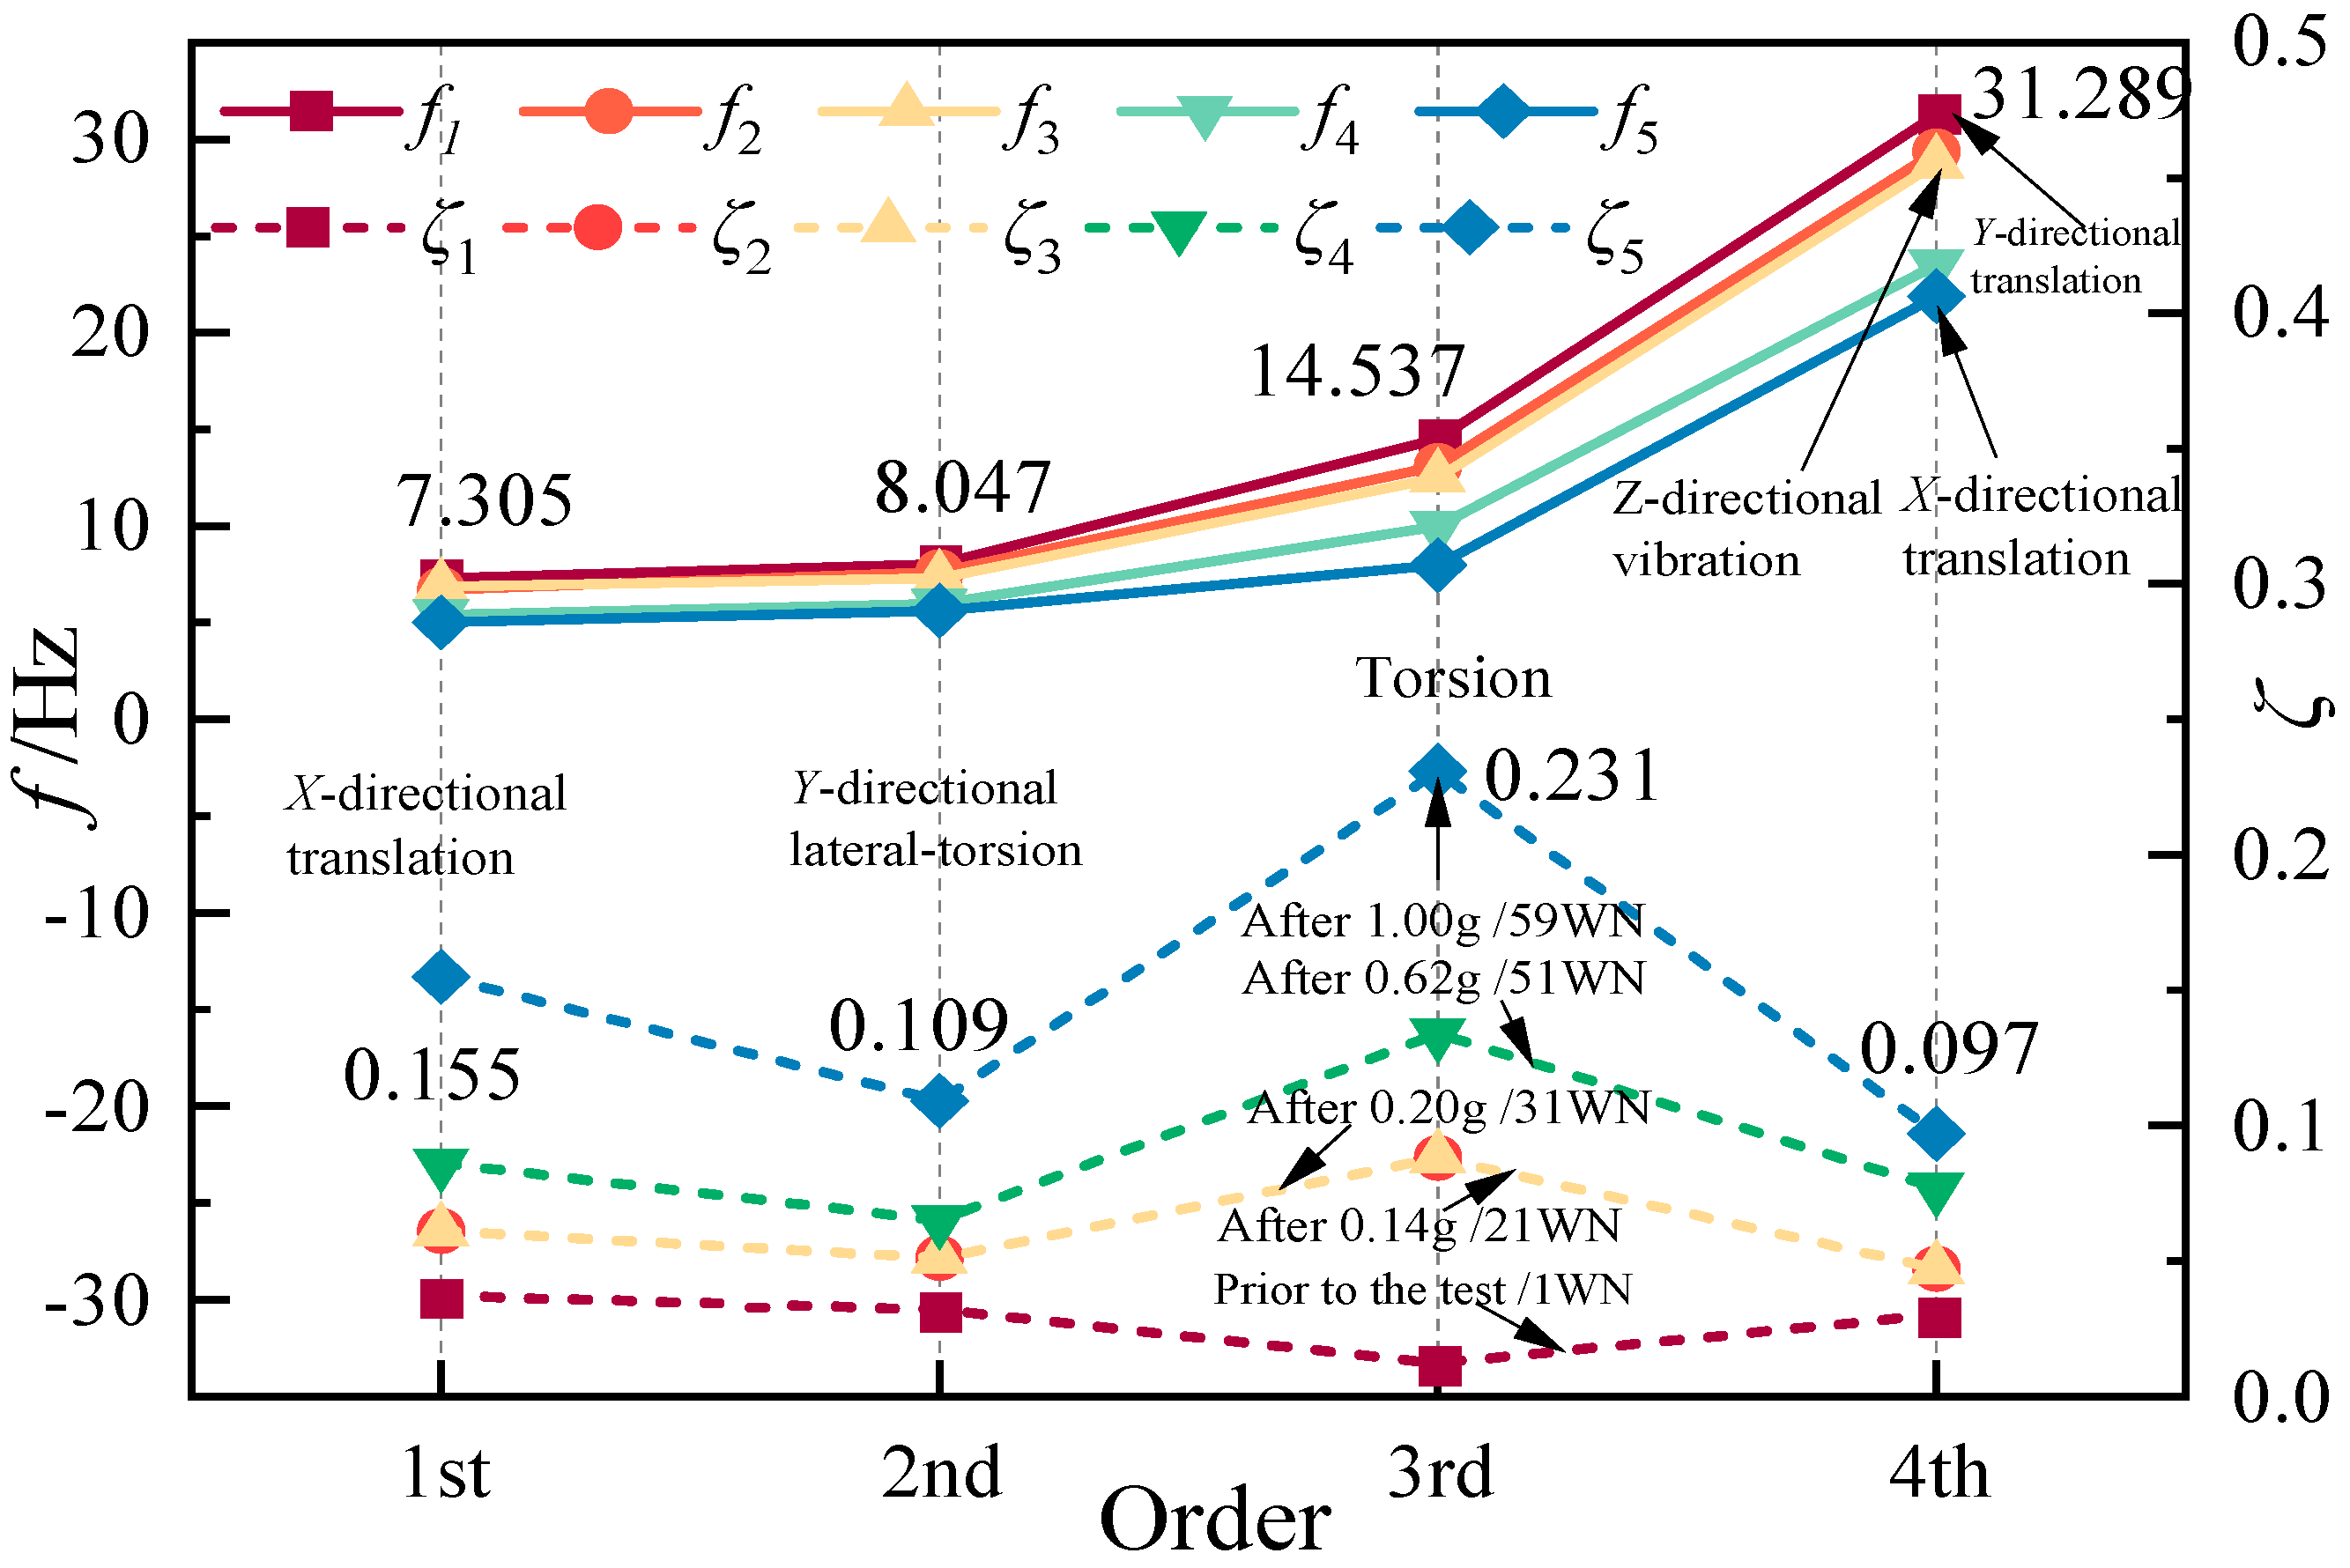
4. Shaking Table Test of the Special-Shaped Column Frame Structure

4.1. Test Survey

A structure model of a five-story solid web steel-reinforced concrete spatial frame with a special-shaped column at the similarity ratio of 1:4 based on the dynamic similarity relationship is designed to obtain the displacement response, acceleration response, and strain response of the steel-reinforced concrete frame with a special-shaped column under a 3D earthquake. The model structure is symmetrically arranged in the plane. To be specific, the frame has a span length of 1000 mm, the ground floor has a height of 900 mm, and the height of the second to fifth floors is 750 mm, as presented in Figure 8a. The lateral force-resisting members of the structure comprise L-shaped, T-shaped, and cross-shaped steel-reinforced concrete special-shaped columns. As depicted in Figure 8b, Q235 steel serves as the column steel, HPB300 grade reinforcement is the stressed reinforcement, 10#3.0 galvanized iron wire serves is the stirrup, and C30 (grade of concrete; the standard value of the compressive strength of the cube is 30 MPa) particulate concrete is employed as the concrete. The frame beam is a reinforced concrete rectangular beam with a section size of 60 mm × 140 mm. Moreover, the slab is a reinforced concrete cast in situ slab with a thickness of 40 mm. The model is fully weighted, and the weight of the respective floor is 1.6 t. The axial compression ratio of the middle column on the bottom floor under vertical load is 0.11.
In the test, the El Centro wave, Taft wave, and Lanzhou artificial wave are selected as the excitation waveform of the mesa, and the peak acceleration input of the mesa is adjusted at a 1:0.67 similarity ratio. There are 60 working conditions (e.g., white noise) after adjustment, and the peak acceleration is set as follows: 0.07 g, 0.14 g, 0.20 g, 0.40 g, 0.62 g, 0.80 g, 0.90 g, 1.0 g, and 1.1 g. In the test of the same earthquake grade, the time interval is adjusted at a 1:2 similarity ratio. The seismic waves in the respective region are input in one direction, two directions, and three directions, respectively. The X, Y, and Z three-way acceleration ratio is 1:0.85:0.65. During the test, the dynamic response of the model structure is examined using the accelerometer, the displacement pickup, and the strain sensor.
The frequency response function (transfer function) for each floor is determined by conducting a frequency domain analysis of the excitation and output signals. Using the transfer function, the amplitude–frequency and phase–frequency curves of the model are generated. The damping ratio of the model structure, which reflects its energy dissipation characteristics, is determined using the half-power approach of the transfer function curve (Ismai 2020) [14]. The transfer function curve is also used to determine the vibration pattern of the model; the amplitude–frequency and phase–frequency curves of each floor relative to the ground floor are obtained using the transfer function (Ismai 2020) [14]. After normalizing the amplitude ratio, the vibration pattern corresponding to the natural vibration frequency is obtained. Figure 9 presents the entire natural vibration frequency distribution, damping ratio, and vibration pattern of the SRC special-shaped column structure subjected to 3D seismic action, where f is the natural vibration frequency of the model, ζ is the damping ratio, and Φ(i) is the vibration pattern.

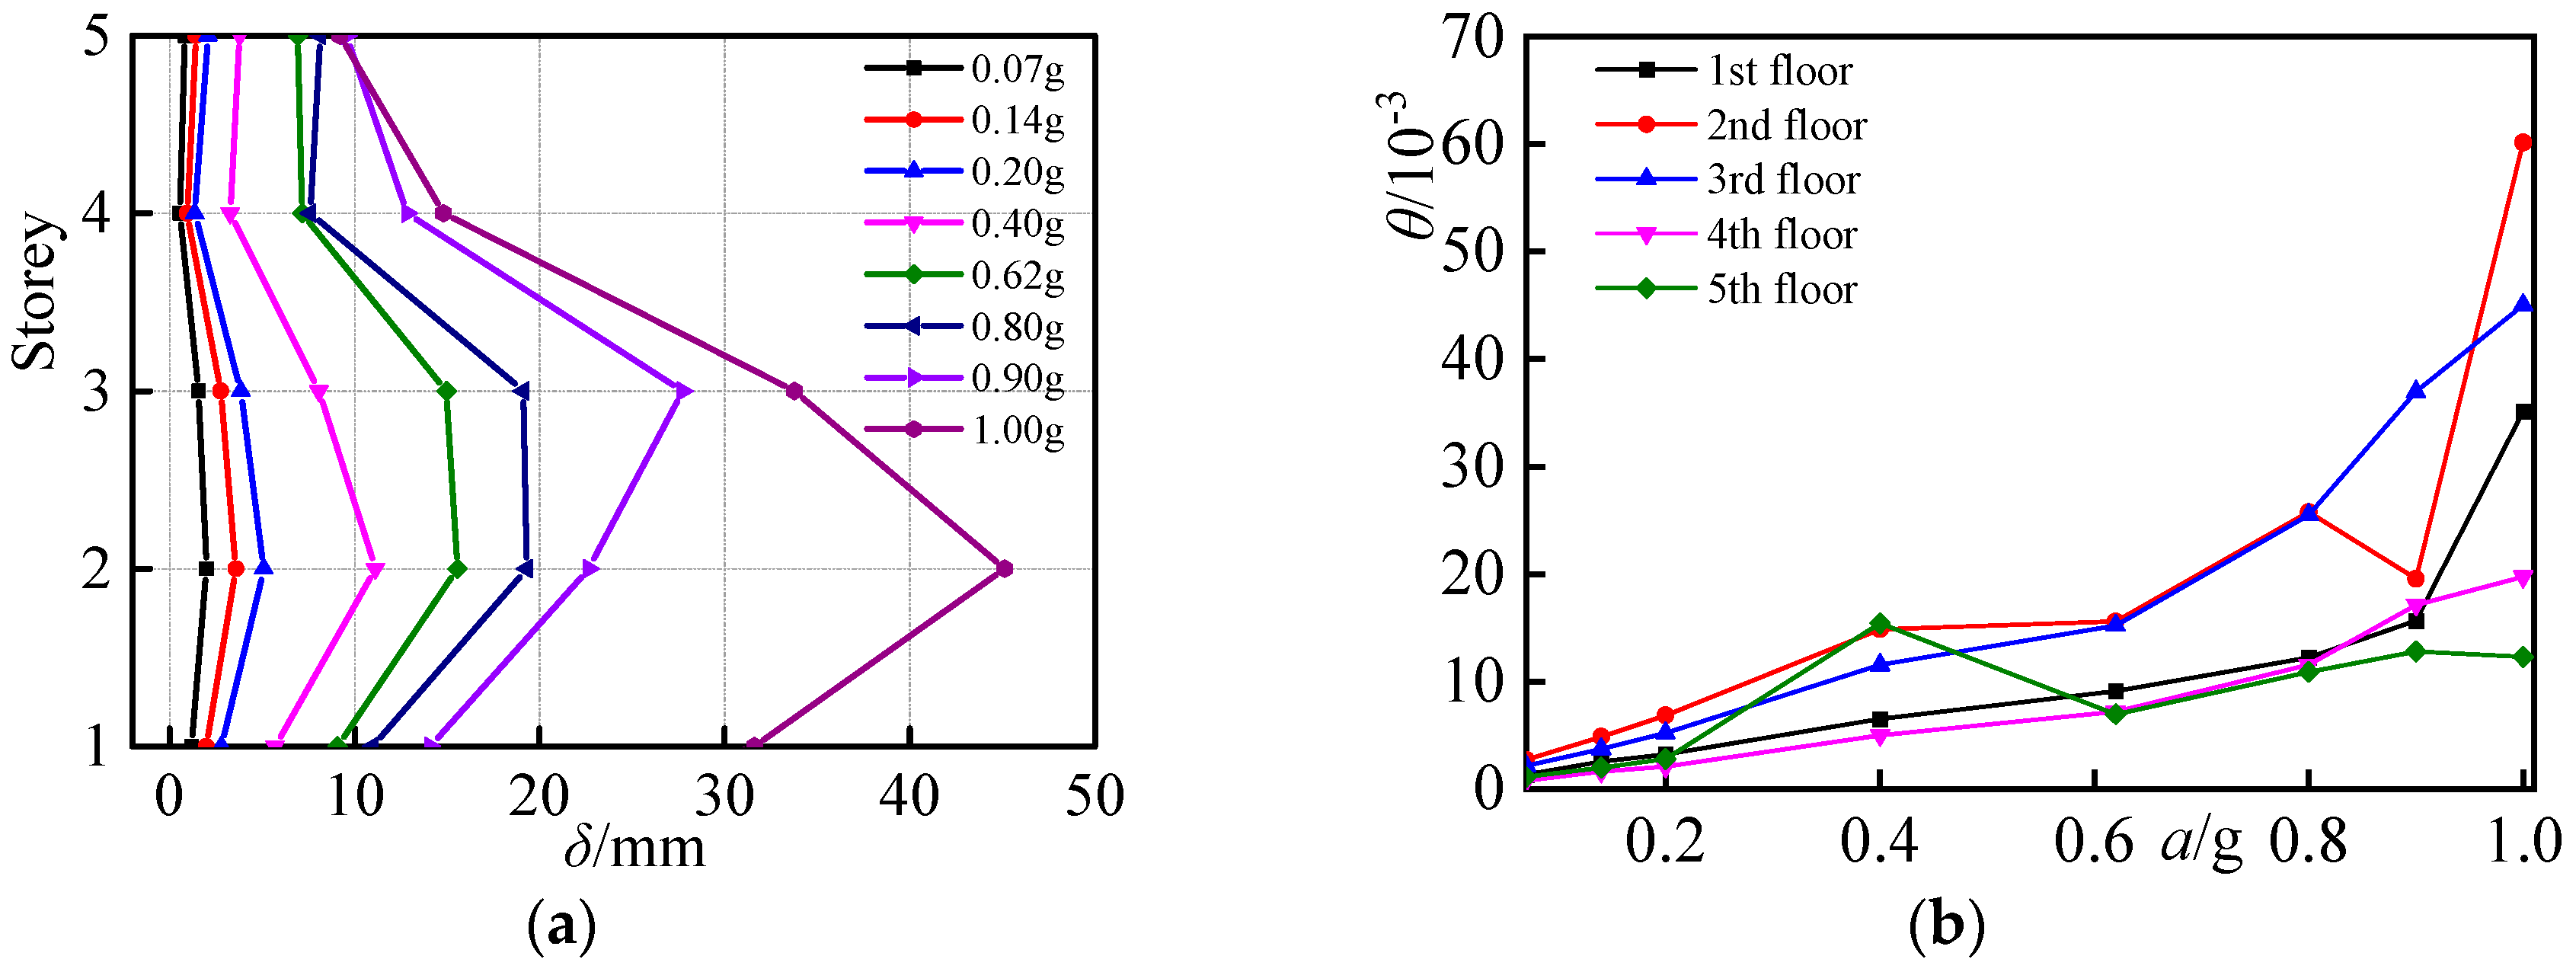
4.2. Lateral Vibration

Figure 10 is the inter-story displacement envelope diagram of the model. As depicted in the figure, with the increase in the peak acceleration, the inter-story displacement response of each layer increases, and the inter-story displacement in descending order is the second floor, third floor, first floor, fourth floor, and fifth floor. Before the 0.14 g PHGA seismic wave input, the lateral displacement curve of each layer is basically a straight line, and the structure is at the elastic stage. After the 0.40 g PHGA seismic wave input, the first and second floors of the model enter the elastic–plastic stage, and the inter-story displacement increases more than that of the third to fifth floor; the overall lateral displacement curve of the structure is S-shaped. After the 0.80 g PHGA seismic wave input, the structure enters the elastic–plastic stage. The maximum value of the inter-story displacement angle on the second floor reaches 1/39. Plastic hinges appear at the beam ends of the third floor, and the inter-story stiffness of the model degrades rapidly.
The response of the model to conditioned seismic action indicates that before the peak acceleration reaches 0.14 g, the structure is in an elastic state. When the peak acceleration reaches 0.20 g, the structure experiences its maximum inter-story displacement angle on the second floor, which is 1/146, and various inter-story displacement angles are distributed as θ2 > θ3 > θ1 > θ4 > θ5. Between peak accelerations of 0.40 g and 0.62 g, the maximum inter-story displacement angle of the second floor is 1/65, which is lower than the specified requirement of 1/60. When the peak acceleration exceeds 0.80 g, the maximum inter-story displacement angle of the second floor is 1/39, and plastic hinges appear at the beam ends of the third floor with rapid degradation of inter-story stiffness. This inter-story displacement angle exceeds 1/60 as specified in the code, but the structure does not collapse. When the peak acceleration exceeds 0.90 g, the maximum inter-story displacement angle of the third floor reaches 1/17, and as the peak ground acceleration increases, deformation at the beam ends of the first to third floors continuously increases, and the steel reinforcement at the beam ends gradually experiences stress failure. Plastic hinges appear at the beam ends of the first and second floors.

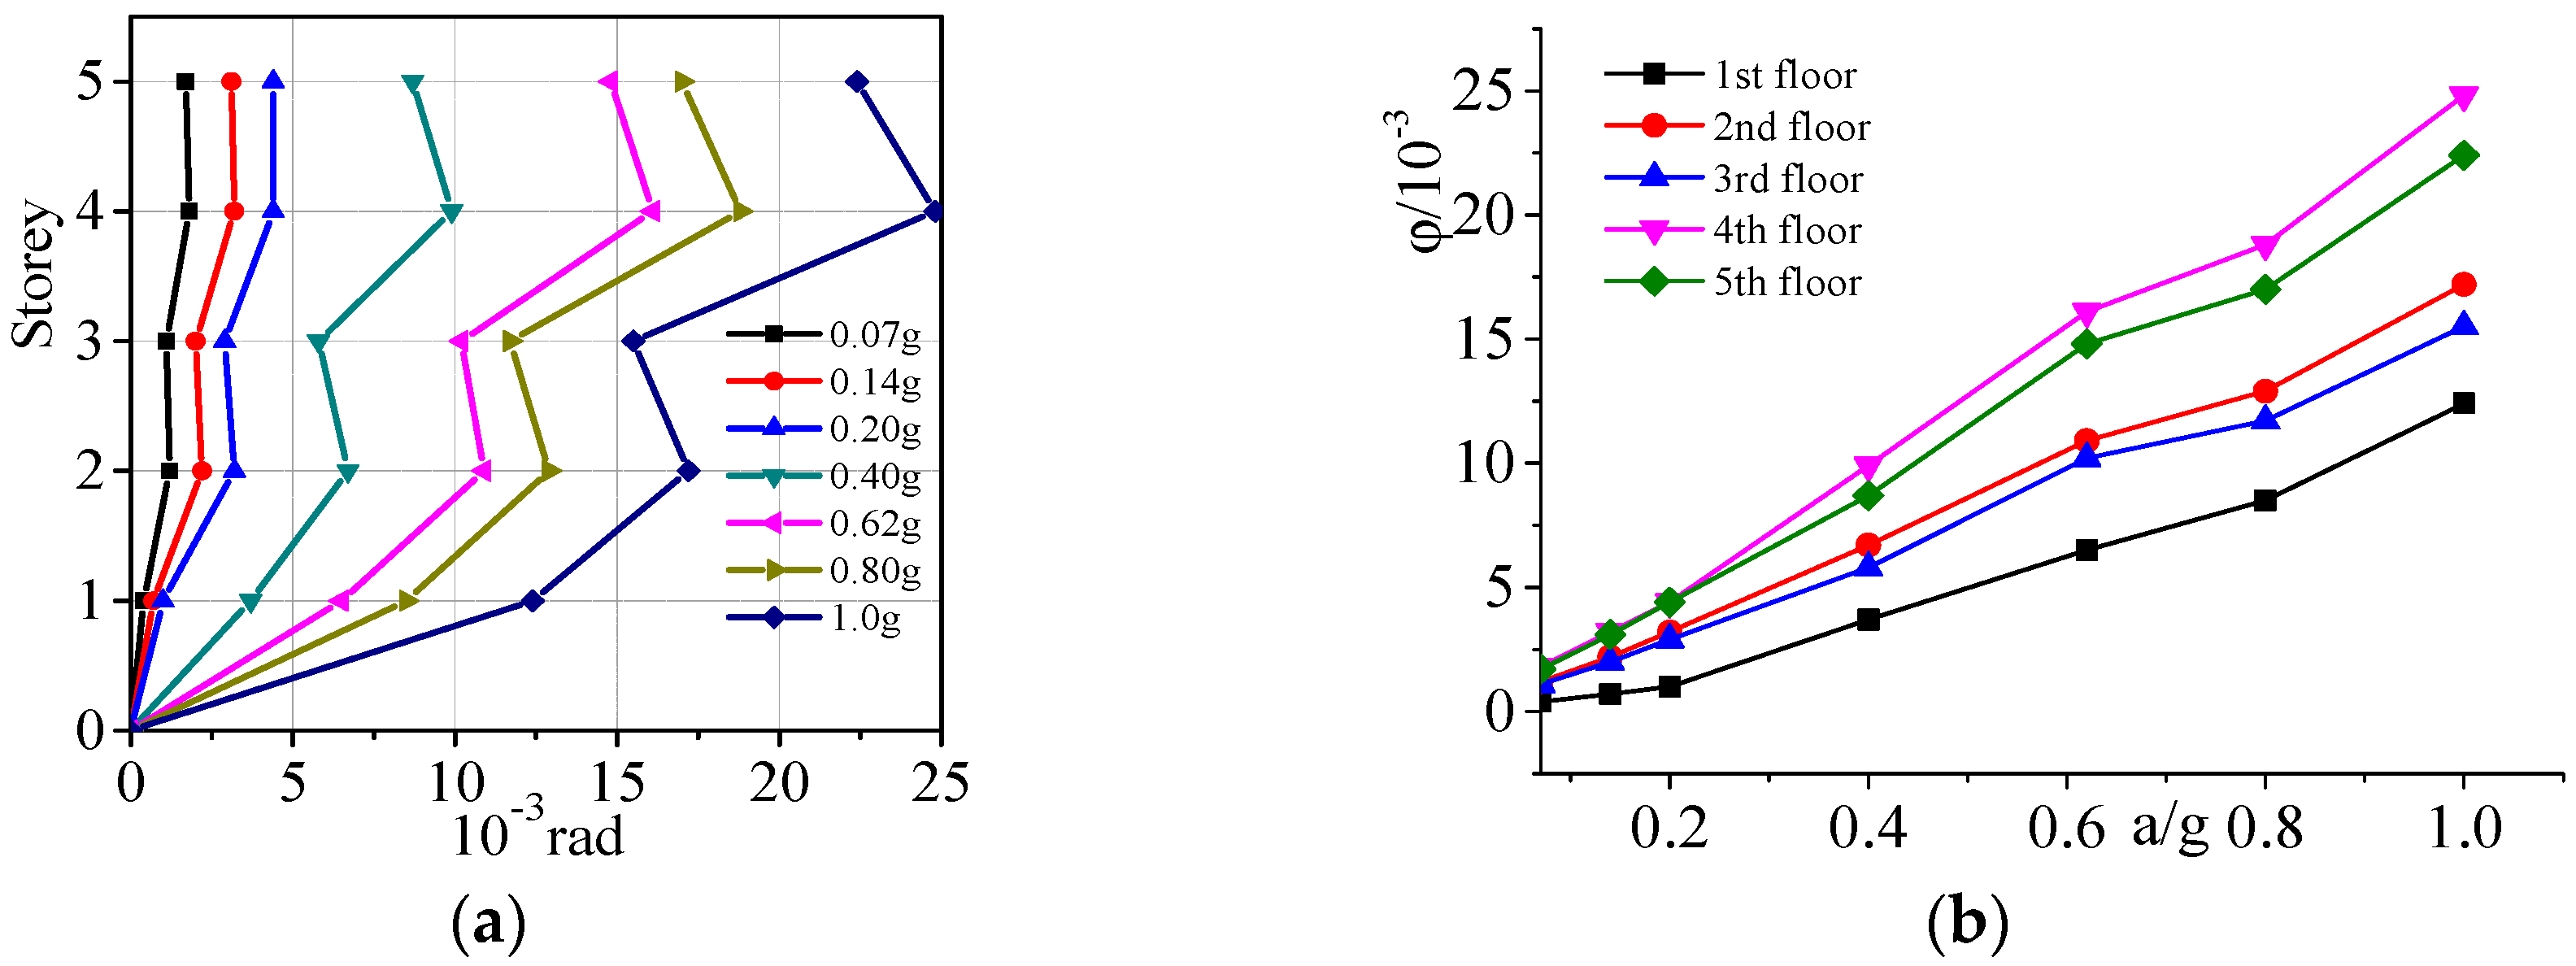
4.3. Torsional Vibration
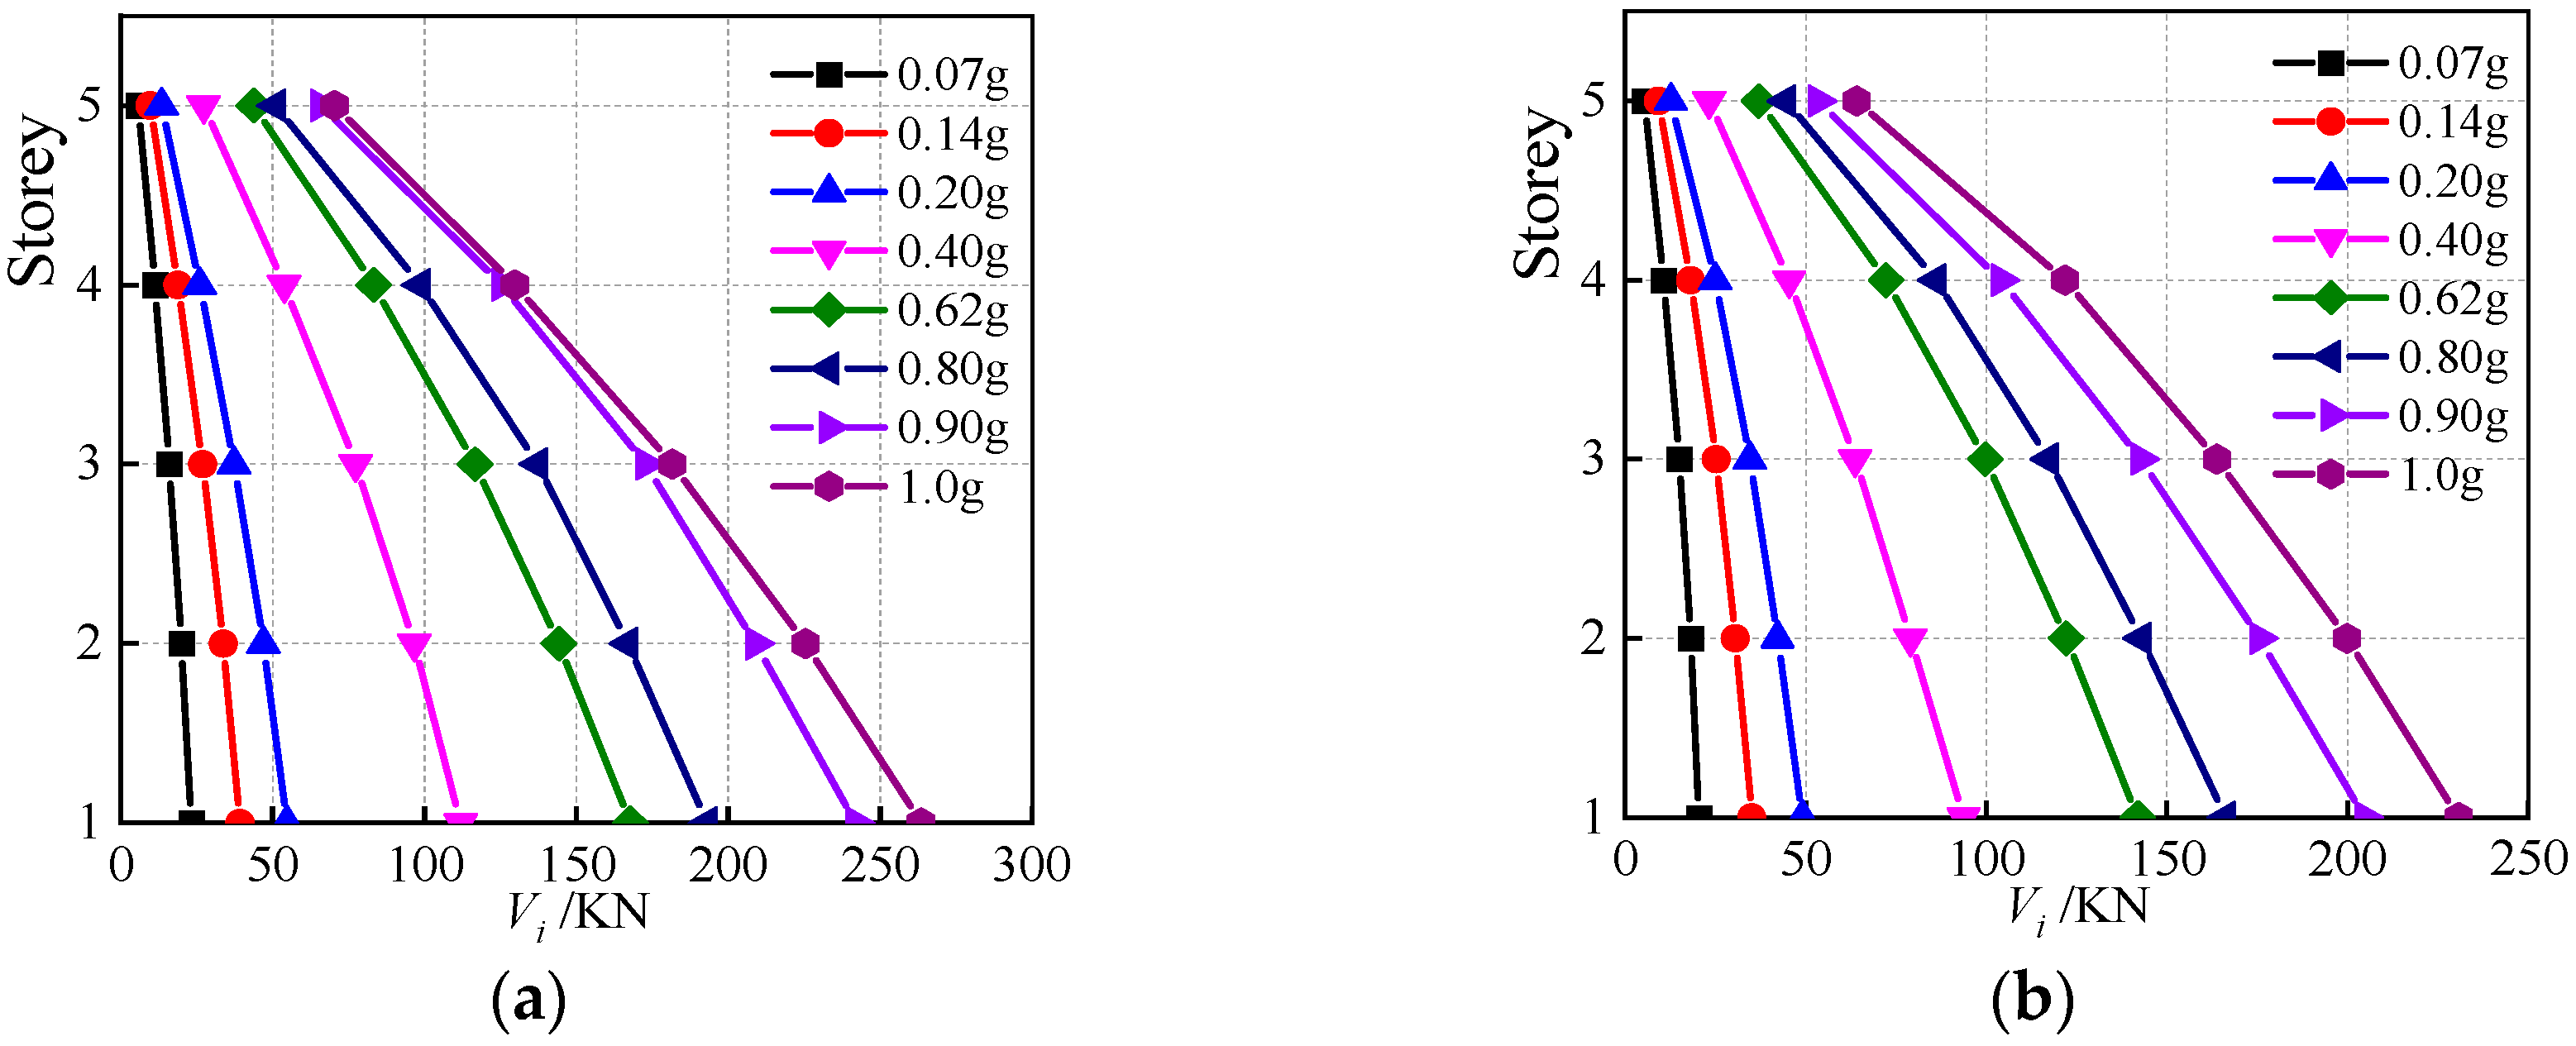
Figure 11 presents the torsion angle envelope diagram of the respective floor relative to the base. The measured seismic response of the shaking table test indicates that under the action of the 0.14 g PHGA seismic input, the maximum torsional angle is obtained as 3.1 × 10⁻⁷ rad. The maximum value of inter-story displacement angle caused by lateral–torsional coupling is 1/502 rad, which basically meets the requirements of the elastic inter-story displacement angle limit of 1/550 rad in the Code for Seismic Design of Buildings (GB50011-2010). Under the action of the 0.40 g PHGA seismic input, the maximum torsional angle is 8.7 × 10⁻⁷ rad. The maximum value of the inter-story displacement angle caused by lateral–torsional coupling is 1/67 rad, thus satisfying the requirements of the elastic–plastic inter-story displacement angle limit of 1/60 rad in the Technical Specification for Concrete Special Shaped Column Structures (JGJ149-2017) [22]. Under the action of the 0.80 g PHGA seismic input, the maximum torsional angle is determined as 17.0 × 10⁻⁷ rad. The maximum value of the inter-story displacement angle caused by lateral–torsional coupling is 1/39 rad, exceeding the limit value of the elastic–plastic inter-story displacement angle, and the model structure enters the fully plastic stage. The analysis of the model structure stiffness and seismic force suggests that when the structure enters the plastic stage, the degradation of the floor torsional stiffness is not significant with the increase in horizontal lateral displacement.

4.4. Seismic Shear

The shear envelope diagram of the floor is shown in Figure 12. As depicted in the figure, the maximum shear force of the respective floor tends to decrease along the direction of the floor height under the same seismic wave and the same peak acceleration input on the model structure, and the shear force of the floor in Y direction is nearly 75% of the shear force in X direction. Between the 0.07 g and 0.20 g PHGA seismic inputs, the maximum shear force of the first floor is nearly 50 kN, and the structure is at the elastic stage. After the 0.62 g PHGA seismic input, the model enters the elastic–plastic stage. The increase in the floor shear force decreases significantly with the increase in the peak acceleration. After the 0.80 g PHGA seismic input, with the increase in floor shear force, the plastic deformation of the model structure rapidly deepens, and the cumulative damage increases continuously.

4.5. Column Shear

The column shear force at a specific level is determined by multiplying the measured acceleration values at the column ends of each level by their corresponding equivalent column mass. The aggregate of the inertia forces at the column ends, originating from all the floors above that level and located at the same position, signifies the column shear force at that level. The equation for this calculation is expressed as follows:
V j c = i = j n m i c a i c ,
where V j c represents the column-end shear force of the jth floor, with j = 1 indicating the column-end shear force of the ground floor, denoted as V 1 c . Additionally, m i c signifies the equivalent column-end mass at the ith level. To ascertain the value of m i c , the floor slab’s gravity load and its weight are apportioned to adjacent beams in accordance with the slab’s force transmission method. Subsequently, the load borne by the beams and the column weight are equitably distributed among the pertinent column-end nodes, ensuring that all masses are deemed equivalent at the column ends. Notably, the column-end mass on each floor is approximately 610 kg, while for corner columns, it is around 305 kg. Here, a is the column-end acceleration response of the ith floor, and n represents the modeled floor number, which stands at 5 in this particular study.
Figure 13 exclusively illustrates the variations in column-end shear force for the ZA2 T-shaped corner column. The graph reveals that the fluctuations in column-end shear force align with the variations in floor shear force observed in the model. Notably, the maximum column-end shear force constitutes approximately 10% of the floor shear force, indicating that the SRC special-shaped column serves as the primary lateral load-resisting component within the model structure. The distribution of column-end shear force is deemed reasonable, adhering to the lateral stiffness of the column.

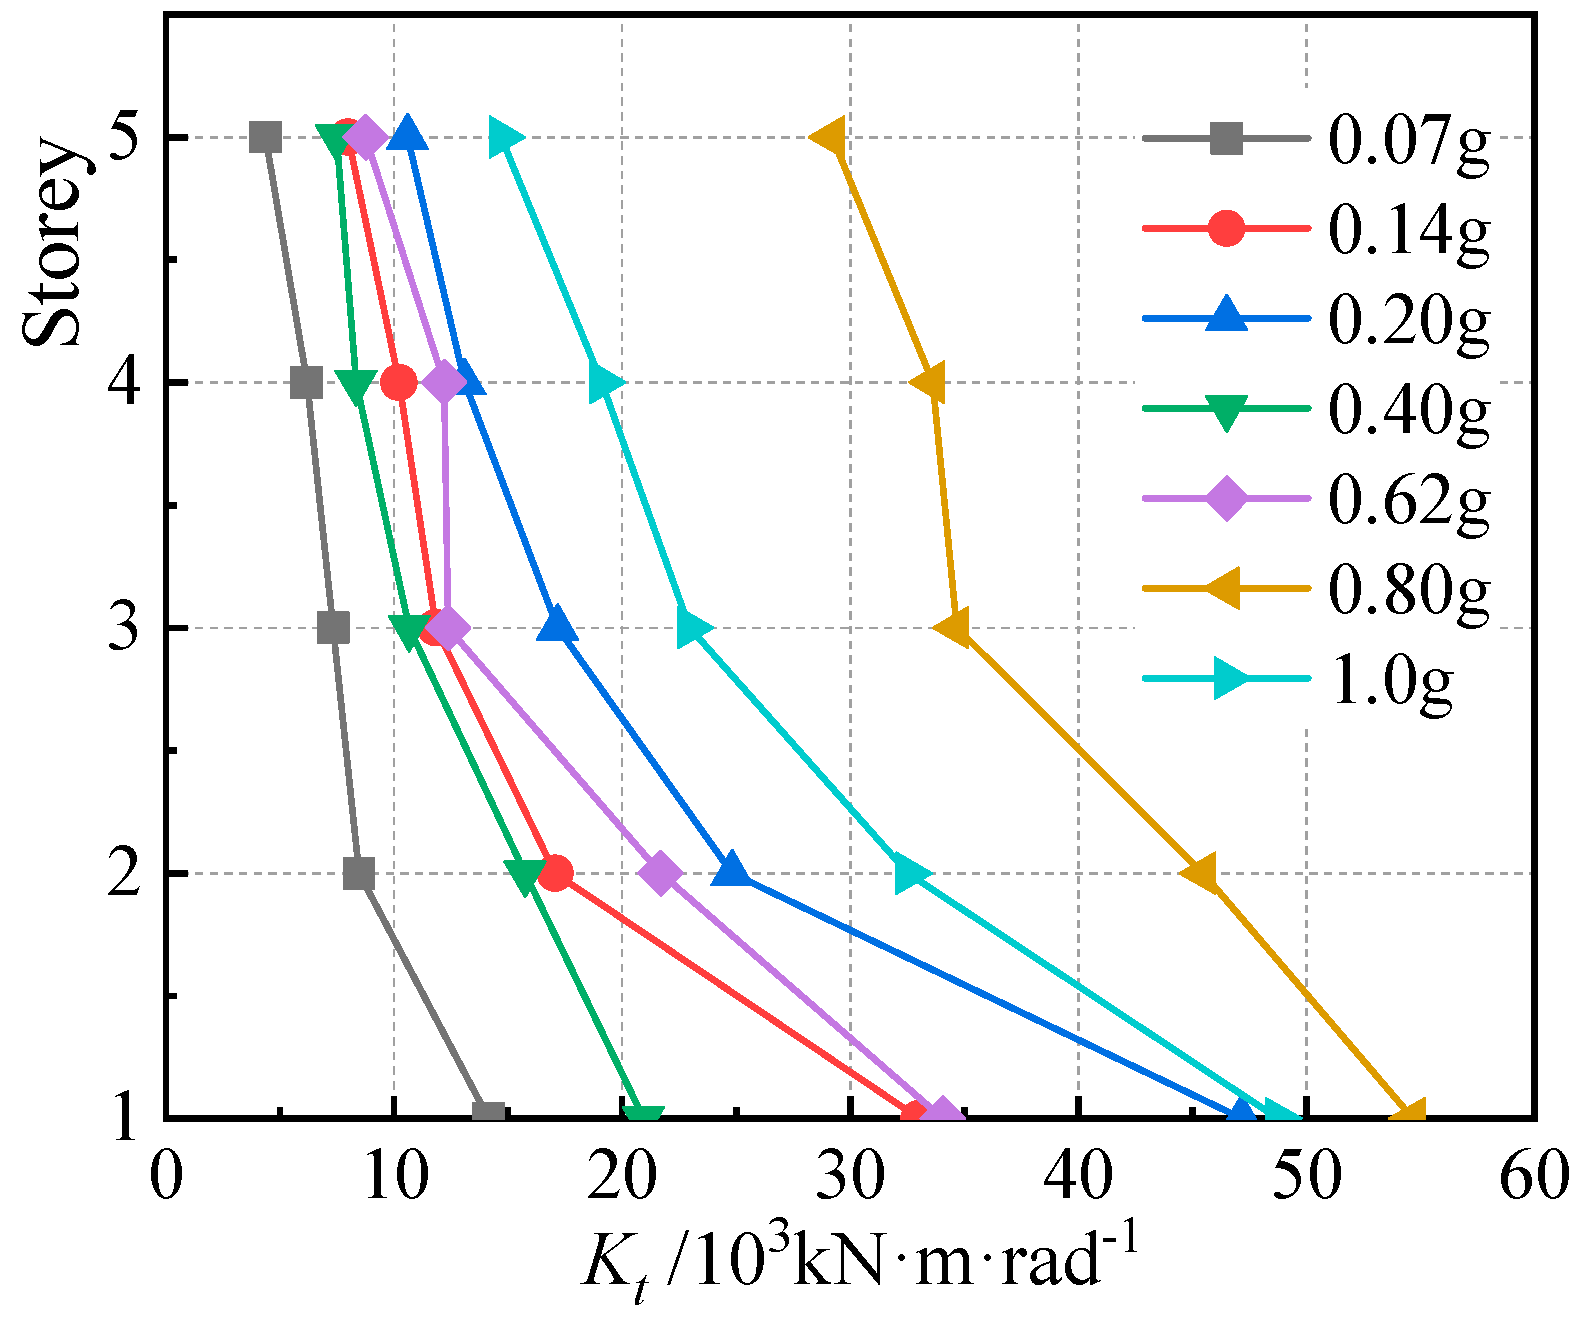
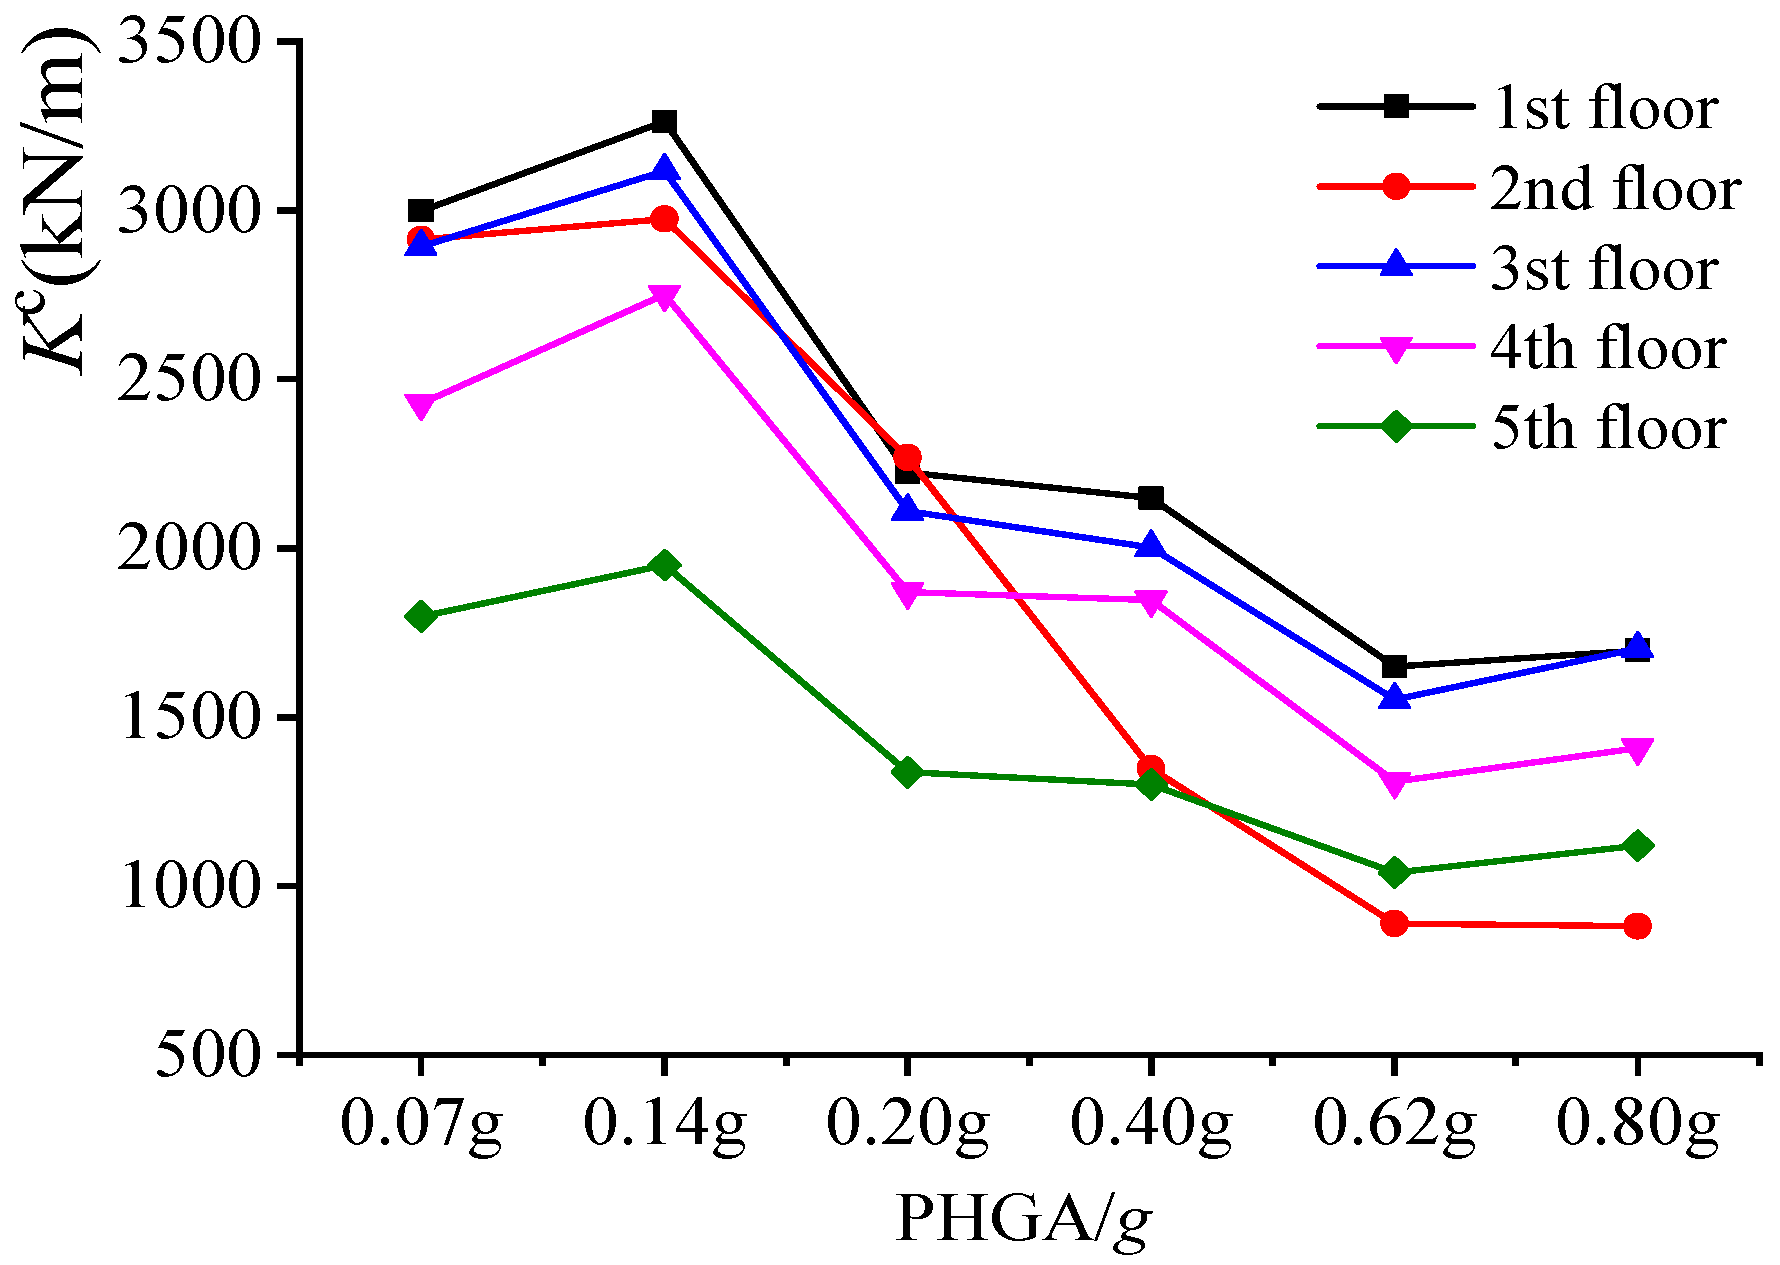
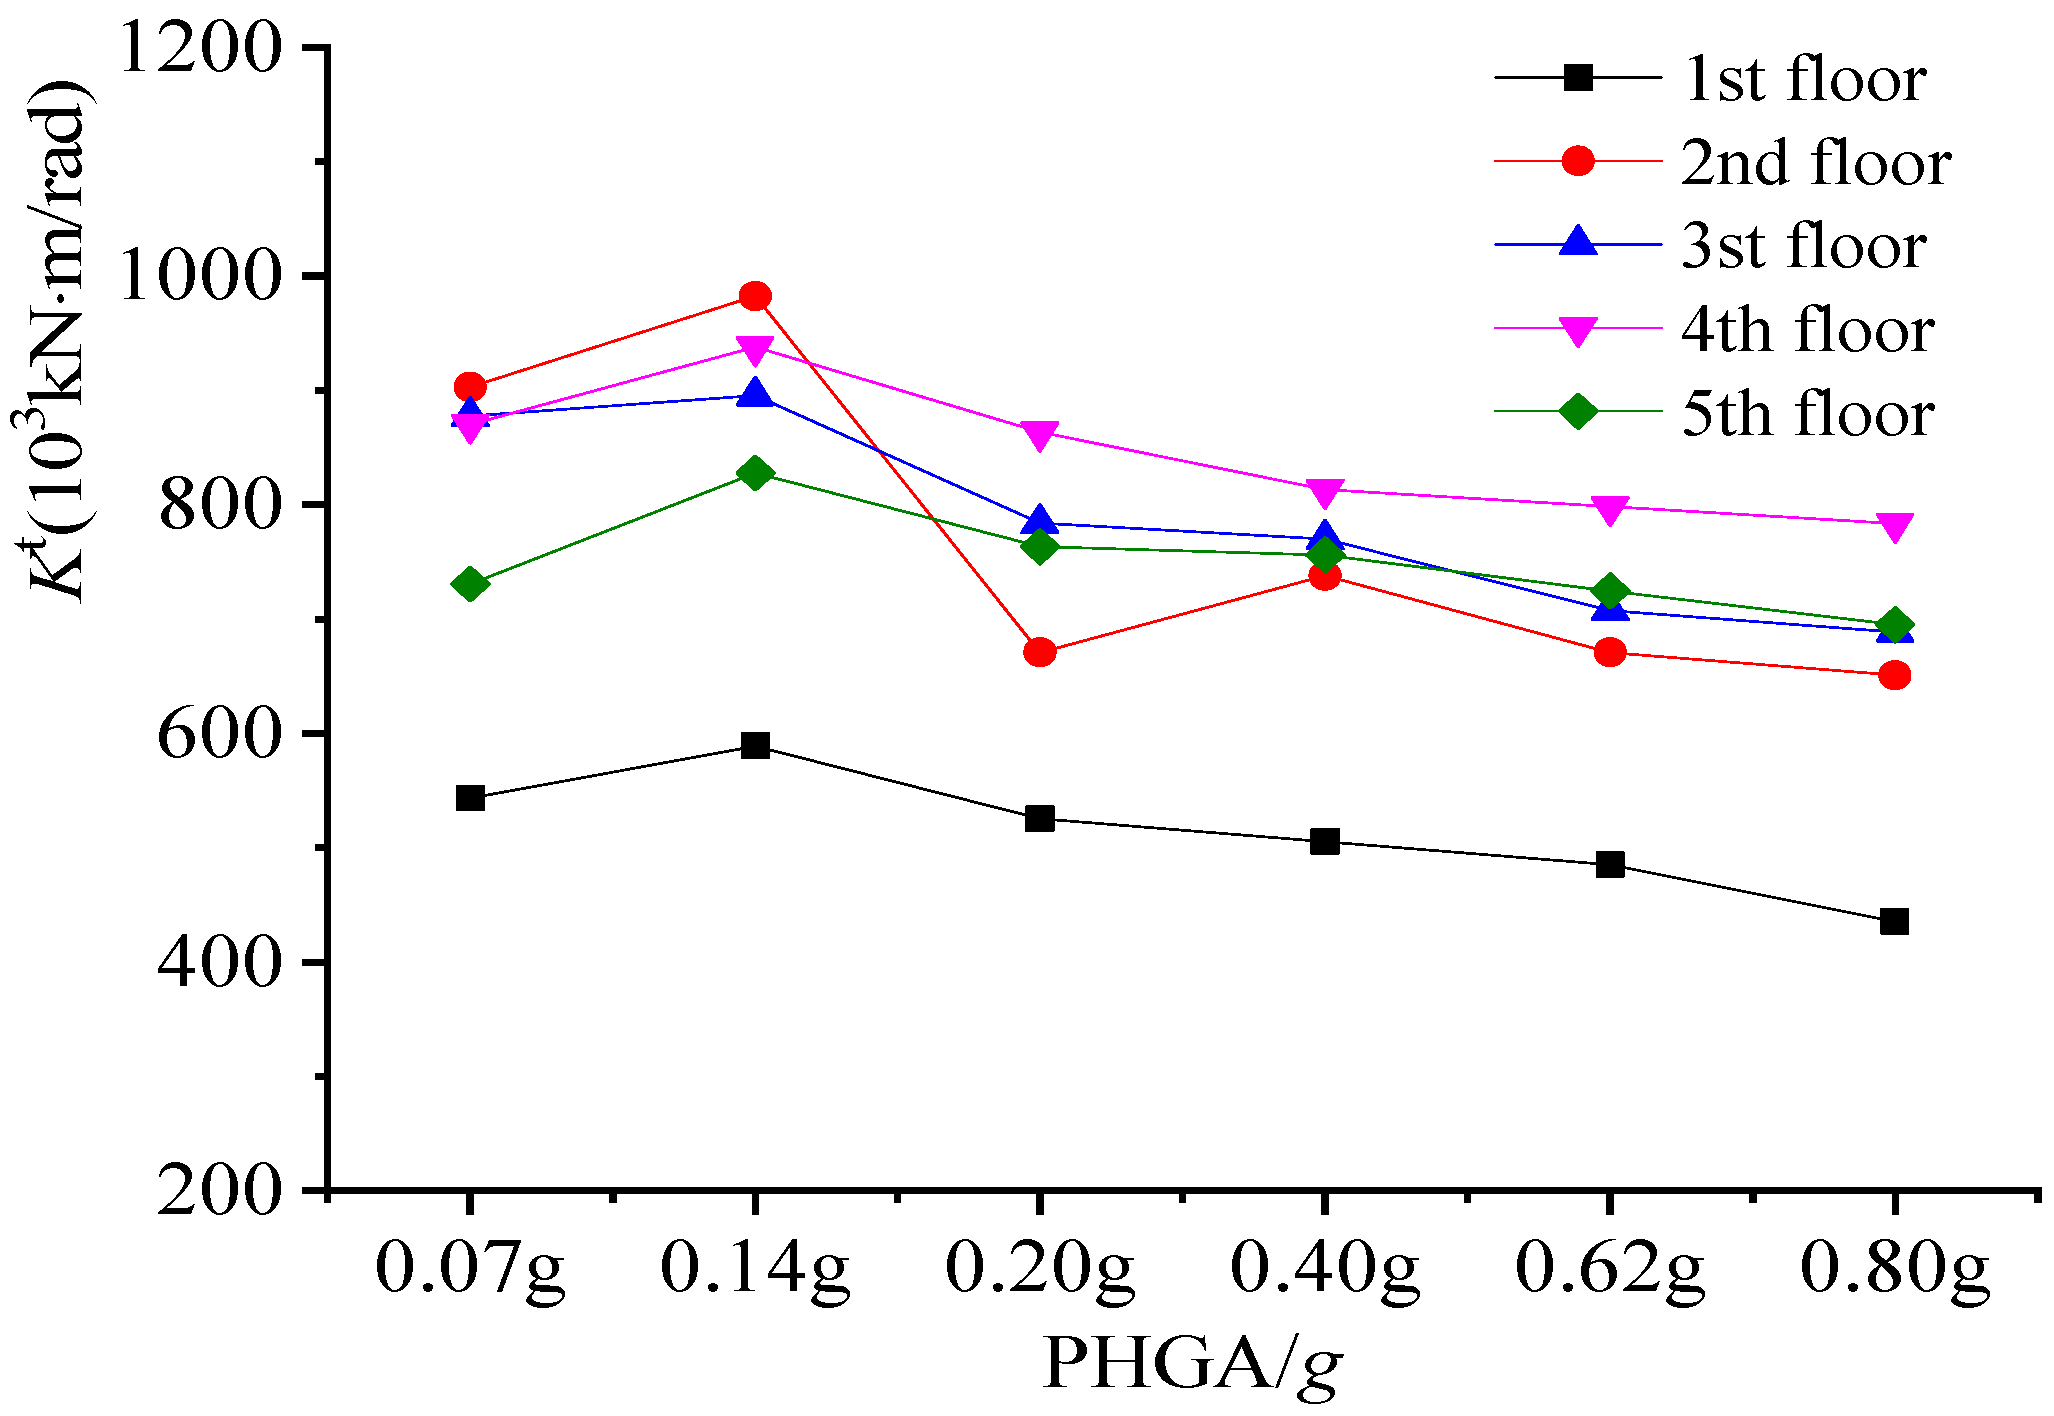
4.6. Column Torsional Stiffness

Similarly, the ratio of column torsion to inter-story torsional rotation demonstrates corresponding column torsional stiffness at the same level. Figure 14 presents the maximum torsional stiffness variations for the ZA2 T-shaped column under the influence of three different seismic waves. The table reveals that the torsional stiffness of the SRC column on each floor increases as the peak ground acceleration increases. Generally, variations in column-end torsional rotation result in minimal torsional deformation of the columns under accidental torsion. Although an increase in torsional deformation is observed during later loading stages, it remains within the elastic torsion range. Therefore, the torsional stiffness of the special-shaped columns corresponds well with their initial torsional stiffness.

5. Comparison Between the Experimental Results and Theoretical Calculations

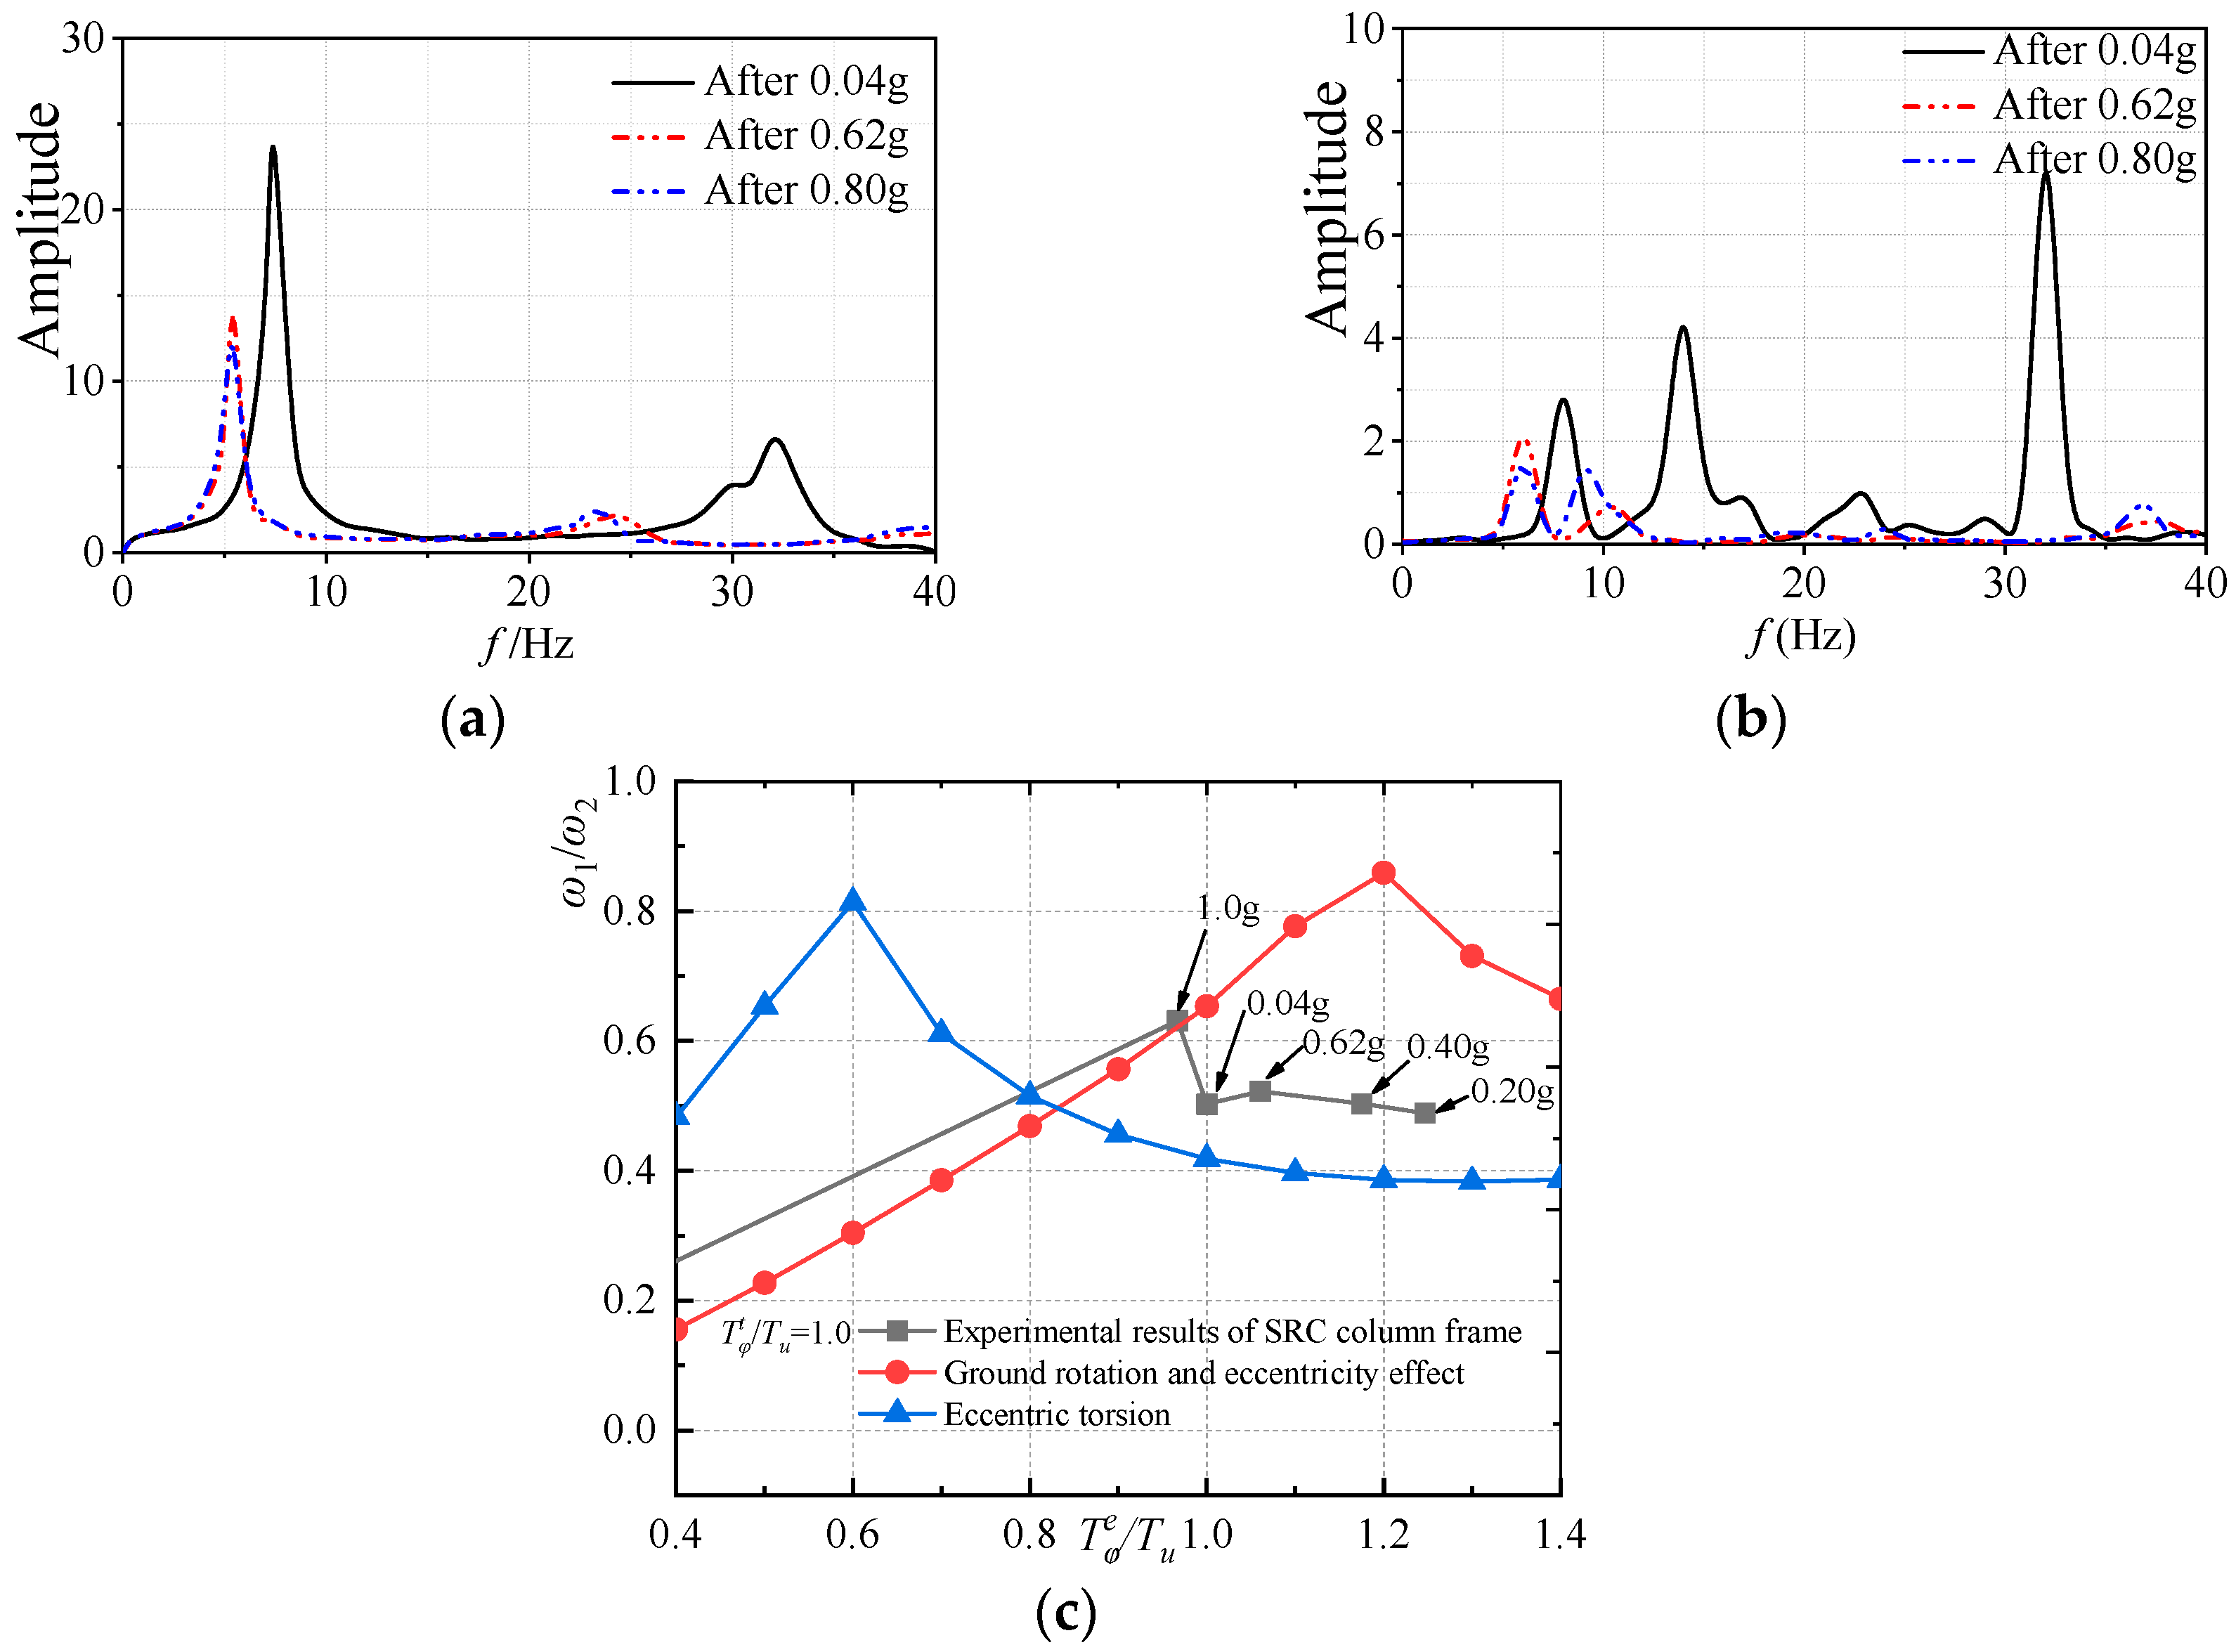
5.1. Comparison of the Natural Frequency Ratio

As shown in Figure 15a,b, the acceleration response signals of the respective layer of the model structure are obtained by scanning the frequency of the model structure with white noise. Subsequently, the acceleration signal on the base serves as the excitation signal and the acceleration signal on the respective floor is employed as the output signal. The frequency response function (transfer function) of each floor is determined through frequency domain analysis of the excitation signal and the output signal. The amplitude–frequency curve and phase–frequency curve of the model can be generated using the transfer function. The frequency value corresponding to the peak value of the amplitude–frequency curve represents the order natural frequency of the model structure in turn. As shown in Figure 15c, the measured structural lateral–torsional natural frequency ratio considering ground rotation is close to the calculated results from the mathematical model. The peak point appears near the lateral–torsional period ratio of 0.89.

5.2. Comparison of the Torsional Effect

The experimental results indicate that the maximum ratio of torsional to horizontal displacements in the X direction is 0.0007 for the ground floor of the steel–concrete special-shaped column frame structure subjected to tri-directional seismic action. Figure 16 illustrates the comparison between the theoretical torsional effect and experimental values, taking into account Y-axis torsion coupling. Figure 17 shows the comparison between the theoretical torsional effect and experimental values, considering ground rotational components.
The comparisons reveal that for the steel–concrete special-shaped column structure when accidental relative eccentricity e y / r is less than 0.1 in the Y direction, and if the torsional force amplification effect due to ground rotation is considered, the dynamic eccentricity should be calculated using static equivalent calculations to determine the torsional response in the seismic design code.
e d = 2 e y ± 0.1 r ,
where ed is the dynamic eccentricity, ey is the static equivalent eccentricity, and r is the rotational radius of the floor. This equation fully considers the dynamic effect of torsion, the amplification effect of ground rotation on torsion, and the influence of accidental eccentricity.

5.3. Comparison of Base Shear

Using the CQC method, the base shear ratio for the structure was obtained, considering both cases with and without coupling, as follows:
V V s = V 1 2 + V 2 2 + 2 ρ 12 V 1 V 2 α G ,
The measured base shear ratio of the SRC structure under seismic action, compared to the theoretical base shear value without coupling, is calculated as follows:
V V s = V m α G ,
where V1 and V2 represent the base shear forces generated by horizontal and torsional seismic forces, respectively; Vm denotes the maximum measured inter-story base shear of the SRC structure; αG is the corresponding seismic shear without considering coupling; and α represents the seismic amplification factor, which is taken as the design level of 8 degrees.
Figure 18a illustrates the base shear ratio considering coupling effects on the base shear but without considering coupling within the structure, and it is compared with the measured base shear of the steel-reinforced concrete (SRC) structure. Figure 18b shows the comparison between the theoretical value of base shear considering ground rotational components and the maximum measured base shear of the SRC structure. The result analysis indicates that the maximum ratio of the measured base shear to the theoretical base shear without considering coupling in the SRC special-shaped column structure under seismic action is 0.93. When Tφe/Tu < 0.75, the maximum measured base shear is less than the total base shear of the eccentric structure. However, when Tφe/Tu ≥ 0.75, the total base shear of the eccentric structure decreases, and the maximum measured base shear of the structure increases beyond that of structures with the same lateral stiffness.

5.4. Comparison of Special-Shaped Column Shear Force

The displacements of column Z1A at the locations highlighted in Figure 1 for the first and second vibration modes are expressed as follows:
u Z 1 A 1 = u 1 + y φ 1 ,   u Z 1 A 2 = u 2 + y φ 2 ,
where y is column Z1A in the Y direction and φ1 and φ2 are the floor rotation angles in the first and second vibration modes, respectively.
The displacement of column Z1A is calculated using the CQC method and is expressed as follows (Maheri et al., 1991) [23]:
u Z 1 A 1 = u Z 1 A 1 2 + u Z 1 A 2 2 + 2 ρ 12 u Z 1 A 1 u Z 1 A 2 ,
By considering the ground rotation effect without coupling, the shear force ratio of column Z1A is calculated as follows:
u Z 1 A V S = k x u Z 1 A α G k x / k x = u Z 1 A 1 2 + u Z 1 A 2 2 + 2 ρ 12 u Z 1 A 1 u Z 1 A 2 α g / ω x 2 ,
where k x represents the lateral stiffness of column Z1A in the X direction and k x is the lateral stiffness of the floor in the X direction. The position of the member in the Y direction is assumed by a multiple of the floor rotation radius, expressed as y = ηr.
Figure 19 illustrates that the shear force ratio, considering ground rotation and without coupling, remains consistent when accounting for the influence of eccentricity. When the relative eccentricity ey/r is constant and the relative position of the column remains unchanged, a significant increase in the shear force of column Z1A is observed, as Tφt/Tu increases to a value equal to or greater than 2.0 compared to the shear force when only considering the influence of eccentricity.
The shear force of the Z1A T-shaped columns during an earthquake is calculated as the ratio of the shear force to the theoretical shear force value of the corresponding position component, without considering coupling. This is expressed as follows (Kuang and Liu 2022) [15]:
V Z 1 A V s = k x u m α G k x / k x ,
where um is the maximum measured displacement at the top of the Z1A T-shaped column, k x is the lateral stiffness of the Z1A T-shaped column in the X direction, and k x is the lateral stiffness of the floor in the X direction.
Figure 20 presents a comparison between the theoretical shear force and the maximum measured shear force of the Z1A column while accounting for ground rotational components. The results indicate that the ratio of the maximum measured shear force of the Z1A T-shaped column under seismic action to the theoretical shear force, without considering coupling, is 0.65. It is observed that the maximum measured shear force value of the Z1A T-shaped column is lower than the shear force value when considering ground rotational components. This suggests that ground rotation has a significant amplification effect on the internal forces of the column components.

5.5. Comparison of Torsional Stiffness

Considering ground rotation, the torsional stiffness of each floor is expressed as follows:
k φ φ = k φ φ e + k φ φ t ,
where k φ φ e is the sum of the torsional stiffness of the lateral force-resisting members, k φ φ e = k x i y i 2 + k y j y j 2 . k x i and k y j are the corresponding column lateral stiffness in the X and Y directions, respectively. k φ φ t is the torsional stiffness of the floor diaphragm induced by ground rotation.
The ratio of the column shear force to the inter-story lateral displacement corresponds to the column lateral stiffness at the same level. Figure 21 illustrates the maximum lateral stiffness variations for the ZA2 T-shaped columns under three seismic waves. The figure indicates that as peak acceleration increases, the inter-story displacement of the model continuously increases, while the column lateral stiffness gradually decreases. Specifically, the column lateral stiffness of the second floor decreases rapidly, indicating significant stiffness degradation. The equivalent torsional stiffness of the model floors is determined according to Equation (30), and the analysis results are shown in Figure 22. The figure reveals that under accidental torsion, the torsional deformation of the floor is relatively small, and the inter-story torsional displacement increases slowly. The degradation in each floor’s torsional stiffness is insignificant.

6. Conclusions

The establishment of a linear seismic response analysis model that considers ground rotation effects and eccentric torsion informed the investigation of the linear response characteristics of coupled lateral–torsional vibration, considering eccentricity and ground rotation. A comparative study of the coupled lateral–torsional vibration response pattern of SRC special-shaped column structures was conducted. The main conclusions obtained are as follows:
(1)
Considering the influence of ground rotation and eccentric torsion on the model, the lateral displacement of the structure and floor torsion is primarily induced by horizontal seismic components and floor eccentricity. The seismic torsion of the model is attributed to ground rotational components. The floor torsional angle is equivalent to the sum of the inter-story and pure torsional angles caused by eccentric torsion and ground rotation, respectively.
(2)
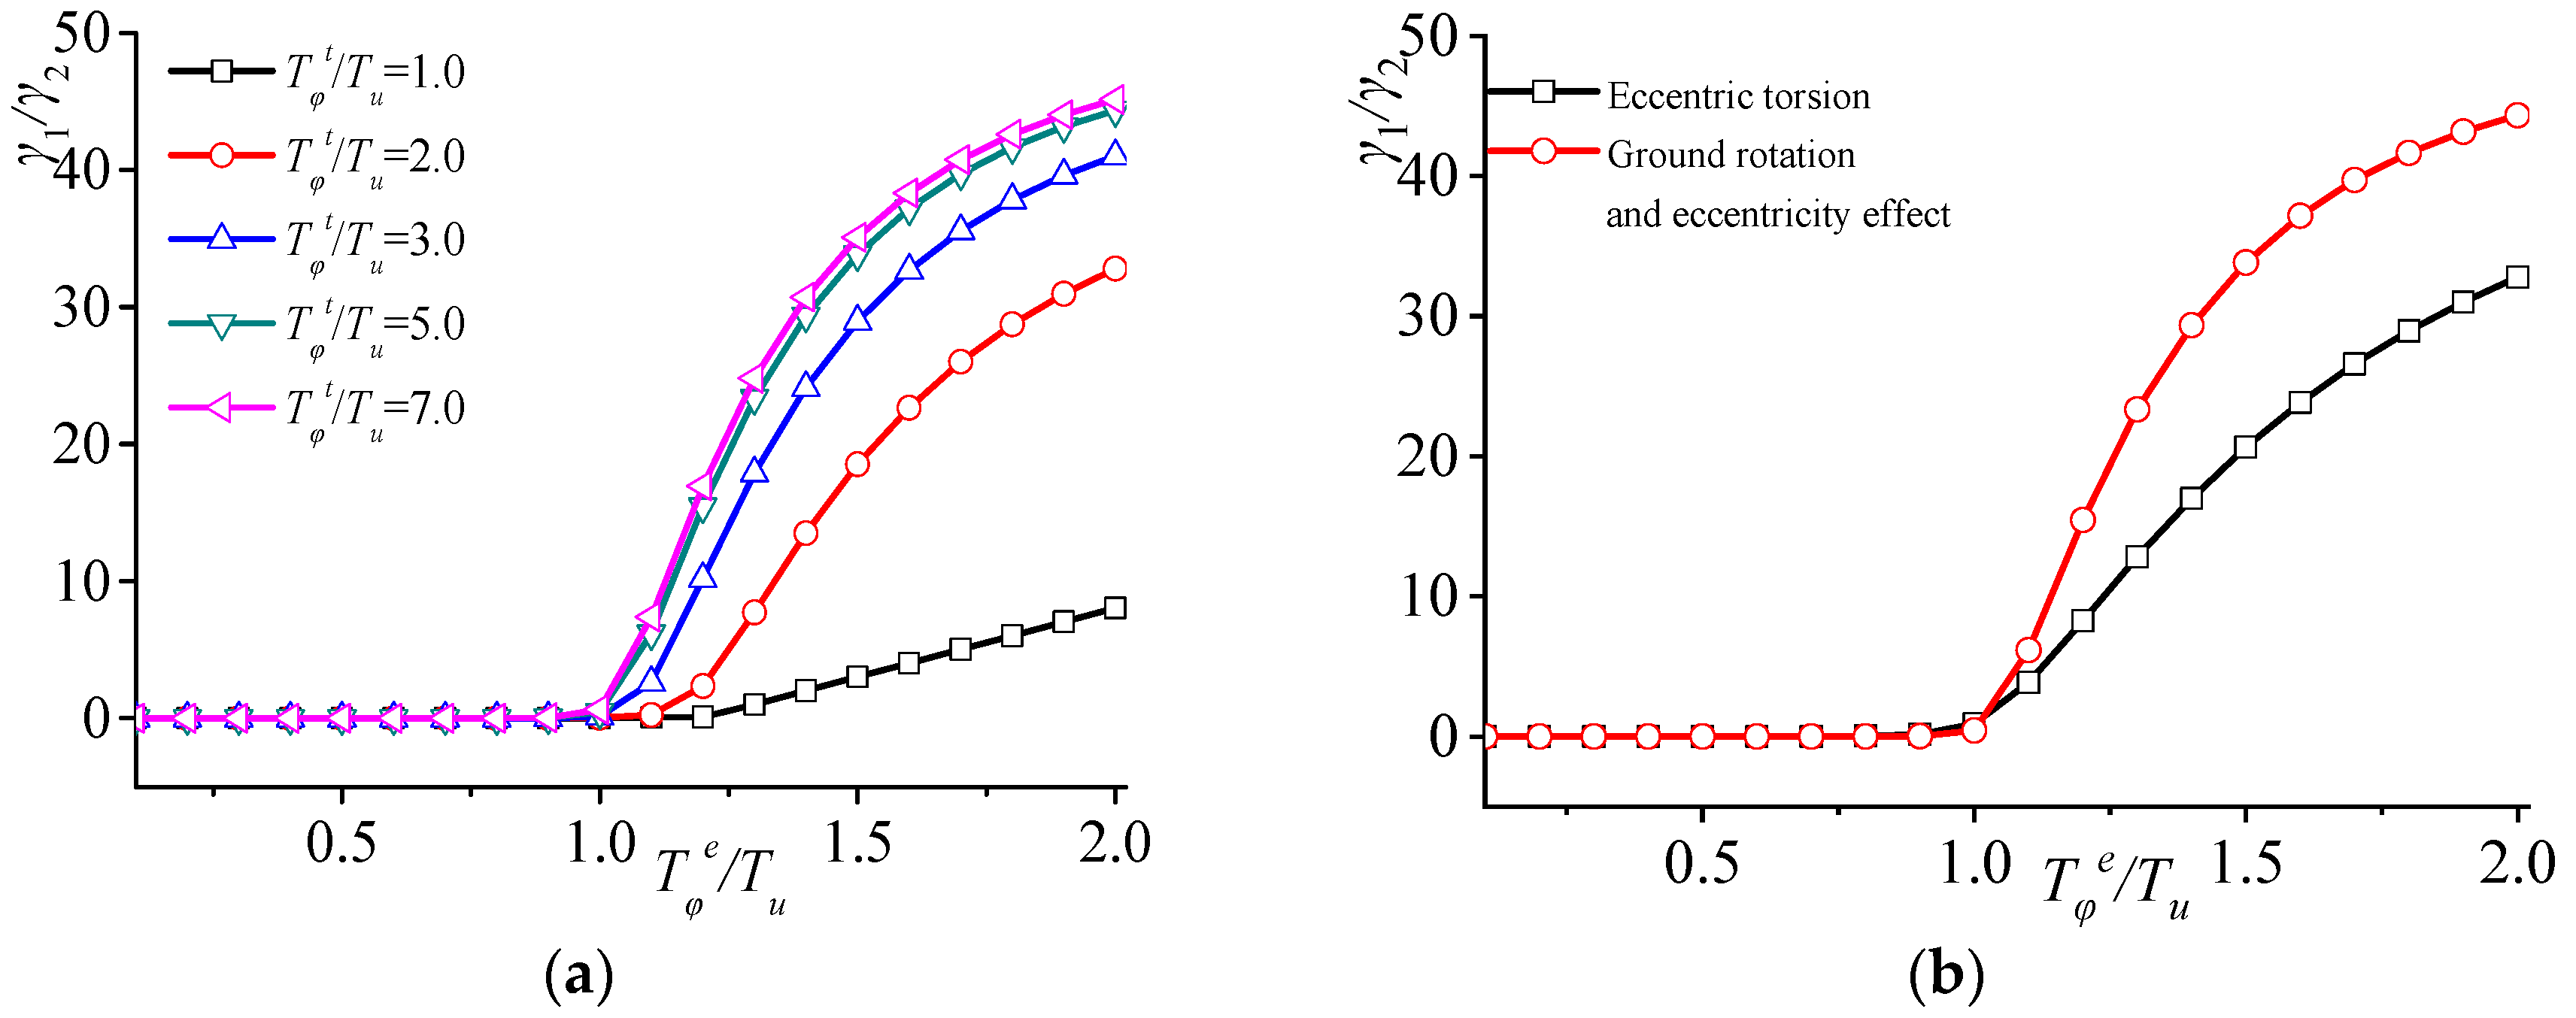
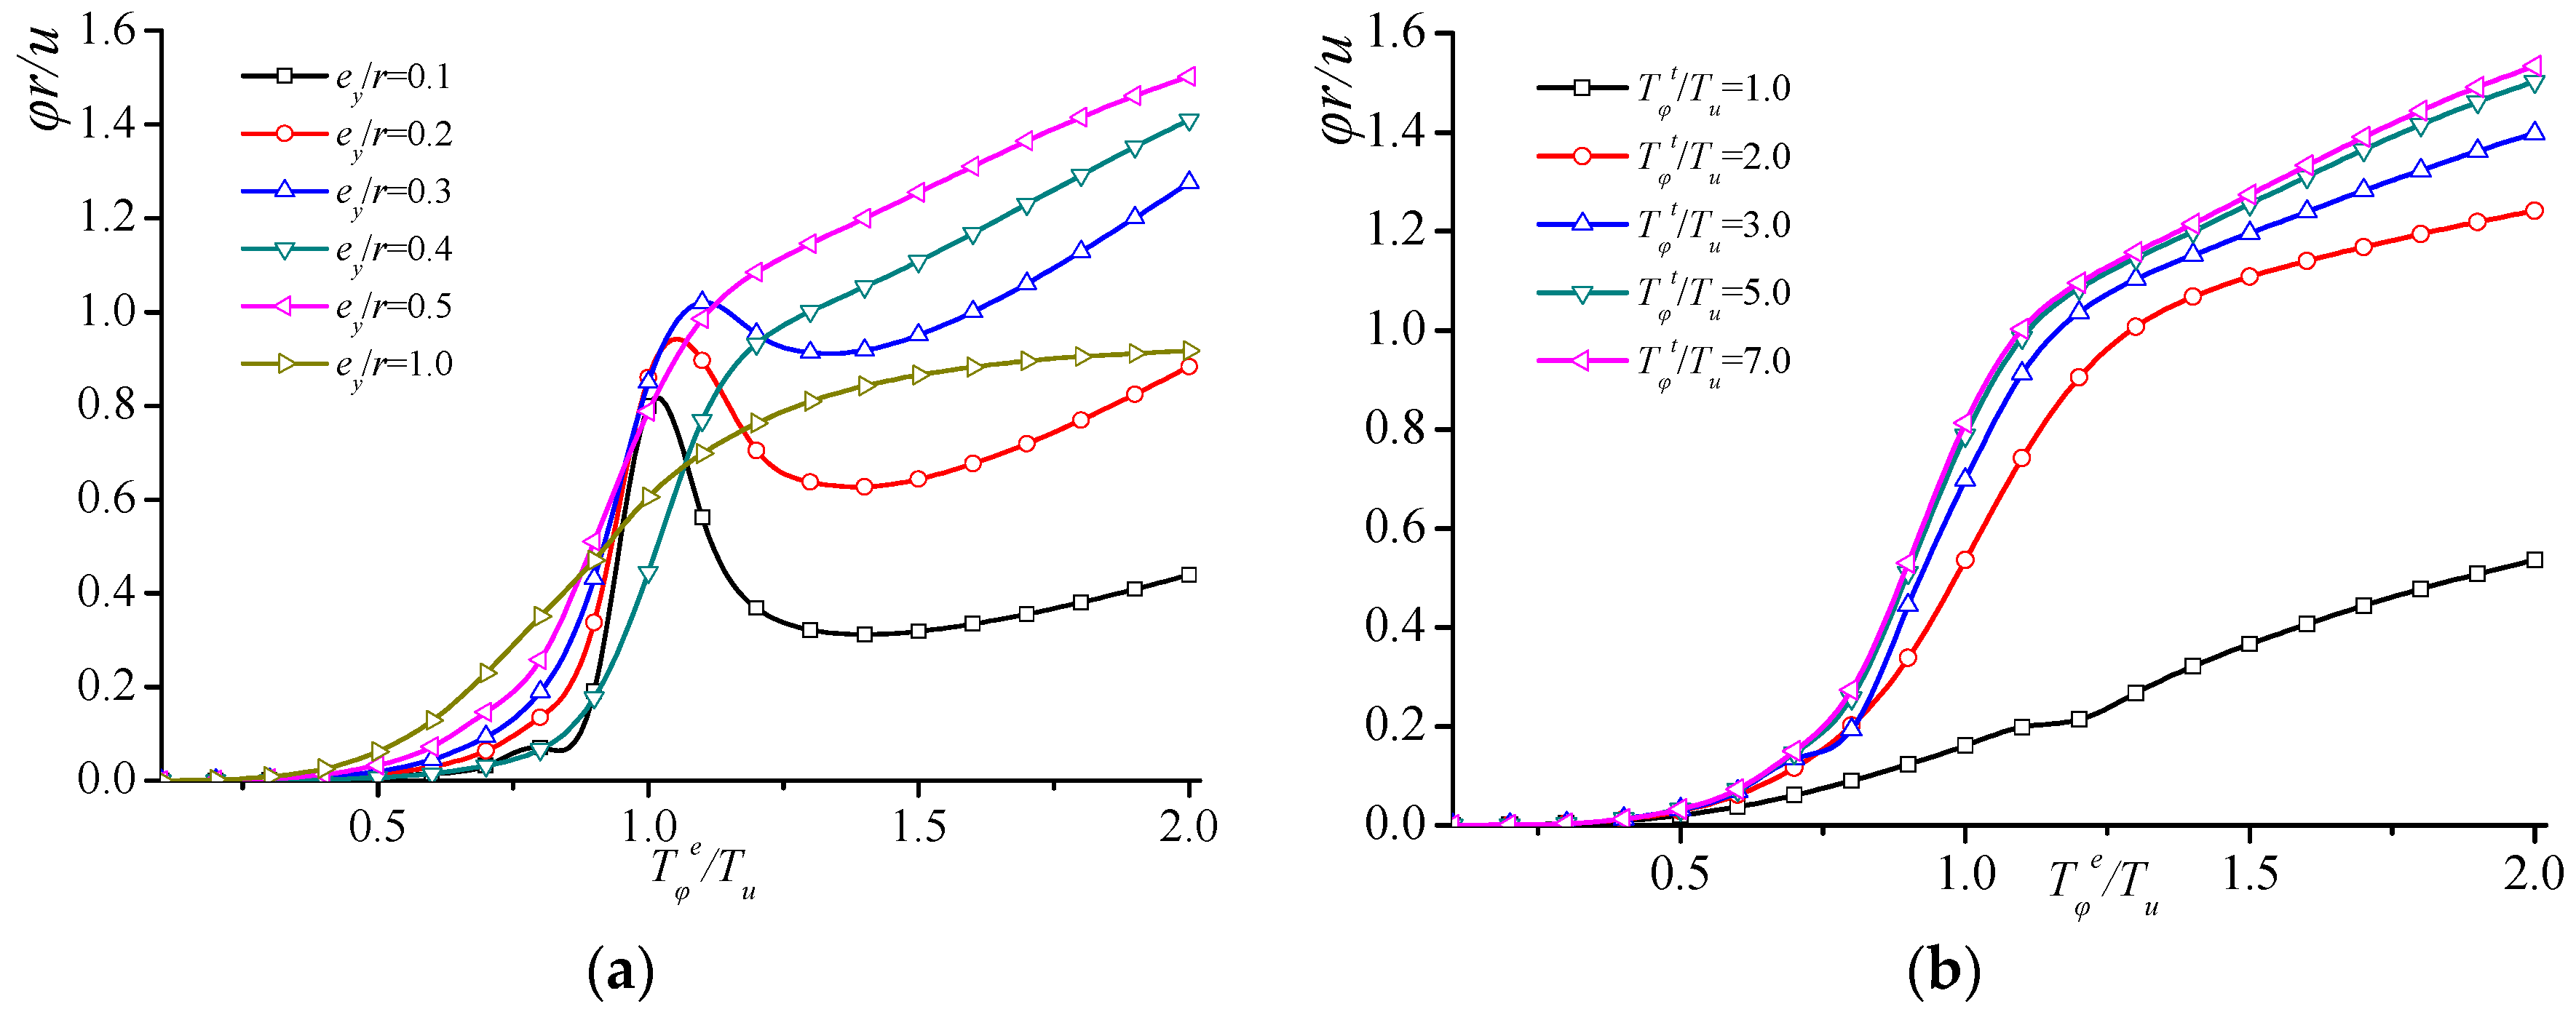
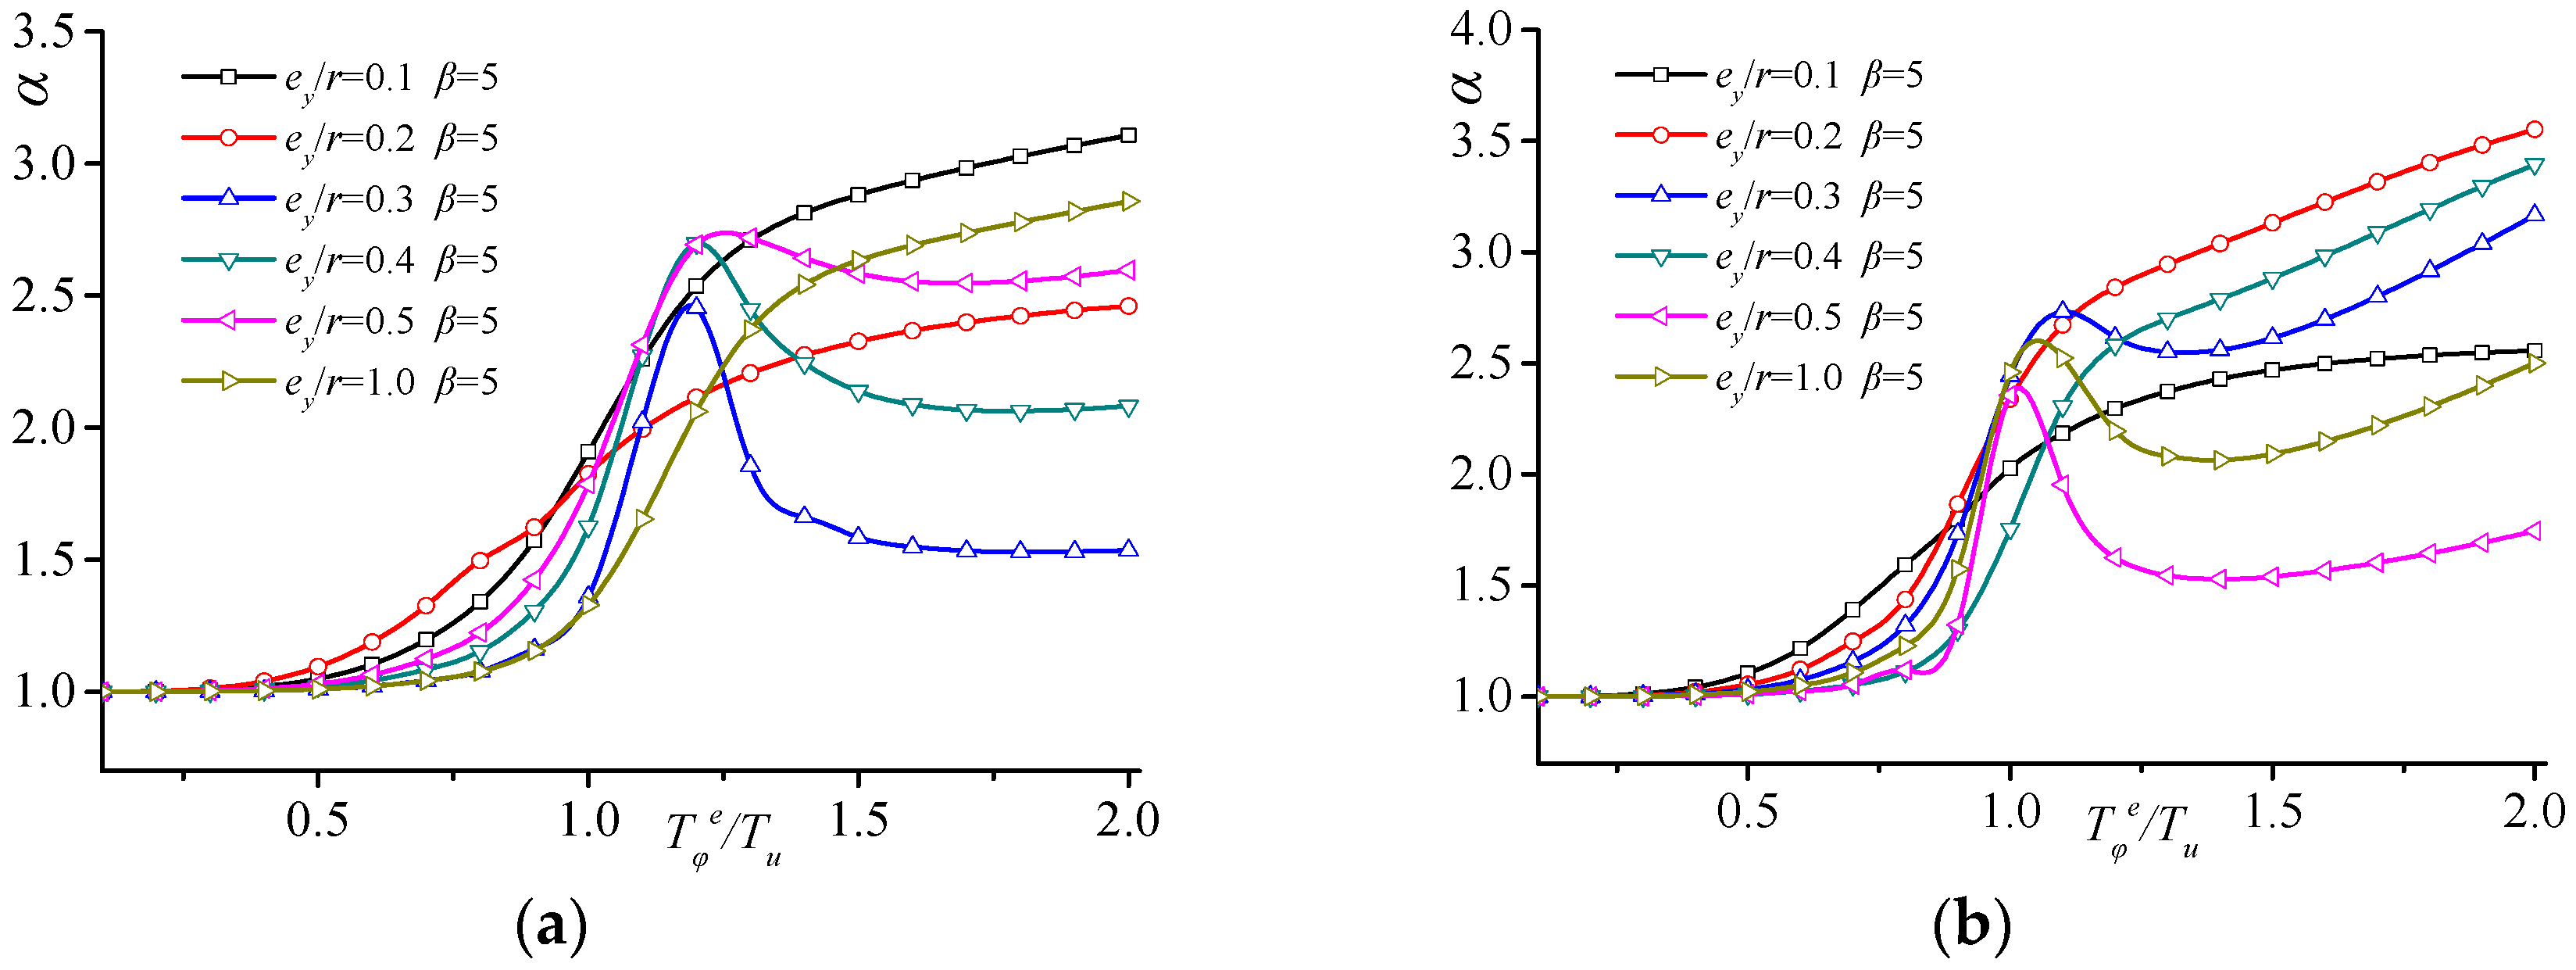
The natural vibration frequency of a structure, considering the influence of ground rotation, is a function of relative eccentricity ey/r, the lateral–torsional period ratio Tφt/Tu caused by ground rotation, and the lateral–torsional period ratio Tφe/Tu considering only eccentric torsion. The following conclusions are drawn from the variation analysis of the natural vibration frequency ratio, torsional amplitude ratio, mode participation factor ratio, and relative torsional index of the structure, considering the influence of ground rotation. When eccentricity ey/r is constant and Tφt/Tu remains unchanged, the peak points of the natural vibration frequency ratio and the lateral–torsional coupling coefficient, considering ground rotation, shift significantly compared to when considering only eccentricity under the same conditions. Once Tφe/Tu surpasses 1.0, the torsional amplitude increases remarkably, and the first vibration mode participation indicates elevated values compared to the scenario where only eccentricity is taken into account. When considering torsional dynamic effects, the accidental relative eccentricity e y / r of the SRC special-shaped structure in the Y-axis is less than 0.1.
(3)
The shaking table test results facilitate the acquisition of the natural characteristics, translational response, torsional response, and internal force distribution of the SRC special-shaped column frame structure. Under intense earthquake conditions, the inter-story stiffness of the structure degrades rapidly. The maximum displacement angle of the structure is observed to be 1/14, the maximum accidental eccentric torsional angle is measured at 18.8 × 10⁻⁷, and the maximum inter-story displacement angle resulting from lateral–torsional coupling is recorded as 1/48. Throughout the experimentation, the torsional response of the SRC special-shaped column remains within the elastic stage. For the special-shaped column structure that meets the height limitation requirement specified in the code, the influence of accidental eccentricity and lateral–torsional coupling on its seismic performance is relatively minimal.
(4)
By comparing experimental and theoretical values, the measured structural lateral–torsional natural frequency ratio considering ground rotation is close to the calculated results from the mathematical model. The maximum ratio of torsional displacement at the ground floor to the horizontal displacement in the X direction of the SRC special-shaped column frame structure under three-directional seismic action is 0.0007. The torsional effect, torsional stiffness, and internal force theoretical calculations of the special-shaped column correspond well to the experimental results, indicating that they can be used for analyzing lateral–torsional vibration response patterns of structures.

Author Contributions

Writing—original draft, Z.H.; Funding acquisition, J.X. All authors have read and agreed to the published version of the manuscript.

Funding

Financial assistance was provided by the Shaanxi Province Natural Science Basic Research Project under Grant 2023-JC-YB-419, the Postdoctoral Science Foundation of China under Grant 2020M683432, and the Natural Science Foundation of China under Grant 51308444.

Data Availability Statement

All data that support the findings of this study are included in this manuscript.

Conflicts of Interest

The authors declare no conflicts of interest.

References

  1. Shetty, S.; R.M., S.; Bhandary, S.; Shetty, T. Comparative study on seismic performance of specially shaped RC columns with that of rectangular columns in high-rise structures. Int. J. Struct. Integr. 2019, 1, 202–215. [Google Scholar] [CrossRef]
  2. Patel, D.S. Comparative Seismic Behaviour Study of Special Shaped Column Framed Reinforced Structure. Int. J. Res. Appl. Sci. Eng. Technol. 2020, 8, 714–719. [Google Scholar] [CrossRef]
  3. Zheng, Z.; Zhang, J.; Miao, Y.; Zhou, B.; Huang, W.; He, Y.; Lu, Q.; Wang, Y. Performance of T-shaped CFST columns with embedded T-shaped steel skeleton under axial compression. J. Constr. Steel Res. 2024, 215, 108554. [Google Scholar] [CrossRef]
  4. Salah, A.; Elsanadedy, H.; Abbas, H.; Almusallam, T.; Al-Salloum, Y. Behavior of axially loaded L-shaped RC columns strengthened using steel jacketing. J. Build. Eng. 2022, 47, 103870. [Google Scholar] [CrossRef]
  5. Liu, Z.; Wang, X.; Zhou, Z.; Xue, J.; Lai, B.; Xu, J. Experimental and numerical study on seismic performance of steel reinforced concrete spatial frame with irregular section columns. Eng. Struct. 2021, 242, 112507. [Google Scholar] [CrossRef]
  6. Guo, X.; Yin, P. Study on Seismic Performance of Concrete Special-shaped Columns. Int. Core J. Eng. 2023, 9, 1–6. [Google Scholar] [CrossRef]
  7. Liang, Y.; Chen, Z.; Liu, X.; Liao, H. Seismic behavior of RC cross-shaped column under combined torsion loading: Experiment and simulation finite element. Structures 2023, 47, 1652–1667. [Google Scholar] [CrossRef]
  8. Jiang, Z.Q.; Niu, Z.Y.; Zhang, A.L.; Liu, X.C. Design method of axial compression stability for cross-section corrugated plate steel special-shaped column. Thin-Walled Struct. 2024, 194, 111243. [Google Scholar] [CrossRef]
  9. Tao, S.Q.; Liu, Y.; Wang, J.F.; Yu, Q.J.; Zhao, J.H. Experimental investigation and design method of axial compression behavior of T-shaped partially encased steel-concrete composite stub columns. J. Build. Eng. 2024, 85, 108668. [Google Scholar] [CrossRef]
  10. Zhang, X.; Far, H. Effects of dynamic soil-structure interaction on seismic behaviour of high-rise buildings. Bull. Earthq. Eng. 2021, 20, 3443–3467. [Google Scholar] [CrossRef]
  11. Li, X.; Liu, J.; Wang, X.; Chen, Y.F. Test and design of eccentrically-loaded slender circular tubed columns filled with high-strength concrete and reinforcement. Structures 2023, 51, 1461–1473. [Google Scholar] [CrossRef]
  12. Sunagar, P.; Gowda, R.; Nayak, S.; Sumalatha, J. Seismic vulnerability and resilience of steel-reinforced concrete (SRC) and composite Structures. Des. Eng. 2021, 1, 11455–11469. [Google Scholar]
  13. Wang, L.; Zhou, Y.; Nagarajaiah, S.; Shi, W. Bi-directional semi-active tuned mass damper for torsional asymmetric structural seismic response control. Eng. Struct. 2023, 294, 116744. [Google Scholar] [CrossRef]
  14. Ismail, M. New approach to seismic-resistant design and structural torsion mitigation. Eng. Struct. 2020, 207, 110092. [Google Scholar] [CrossRef]
  15. Kuang, Y.; Liu, Y. Parametric analysis of the whole loading process of translation-torsion coupled vibration characteristics of the multi-layer bi-directional eccentric frame structure. J. Theor. Appl. Mech. 2022, 60, 479–494. [Google Scholar] [CrossRef]
  16. Hao, H. Torsional response of building structures to spatial random ground excitations. Eng. Struct. 1997, 19, 105–112. [Google Scholar] [CrossRef]
  17. Lai, X.; He, Z. A generalized hybrid model considering earthquake-induced internal force distribution rules for super high-rise frame-core tube structures. Eng. Struct. 2022, 268, 114745. [Google Scholar] [CrossRef]
  18. Wen, J.; Xiong, H.; Bu, G.; Xu, C.; Chen, K.; Wen, J. Seismic fragility of vertically irregular gravity column-core tube structure subjected to pulse-like ground motions. Structures 2024, 62, 106217. [Google Scholar] [CrossRef]
  19. Mao, H.; Yan, X.; Wei, X.; Liu, X. Seismic analysis of a frame structure equipped with displacement-amplified torsional dampers. Structures 2022, 41, 190–202. [Google Scholar] [CrossRef]
  20. Alam, Z.; Sun, L.; Zhang, C.; Noroozinejad Farsangi, E. Global performance of multi-story stiffness-eccentric RC structures subjected to progressive seismic excitations: Shaking table investigations. J. Build. Eng. 2023, 64, 105582. [Google Scholar] [CrossRef]
  21. GB 50011-2010; Code for Seismic Design of Buildings. Ministry of Housing and Urban-Rural Development of the People’s Republic of China, China Architecture & Building Press: Beijing, China, 2016.
  22. JGJ149-2017; Technical Specification for Concrete Structures with Specially Shaped Columns. Ministry of Housing and Urban-Rural Development of the People’s Republic of China, China Architecture & Building Press: Beijing, China, 2017.
  23. Maheri, M.R.; Chandler, A.M.; Bassett, R.H. Coupled lateral-torsional behaviour of frame structures under earthquake loading. Earthq. Eng. Struct. Dyn. 1991, 20, 61–85. [Google Scholar] [CrossRef]
Figure 1. Dynamic model of the single-story eccentric structure.
Buildings 15 01300 g001
Figure 2. Inter-story torsion and floor torsional stiffness.
Buildings 15 01300 g002
Figure 3. Natural vibration frequency ratio and coupling coefficient of the structure.
Buildings 15 01300 g003
Figure 4. Variation pattern of torsional amplitude. (a) e/r = 0.1. (b) e/r = 0.1 and Tφt/Tu = 5.0.
Buildings 15 01300 g004
Figure 5. Participation degree of vibration mode. (a) e/r = 0.1. (b) e/r = 0.1 and Tφt/Tu = 5.0.
Buildings 15 01300 g005
Figure 6. Relationship among φr/u, ey, Tφe/Tu, and Tφt/Tu. (a) Tφt/Tu = 5.0. (b) e/r = 0.5.
Buildings 15 01300 g006
Figure 7. Torsional displacement ratio α. (a) Tφt/Tu = 2.0. (b) Tφt/Tu = 5.0.
Buildings 15 01300 g007
Figure 8. Test specimen. (a) Test model. (b) Special-shaped column sections.
Buildings 15 01300 g008
Figure 9. Vibration characteristics.
Buildings 15 01300 g009
Figure 10. Distribution of inter-story displacement. (a) Maximum inter-story displacement. (b) Inter-story displacement angle.
Buildings 15 01300 g010
Figure 11. Torsion angle. (a) Torsion angle envelope. (b) Relative torsional angle.
Buildings 15 01300 g011
Figure 12. Distribution of maximum inter-story shear force. (a) X direction. (b) Y direction.
Buildings 15 01300 g012
Figure 13. Shear force of ZA2 T-shaped column. (a) X direction. (b) Y direction.
Buildings 15 01300 g013
Figure 14. Torsional stiffness of the ZA2 T-shaped column.
Buildings 15 01300 g014
Figure 15. Natural frequency ratio considering ground rotation. (a) Amplitude–frequency curve of translational acceleration, (b) amplitude–frequency curve of torsional acceleration, (c) comparison of the natural frequency ratio.
Buildings 15 01300 g015
Figure 16. Comparison between the theoretical torsional effect and the experimental value of lateral–torsional coupling in the Y direction. (a) Platform section of response spectrum. (b) Descending section of response spectrum.
Buildings 15 01300 g016
Figure 17. Comparison between the theoretical torsional effect and the experimental value considering ground rotation.
Buildings 15 01300 g017
Figure 18. Comparison between base shear theoretical and test values considering ground rotational components. (a) Y direction lateral–torsional and ey/r = 0.1. (b) ey/r = 0.5 and Tφt/Tu = 5.0.
Buildings 15 01300 g018
Figure 19. Z1A column shear force.
Buildings 15 01300 g019
Figure 20. Comparison between theoretical and test values of Z1A column shear force.
Buildings 15 01300 g020
Figure 21. Lateral stiffness of the T-shaped column.
Buildings 15 01300 g021
Figure 22. Torsional stiffness of the model.
Buildings 15 01300 g022
Disclaimer/Publisher’s Note: The statements, opinions and data contained in all publications are solely those of the individual author(s) and contributor(s) and not of MDPI and/or the editor(s). MDPI and/or the editor(s) disclaim responsibility for any injury to people or property resulting from any ideas, methods, instructions or products referred to in the content.

