1. Introduction
The excavation of deep foundation pits, as the primary engineering activity involved in this development, may lead to ground settlement, deformation of surrounding structures, and even foundation collapse. Precise and effective pit monitoring could be a critical technical instrument for preventing potential risks and ensuring construction safety by supervision over pit deformation [
1].
Pit monitoring refers to the process of using equipment and instruments to monitor the deformation of the pit support structure and its surrounding environment during the pit excavation process, and then analyzing the monitoring data to assess the safety of pit excavation [
2]. The traditional pit monitoring method that remains to dominate current pit monitoring is single-point monitoring (e.g., inclinometers); however, it has limitations in spatial coverage (less than 30% in large-scale projects), operational efficiency (2–3 times slower in data processing than 3D scanning), and spatiotemporal discontinuity [
3]. These shortcomings hinder the comprehensive 3D deformation analysis and accurate mechanical interpretations of soil–structure interactions.
To address these challenges, researchers have explored advancements in both theoretical analyses and monitoring technologies [
4,
5,
6,
7]. Early studies focused on empirical and numerical approaches. Bolton et al. [
8] carried out various indoor tests to investigate the deformation characteristics of diaphragm walls under different soil conditions and pit parameters. Poh et al. [
9] collated the monitoring data from two pits and calculated the bending moments generated by the diaphragm walls. The results indicated that wall cracking was primarily responsible for the diaphragm wall’s bending moment, while it had no effect on the wall’s lateral displacement. Gao et al. [
10] combined pit monitoring data with 3D simulations, proposing a self-validation method to address theoretical flaws in finite element parameter selection, identifying excavation depth as the primary factor influencing ground settlement near circular diaphragm walls. Wang et al. [
11] simulated metro deep foundation pit supports using finite difference methods, validating the results through the construction monitoring of ground settlement, enclosure structure displacement, support axial forces, and drainage impacts during excavation processes. Liu et al. [
12] revealed through field monitoring that circular pit deformation exhibits temporal–spatial coordination, demonstrating superior stability control compared to square pits with reduced excavation depth sensitivity through the statistical analysis of structural deformation and settlement patterns. Guo et al. [
13] verified the finite difference method’s effectiveness by analyzing asymmetric overload impacts on deep pit supports, achieving consistent results between numerical simulations, elastic foundation beam calculations, and field monitoring data for wall displacement and bending moments. Guo et al. [
14] developed an LSTM (Long Short-Term Memory)-based safety risk model by translating traditional monitoring data into risk metrics for ultra-deep gravel-layer excavation deformation. Predictions show absolute errors of −0.24 to 0.16 mm against field measurements, with risks classified as Level IV (i.e., “unacceptable, requiring action”), offering critical insights for safety in similar geotechnical projects. Sun et al. [
15] proposed a fuzzy AHP-based analytic hierarchy process (AHP) health assessment model for foundation pits, integrating hierarchical factor weighting and fuzzy membership functions to quantify health levels (A–D). Validated with field data, the model identifies Grade B (“basically healthy”) alignment with on-site inspections, enabling data-driven structural safety evaluation from multi-parameter monitoring indices. These limitations of traditional methods have motivated researchers to explore innovative monitoring technologies.
The integration of 3D technologies into pit monitoring has emerged as a prominent research focus, driven by demands for enhanced spatial resolution and real-time deformation analysis. Recent advancements span diverse methodologies: Wu et al. [
16] addressed labor-intensive excavation pit monitoring by developing a UAV image-based method. Utilizing safety inclination angles and point cloud reconstruction, the approach evaluates localized deformation risks through surface fitting, with experiments demonstrating its efficacy for rapid on-site safety assessment. Sun et al. [
17] established a multi-source monitoring system for open-pit slope disasters in Fushun, integrating GNSS, InSAR, LiDAR, and IoT technologies. The displacement rate-based early warning platform demonstrates improved geohazard identification accuracy (84%) and real-time monitoring efficiency across surface, deep strata, and infrastructure. Zhao et al. [
18] integrated distributed optical fiber monitoring and HSS-model finite element analysis to assess deep excavation deformations in soft soils. Comparative analysis with field data demonstrates the HSS model’s 95% accuracy in simulating strain-hardening behavior and fiber optics’ superior data continuity compared to conventional methods. An SSA-BP neural network-based parameter inversion method enhances model calibration, providing reliable deformation warnings for support structures. Wu et al. [
19] proposed a MEMS (micro-electromechanical systems)-based foundation pit monitoring method using time-domain integration algorithms. Fixed-distance tests validate feasibility, while embedded MEMS sensors in model tests capture soil acceleration and rotation angles. Algorithmic integration converts acceleration to displacement, enabling deformation analysis. The results demonstrate the sensors’ accuracy in signal acquisition (error < 3%), establishing a theoretical and experimental framework for MEMS applications in geotechnical monitoring. Liu et al. [
20] developed a GNSS-geomagnetic sensor system for real-time compaction pit monitoring during dynamic compaction. Spatial clustering resolves discrete positional data, enabling automated localization. Validated in the Baihetan Hydropower Project, the method improves positioning accuracy (95%) and efficiency by 37%. Wu et al. [
21] employed Full Scatterer InSAR (FS-InSAR) with Sentinel-1 data (2021–2022) to monitor pre-collapse deformation at the Xinjing Open-Pit Mine, Inner Mongolia. The results reveal accelerated instability (deformation rates > 200 mm/a) in the southern slope since February 2022, achieving high-density monitoring (4758 points/km
2), demonstrating FS-InSAR’s critical role in mining hazard early warning. Lee et al. [
22] employed InSAR, DEM, and PSInSAR techniques to monitor stability at the Okgye limestone open pit. The results reveal a 63.6 mm/year displacement in tailings storage areas (2019–2020) and seasonal oscillations linked to thermal expansion. The integrated approach effectively tracks surface deformation, aiding slope stability management in active mining zones. Yang et al. [
23] implemented a real-time monitoring system (vibration, temperature, and strain sensors) with 5G transmission to assess steel support safety in pit monitoring. Finite element analysis reveals temperature-induced stresses exceed initial prestress levels, vertical vibrations impact worker perception despite negligible structural effects, and combined thermal–vibration conditions maintain safety, offering actionable insights for structural health monitoring. Gao et al. [
24] developed an FBG (Fiber Bragg Grating)-based displacement monitoring method for utility tunnel excavations, integrating a novel sensor-equipped tube as a real-time inclinometer. Experimental validation shows FBG measurements align with conventional inclinometers (accuracy > 98%) in identifying critical slip surfaces, demonstrating its efficiency for rapid, simplified structural health assessment in complex geotechnical environments.
Furthermore, laser scanning has gradually become a typical technology in the field of pit detection to overcome these limitations, owing to its high efficiency and maneuverability [
25,
26,
27,
28,
29]. In the realm of field monitoring, 3D laser scanning is an emerging technology, which is based on the principle of laser ranging to acquire 3D data directly from the entity [
30,
31,
32,
33,
34,
35]. Pit monitoring was expanded the measurement mode and effectively enhanced with the introduction of terrestrial laser scanning (TLS). Pioneering applications include Li et al. [
36], who used 3D laser scanning combined with BIM (Building Information Modeling) in the construction of the National Speed Skating Pavilion to effectively improve the engineering quality management level and efficiency. In order to demonstrate the superiority of the 3D laser scanning method in terms of efficiency and accuracy, Chen et al. [
37] applied 3D laser scanning to the subterranean space, proposed a semiautomatic laser scanning method, and carried out the non-contact rock feature identification and structural surface identification of the underground gold mine in Western Australia. In their initial research, Chen et al. [
38] examined the adoption of 3D laser scanning in foundation pit engineering. They tracked the pit site’s wall deformation and discovered the pit wall’s qualitative trend, which served as a guide for the practical application. Tan [
39] formulated a specific 3D laser scanning monitoring program and a traditional monitoring program for a deep foundation pit project in Nanjing based on theoretical analysis. He also used a combination of numerical simulation and on-site monitoring to further study the deformation laws of the supporting structure, surrounding ground surface, and buildings, exposing deficiencies in the existing support system. To find a way to measure building displacement, Sun et al. [
40] combined UAV images with 3D laser scanning, and generated point cloud data from 2D images to create a 3D model. They verified the feasibility of this method by comparing the measurement results from total stations and 3D laser scanning. Three-dimensional laser scanning has been extensively researched and used for site monitoring [
41,
42,
43,
44,
45,
46], while there is limited research on deep foundation pit monitoring based on 3D laser scanning, and further exploration and utilization of 3D laser scanning monitoring data are relatively lacking.
However, critical scientific and practical problems remain unresolved in current deep foundation pit monitoring: (1) existing methods lack physics-driven data fusion mechanisms to bridge multi-source monitoring data (e.g., 3D laser scanning, inclinometers, and vibration sensors), resulting in the incomplete characterization of soil–structure interactions under dynamic excavation conditions; (2) current neural network models for deformation correction ignore the intrinsic coupling between soil displacement and structural deformation (e.g., Sagaseta’s displacement theory [
47]), leading to limited generalizability across heterogeneous geological environments; (3) inadequate sparse data adaptability: Most correction algorithms require dense traditional monitoring points (>20% coverage), which are infeasible in large-scale projects due to cost and site constraints.
To address these problems, this study proposes an innovative framework for deep foundation pit deformation monitoring through the integration of 3D laser scanning and neural network-assisted data processing. The key contributions include the following:
- (1)
A multi-stage point cloud registration strategy that first utilizes structural bounding boxes for coarse registration and then employs ICP with robust loss functions for fine registration, achieving sub-millimeter accuracy.
- (2)
A neural network model embedding Sagaseta’s image source method [
47] into backpropagation neural network (BPNN) training, enabling sparse data-adaptive correction.
- (3)
Field validation in a commercial and business complex project in Hangzhou, demonstrating 80% consistency with inclinometers monitoring and TLS monitoring (after BPNN correction).
The remainder of this paper is organized as follows: In
Section 2, we detail the application of 3D laser scanning for pit deformation monitoring and correction process. The actual project example applied to test the proposed method is in
Section 3. Finally, the discussion and conclusions are presented in
Section 4 and
Section 5.
2. Methodology
This paper proposes an evaluation method based on the scanned point cloud model and BIM model, where scanned point cloud models are systematically registered with as-designed BIM elements.
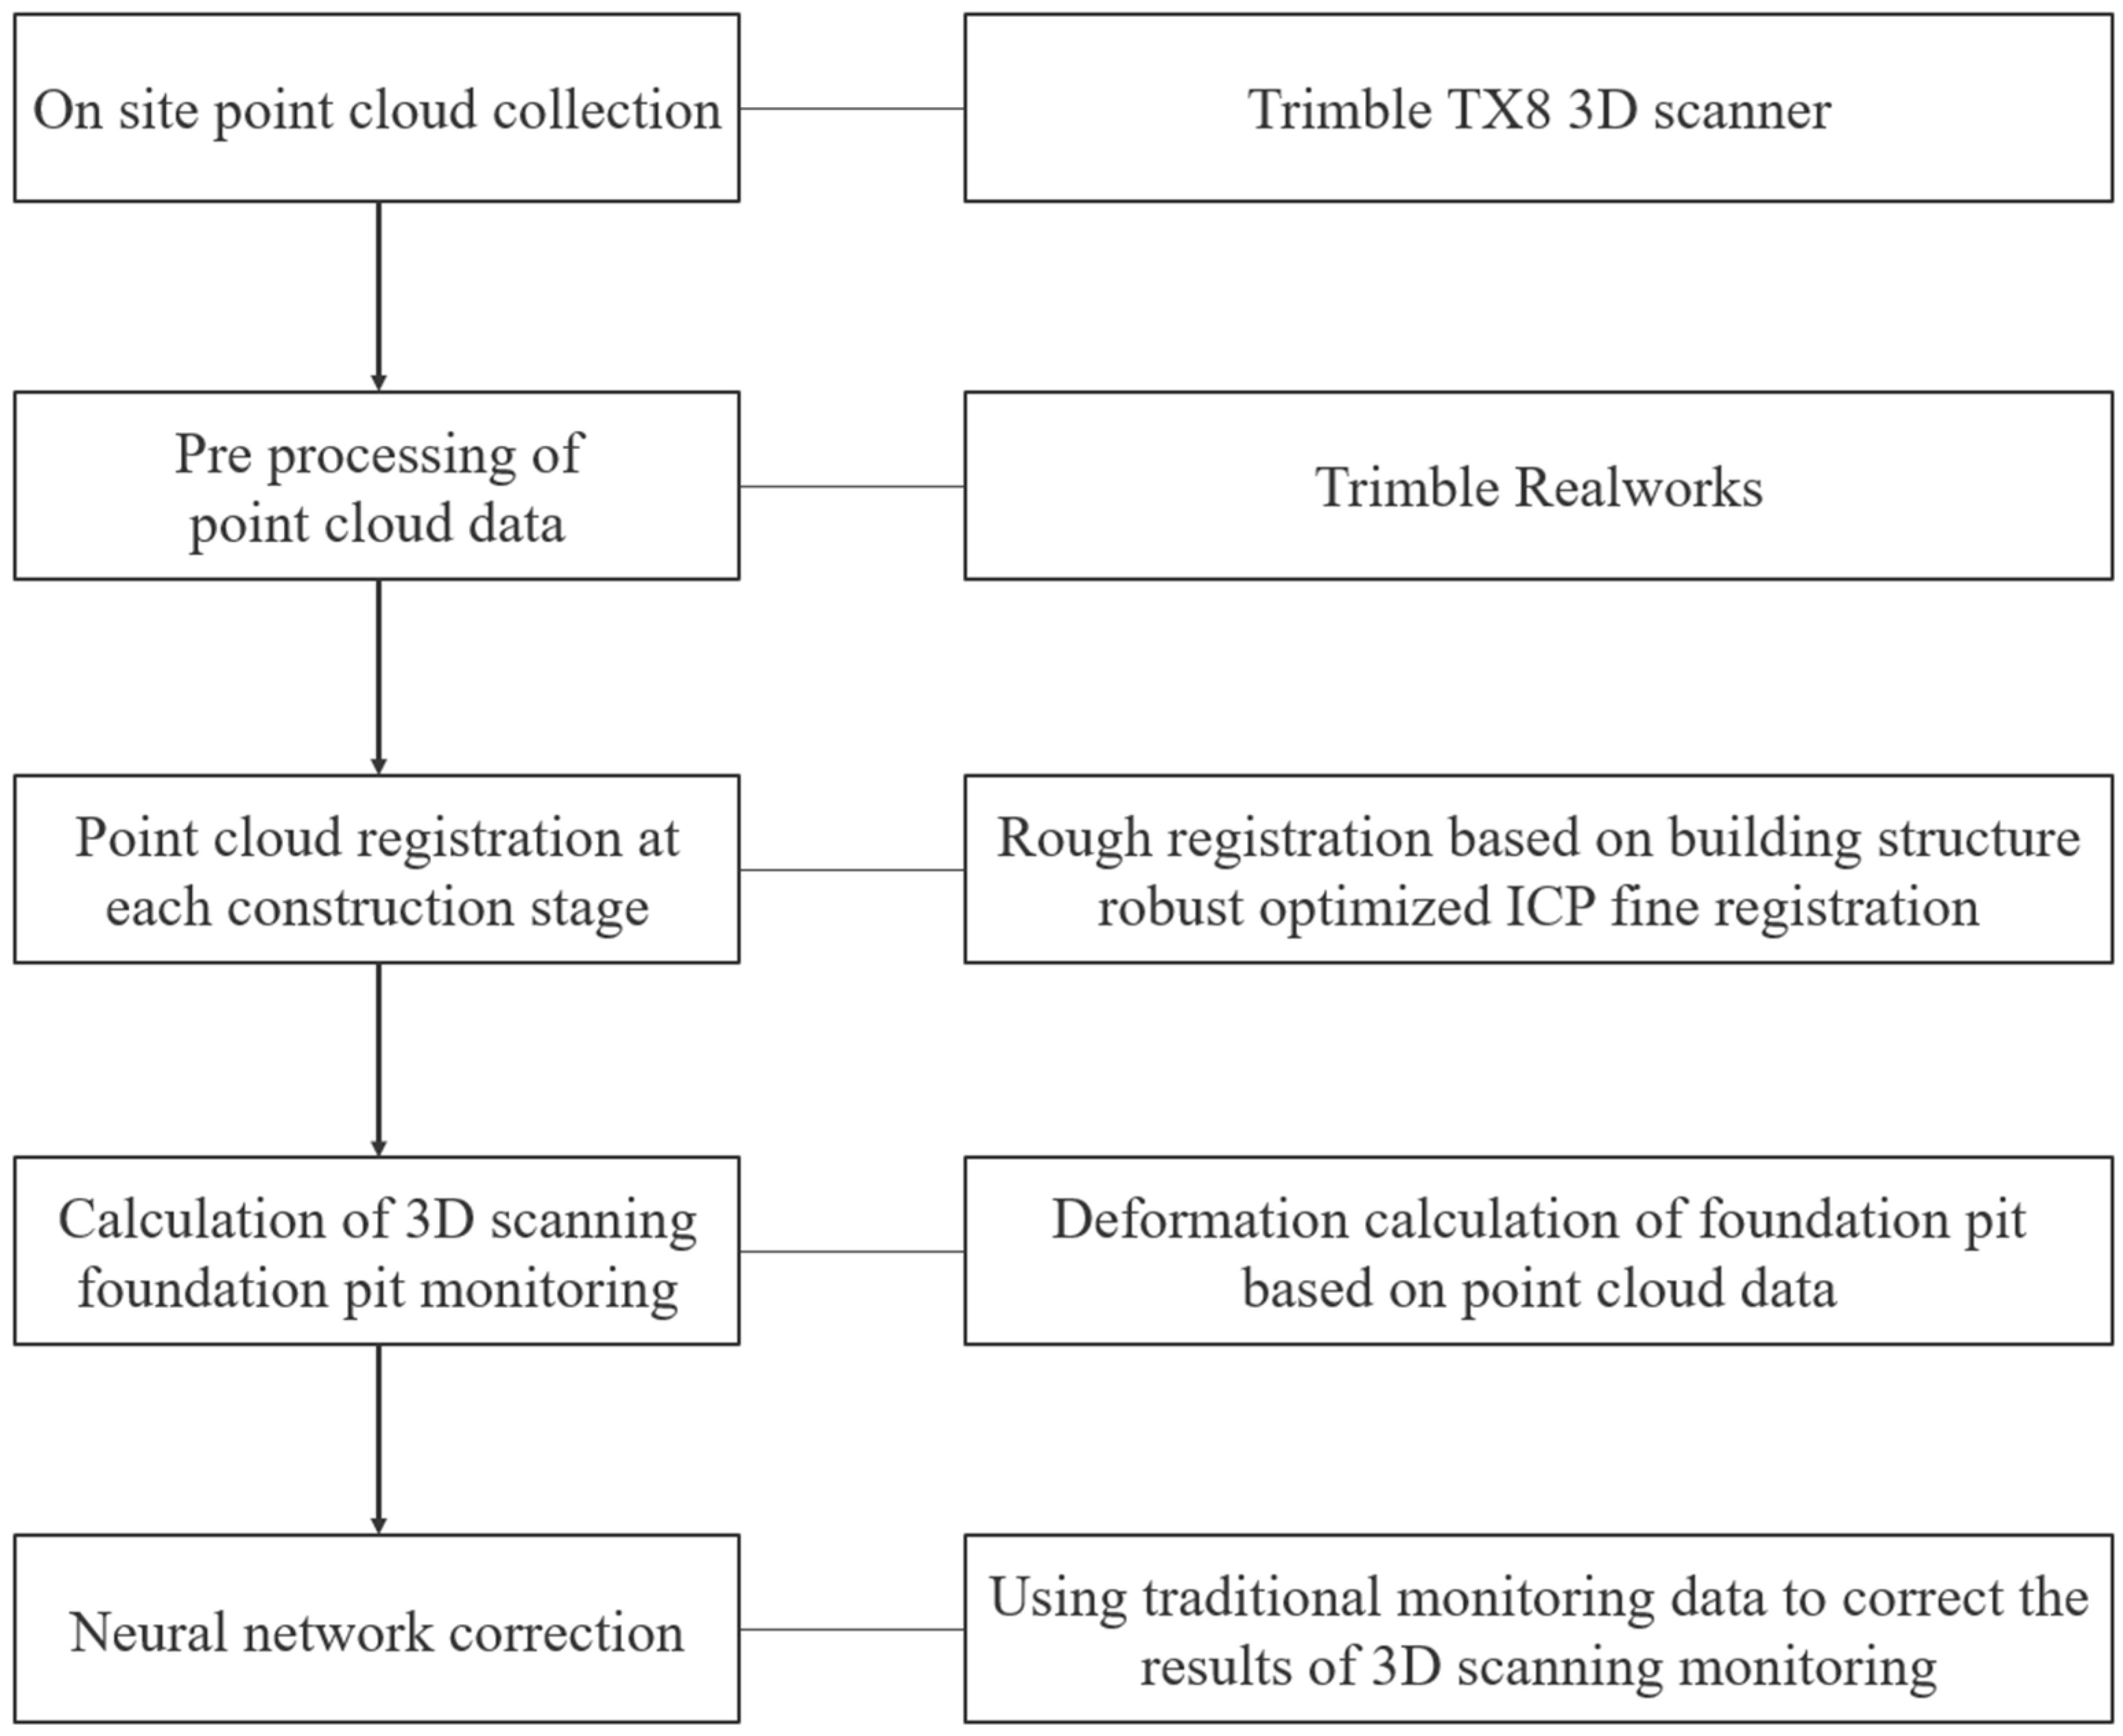
Figure 1 illustrates the process of the proposed method which comprises four main components:
- (1)
Point cloud data preprocessing.
- (2)
Point cloud data registration.
- (3)
Pit deformation monitoring of point cloud data.
- (4)
Monitoring data correction based on neural network algorithm.
The on-site deep foundation pit point cloud was first collected using the Trimble TX6 laser scanner (Trimble Inc., Sunnyvale, CA, USA). Trimble Realworks was then used to perform pre-processing on the point cloud, such as registration, thinning, and separation of the surrounding structure. Next, the deep foundation pit point cloud model was registered at each stage of construction to obtain the spatial transformation matrix. After that, it evaluates the pit deformation results and the variations between the two monitoring methods by comparing the 3D laser scanning monitoring data with the traditional monitoring findings. Finally, the neural network algorithm was combined with the traditional monitoring data to correct the 3D laser scanning monitoring results, improving the accuracy of scanning monitoring. In addition, an attempt was made to use the correction process to connect laser scanning monitoring with the traditional monitoring method.
2.1. Point Cloud Registration
Point cloud registration at each construction stage is the foundation for enabling pit deformation monitoring. Point cloud registration first determines transformation matrix T which consists of rotation matrix R and translation matrix t according to the input point clouds, e.g., source point cloud Ps and target point cloud Pt. The purpose is to make the transformed source point cloud Ps (T) overlap highly with the target point cloud Pt.
To achieve this, the two-stage registration strategy was frequently utilized, in which an approximate correspondence is found immediately by coarse registration, which is based on geometric features and often involves the selection of key points or the use of shape descriptions. After that, a fine registration was carried out, in which the outcomes of the coarse registration were refined by employing algorithms like Iterative Closest Point (ICP) in order to produce a precise registration result. This paper considers various factors, including registration accuracy, computational efficiency, and user-friendliness, when selecting a registration method. Following experimental comparisons, the coarse registration method based on the bounding boxes of architectural structures was ultimately chosen, and the ICP algorithm of robust loss function optimization was used for the fine registration.
The coarse registration method based on the building structure bounding box is based on the following idea: certain components in the building structure (e.g., structural columns) have relatively stable positions and morphologies. By selecting these members as references, a simplified bounding box can be constructed to represent the whole building structure. During the coarse registration process, a preliminary transformation matrix was determined by calculating the coordinate differences in the center at the bottom surface of the enveloping box at different construction stages and the deviation in the direction of the long axis.
consists of a translation matrix
and a rotation matrix
. The translation transformation can be regarded as an operation of moving a point a certain distance in a specific direction. The transformation matrix
can be expressed as follows:
where
,
, and
are the components of the translation distance in each axis.
The rotational transformation is determined by the axis and the angle of rotation, so the rotation matrix
can be divided into
, and
according to the axis of rotation:
In the right-hand Cartesian system, the term in is reversed.
The coarse registration transformation matrix
is obtained by combining the translation matrix
with the rotation matrix
:
This study adopts an optimization technique based on the robust loss function in the fine registration stage of the ICP algorithm to increase the robustness and accuracy of the registration. The fundamental concept is to lessen the influence of outliers on the registration scheme by weakening the residuals they create. With its considerable resistance to noise and outliers, this loss function can lessen its detrimental effects on the registration process and produce registration results that are more stable and dependable. The transformation matrix is continuously modified during the iterative optimization process until the optimal registration outcome is attained, which maximizes the similarity between the source and target point clouds. After experimenting with the registration effect of several robust loss functions to achieve robustness optimization, this research ultimately employs the L2Loss function for processing.
2.2. Calculation of Deep Foundation Pit Deformation
On the basis of the registration of the point cloud of the deep foundation pit in each construction stage, the coordinate deviation of the successive point cloud was calculated to realize the deformation monitoring of the deep foundation pit based on 3D laser scanning. The point cloud data obtained from 3D laser scanning was essentially a large number of discrete points, and due to the technical characteristics of 3D laser scanning, the external scanning can only collect the point cloud data of the diaphragm wall of the deep foundation pit, and cannot obtain the spatial information and deformation of the surrounding soil. The 3D laser scanning results of the diaphragm wall are different from the representativeness of the traditional inclinometer measurement results, so it is necessary to consider the joint function of the soil-enclosing structure and establish the relationship between soil excavation and deformation of the diaphragm wall.
At present, the theoretical calculation methods of soil displacement and enclosure structure deformation caused by deep foundation pit excavation can be mainly divided into three categories: empirical method, finite element method, and analytical method. Among them, the empirical method is simple, but there are great limitations, and the finite element method can predict the soil displacement more accurately, but the calculation is too complicated. Therefore, some scholars proposed analytical calculation methods, such as Sagaseta [
47], Poulos [
48], Loganathan, etc. [
49]. Among them, Sagaseta [
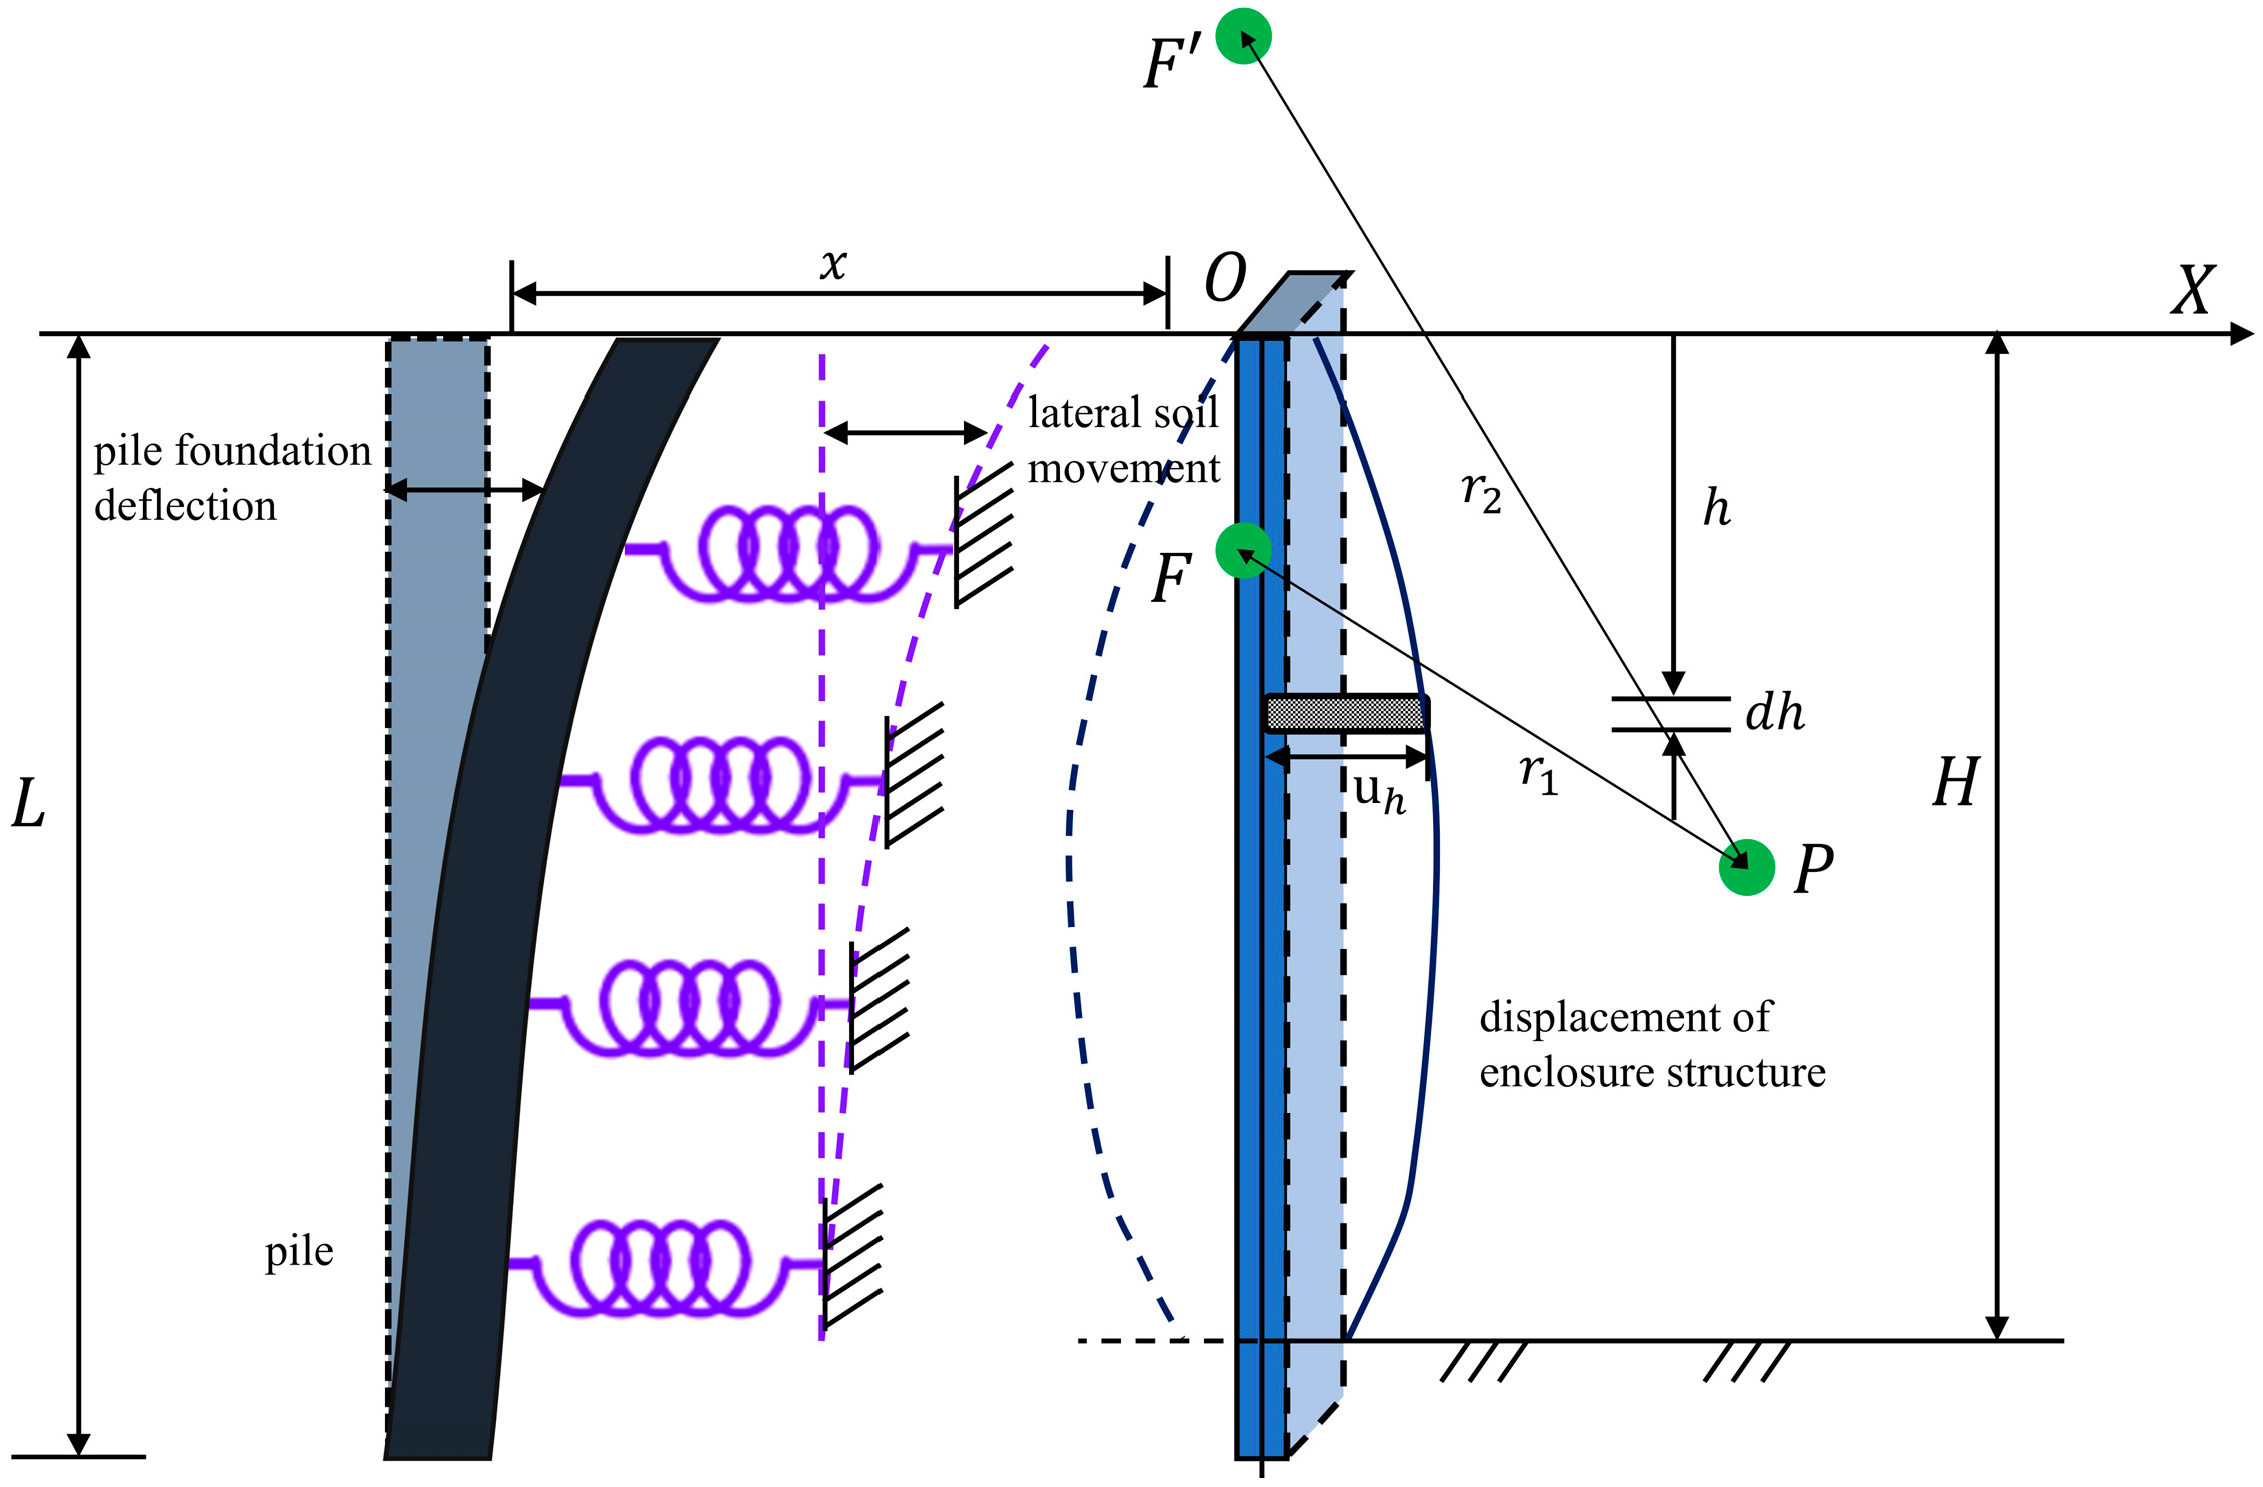
47] proposed the image source method and derived the formula for the distribution law of the displacement field of the surrounding soil due to the loss of strata at any point in the elastic half-space, which is quoted in this paper to establish the relationship between soil displacement due to deep foundation pit excavation and deformation of the surrounding structure.
Figure 2 shows the microelement model of the image source method. The displacement generated at point
by a known gap of radius
at point
within the semi-infinite body, i.e., the displacement of the soil caused by the deformation of any gap of radius
is the component along the
x-axis:
where
represents the distance between point
and point
;
represents the distance between point
and point
; and
is the soil gap radius.
Considering that the soil outside the pit enclosure structure should be 1/2 half space, according to the symmetry, the problem can be transformed into the solution of the ground deformation at any point under the ground loss of 2a produced in the elastic half-space shown above. The horizontal displacement of the enclosure structure was divided into n differential segments, and each of the segments was approximated as a rectangle. Based on the principle of area equivalence, the area corresponding to each differential segment is equivalent to a circle with the same radius. After obtaining the solution of soil displacement caused by the deformation of an arbitrary gap in the half-space and integrating along the entire depth of the enclosure structure using the image source method, the horizontal displacement of the soil beneath the surface caused by the excavation of the deep foundation pit in a free site can be obtained. This establishes the link between soil displacement and enclosure wall deformation.
where
,
,
is the horizontal displacement of the envelope at depth
h, which can be obtained using on-site monitoring.
After establishing the relationship between soil displacement and enclosure wall deformation, deformation monitoring calculations were performed based on point cloud preprocessing and model registration. The 3D coordinates were obtained by selecting a portion of the point cloud, and then the coordinates were calculated for the corresponding points of the point cloud data at various phases to provide the local deformation monitoring data from the before-and-after scanning. In field operation, engineering vibration, wall cracking and peeling, and the accuracy of the instrument itself will all have an impact on 3D laser scanning technology, resulting in noise and outliers in the model and negatively impacting coordinate calculation. Therefore, in order to weaken the impact of discrete points in some locations on the monitoring results, the two nearest calculation points were chosen and averaged as the basis for computation at a certain measurement site when taking points for calculation.
2.3. Correction of 3D Laser Scanning Monitoring Data Based on BPNN
The terrestrial laser scanner used in this study is Trimble TX6. In contrast, traditional deep soil displacement monitoring uses an inclinometer to measure the inclination to calculate the soil displacement value, which has higher measurement accuracy than 3D scanners. Although this method offers higher measurement accuracy than 3D laser scanning, the latter provides significant advantages in terms of monitoring range, data continuity, and flexibility. Consequently, the monitoring data obtained from traditional methods are used as benchmarks for calibrating the 3D laser scanning results. To improve the accuracy of 3D laser scanning, this paper proposes a neural network approach that integrates traditional monitoring data for correction.
Regarding the monitoring results, the deformations of traditional monitoring and scanning monitoring belong to different spatial levels. In order to analyze and correct further monitoring data and future deformation, this paper takes the inverse analysis path, which gathers some data from the systematic monitoring object and establishes the mapping link between the two in reverse when the real physical model is still unclear. A neural network is a parallel processing connection network obtained by imitating the human brain thinking and simplifying the abstraction with mathematical methods, which has strong self-learning and self-adaptation, and is suitable for learning the input and output samples of the system and establishing the mapping relationship between the input and output values when the mathematical model is unknown [
50,
51,
52].
In this paper, the proposed deep foundation pit monitoring framework primarily relies on 3D laser scanning technology. Compared to traditional inclinometer-based monitoring, 3D laser scanning offers superior spatial coverage and data continuity. However, its measurement accuracy is inherently limited due to environmental interference (e.g., vibrations and occlusions) and instrumental constraints. To address this limitation, a neural network model was integrated into the framework to enhance the accuracy of laser scanning data through multi-source data fusion. The neural network was employed to integrate multi-source physics-informed data, effectively reconciling the wide-area capability of 3D scanning with the high precision of point-based inclinometers. By integrating empirical monitoring data with analytical soil mechanics parameters, the framework ensures both spatial comprehensiveness and mechanical interpretability, which is critical for safety-critical applications like metro-adjacent excavations.
Specifically, the network structure of the BPNN model consists of 3 parts: the input layer, the hidden layer, and the output layer, as shown in
Figure 3. In the figure, the input
;
is the hidden layer;
is the output layer;
is the neuron weights from the input layer to the hidden layer; and
is the neuron weights from the hidden layer to the output layer. Specifically for the pit deformation monitoring study involved in this paper, the input values include scanning monitoring data corresponding to scanning monitoring (
), lateral offset value (
), construction stage (
), and parameters of the image source method (
), and the output value
is the corresponding points (
) of the traditional pit monitoring data. The hidden layer comprises 10 neurons, determined through cross-validation to balance model complexity and generalization capability. The hyperbolic tangent (Tanh) activation function was adopted to establish nonlinear relationships between input features and deformation patterns, enhancing the network’s ability to simulate complex soil–structure interactions.
The BPNN learning process includes forward propagation and error backpropagation. Forward propagation passes the input value from the input layer to the hidden layer nodes, and then to the output layer to obtain the output value after computing and processing layer by layer, where the implied layer calculation result is as follows:
The output of the output layer is as follows:
The error signal is defined as the difference between the network’s output and the expected value. Error backpropagation is to return the error signal along the original connection path, solve the error gradient, correct the neuron weights between the layers, and reduce the error signal. And then, the above process is repeated until the error is less than a given threshold and the network training is complete.
The training process employs the Levenberg–Marquardt optimization algorithm, chosen for its rapid convergence on small-to-medium datasets. Key parameters include the following: (1) Learning Rate = 0.01, dynamically adjusted to prevent overshooting during gradient descent. (2) Maximum Iterations = 1000, ensuring convergence while avoiding overfitting. (3) Mean Squared Error (MSE) Threshold = 0.001, terminating training once the validation loss stabilizes.
To enhance robustness under sparse data conditions, L2 regularization (λ = 0.001) was applied to penalize large weights. The dataset was partitioned into 80% training and 20% validation subsets, with data augmentation techniques employed to mitigate overfitting.
The purpose of neural network learning is to obtain the correct neuron weights, and subsequently, the trained network structure can be used for data prediction. The correction process in this paper follows the same idea: the deep foundation pit horizontal displacement monitoring data () of each measurement point location was selected as the output value, and the input values were the scanning monitoring data corresponding to the 3D laser scanning monitoring (), the lateral offset value (), the construction stage (), and the parameters of the image source method (). The input and output values were used to train the BPNN, and the neuron weights were iteratively derived. After that, the trained BP network was used to input the scanning monitoring data at the unmeasured points and obtain the predicted values. Finally, the predicted values were used to replace the original 3D laser scanning monitoring data to correct the scanning monitoring results and improve the accuracy of scanning monitoring.
3. Validation
3.1. Preprocessing of Point Cloud Data
To validate the deep foundation pit deformation monitoring method based on 3D laser scanning proposed in this paper, point cloud data of the deep foundation pit were collected using the Trimble TX6 laser scanner at a commercial and business complex project in Hangzhou. The project is located in the northeastern part of Hangzhou City, adjacent to the Hangzhou Metro Station and shield tunnel section on its northern side. The project pit is roughly trapezoidal in
Figure 4, the longest length is about 230 m in the east–west direction, and 115 m in the north–south direction. The total excavation area of the pit is about 19,300 m
2, and the extension of the external support structure is about 625 m. The project pit is divided into the north area and south area, and the north area is close to the metro station, whose excavation has a greater impact on the metro facilities. Due to the fact that the subdistrict is smaller than the southern area and is scheduled for earlier construction, deformation monitoring is important for the overall project. The north area is divided into five small subareas from North 1 to North 5 according to the east–west direction, each subarea is similar in size, among which North 2 and North 4 are prioritized for construction. By integrating the complexity of each subarea, convenience of movement, actual scanning workload, and other factors, North 2 was finally selected as the main monitoring area, while North 1 and North 5 were selected as the secondary monitoring area.
After determining the object of monitoring, it is necessary to design the scanning program according to the spatial distribution inside the deep foundation pit and the monitoring range, which mainly includes the following contents: the location of the scanner’s measuring station, the height of the measuring station, the location of the marking target, and the number of the marking target. The arrangement of measuring stations and targets in this study is based on the above considerations. The first step of point cloud collection is to arrange the measuring station. The primary goal is to ensure the completeness of the point cloud, and on this basis, the number of stations is reduced as much as possible. Subsequently, the target is reasonably arranged according to the location of the station. In this study, a flat black and white target is chosen as the target to be pasted on the wall, and the number of targets is increased appropriately under the premise of ensuring that more than two targets can be observed by the station at the same time.
To minimize the impact of vibrations and obstructions during data collection, the scanning schedule was strategically aligned with construction activities to avoid the peak periods of machinery operation. Additionally, the scanning scheme was optimized by increasing the number of scanning stations and adjusting scanner placement angles to bypass temporary obstructions. Multi-station data fusion during post-processing increased point cloud coverage in obstructed zones by 31%, ensuring robust deformation analysis. These measures were validated through field tests, demonstrating a consistent alignment between the corrected scanning results and traditional monitoring data (MAE < 2 mm).
The deep foundation pit point cloud information obtained after the device scanning was fragmented, requiring preprocessing including point cloud splicing, segmentation, and noise reduction to address fragmentation and obtain effective information. After the above preprocessing process, the proposed method was applied to the deep foundation pits point cloud data. In the model registration stage, the distance threshold for the ICP validation step was set to 0.03 m. A total of seven deep foundation pit field scans were performed in this project, and some of the scanned data are shown in
Figure 5.
The next step was to register the point cloud model of the deep foundation pit. In the translation transformation session, the center of the bottom of the encircling box of the deep foundation pit point cloud model at different construction stages was selected as the reference point, and the translation operation was executed based on these two point coordinates. For the rotational transformation, the correct data acquisition and preprocessing steps ensure the consistency of the point cloud data in the height direction, while the preprocessed point cloud model is also consistent with the coordinate axes in the vertical and horizontal directions. Therefore, in the rotation transformation operation, there was no need to consider all the possible rotation angles, but only need to test the four key angles of (0, π/2, π, and 3π/2) and filter out the most suitable rotation results, thus effectively improving the efficiency of model registration.
3.2. Three-Dimensional Laser Scanning Monitoring Data Analysis
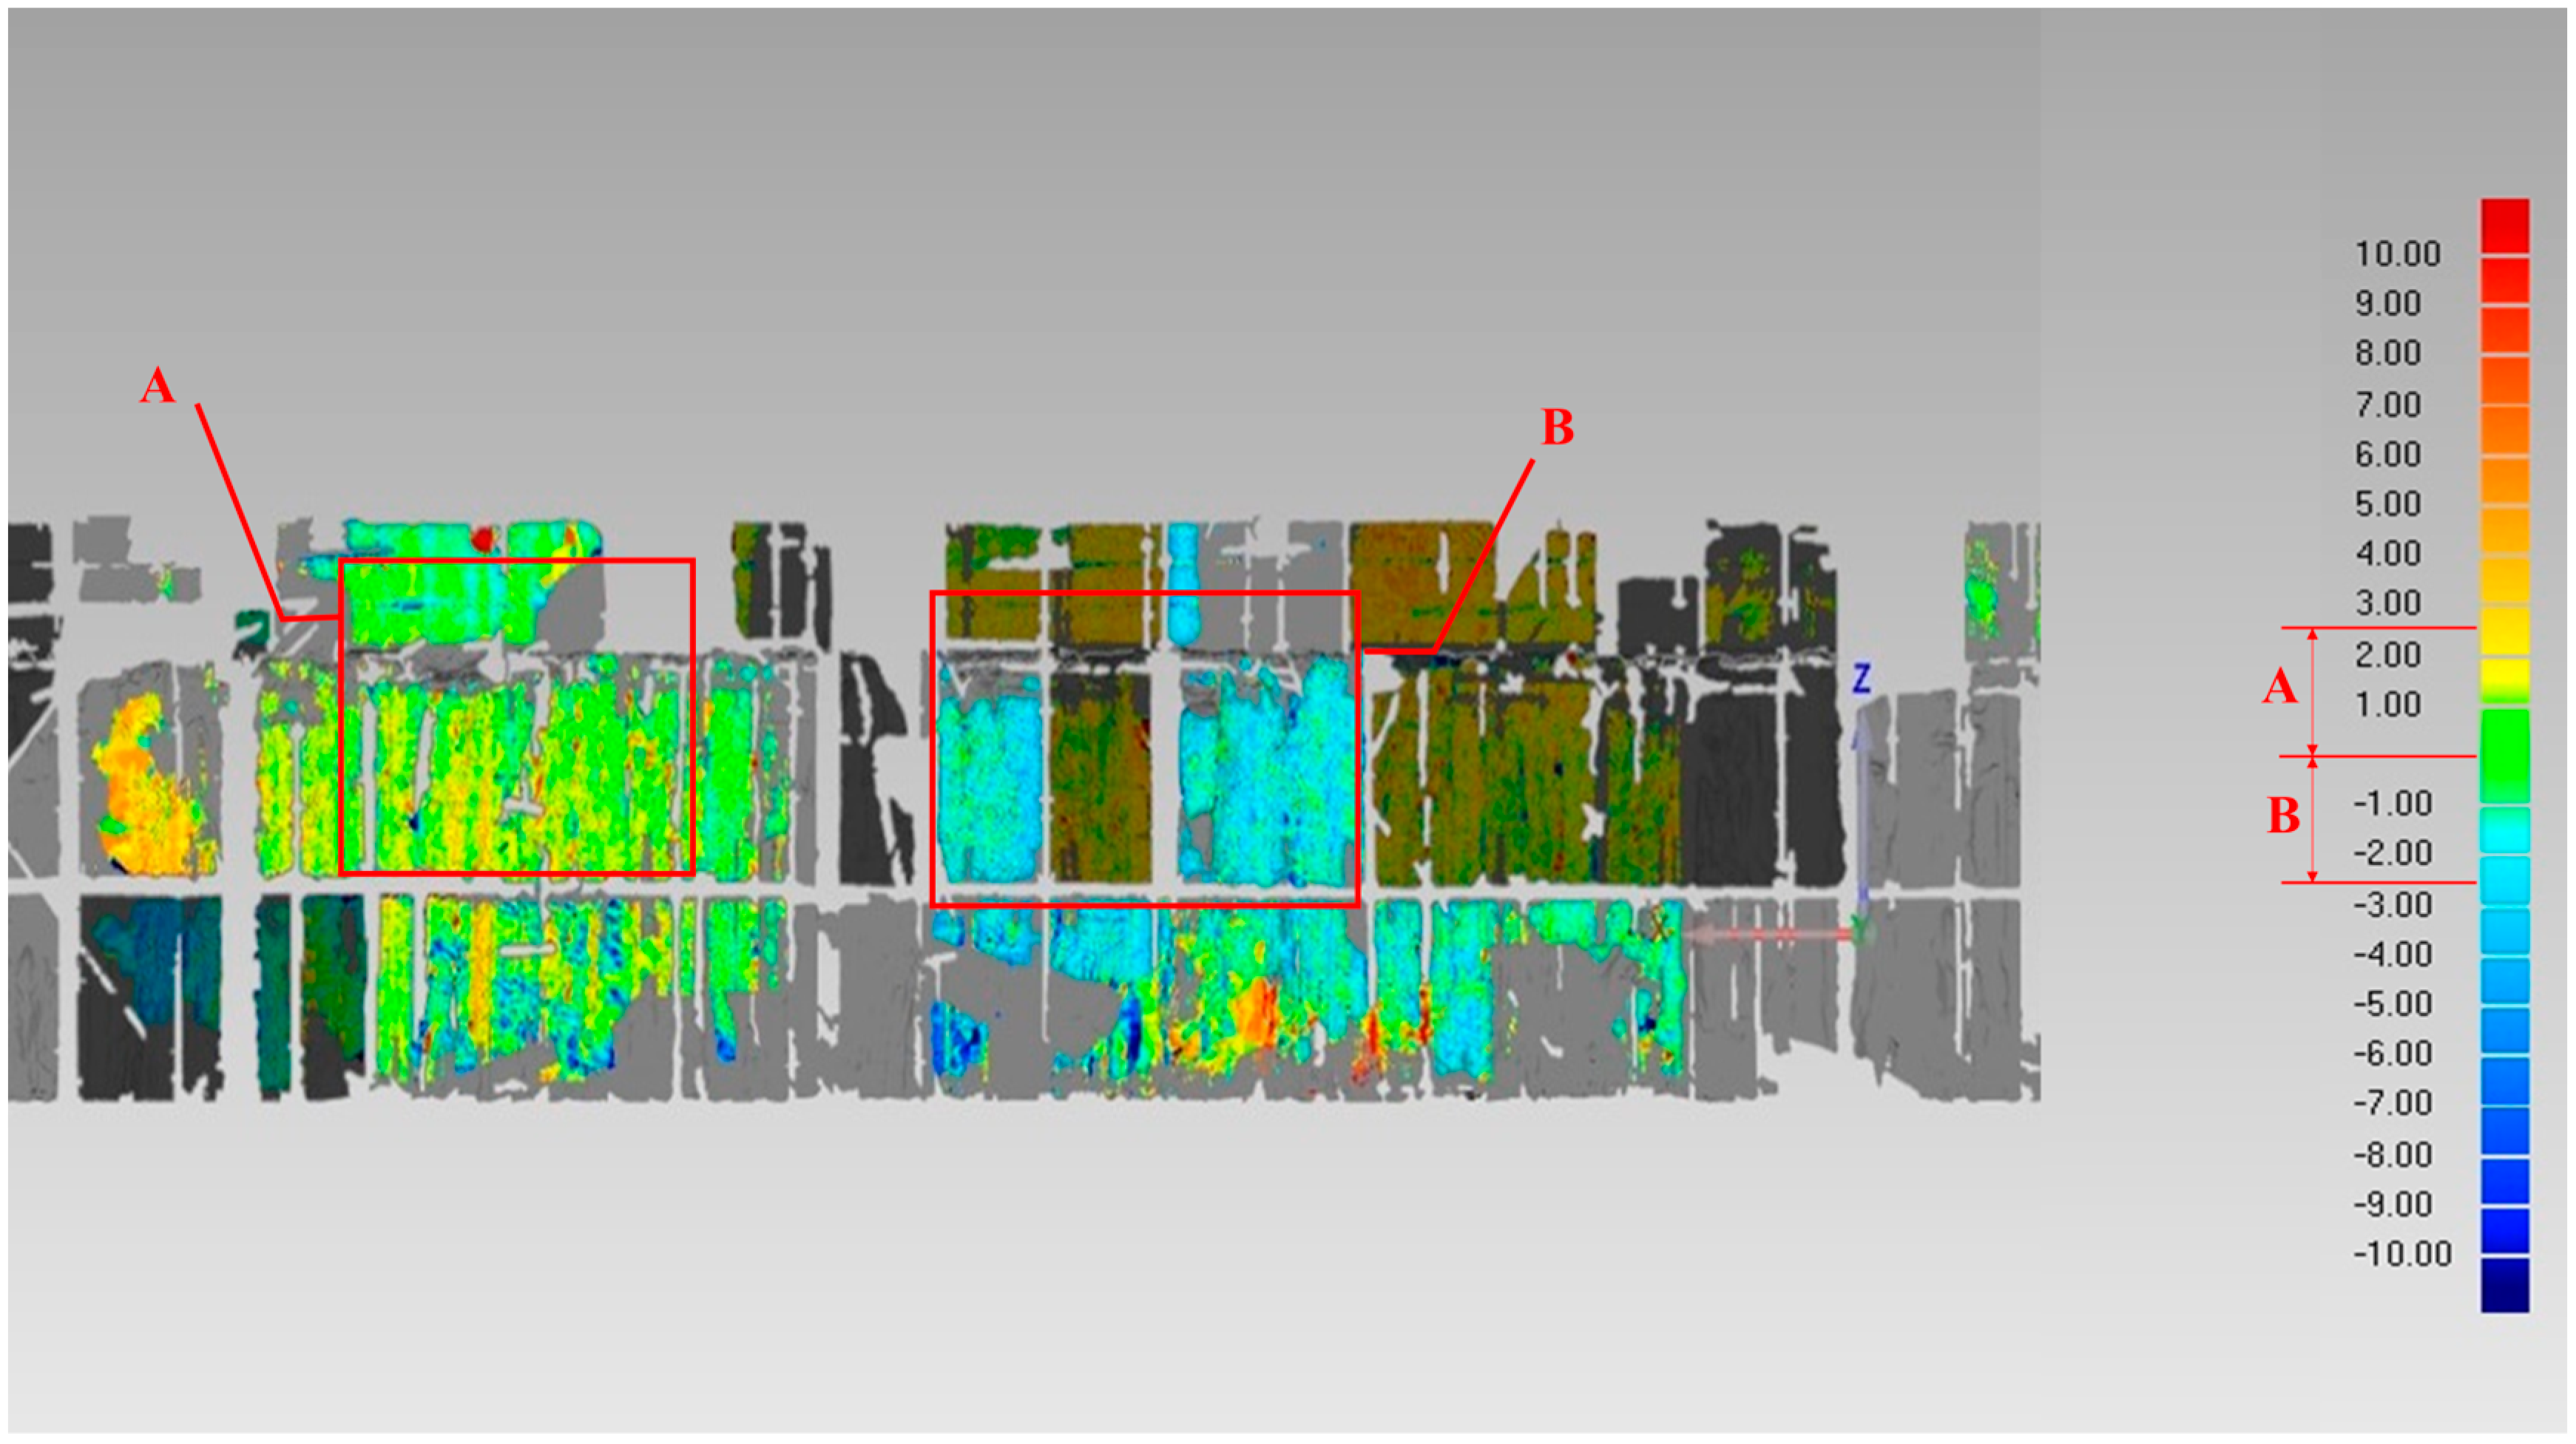
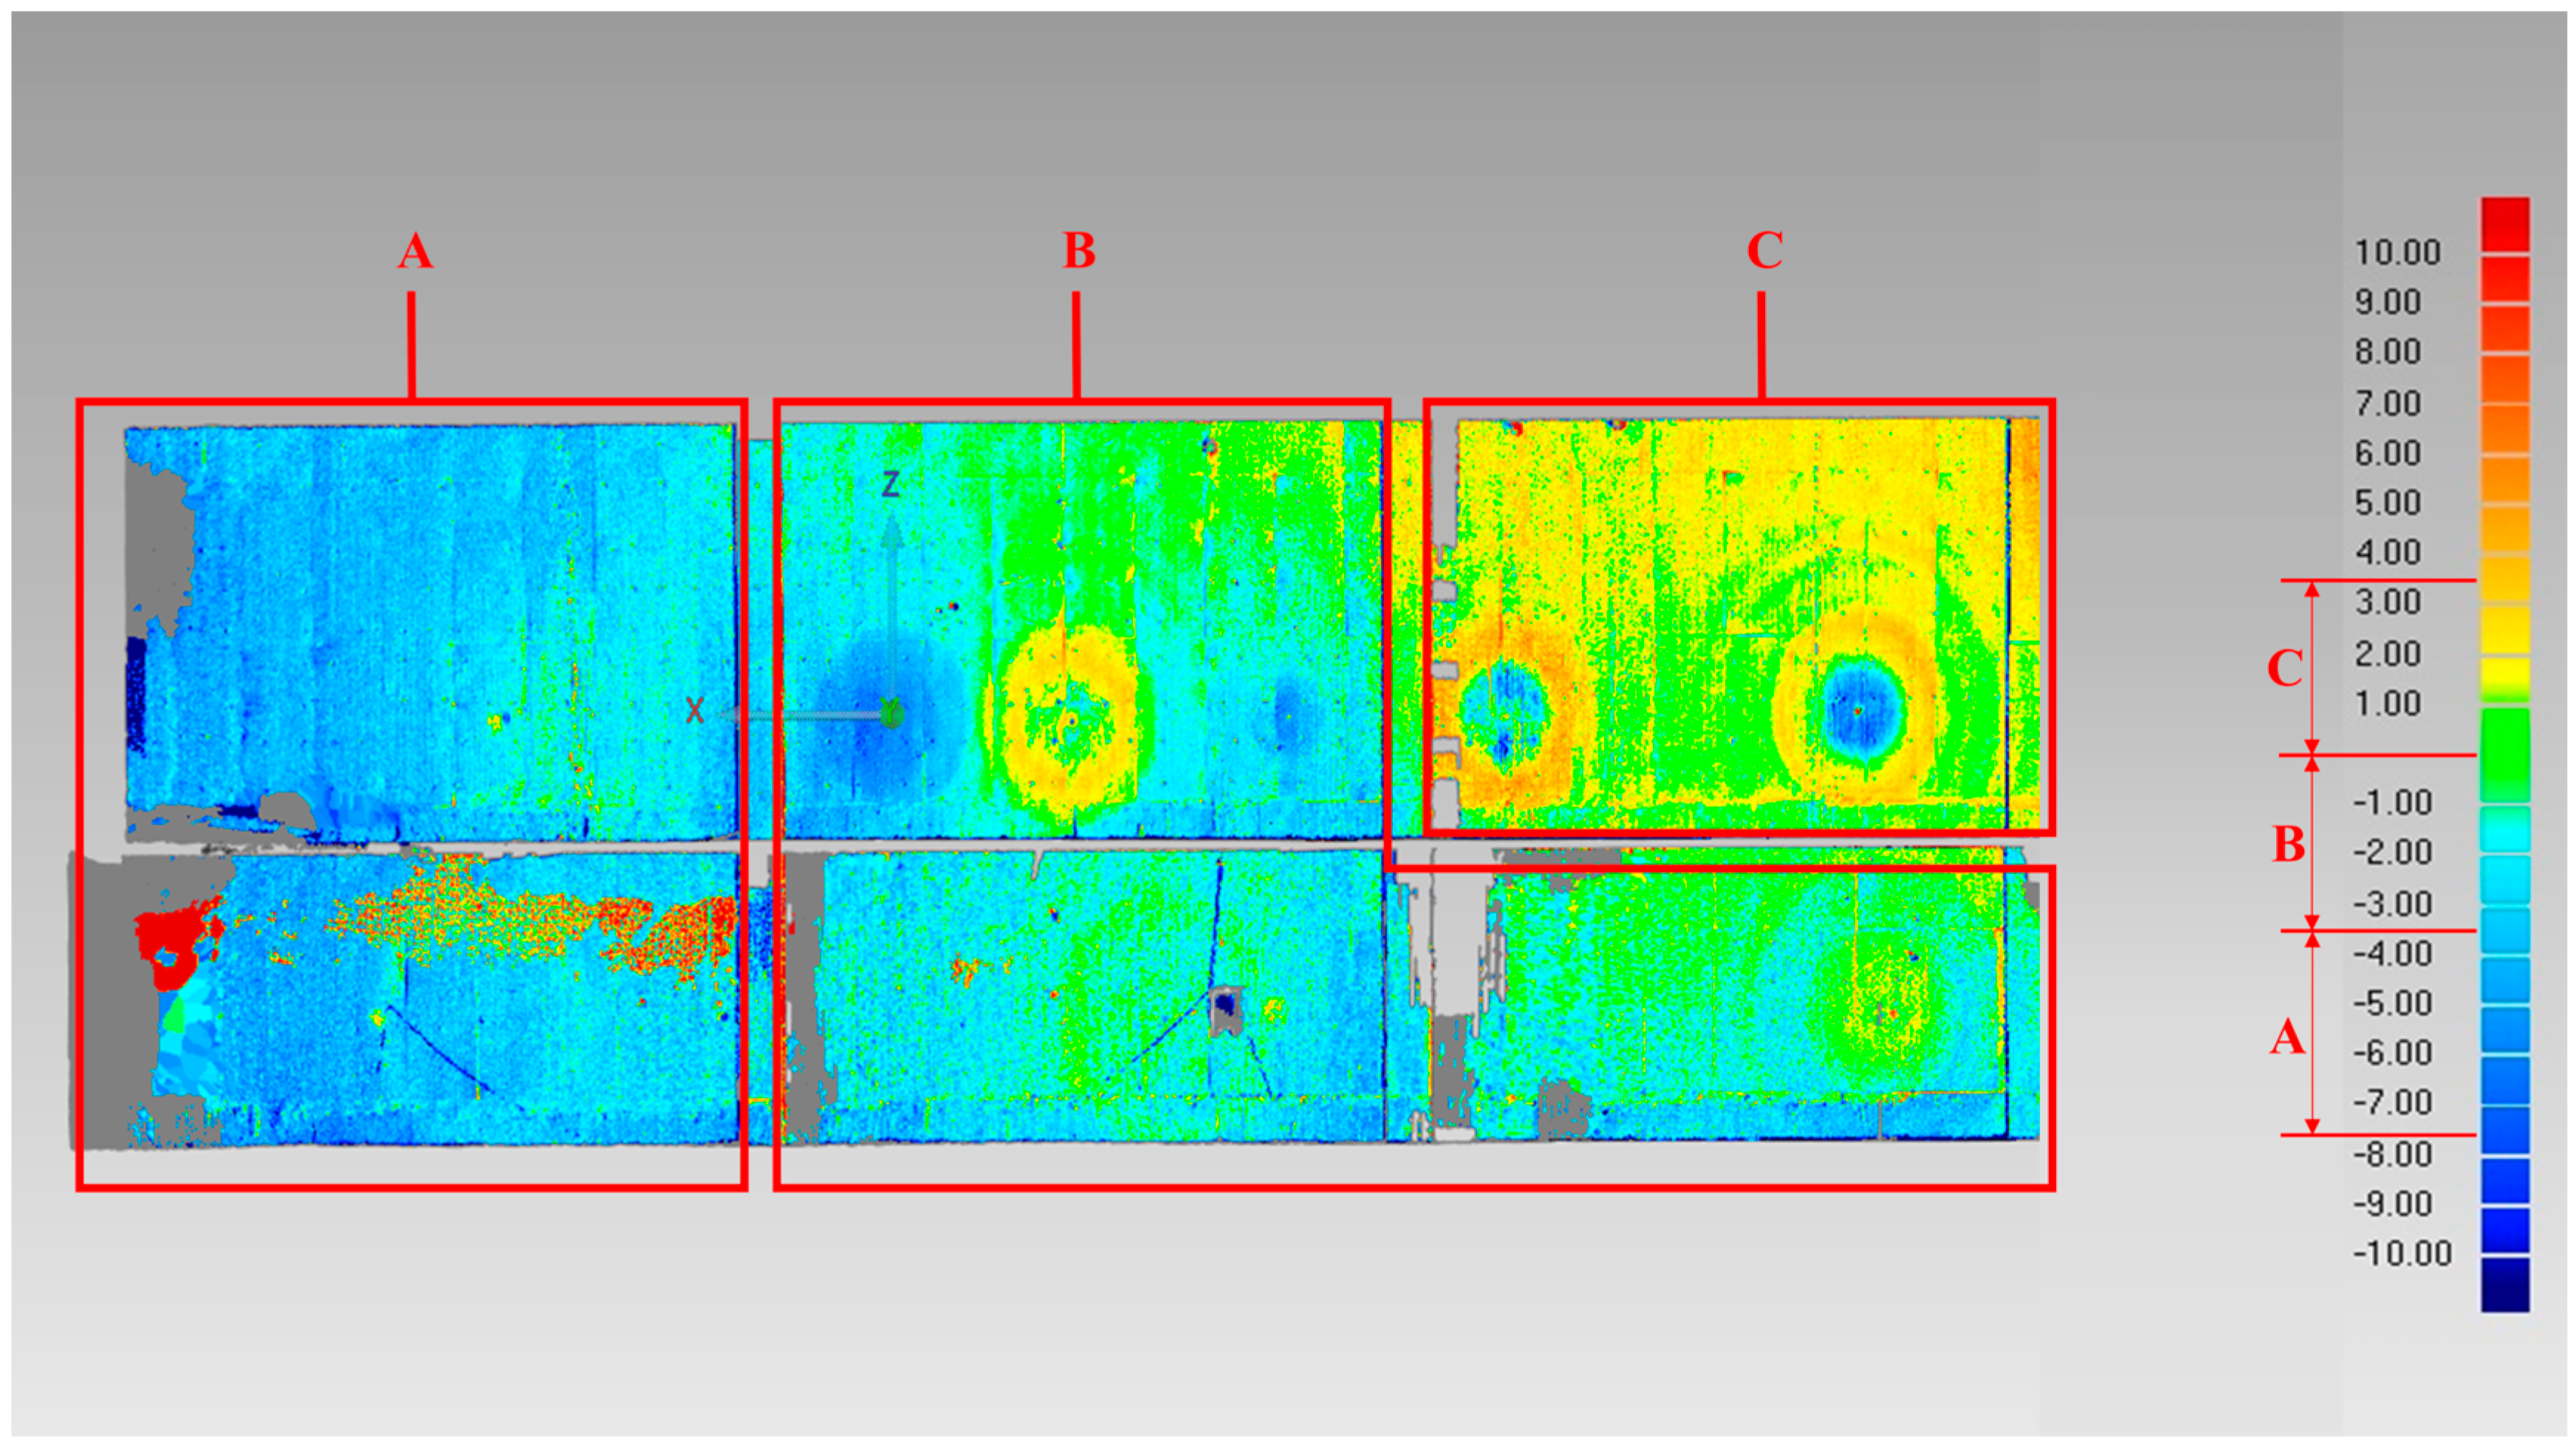
After preprocessing, based on the comparison of scanning monitoring data at different stages, the overall and local lateral deformation of the deep foundation pit support structure was analyzed. In this paper, chromatographic deviation analysis was used to obtain the overall deformation monitoring results of the deep foundation pit. Since the chromatographic deviation analysis needs to be implemented based on the triangular mesh model, the point cloud at an early stage of construction was encapsulated to generate a continuous model composed of triangular mesh as a computational benchmark. After the encapsulation, chromatographic deviation analysis was used to calculate the lateral deviation of the unencapsulated point cloud from the baseline model to obtain the overall deviation of the deep foundation pit diaphragm wall, and the deviation values were differentiated by color, as shown in
Figure 6 and
Figure 7. The right side of the figure shows the scale of deviation values differentiated by color, with positive values meaning displacement towards the outside of the pit. The deviation values of each area are in different ranges, which are divided into red rectangular areas in the figure and marked with corresponding scales on the right side. For example, area C in
Figure 7 corresponds to a deviation value of 0–3.5 mm on the right scale. Compared with
Figure 7, the deep foundation pit chromatic deviation results shown in
Figure 6 exhibit more missing portions. The primary reasons are as follows: ① During January 2022, the dense temporary supports (e.g., scaffolding) within the deep foundation pit created severe on-site obstructions. Although additional survey stations were temporarily deployed during scanning, the completeness of the point cloud model remained compromised, thereby increasing the complexity of model processing. ② Hydraulic fracturing operations during scanning generated significant vibrations, which adversely affected data acquisition quality. Subsequent communications with the construction team addressed these issues through adjustments to the field scanning protocol, effectively reducing deviations between the chromatic analysis results and actual conditions.
The time frame covered by the scanning data above mainly relates to the phases of excavation for earthworks and replacement of supports in the south, and pouring of the roof slab in the north. At this point, the north zone’s excavation was finished, and the pit’s deformation was mostly caused by the south zone’s excavation and the building of the structure, so it was in a relatively stable state and had only slightly deformed. The scanning monitoring results indicate that the deformation of the deep foundation pit retaining wall in Zone B2 progressively increases from west to east. Concurrently, certain eastern areas have been affected by the post-spring-festival removal of steel supports within the deep foundation pit, leading to gradual alterations in the wall’s elastic deformation. When superimposed with the overall structural deformation of the retaining system, these combined effects manifest as minor ring-shaped abrupt changes in the chromatographic deviation analysis results. The entire scanning monitoring findings also show that the diaphragm wall’s deformation is essentially within 10 mm.
The chromatographic deviation can qualitatively reflect the overall deformation of the pit, but coordinate calculations are required to obtain specific area’s offset values. When the number of model points of 3D laser scanning is millions or even tens of millions, it usually can be regarded as a continuous model on the engineering scale. Compared with the limited number of measurement points and fixed position of traditional methods, scanning monitoring allows the selection of any position within the scanning range for deformation analysis, which offers greater flexibility in deformation monitoring selection.
Localized pit deformation monitoring was carried out according to the deformation calculation method mentioned in
Section 2.2. The main deep foundation pit monitoring area in this study is North 2. Each traditional monitoring point is located in the soil behind the wall, and the deformation of the soil is directly monitored. There is approximately 1.5 m of soil between the measurement locations and the wall. Based on the joint action of the soil enclosure structure described in
Section 2.2, the lateral deformation of the pit enclosure structure is associated with the displacement of soil, e.g., at the same cross-section, the wall’s deformation and the soil’s lateral displacement are significantly correlated. Both the theoretical calculations and the actual monitoring have confirmed this relationship. The monitoring points CX32 and CX33 correspond to the temporary partition wall on the south side of North 2, the surface condition of the wall is poorer, and the engineering vibration impact is greater, so we choose the monitoring point corresponding to the north diaphragm wall to carry out local quantitative monitoring calculations, and some of the calculation and monitoring results are shown in the
Table A1 and
Table A2 (in
Appendix A), where Y1, Y2, Y3, and Y4 represent the Y-direction point coordinates data in December 2021, January 2022, March 2022, and May 2022, respectively.
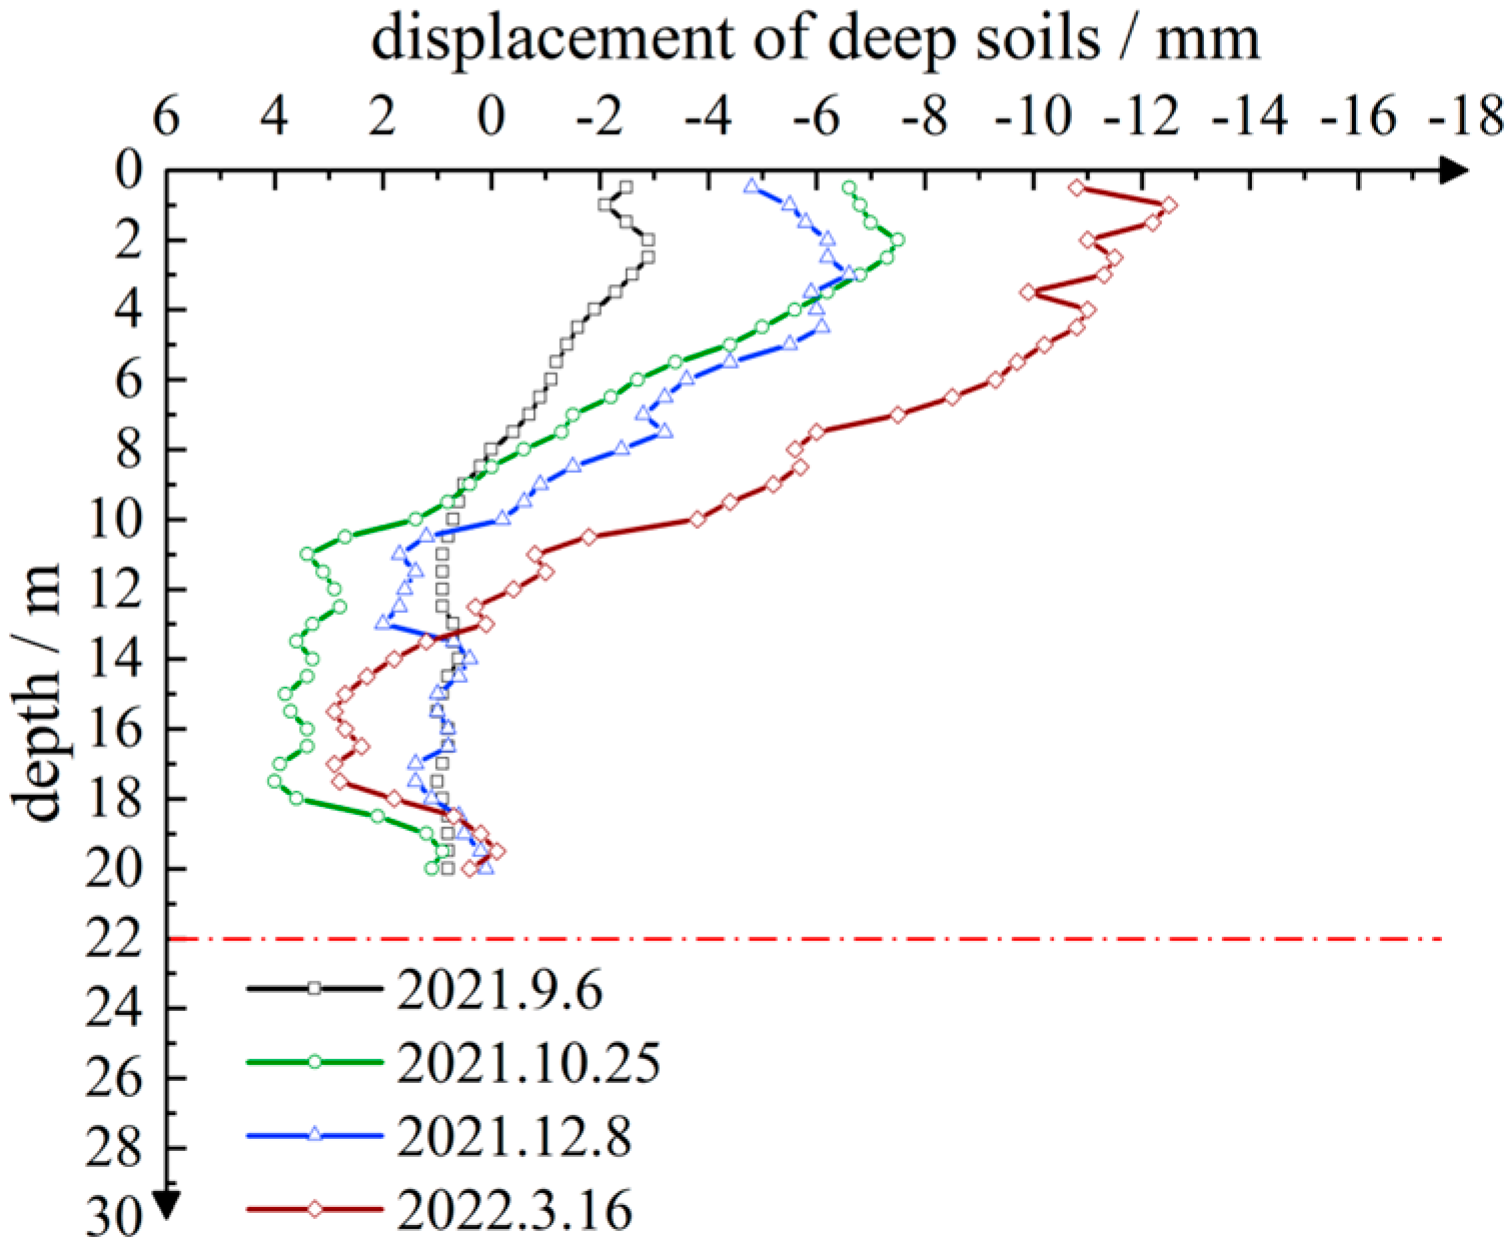
Afterward, the results of 3D laser scanning monitoring and traditional pit monitoring were compared and analyzed. In this project, the pit monitoring points are uniformly arranged along the enclosure wall, and the monitoring items include ground surface settlement, horizontal displacement of support piles, displacement of deep soil, settlement of support piles, and changes in groundwater level. Since the overall deformation control of the pit structure is primarily based on horizontal displacement rather than vertical displacement, the 3D laser scanning monitoring in this study focused mainly on lateral deformation. Taking the deep soil displacement monitoring item as an example, the technical features of 3D laser scanning monitoring were analyzed and the data from the deep soil displacement monitoring were compared with the outcomes of the scanning monitoring. Part of the deep soil displacement curve is shown in
Figure 8.
For instance, the change in deep soil displacement on the north side of the pit in North 2 was examined for the period from 6 January to 16 March 2022 (measurement point CX3). The deep soil displacement monitoring data were compared with the corresponding scanning monitoring results, as shown in
Figure 9.
The comparative analysis reveals that the deep soil displacement change value is essentially between 3 and 5 mm, increasing with depth, whereas the 3D laser scanning monitoring data are essentially between 5 and 10 mm. Overall, the monitoring results are higher than the traditional values, and the change trend is consistent with the traditional monitoring data. A small number of data points exhibit significant differences, which can be attributed to the following factors:
- (1)
Different susceptibility to construction site interference: During the deep soil displacement monitoring of the inclined tube buried in advance in the soil, the usage of inclinometers to obtain the actual deformation of the soil is not easily disturbed by external conditions, and so the monitoring data are relatively reliable; in practice, the 3D scanner’s susceptibility to human activity, ambient light, engineering vibration, and other external elements makes the interference situation considerably higher.
- (2)
Accuracy differences in different monitoring methods: The inclinometer is used to calculate the soil displacement value by measuring the inclination angle, and the measurement accuracy can reach ±0.01 mm/0.5 m. The 3D laser scanner in this study exhibits a measurement accuracy of ±2 mm, with a similar accuracy for target acquisition. Additionally, field operations such as site positioning, instrument registration, and station splicing introduce further errors, leading to a substantial difference in the overall monitoring accuracy.
- (3)
Difference exists in deep foundation pit monitoring targets: The inclinometer pipe corresponding to deep soil displacement is buried in the soil, which can directly reflect the deformation of the soil; the 3D scanner can obtain only the surface information of the diaphragm wall, and the deformation of the wall cannot directly correspond to the displacement of the soil.
The study above demonstrates that the amount of deformation at the same location and at different depths of the deep foundation pit is reflected in the data from both the deep soil displacement monitoring and the 3D laser scanning monitoring. Although the results from these two methods differ, they show a strong correlation. The range and efficiency of 3D laser scanning monitoring are superior to those of traditional monitoring methods, while the degree of interference and accuracy are lower, which accounts for the variation in the outcomes. The neural network algorithm proposed in
Section 2.3 was used to correct the 3D laser scanning monitoring results in conjunction with traditional monitoring data in order to improve scanning monitoring accuracy, and an attempt was made to utilize the correction process to link laser scanning monitoring to deep soil monitoring.
In this paper, a BPNN was trained with MATLAB R2021a to establish the mapping between 3D laser scanning monitoring values and traditional inclinometer measurements. To optimize the network architecture, a grid search was conducted across hyperparameters including the number of hidden neurons (tested in the range of [
5,
15]) and learning rate (evaluated at [0.001, 0.01, 0.1]). Through 5-fold cross-validation, the final architecture adopted 10 hidden neurons with a learning rate of 0.01, achieving a mean absolute error (MAE) of 1.8 mm and a coefficient of determination (
) of 0.91 on the test set.
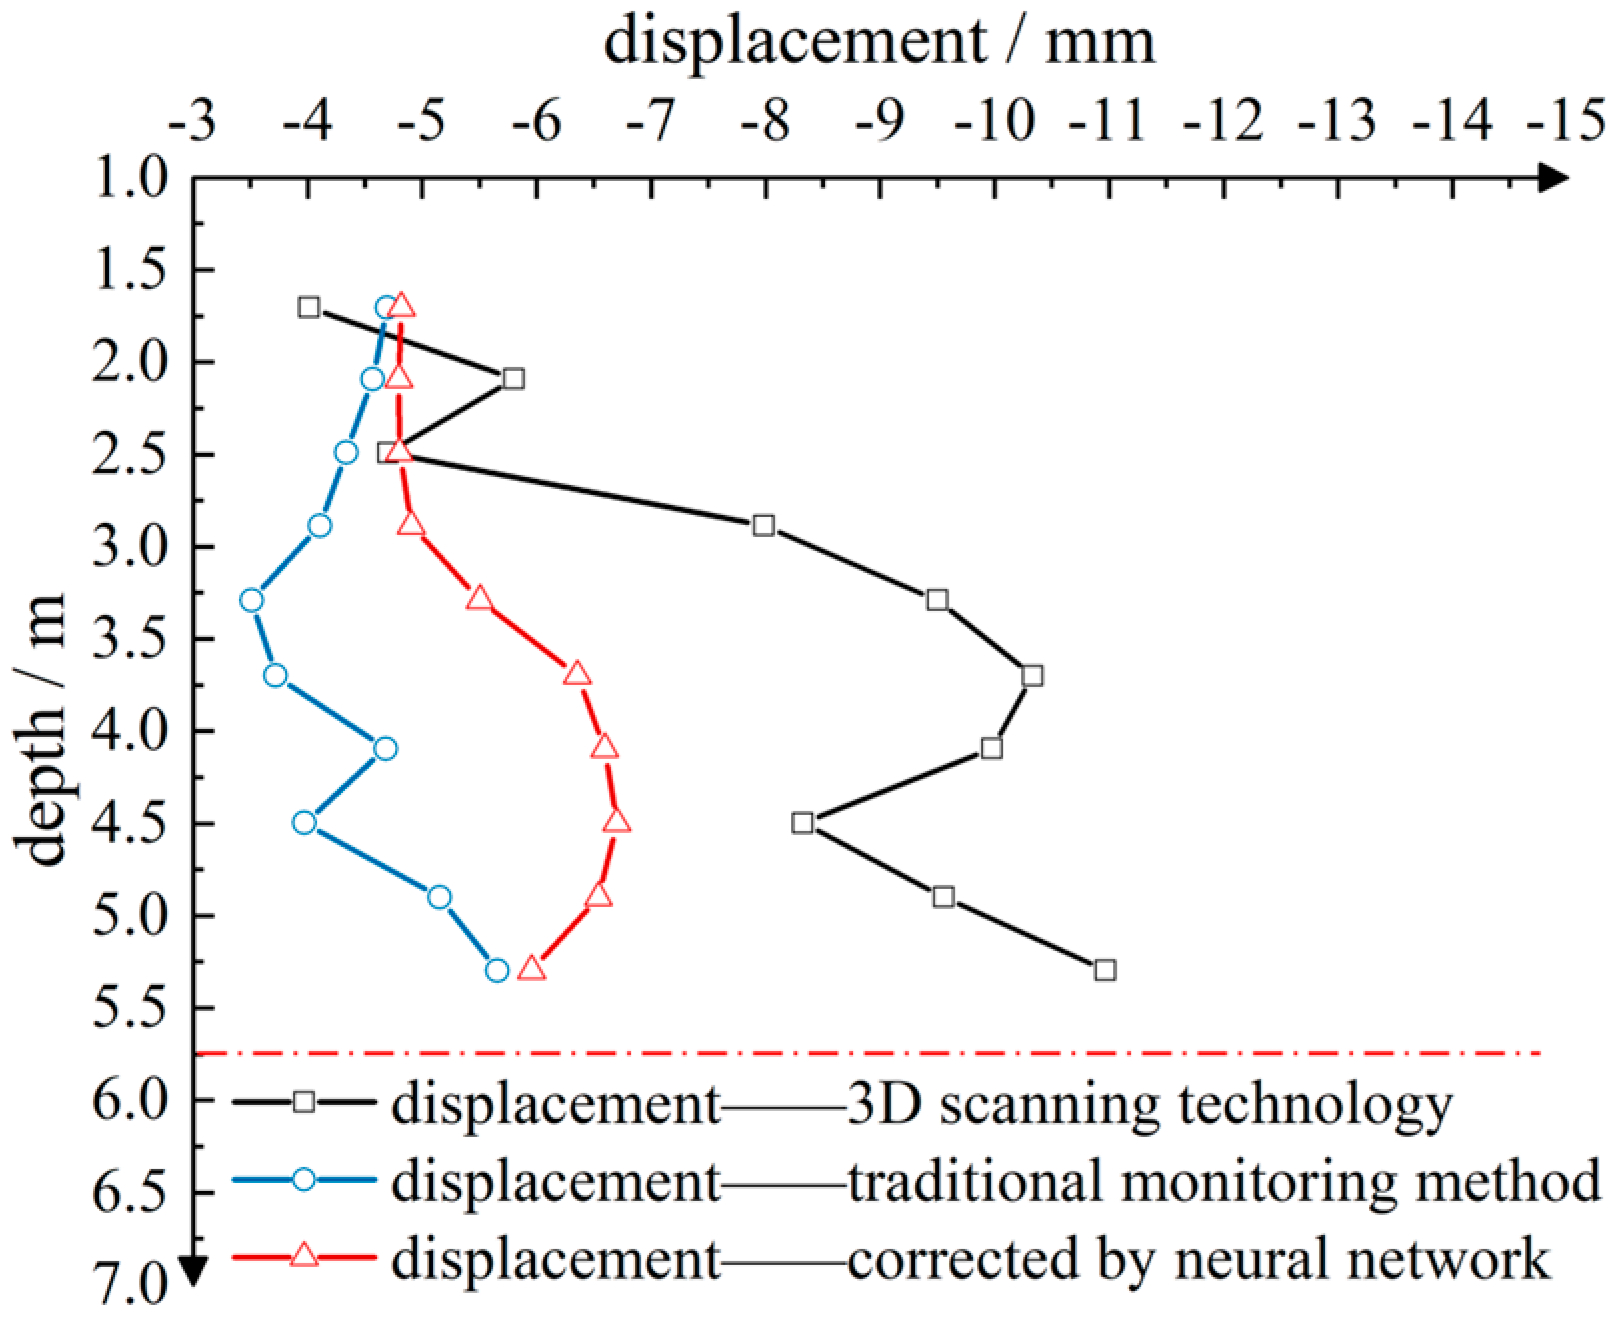
After training, the optimized network structure (4-10-1 configuration) was used to correct the scanning data. By inputting the 3D coordinates from scanning results into the network, the corrected outputs were generated and compared with traditional measurements (
Figure 10 and
Figure 11). The curves demonstrate that the discrepancy (quantified by MAE) decreased from 5.2 mm to 1.8 mm post-correction, with
improving from 0.72 to 0.91. Sensitivity analysis further revealed that lateral offset (
) and image source parameters (
) contributed 38% and 29% to prediction variance, respectively, aligning with soil–structure interaction theories. These results validate the effectiveness of integrating physics-driven parameters into neural network training.
The number of training samples has a strong correlation with the training effect of neural networks. With too few learning samples, the neural networks cannot learn the nonlinear mapping habit between input and output, and if too many samples are chosen, the training time of the networks will be excessively extended. Due to location conditions, energy costs, and other factors, the actual number of learning examples in this project is quite limited. It is foreseeable that when the quantity and frequency of monitoring data are adequate, the effect of neural network correction can be further enhanced. Furthermore, there are only a few training parameters used in this neural network training procedure, which will also reduce the neural network’s ability to remedy problems.
4. Discussion
The proposed method exhibits several advantages over the existing monitoring technologies in large-scale excavation projects. Compared to conventional inclinometers, our approach achieves an 80% spatial coverage (less than 30% for inclinometers) and reduces MAE from 5.2 mm to 1.8 mm through neural network correction. Under sparse data conditions, the proposed method outperforms recent UAV fusion methods in terms of accuracy [
16]. Additionally, compared to multi-sensor systems [
17], our framework requires no additional hardware, reducing deployment costs by 40% while maintaining comparable data continuity.
The approach presented in this research contributes to advancing the development of foundation pit monitoring techniques and three-dimensional technologies in geotechnical engineering. By embedding Sagaseta’s image source method [
47] into BPNN training, we establish the first explicit coupling between soil–structure interaction theory and data-driven correction, resolving the “black-box” limitation of conventional neural networks. This enables accurate deformation prediction even with sparse labels (<20% coverage). Furthermore, the integration of TLS monitoring with inclinometer monitoring enables the real-time visualization of 3D deformation fields, providing enhanced spatial resolution for the identification of localized high-risk areas, such as stress concentrations at support structure joints.
Within the validation project conducted at a deep foundation pit site in Hangzhou, subarea North 1 (soft clay) and North 5 (clay loam) exhibited MAE variations of 1.8 mm and 2.3 mm post-correction, respectively. The increased error in loamy conditions is attributed to reduced soil–structure coupling, while the error remains within acceptable thresholds.
While the proposed framework demonstrates several advantages, several key limitations warrant consideration:
- (1)
The BPNN’s performance relies on sufficient traditional monitoring points for training. Empirical testing reveals performance degradation when inclinometer monitoring coverage drops below 10%.
- (2)
Mechanical vibrations (>5 Hz) and dense obstructions (e.g., scaffolding) can degrade point cloud quality. This necessitates manual outlier removal combined with a filtering algorithm during the preprocessing phases.
- (3)
The current validation is primarily constrained to soft clay conditions. The method’s accuracy in rocky strata or high water table conditions remains untested.
- (4)
Although the current framework effectively integrates 3D laser scanning with inclinometers, it does not integrate complementary technologies such as thermal imaging or vibration sensors, which restricts its ability to capture multi-physical interactions.
Overall, the developed framework holds immediate applications in urban deep excavation safety monitoring (e.g., metro-adjacent projects in Hangzhou), BIM-integrated smart construction, and cost-sensitive scenarios. In addition, the pit point cloud dataset obtained by this method can provide a data validation basis for finite element modeling studies.
Future studies could focus on enhancing neural network adaptability under extreme data sparsity, potentially through hybrid approaches combining physical models with machine learning. Exploring cross-project data-sharing frameworks and real-time adaptive correction systems would extend the method’s applicability to diverse geological conditions and larger-scale excavations. These advancements could strengthen the balance between monitoring accuracy and operational feasibility in complex engineering scenarios.
5. Conclusions
In this paper, a 3D laser scanning monitoring method was proposed for monitoring deep foundation pit deformation. Based on a deep foundation pit project under construction in Hangzhou, the scanning monitoring results were compared with those obtained by traditional monitoring methods. Subsequently, the improved neural network was utilized to correct the scanning monitoring results with conventional monitoring data to increase the scanning monitoring accuracy. The following conclusions can be drawn:
(1) Three-dimensional laser scanning technology enables the collection of large volumes of data and provides a concise visualization of deformation. In terms of monitoring range, data continuity, flexibility, and non-contact measurement, 3D laser scanning monitoring is more advantageous than traditional monitoring methods. However, because of the project’s huge pit and the multi-station splicing involved in the scanning process, it is more challenging to guarantee accuracy. Simultaneously, when the scanning distance increases, the accuracy of 3D laser scanning also experiences a considerable decline, which limits its role as a complementary tool for validating conventional monitoring results.
(2) Analysis of monitoring data from different monitoring methods (3D laser scanning monitoring in this paper and traditional inclinometer monitoring) reveals that although the displacement distribution trends of the two are generally consistent, there is a greater degree of deformation in the scanning monitoring data. A few data points exhibit significant variations primarily as a result of variations in the level of interference, monitoring precision, and monitoring objects. The findings of scanning monitoring and traditional monitoring indicate certain variances, but they also show a strong correlation of the deformation at various levels at the same position of the deep foundation pit.
(3) A neural network algorithm was applied to the quantitative scanning monitoring data to establish the mapping between traditional monitoring and scanning measurements, correct the 3D laser scanning results, and improve monitoring accuracy. The data indicate that the corrective procedure is effective.
It was confirmed that our enhanced neural network correlated satisfactorily with actual deep foundation pit project data. Nevertheless, the analysis reveals that real deep foundation pit projects have a limited number of measurement points and monitoring data, whereas neural network training requires a vast amount of data. More research is needed to determine how to address the issues brought on by the sparse monitoring data, constrained training parameters, and uncertain applicability.


