Article

Analyzing the Spatial-Temporal Patterns of Urban Heat Islands in Nanjing: The Role of Urbanization and Different Land Uses

1
School of Architecture and Urban Planning, Guangdong University of Technology, Guangzhou 510080, China
2
School of Architecture, The Chinese University of Hong Kong, Hong Kong SAR, China
*
Author to whom correspondence should be addressed.
Buildings 2025, 15(8), 1289; https://doi.org/10.3390/buildings15081289
Submission received: 3 March 2025 / Revised: 4 April 2025 / Accepted: 10 April 2025 / Published: 14 April 2025
(This article belongs to the Section Architectural Design, Urban Science, and Real Estate)

Abstract

This study explores the spatiotemporal distribution and formation mechanisms of urban heat islands (UHIs) in Nanjing during summer, utilizing temperature data from 82 automatic weather stations (AWSs) distributed across five concentric zones. The results demonstrate the substantial impact of urbanization on UHI patterns, with industrial and densely populated areas exhibiting higher UHI intensity (UHII), while regions with natural landscapes such as mountains and water bodies display lower temperatures. The analysis reveals that the most pronounced night-time UHI effect occurs in the highly urbanized central zones, whereas the weakest effect is observed during midday. Transitional UHI phases are identified around sunrise and sunset, with increased long-wave radiation post-sunset amplifying the UHI effect. Additionally, this study underscores the directional characteristics of UHI distribution in Nanjing. Notably, Hexi New Town has emerged as a new high-temperature hotspot due to rapid urbanization, while Jiangning New Town and Xianlin Sub-City maintain lower temperatures owing to their proximity to agricultural and forested areas. By selecting representative AWSs from different zones, this study introduces a novel and practical method for calculating UHII. Although the approach has limitations in precision, it provides an accessible tool for UHI analysis and can be adapted for use in other cities. This research offers valuable insights into the influence of urban development on local climate and presents a practical framework for future UHI studies and urban planning strategies aimed at mitigating UHI effects.

1. Introduction

In the last few decades, most cities in China have undergone large-scale rapid urbanization, which has led to rapid changes in land use and land cover (LULC). The continuous process of urbanization has a significantly negative impact on the urban environment, leading to a common microclimate phenomenon known as the urban heat island (UHI) effect. This effect is characterized by higher near-surface temperatures in urban areas compared to surrounding rural regions [1]. This phenomenon not only adversely affects outdoor thermal comfort and increases building energy consumption, but also exacerbates air pollution, thereby reducing urban livability. Moreover, the heightened energy demands linked to urban heat stress have prompted explorations into innovative energy management and optimization strategies [2], which highlight the integration of sustainable energy solutions to mitigate urban thermal challenges.
Previous explorations on UHI effects generally employ three kinds of methodologies, including remote sensing, numerical simulation, and meteorological station measurement. In recent years, with the rapid development of remote sensing technology, numerous advanced remote sensing instruments and equipment have been employed to obtain high-resolution remote sensing data for analyzing the surface urban heat island (SUHI) effect and its relationship with surface characteristics [3,4,5,6,7,8,9,10]. These studies validate that the spatial distribution of LST observed through remote sensing is influenced not only by urban patterns [11] but also by the properties of the urban underlying surface, including land use layout, the nature of land cover materials, and vegetation coverage [12,13]. Additionally, urban morphological factors, such as building density and the geometric shape of street canyons, significantly affect urban thermal fields [14,15]. Population distribution and the intensity of human activities also contribute to the SUHI effect [16,17,18,19]. Although remote sensing provides extensive spatial coverage and high spatiotemporal resolution, the anisotropy of three-dimensional urban surface radiation, the uncertainty of surface emissivity, and the spatial variation in atmospheric transmittance in urban areas significantly affect the accuracy of surface temperature retrieval, resulting in certain errors.
In addition, numerical simulation technology is increasingly being used to analyze the spatiotemporal distribution characteristics of the atmosphere urban heat island (AUHI) effect in different climate regions [20,21,22,23,24,25,26]. Numerical simulations with high-performance computers can effectively study the relative contributions of LULC changes, anthropogenic heat sources, and solar radiation to the UHI [27,28]. Weather modeling tools with high spatiotemporal resolution, such as the WRF model, are used to generate virtual meteorological data [28,29,30]. However, the currently developed simulation tools still have significant limitations, including the complexity and excessive detail of urban specifics, the theoretical weaknesses of the methods, and the high computational costs of simulations [31].
Furthermore, studies on the canopy layer heat island (CLHI) also employ data from meteorological stations [32,33,34]. Meteorological data provided by weather stations are highly accurate and convenient, offering long-term temperature records [35]. The measurement of the CLHI effect typically involves using sensors from fixed or mobile meteorological stations located at ground level to obtain the necessary meteorological data. Mobile measurement exhibits advantages such as high spatial resolution across the entire study area, high temporal resolution throughout the study period, lower cost, and ease of implementation. It can also serve as a reconnaissance survey to determine the locations for installing more expensive fixed temperature sensors. Most mobile measurements were conducted using vehicles or bicycles across transects [36,37,38]. Nevertheless, mobile measurement often suffers from temporal inconsistencies, making it difficult to obtain continuous long-term records. Operational challenges include logistical planning and coordination, particularly in densely populated areas. Mobile measurement depends on chosen transect routes, which might miss critical UHI hotspots, and are prone to human error.
In comparison, some other explorations were carried out by setting up fixed weather stations [39,40]. However, static measurement also has limitations. Due to the limited observation range, a single meteorological observation station cannot reflect the UHI situation of an entire city [41,42]. Moreover, it is unrealistic to cover an entire city with temperature detection sensors due to the high cost of weather stations [43]. Additionally, weather stations are susceptible to various interferences from human activities and environmental factors, leading to data instability. Dense population areas and other man-made surfaces are often unsuitable for building weather stations, even though these areas are of greater research interest [44]. Therefore, enhancing understanding of the UHI effect across the city can be achieved by increasing the number of observation points or collaborating with more weather stations [45,46,47,48].
As one of the core cities in the Yangtze River Delta, Nanjing has seen significant transformations in its urban development, which leads to the generation of a multi-centric urban system. The core center is the Xinjiekou centralized zone (XCZ), while sub-centers include zones of Hexi, Fuzimiao, and Hunan Road. Additionally, subdistrict-level centers have emerged in areas like Xianlin in Qixia District and Dongshan in Jiangning District. Overall, the city’s natural geography, climatic conditions, historical development, and rapid urbanization contribute to the distinct characteristics of Nanjing’s UHI effect. Analyzing the spatiotemporal distribution characteristics of the UHI effect in Nanjing, based on its geographical and climatic conditions, and exploring the impact of urban spatial layout development and changes on the UHI effect are of significant importance. Such analysis can guide scientific and rational urban spatial planning and design, ensuring a balanced integration of economic and environmental benefits. Based on the above literature review, previous explorations on the UHI effect of Nanjing mostly focused on analyzing the impact of UHI from various angles by using remote sensing technology [39,49,50,51,52], while a few studies employ numerical simulation method to analyze the AUHI effect of Nanjing. In comparison, only a small portion of studies utilized the ground observation method due to the limited number of fixed weather stations.
In the past decade, the Nanjing Meteorological Bureau (NMB) has built up an extensive professional observation network, comprising approximately 130 automatic weather stations (AWSs) distributed across the city. These AWSs enable the study to overcome the challenges of limited spatial coverage and low resolution that typically plague fixed measurement methods.
Thus, this study aims to comprehensively analyze the spatiotemporal distribution and underlying mechanisms of the UHI effect in Nanjing by using the recorded weather data from this extensive network of weather stations. Instead of relying on traditional interpolation methods commonly used in previous studies [53], a novel and streamlined approach for calculating the UHI intensity (UHII) is introduced. Meteorological data from an extensive network of fixed-point weather stations were analyzed by dividing Nanjing into annular zones centered on the XCZ and selecting representative urban and rural stations. The UHII was then calculated as the temperature difference between these stations during clear, high-temperature summer days to reveal the spatiotemporal distribution of the UHI effect. Although this method is recognized for its simplicity, robust insights into urban thermal dynamics are provided. The findings of this study demonstrate that a detailed analysis of the UHI effect using an extensive network of fixed-point weather stations can uncover nuanced spatiotemporal patterns that are closely linked to urban morphological characteristics and land use dynamics. These results contribute to the field by providing a novel, practical method for UHII calculation, enhancing our understanding of urban heat dynamics and offering valuable insights for urban planning and mitigation strategies in rapidly urbanizing areas.

2. Data and Method

This study presents an analysis of the UHI effect in Nanjing based on the meteorological data obtained from the fixed-point ground observations of the NMB, which has a professional observation network in the city, consisting of approximately 130 AWSs. The meteorological data used in this study covers the period of August 2015 and August 2016, recorded by these AWSs at a frequency of once per ten minutes.

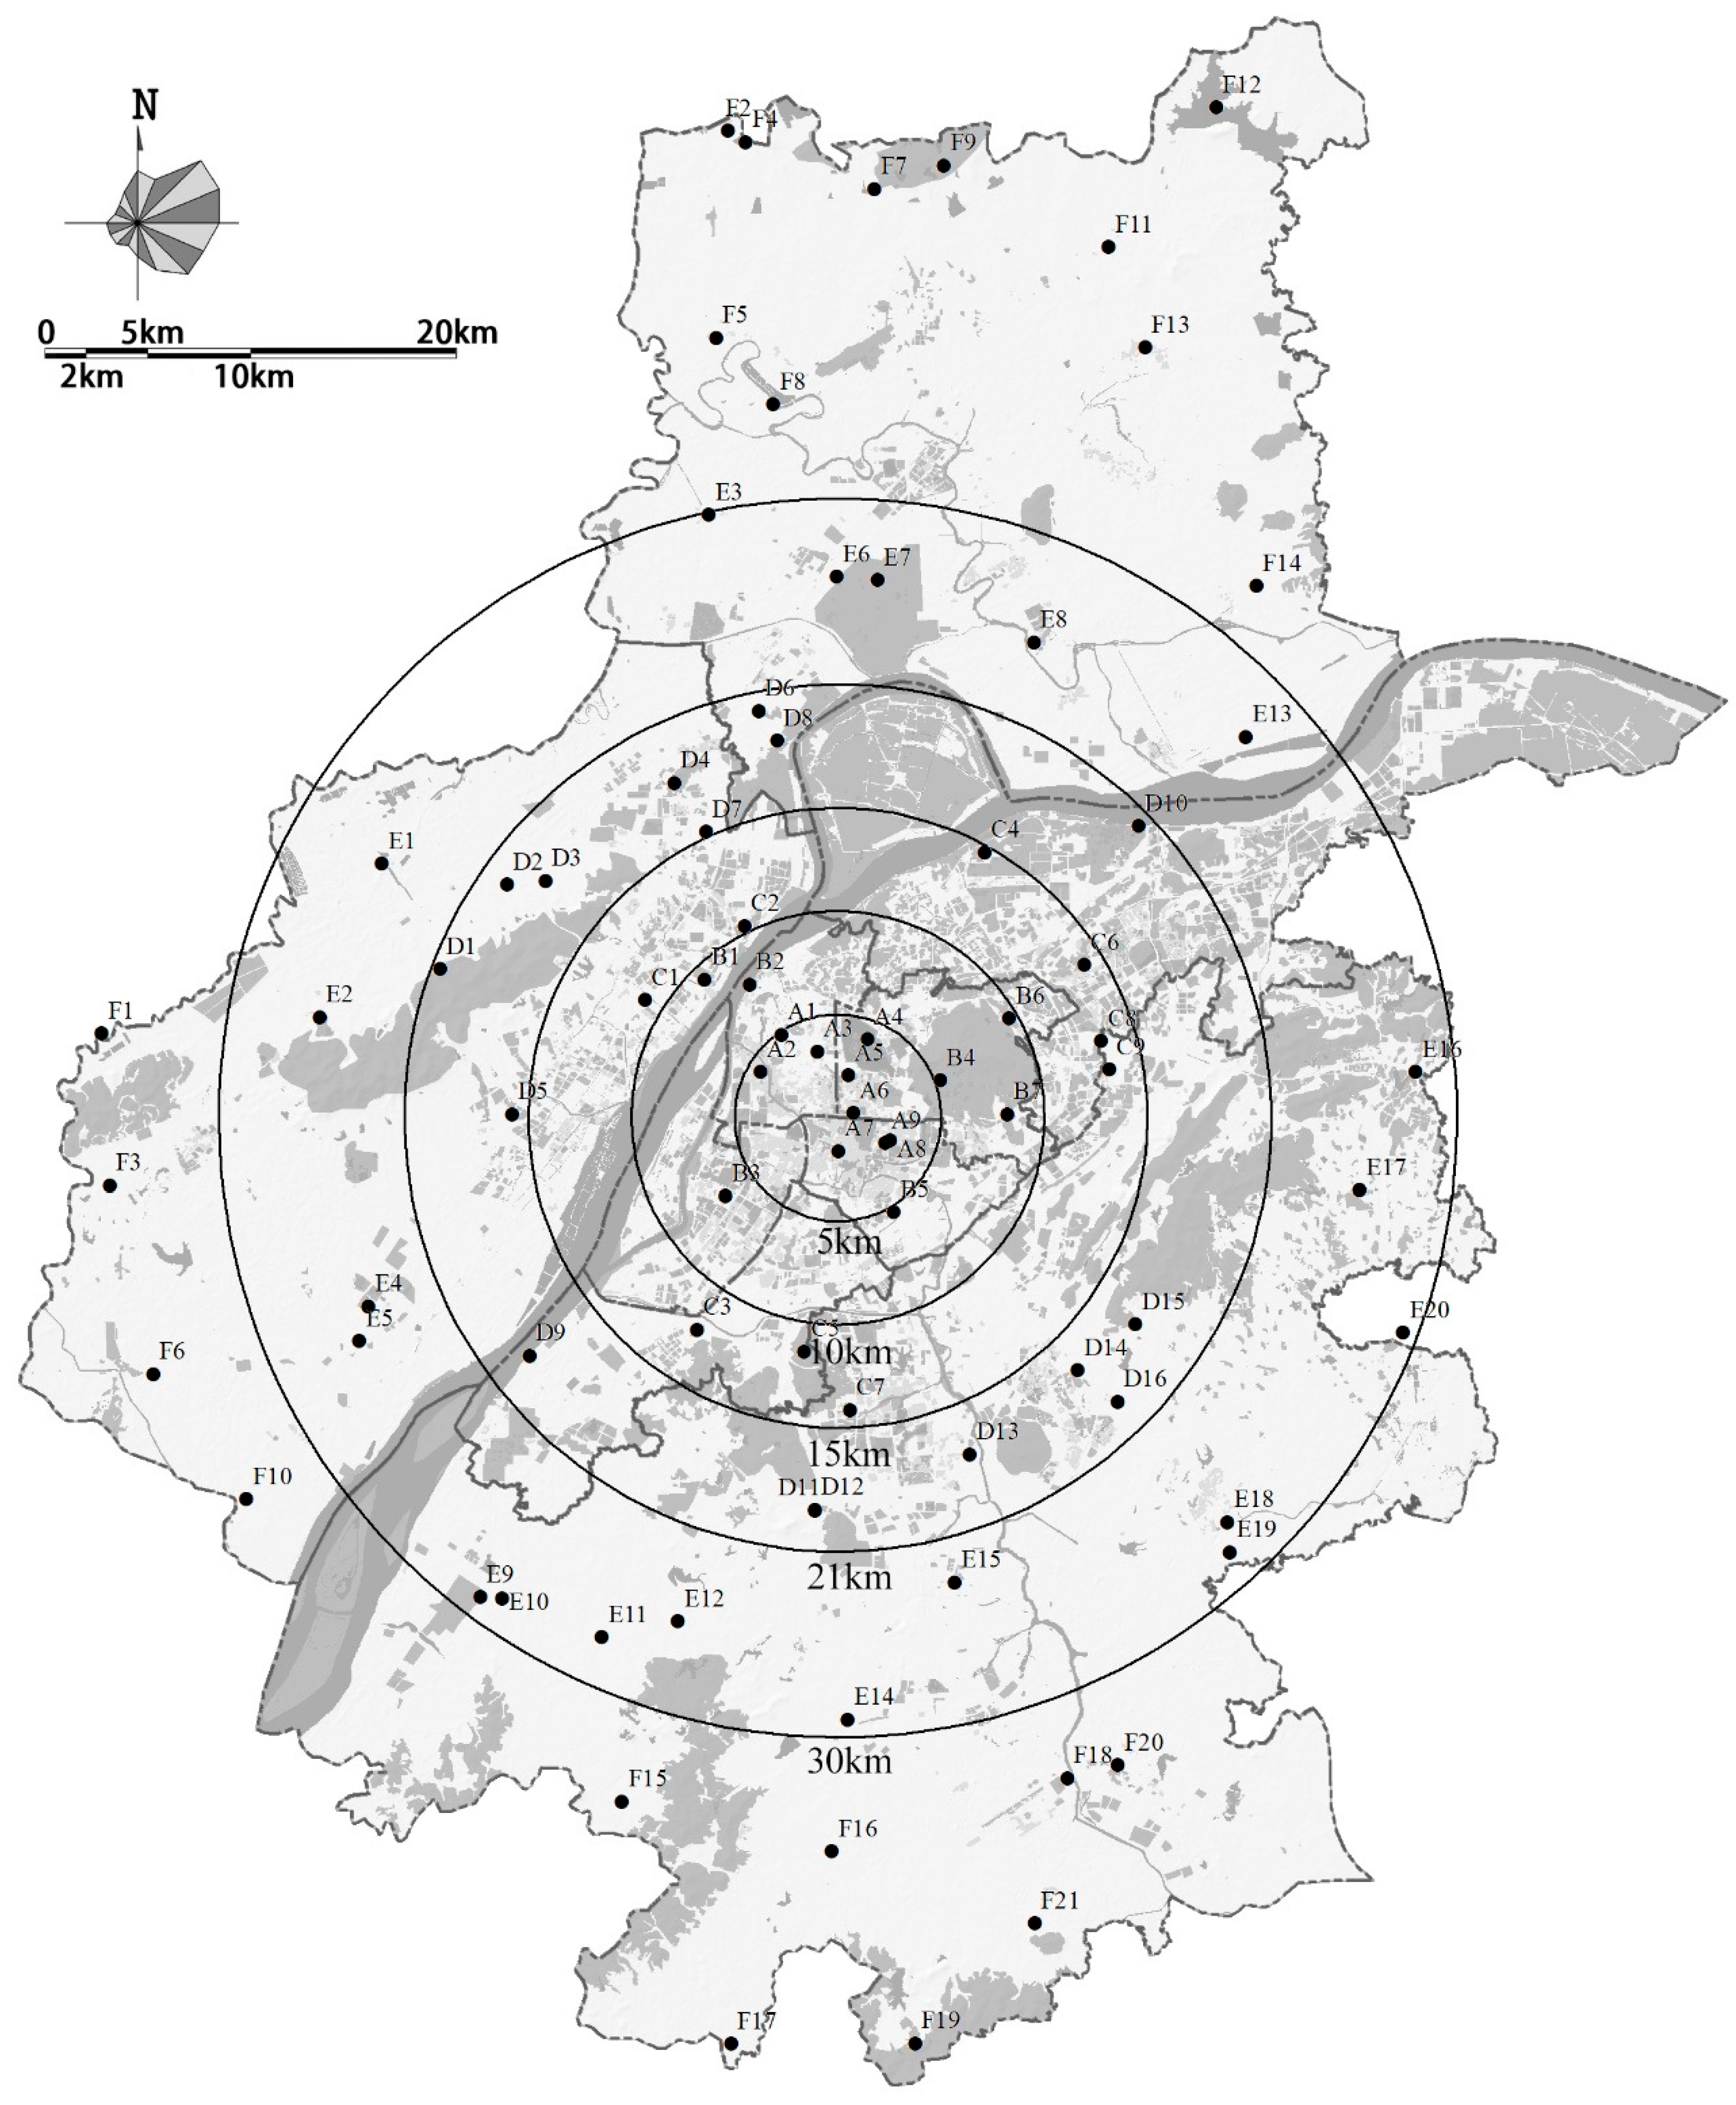
2.1. Annular Zone Division for UHI Analysis

In this study, the XCZ was taken as the center, and the main urban area of Nanjing is divided into five annular zones with radius of 5 km, 10 km, 15 km, 21 km, and 30 km according to the built-up area percentage, as shown in Table 1. The built-up areas in the classification system were considered as urban land, and various urban land percentages represent different land use attributes and characteristics within each zone. A total of 82 AWSs were selected based on the percentage of LULC within a 4 km radius buffer around the stations, as shown in Figure 1. The screening of AWSs also follows two principles: (1) the meteorological data for both August 2015 and August 2016 must be complete; (2) the data quality for both periods must meet the required standards, with minimal data missing. Accordingly, the selected AWSs within each zone are shown in Table 1.

2.2. Data Selection and Quality Control

The weather data set from August 2015 and August 2016, recorded by the selected AWSs, were used for analysis in this study. To ensure the reliability of our results, the data underwent a rigorous screening and validation process. Initially, data completeness and consistency were checked, and quality control filters were applied to remove erroneous measurements. In addition, to minimize the impact of precipitation on the analysis of the urban heat island effect, only meteorological data from clear, low-cloud, and rain-free days were used.
The AWS temperature data were then validated by comparing them with corresponding measurements from National Meteorological Stations (NMS). Standard statistical metrics, including regression analysis and graphical analytical method, were employed to evaluate the accuracy of the AWS data [54]. Specifically, the actual temperature values from the AWSs were plotted on the ordinate axis, while those from the NMS on the abscissa, and the resulting linear relationship was compared against a 1:1 line. As shown in Figure 2, the linear dependency almost coincides with the 1:1 line, with a slope coefficient of 0.9854 and an R2 of 0.8102. Additionally, the root mean square error (RMSE) was calculated to quantify the discrepancies between the two datasets, where lower RMSE values indicate higher accuracy. The validation results yielded RMSE values ranging from approximately 1.52 °C to 2.93 °C, consistent with previous studies [55,56], thereby supporting the reliability of the AWS-derived temperature data for further analysis.
Accordingly, the daily average, minimum, and maximum temperatures ranged from 31.2 °C to 33.2 °C, 27.2 °C to 30.6 °C, and 35.9 °C to 37.4 °C, respectively. Relative humidity varied between 45% and 81%, and wind speeds were generally below 3.0 m/s. The hourly temperature data recorded at each AWS over the selected clear-weather days were arithmetically averaged for each corresponding hour, forming two 24 h temperature profiles. These two profiles represent the 24 h temperature variations at each AWS under typical summer high-temperature conditions in 2015 and 2016, reflecting the temperature dynamics in the surrounding areas. Consequently, these air temperature data from the 82 AWSs were statistically analyzed based on their respective zonal ranges.

2.3. Calculation of UHII and Selection of Representative Weather Stations

The UHI effect is typically measured by the UHII, calculated as the temperature difference between urban and rural areas at the same time and altitude, denoted as ΔTu−r (Equation (1)) [57]. However, the urban morphology, properties of LULC, and natural geographic conditions vary between different locations, whether in urban or rural areas. Consequently, the specific urban environment surrounding different weather stations within the same urban or rural areas may differ significantly. For the 82 AWSs mentioned, although they have been categorized into annular zones based on their distance from the XCZ, the temperature distribution and corresponding UHII near these stations do not necessarily follow a linear relationship with the distance from the city center due to the varying surrounding environments and topographical conditions of the weather stations. Therefore, the selection of representative weather stations in each annular zone has a significant impact on the analysis of the UHI effect.
Δ T u r = T u T r
To objectively analyze the spatial and temporal distribution characteristics of the UHI effect in Nanjing, this study selected several AWSs within the outermost annular zone (>30 km) with surrounding land use of open spaces and agricultural/forestry areas as representatives of rural weather stations. The arithmetic mean temperature recorded by these stations was used as the rural temperature. Meanwhile, in other annular zones, AWSs located in typical urban built-up areas were selected as representatives of urban weather stations for each annular zone, with the arithmetic mean of the temperature recorded by these stations used as the urban temperature corresponding to each annular zone. By comparing the temperature differences between the urban representative weather stations in each annular zone and the rural representative weather stations in the outermost annular zone, this study explores and verifies the spatial and temporal distribution characteristics and patterns of the urban CLHI effect at the city-wide scale.

3. Results and Discussion

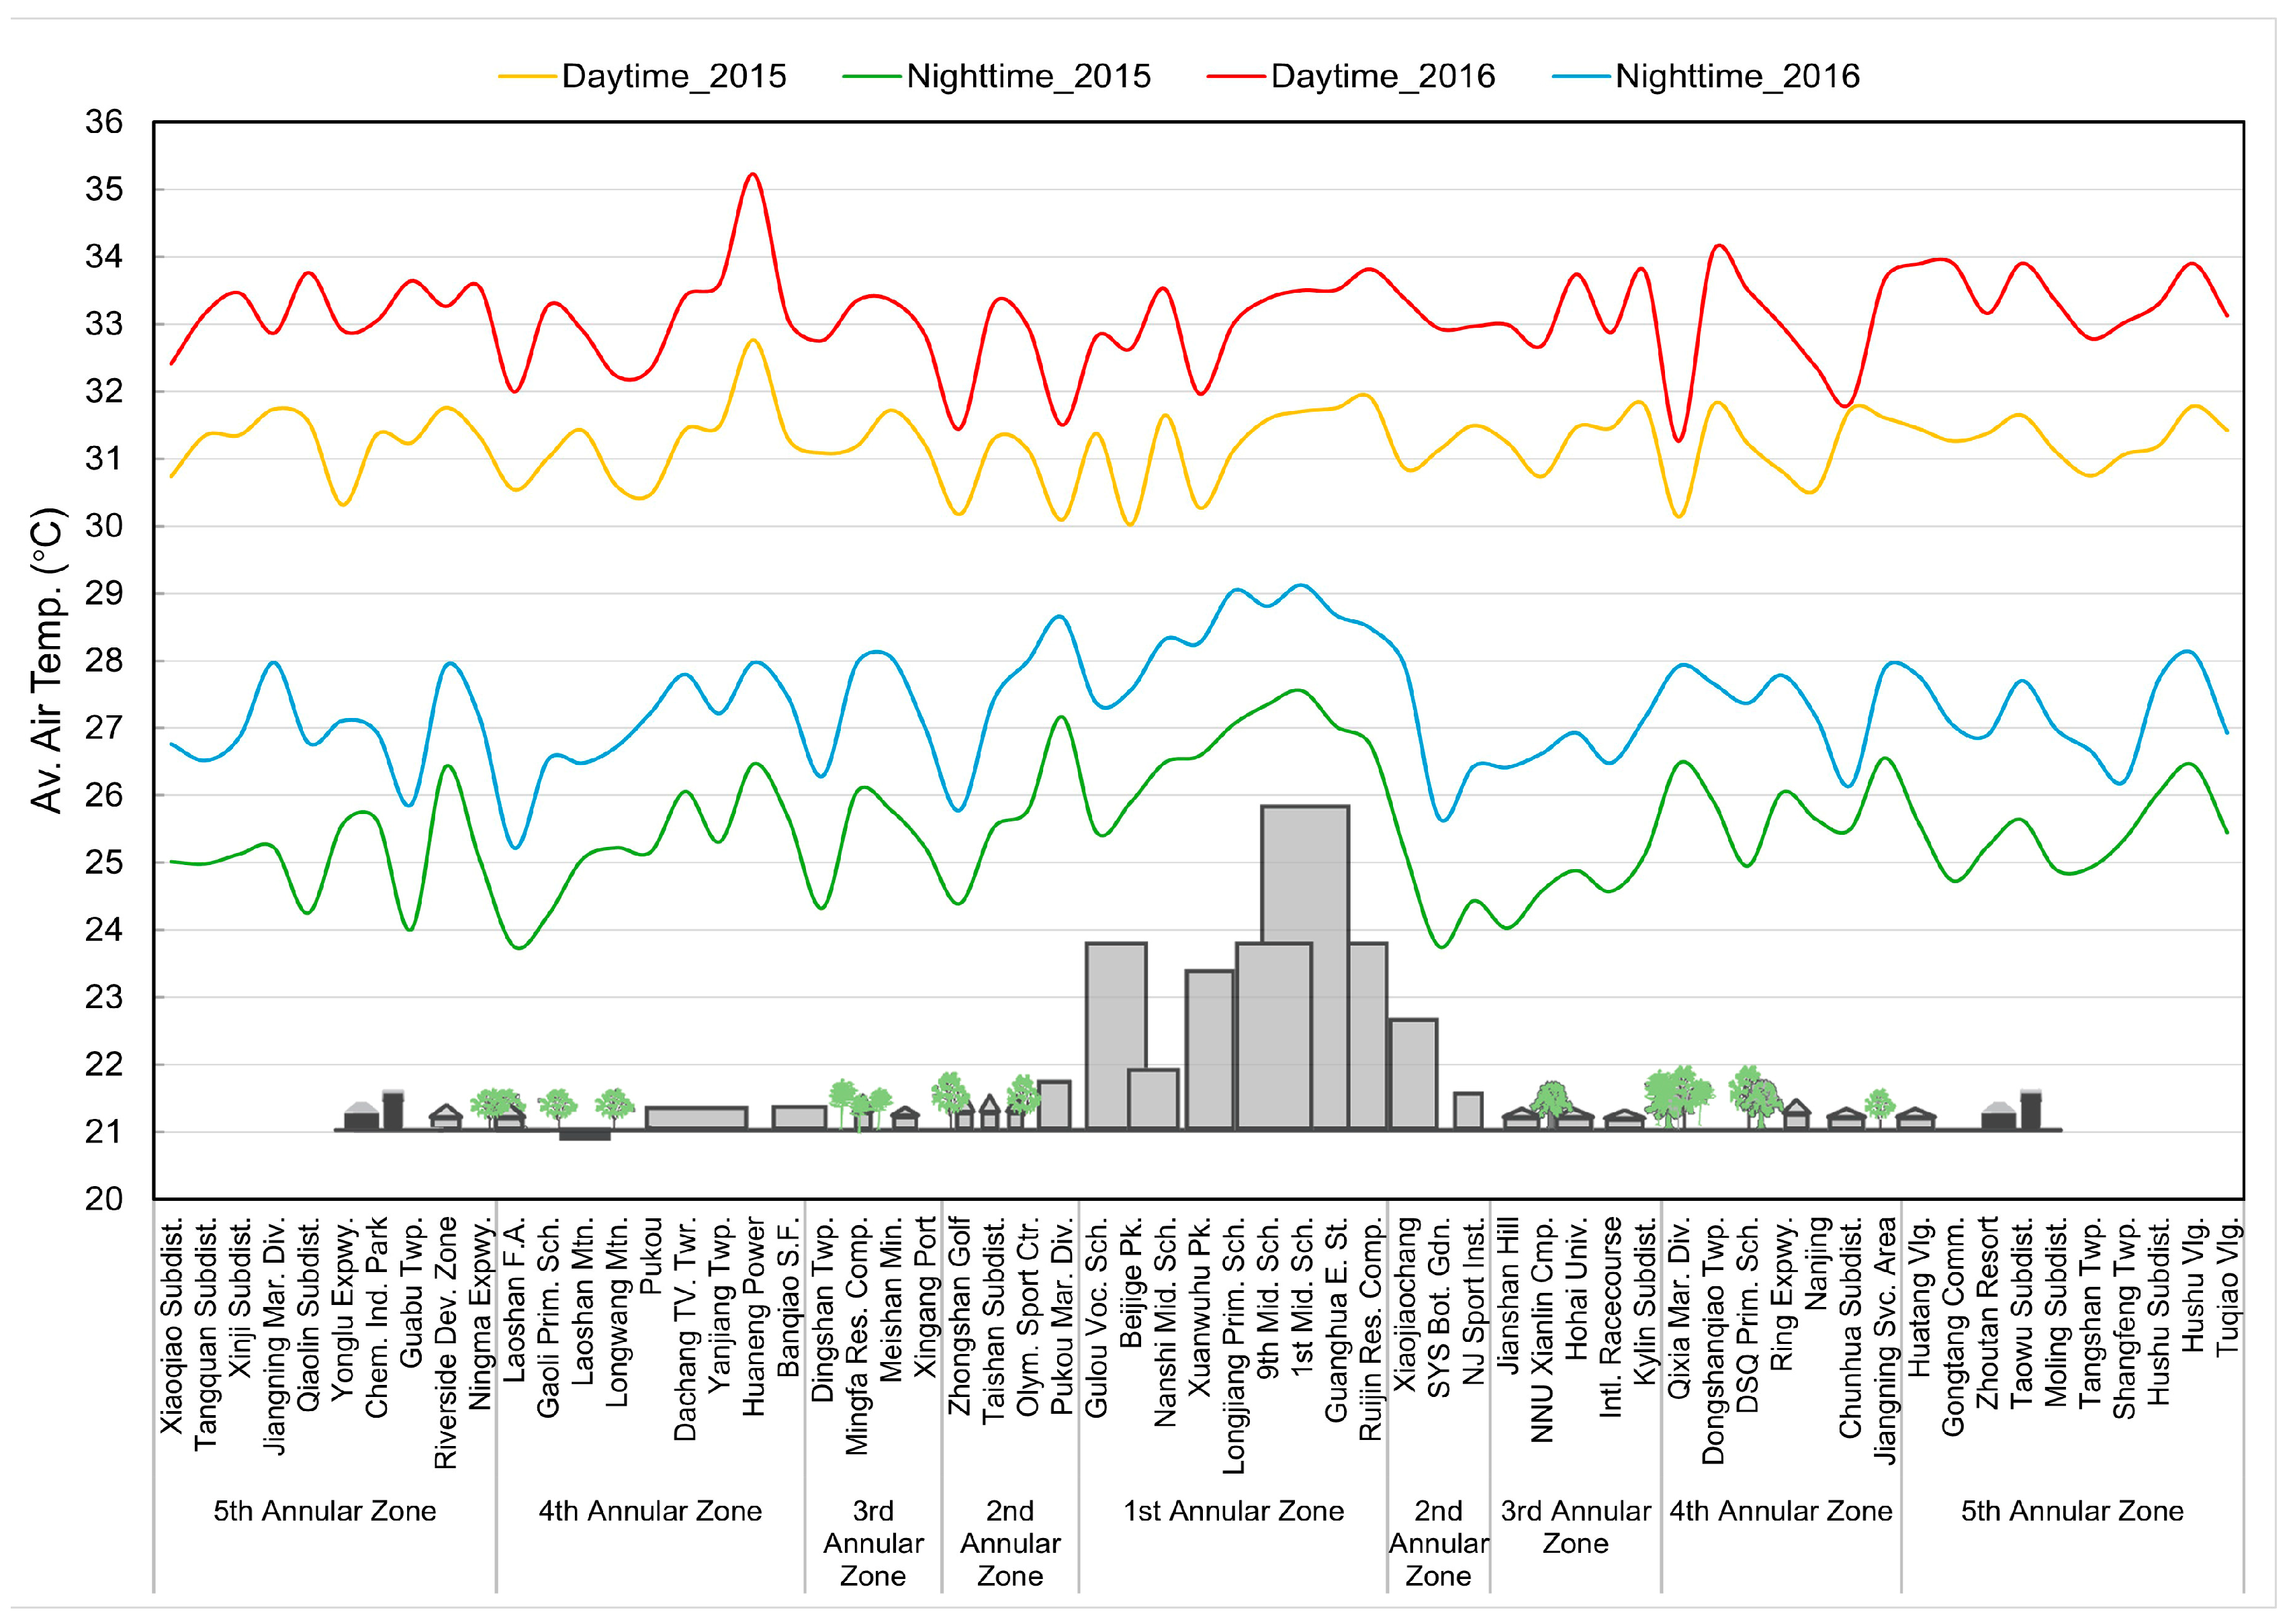
3.1. Temporal Distribution Characteristics of UHII

The built-up area percentages in the surrounding areas of all 21 AWSs in the outermost annular zone (>30 km) listed in Table 1 are below 30%, with an average of 20%. Among these, 9 stations have a built-up area percentage of no more than 12%, 7 stations fall within the range of 12% to 20%, and 5 stations have a built-up area percentage between 20% and 30%. Accordingly, these 21 stations were selected as representatives of rural weather stations. The arithmetic mean of the temperatures recorded at these stations was used to determine the rural air temperature Tr.

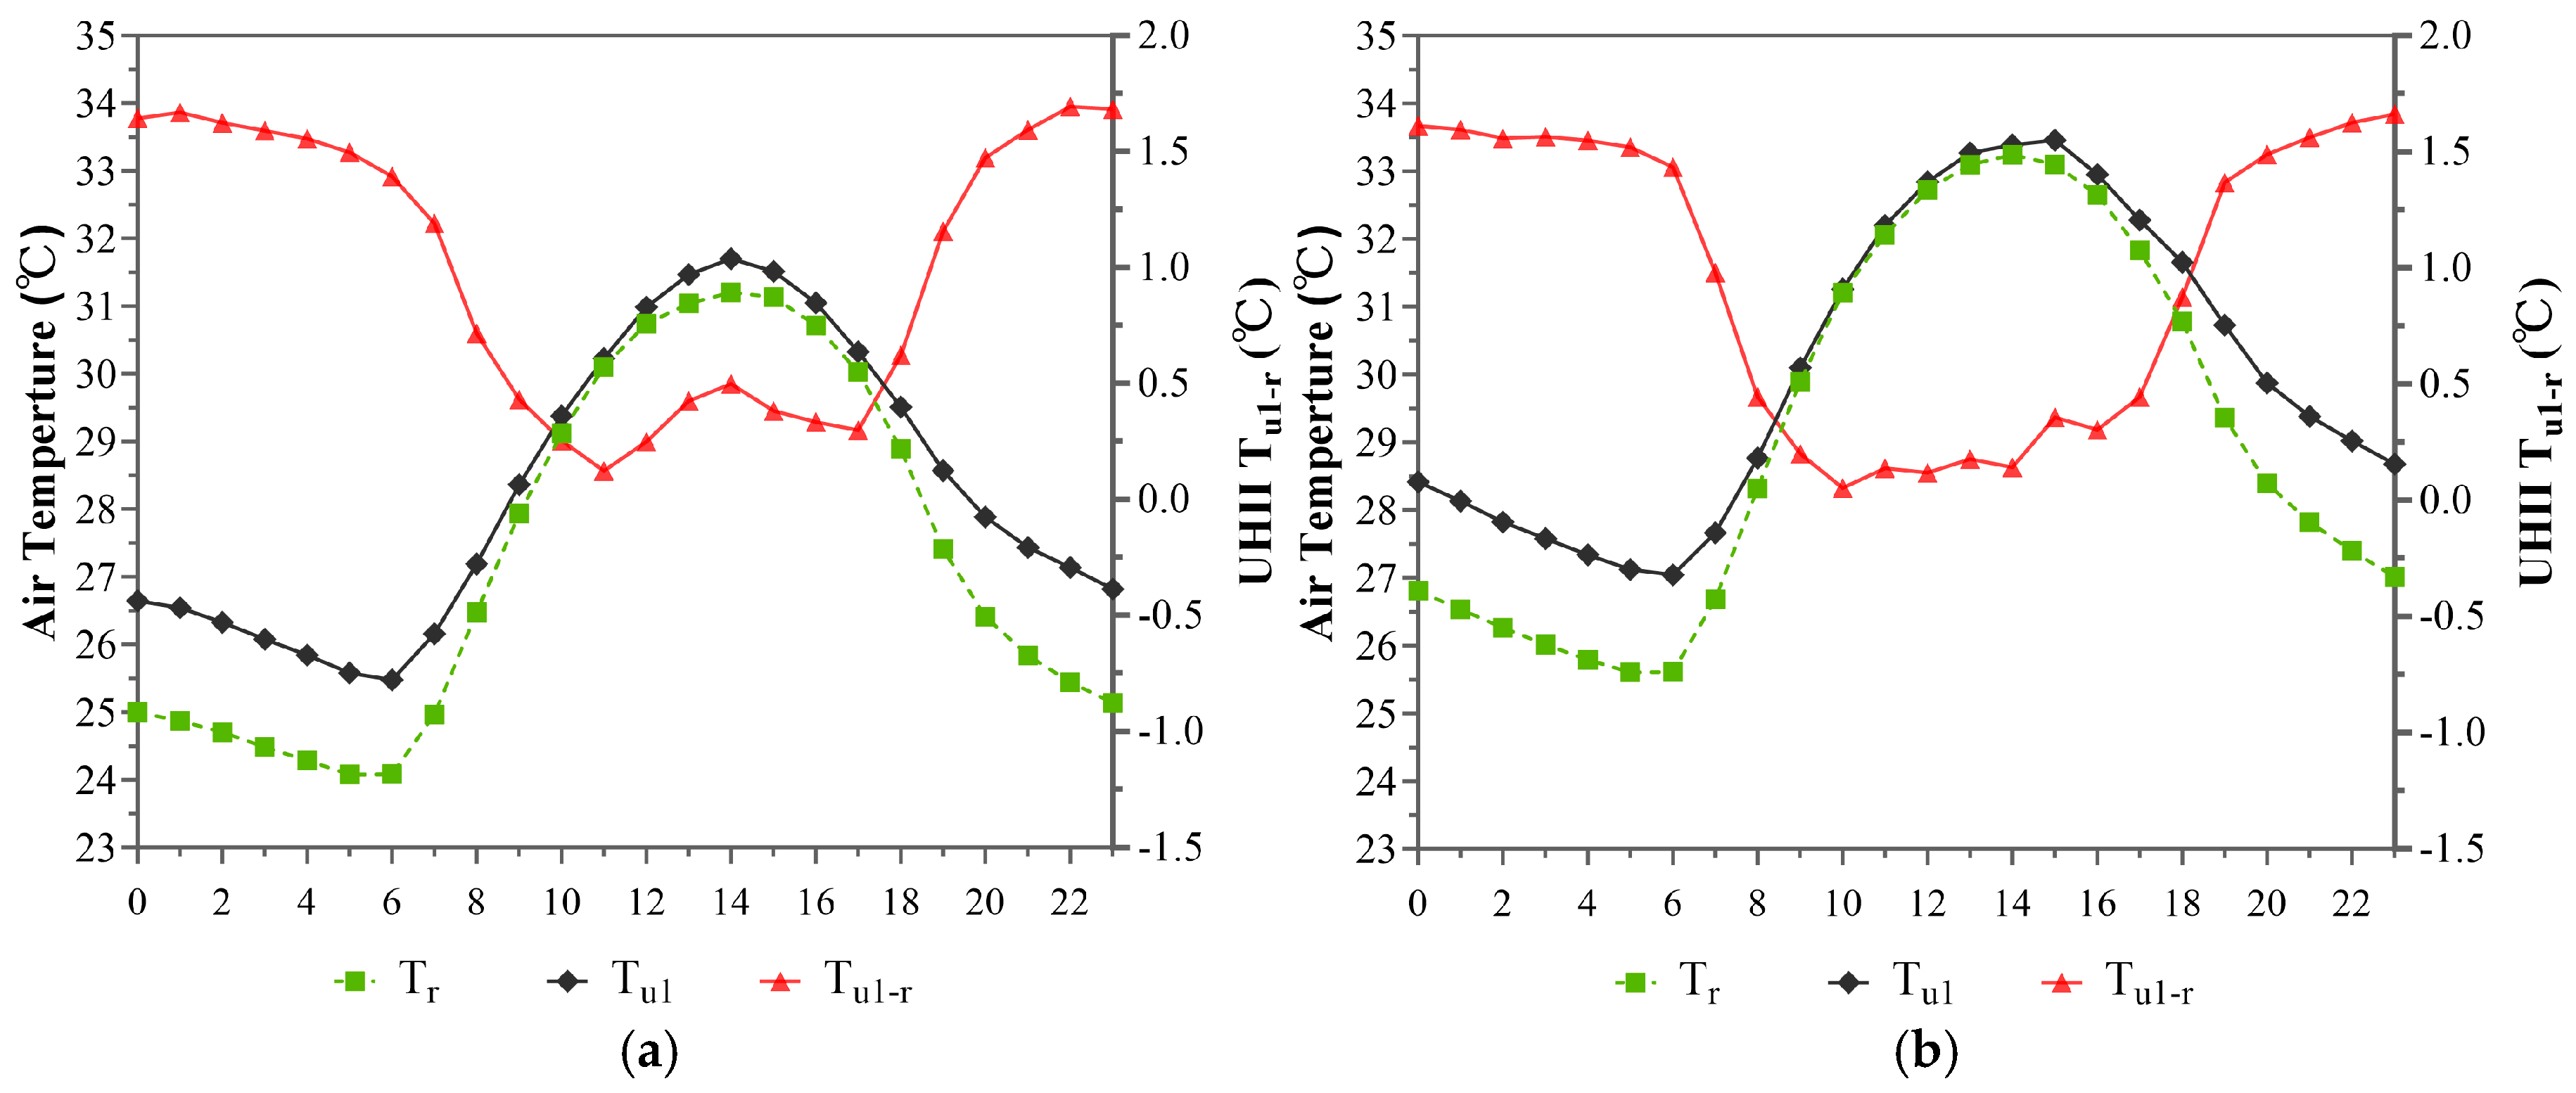
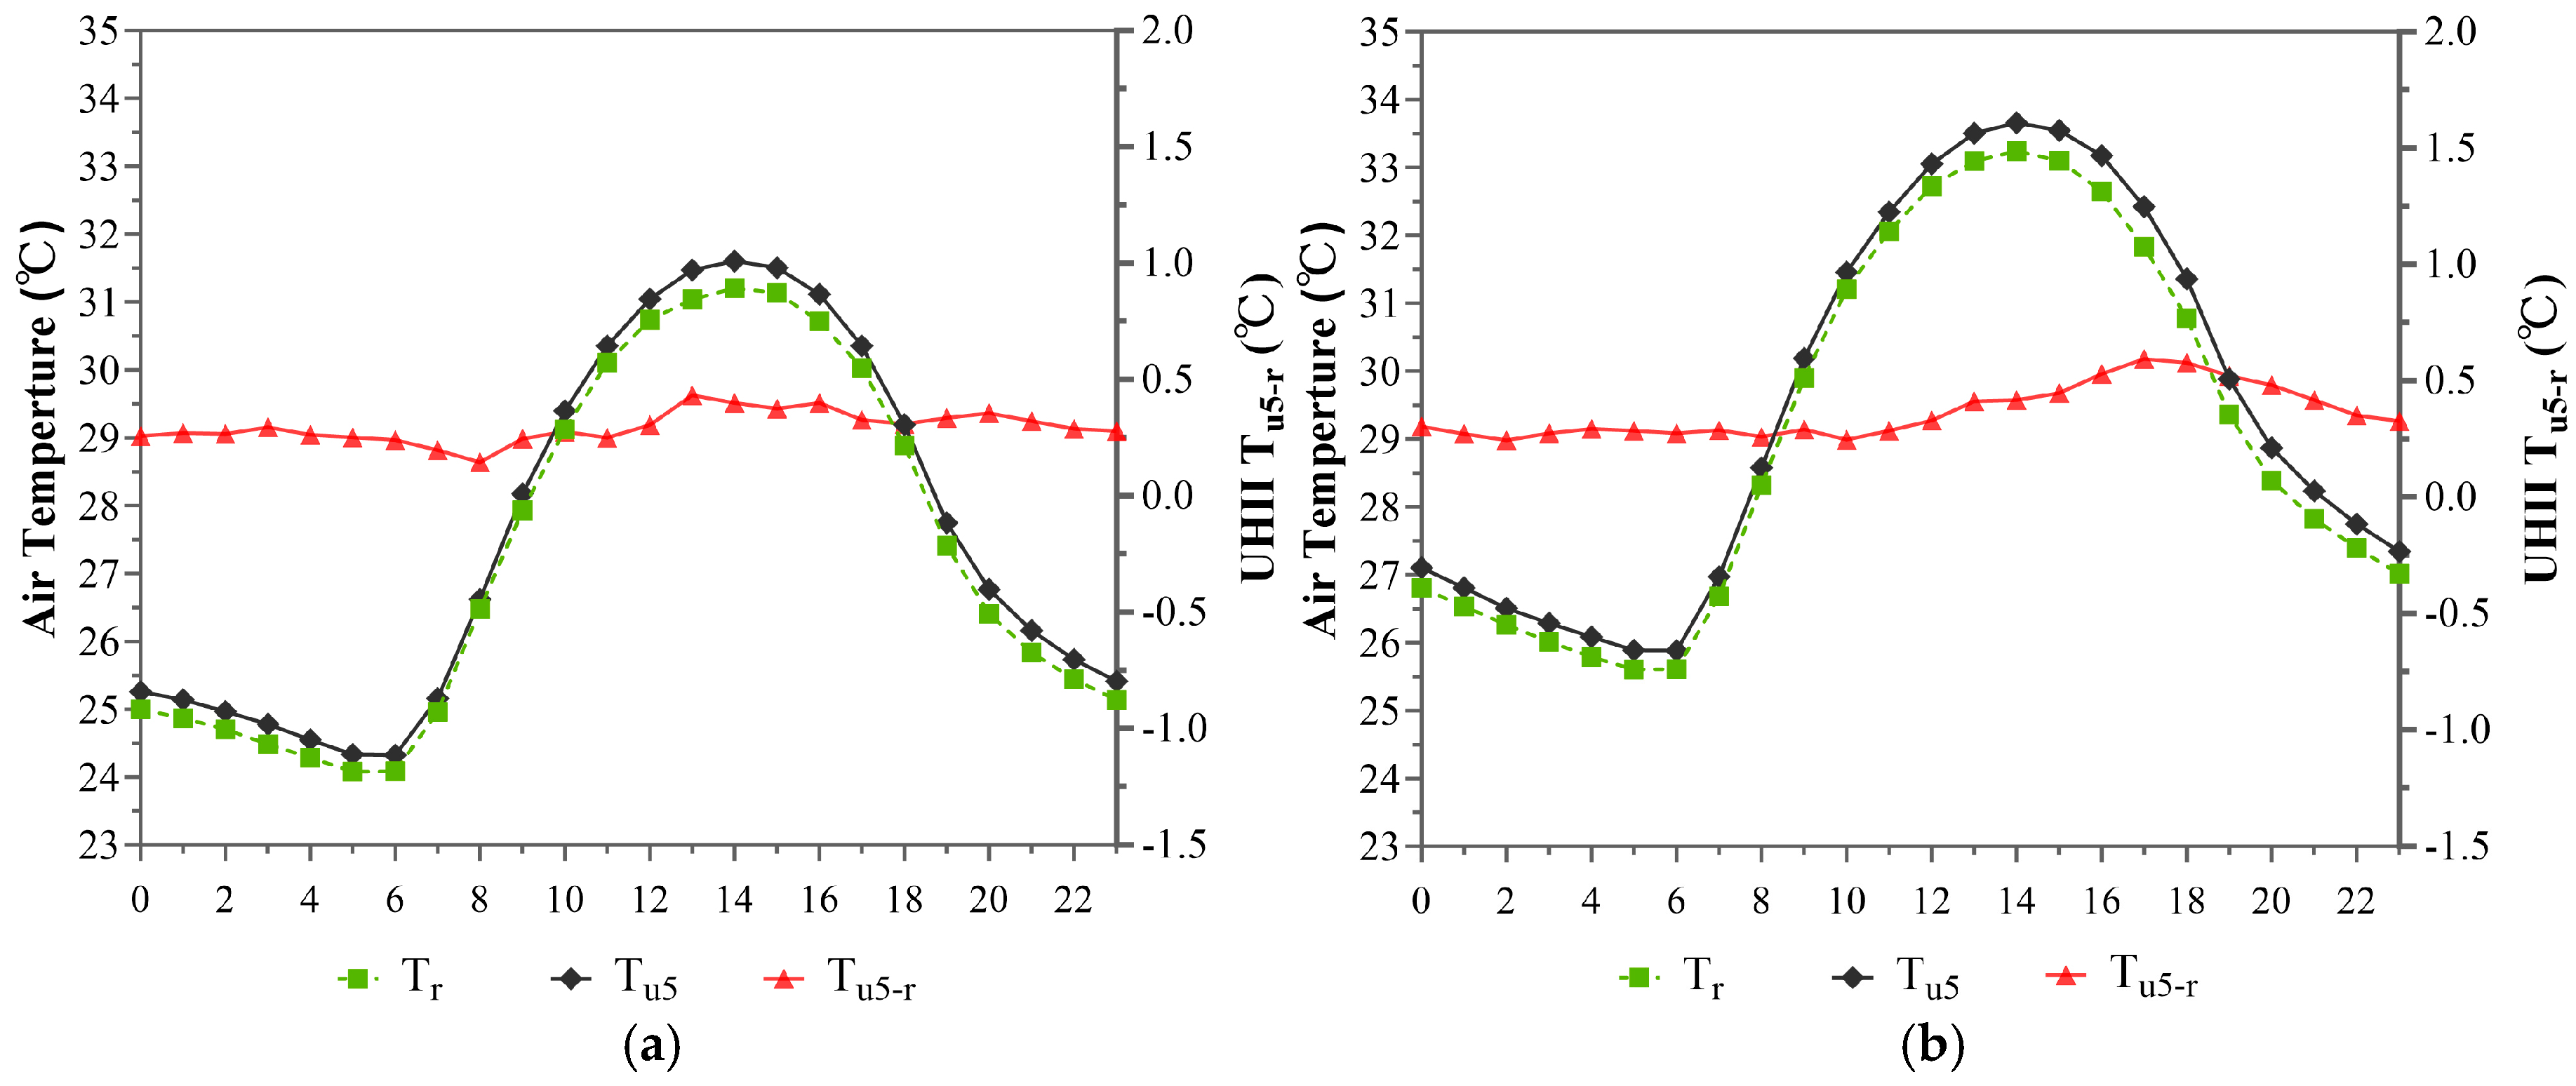
3.1.1. Temporal Distribution Characteristics of the UHI Effect Within the 1st Annular Zone (Within 5 km)

In the innermost annular zone (within 5 km), a total of 9 AWSs with an average built-up area percentage of 83.58% are located in typical urban center built-up areas with dense buildings and traffic and low vegetation coverage. Therefore, these 9 stations were used as representatives of the urban weather stations in the 5 km core zone. The arithmetic mean of the temperatures recorded by these 9 stations was used as the urban temperature Tu1 for this zone. According to Equation (1), the variation curves of the UHII ΔTu1−r for the typical hottest days of 2015 and 2016, were calculated and are shown in Figure 3.
Figure 3 shows that on the hottest days of 2015 and 2016, the Nanjing central urban area within a 5 km radius centered around XCZ experienced prolonged high-temperature periods from 11:00 to 17:00 and 09:00 to 19:00, respectively (Tu1 ≥ 30 °C). The highest temperatures, approximately 32 °C and 33 °C, were reached around 14:00 and 15:00, respectively. This phenomenon reflects the thermal environment characteristics of the city center, with high heat capacity, strong heat retention, and large heat storage. The lowest temperatures in the central urban area on both days were around 27 °C, occurring at 6:00. In contrast, the rural areas experienced slightly shorter high-temperature periods (Tr ≥ 30 °C), from 11:00 to 17:00 and 09:00 to 18:00 on the two days, with the highest temperatures around 31 °C and 33 °C. The lowest rural air temperatures, 24 °C and 25.5 °C, also occurred at 6:00. The temperature variation curves for both days show that from 0:00 to 6:00, temperatures in both urban and rural areas gradually decreased at similar rates, reaching their minimum at 6:00, followed by a rapid increase until 13:00~14:00, when they peaked. Subsequently, temperatures gradually decreased until 24:00. Notably, from 18:00 to 24:00, the urban temperature decline was slower than the rural temperature due to the night-time UHI effect.
Based on the 24 h temperature profiles for urban and rural areas, a comparative analysis of the 24 h profiles of UHII (ΔTu1−r) within the 5 km radius on the typical summer days shown in Figure 3 reveals that the UHI effect was generally noticeable on both days. However, the effect was slightly pronounced in the summer of 2015 (ΔTu1−r = 1.7 °C) than 2016 (ΔTu1−r = 1.6 °C). The 24 h curves of the UHI effect on both days exhibit a similar overall trend. From 0:00 to 6:00, the UHI effect within the 5 km radius of the urban area remained stable at a relatively high level. Starting at 6:00, the UHII value dropped sharply until 10:00, reaching a relatively low level. From 10:00 to 17:00, the UHII fluctuated near this lower value. Between 17:00 and 19:00, the UHII rose rapidly again. After 19:00, the rise in UHII slowed, peaking between 0:00 and 1:00 on the next day. Overall, the UHII was lower during the day, with average values of 0.35 °C (August 2015) and 0.25 °C (August 2016). The night-time UHI effect was stronger than during the day, with maximum intensities of 1.7 °C (August 2015) and 1.6 °C (August 2016). The average 24 h UHI intensities were 1.0 °C (August 2015) and 0.9 °C (August 2016).

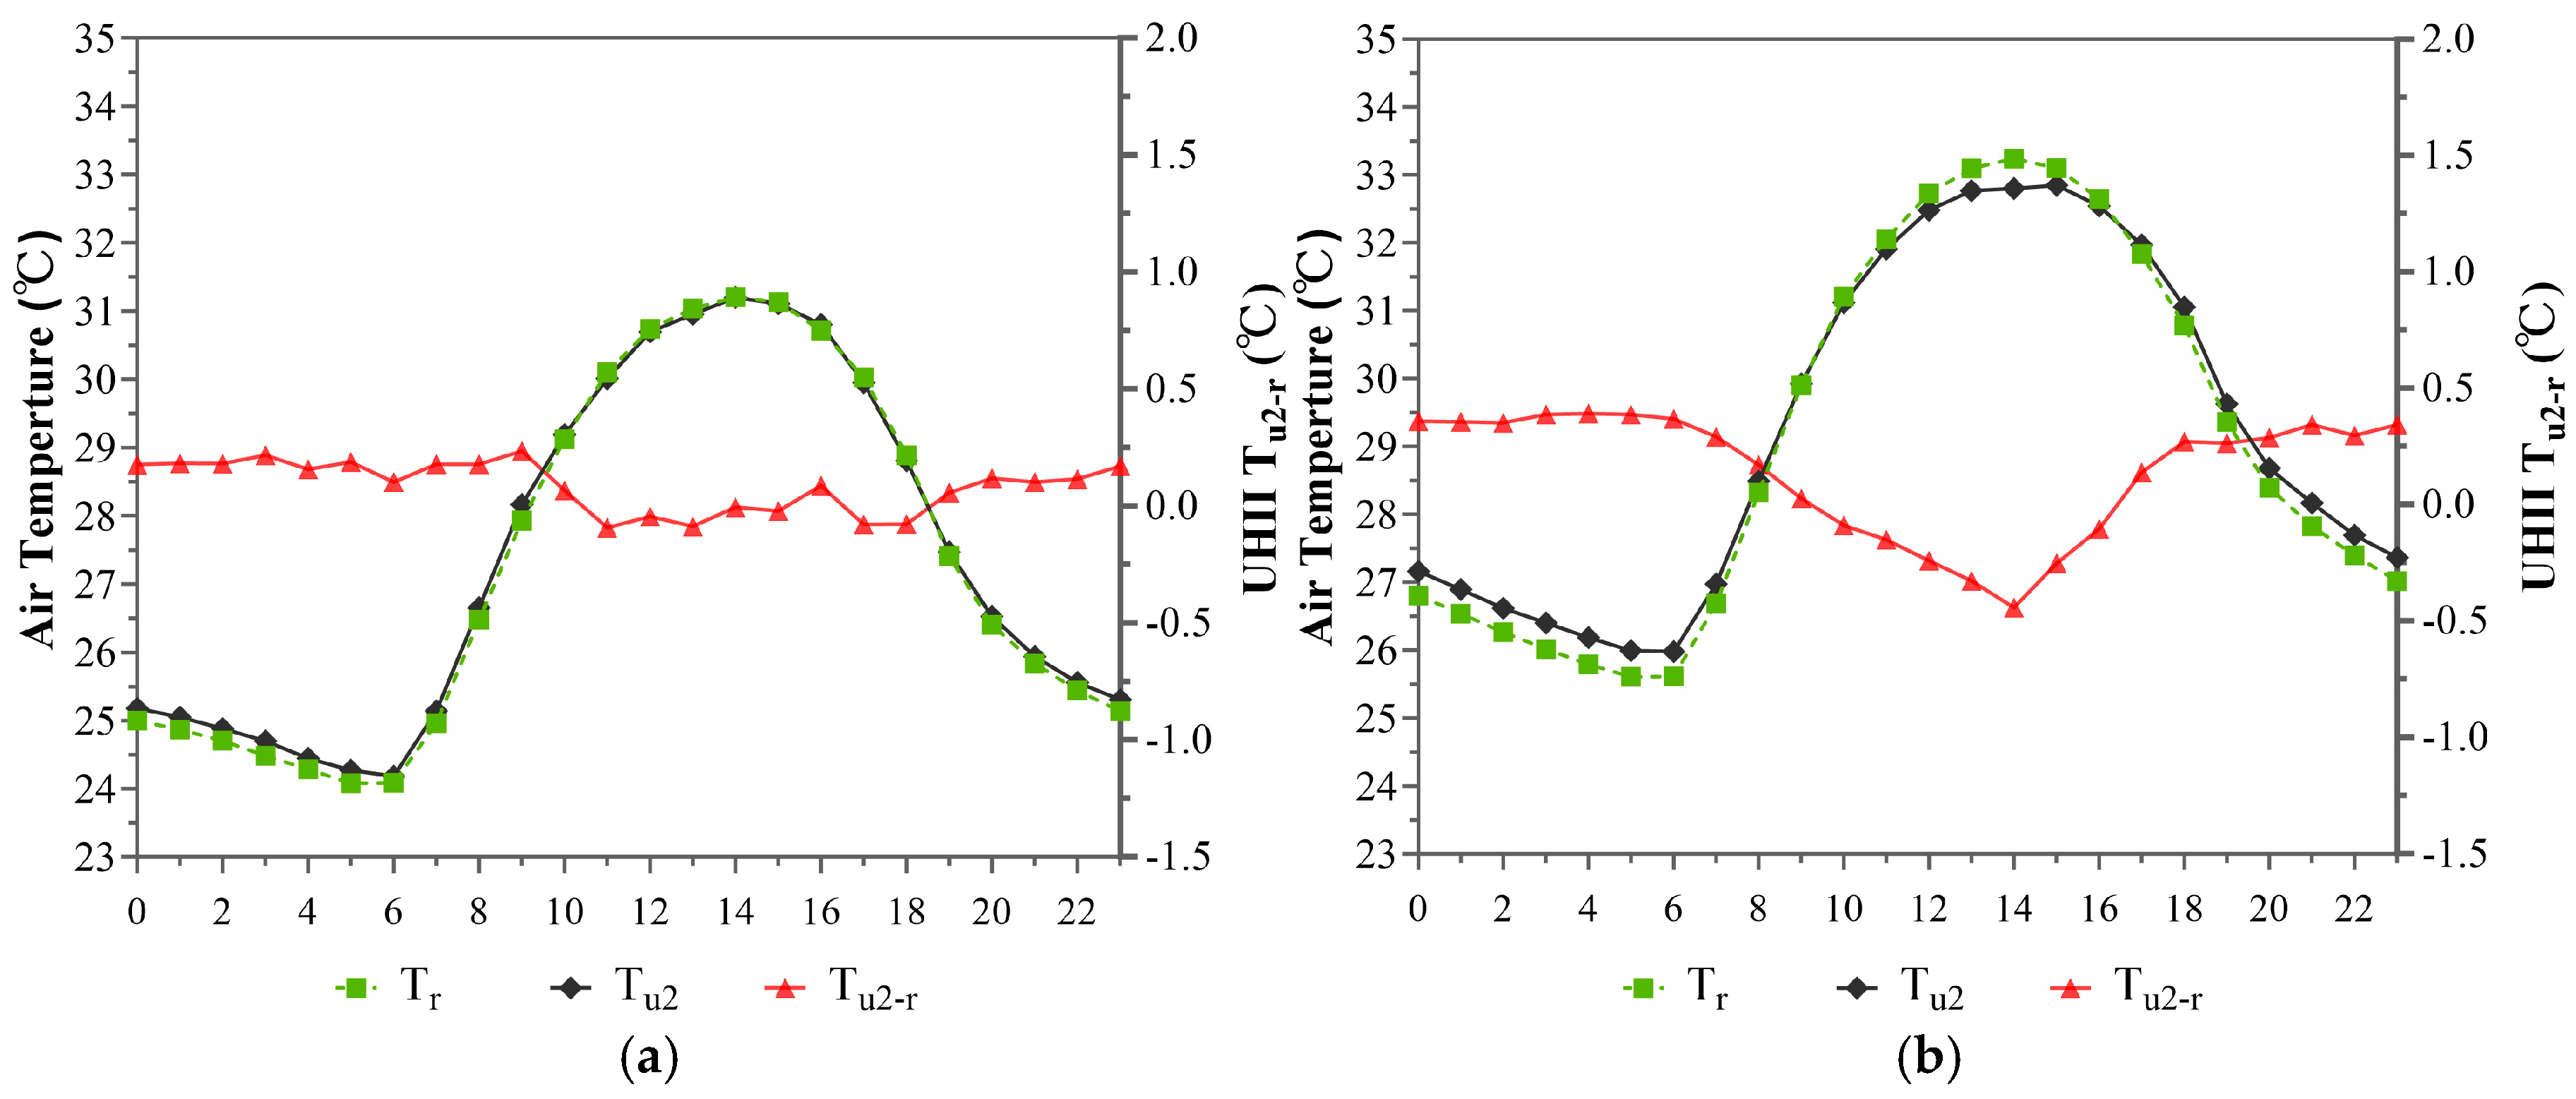
3.1.2. Temporal Distribution Characteristics of the UHI Effect Within the 2nd Annular Zone (5~10 km)

Within the 5~10 km radius of the second annular zone, some AWSs are primarily surrounded by medium-density residential areas with moderate vegetation coverage, while some are located in various urban open spaces. The average built-up area percentage (68.75%) in the surrounding areas of these stations is lower compared to the central zone. Therefore, these stations were selected as representatives of the urban meteorological stations in this annular zone. The arithmetic mean of the temperatures recorded at these stations was taken as the urban temperature Tu2 for this zone. According to Equation (1), the 24 h variation curve of the UHII ΔTu2−r was calculated, as shown in Figure 4.
Similarly, according to Figure 4, during the high-temperature period (Tu2 ≥ 30 °C) within the 5~10 km radius from the XCZ, the urban areas experienced high temperatures from 11:00 to 17:00 in August 2015, and from 09:00 to 18:00 in August 2016. The duration of high temperatures in this annular zone was slightly shorter than in the 5 km core zone, and the peak temperatures on both days were also lower, reaching approximately 31 °C in 2015 and 32.7 °C in 2016. This suggests that the urban heat capacity in this zone is smaller than in the core zone, likely due to a less urban environment and reduced anthropogenic heat. The lowest temperatures in this area also occurred at 6:00, with 24.2 °C in August 2015 and 25.9 °C in August 2016.
Furthermore, the 24 h temperature variation pattern in this zone is similar to that of the 5 km core zone. Between 00:00 and 6:00, temperatures decreased slowly, with a similar rate to that in rural areas, reaching their lowest at 6:00, then rising until 13:00~15:00 when they reached their highest, followed by a decline until 06:00 the next day. Unlike the core zone, only slight differences in the cooling rates between urban and rural air temperatures could be observed. This phenomenon may be attributed to the presence of numerous open spaces in this annular zone, such as urban parks and water bodies, which likely contribute to a cooling effect.
Comparative analysis of the 24 h variation curves of UHII in this zone reveals that the UHI effect was noticeably weaker than in the core zone. Additionally, the overall trend of UHII profiles varied between the two years. In August 2015, the UHII profile in this zone fluctuated smoothly, particularly from 00:00 to 9:00, with an average value of 0.35 °C. Then, from 9:00 to 19:00, the UHII showed more fluctuations and kept smooth status after 19:00. In contrast, the UHII in August 2016 exhibited little fluctuation from 0:00 to 6:00, remaining around 0.3 °C. It then began to decrease linearly, reaching a minimum of approximately −0.5 °C by 14:00. Afterward, it started to rise again until 18:00 and remained relatively stable at around 0.3 °C from 18:00 until 0:00 the following day. Additionally, comparing the characteristics of daytime and night-time UHI effects, the night-time UHI effect was still relatively more significant, with average intensities of 0.3 °C. No obvious UHI effect could be detected during the daytime, and in fact, a slight urban cool island effect was even observed in August 2016).

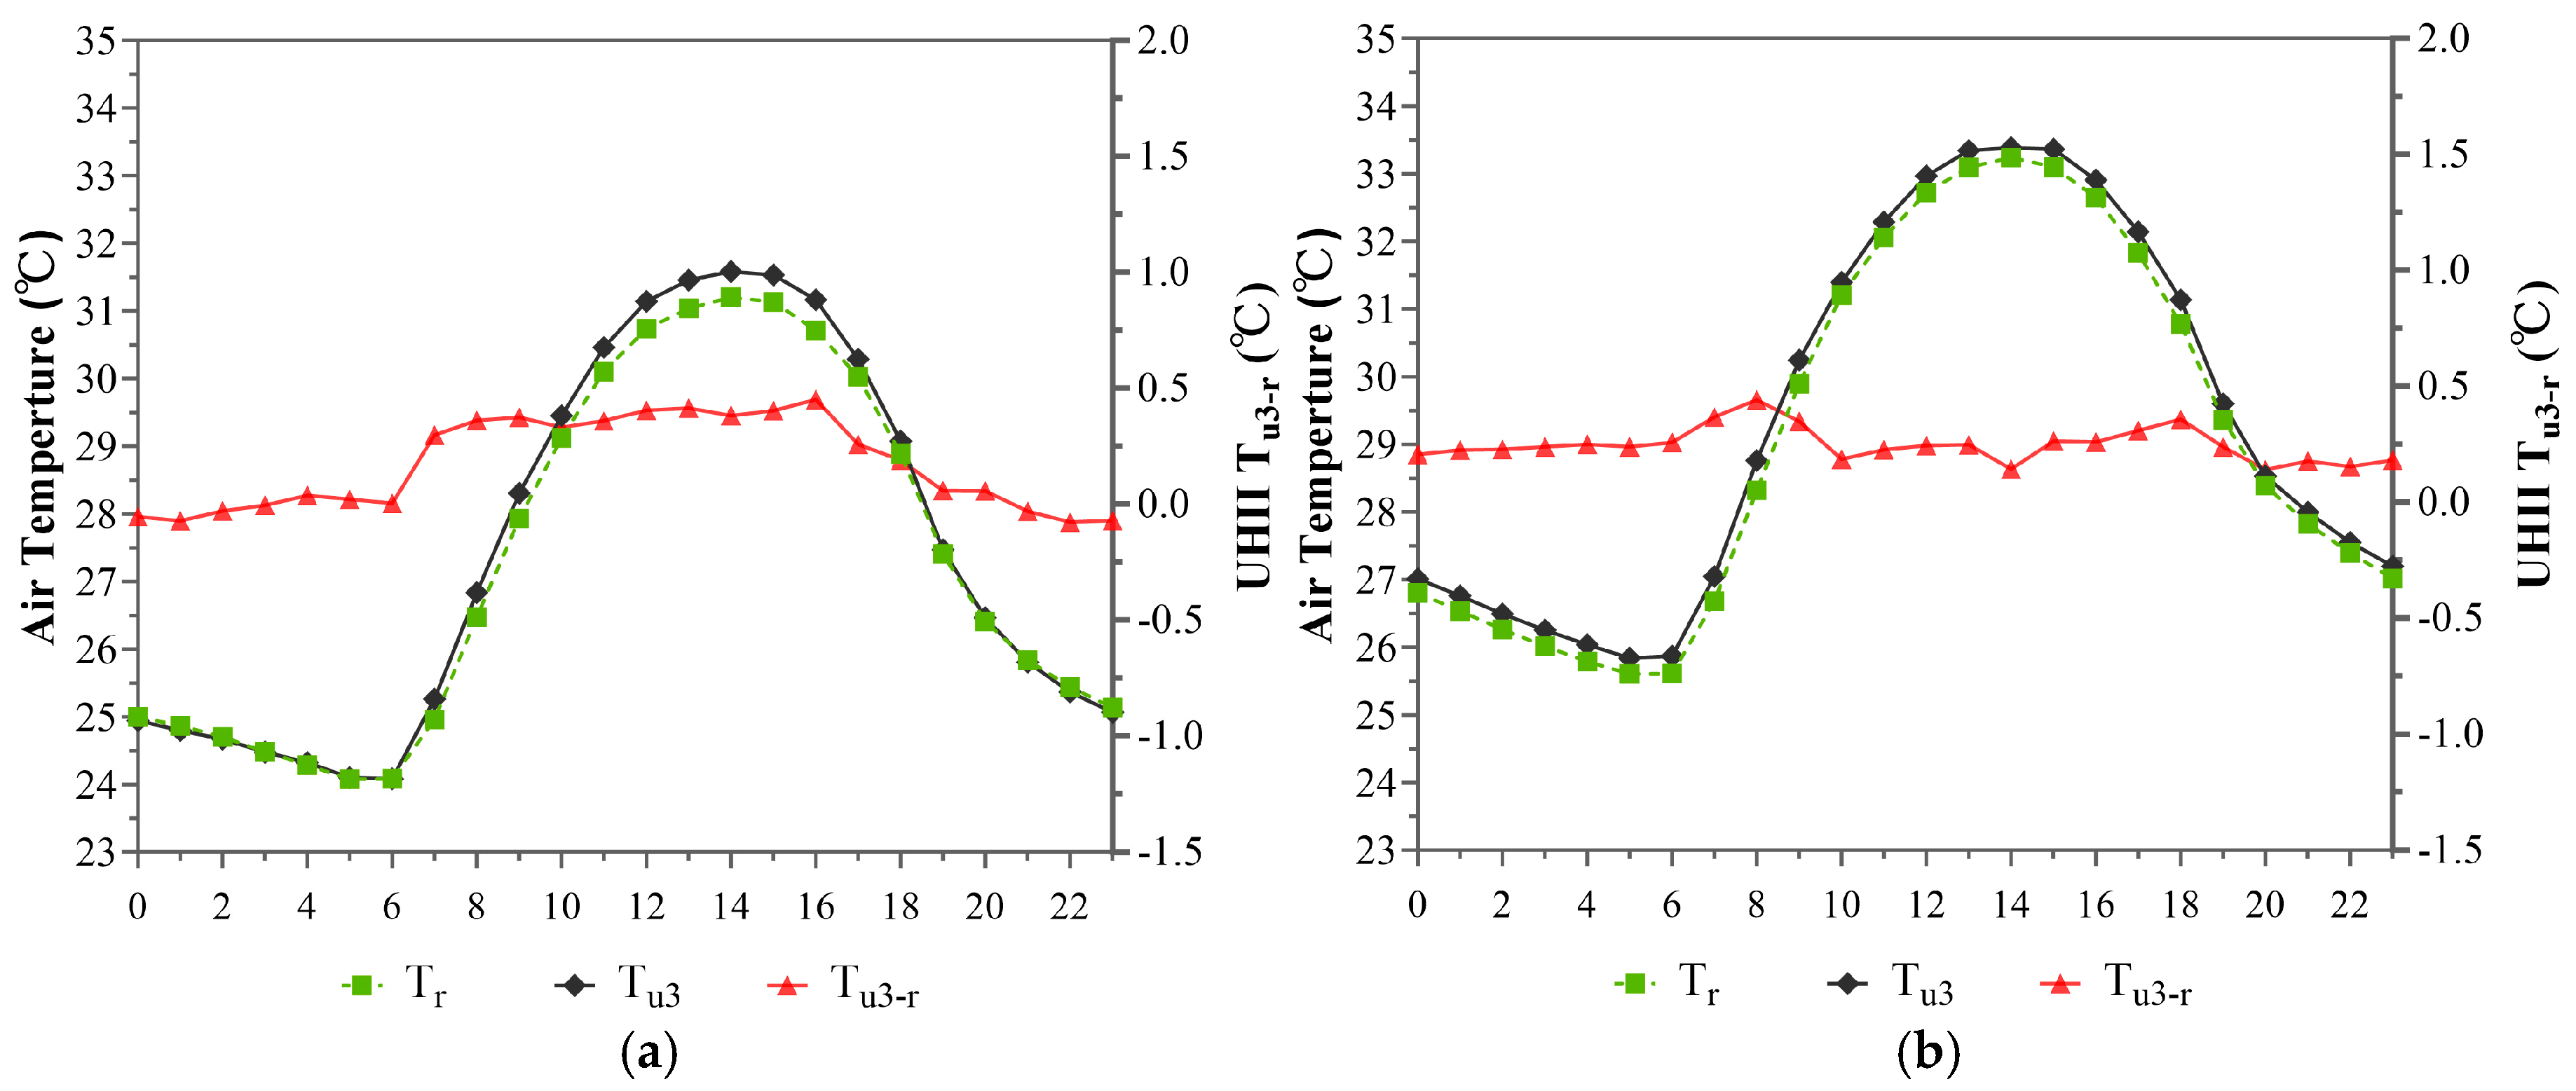
3.1.3. Temporal Distribution Characteristics of the UHI Effect Within the 3rd Annular Zone (10~15 km)

Within the third annular zone (10~15 km) range, the selected AWSs are mostly surrounded by areas with slightly higher average built-up area coverage (69.01%) than the second annular zone. The peripheral areas around some of the AWSs are largely industrial parks or educational institutes with even lower building densities, while some are residential complexes. Therefore, these stations were selected as representatives of urban weather stations for this zone, and the arithmetic mean of their recorded temperatures was taken as the urban temperature Tu3 for this zone. According to Equation (1), the 24 h variation curve of the UHII ΔTu3−r was calculated, as shown in Figure 5.
From Figure 5, it can be observed that the 24 h temperature variation curves for the urban area within the third annular zone (10–15 km) closely overlap with those of the rural area. This indicates that the temperature trends and values at different times were very similar between the urban areas in this zone and rural areas. This suggests that the urban areas in the third annular zone have a smaller heat capacity, weaker heat retention, and a more relaxed urban environment. Regarding the 24 h temperature distribution, the temperature change rates in both urban and rural areas were almost identical. Between 0:00 and 6:00, temperatures in both areas slowly decreased, reaching their minimum values around 5:00, at approximately 24 °C in August 2015 and 25.6 °C in August 2016. After that, the temperature rose rapidly, peaking around 31.5 °C and 33.5 °C at 14:00, and then gradually declined until 0:00 the next day.
Based on the 24 h temperature distribution of the urban area within this annular zone on the two different Augusts, it can be observed that the UHI effect in this zone was relatively weak. Unlike the previous two zones where the nocturnal UHI effect was more significant than the daytime effect, the UHI effect in this zone was more pronounced during daytime (06:00~18:00). Overall, the UHII variations were quite similar in the Augusts of both years, reaching a maximum of 0.45 °C. However, the nocturnal UHII in August 2016 (0.2 °C) was slightly higher than that in August 2015 (0 °C). The average UHII for the entire day was 0.26 °C on both Augusts. Therefore, it is evident that the UHI effect within the third annular zone was relatively weak.

3.1.4. Temporal Distribution Characteristics of the UHI Effect Within the 4th Annular Zone (15~21 km)

Within the 15–21 km range of the fourth annular zone, nearly one-third of the 16 AWSs are surrounded predominantly by natural green spaces with lower building density and high vegetation coverage, while the surrounding areas of the remaining AWS are densely populated with industrial factories. Overall, in the urban planning of Nanjing during the last century, this zone was situated on the outskirts of the main urban district. Therefore, the urban forms around these stations are representative of this annular zone, and the arithmetic mean of the temperatures recorded by these stations was taken as the urban temperature Tu4. According to Equation (1), the 24 h variation curve of the UHII ΔTu4−r was calculated, as shown in Figure 6.
According to Figure 6, the 24 h temperature curve for the urban area within this zone followed a general trend similar to that of the rural area, particularly overlapping with the rural 24 h temperature curve during daytime. However, unlike the higher degree of overlap observed in the third annular zone, there were differences between the urban temperature in this annular zone and rural temperature at night. This indicates that the urban environment within the fourth annular zone has a slightly higher heat capacity and heat retention ability compared to the third annular zone.
Regarding the variation in temperature over time, the temperatures in this zone slowly decreased from 0:00 to 6:00, reaching their lowest values around 6:00, approximately 24.5 °C in August 2015, and 26 °C in August 2016. Starting from 6:00, solar radiation increased, causing temperatures to rise rapidly until they reached a peak of around 31.5 °C and 33.3 °C at approximately 14:00. Subsequently, temperatures began to gradually decrease until around 0:00 the next day.
During the 24 h periods for both years, the urban and rural temperatures were nearly identical between 7:00 and 19:00, especially in August 2016. Outside these time frames, the temperatures in the urban area of this zone were consistently higher than those in the rural area.
According to the 24 h temperature difference curve between the urban areas in this zone and rural areas, the UHI effect in the fourth annular zone was stronger than that in the third annular zone but weaker than that in the second annular zone. This difference is likely related to the presence of dense industrial areas within this zone. Specifically, being in the near suburbs, the density of anthropogenic heat sources such as buildings and traffic was far less than in the first and second annular zones with high densities, resulting in weaker heat retention. The original temperature in this zone should be similar to that in the third annular zone or the rural areas. However, due to the presence of dense industrial areas, which include large expanses of hard surfaces and significant heat release from industrial activities, the UHI effect in this zone was more pronounced than in the rural areas with fewer industrial zones.
Additionally, there were differences in the overall trend of UHII on the two different days. In August 2015, the UHII was at its maximum of 0.5 °C around 0:00, gradually decreasing until it reached its minimum of 0.2 °C at 12:00, and exhibited minor fluctuations until 18:00, and then began to rise again. Conversely, in August 2016, the UHII remained relatively stable around 0.7 °C, except during the period from 8:00 to 16:00 when it was mostly 0 °C.

3.1.5. Temporal Distribution Characteristics of the UHI Effect Within the 5th Annular Zone (21~30 km)

The 5th annular zone is the closest to the rural areas, where the land is primarily used for agriculture, rural residential areas, and a small amount of industrial land. The average built-up area coverage of the 20 selected stations is only 27.49%, and the urban form is also quite representative within this zone. Thus, the urban temperature Tu5 was determined by calculating the arithmetic mean of the temperatures recorded by these stations. Using Equation (1), the 24 h variation curve of the UHII ΔTu5−r was then computed, as presented in Figure 7.
As shown in Figure 7, the 24 h temperature variation trends in urban and rural areas still show significant similarity. However, compared to the 4th annular zone, the temperature curves of urban and rural areas only overlap significantly between 6:00 and 11:00, while during the rest of the time, there is a certain difference in temperature between urban and rural areas, generally maintained at around 0.25 °C. this indicates that the heat retention capacity of the built environment in the 5th annular zone is smaller than that in the previous zones.
In terms of the temperature variation trend over time, this zone is largely consistent with previous zones, with the minimum and maximum temperatures being roughly the same as those in the 4th annular zone.
In addition, the UHII variation in the Augusts of the two years differs from that in the 4th annular zone. In August 2015, the UHII remained around 0.25 °C from 00:00 to 07:00, slightly increased between 08:00 and 17:00, peaking at 0.4 °C at 13:00, and then slightly decreased after 18:00, returning to 0.25 °C by 00:00. In contrast, in August 2016, the UHII remained steady at 0.25 °C from 00:00 to 10:00, then gradually increased to 0.6 °C by 17:00 in the afternoon, before slowly decreasing to 0.26 °C by 00:00.
Overall, the night-time UHII in the 4th annular zone is significantly higher than during the day, especially in 2016, while the daytime UHII in the 5th annular zone is slightly higher than at night, with the peak UHII at 0.6 °C occurring at 17:00 in August 2016. This is likely due to the fact that the built-up areas in this zone are primarily low-rise rural residential areas. During the day, they warm up quickly under solar radiation, but the low-rise buildings allow heat to dissipate more quickly. Additionally, the large surrounding areas of open agricultural and forestry land contribute to cooling, having a positive effect on reducing temperatures.

3.2. Spatial Distribution Characteristics of UHII

As previously mentioned, the urban spatial form, LULC, and natural geographical conditions within different locations in a city are not necessarily the same. Therefore, the specific urban environments surrounding various weather stations within the same annular zone may vary significantly, leading to considerable differences in the recorded temperatures. This study estimates and analyzes the urban spatial characteristics around the locations of the 82 selected AWSs, as shown in Table 2.
Corresponding to the daily temporal variations in the UHII, the average temperatures recorded by each AWS on the above-mentioned two typical summer days were calculated to analyze the spatial distribution of the UHI effect in Nanjing during the summer. Based on the above analysis, it is necessary to separately analyze the spatial distribution of UHI for daytime and night-time due to their distinct distribution characteristics. Therefore, the average temperatures recorded by each AWS during the periods with significant UHI effects in daytime and night-time were calculated as the representative temperatures of daytime and night-time, respectively. Specifically, the average temperature from 11:00 to 16:00 was used as the representative daytime temperature, and the average temperature from 22:00 to 2:00 was used as the representative night-time temperature [40]. The representative daytime and night-time temperatures recorded by AWSs in each annular zone were then compared and analyzed for their correlation with land use types and surrounding urban spatial characteristics.

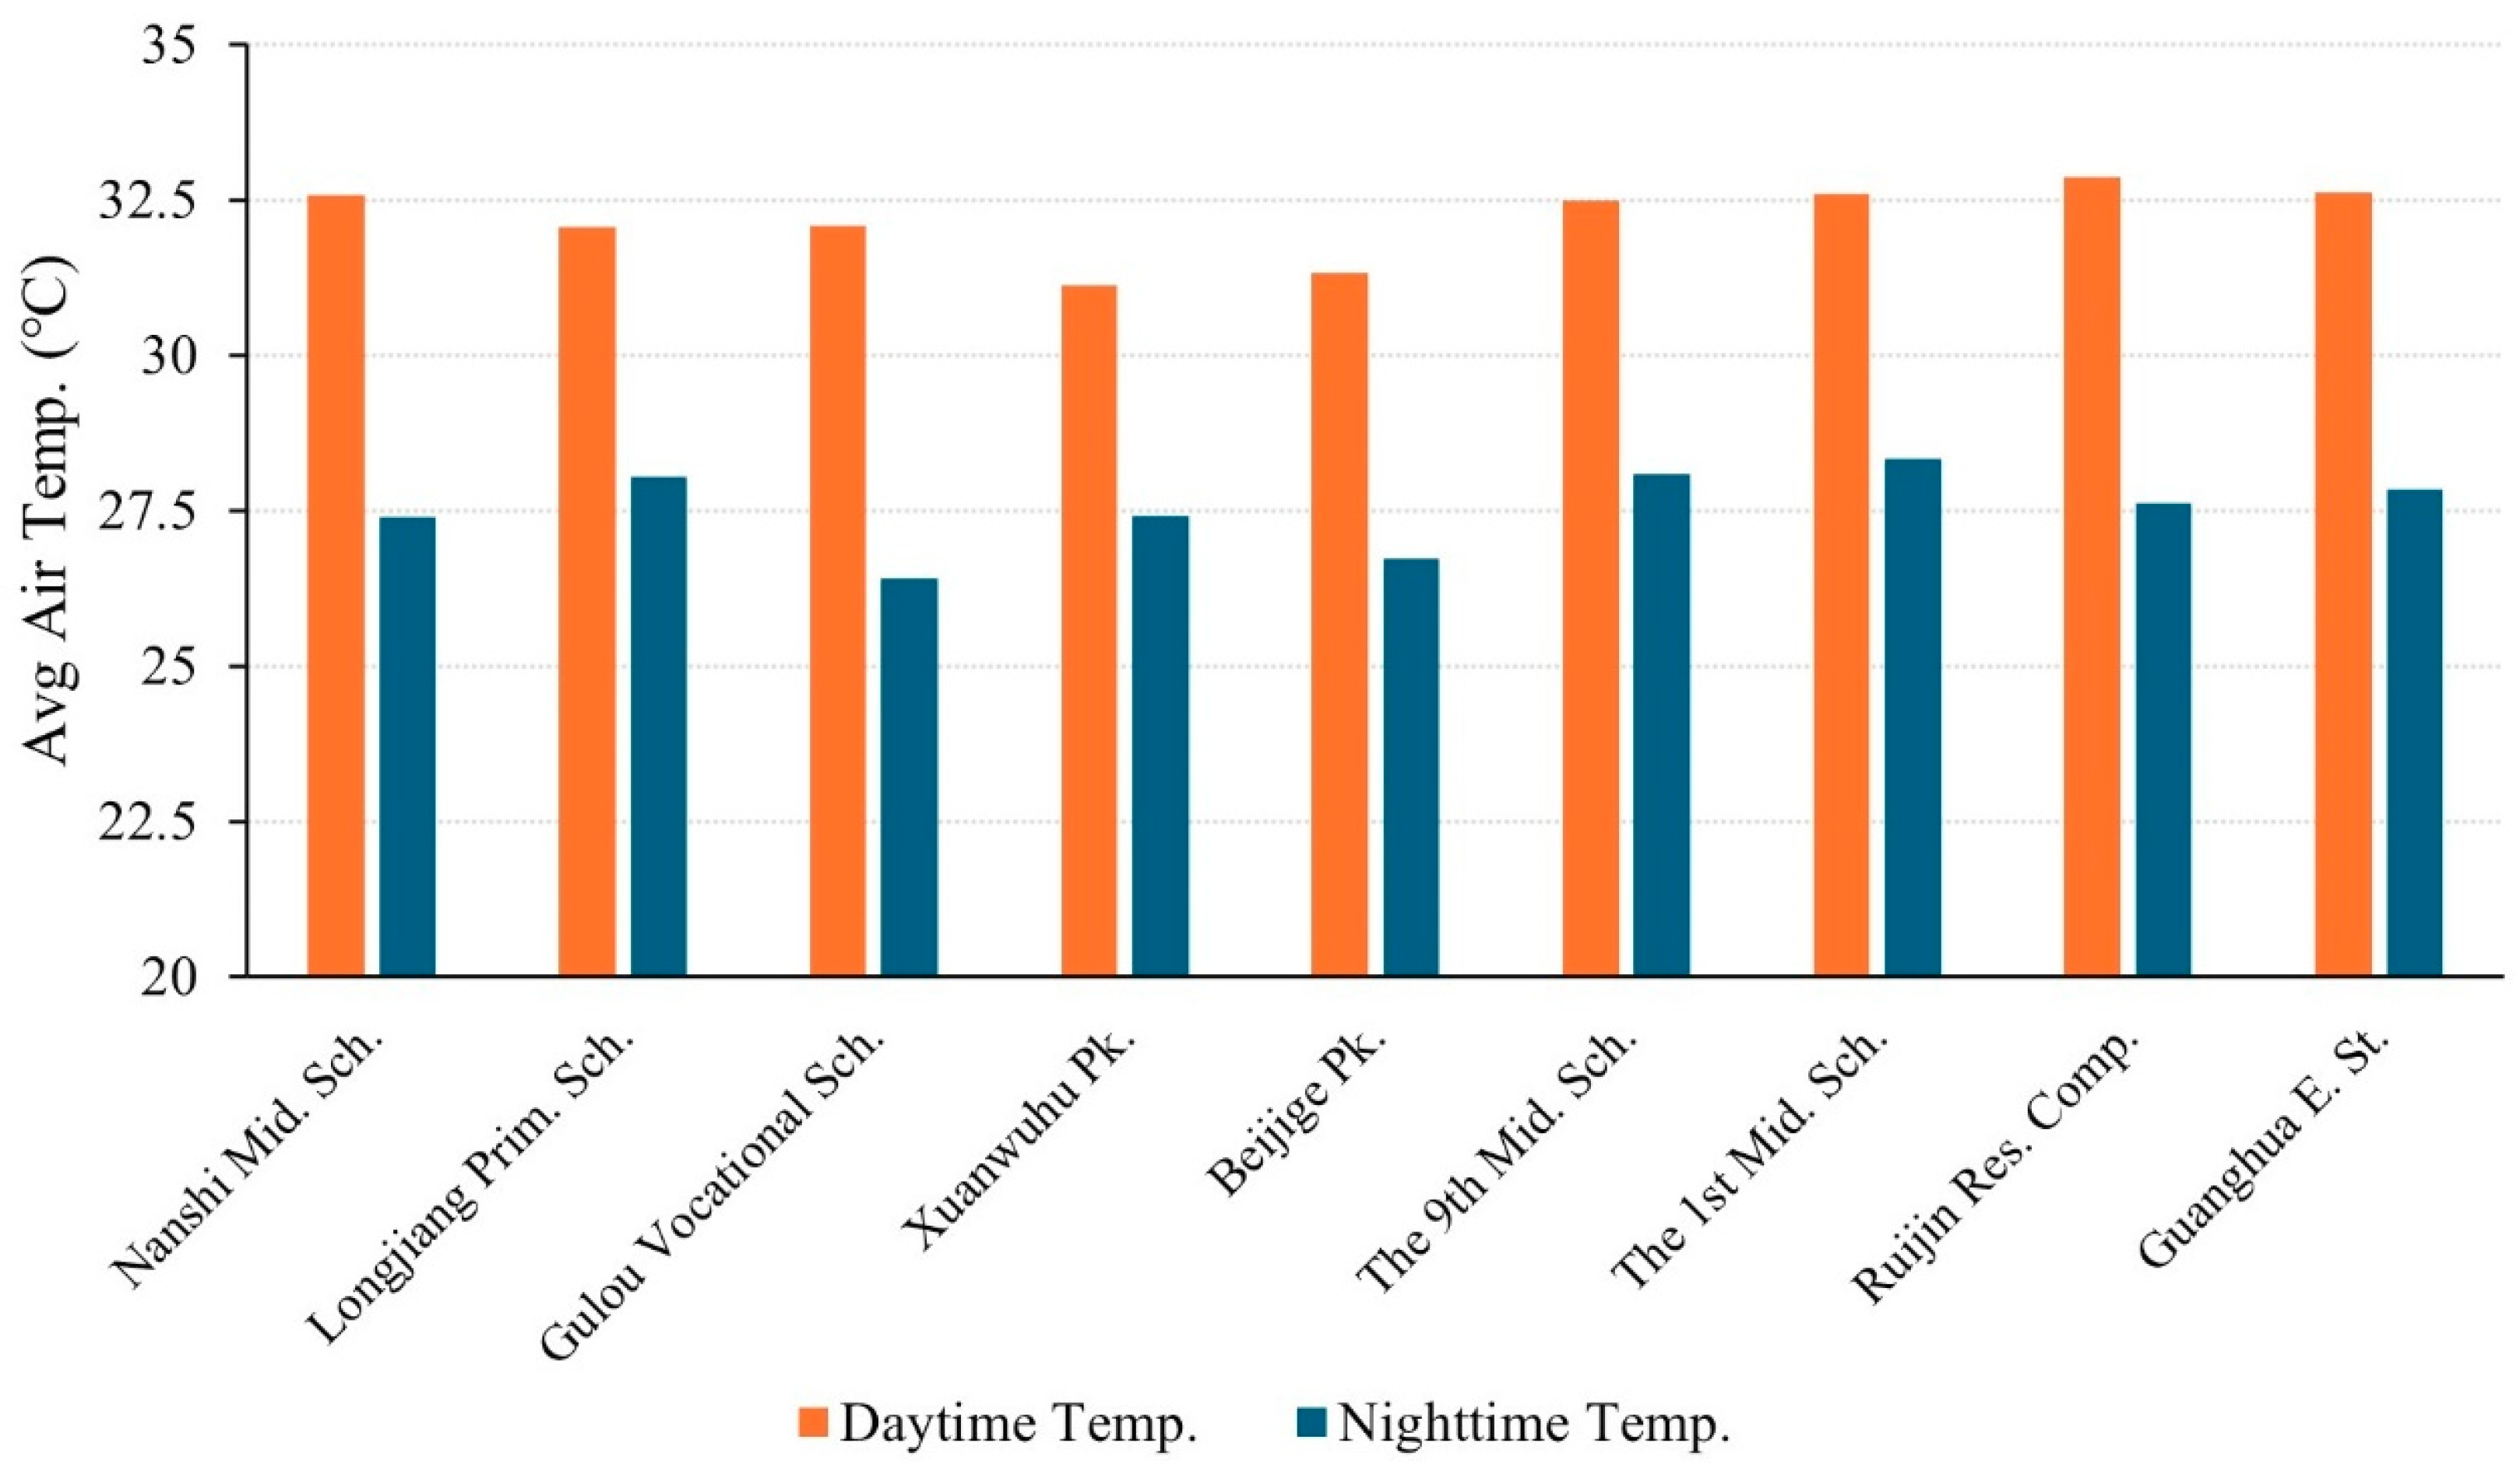
3.2.1. Spatial Distribution Characteristics of the UHI Effect Within the 1st Annular Zone (Within 5 km)

The distribution of representative daytime and night-time temperatures for AWSs in the core zone is shown in Figure 8. By comparing the representative average temperatures at each AWS, significant temperature differences between different stations can be observed. Higher daytime temperatures were found near the stations of the 9th Middle School, the 1st Middle School, Ruijin Residential Complex, and Guanghua East Street, averaging 32.7 °C. The high temperatures are probably due to the low vegetation coverage in these locations, coupled with the lack of high-rise buildings to block direct sunlight. Conversely, the daytime temperatures were relatively lower near the stations of Beijige Park and Xuanwuhu Park, averaging about 31.2 °C, approximately 1.5 °C lower than the higher temperatures. Xuanwuhu Park station held the lowest daytime average temperature, around 31 °C. Although the Nanshi Middle School has high vegetation coverage, it is situated in an old urban area with dense building layouts, resulting in higher daytime temperatures. On the other hand, the lower temperatures near the stations of Beijige Park and Xuanwuhu Park are mainly due to the high vegetation coverage in these parkland areas, which provides significant cooling effects. The stations at Longjiang Primary School and Gulou Vocational School have lower vegetation coverage than the two parks, but the existing lush vegetation provides notable cooling through transpiration, resulting in relatively lower temperatures.
During the night, the stations of Nanshi Middle School, 9th Middle School, the 1st Middle School, Ruijin Residential Complex, and Guanghua East Street continued to maintain relatively higher temperatures, averaging 27.6 °C. This is primarily due to these locations in the city center absorbing and storing a large amount of heat from solar radiation during the day, which is then released at night through longwave radiation. However, the high density of buildings and lack of vegetation around these stations, combined with the trapping effect of street canyons, buildings, and atmospheric pollutants, significantly obstruct the release of longwave radiation from the ground, resulting in the highest night-time temperatures at these stations.
Moreover, although the daytime temperatures at the station of Longjiang Primary School were lower, their night-time temperatures remained relatively high (27.5 °C) due to the heat retention in the urban center surrounding these stations. The Xuanwuhu Park station, influenced by the large thermal capacity of the lake, experienced slow heat absorption and release, leading to relatively stable temperatures with lower daytime and higher night-time temperatures.

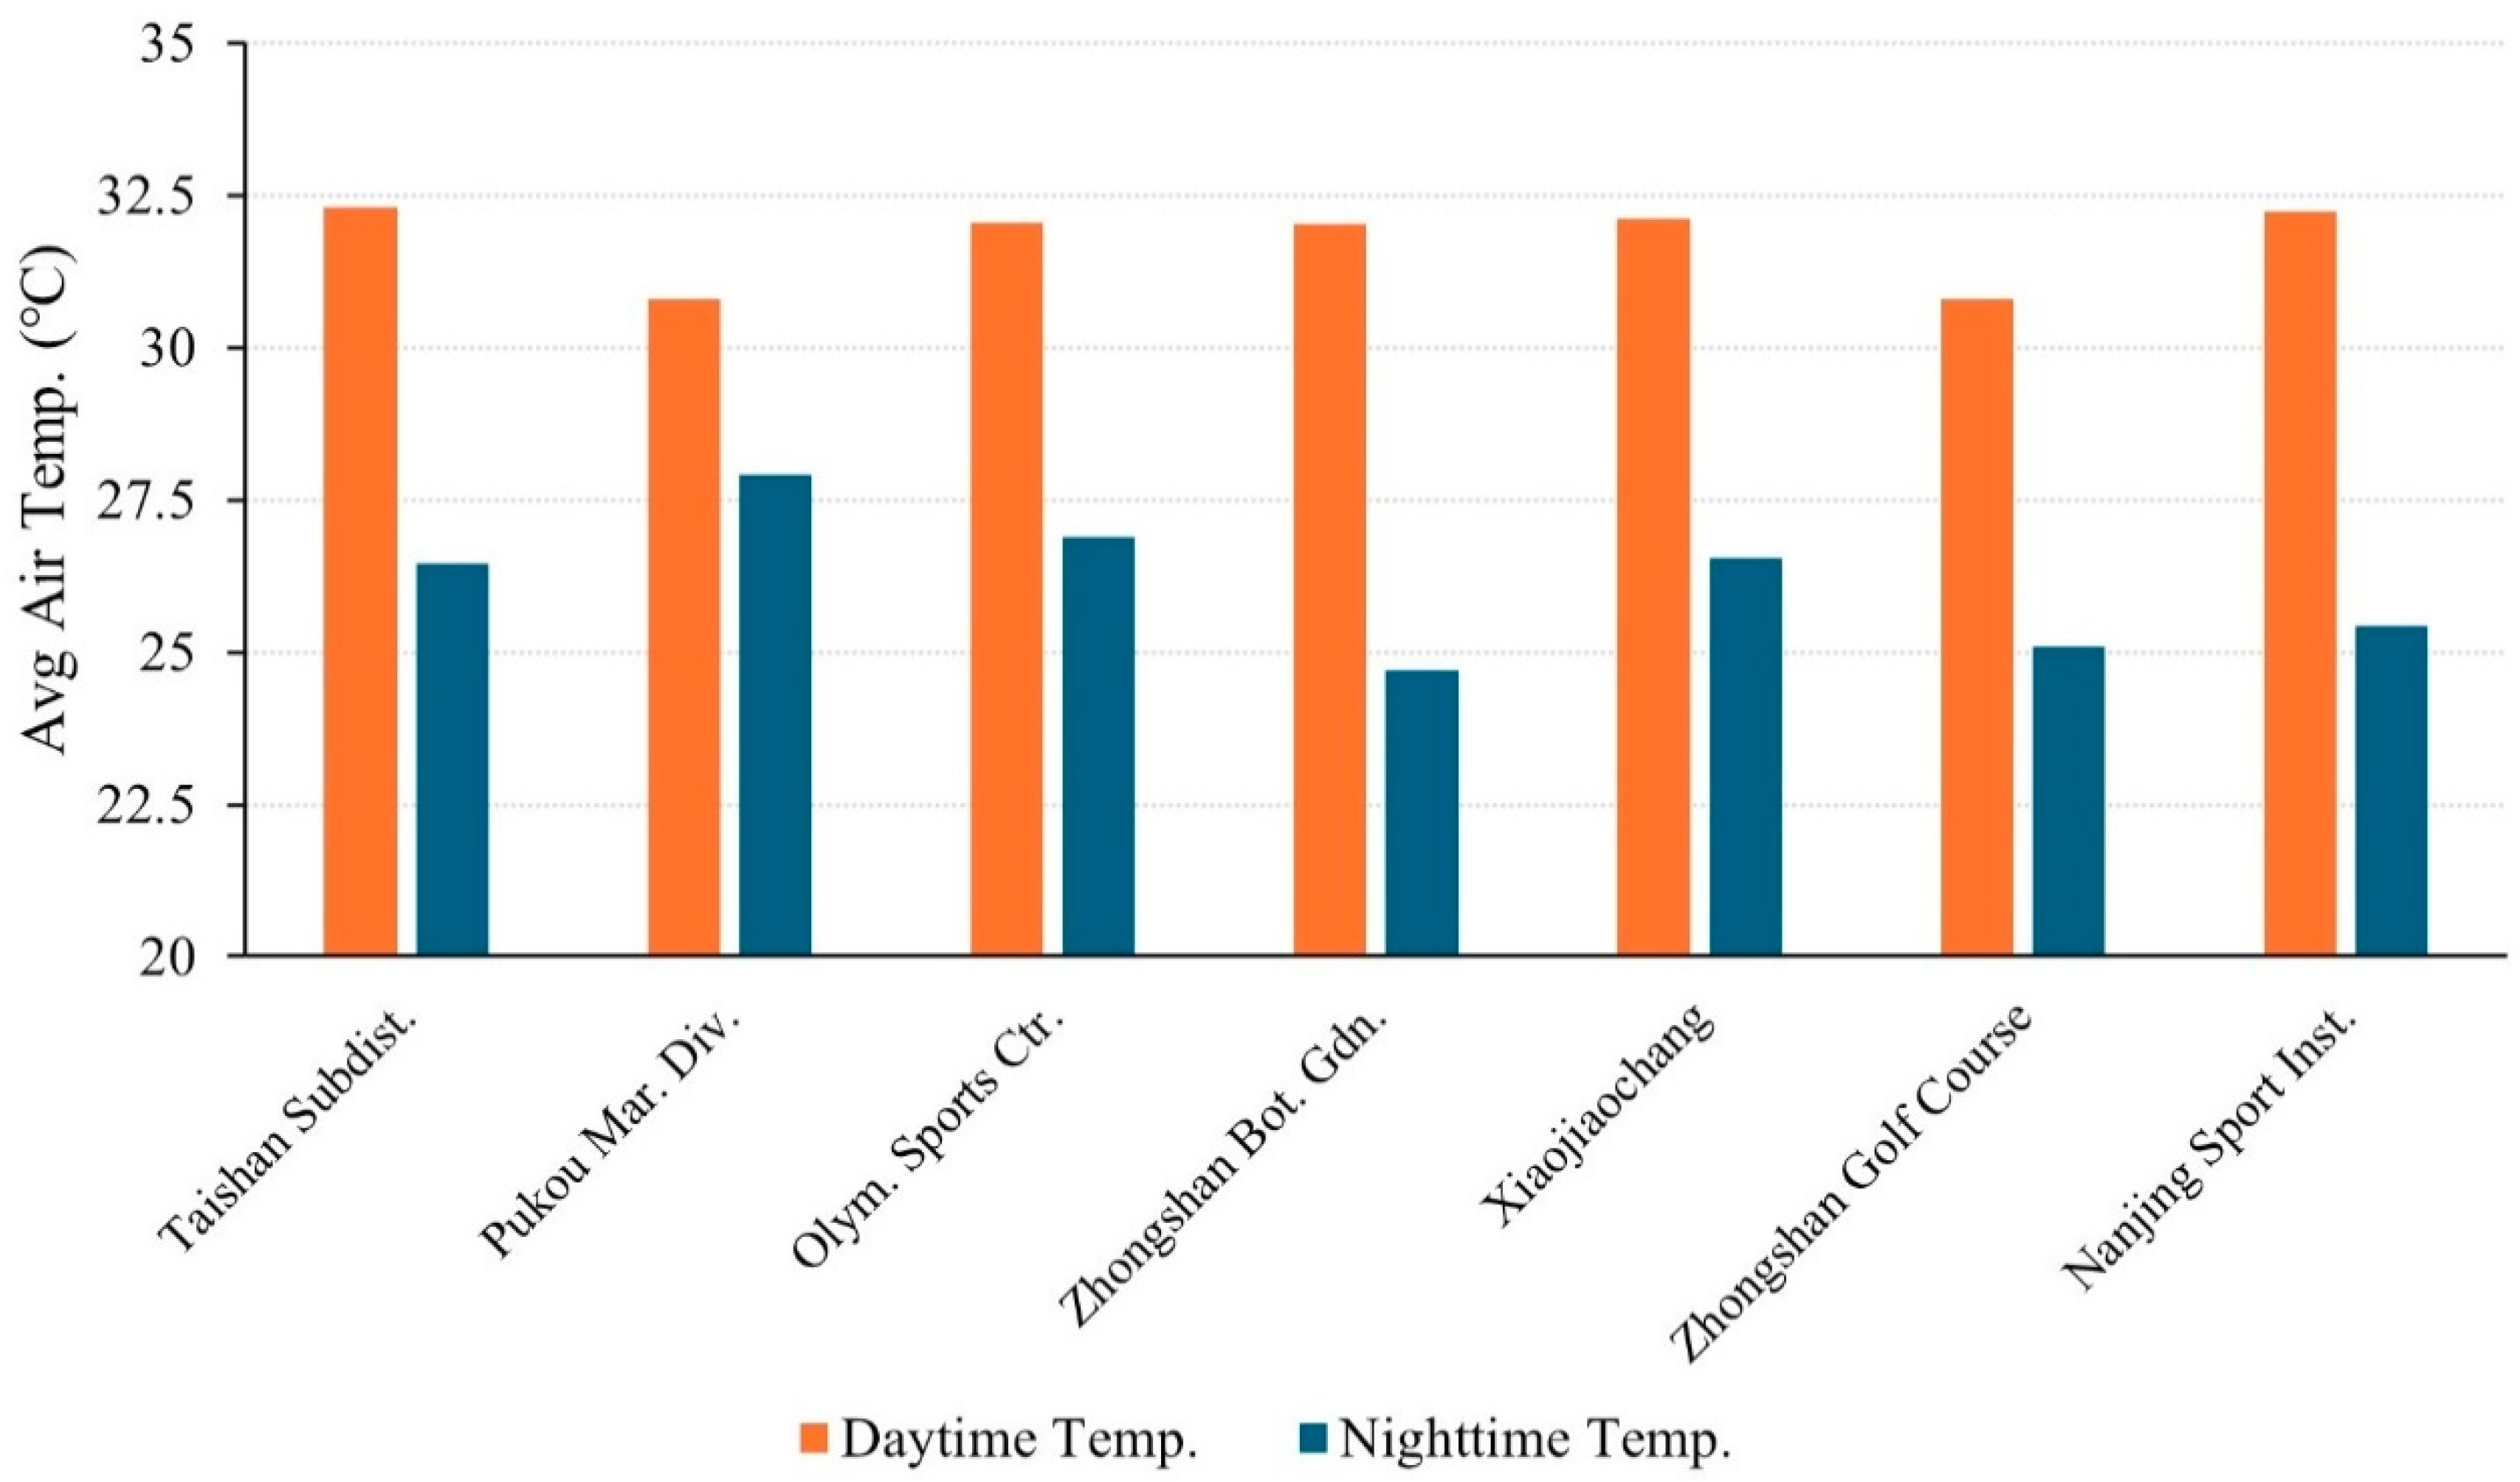
3.2.2. Spatial Distribution Characteristics of the UHI Effect Within the 2nd Annular Zone (5~10 km)

The distribution of the daytime and night-time representative temperatures at each AWS in the second annular zone is shown in Figure 9. It is obvious that the differences in daytime and night-time average temperatures among the stations in the second annular zone were also significant. Among them, stations such as Taishan Subdistrict, Olympic Sports Center, Zhongshan Botanic Garden, Xiaojiaochang, and Nanjing Sports Institute showed higher daytime temperatures, averaging about 32.5 °C. In contrast, the daytime temperatures of the stations at Pukou Maritime Division and Zhongshan Golf Course were about 2 °C lower, averaging about 30.6 °C. The high temperatures observed near Zhongshan Botanic Garden and Nanjing Sports Institute are primarily due to the low building density in these areas, which results in a high sky view factor and consequently a significant absorption of solar radiation during the day, leading to high temperatures at noon. The stations of Taishan Subdistrict, Xiaojiaochang and Olympic Sports Center, located in urban sub-central zones with dense populations and high building density, are characterized by low-rise buildings that provide limited shading from the midday sun and low vegetation coverage, resulting in high noon temperatures as well. The low temperatures near the Zhongshan Golf Course station can be attributed to its location on the foothills of Zijin Mountain, with lush vegetation, where shading from vegetation and cooling effects from air convection were significant. The Pukou Maritime Division station, situated near the Yangtze River, was influenced by the large water body, leading to lower daytime temperatures.
The night-time situation differed from the daytime. Stations such as Taishan Subdistrict, Xiaojiaochang, Olympic Sports Center, and Pukou Maritime maintained higher night-time representative temperatures, with an average night-time temperature of 26.3 °C. The first three stations are located in urban sub-central zones with dense buildings and heavy traffic. These areas absorb and accumulate a significant amount of solar radiant heat during the day and have substantial anthropogenic heat emissions. During the night, the street canyon effect, buildings, and atmospheric pollutants significantly hinder heat dissipation, forming a strong nocturnal heat island, and resulting in higher night-time temperatures around these stations. Pukou Maritime Division, located near the Yangtze River, are influenced by the slower heat absorption and release of the water body, leading to relatively higher night-time temperatures.
Conversely, lower night-time temperatures were observed at stations near the stations of Zhongshan Botanic Garden, Zhongshan Golf Course, and Nanjing Sport Institute, averaging around 25 °C. The lower temperatures at Zhongshan Botanic Garden were due to both the minimal solar radiation absorbed during the day and the influence of Zijin Mountain’s natural environment. The stations of Nanjing Sport Institute and Zhongshan Golf Course, located at the foothills of Zijin Mountain, are also influenced by its natural environment. Additionally, these areas have high sky view factors, which facilitate rapid heat dissipation at night, resulting in lower night-time temperatures around these stations.

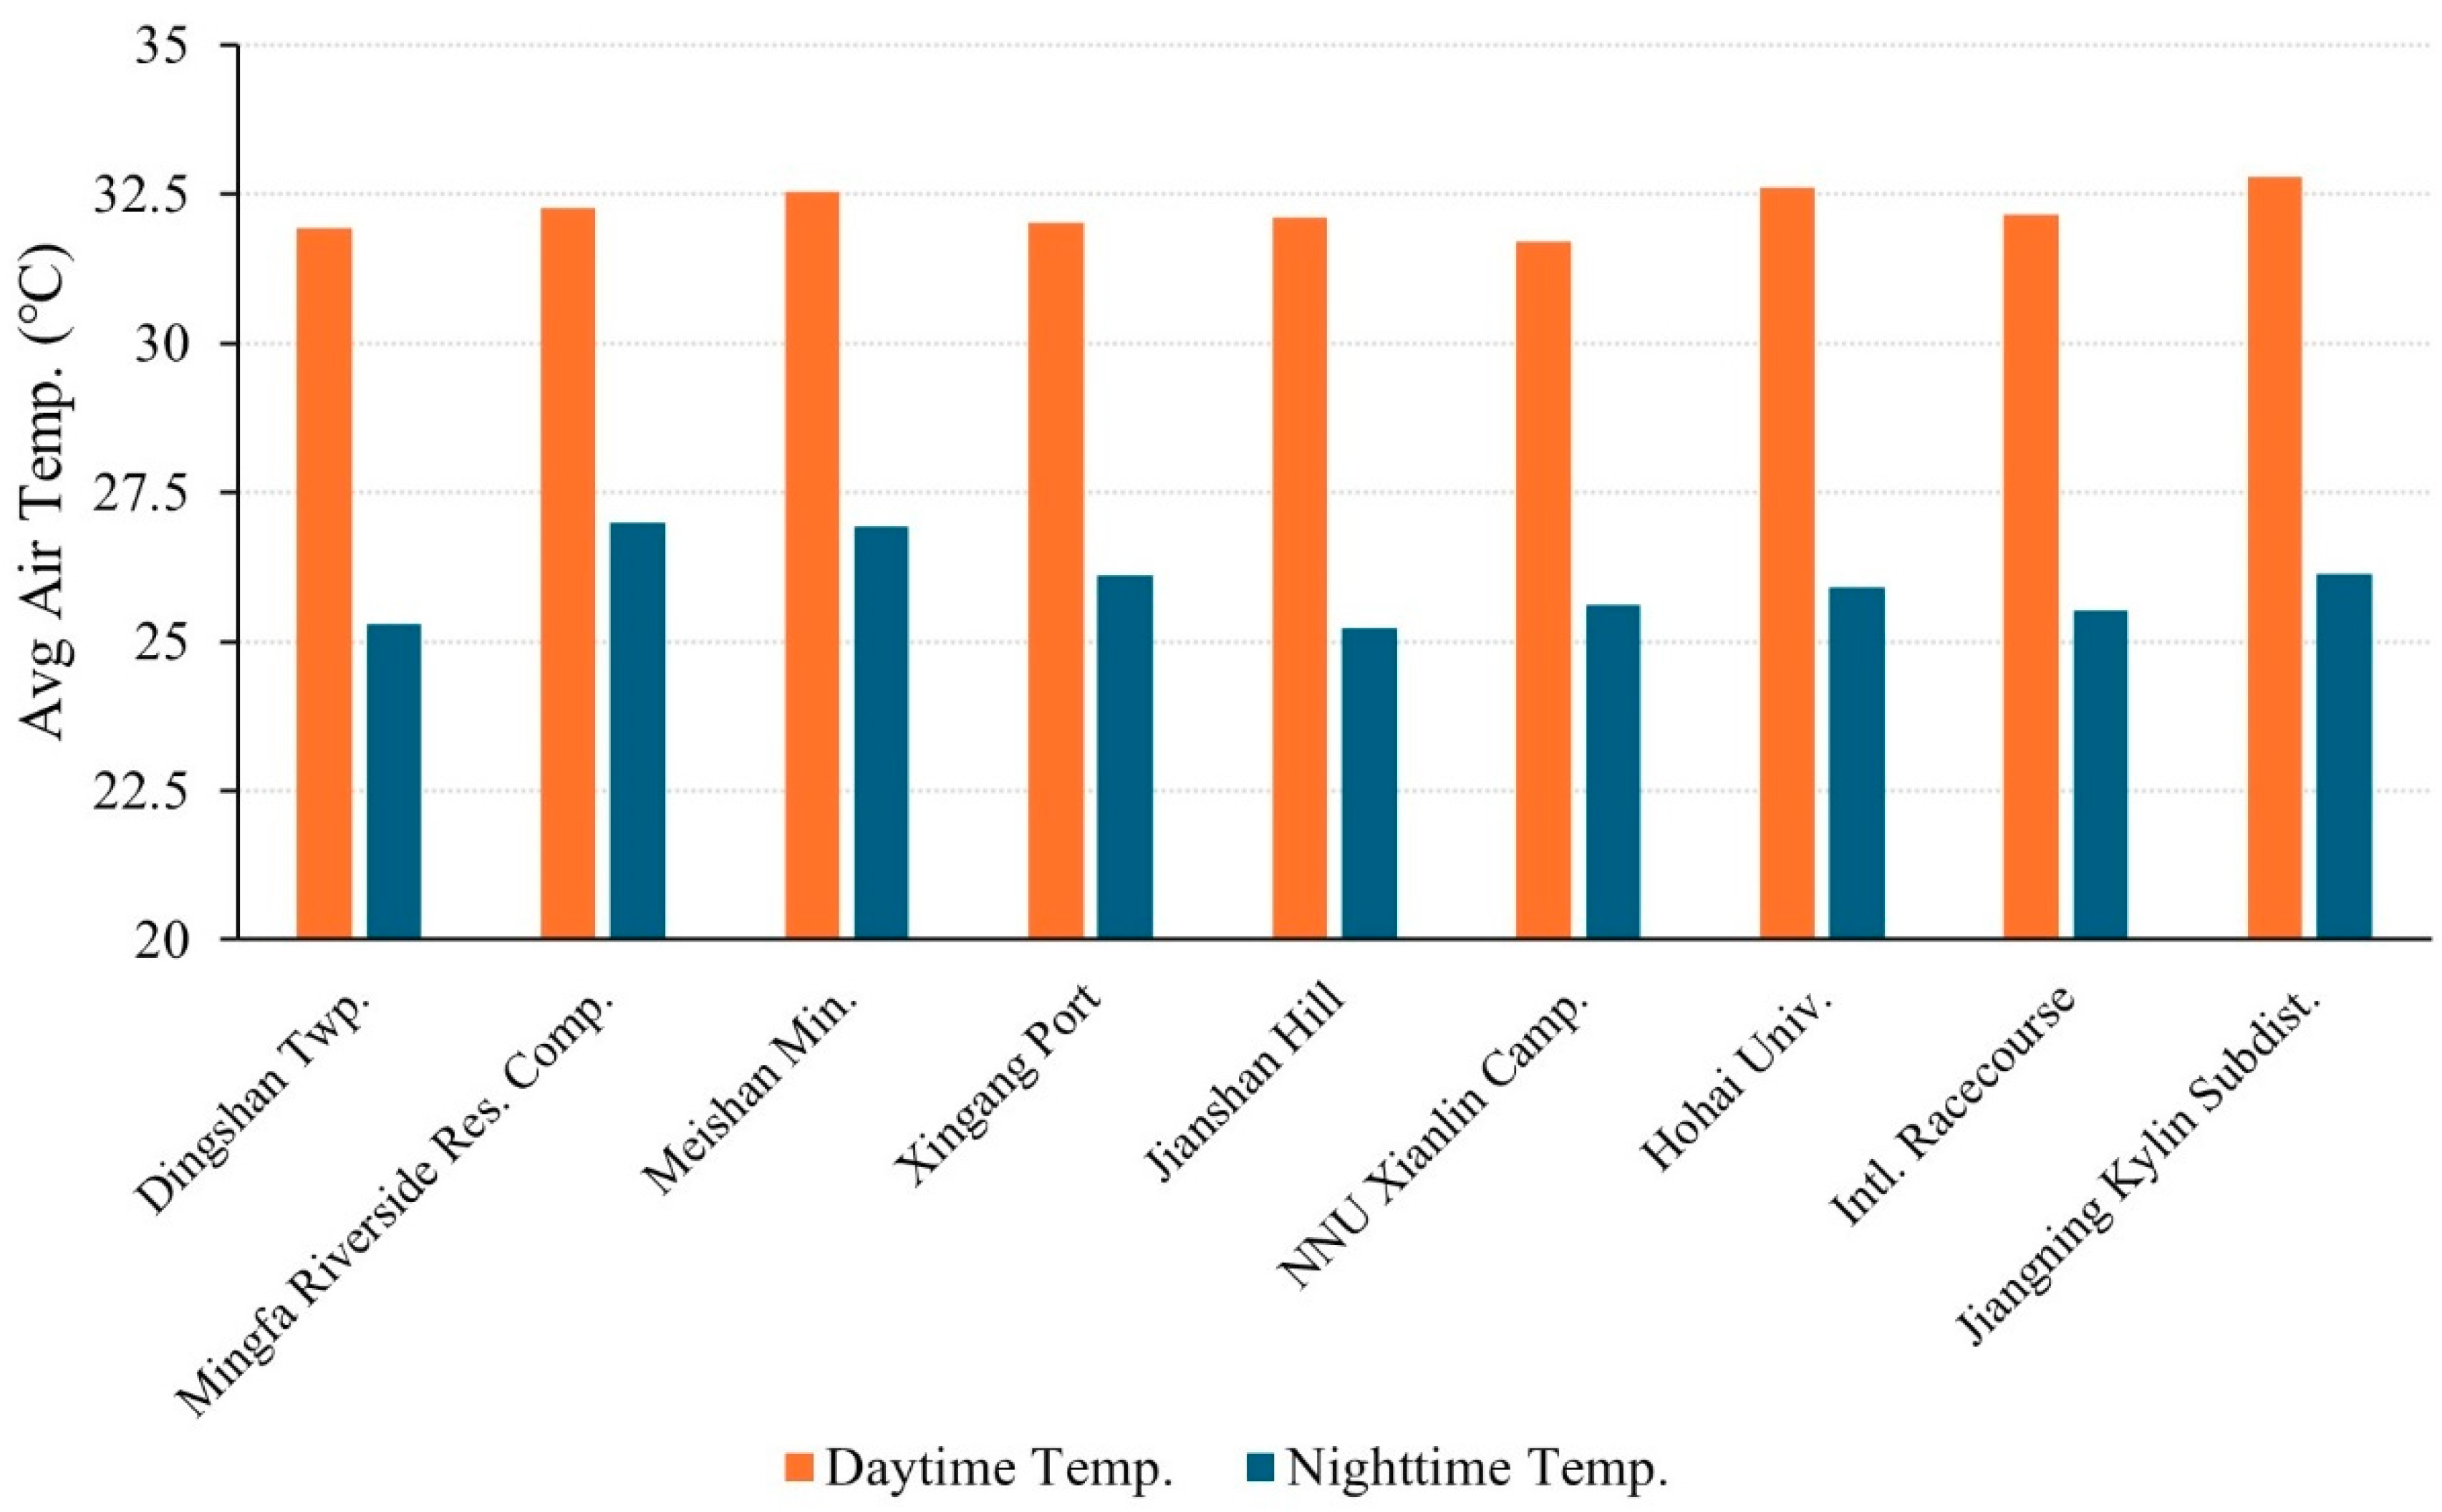
3.2.3. Spatial Distribution Characteristics of the UHI Effect Within the 3rd Annular Zone (10~15 km)

The distribution of daytime and night-time average temperatures for the AWSs in the third annular zone is shown in Figure 10. The differences in daytime temperatures among the AWSs in the third annular zone were relatively minor. Stations such as Mingfa Residential Complex, Meishan Mining, Hohai University, and Jiangning Kylin Subdistrict had relatively higher daytime temperatures, averaging around 32.5 °C. In contrast, Dingshan Township, Xingang Port, and Nanjing Normal University Xianlin Campus, experienced relatively lower daytime temperatures, averaging around 32 °C. During the night, Mingfa Residential Complex and Meishan Mining stations suffered the highest night-time temperatures, averaging 26.8 °C. Xingang Port and Jiangning Kylin Subdistrict stations followed with an average night-time temperature of around 26 °C. In comparison, stations such as Nanjing Normal University Xianlin Campus, International Racecourse, Jianshan Hill, and Dingshan Township held the lowest night-time temperatures, averaging around 25.3 °C, with a maximum of 1.5 °C lower than the highest night-time temperature.
In this annular zone, the stations of Mingfa Residential Complex, Meishan Mining, Hohai University, and Kylin Subdistrict are surrounded by dense residential complexes or road networks, resulting in substantial anthropogenic heat. Additionally, the dense urban morphologies also hinder the heat dissipation at night, resulting in relatively higher night-time temperatures. The Jianshan Hill and International Racecourse stations are both located in open areas, with high absorption of solar radiation during the day, leading to higher daytime temperatures. However, due to the lower density of surrounding buildings and minimal anthropogenic heat from buildings and traffic, heat is easily dissipated at night, leading to lower night-time temperatures. Although the Xingang Port station is located in an industrial land near Yangtze River with low vegetation coverage, resulting in relatively high temperatures both day and night. The stations at Nanjing Normal University Xianlin Campus and Dingshan Township have high vegetation coverage in their surroundings and are far from anthropogenic heat sources, leading to lower temperatures both day and night.

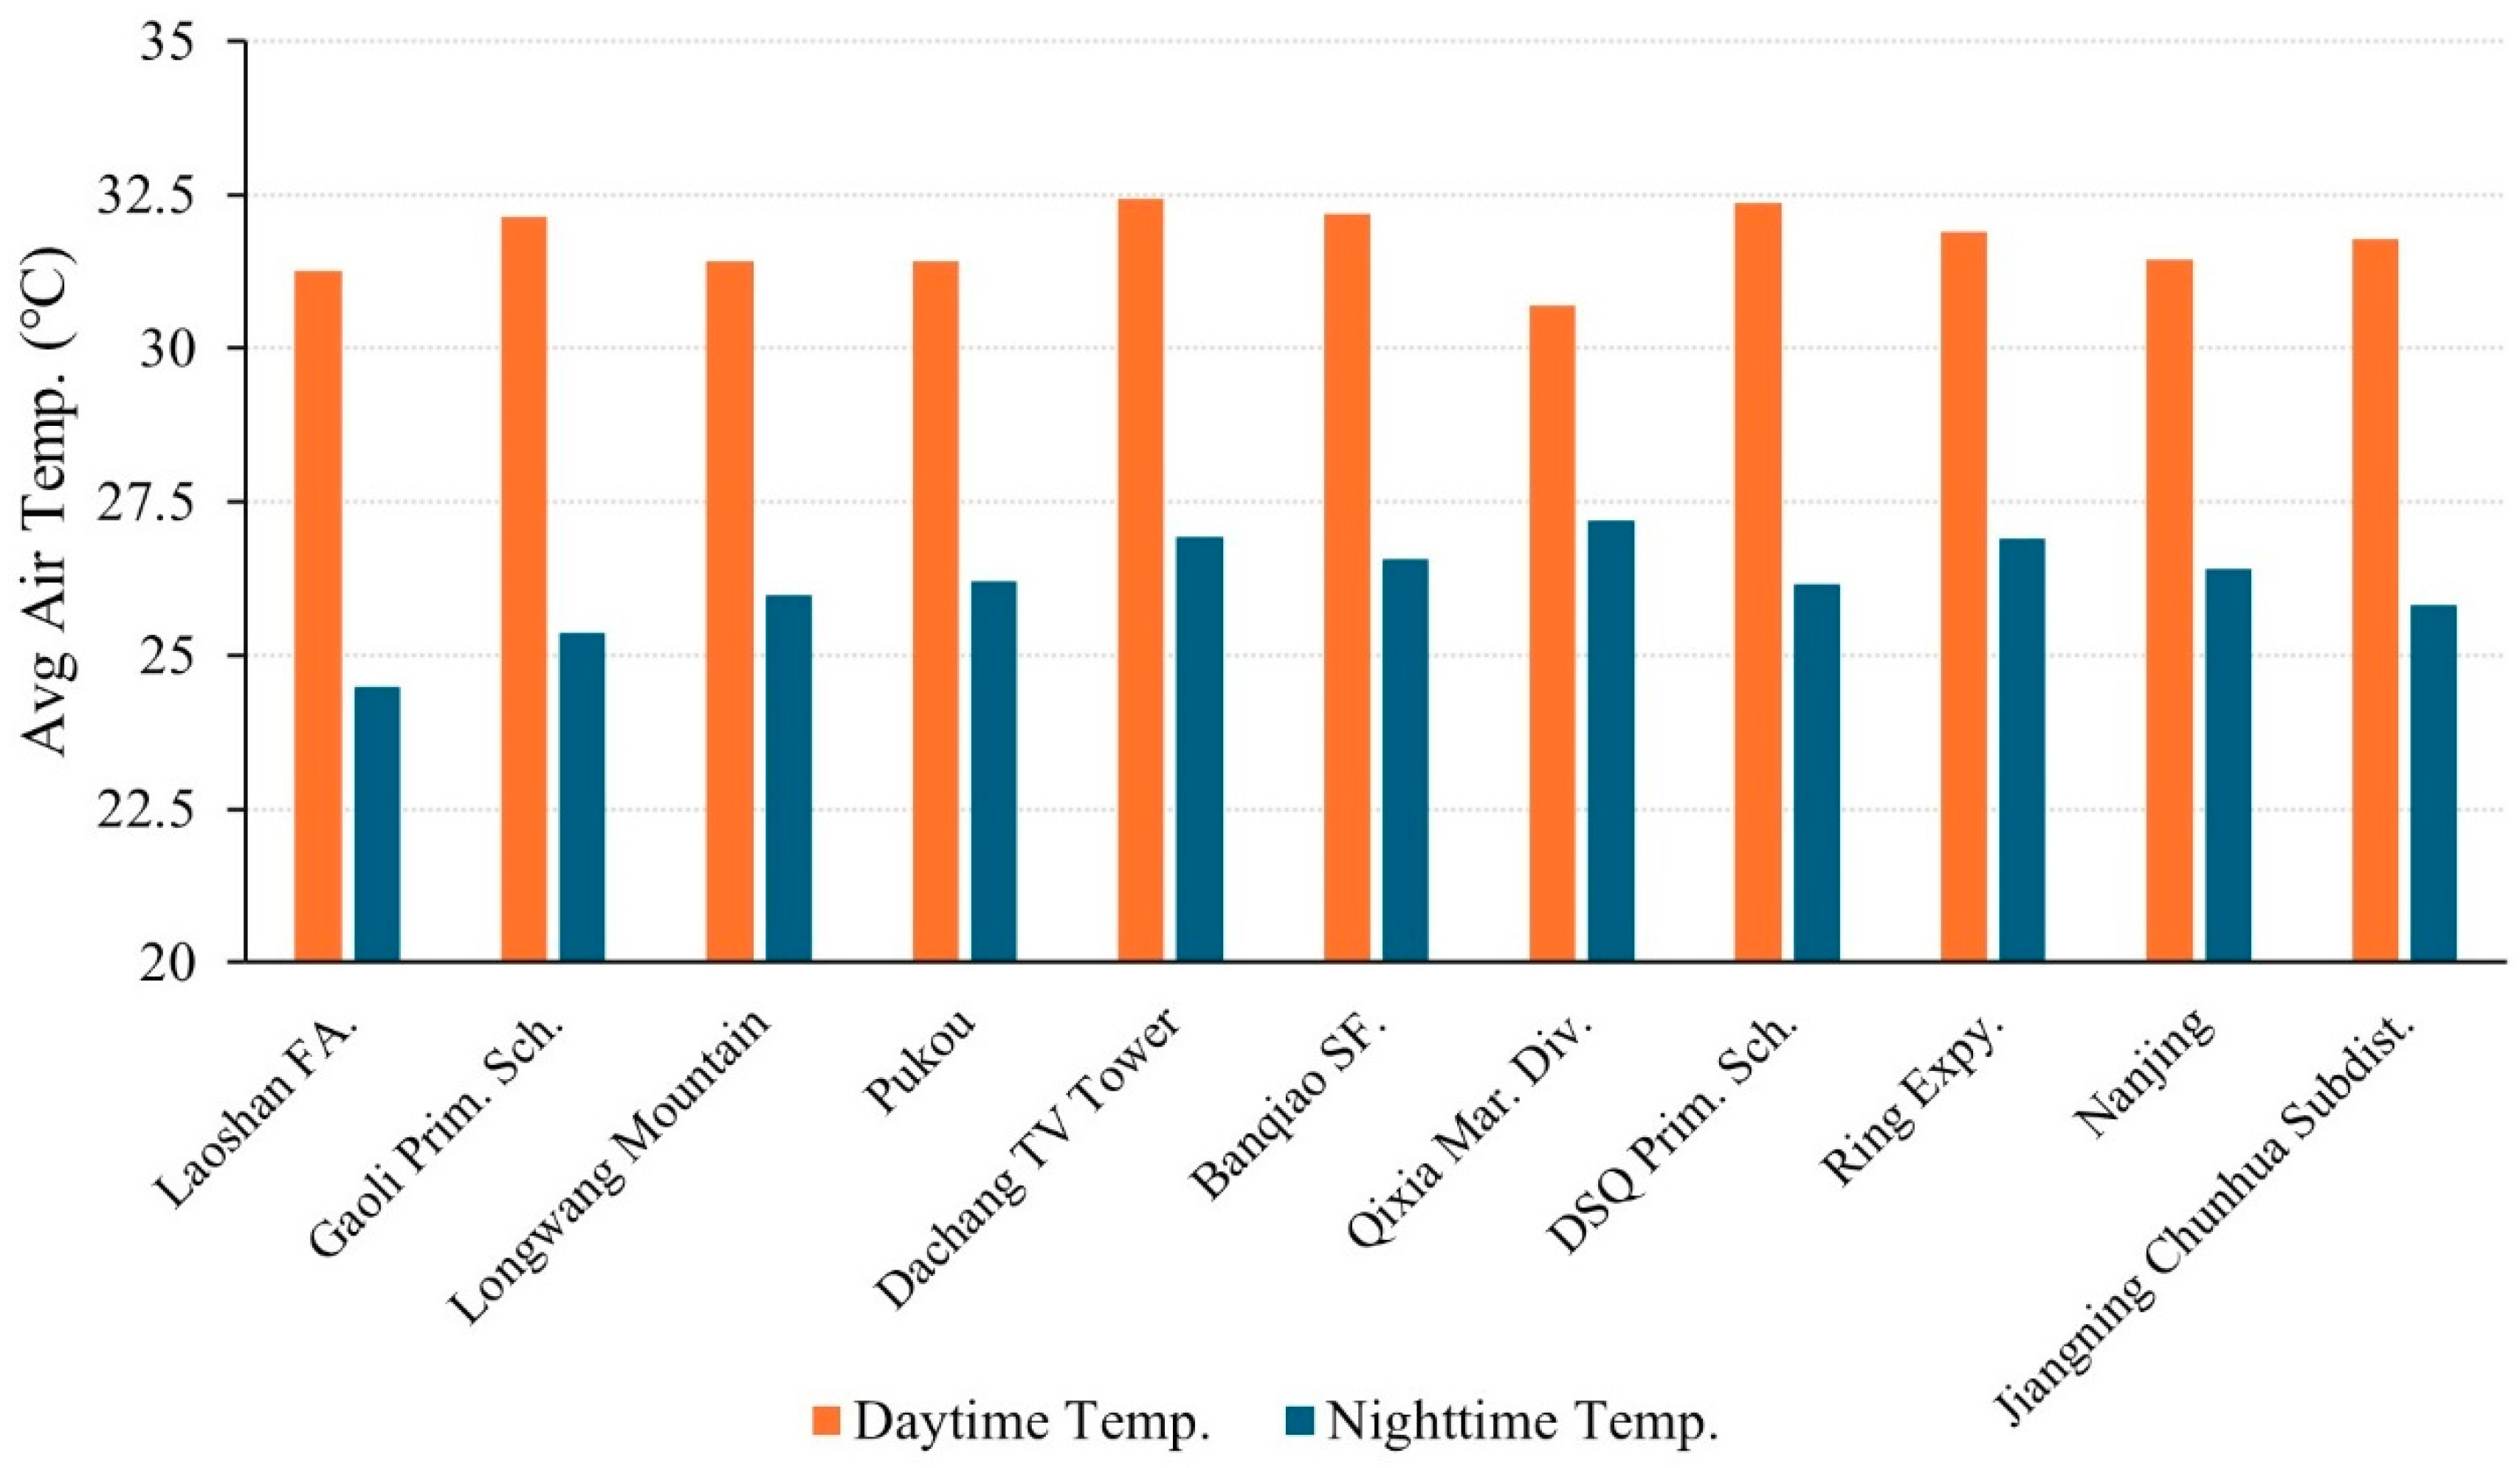
3.2.4. Spatial Distribution Characteristics of the UHI Effect Within the 4th Annular Zone (15~21 km)

The distribution of daytime and night-time average temperatures for the AWSs in the 4th annular zone is shown in Figure 11. In this zone, higher daytime temperatures were observed at Gaoli Primary School, Dachang TV Tower, Banqiao Steam Ferry, and Dongshanqiao Primary School stations, with an average of approximately 32.3 °C. These stations were followed by another two, including the Ring Expressway and Chunhua Subdistrict, holding a slightly lower average temperature of 31.7 °C. The other four stations, including Laoshan Forest Area, Longwang Mountain, Pukou, and Nanjing, held a relatively lower temperature around 31.3 °C. The Qixia Marinetime Division station experienced the lowest daytime temperature at 30.6 °C. However, this station also suffered the highest night-time temperature at around 27 °C. In addition, the stations of Dachang TV Tower, Banqiao Steam Ferry, and Ring Expressway also held similar high night-time temperatures, followed by four stations, including Longwang Mountain, Pukou, Dongshanqiao Primary School, and Chunhua Subdistrict, which had an average temperature of 26 °C. Finally, Laoshan Forest Area and Gaoli Primary School held the lowest night-time temperature (25 °C), yielding a maximum difference of 2 °C compared to the highest.
Stations such as Dachang TV Tower, Banqiao Steam Ferry, and Ring Expressway are all surrounded by densely built industrial areas with low vegetation coverage. Consequently, both their daytime and night-time temperatures were the highest in the fourth annular zone. The Dongshanqiao Primary School station is in a populated residential area with dense low-rise buildings and significant anthropogenic heat emissions, leading to consistently high daytime temperature and low night-time temperature. The Qixia Marinetime Division station is situated near the Yangtze River, where the large heat capacity of the water results in slower heat absorption and release, causing slower and smaller temperature changes. As a result, the station experienced relatively low daytime temperatures and relatively high night-time temperatures. The Laoshan Forest Area station, located at the northern foothills of the Laoshan National Forest Park, is characterized by abundant vegetation and a lack of anthropogenic heat sources. Due to the surrounding environment, both daytime and night-time temperatures around this station were relatively low.

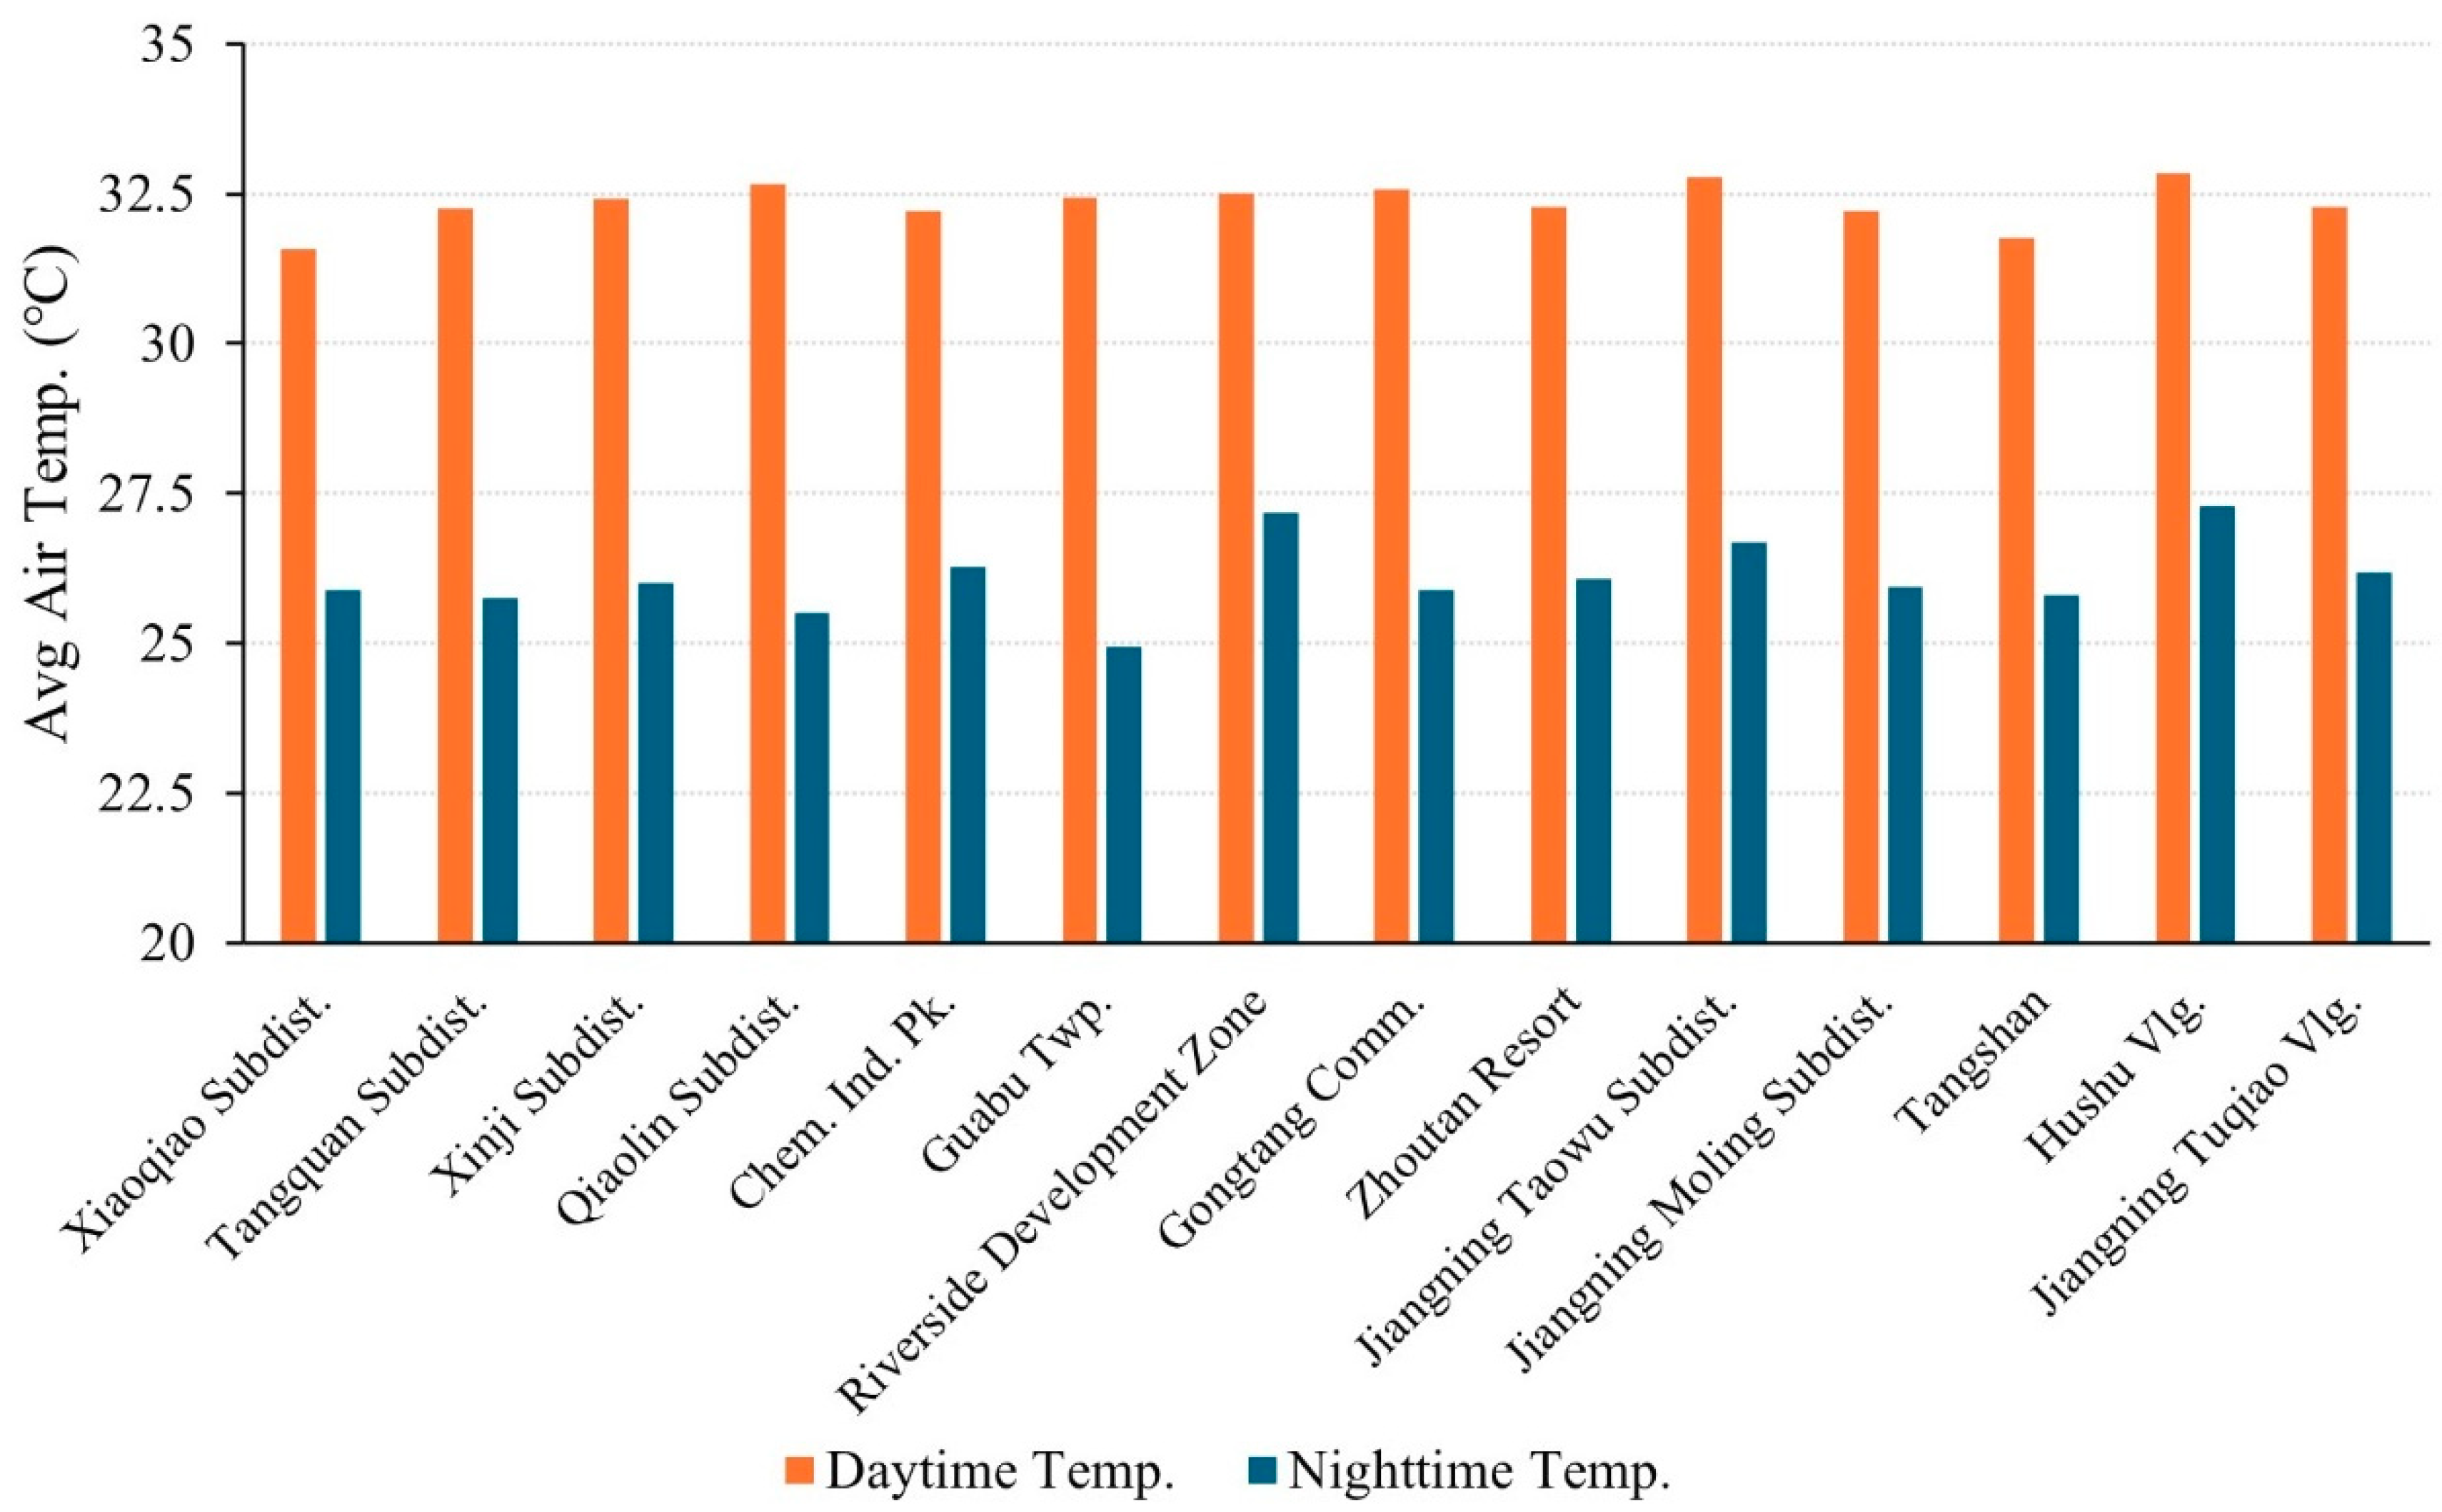
3.2.5. Spatial Distribution Characteristics of the UHI Effect Within the 5th Annular Zone (21~30 km)

Figure 12 shows the distribution of daytime and night-time average temperatures for the AWSs in the fifth annular zone. This zone encompasses rural areas, primarily including agricultural, forestry, and industrial land uses. According to Figure 12, within the range of this zone, the daytime maximum temperatures around most stations are relatively similar, approximately around 32.5 °C. This is because that majority of this zone consists of low-rise town areas with similar spatial forms of the blocks, resulting in a weaker UHI effect and smaller differences in anthropogenic heat emissions. The absorption of solar radiation during the day is also similar. Additionally, among the stations in this zone, only Xiaoqiao and Tangshan have slightly lower daytime temperatures, around 31.5 °C. This is due to the dense forest areas or nature reserves surrounding these two stations, which have a relatively stronger cooling effect.
In terms of night-time temperatures, the Riverside Development Zone, Taowu Subdistrict, and Hushu Village have the highest temperatures, averaging about 27 °C. This is due to the presence of large contiguous industrial areas near these three stations. Although the buildings are low-rise, they continuously emit significant anthropogenic heat at night, resulting in higher night-time temperatures in the surrounding areas. The night-time temperatures at most other stations in this zone are relatively similar, averaging around 25.8 °C. Notably, the Guabu station has higher daytime temperatures but the lowest night-time temperature, at only 24.9 °C. This is because the area around this station is relatively flat and open, with mostly farmland and rivers, which allows it to easily receive solar radiation during the day, leading to rapid warming, while heat dissipates more easily at night, causing faster cooling.

4. Further Discussion

4.1. Temporal Distribution Characteristics of UHI

The analysis of the UHI effect across different annular zones reveals a distinct temporal pattern in Nanjing during the summer, with higher UHII values at night compared to the daytime. A comparison of UHII distributions for August of 2015 and 2016 shows an average UHII of approximately 1.1 °C across the city under clear skies and high-pressure weather conditions, underscoring the typical summer UHI in Nanjing. These findings indicate that the UHI effect results from the combined influence of multiple factors, with daytime and night-time phenomena driven by different mechanisms.
During the day, the UHI effect is primarily governed by dynamic thermal radiation processes and variable contributions from anthropogenic heat sources. Intensive shortwave solar radiation rapidly warms both urban and rural areas after sunrise, thereby reducing the temperature difference. At noon, when shortwave solar radiation is at its peak, increased cloud covers due to convection instability and enhanced turbulent mixing facilitated by heat island circulation further reduce the temperature difference between urban and rural areas. However, as the urban environment absorbs and accumulates a large amount of heat, disparities begin to emerge by late afternoon. In contrast, at night, the absence of solar radiation shifts the balance: the UHI effect is predominantly determined by differences in surface properties between urban and rural areas. The dense urban fabric, coupled with obstacles such as street canyons, buildings, and atmospheric pollutants that inhibit longwave radiation emission from urban surfaces, resulting in stable and pronounced heat retention (Figure 13). Consequently, the strongest UHI effect typically occurs between 18:00 and midnight, with a secondary peak between midnight and 6:00 on the next day.
These temporal characteristics align with previous studies [1,58] and highlight the importance of considering both daytime dynamics and night-time heat retention in understanding urban thermal behavior. The insights gained here provide a basis for future research and targeted mitigation strategies aimed at reducing the UHI effect.

4.2. Spatial Distribution Characteristics of UHI

The comparative analysis of the daytime and night-time average temperatures across different zones reveals that the high-temperature centers in Nanjing during the summer are mainly located in the central urban area (Zone 1), as shown in Figure 13. This region is characterized by a high urbanization rate, dense population and building clusters, heavy traffic volume, and low vegetation coverage, all of which contribute to elevated temperatures. The second zone, which encompasses the sub-central urban area, exhibits intermediate temperature levels due to a relatively lower density of buildings and population, and a moderate degree of vegetation cover, resulting in temperatures that lie between those of the central urban core and the suburbs. The third zone, typically classified as suburban areas, generally shows temperatures that are also intermediate. However, localized high-temperature pockets occur due to industrial land use and traffic-intensive areas, while other parts benefit from higher vegetation coverage and lower urban densities. The fourth and fifth zones, predominantly rural, display more diverse thermal patterns: although areas with abundant vegetation and lower anthropogenic influence form low-temperature zones, significant industrial land use in some parts creates localized high-temperature centers.
Notably, certain stations deviate from these general trends. As shown in Figure 13, AWSs located in areas such as Sun Yat-sen Botanic Garden and Zhongshan Golf Course exhibit lower temperatures despite their location in the urban core, owing to the cooling effects of adjacent natural landscapes like large mountains and forests. Conversely, stations at sites like the Huaneng Power Plant and the Chemical Industrial Park record higher temperatures, even within rural zones, due to intense local industrial heat emissions. Additionally, stations near water bodies, such as those at Pukou Maritime Division and Qixia Maritime Division, demonstrate unique diurnal patterns, forming low-temperature centers during the day and high-temperature centers at night because of the slow heat absorption and release characteristics of water.
These spatial patterns underscore the significant influence of urban morphology, land use, and localized anthropogenic heat sources on the UHI effect. The observed distribution aligns with findings from previous studies [50], emphasizing that both macro-scale urban planning and micro-scale local conditions are critical in shaping urban thermal environments. Future research should further investigate these spatial variations by incorporating higher-resolution land use data and advanced modeling techniques to provide deeper insights and inform targeted urban climate mitigation strategies.

4.3. Boxplot Analysis of Average Temperature Variability

Figure 14 presents boxplots of the daytime and night-time average temperatures recorded at various stations across different annular zones. The boxplots reveal a gradual decrease in median temperatures from the central core (Zone 1) to the peripheral areas (Zones 4 and 5), a trend that reflects the levels of urbanization and vegetation coverage. In addition, Zones 2 and 4 exhibit extended whiskers and wider interquartile ranges, indicating greater temperature variability in these transitional areas. This phenomenon is likely driven by the uneven distribution of localized anthropogenic heat sources within suburban industrial clusters.
During the day, the urban core (Zone 1), characterized by dense construction and high traffic, receives concentrated solar radiation and significant anthropogenic heat emissions, forming a strong heat island center where temperature readings are uniformly high with minimal variation. In contrast, Zone 3, located at the outskirts of the main urban area and hosting numerous industrial parks established during late 20th-century urban planning, experiences high daytime temperatures with low variability due to substantial industrial heat emissions, open spatial configurations, and limited vegetation. Similarly, Zone 5, predominantly comprising suburban and rural areas used for agriculture, forestry, or natural mountainous terrain, although having extensive vegetative cover, exhibits an open spatial configuration that limits shading. This results in concentrated direct solar radiation during the day, leading to relatively high temperatures with little variation. Meanwhile, Zone 2, representing the secondary urban center, shows slightly lower daytime average temperatures than Zone 1; however, significant variations in the surrounding spatial configurations of individual stations contribute to greater temperature variability. Zone 4, representing suburban areas, displays even larger disparities in temperature distributions due to pronounced differences in land use and local spatial configurations.
At night, the urban heat island intensity is highest in Zone 1, followed by Zone 2, while the remaining three zones exhibit lower and more similar intensities. This pattern is primarily due to the absence of solar radiation at night, where the heat island intensity depends on the rate at which the heat absorbed during the day dissipates and the magnitude of night-time anthropogenic heat emissions. In Zone 1, the dense urban fabric and concentrated anthropogenic heat significantly hinder heat dissipation, resulting in the highest night-time heat island intensity. Similarly, Zone 2, being close to the center, also experiences substantial anthropogenic heat and a dense urban form, leading to the next highest intensity. The remaining zones, located farther from the city center and characterized by more open spatial configurations with less concentrated anthropogenic heat sources, tend to have relatively lower and more variable night-time temperatures.
In summary, the temperature records at various stations are closely related to the surrounding urban spatial form, land use characteristics, and the distribution of anthropogenic heat sources. In urban areas, denser spatial configurations during the day enhance shading and limit the absorption of direct solar radiation; however, this density also corresponds with higher levels of anthropogenic heat emissions. At night, the same dense urban structure impedes heat dissipation, reinforcing the urban heat island effect. Conversely, in suburban or rural agricultural and forested areas, the open spatial layout facilitates greater daytime absorption of solar radiation but allows for rapid heat loss at night. It is also important to note that in industrial areas, despite open spatial configurations that promote heat dissipation at night, the significant heat released during industrial processes may still result in localized high-temperature zones.

5. Conclusions

This study investigated the spatial and temporal distribution of the UHI effect in Nanjing during the summer months. By examining the average temperatures recorded by 82 AWSs in Augusts of 2015 and 2016, this study aims to provide a comprehensive analysis of how urbanization influences temperature variations in different zones of the city. Key findings are concluded as follows.
For the temporal distribution of UHI in Nanjing during the summer, the UHI effect is most pronounced at night and weakest at noon. This is because urban surfaces, which absorb solar radiation during the day, release the heat slowly at night, leading to higher night-time temperatures. The periods around sunrise and sunset serve as transitional phases between night-time and daytime UHIs. At sunset, the rapid decrease in shortwave radiation and increase in longwave radiation contribute to the strengthening of the UHI effect. Additionally, the night-time UHI is closely related to the properties of the underlying surface, with urban surface characteristics significantly influencing the formation and intensity of the UHI. This is particularly evident in the central urban area, where the dense population, high building density, and heavy traffic volume contribute to a stable and strong UHI effect.
Overall, with the development of urbanization, the spatial distribution of the summer UHI in Nanjing exhibits directional characteristics. Firstly, Hexi New Town, located to the southwest of the central urban area and where the Olympic Sports Center is situated, has experienced rapid urbanization in recent years. This development has resulted in higher summer temperatures, transforming this region from a fringe area of the UHI into a high-temperature center. Secondly, although Jiangning New Town, located to the south and far from the central urban area, has seen significant urbanization and rapid development in recent years, the temperature is lower than that of the central urban area due to the large areas of agricultural and forest land surrounding it. Thirdly, The Xianlin Sub-City in the eastern part of Nanjing, separated from the central urban area by Zijin Mountain and surrounded by large natural hills, also has lower temperatures than the central urban area. This natural barrier significantly mitigates the UHI effect, creating a cooler environment. Similarly, the Pukou Sub-City in the northwest, situated between the Yangtze River and the Laoshan National Forest Park, has developed large residential and industrial areas. The Laoshan Mountain and its vegetation help to lower the temperatures compared to the central urban area, making Pukou a transitional temperature zone between urban and rural areas.
Therefore, based on Nanjing’s urban development plan, as the population continues to grow, the urbanization rates in Hexi and Jiangning Districts are expected to reach the levels of the central urban area. Consequently, the strong UHI center in Nanjing will gradually expand to encompass the entire southern new towns, with the UHI range continuously expanding outward. This expansion of the UHI effect underscores the need for urban planning strategies that incorporate green spaces and mitigate heat accumulation in densely built areas.
Furthermore, this study utilized a rough methodology involving the selection of representative AWSs from different annular zones around the city and the analysis of temperature data during both daytime and night-time periods. While this approach facilitates convenient calculations and provides valuable insights into the spatiotemporal distribution characteristics and formation mechanisms of UHI, it is acknowledged that the method may not offer the highest accuracy due to its inherent simplifications. The reliance on representative stations and aggregated data may overlook localized variations and complex microclimatic factors. A comparative analysis with cities exhibiting analogous climatic and demographic conditions is recommended to identify unique urban drivers of UHI and better contextualize these results. Future exploration should focus on refining this approach by incorporating higher-resolution data, advanced modeling techniques, and more detailed analyses of micro-scale influences. Moreover, actionable policy insights, such as promoting urban greening, increasing the use of reflective building materials, and optimizing urban layouts to reduce UHII by quantifiable margins, should be developed and widely applied. Despite these limitations, the framework presented herein offers a practical starting point for further UHI studies and the development of more precise tools for urban thermal analysis.

Author Contributions

Conceptualization, J.-Y.D. and Y.H.; Methodology, J.-Y.D.; Investigation, H.L., C.M. and Y.C.; Resources, K.L.; Data curation, Y.C.; Writing—original draft, J.-Y.D., H.L. and C.M.; Writing—review & editing, J.-Y.D., Y.H. and K.L.; Visualization, Y.C.; Funding acquisition, K.L. All authors have read and agreed to the published version of the manuscript.

Funding

This study was supported by the Guangdong Provincial Natural Science Foundation (Grant No. 2022A1515010769).

Data Availability Statement

The original contributions presented in this study are included in the article. Further inquiries can be directed to the corresponding author.

Acknowledgments

The authors would like to express gratitude to Chen Jian at Nanjing University of Information Science & Technology for his valuable support in this study.

Conflicts of Interest

The authors declare no conflict of interest.

References

  1. Oke, T.R. City size and the urban heat island. Atmos. Environ. 1973, 7, 769–779. [Google Scholar] [CrossRef]
  2. Dorahaki, S.; MollahassaniPour, M.; Rashidinejad, M.; Siano, P.; Shafie-khah, M. A flexibility-oriented model for a sustainable local multi-carrier energy community: A hybrid multi-objective probabilistic-IGDT optimization approach. Appl. Energy 2025, 377, 124678. [Google Scholar] [CrossRef]
  3. Bai, Y.; Wang, W.; Liu, M.; Xiong, X.; Li, S. Impact of urban greenspace on the urban thermal environment: A case study of Shenzhen, China. Sustain. Cities Soc. 2024, 112, 105591. [Google Scholar] [CrossRef]
  4. Cai, Y.; Chen, Y.; Tong, C. Spatiotemporal evolution of urban green space and its impact on the urban thermal environment based on remote sensing data: A case study of Fuzhou City, China. Urban For. Urban Green. 2019, 41, 333–343. [Google Scholar] [CrossRef]
  5. Yao, L.; Sun, S.; Song, C.; Li, J.; Xu, W.; Xu, Y. Understanding the spatiotemporal pattern of the urban heat island footprint in the context of urbanization, a case study in Beijing, China. Appl. Geogr. 2021, 133, 102496. [Google Scholar] [CrossRef]
  6. Zhang, H.; Kang, M.-Y.; Guan, Z.-R.; Zhou, R.; Zhao, A.-L.; Wu, W.-J.; Yang, H.-R. Assessing the role of urban green infrastructure in mitigating summertime Urban Heat Island (UHI) effect in metropolitan Shanghai, China. Sustain. Cities Soc. 2024, 112, 105605. [Google Scholar] [CrossRef]
  7. Zhou, M.; Wang, R.; Guo, Y. How urban spatial characteristics impact surface urban heat island in subtropical high-density cities based on LCZs: A case study of Macau. Sustain. Cities Soc. 2024, 112, 105587. [Google Scholar] [CrossRef]
  8. Anees, S.A.; Mehmood, K.; Raza, S.I.H.; Pfautsch, S.; Shah, M.; Jamjareegulgarn, P.; Shahzad, F.; Alarfaj, A.A.; Alharbi, S.A.; Khan, W.R.; et al. Spatiotemporal analysis of surface Urban Heat Island intensity and the role of vegetation in six major Pakistani cities. Ecol. Inform. 2025, 85, 102986. [Google Scholar] [CrossRef]
  9. Jamarkattel, U.; Lamichhane, B.R.; Gautam, S.; Niraj, K.C.; Sherchan, B.; Horanont, T. Analyzing Urban Heat Islands in Pokhara Metropolitan City-Nepal Through Remote Sensing Techniques. Remote Sens. Appl. Soc. Environ. 2025, 37, 101479. [Google Scholar] [CrossRef]
  10. Zhang, X.; Liu, Y.; Chen, R.; Si, M.; Zhang, C.; Tian, Y.; Shang, G. The Spatiotemporal Evolution and Driving Forces of the Urban Heat Island in Shijiazhuang. Remote Sens. 2025, 17, 781. [Google Scholar] [CrossRef]
  11. Voogt, J.A.; Oke, T.R. Thermal remote sensing of urban climates. Remote Sens. Environ. 2003, 86, 370–384. [Google Scholar] [CrossRef]
  12. Dousset, B.; Gourmelon, F. Satellite multi-sensor data analysis of urban surface temperatures and landcover. ISPRS J. Photogramm. Remote Sens. 2003, 58, 43–54. [Google Scholar] [CrossRef]
  13. Weng, Q.; Lu, D.; Schubring, J. Estimation of land surface temperature–vegetation abundance relationship for urban heat island studies. Remote Sens. Environ. 2004, 89, 467–483. [Google Scholar] [CrossRef]
  14. Bottyán, Z.; Unger, J. A multiple linear statistical model for estimating the mean maximum urban heat island. Theor. Appl. Climatol. 2003, 75, 233–243. [Google Scholar] [CrossRef]
  15. Eliasson, I. Urban nocturnal temperatures, street geometry and land use. Atmos. Environ. 1996, 30, 379–392. [Google Scholar] [CrossRef]
  16. Elvidge, C.D.; Baugh, K.E.; Kihn, E.A.; Kroehl, H.W.; Davis, E.R.; Davis, C.W. Relation between satellite observed visible-near infrared emissions, population, economic activity and electric power consumption. Int. J. Remote Sens. 1997, 18, 1373–1379. [Google Scholar] [CrossRef]
  17. Fan, H.; Sailor, D.J. Modeling the impacts of anthropogenic heating on the urban climate of Philadelphia: A comparison of implementations in two PBL schemes. Atmos. Environ. 2005, 39, 73–84. [Google Scholar] [CrossRef]
  18. Weng, Q.; Lu, D.; Liang, B. Urban Surface Biophysical Descriptors and Land Surface Temperature Variations. Photogramm. Eng. Remote Sens. 2006, 72, 1275–1286. [Google Scholar] [CrossRef]
  19. Xiao, R.; Weng, Q.; Ouyang, Z.; Li, W.; Schienke, E.W.; Zhang, Z. Land Surface Temperature Variation and Major Factors in Beijing, China. Photogramm. Eng. Remote Sens. 2008, 74, 451–461. [Google Scholar] [CrossRef]
  20. Chen, Y.; Jiang, W.M. Impact of Nanjing urban development on the boundary layer. Chin. J. Geophys. 2007, 50, 67–74. [Google Scholar]
  21. Orkomi, A.A.; Ameri, M. Investigating the intensity of urban heat island and the impacts of local climate using verified WRF data: A case study of Rasht, Northern Iran. Sustain. Cities Soc. 2024, 106, 105405. [Google Scholar] [CrossRef]
  22. Shi, H.; Xian, G.; Auch, R.; Gallo, K.; Zhou, Q. Urban Heat Island and Its Regional Impacts Using Remotely Sensed Thermal Data—A Review of Recent Developments and Methodology. Land 2021, 10, 867. [Google Scholar] [CrossRef]
  23. Zhihong, J.; Limei, Y.; Fei, H. Numerical simulation of the impact of land cover change on Urban Heat Island effect in Nanjing. In Proceedings of the 2011 International Conference on Remote Sensing, Environment and Transportation Engineering, Nanjing, China, 24–26 June 2011; pp. 4223–4226. [Google Scholar]
  24. Aquino-Martínez, L.P.; Ortega-Guerrero, B.; Quintanar, A.I.; Díaz-Esteban, Y. Synoptic patterns and heatwaves: Intensifying urban heat islands in the Mexico Basin. Urban Clim. 2025, 59, 102318. [Google Scholar] [CrossRef]
  25. Tabassum, A.; Hong, S.-H.; Park, K.; Baik, J.-J. Simulating urban heat islands and local winds in the Dhaka metropolitan area, Bangladesh. Urban Clim. 2025, 59, 102284. [Google Scholar] [CrossRef]
  26. Zhou, K.; Zhong, L.; Liu, J.; Wang, Z.; Liu, J. Unveiling the Role of Western Pacific Subtropical High in Urban Heat Islands Using Local Climate Zones Coupled WRF-BEP/BEM. Earth Syst. Environ. 2025. [Google Scholar] [CrossRef]
  27. Li, Y.; Schubert, S.; Kropp, J.P.; Rybski, D. On the influence of density and morphology on the Urban Heat Island intensity. Nat. Commun. 2020, 11, 2647. [Google Scholar] [CrossRef] [PubMed]
  28. Michau, Y.; Lemonsu, A.; Lucas-Picher, P.; Caillaud, C. Evaluation of the Urban Heat Island of 12 cities of France in a high-resolution regional climate model simulation. Urban Clim. 2023, 47, 101386. [Google Scholar] [CrossRef]
  29. Sharma, S.; Najian, M.; Goudarzi, N. Towards Improving High Spatiotemporal Weather Forecast Accuracy with Data-Driven Modeling. In Proceedings of the ASME 2024 18th International Conference on Energy Sustainability collocated with the ASME 2024 Heat Transfer Summer Conference and the ASME 2024 Fluids Engineering Division Summer Meeting, Anaheim, CA, USA, 15–17 July 2024. [Google Scholar]
  30. Vitanova, L.L.; Kusaka, H. Study on the urban heat island in Sofia City: Numerical simulations with potential natural vegetation and present land use data. Sustain. Cities Soc. 2018, 40, 110–125. [Google Scholar] [CrossRef]
  31. Mirzaei, P.A.; Haghighat, F. Approaches to study Urban Heat Island—Abilities and limitations. Build. Environ. 2010, 45, 2192–2201. [Google Scholar] [CrossRef]
  32. Saaroni, H.; Ben-Dor, E.; Bitan, A.; Potchter, O. Spatial distribution and microscale characteristics of the urban heat island in Tel-Aviv, Israel. Landsc. Urban Plan. 2000, 48, 1–18. [Google Scholar] [CrossRef]
  33. Sakthivel, P.; Sengupta, R. Spatial bias in placement of citizen and conventional weather stations and their impact on urban climate research: A case study of the Urban Heat Island effect in Canada. Urban Clim. 2025, 59, 102280. [Google Scholar] [CrossRef]
  34. Zezzo, L.V.; Coltri, P.P.; Dubreuil, V.; Torres, G.A.L.; de Costa Trindade Amorim, M.C. Exploring the urban heat island phenomenon in a tropical medium-sized city: Insights for sustainable urban development. Environ. Monit. Assess. 2025, 197, 445. [Google Scholar] [CrossRef] [PubMed]
  35. Yao, R.; Wang, L.; Huang, X.; Niu, Y.; Chen, Y.; Niu, Z. The influence of different data and method on estimating the surface urban heat island intensity. Ecol. Indic. 2018, 89, 45–55. [Google Scholar] [CrossRef]
  36. Lin, T.-P.; Chen, Y.-C.; Matzarakis, A. Urban thermal stress climatic mapping: Combination of long-term climate data and thermal stress risk evaluation. Sustain. Cities Soc. 2017, 34, 12–21. [Google Scholar] [CrossRef]
  37. Liu, L.; Lin, Y.; Liu, J.; Wang, L.; Wang, D.; Shui, T.; Chen, X.; Wu, Q. Analysis of local-scale urban heat island characteristics using an integrated method of mobile measurement and GIS-based spatial interpolation. Build. Environ. 2017, 117, 191–207. [Google Scholar] [CrossRef]
  38. Tsin, P.K.; Knudby, A.; Krayenhoff, E.S.; Ho, H.C.; Brauer, M.; Henderson, S.B. Microscale mobile monitoring of urban air temperature. Urban Clim. 2016, 18, 58–72. [Google Scholar] [CrossRef]
  39. Sun, X.; Tan, X.; Chen, K.; Song, S.; Zhu, X.; Hou, D. Quantifying landscape-metrics impacts on urban green-spaces and water-bodies cooling effect: The study of Nanjing, China. Urban For. Urban Green. 2020, 55, 126838. [Google Scholar] [CrossRef]
  40. Yao, L.; Sailor, D.J.; Yang, X.; Xu, G.; Zhao, L. Are water bodies effective for urban heat mitigation? Evidence from field studies of urban lakes in two humid subtropical cities. Build. Environ. 2023, 245, 110860. [Google Scholar] [CrossRef]
  41. Lai, J.; Zhan, W.; Huang, F.; Voogt, J.; Bechtel, B.; Allen, M.; Peng, S.; Hong, F.; Liu, Y.; Du, P. Identification of typical diurnal patterns for clear-sky climatology of surface urban heat islands. Remote Sens. Environ. 2018, 217, 203–220. [Google Scholar] [CrossRef]
  42. Rajkovich, N.B.; Larsen, L. A Bicycle-Based Field Measurement System for the Study of Thermal Exposure in Cuyahoga County, Ohio, USA. Int. J. Environ. Res. Public Health 2016, 13, 159. [Google Scholar] [CrossRef]
  43. Kim, M.; Lee, K.; Cho, G.-H. Temporal and spatial variability of urban heat island by geographical location: A case study of Ulsan, Korea. Build. Environ. 2017, 126, 471–482. [Google Scholar] [CrossRef]
  44. Anderson, C.I.; Gough, W.A.; Mohsin, T. Characterization of the urban heat island at Toronto: Revisiting the choice of rural sites using a measure of day-to-day variation. Urban Clim. 2018, 25, 187–195. [Google Scholar] [CrossRef]
  45. Azevedo, J.; Chapman, L.; Muller, C. Quantifying the Daytime and Night-Time Urban Heat Island in Birmingham, UK: A Comparison of Satellite Derived Land Surface Temperature and High Resolution Air Temperature Observations. Remote Sens. 2016, 8, 153. [Google Scholar] [CrossRef]
  46. Bassett, R.; Cai, X.; Chapman, L.; Heaviside, C.; Thornes, J.E.; Muller, C.L.; Young, D.T.; Warren, E.L. Observations of urban heat island advection from a high-density monitoring network. Q. J. R. Meteorol. Soc. 2016, 142, 2434–2441. [Google Scholar] [CrossRef]
  47. Chapman, L.; Muller, C.L.; Grimmond, C.S.B.; Young, D.T.; Cai, X.-M. Toward a Standardized Metadata Protocol for Urban Meteorological Networks. Bull. Am. Meteorol. Soc. 2013, 94, 1161–1185. [Google Scholar] [CrossRef]
  48. Hu, X.-M.; Xue, M.; Klein, P.M.; Illston, B.G.; Chen, S. Analysis of Urban Effects in Oklahoma City using a Dense Surface Observing Network. J. Appl. Meteorol. Climatol. 2016, 55, 723–741. [Google Scholar] [CrossRef]
  49. Liang, Z.; Li, Z.; Fan, Z. Seasonal impacts of built environment and its interactions on urban park cooling effects in Nanjing, China. Build. Environ. 2023, 242, 110580. [Google Scholar] [CrossRef]
  50. Min, M.; Lin, C.; Duan, X.; Jin, Z.; Zhang, L. Spatial distribution and driving force analysis of urban heat island effect based on raster data: A case study of the Nanjing metropolitan area, China. Sustain. Cities Soc. 2019, 50, 101637. [Google Scholar] [CrossRef]
  51. Xiao, Y.; Piao, Y.; Pan, C.; Lee, D.; Zhao, B. Using buffer analysis to determine urban park cooling intensity: Five estimation methods for Nanjing, China. Sci. Total Environ. 2023, 868, 161463. [Google Scholar] [CrossRef]
  52. Zhang, M.; Tan, S.; Liang, J.; Zhang, C.; Chen, E. Predicting the impacts of urban development on urban thermal environment using machine learning algorithms in Nanjing, China. J. Environ. Manag. 2024, 356, 120560. [Google Scholar] [CrossRef]
  53. Jiang, X.D.; Xia, B.C.; Guo, L.; Li, N. Characteristics of multi-scale temporal-spatial distribution of urban heat island in Guangzhou. Ying Yong Sheng Tai Xue Bao 2007, 18, 133–139. [Google Scholar] [PubMed]
  54. Estévez, J.; Gavilán, P.; Giráldez, J.V. Guidelines on validation procedures for meteorological data from automatic weather stations. J. Hydrol. 2011, 402, 144–154. [Google Scholar] [CrossRef]
  55. Acquaotta, F.; Fratianni, S.; Aguilar, E.; Fortin, G. Influence of instrumentation on long temperature time series. Clim. Chang. 2019, 156, 385–404. [Google Scholar] [CrossRef]
  56. Liubitskyi, V.V.; Shcherbatiuk, M.V.; Cherevychnyi, Y.O.; Shatkovskyi, A.P.; Zhuravlov, O.V. Assessment of the Accuracy of Meteorological Data Obtained from Virtual and Automatic Weather Stations for the Conditions of Ukrainian Polissya. Land Reclam. Water Manag. 2024, 2, 87–99. [Google Scholar] [CrossRef]
  57. Oke, T.R.; East, C. The urban boundary layer in Montreal. Bound.-Layer Meteorol. 1971, 1, 411–437. [Google Scholar] [CrossRef]
  58. Huang, L.; Li, H.; Zha, D.; Zhu, J. A fieldwork study on the diurnal changes of urban microclimate in four types of ground cover and urban heat island of Nanjing, China. Build. Environ. 2008, 43, 7–17. [Google Scholar] [CrossRef]
Figure 1. Distribution of automatic weather stations within each annular zone.
Buildings 15 01289 g001
Figure 2. Linear regression analysis of two data sets.
Buildings 15 01289 g002
Figure 3. Daily variations in urban and rural temperatures and UHII in the 5 km annular zone. (a) August 2015. (b) August 2016.
Buildings 15 01289 g003
Figure 4. Daily variations in urban and rural temperatures and UHII in the 5~10 km annular zone. (a) August 2015. (b) August 2016.
Buildings 15 01289 g004
Figure 5. Daily variations in urban and rural temperatures and UHII in the 10~15 km annular zone. (a) August 2015. (b) August 2016.
Buildings 15 01289 g005
Figure 6. Daily variations in urban and rural temperatures and UHII in the 15~21 km annular zone. (a) August 2015. (b) August 2016.
Buildings 15 01289 g006
Figure 7. Daily variations in urban and rural temperatures and UHII in the 21~30 km annular zone. (a) August 2015. (b) August 2016.
Buildings 15 01289 g007
Figure 8. Distribution of representative daytime and night-time temperatures at AWSs in the first annular zone.
Buildings 15 01289 g008
Figure 9. Distribution of representative daytime and night-time temperatures at AWSs in the second annular zone.
Buildings 15 01289 g009
Figure 10. Distribution of representative daytime and night-time temperatures at AWSs in the third annular zone.
Buildings 15 01289 g010
Figure 11. Distribution of representative daytime and night-time temperatures at AWSs in the fourth annular zone.
Buildings 15 01289 g011
Figure 12. Distribution of representative daytime and night-time temperatures at AWSs in the fifth annular zone.
Buildings 15 01289 g012
Figure 13. Distribution of daytime and night-time average temperatures across five annular zones.
Buildings 15 01289 g013
Figure 14. Boxplots of the daytime and night-time average temperatures across five annular zones.
Buildings 15 01289 g014
Table 1. The selected AWSs within each annular zone.
Annular ZonesBuilt-Up Area PercentageNames of the Selected AWSsID
0~5 km94%Nanshi Middle SchoolA01
Longjiang Primary SchoolA02
Gulou Vocational SchoolA03
Xuanwuhu ParkA04
Beijige ParkA05
The 9th Middle SchoolA06
The 1st Middle SchoolA07
Ruijin Residential ComplexA08
Guanghua East StreetA09
5~10 km84%Taishan SubdistrictB01
Pukou Maritime DivisionB02
Olympic Sports CentreB03
Zhongshan Botanical GardenB04
XiaojiaochangB05
Zhongshan Golf CourseB06
Nanjing Sport InstituteB07
10~15 km65%Dingshan TownshipC01
Mingfa Riverside Residential ComplexC02
Meishan MiningC03
Xingang PortC04
Jianshan HillC05
Nanjing Normal University Xianlin CampusC06
Hohai UniversityC07
International RacecourseC08
Jiangning Kylin SubdistrictC09
15~21 km41%Laoshan Forestry AreaD01
Gaoli Primary SchoolD02
Laoshan MountainD03
Longwang MountainD04
PukouD05
Dachang TV TowerD06
Yanjiang TownshipD07
Huaneng Power PlantD08
Banqiao Steam FerryD09
Qixia Maritime DivisionD10
Dongshanqiao TownshipD11
Dongshanqiao Primary SchoolD12
Ring ExpresswayD13
NanjingD14
Jiangning Chunhua SubdistrictD15
Jiangning Service AreaD16
21~30 km22%Xiaoqiao SubdistrictE01
Tangquan SubdistrictE02
Xinji SubdistrictE03
Jiangning Maritime DivisionE04
Qiaolin SubdistrictE05
Yong-Liu ExpresswayE06
Chemical Industry ParkE07
Guabu TownshipE08
Riverside Development ZoneE09
Ning-Ma ExpresswayE10
Lulang Huatang VillageE11
Gongtang CommunityE12
Zhoutan ResortE13
Jiangning Taowu SubdistrictE14
Jiangning Moling SubdistrictE15
TangshanE16
Shangfeng TownshipE17
Jiangning Hushu SubdistrictE18
Hushu VillageE19
Jiangning Tuqiao VillageE20
>30 km20%Ninghe North SlopeF01
Ning-Lian ExpresswayF02
Xingdian TownshipF03
Liuhe Service AreaF04
Chengqiao SubdistrictF05
Shiqiao CommunityF06
Pingshan Post OfficeF07
North of Chu River BridgeF08
Pingshan Forest FarmF09
Wujiang CommunityF10
Babai TownshipF11
Jinniu Lake Scenic AreaF12
Xinhuang TownshipF13
Donggou TownshipF14
Damiao VillageF15
Hengxi Vegetable InstituteF16
Jiangning Little DanyangF17
Airport ExpresswayF18
Hengshan Forest FarmF19
ZhetangF20
Jiangning Tongshan SubdistrictF21
Table 2. LULC properties and urban spatial form characteristics of AWSs locations in each annular zone.
Annular ZonesNames of the Selected AWSsLand UseZone LevelAvg. Greenery CoverageAvg. Sky View Factor
0~5 kmNanshi Middle SchoolEducationalSub-central60%0.6~0.7
Longjiang Primary SchoolEducationalSub-central40%0.6~0.7
Gulou Vocational SchoolEducationalCentral38%0.4~0.5
Xuanwuhu ParkGreen spaceCentral75%0.9~1
Beijige ParkGreen spaceCentral75%0.9~1
The 9th Middle SchoolEducationalCentral15%0.5~0.6
The 1st Middle SchoolEducationalCentral15%0.4~0.5
Ruijin Residential ComplexResidentialSub-central10%0.5~0.6
Guanghua East StreetResidentialSub-central10%0.5~0.6
5~10 kmTaishan SubdistrictIndustrialSuburban20%0.7~0.8
Pukou Maritime DivisionWater bodiesSuburban00.9~1
Olympic Sports CentreRecreationalSub-central50%0.6~0.7
Zhongshan Botanical GardenGreen spaceSub-central85%0.9~1
XiaojiaochangResidentialSub-central5%0.5~0.6
Zhongshan Golf CourseGreen spaceSub-central75%0.9~1
Nanjing Sport InstituteEducationalSub-central60%0.7~0.8
10~15 kmDingshan TownshipFarm and forestrySuburban15%0.5~0.6
Mingfa Riverside Residential ComplexResidentialSubcentral40%0.5~0.6
Meishan MiningIndustrialSuburban15%0.8~0.9
Xingang PortIndustrialSuburban15%0.8~0.9
Jianshan HillForestrySuburban90%0.9~1
NJ Normal University Xianlin CampusEducationalSuburban70%0.6~0.7
Hohai UniversityEducationalSub-central50%0.7~0.8
International RacecourseRecreationalSuburban45%0.9~1
Jiangning Kylin SubdistrictResidentialSuburban50%0.7~0.8
15~21 kmLaoshan Forestry AreaForestryRural90%0.9~1
Gaoli Primary SchoolEducationalRural50%0.7~0.8
Laoshan MountainForestryRural90%0.6~0.7
Longwang MountainIndustrialSuburban85%0.9~1
PukouResidentialSuburban40%0.5~0.6
Dachang TV TowerIndustrialSuburban50%0.8~0.9
Yanjiang TownshipIndustrialSuburban20%0.6~0.7
Huaneng Power PlantIndustrialRural10%0.8~0.9
Banqiao Steam FerryIndustrialRural40%0.9~1
Qixia Maritime DivisionWater bodiesSuburban30%0.9~1
Dongshanqiao TownshipResidentialRural40%0.7~0.8
Dongshanqiao Primary SchoolResidentialRural40%0.7~0.8
Ring ExpresswayIndustrialRural45%0.8~0.9
NanjingTransportationSuburban40%0.7~0.8
Jiangning Chunhua SubdistrictIndustrialRural25%0.7~0.8
Jiangning Service AreaTransportationSuburban30%0.7~0.8
21~30 kmXiaoqiao SubdistrictFarm and forestryRural85%0.9~1
Tangquan SubdistrictCommercialRural15%0.6~0.7
Xinji SubdistrictResidentialRural50%0.7~0.8
Jiangning Maritime DivisionIndustrialSuburban75%0.9~1
Qiaolin SubdistrictFarm and forestryRural85%0.8~0.9
Yong-Liu ExpresswayIndustrialRural20%0.8~0.9
Chemical Industry ParkIndustrialRural5%0.7~0.8
Guabu TownshipFarm and forestryRural80%0.9~1
Riverside Development ZoneIndustrailSuburban30%0.7~0.8
Ning-Ma ExpresswayFarmRural85%0.9~1
Lulang Huatang VillageFarmRural80%0.9~1
Gongtang CommunityFarmRural90%0.9~1
Zhoutan ResortWetlandRural95%0.9~1
Jiangning Taowu SubdistrictResidentialRural50%0.6~0.7
Jiangning Moling SubdistrictIndustrialSuburban15%0.6~0.7
TangshanFarm and forestryRural80%0.9~1
Shangfeng TownshipFarm and forestryRural80%0.8~0.9
Jiangning Hushu SubdistrictIndustrialRural25%0.8~0.9
Hushu VillageResidentialSuburban50%0.5~0.6
Jiangning Tuqiao VillageResidentialRural80%0.8~0.9
>30 kmNinghe North SlopeFarmRural90%0.9~1
Ning-Lian ExpresswayFarm and forestryRural90%0.7~0.8
Xingdian TownshipResidentialRural60%0.5~0.6
Liuhe Service AreaTransportationRural30%0.7~0.8
Chengqiao SubdistrictResidentialRural50%0.6~0.7
Shiqiao CommunityResidentialRural30%0.5~0.6
Pingshan Post OfficeResidentialRural70%0.7~0.8
North of Chu River BridgeWetlandRural90%0.9~1
Pingshan Forest FarmForestryRural95%0.7~0.8
Wujiang CommunityResidentialSuburban30%0.4~0.5
Babai TownshipResidentialRural60%0.5~0.6
Jinniu Lake Scenic AreaWetlandRural90%0.9~1
Xinhuang TownshipResidentialRural60%0.5~0.6
Donggou TownshipResidentialRural65%0.6~0.7
Damiao VillageResidentialRural80%0.7~0.8
Hengxi Vegetable InstituteResidentialRural70%0.6~0.7
Jiangning Little DanyangResidentialSuburban40%0.5~0.6
Airport ExpresswayTransportationRural70%0.8~0.9
Hengshan Forest FarmForestryRural90%0.7~0.8
ZhetangResidentialRural60%0.6~0.7
Jiangning Tongshan SubdistrictResidentialSuburban40%0.5~0.6
Disclaimer/Publisher’s Note: The statements, opinions and data contained in all publications are solely those of the individual author(s) and contributor(s) and not of MDPI and/or the editor(s). MDPI and/or the editor(s) disclaim responsibility for any injury to people or property resulting from any ideas, methods, instructions or products referred to in the content.

