Article

A Machine Learning-Based Intelligent Framework for Predicting Energy Efficiency in Next-Generation Residential Buildings

by
Hafiz Muhammad Shakeel
1,*,
Shamaila Iram
1,
Richard Hill
1,
Hafiz Muhammad Athar Farid
1,
Akbar Sheikh-Akbari
2,* and
Farrukh Saleem
2
1
Department of Computer Science, University of Huddersfield, Huddersfield HD1 3DH, UK
2
School of Built Environment, Engineering and Computing, Leeds Beckett University, Leeds LS6 3QR, UK
*
Authors to whom correspondence should be addressed.
Buildings 2025, 15(8), 1275; https://doi.org/10.3390/buildings15081275
Submission received: 26 February 2025 / Revised: 3 April 2025 / Accepted: 7 April 2025 / Published: 13 April 2025

Abstract

Improving energy efficiency is a major concern in residential buildings for economic prosperity and environmental stability. Despite growing interest in this area, limited research has been conducted to systematically identify the primary factors that influence residential energy efficiency at scale, leaving a significant research gap. This paper addresses the gap by exploring the key determinant factors of energy efficiency in residential properties using a large-scale energy performance certificate dataset. Dimensionality reduction and feature selection techniques were used to pinpoint the key predictors of energy efficiency. The consistent results emphasise the importance of CO2 emissions per floor area, current energy consumption, heating cost current, and CO2 emissions current as primary determinants, alongside factors such as total floor area, lighting cost, and heated rooms. Further, machine learning models revealed that Random Forest, Gradient Boosting, XGBoost, and LightGBM deliver the lowest mean square error scores of 6.305, 6.023, 7.733, 5.477, and 5.575, respectively, and demonstrated the effectiveness of advanced algorithms in forecasting energy performance. These findings provide valuable data-driven insights for stakeholders seeking to enhance energy efficiency in residential buildings. Additionally, a customised machine learning interface was developed to visualise the multifaceted data analyses and model evaluations, promoting informed decision-making.

1. Introduction

Measuring the energy efficiency of residential buildings is a crucial task that necessitates a wide range of skills and various processes. It is highly important to enable energy efficiency measurement in houses in order to analyse energy performance, improve areas, and ensure compliance. Energy efficiency ratings are an essential part of the energy performance evaluation of residential buildings in the United Kingdom [1]. Ratings should provide information that is conveyed in such a manner that homeowners, policymakers, and other stakeholders are given an informed choice [2]. Over the years, the UK has developed many methods and frameworks [3,4] to standardise the way in which the measurement and reporting of energy efficiency in houses is conducted [5,6].
The implementation of energy-saving improvements in residential buildings achieves significant economic benefits by reducing utility bills and minimising the emissions footprint [7,8]. Lower energy consumption rates reduce the cost of living and decrease energy stress on grid loads [9]. Conventional approaches often fall short of addressing energy efficiency in buildings, possessing several dynamic and complex sets of features [10]. Traditional methods typically rely on linear assumptions and simplified interactions, which can overlook critical non-linear relationships and complex feature interactions inherent in large datasets. These challenges require advanced machine learning techniques to uncover correlations and hidden patterns within energy performance data [11,12,13]. In contrast to traditional methods, machine learning algorithms are capable of modelling non-linear dependencies and complex feature interactions, thereby providing more accurate and robust predictions. Therefore, the implementation of machine learning models in energy efficiency prediction can enhance the effectiveness of energy resource allocation [14]. However, the highly complex interactions of the features within buildings can make the measurement process challenging [15]. Hence, this demands the use of advanced and intricate analytical techniques. Combining machine learning with feature selection together provides very high promises for further improvements in the accuracy and robustness of energy efficiency prediction methods for residential buildings [16,17]. These powerful techniques can mine hidden patterns, model complex interactions, and adapt to changing conditions. Advanced analytics with advanced ML algorithms can play a significant role in achieving objectives for energy efficiency and sustainability [18]. Machine learning techniques have been employed to work effectively when energy data have complex dependencies [19,20]. Prediction models are capable of predicting energy efficiency by identifying gaps within residential feature performance. Predictive models provide effective design and retrofit strategies to improve the energy performance of buildings [21].
In this regard, we employ a mix of traditional and modern machine learning algorithms that are crucial for enhancing energy efficiency due to their capability of analysing large feature sets of data and identifying complex patterns. This diversity of algorithm selection helps to capture multiple aspects of the features’ relationships, leading towards a more robust prediction. Through the analysis of past data on energy performance, algorithms are employed to predict future energy efficiency in order to pinpoint locations where energy savings are required to be achieved in residential buildings. In our study, the use of mix of traditional and modern machine learning algorithms, such as Linear Regression, Support Vector Regression (SVR), Decision Tree, Random Forest, and Gradient Boosting, is encouraged due to their exhibited efficacy in dealing with a wide range of predictors, as well as their different levels of interpretability and complexity. Linear Regression offers a fundamental starting point because of its simplicity and straightforward interpretation. On the other hand, non-linear models like Support Vector Regression (SVR) and Decision Tree are capable of capturing intricate inter-relationships within the data. Ensemble approaches, such as Random Forest and Gradient Boosting, boost predictive performance by amalgamating many models to mitigate overfitting and enhance accuracy.
This study aims to comprehensively analyse the key features that contribute to energy efficiency, performance, and evaluation using selected machine learning models for the energy efficiency prediction of residential buildings. After performing thorough experiments and analysing the performance of the features, we sought to investigate the following research questions: (1) How does the performance of key predictors vary across traditional and modern models? (2) How does the performance of classical ML models (Linear Regression, Decision Tree, and SVR) compare to modern ensemble models (Random Forest, extra trees, Gradient Boosting, XGBoost, and LightGBM) for the prediction of energy efficiency? (3) Do ensemble models sustain their higher predictive performance over traditional models when applied to large data? This research has the following objectives to address and achieve the aim of the study:
  • To identify and quantify the key house features across traditional and modern models that significantly impact energy efficiency;
  • To rigorously evaluate the predictive performance and scalability of traditional and modern models in the context of large datasets;
  • To assess the robustness of models and address any biases that can affect the analysis.
The structure of this article is as follows: Section 1 presents an introduction to the importance of ML algorithms in the calculation of residential building energy efficiency. Section 2 explores a literature review related to the key models and techniques implemented in the measurement of building energy performance. Section 3 describes the methodology by providing an overview of the dataset, employing a thorough feature selection approach to identify the most valuable features and select the ML models. Section 4 presents the results across the key features that contribute to energy efficiency in residential buildings and presents an analysis of the performance and evaluation of selected machine learning models for energy efficiency prediction of residential buildings. Section 5 explains the theoretical and practical implications. Section 6 concludes the methodology and findings of this research.

2. Related Work

The global energy consumption from buildings, particularly residential structures, is increasing. Enhancing energy efficiency in this sector is vital for advancing sustainability and improving quality of life [22,23]. Energy efficiency rating measurement is a critical component in assessing the energy performance of residential buildings. Ratings provide information in a manner that enables homeowners, policymakers, and other stakeholders to make well-informed decisions. The UK has employed several techniques to provide uniform procedures for measuring and reporting energy efficiency in residential buildings throughout time [1,3,5,6]. Energy-efficient buildings offer enhanced comfort and a better health environment for those within such households. Modern HVAC systems and enhanced insulation provide sustainable indoor temperatures with better air quality [24]. This literature review examines the primary techniques and frameworks implemented to predict energy efficiency in buildings, specifically emphasising feature selection techniques and machine learning models.
The following are the key techniques and methods currently employed to measure energy efficiency in residential buildings. energy performance certificates (EPCs) are mandatory for all buildings at the time of construction in the UK [25,26]. The Standard Assessment Procedures (SAPs) methodology [1] is the most common type of methodology applied to measure energy performance in a house [1]. RdSAP is another methodology; it has been implemented on a smaller amount of input data and with the entire SAPs methodology [27]. RdSAP becomes highly beneficial in producing EPCs in existing dwellings, where producing a total SAPs rate is not viable. The Building Energy Rating (BER) is used in the Republic of Ireland to measure the energy performance possible for a house [28]. The Passive House Standard is used for building energy efficiency to improve insulation, airtightness, and ventilation systems within buildings [29]. Leadership in Energy and Environmental Design (LEED) is another tool for calculating a building’s energy and environmental performance [30]. Smart meters and home energy monitoring systems provide real-time data for the occupants to be able to manage energy use in an optimised manner [31]. The Building Research Establishment Environmental Assessment Method (BREEAM) is a well-recognised assessment technique for commercial buildings [32].
Machine learning algorithms have been extensively employed in predicting energy consumption and evaluating the energy performance of buildings. The following are published studies that have utilised machine learning techniques. The authors of [33] employed Linear Regression to assess the impact of various building features on energy performance. In refs. [34,35], where residential energy consumption was predicted using KNN for the construction of historical energy usage and characteristic patterns, especially when the dataset included complex and irregular structures. A similar piece of work [36] on predicting energy-saving using retrofit measures in residential buildings, as well as an energy consumption dataset with two different cases of before and after retrofit energy usage, correctly showed KNN to be suitable for predicting energy-saving potential states from different retrofit interventions. SVR was employed in [37] to model energy performance in residential buildings under heterogeneous data features driving each building, linked to meteorological conditions, building materials, and occupancy patterns. Another study [38] used Decision Tree to predict energy consumption to enhance energy efficiency within buildings. The numerical statement in this research stated historical energy consumption data and building characteristic data, whereby Decision Tree can predict critical energy-saving areas effectively. Ref. [39] demonstrated that Random Forest performs well in energy consumption prediction tasks based on information about building size, insulation type, and patterns of occupancy. They revealed that RF could capture the complex relationships between input features and the energy applications needed for accurate energy use prediction. Similarly, the authors of [40] used RF to predict energy demand using historical consumption data and the building characteristics in the dataset. Gradient Boosting in [41] was used to predict commercial buildings’ energy consumption by considering a building’s design, occupancy pattern, and weather conditions. A conclusion was drawn that Gradient Boosting establishes better forecasting accuracy than other approaches available to date in this field.
There are published studies comparing the prediction performances of various machine learning models in the Table 1. Comparative analysis studies on multiple machine learning algorithms relating to the prediction of energy performance have been published [14,42]. Ref. [43] introduced three machine learning-based prediction frameworks that aim to anticipate several energy loads simultaneously. Ref. [44] presents a comprehensive analysis of the four primary machine learning techniques used in forecasting and enhancing building energy performance: artificial neural networks, Support Vector Machines, Gaussian-based regressions, and clustering. Ref. [12] introduced a range of machine learning approaches that can improve the accuracy and efficiency of energy models by thoroughly demonstrating the construction of energy models utilising extreme Gradient Boosting (XGBoost), artificial neural network (ANN), and degree-day-based ordinary least square regression. Ref. [45] presents a taxonomy of the predominant machine learning techniques employed for predicting energy consumption, which were based on the features of buildings. The study also offers a comparative examination of several ML algorithms in terms of how they contribute to predicting energy use.

3. Methodology

3.1. Description of Dataset

The dataset was collected from the Department of Levelling Up, Housing, and Communities in the United Kingdom [47]. This is an extensive dataset of housing energy performance, and we investigated the performance of houses, particularly, in the area of York, United Kingdom. The York dataset has 49,959 observations (rows) and 92 features (columns). The dataset consists of all the house features that are required to calculate the energy performance of a house. It covers the following wide range of features that contribute towards energy efficiency: energy consumption performance, CO2 emissions performance, cost analysis, water consumption analysis, houses structural components that are important for measuring energy efficiency, and energy performance certificate rating. Table 2 and Table 3 classify the key attributes in the dataset.

3.2. Feature Transformation

The following number of steps using proposed framework in the Figure 1 were taken to clean and prepare the dataset to ensure the data are consistent and accurate.

3.2.1. Handling Missing Data

The original dataset had several missing data points. The following approach was implemented to deal with the missing values; the missing values were replaced with the median values in order to maintain the distribution of the data. In the case of categorical features, missing values were imputed with the mode values. This approach ensures that the selected imputation did not significantly skew the distribution of the data.

3.2.2. Handling Duplicates

Redundant observations were excluded to prevent repeating information. By filtering out the inaccurate values, the number of observations (rows) was reduced. The dataset was refined from 49,959 rows to 36,534 rows, assuring the inclusion of the most important features and observations.

3.2.3. Normalisation

The dataset was normalised using Min-Max scaling [48], which enables an effective comparison and improves the effectiveness of the machine learning models. The following is the formula that was used:
X norm = X X min X max X min
where X represents the original value,  X min  represents the minimum value, and  X max  represents the maximum values of the feature, respectively. This scaling process results in the conversion of numerical features ranging between 0 and 1.

3.2.4. Standardisation

Following normalisation, the dataset was standardised [19] in order to rescale a mean of zero and a standard deviation of one. The equation of standardisation is as follows:
X standard = X μ σ
where  μ  represents the average value of the feature, and  σ  represents the standard deviation. This is crucial for models to perform assumptions about the features of a Gaussian distributed dataset.

3.2.5. Encoding Categorical Variables

We employed a label encoding method to encode the categorical features into numerical features. This encoding method [49] preserves the inherent sequence of the features. In the dataset, the categorical features, which have a range between ‘Very Good’, ‘Good’, ‘Average’, ‘Poor’, and ‘Very Poor’, describe the highest ratings to the lowest ratings. The numerical values are assigned to each data point uniformly distributed between 0 and 1, demonstrating the relative logical ranking of the ratings.

3.3. Features Classification

The house’s key features were categorised into four main groups: Building Description, Energy Performance, Environmental Factors, and Cost. The description of each category is provided below.

3.3.1. Building Components

The characteristics of building structures offer crucial insights into the influence of energy performance and the feasibility of enhancing energy efficiency. The characteristics of construction age, floor size, and the number of heatable and heated rooms give crucial data on the material, design, and age of the structure. This information is vital for assessing thermal efficiency and insulation levels. The tenure function provides crucial information regarding the ownership of the building, which is essential for implementing energy-efficient activities. The kind of property and its constructed characteristics provide information about the construction of dwellings, which may help determine the amount of heat lost through roofs and walls. The discussion revolves around the heat loss and distribution variables in multi-story buildings, specifically focusing on the flat level and its count aspects. The unheated corridor feature can reveal the channels through which air leakage occurs.

3.3.2. Energy

Current energy consumption refers to the amount of energy that a specific residence consumes on average in a year. The energy consumption feature measures the precise amount of energy used and is a crucial factor that directly affects the energy efficiency of buildings. The energy rating is a crucial aspect in measuring energy efficiency, as it indicates the level of energy performance for buildings. Our main focus is on energy efficiency, which is measured using a detailed numerical score. The major feature serves as an indicator of the performance of other building characteristics and identifies areas that provide an opportunity for further improvement. These energy characteristics offer a thorough depiction of the energy profile of buildings. The energy efficiency attributes provide a description of the efficiency and effectiveness of each corresponding feature.

3.3.3. Environmental Factors

The features of the environment are vital because they serve as the primary factor in determining energy efficiency. Environmental impact assesses the environmental effectiveness of a certain dwelling. The present levels of CO2 emissions and the amount of CO2 emitted per unit of floor space are important elements that directly impact the evaluation of a property’s energy efficiency. The environmental performance of a building is also monitored by using other components. Additionally, these qualities serve as important indicators of a house’s carbon impact. This would encompass the comprehensive depiction and effectiveness evaluation of different building elements, such as lighting, windows, the roof, and floors.

3.3.4. Cost

This provides a comprehensive breakdown of the expenses associated with different architectural elements, such as lighting, heating, and hot water. The cost features offer a clear understanding of the financial consequences. The expenditures are linked to hot water, heating, and lighting on a yearly basis. Consequently, these characteristics have an impact on the assessment of the energy efficiency of a dwelling.

3.4. Features Selection Process

We employed a thorough feature selection approach to identify the most valuable features and enhance the performance of machine learning models, as can be seen in Figure 2. We utilised a blend of filter, wrapper, and embedding techniques to evaluate the significance of features across several assessments. Correlation analysis and mutual information were employed to investigate both linear and non-linear correlations between independent characteristics and the target feature. In addition, we utilised tree-based models such as Random Forest and Gradient Boosting, which are recognised for their intrinsic feature significance metrics, to prioritise features according to their impact on prediction accuracy. Moreover, we utilised principal component analysis (PCA) to discover the primary components that encapsulate the main variations in the dataset. Ultimately, we enhanced our selection procedure by employing Recursive Feature Elimination (RFE) and LASSO Regression. These methods systematically delete less significant features by considering their coefficients. By employing a multifaceted strategy, we were able to carefully choose a comprehensive collection of features to optimise the performance of the model while simultaneously reducing the risk of overfitting and computational complexity.

3.5. Feature Analysis Techniques

This work utilises filter methods, such as correlation and mutual information, wrapper methods, such as Random Forest and Gradient Boosting, and an embedding approach, namely dimensionality reduction, to determine the most important features that significantly impact the computation of energy efficiency in residential premises. In the context of energy efficiency, we examined each of the following techniques.

3.6. Principal Component Analysis (PCA) Algorithm

Principle component analysis (PCA) is a method used to identify the linear combination of the original characteristics, known as principle components (PCs). These components account for the majority of the variability in the dataset. PCA is used to convert the multiple features in the energy efficiency dataset into a smaller number of principal components (PCs). Each PC is a composite of actual features, with each feature being assigned a weight. The size of each weight determines the level of attention placed on energy efficiency calculations [50].

Mathematical Model

PCA rescales the dataset to standardise the mean and normal deviation. The process involves obtaining the covariance matrix of a standardised dataset, calculating the eigenvalues and their associated eigenvectors of the covariance matrix and forming principal components. The eigenvalues are ordered in decreasing order, and their corresponding eigenvectors are selected.
The covariance matrix  C  of the dataset  X  is given by
C = 1 n 1 X X
where n is the number of observations, and  λ  and the vector  v  are the eigenvalues and eigenvectors for that personality.
C v = λ v

3.7. Correlation Analysis

Correlation analysis quantifies the extent to which each independent feature is related to a target feature. Thus, it entails quantifying the correlation coefficients of crucial aspects in the examination of energy efficiency. The Pearson correlation coefficient that we employed runs from  1  (indicating negative values) to 1 (indicating positive values), where a value of 0 signifies no linear connection [51].

Mathematical Model

The Pearson correlation coefficient, expressed by  ρ  or r, is the measure of the correlation between two variables, X and Y. The formula for the Pearson correlation coefficient is given by
r = i = 1 n ( X i X ¯ ) ( Y i Y ¯ ) i = 1 n ( X i X ¯ ) 2 i = 1 n ( Y i Y ¯ ) 2
where
  • X i  and  Y i  are the sample points for the individual;
  • X ¯  and  Y ¯  are the means;
  • n is the number of observations.

3.8. Mutual Information Algorithm

Mutual information decreases the level of uncertainty regarding one variable when the information of another variable is taken into account. MI calculates the combined probability distribution of the distinct features and the target feature [52].

Mathematical Model

Mutual information for two discrete random variables is defined between X and Y as
I ( X ; Y ) = x X y Y p ( x , y ) log p ( x , y ) p ( x ) p ( y )
where
  • p ( x , y )  is the joint probability distribution function of X and Y;
  • p ( x )  and  p ( y )  are the marginal probability distribution functions of X and Y, respectively.
In continuous variables, the estimation of MI varies through the density estimation carried out by the kernel or by some other numeric methods [3].

3.9. Recursive Feature Elimination (RFE)

RFE operates in a retrogressive fashion by removing aspects. The process begins by training the whole collection of features from the dataset and evaluating the significance of each feature based on the model’s parameter performance. It eliminates the least significant characteristic while preserving the most significant features [53].

Mathematical Model

Mathematically, let  F = { f 1 , f 2 , , f n }  be the set of all features, and let  M  be the machine learning model. The goal of RFE is to find the optimal subset of features  F * F  that minimise model error.
F * = arg min F F L ( M ( F ) )
where  L  is the loss function, and  M ( F )  is the model trained on a subset of the features  F .

3.10. Least Absolute Shrinkage and Selection Operator (LASSO)

LASSO regression incorporates a regularisation term into the ordinary least squares (OLSs) function of the objective. The penalty is directly related to the absolute value of the coefficient in the model. The penalty can be modified by parameter regularisation, resulting in a significant reduction in the coefficients towards zero [54].

Mathematical Model

min β 0 , β 1 2 n i = 1 n ( y i β 0 j = 1 p β j x i j ) 2 + α j = 1 p | β j |
where
  • y i  is the dependent variable;
  • x i j  are the independent variables;
  • β 0  is the intercept;
  • β j  are the coefficients of the model;
  • n is the number of observations;
  • p is the number of features;
  • α  is the regularisation parameter.

3.11. Random Forest Algorithm

The Random Forest model operates by combining many Decision Trees into an ensemble. Every tree is trained using a random selection of parameters and the available data. By including randomisation, this technique mitigates overfitting and improves the model’s performance. The ultimate result is achieved by aggregating individual trees through the process of averaging [55].

Mathematical Model

Random Forest is an approach in which base trees are learned from bootstrapped samples  { h 1 ( X ) , h 2 ( X ) , l o t s , h N ( X ) } . Moreover, each tree is trained using the sample derived from resampling the dataset; however, during training, predictive variables are chosen randomly to grow said trees. The prediction using Random Forest is given as the average of all the trees:
Y ^ = 1 N i = 1 N h i ( X )
where  h i ( X )  is the prediction of the i-th tree, and N is the total number of trees.

3.12. Gradient Boosting

Gradient Boosting models operate in an iterative manner. At each iteration, a subset of the Decision Tree is generated and trained to forecast the mistakes (residuals) of the previous model. Once all forecasts had been completed, we merged the findings to generate the ultimate singular forecast for the model. This iterative forecasting procedure occurs until the model successfully identifies the precise collection of traits that serve as the primary predictors [56].

Mathematical Model

Gradient Boosting works by sequentially building trees of decisions in which individual trees correct the residuals of those constructed previously. The general form of the prediction function  F m ( x )  at the m-th stage is
F m ( x ) = F m 1 ( x ) + ν h m ( x )
wherein
  • F m 1 ( x )  is the forecast from the  ( m 1 ) -th iteration;
  • h m ( x )  is the m-th Decision Tree;
  • ν  is the learning rate, which helps in applying the regularisation parameter, scaling the contribution of each tree.

3.13. Model Selection

In this study, we employed a mix of traditional and modern machine learning algorithms crucial for enhancing energy efficiency due to their capability to analyse large feature sets of data and identify complex patterns. This diversity of algorithm selection helped to capture multiple aspects of the features’ relationships, leading toward a more robust prediction. Through the analysis of past data on energy performance, algorithms were employed to predict future energy efficiency in order to pinpoint locations where energy savings were required in residential buildings. In our study, the use of a mix of traditional and modern machine learning algorithms, such as Linear Regression, Support Vector Regression (SVR), Decision Tree, Random Forest, and Gradient Boosting, was encouraged due to their exhibited efficacy in dealing with a wide range of predictors as well as their different levels of interpretability and complexity. Linear Regression offers a fundamental starting point due to its simplicity and straightforward interpretation. On the other hand, non-linear models like Support Vector Regression (SVR) and Decision Tree are capable of capturing intricate inter-relationships within the data. Ensemble approaches, such as Random Forest and Gradient Boosting, boost predictive performance by amalgamating many models to mitigate overfitting and enhance accuracy. Therefore, we examined a diverse range of regression models for predicting the Current Energy Efficiency of residential buildings. We investigated both linear and non-linear models to estimate the predictive capability of different classifiers.

3.14. Linear Regression

Linear Regression is a statistical method that finds the straight line that best fits the relationship between variables. It operates by reducing the total of the squared discrepancies between the predicted and observed levels of energy efficiency. When analysing energy efficiency features, Linear Regression may be employed to approximate the weights of the coefficients linked to each independent factor. This assessment quantifies the individual impact of each independent variable on the dependent feature of energy efficiency [57].

Mathematical Model

This is basically the mathematical form of the Linear Regression model:
Y = β 0 + β 1 X 1 + β 2 X 2 + + β n X n + ϵ
where
  • Y is the dependent variate;
  • X 1 , X 2 , , X n  are the independent variables;
  • β 0  is the constant.  β 1 , β 2 , , β n  are the coefficients of the error term,  ϵ .

3.15. k-Nearest Neighbors (KNNs) Algorithm

The KNN algorithm is a simple, non-parametric, instance-based learning approach to classification and regression. In the current study, the application of KNN was carried out to predict the future trend of energy efficiency and categorise possible areas of potential energy savings in residential buildings [58].

Mathematical Model

The KNN algorithm predicts the value of a new data point by surveying the k-nearest samples in the training set and averaging over the responses of the training samples in the case of regression or using simple votes for the most frequent class in the case of classification. The most popular choice for this measure is Euclidean distance:
d ( x i , x j ) = k = 1 n ( x i k x j k ) 2
where  x i  and  x j  are two samples of feature space.

3.16. Decision Tree

The Decision Tree algorithm is a non-parametric supervised learning method for classification and regression. It models decisions and their possible consequences, represented as a tree-like graph. In this study, Decision Tree was used for modelling and prognosticating future energy efficiencies, finding the potential areas of power savings [59].

Mathematical Model

A Decision Tree splits the data into subsets based only on the value of input features and forms branches out of them, ultimately leading to the final prediction decision at the leaf nodes. These splits are made using criteria like Gini impurity, Information Gain for choices in classification tasks, or Mean Squared Error in regression.

3.17. Support Vector Regression (SVR)

SVR works for both linear and non-linear regression performance and is a type of support vector machine. It finds the function that, when predicted from the SVR, strays from the actual observed targets by no more than a specified margin [60].

Mathematical Model

SVR tries to get hold of a linear function  f ( x )  such that the predicted value deviates by, at most,  e p s i l o n  from the actual value. The form of the function is shown as
f ( x ) = w · x + b
Formulate the optimisation problem:
min w , b 1 2 w 2 + C i = 1 n ξ i
y i ( w · x i + b ) ϵ + ξ i ( w · x i + b ) y i ϵ + ξ i ξ i 0
where  ξ i  denotes the slack variables that quantify the error, and C is a regularisation parameter.

3.18. Random Forest Algorithm with Extra Trees

Random Forest with extra trees can improve the prediction performance of a regular RF model by including the concept of extremely randomised trees. Therefore, the optimal subset of features for each tree is selected randomly. This reduces the chances of unpredictability by minimising overfitting. This technique decreases the variance of the model without increasing bias, offering robust predictions [61].

3.19. XGBoost and LightGBM

Extreme Gradient Boosting (XGBoost) and Light Gradient Boosting Machine (LightGBM) are two advanced ensemble learning models that have demonstrated exceptional performance in prediction accuracy. They have shown outstanding performance on large and complex datasets with multiple sets of features. Both models construct trees sequentially, where each new tree operates to fix the errors of its predecessor [62].

3.20. Hyperparameters Tuning

A systematic hyperparameter tuning strategy was employed to optimise model performance. We employed grid search, which is a systematic way of tuning hyperparameters; it moves through every combination of a specified set of given hyperparameters. Therefore, through cross-validation results, the assurance that the selected hyperparameters will return the best model performance is obtained. The best hyperparameters tuned for each model can be seen in Table 4.

3.21. Model Evaluation

A comprehensive list of multiple evaluation metrics was used to evaluate the performance of the regression model.

3.21.1. Mean Squared Error (MSE)

MSE = 1 n i = 1 n ( y i y ^ i ) 2
MSE measures the average squared difference between the actual and predicted values, providing a sense of the magnitude of the errors. Lower MSE values indicate better model performance.

3.21.2. Mean Absolute Error (MAE)

MAE = 1 n i = 1 n | y i y ^ i |
MAE computes the average of the absolute differences between actual and predicted values, offering a straightforward measure of prediction accuracy.

3.21.3. Root Mean Squared Error (RMSE)

RMSE = 1 n i = 1 n ( y i y ^ i ) 2
RMSE provides an error measure in the same units as the target variable and places greater emphasis on larger errors due to the squaring of differences.

3.21.4. R-Squared (R2)

R 2 = 1 i = 1 n ( y i y ^ i ) 2 i = 1 n ( y i y ¯ ) 2
R-squared represents the proportion of variance in the dependent variable that is predictable from the independent variables. Higher values indicate better model performance.

3.21.5. Mean Absolute Percentage Error (MAPE)

MAPE = 1 n i = 1 n y i y ^ i y i × 100
MAPE expresses prediction accuracy as a percentage, making it scale-independent and useful for comparing models across different scales.

3.21.6. Adjusted R-Squared (Adjusted R2)

Adjusted R 2 = 1 1 R 2 n 1 n p 1
Adjusted R-squared adjusts the R-squared value based on the number of predictors, providing a more accurate measure of model performance, especially when multiple predictors are involved.

3.22. Cross-Validation

K-fold cross-validation was employed to ensure a robust model evaluation. Cross-validation is a resampling technique used to evaluate models on a limited sample of data. k is the number of groups to divide a given data sample. In order to achieve this aim, cross-validation is performed for multiple rounds (specifically, 3, 5, 7, and 9) to examine whether model performance remains stable across various data partition points. The process is iterated k times, with each k-fold executed precisely.

4. Results

This section presents the results across the key features that contribute most to the prediction of energy efficiency in residential buildings. This section also presents an analysis of the performance and evaluation of selected machine learning models for the energy efficiency prediction of residential buildings. These models include Linear Regression, Random Forest, Gradient Boosting, k-nearest Neighbours (KNNs), Decision Tree, and Support Vector Regression (SVR). Through the use of these results, we evaluated performance metrics that effectively approximate the ability to forecast energy efficiency for actionable insights about energy savings.

4.1. Key Features

The results of the comparative features ranking of the feature selection techniques in Table 5 reveal distinct trends and insights regarding the significance of independent features in predicting the target feature. The visual analysis in Figure 3 involves the use of multiple techniques, such as correlation, Linear Regression, principal component analysis (PC1), mutual information, recursive feature deletion, LASSO, Random Forest, and Gradient Boosting. The study reveals that various techniques prioritise features differently based on their distinct methodologies. For instance, CEPFA has a significantly high negative correlation ranking, indicating a strong relationship with energy efficiency. Simultaneously, CEPFA is also consistently identified by RF, GB, and MI as a robust predictor in those non-linear models.
Linear Regression and LASSO exhibit similarities at the highest level in terms of their linearity; however, they differ slightly because of the additional regularisation impact of LASSO. For instance, if a Linear Regression model ranks TFA as the most important feature, LASSO would emphasise ECC to a greater extent. This disparity demonstrates the impact of regularisation on the significance of features. Additionally, it was discovered that Recursive Feature Elimination (RFE), a method that iteratively removes the least significant features, and mutual information, a metric for assessing the reliance between variables, both highlight the importance of CEPFA and ECC. This concordance demonstrates the convergence of methodologies in determining the relative relevance of different features. Principal component analysis (PCA), specifically PC1, is inclined towards Lighting Energy Efficiency (LEE) and Lighting Environment Efficiency (LENE). These factors are closely associated with the variability of the data in the dataset, distinguishing PCA from other approaches that primarily prioritise predictive accuracy.

Analysis of Key Feature Contributions

The following key contributions of different critical features towards target feature prediction in each model were computed using feature importance scores.
Principal Component Analysis (PCA):
The presence of LEL, LENE, and LEE as significant factors suggests that they play a crucial role in accounting for the variation in energy performance. These characteristics are categorical and do not contribute to the variance covered by PC1. Following ECC, CEC, and CEPFA, the primary factors that contribute to the variation reflected by PC were identified.
Correlation Analysis:
The following features show strong positive correlations: HWEE, HWEVE, and MHEE have a strong positive relationship with the energy efficiency of houses. The features that show strong negative correlations are CEPFA, ECC, CEC, and HCC. These give a negative correlation, and therefore, enhancement can improve energy performance. The features which show moderate correlations are HWCC and WENE. These show a moderate positive correlation. The features which show weak correlations are LEL, LEE, and NHR. The features which have a negligible correlation with the target feature are NAR, TFA, and LCC. These results bind critical features that have a significant impact on the energy efficiency of houses, which, in turn, can be used to inform future predictive modelling efforts and strategies for energy saving.
Linear Regression Analysis:
The regression coefficients indicate the magnitude and direction of the impact each feature has on the energy performance of residential buildings. Key observations include the following: TFA has a strong positive impact on energy efficiency, suggesting that larger buildings tend to have better energy efficiency. MHEE is positively correlated, indicating that higher energy efficiency in specific areas contributes positively. LCC also shows a positive impact, implying that investments in efficient systems may enhance overall energy performance. LEL has a smaller positive impact; HWCC has a significant negative impact, indicating higher costs reduce performance. NAR also negatively impacts performance. HCC has a strong negative impact, showing high costs reduce energy performance. CEPFA indicates a significant negative impact. CEC and ECC show the strongest negative impacts, indicating that high costs in these areas significantly detract from energy performance.
Mutual Information: Mutual information captures the most relevant features influencing energy performance, with scores for CEPFA, ECC, CEC, and HCC. These are the most influential features in the energy efficiency of residential buildings.
Recursive Feature Elimination (RFE): RFE captures the following features: ECC, CEC, CEPFA, HCC, TFA, and NAR. These are the most pertinent features that contribute to the predictive power of the model, as determined by iteratively eliminating the most minor important features.
Least Absolute Shrinkage and Selection Operator (LASSO):
LASSO provides a slightly different subset of features, including ECC, CEC, LEL, and HWEE. LASSO has added an L1 penalty to the regression model, and it not only reduces the complexity of the model but also ensures some of the coefficients are shrunk exactly to zero.
Random Forest: CEPFA has the highest importance score, meaning it was the most important feature driving the predictions. CEC and HCC receive a very high score of importance, reflecting their relevance in this model.
Gradient Boosting: The highest importance score is assigned to CEPFA. CEC, HCC, and ECC, showing that the importance grades of these features closely mirrored the aspects observed for Random Forest.

4.2. Model Performance

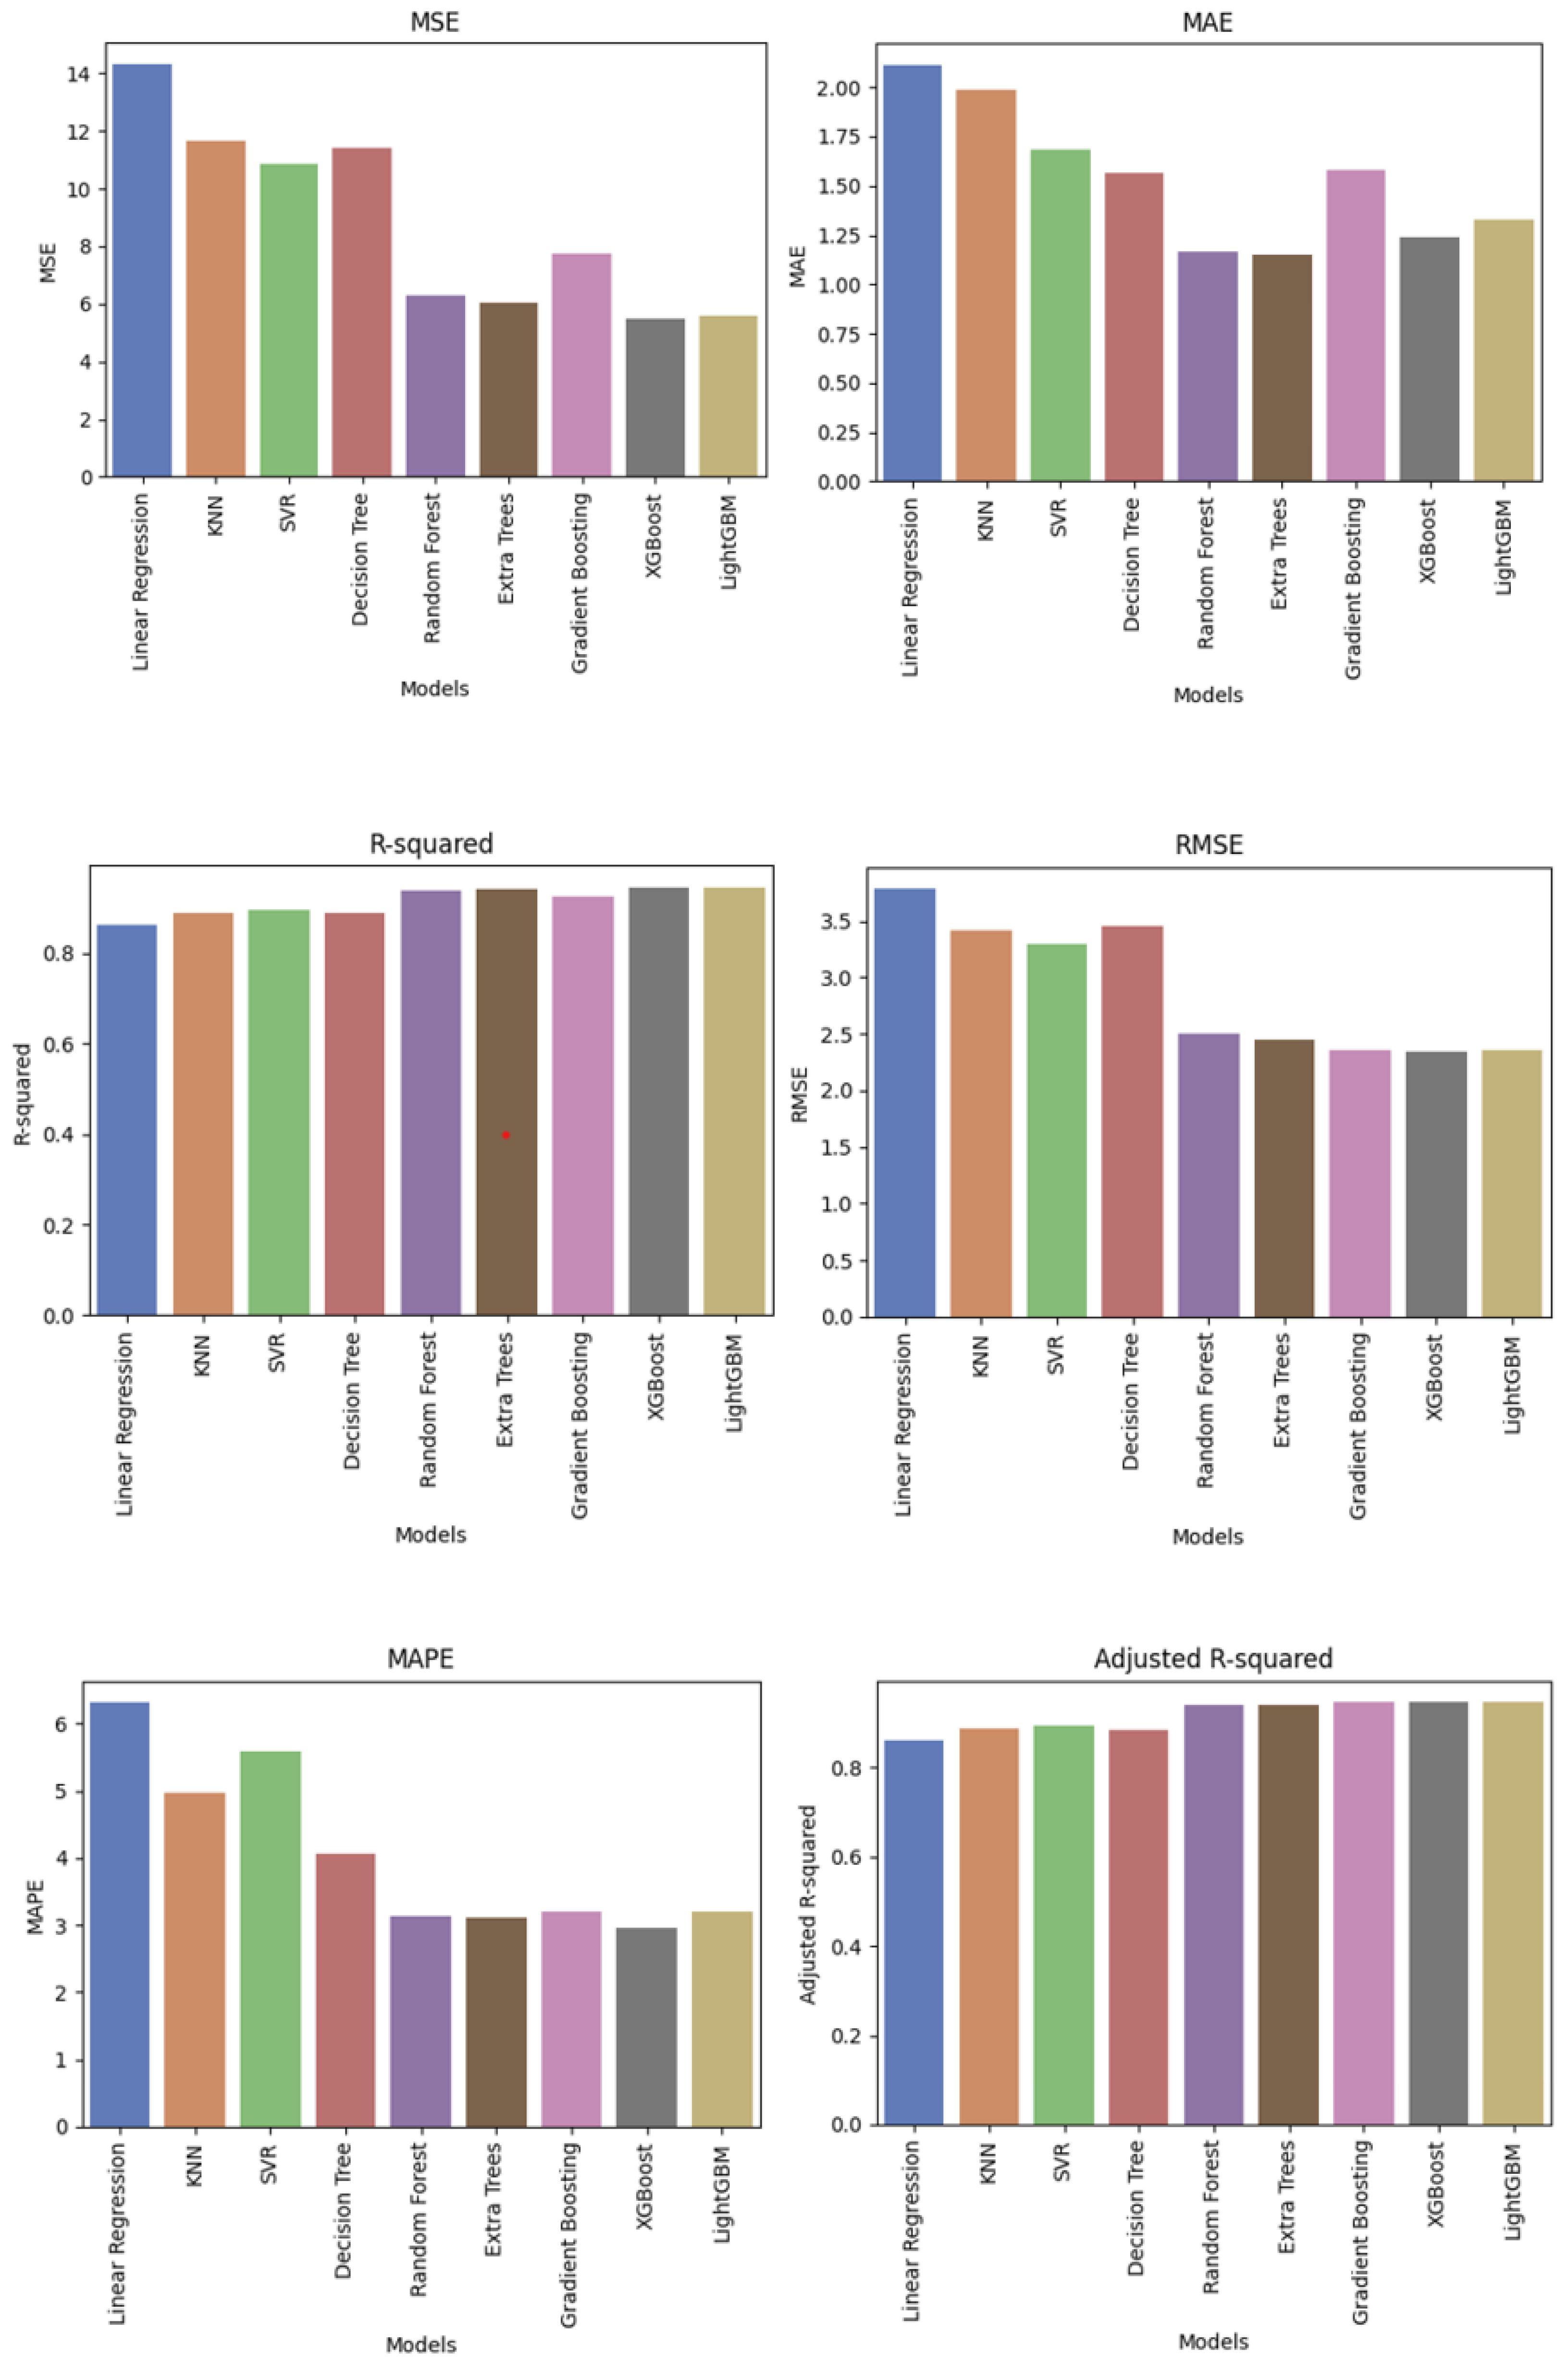
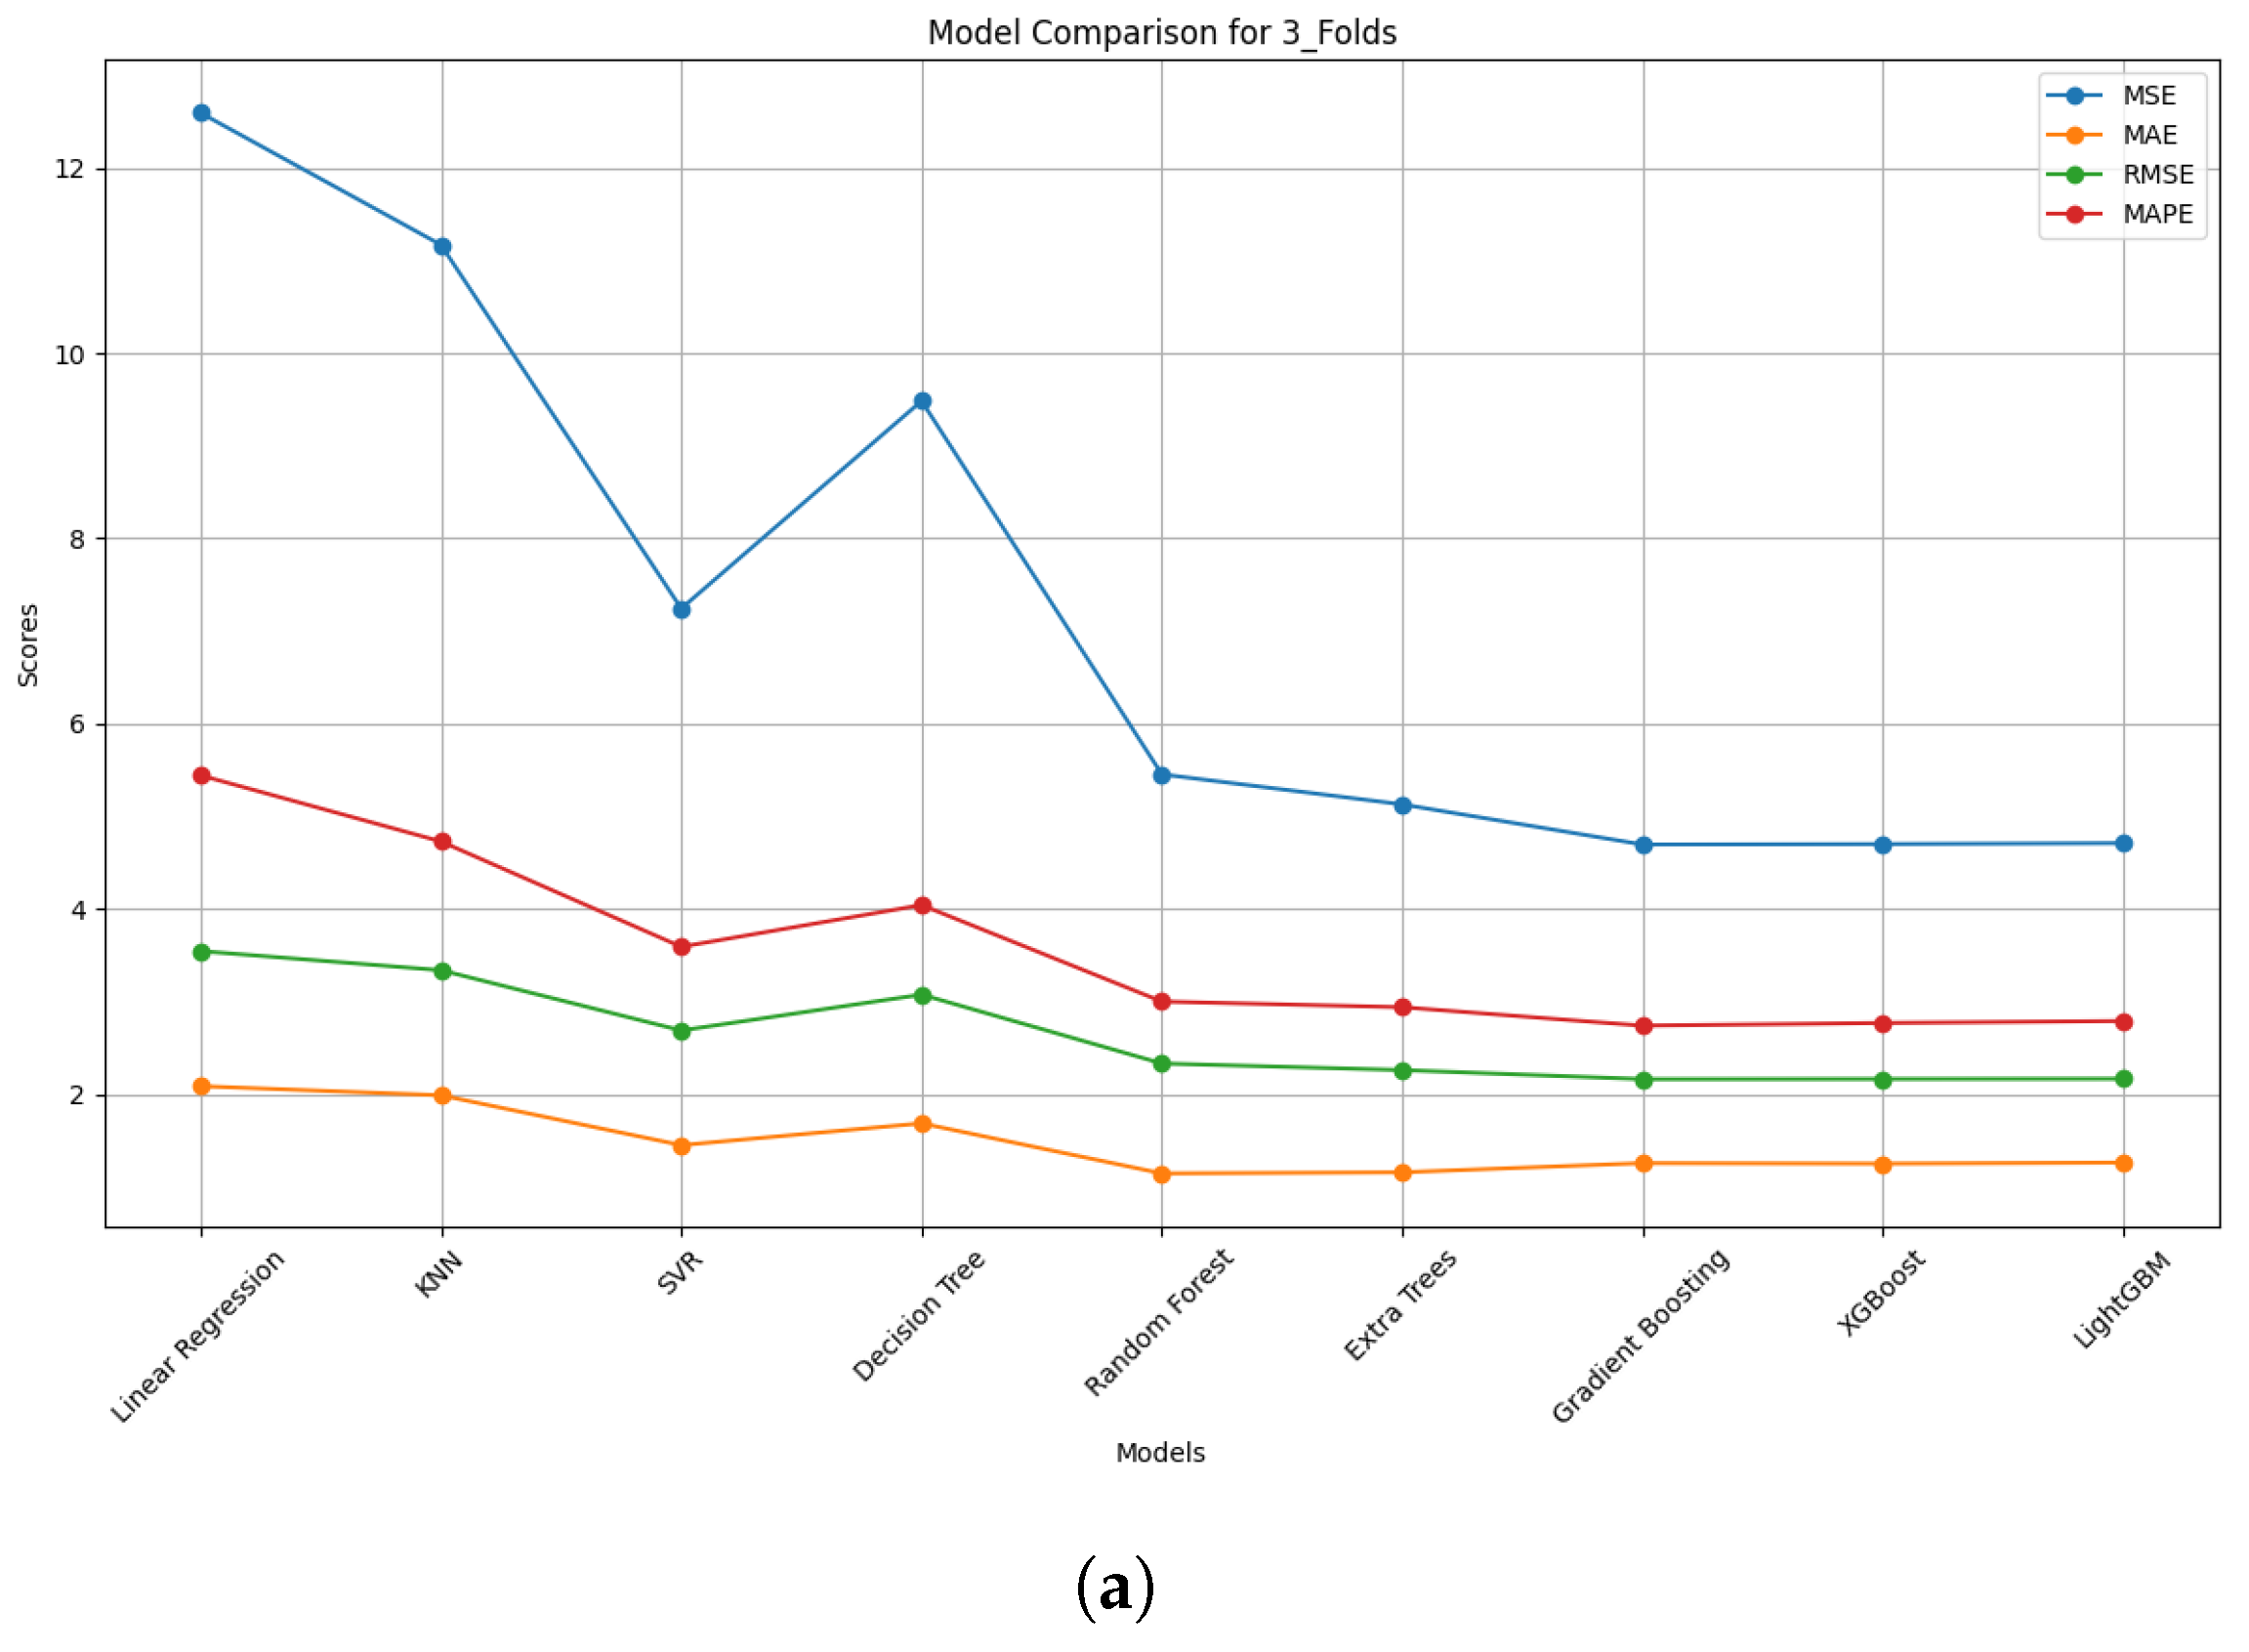
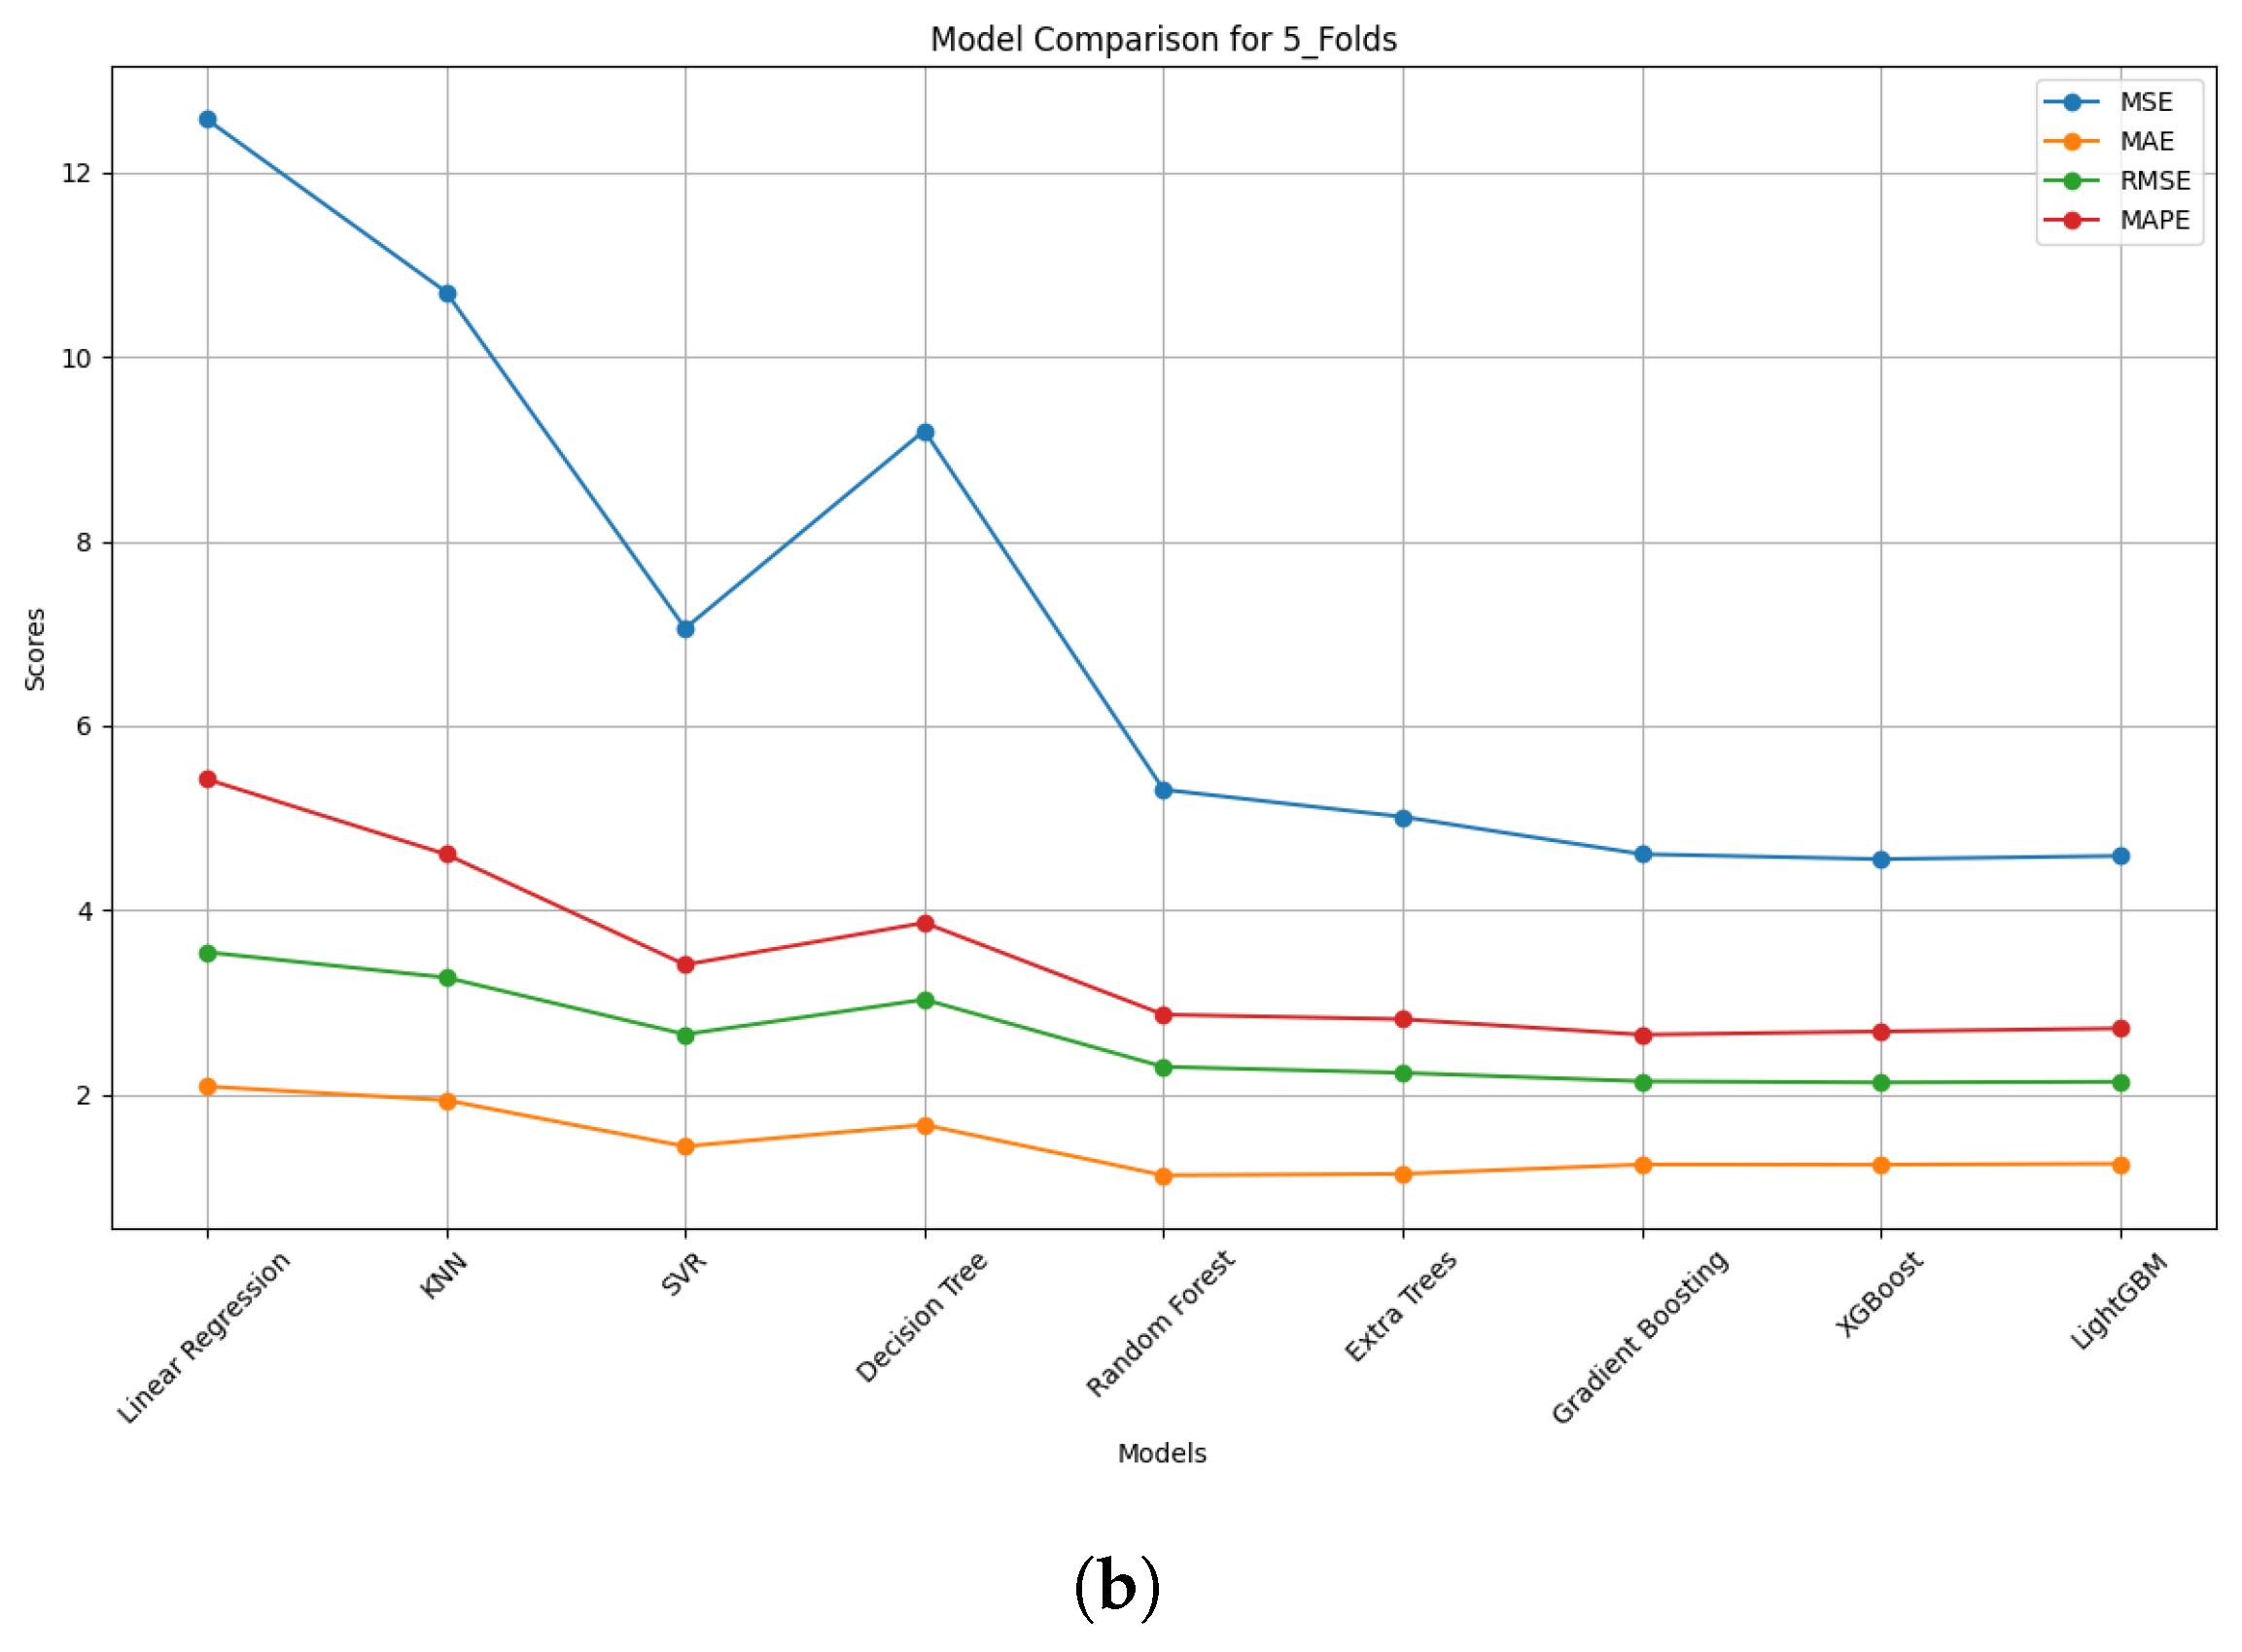
4.2.1. Performance Metrics

Figure 4 exhibits the performance metrics of the models, comprising Mean Squared Error (MSE), Mean Absolute Error (MAE), R-squared (R2), Root Mean Squared Error (MSE), Mean Absolute Percentage Error (MAPE), and adjusted R-squared (Adjusted R2), with their best hyperparameters; this can be seen in Table 4, and these were calculated by the models during tuning.

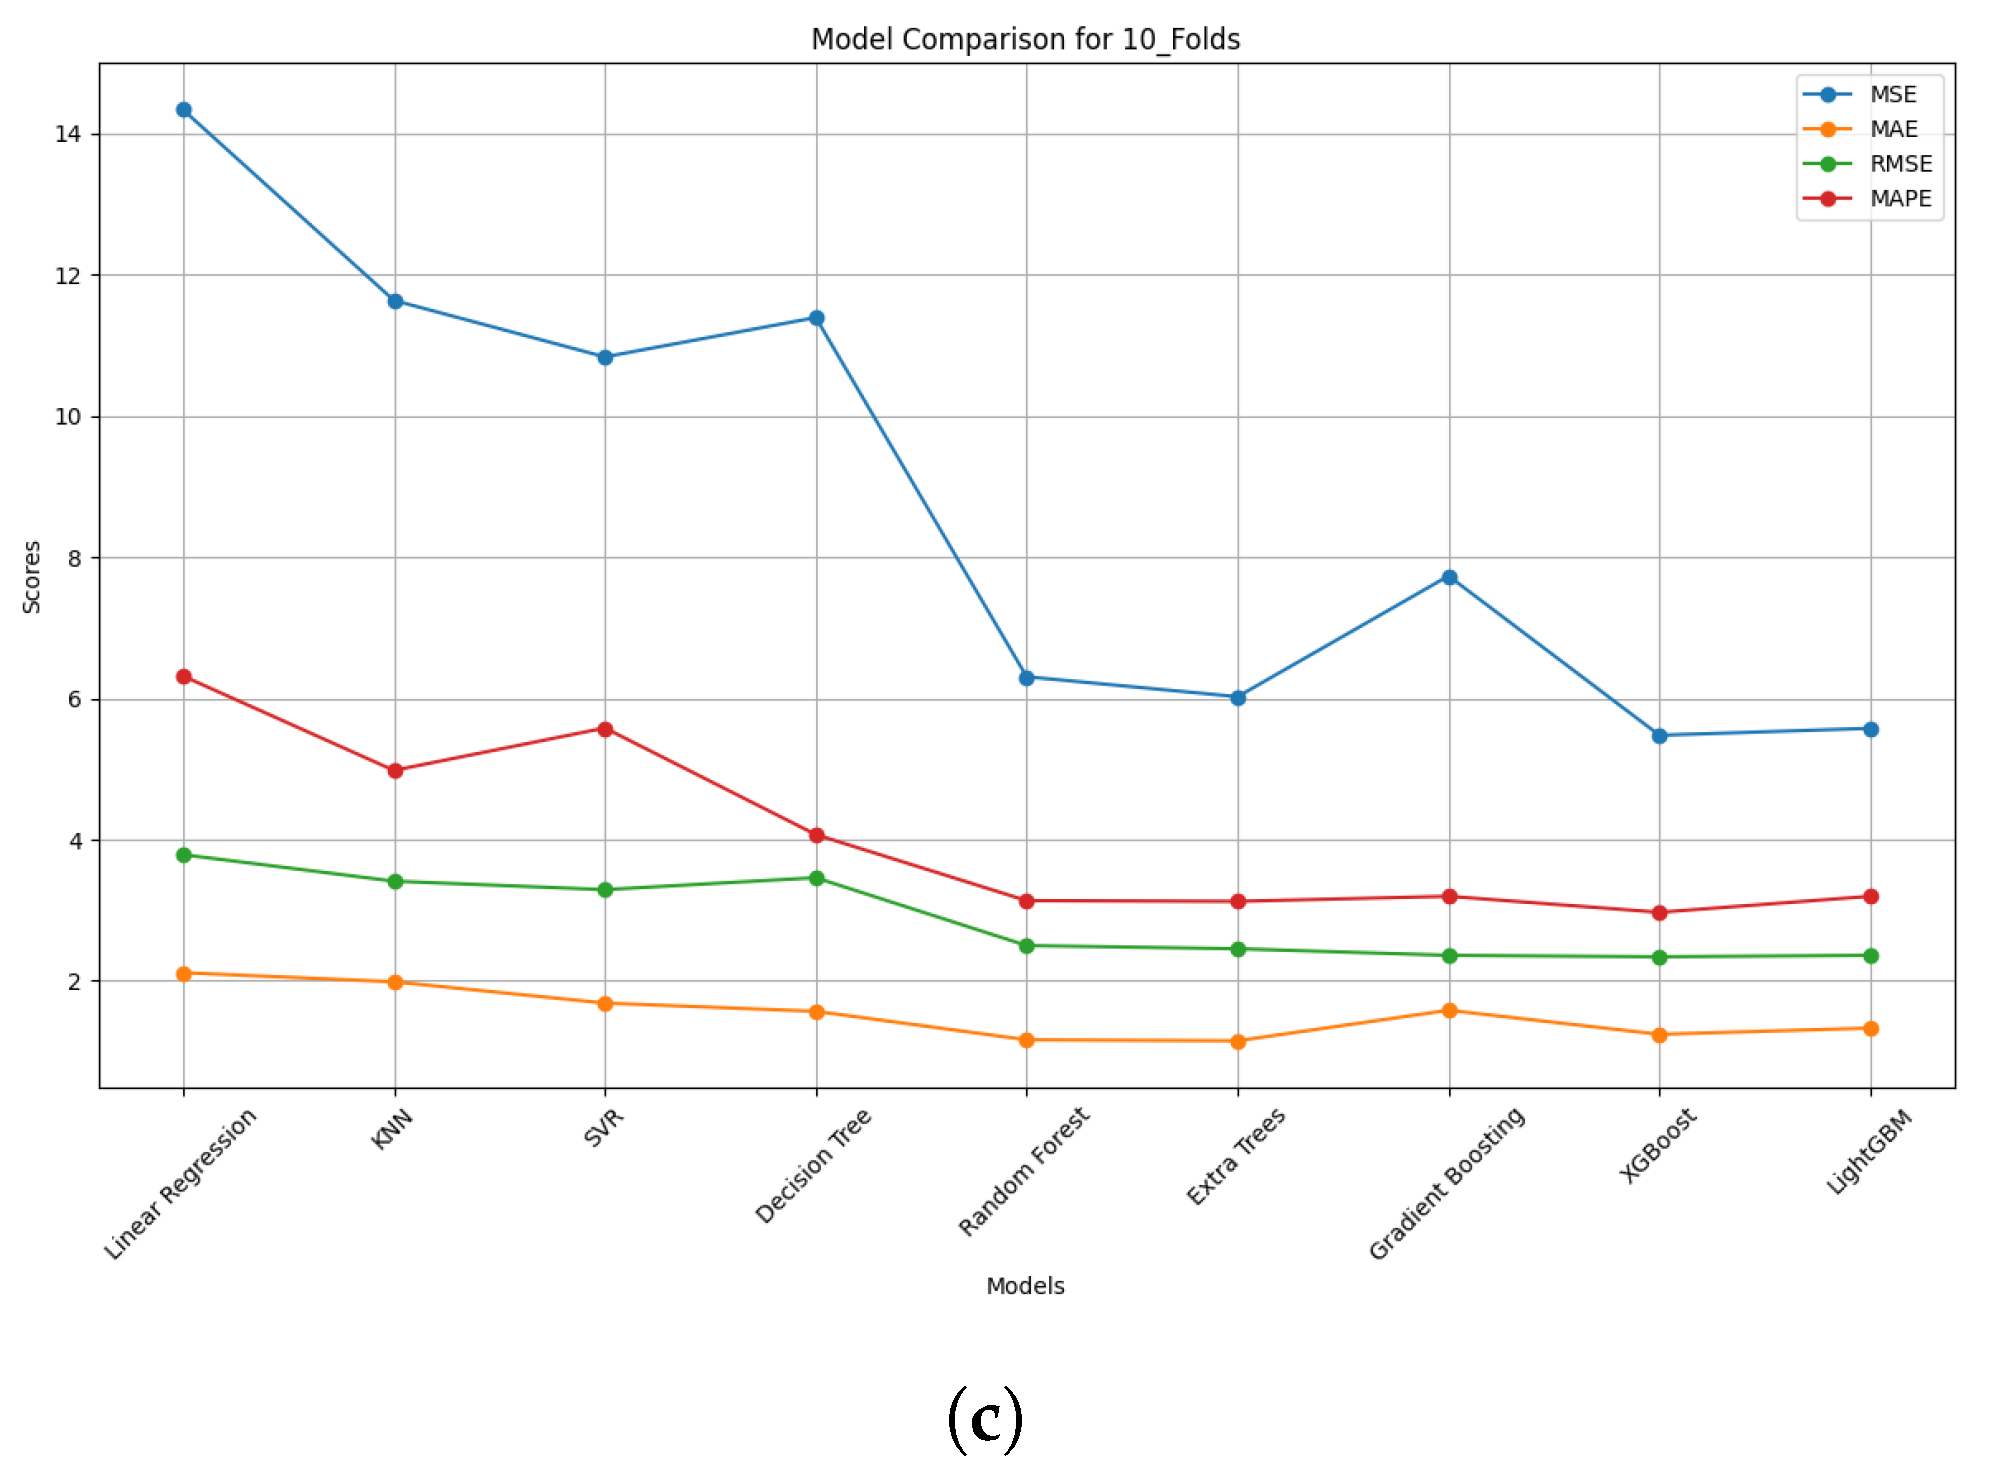
4.2.2. Comparison of Model Performance

Figure 5 and Figure 6 visualise the performance of each model in terms of MSE, MAE, and R-squared.

4.2.3. Model Performance Discussion

For the comparison of the predictive models according to the different performance metrics, the following insights are discussed:
Random Forest: Among all models tested, RF registered the lowest Mean Squared Error of 3.932, the lowest Mean Absolute Error at 1.017, and the highest R-squared value at 0.962. The best hyperparameters for Random Forest use 200 trees and a max depth of 20, with a minimum sample split of 2. Therefore, this shows that the Random Forest model is robust and accurate in predicting energy efficiency.
Random Forest with Extra Trees: This model shows robust performance across all models, exhibiting its ability to manage high-dimensional features and their complex interaction; the results can be seen in Table 6.
Gradient Boosting: Gradient Boosting has worked very well; it had an MSE of 4.569, an MAE of 1.389, and an R-squared score of 0.956. The best hyperparameters for Gradient Boosting are a learning rate of 0.1, 5 particular trains, and 200 estimators. Regarding performance, Gradient Boosting places close to Random Forest for forecasting energy efficiency.
XGBoost: As seen in the results in Table 6, this model has also performed exceptionally well, with consistent and accurate prediction, highlighting efficiency and robustness in handling the predictor’s complex interactions.
LightGBM: This model has also demonstrated excellent accuracy and performance, which can be seen in Table 6. LightGBM is one of the most efficient models for predicting residential building energy efficiency.
Decision Tree: This model saw an MSE of 7.319, generating an MAE of 1.393 and gaining an R-squared score of 0.929. So, it too has performed not too severely, although it has a little less accuracy than Random Forest and Gradient Boosting.
Support Vector Regression (SVR): SVR has recorded lower scores: an MSE of 8.747, an MAE of 1.804, and an R2 of 0.916. The best hyperparameters this model yielded are the following: a C of well-regulasing 10, and the value of gamma set to ‘cale’.
Linear Regression: The linear model has an MSE of 11.024, an MAE of 1.993, and an R-squared score of 0.894. Hence, the contribution is just as expected for a baseline model.
k-Nearest Neighbors (KNNs): KNN comes out with a top MSE of 27.911, an MAE of 3.747, and the lowest R-squared Score of 0.731. Hence, this means that KNN is the least accurate among the models tested. The best hyperparameter configuration gives n_neighbors equivalent to 7.
Random Forest showed the best overall performance in the forecasting of energy efficiency in residences; the Gradient Boosting model also indicated good performance and generated candidates that were credible for consideration. As such, these models would be of distinct interest, allowing accurate prognostic estimation and touching on the global potential pain points of saving energy and promoting energy management strategies.

5. Implications of Study

This study discusses the theoretical and practical implications.

5.1. Theoretical

This study provides a significant theoretical contribution to the prediction of residential building energy efficiency using ML models. By systematically employing a mixed method strategy to improve understanding of how multiple models can be utilised, we enhanced the robustness and accuracy of prediction using a high-dimensional dataset. The comparative analysis of the models offers a detailed understanding in the context of energy efficiency forecasting. This study shows that ensemble models outperform classical models by capturing complex interactions. The extensive set of evaluation metrics also provides a framework for evaluating the performance of each model. This incorporates into the theoretical knowledge of how mixed-model approaches can assess the effectiveness of ML models in the prediction of residential building energy efficiency.

5.2. Policy

This research provides insightful practical implications for building designers, policymakers, energy engineers, and homeowners. The findings of this research can be directly utilised to predict the energy efficiency of current buildings and in the implementation of retrofitting applications. We have developed a machine learning interface that visualises a multifaceted view of data visual analysis and model evaluations, as can be seen in Figure 7, Figure 8, Figure 9, Figure 10, Figure 11 and Figure 12. This interface seamlessly integrates the insights of several features into a single, user-friendly display. This platform incorporates a powerful visualisation of feature correlation, feature importance, prediction, and multiple model evaluation metrics. Each display is dedicated to a distinct analytical approach, offering a comprehensive insight into how each machine learning model processes and ranks features within the energy performance dataset. This interface integration not only improves the usability of the analytical models but also enables stakeholders to make well-informed decisions. The results of this research can guide the development of new energy efficiency techniques, with the aim of improving residential building energy efficiency. Energy managers can employ this prediction model to design more effective energy performance and management strategies. This framework can be integrated into live data to predict the real-time energy performance of different features of smart buildings. This could be integrated into dynamic adjustments that optimise energy consumption, reduce operational costs, and improve the comfort of the occupants.

6. Conclusions

In this study, we investigated the critical role of feature selection techniques and machine learning models to identify the most influential features in terms of predicting Current Energy Efficiency in residential buildings in the York area in the United Kingdom. Our proposed approach not only addressed a local challenge but also established a scalable methodology that can be adapted to diverse contexts.
This study demonstrated the efficacy of ensemble models by addressing the challenges of a high-dimensional dataset. Ensemble models outperformed the other classical models, showcasing the capability of capturing complex relationships between sets of features and minimising overfitting.
These findings advance the field by highlighting the practical superiority of ensemble methods in handling intricate, real-world datasets, thereby setting a benchmark for future research. Therefore, the results decisively answered our research questions on the performance of key predictors and prediction efficiency across traditional and modern models, identifying the key features of energy efficiency and designing a robust feature selection and prediction methodology.
This contribution is significant, as it bridges the gap between theoretical model development and practical implementation, providing a clear pathway for improving energy efficiency predictions in both academic and applied settings. By systematically employing a mixed-method strategy, our proposed framework enhances the understanding of how multiple models can be utilised to enhance the robustness and accuracy of prediction using a high-dimensional dataset. The comparative analysis of models also offers a detailed understanding in the context of energy efficiency forecasting. Such insights pave the way for the integration of diverse techniques to capture the full spectrum of influential features, thereby encouraging the development of more refined and targeted energy efficiency interventions. Practically, our findings have direct implications for enhancing energy efficiency in residential properties. This set of refined features is ready to use in training more accurate machine learning models for the accurate predictions of energy efficiency.
In a broader context, these contributions empower stakeholders, including policymakers, designers, and engineers, to make data-driven decisions that can lead to substantial improvements in energy conservation and sustainability across the built environment.

6.1. Limitations

One of the key limitations of this study is its reliance on static datasets. However, with the increasing availability of real-time data through smart meters, IoT devices, and building management systems, there is an opportunity to integrate continuous data streams into energy efficiency models. The models and findings presented in this research are based on specific building energy-related datasets and features. Further research is needed to validate these models in other contexts or domains, such as commercial or industrial buildings, to ensure their broader applicability.

6.2. Future Research

This proposed framework is currently focused on building-specific features (e.g., energy consumption, CO2 emissions, and heating costs). However, energy efficiency in buildings is also influenced by external factors such as weather patterns, energy prices, local grid dynamics, and occupant behaviour. These variables play a critical role in shaping the overall energy profile of a building. Future research could investigate how these external factors can be integrated into predictive models. This would enable a more holistic approach to energy efficiency modelling while capturing a wider range of variables that impact building performance.

Author Contributions

Conceptualisation, H.M.S., S.I. and R.H.; methodology, H.M.S., S.I. and R.H.; software, H.M.S., H.M.A.F., F.S. and A.S.-A.; validation, H.M.S., S.I. and R.H.; formal analysis, H.M.S., S.I. and R.H.; investigation, H.M.S.; resources, H.M.S. and H.M.A.F.; data curation, H.M.S., H.M.A.F., F.S. and A.S.-A.; writing—original draft preparation, H.M.S., S.I., R.H., F.S. and A.S.-A.; writing—review and editing, H.M.S., S.I., R.H., A.S.-A. and F.S.; visualisation, H.M.S., H.M.A.F., F.S., A.S.-A. and S.I.; supervision, S.I. and R.H.; project administration, S.I. and R.H. All authors have read and agreed to the published version of the manuscript.

Funding

This research received no external funding.

Institutional Review Board Statement

The study was conducted with ethical approval from the University of Huddersfield.

Data Availability Statement

The dataset is publicly available online [47].

Conflicts of Interest

The authors declare no conflicts of interest.

Abbreviations

The following abbreviations are used in this manuscript:
PCAPrincipal component analysis
KNNsk-Nearest Neighbours
SVRSupport Vector Regression
RFRandom Forest
GBGradient Boosting
XGBoostExtreme Gradient Boosting
LightGBMLight Gradient Boosting Machine
MIMutual information
RFERecursive Feature Elimination
HWEEHot Water Energy Efficiency
HWEVEHot Water Environment Efficiency
HVACHeating, Ventilation, Air Conditioning
WIEEWindows Energy Efficiency
WENEWindows Environment Efficiency
WEEWalls Energy Efficiency
WENEWalls Environment Efficiency
REERoof Energy Efficiency
RENERoof Environment Efficiency
MHEEMain Heat Energy Efficiency
MHENEMain Heat Environment Efficiency
MHCEEMain Heat Control Energy Efficiency
MHCENEMain Heat Control Environment Efficiency
LEELighting Energy Efficiency
LENELighting Environment Efficiency
CEECurrent Energy Efficiency
EICEnvironment Impact Current
ECCEnergy Consumption Current
CECCO2 Emissions Current
CEPFACO2 Emissions Current per Floor Area
LCCLighting Cost Current
HCCHeating Cost Current
HWCCHot Water Cost Current
TFATotal Floor Area
EOExtension Count
NARNumber of Habitable Rooms
NHRNumber of Heated Rooms
LELLow-Energy Lighting
SAPStandard Assessment Procedure
RdSAPreduced Standard Assessment Procedure

References

  1. BRE. The Government’s Standard Assessment Procedure for Energy Rating of Dwellings; Building Research Establishment: Watford, UK, 2012. [Google Scholar]
  2. Khazal, A.; Sønstebø, O.J. Valuation of energy performance certificates in the rental market—Professionals vs. nonprofessionals. Energy Policy 2020, 147, 111830. [Google Scholar] [CrossRef]
  3. Anđelković, A.S.; Kljajić, M.; Macura, D.; Munćan, V.; Mujan, I.; Tomić, M.; Vlaović, Ž.; Stepanov, B. Building energy performance certificate—A relevant indicator of actual energy consumption and savings? Energies 2021, 14, 3455. [Google Scholar] [CrossRef]
  4. Yuan, M.; Choudhary, R. Energy Performance Certificate renewal—An analysis of reliability of simple non-domestic buildings’ EPC ratings and pragmatic improving strategies in the UK. Energy Policy 2023, 178, 113581. [Google Scholar] [CrossRef]
  5. Brockway, P.E.; Sorrell, S.; Semieniuk, G.; Heun, M.K.; Court, V. Energy efficiency and economy-wide rebound effects: A review of the evidence and its implications. Renew. Sustain. Energy Rev. 2021, 141, 110781. [Google Scholar] [CrossRef]
  6. Webborn, E.; Few, J.; McKenna, E.; Elam, S.; Pullinger, M.; Anderson, B.; Shipworth, D.; Oreszczyn, T. The SERL Observatory Dataset: Longitudinal smart meter electricity and gas data, survey, EPC and climate data for over 13,000 households in Great Britain. Energies 2021, 14, 6934. [Google Scholar] [CrossRef]
  7. Sekisov, A.; Ovchinnikova, S.; Schneider, E. Challenges and prospects for energy efficiency development in residential buildings. E3S Web Conf. 2023, 389, 6009. [Google Scholar] [CrossRef]
  8. Sheina, S.; Girya, L.; Shvets, A.; Larin, N. Methods for increasing energy efficiency during the construction of high-rise residential buildings. Mod. Trends Constr. Urban Plan. Territ. Plan. 2022, 1, 17–23. [Google Scholar]
  9. Ugli, K.K.B. Improving the energy efficiency of low-rise residential buildings. Int. J. Adv. Sci. Res. 2022, 2, 24–31. [Google Scholar] [CrossRef]
  10. Akgüç, A.; Yılmaz, A.Z. Determining HVAC system retrofit measures to improve cost-optimum energy efficiency level of high-rise residential buildings. J. Build. Eng. 2022, 54, 104631. [Google Scholar] [CrossRef]
  11. Riabchuk, V.; Hagel, L.; Germaine, F.; Zharova, A. Utility-based context-aware multi-agent recommendation system for energy efficiency in residential buildings. arXiv 2022, arXiv:2205.02704. [Google Scholar] [CrossRef]
  12. Chakraborty, D.; Elzarka, H. Advanced machine learning techniques for building performance simulation: A comparative analysis. J. Build. Perform. Simul. 2019, 12, 193–207. [Google Scholar] [CrossRef]
  13. Zuhaib, S.; Schmatzberger, S.; Volt, J.; Toth, Z.; Kranzl, L.; Maia, I.E.N.; Verheyen, J.; Borragán, G.; Monteiro, C.S.; Mateus, N.; et al. Next-generation energy performance certificates: End-user needs and expectations. Energy Policy 2022, 161, 112723. [Google Scholar] [CrossRef]
  14. Egwim, C.N.; Alaka, H.; Egunjobi, O.O.; Gomes, A.; Mporas, I. Comparison of machine learning algorithms for evaluating building energy efficiency using big data analytics. J. Eng. Des. Technol. 2024, 22, 1325–1350. [Google Scholar] [CrossRef]
  15. Chen, S.; Zhang, G.; Xia, X.; Setunge, S.; Shi, L. A review of internal and external influencing factors on energy efficiency design of buildings. Energy Build. 2020, 216, 109944. [Google Scholar] [CrossRef]
  16. Mo, Y.; Zhao, D. Effective factors for residential building energy modeling using feature engineering. J. Build. Eng. 2021, 44, 102891. [Google Scholar] [CrossRef]
  17. Buyo, N.; Sheikh-Akbari, A.; Saleem, F. An Ensemble Approach to Predict a Sustainable Energy Plan for London Households. Sustainability 2025, 17, 500. [Google Scholar] [CrossRef]
  18. Wilfling, S. Augmenting data-driven models for energy systems through feature engineering: A Python framework for feature engineering. arXiv 2023, arXiv:2301.01720. [Google Scholar]
  19. Ali, P.J.M.; Faraj, R.H.; Koya, E.; Ali, P.J.M.; Faraj, R.H. Data normalization and standardization: A technical report. Mach. Learn. Tech. Rep. 2014, 1, 1–6. [Google Scholar]
  20. Mohamed, S.; Smith, R.; Rodrigues, L.; Omer, S.; Calautit, J. The correlation of energy performance and building age in UK schools. J. Build. Eng. 2021, 43, 103141. [Google Scholar] [CrossRef]
  21. Choi, J.H. Investigation of the correlation of building energy use intensity estimated by six building performance simulation tools. Energy Build. 2017, 147, 14–26. [Google Scholar] [CrossRef]
  22. Hafez, F.S.; Sa’di, B.; Safa-Gamal, M.; Taufiq-Yap, Y.; Alrifaey, M.; Seyedmahmoudian, M.; Stojcevski, A.; Horan, B.; Mekhilef, S. Energy efficiency in sustainable buildings: A systematic review with taxonomy, challenges, motivations, methodological aspects, recommendations, and pathways for future research. Energy Strategy Rev. 2023, 45, 101013. [Google Scholar]
  23. Zhou, Y. Climate change adaptation with energy resilience in energy districts—A state-of-the-art review. Energy Build. 2023, 279, 112649. [Google Scholar] [CrossRef]
  24. Dimitroulopoulou, S.; Dudzińska, M.R.; Gunnarsen, L.; Hägerhed, L.; Maula, H.; Visualisation, R.S.; Visualisation, O.T.; Haverinen-Shaughnessy, U. Indoor air quality guidelines from across the world: An appraisal considering energy saving, health, productivity, and comfort. Environ. Int. 2023, 178, 108127. [Google Scholar] [CrossRef]
  25. Fuerst, F.; McAllister, P.; Nanda, A.; Wyatt, P. Energy performance ratings and house prices in Wales: An empirical study. Energy Policy 2016, 92, 20–33. [Google Scholar] [CrossRef]
  26. Iram, S.; Shakeel, H.; Farid, H.M.A.; Hill, R.; Fernando, T. A web-based visual analytics platform to explore smart houses energy data for stakeholders: A case study of houses in the area of Manchester. Energy Build. 2023, 296, 113342. [Google Scholar] [CrossRef]
  27. Department for Business, Energy & Industrial Strategy. Changes to Government’s Standard Assessment Procedure (SAP): Government Response; Technical report; Department for Business, Energy & Industrial Strategy: London, UK, 2023. [Google Scholar]
  28. Sustainable Energy Authority of Ireland. Building Energy Rating (BER); Sustainable Energy Authority of Ireland: Dublin, Ireland, 2023. [Google Scholar]
  29. Passive House Institute. What Is a Passive House? Passive House Institute: Darmstadt, Germany, 2023. [Google Scholar]
  30. United States Environmental Protection Agency. US Green Building Council’s Leadership in Energy and Environmental Design (LEED®); United States Environmental Protection Agency: Washington, DC, USA, 2023. [Google Scholar]
  31. Spudys, P.; Jurelionis, A.; Fokaides, P. Conducting smart energy audits of buildings with the use of building information modelling. Energy Build. 2023, 285, 112884. [Google Scholar] [CrossRef]
  32. Ferreira, A.; Pinheiro, M.D.; de Brito, J.; Mateus, R. A critical analysis of LEED, BREEAM and DGNB as sustainability assessment methods for retail buildings. J. Build. Eng. 2023, 66, 105825. [Google Scholar]
  33. Droutsa, K.G.; Kontoyiannidis, S.; Dascalaki, E.G.; Balaras, C.A. Mapping the energy performance of hellenic residential buildings from EPC (energy performance certificate) data. Energy 2016, 98, 284–295. [Google Scholar] [CrossRef]
  34. International Energy Agency. Transition to Sustainable Buildings: Strategies and Opportunities to 2050; Organization for Economic Co-Operation & Development, International Energy Agency: Paris, France, 2013. [Google Scholar]
  35. Iram, S.; Al-Aqrabi, H.; Shakeel, H.M.; Farid, H.M.A.; Riaz, M.; Hill, R.; Vethathir, P.; Alsboui, T. An innovative machine learning technique for the prediction of weather based smart home energy consumption. IEEE Access 2023, 11, 76300–76320. [Google Scholar]
  36. Lopes, M.A.; Antunes, C.H.; Martins, N. Energy behaviours as promoters of energy efficiency: A 21st century review. Renew. Sustain. Energy Rev. 2012, 16, 4095–4104. [Google Scholar]
  37. Williams, J.; Mitchell, R.; Raicic, V.; Vellei, M.; Mustard, G.; Wismayer, A.; Yin, X.; Davey, S.; Shakil, M.; Yang, Y.; et al. Less is more: A review of low energy standards and the urgent need for an international universal zero energy standard. J. Build. Eng. 2016, 6, 65–74. [Google Scholar] [CrossRef]
  38. Fathi, S.; Srinivasan, R.; Fenner, A.; Fathi, S. Machine learning applications in urban building energy performance forecasting: A systematic review. Renew. Sustain. Energy Rev. 2020, 133, 110287. [Google Scholar] [CrossRef]
  39. Tronchin, L.; Fabbri, K. Energy Performance Certificate of building and confidence interval in assessment: An Italian case study. Energy Policy 2012, 48, 176–184. [Google Scholar] [CrossRef]
  40. Prieler, M.; Leeb, M.; Reiter, T. Characteristics of a database for energy performance certificates. Energy Procedia 2017, 132, 1000–1005. [Google Scholar] [CrossRef]
  41. Touzani, S.; Granderson, J.; Fernandes, S. Gradient boosting machine for modeling the energy consumption of commercial buildings. Energy Build. 2018, 158, 1533–1543. [Google Scholar] [CrossRef]
  42. Walker, S.; Khan, W.; Katic, K.; Maassen, W.; Zeiler, W. Accuracy of different machine learning algorithms and added-value of predicting aggregated-level energy performance of commercial buildings. Energy Build. 2020, 209, 109705. [Google Scholar] [CrossRef]
  43. Luo, X.; Oyedele, L.O.; Ajayi, A.O.; Akinade, O.O. Comparative study of machine learning-based multi-objective prediction framework for multiple building energy loads. Sustain. Cities Soc. 2020, 61, 102283. [Google Scholar] [CrossRef]
  44. Seyedzadeh, S.; Rahimian, F.P.; Glesk, I.; Roper, M. Machine learning for estimation of building energy consumption and performance: A review. Vis. Eng. 2018, 6, 1–20. [Google Scholar] [CrossRef]
  45. Al-Shargabi, A.A.; Almhafdy, A.; Ibrahim, D.M.; Alghieth, M.; Chiclana, F. Buildings’ energy consumption prediction models based on buildings’ characteristics: Research trends, taxonomy, and performance measures. J. Build. Eng. 2022, 54, 104577. [Google Scholar] [CrossRef]
  46. Eker, H. Natural Language Processing Risk Assessment Application Developed for Marble Quarries. Appl. Sci. 2024, 14, 9045. [Google Scholar] [CrossRef]
  47. Department for Levelling Up, Housing & Communities Energy Performance of Buildings Data: England and Wales. 2023. Available online: https://epc.opendatacommunities.org/ (accessed on 15 March 2024).
  48. Patro, S.; Sahu, K.K. Normalization: A preprocessing stage. arXiv 2015, arXiv:1503.06462. [Google Scholar] [CrossRef]
  49. Potdar, K.; Pardawala, T.S.; Pai, C.D. A comparative study of categorical variable encoding techniques for neural network classifiers. Int. J. Comput. Appl. 2017, 175, 7–9. [Google Scholar] [CrossRef]
  50. Abdi, H.; Williams, L.J. Principal component analysis. Wiley Interdiscip. Rev. Comput. Stat. 2010, 2, 433–459. [Google Scholar] [CrossRef]
  51. Cohen, I.; Huang, Y.; Chen, J.; Benesty, J.; Benesty, J.; Chen, J.; Huang, Y.; Cohen, I. Pearson correlation coefficient. In Noise Reduction in Speech Processing; Springer: Berlin/Heidelberg, Germany, 2009; pp. 1–4. [Google Scholar]
  52. Kraskov, A.; Stögbauer, H.; Grassberger, P. Estimating mutual information. Phys. Rev. E Stat. Nonlinear Soft Matter Phys. 2004, 69, 66138. [Google Scholar] [CrossRef]
  53. Chen, X.w.; Jeong, J.C. Enhanced recursive feature elimination. In Proceedings of the Sixth International Conference on Machine Learning and Applications (ICMLA 2007), IEEE, Cincinnati, OH, USA, 13–15 December 2007; pp. 429–435. [Google Scholar]
  54. Kukreja, S.L.; Löfberg, J.; Brenner, M.J. A least absolute shrinkage and selection operator (LASSO) for nonlinear system identification. IFAC Proc. Vol. 2006, 39, 814–819. [Google Scholar]
  55. Breiman, L. Random forests. Mach. Learn. 2001, 45, 5–32. [Google Scholar]
  56. Friedman, J.H. Greedy function approximation: A gradient boosting machine. Ann. Stat. 2001, 29, 1189–1232. [Google Scholar] [CrossRef]
  57. Montgomery, D.C.; Peck, E.A.; Vining, G.G. Introduction to Linear Regression Analysis; John Wiley & Sons: Hoboken, NJ, USA, 2021. [Google Scholar]
  58. Bansal, M.; Goyal, A.; Choudhary, A. A comparative analysis of K-nearest neighbor, genetic, support vector machine, decision tree, and long short term memory algorithms in machine learning. Decis. Anal. J. 2022, 3, 100071. [Google Scholar] [CrossRef]
  59. Song, Y.Y.; Ying, L. Decision tree methods: Applications for classification and prediction. Shanghai Arch. Psychiatry 2015, 27, 130. [Google Scholar]
  60. Hearst, M.A.; Dumais, S.T.; Osuna, E.; Platt, J.; Scholkopf, B. Support vector machines. IEEE Intell. Syst. Their Appl. 1998, 13, 18–28. [Google Scholar] [CrossRef]
  61. Geurts, P.; Ernst, D.; Wehenkel, L. Extremely randomized trees. Mach. Learn. 2006, 63, 3–42. [Google Scholar]
  62. Nemeth, M.; Borkin, D.; Michalconok, G. The comparison of machine-learning methods XGBoost and LightGBM to predict energy development. In Computational Statistics and Mathematical Modeling Methods in Intelligent Systems: Proceedings of 3rd Computational Methods in Systems and Software; Springer: Berlin/Heidelberg, Germany, 2019; Volume 1047, pp. 208–215. [Google Scholar]
Figure 1. Proposed comprehensive framework for predicting energy efficiency in residential buildings using machine learning models.
Buildings 15 01275 g001
Figure 2. Comprehensive analysis and evaluation of predictive models for energy efficiency in residential buildings.
Buildings 15 01275 g002
Figure 3. Comparative features ranking for different models.
Buildings 15 01275 g003
Figure 4. Model comparison charts regarding error performance metric charts for different models using MSE, MAE, ADJR, R², RMSE, and MAPE assessment criteria.
Buildings 15 01275 g004
Figure 5. Comparison of different models’ performance in terms of their MSE, MAE, R2, RMSE, and MAPE when using (a) 3-Fold and (b) 5-Fold data.
Buildings 15 01275 g005aBuildings 15 01275 g005b
Figure 6. Comparison of different models’ performance in terms of their MSE, MAE, R2, RMSE, and MAPE when using (a) 7-Fold, (b) 9-Fold data, and (c) whole data.
Buildings 15 01275 g006aBuildings 15 01275 g006b
Figure 7. Energy Predict platform: Feature selection and prediction results page.
Buildings 15 01275 g007
Figure 8. EnergyPredict platform: Data insight page.
Buildings 15 01275 g008
Figure 9. EnergyPredict platform: Feature distribution page.
Buildings 15 01275 g009
Figure 10. EnergyPredict platform: Feature importance page.
Buildings 15 01275 g010
Figure 11. EnergyPredict platform: Predicted values comparison page.
Buildings 15 01275 g011
Figure 12. EnergyPredict platform: Model comparison page.
Buildings 15 01275 g012
Table 1. Summary of key studies on machine learning applications in energy efficiency prediction.
CiteTechniques UsedContextKey Findings
[33]LRBuilding features analysisAssessed the impact of various features on energy performance.
[34]KNNResidential energy consumptionPredicted historical energy usage and identified characteristic patterns.
[36]KNNPre- and post-retrofit energy dataDemonstrated suitability to predicting energy-saving potential.
[37]SVRMeteorological, material, and occupancy dataModeled energy performance under heterogeneous conditions.
[38]DTHistorical energy and building characteristicsEffectively identified critical energy-saving areas.
[39]RFBuilding size, insulation, and occupancy patternsCaptured complex relationships for accurate energy use prediction.
[40]RFHistorical consumption and building dataValidated RF’s performance in predicting energy demand.
[41]GBCommercial building energy consumptionAchieved superior forecasting accuracy compared to other approaches.
[44]ANN, SVM, Gaussian-based regressions, clusteringBuilding energy performance forecastingProvided a comprehensive analysis of primary ML techniques.
[12]XGBoost, ANN, Degree-Day OLS RegressionEnergy model constructionDemonstrated enhanced accuracy and efficiency in energy prediction.
[45]Taxonomy of ML TechniquesEnergy consumption predictionOffered a comparative examination of various ML algorithms.
[46]SGD, NLPClassification and Prediction by analysing text dataConducted automatic risk assessment on text data and effectively predicted it.
Table 2. Categorisation and analysis of key attributes in energy performance certificate (EPC) data for residential buildings.
CategoryFeatureDescription
BuildingTotal Floor AreaThe total floor area measured in square meters.
Number of ExtensionsThe number of extensions present in the property.
Number of Habitable RoomsThe total number of habitable rooms within the property.
Number of Heated RoomsThe total number of rooms in the property that are heated.
Low-Energy LightingThe percentage of lighting within the property that utilizes low-energy solutions.
Window Energy EfficiencyThe energy efficiency rating of the windows.
Wall Energy EfficiencyThe energy efficiency rating of the walls.
EnergyCurrent Energy Efficiency RatingThe current energy efficiency rating of the property.
Current Energy ConsumptionThe total energy consumption of the property in its current state.
Main Heating System EfficiencyThe energy efficiency rating of the primary heating system.
Main Heating Control EfficiencyThe energy efficiency rating of the primary heating control system.
Lighting EfficiencyThe energy efficiency rating of the lighting system.
Hot Water System EfficiencyThe energy efficiency rating of the hot water system.
Roof Energy EfficiencyThe energy efficiency rating of the roof.
Window Energy EfficiencyThe energy efficiency rating of the windows.
Table 3. Categorisation and analysis of key attributes in energy performance certificate (EPC) data for residential buildings.
CategoryFeatureDescription
EnvironmentalCurrent Environmental Impact RatingThe environmental impact rating of the property in its current state.
Current CO2 EmissionsThe total amount of CO2 emissions produced by the property.
CO2 Emissions per Floor AreaThe amount of CO2 emissions produced per square meter of floor area.
Main Heating System Environmental EfficiencyThe environmental efficiency rating of the primary heating system.
Main Heating Control Environmental EfficiencyThe environmental efficiency rating of the primary heating control system.
Lighting Environmental EfficiencyThe environmental efficiency rating of the lighting system.
Hot Water System Environmental EfficiencyThe environmental efficiency rating of the hot water system.
Roof Environmental EfficiencyThe environmental efficiency rating of the roof.
Window Environmental EfficiencyThe environmental efficiency rating of the windows.
CostAnnual Lighting CostThe estimated annual cost incurred for lighting.
Annual Heating CostThe estimated annual cost incurred for heating.
Annual Hot Water CostThe estimated annual cost incurred for hot water usage.
Current Energy ConsumptionThe total energy consumption of the property in its current state.
Table 4. Best hyperparameter tunings for different models.
ModelsSelected HyperparametersBest Hyperparameters
Linear Regression{}{}
KNN{n_neighbors: [3, 5, 7]}{n_neighbors: 5}
SVR{C: [0.1, 1, 10], gamma: [0.1, 1, ’cale’, ’auto’]}{C: 10, gamma: ’cale’}
Decision Tree{max_depth: [None, 10, 20], min_samples_split: [2, 5, 10]}{max_depth: 10, min_samples_split: 10}
Random Forest{n_estimators: [50, 100, 200], max_depth: [None, 10, 20], min_samples_split: [2, 5, 10]}{max_depth: 20, min_samples_split: 2, n_estimators: 100}
Extra Trees{n_estimators: [50, 100, 200], max_depth: [None, 10, 20], min_samples_split: [2, 5, 10]}{max_depth: 20, min_samples_split: 2, n_estimators: 100}
Gradient Boosting{n_estimators: [50, 100, 200], learning_rate: [0.01, 0.1, 0.5], max_depth: [3, 5, 10]}{learning_rate: 0.1, max_depth: 5, n_estimators: 200}
XGBoost{n_estimators: [50, 100, 200], learning_rate: [0.01, 0.1, 0.5], max_depth: [3, 5, 10]}{learning_rate: 0.1, max_depth: 5, n_estimators: 200}
LightGBM{n_estimators: [50, 100, 200], learning_rate: [0.01, 0.1, 0.5], max_depth: [3, 5, 10]}{learning_rate: 0.1, max_depth: 5, n_estimators: 200}
Table 5. Comparative features ranking across different techniques.
RankingCorrelationLinear RegressionRandom ForestGradient BoostingPC1Mutual
Information
RFELASSO
1CEPFAECCCEPFACEPFALEECEPFACEPFAECC
2ECCCECCECCECLENEECCECCCEC
3CECCEPFAHCCHCCLELCECCECHWEE
4HCCHCCECCECCRENEHCCTFAWEE
5HWCCHWCCMHEEMHEEREEWENE.1HCCMHEE
6EONARHWCCHWCCMHCEEHWEEMHEEREE
7LCCMHCENEMHENEMHENEMHCENEWEEMHENELEL
8TFAMHCEELCCLCCWEEHWEVENARWIEE
9NARLEETFATFAWENE.1HWCCNHRMHCEE
10NHRLENEHWEEHWEEWENEMHEEHWEEWENE.1
11LENEEOLELLELWIEERENELCCRENE
12LEELELHWEVEHWEVELCCREELELLEE
13LELNHRWENE.1WENE.1HWEEMHCENEHWCCMHCENE
14WENELEEWEEWEEHWEVEMHCEEWEEMHENE
15WIEEMHENENHRNHRECCWIEEHWEVEHWEVE
16REEEONARNARCECMHENEMHCEEWENE
17RENEWIEEEOEOCEPFAWENEWENE.1NHR
18MHCEEWENERENERENEMHEELELRENENAR
19MHCENEREEREEREEMHENETFAMHCENEEO
20MHENEREEWENEWENEHCCNHRREETFA
21WEERENEWIEEWIEENARLENEWENEHWCC
22WENE.1WEEMHCEEMHCEEHWCCLEEWIEEHCC
23MHEEMHENEMHCENEMHCENETFALCCEOLCC
24HWEVEWENE.1LENELENENHREOLENECEPFA
25HWEEMHEELEELEEEONARLEELENE
Table 6. Cross-validation results for using (a) 3-fold, (b) 5-fold, (c) 7-fold, (d) 9-fold, and (e) whole data.
ModelsMSEMAER2RMSEMAPEAdjusted R2
Linear Regression12.5902.0910.8733.5485.4440.873
KNN11.1671.9930.8873.3424.7310.887
SVR7.2441.4550.9272.6923.5950.927
Decision Tree9.4831.6900.9033.0794.0450.903
Random Forest5.4551.1500.9452.3363.0040.945
Extra Trees5.1311.1620.9482.2652.9430.948
Gradient Boosting4.6981.2610.9532.1672.7440.953
XGBoost4.7031.2560.9532.1692.7730.953
LightGBM4.7131.2670.9522.1712.7940.952
(a) Using 3-Fold Data
ModelsMSEMAER2RMSEMAPEAdjusted R2
Linear Regression12.5742.0910.8733.5465.4210.873
KNN10.7041.9420.8923.2724.6080.892
SVR7.0571.4420.9292.6563.4110.929
Decision Tree9.2001.6750.9073.0333.8650.907
Random Forest5.3081.1280.9462.3042.8700.946
Extra Trees5.0141.1440.9492.2392.8200.949
Gradient Boosting4.6091.2450.9532.1472.6520.953
XGBoost4.5551.2430.9542.1342.6870.954
LightGBM4.5901.2530.9542.1422.7200.954
(b) Using 5-Fold Data
ModelsMSEMAER2RMSEMAPEAdjusted R2
Linear Regression12.5542.0920.8733.5435.4060.873
KNN10.4831.9190.8943.2384.5590.894
SVR6.9771.4370.9292.6413.3680.929
Decision Tree9.1291.6730.9093.0223.8460.909
Random Forest5.1591.1150.9482.2712.8500.948
Extra Trees4.9481.1380.9502.2242.7970.950
Gradient Boosting4.5211.2420.9542.1262.6360.954
XGBoost4.5431.2420.9542.1322.6920.954
LightGBM4.5381.2460.9542.1302.6820.954
(c) Using 7-Fold Data
ModelsMSEMAER2RMSEMAPEAdjusted R2
Linear Regression12.5582.0920.8733.5445.4000.873
KNN10.3361.9040.8953.2154.4920.895
SVR6.9431.4350.9302.6353.3530.930
Decision Tree8.8081.6560.9112.9683.7240.911
Random Forest5.1391.1110.9482.2672.8410.948
Extra Trees4.8851.1320.9512.2102.7750.951
Gradient Boosting4.5471.2410.9542.1322.6740.954
XGBoost4.5261.2360.9542.1272.6810.954
LightGBM4.4901.2380.9552.1192.6980.955
(d) Using 9-Fold Data
ModelsMSEMAER2RMSEMAPEAdjusted R2
Linear Regression14.3342.1150.8623.7866.3160.862
KNN11.6341.9860.8883.4114.9790.888
SVR10.8341.6850.8963.2915.5800.896
Decision Tree11.3911.5680.8903.4604.0710.884
Random Forest6.3051.1650.9392.4993.1350.940
Extra Trees6.0231.1510.9422.4543.1250.942
Gradient Boosting7.7331.5830.9252.3613.1970.925
XGBoost5.4771.2420.9472.3402.9700.947
LightGBM5.5751.3310.9462.3613.1970.946
(e) Using whole data
Disclaimer/Publisher’s Note: The statements, opinions and data contained in all publications are solely those of the individual author(s) and contributor(s) and not of MDPI and/or the editor(s). MDPI and/or the editor(s) disclaim responsibility for any injury to people or property resulting from any ideas, methods, instructions or products referred to in the content.

