3.2.1. Failure Checks for In- and Out-of-Plane Action According to KADET
For the assessment of the whole structure, the load and the displacement performance-based approach adopted in the Greek Code for Structural Interventions on Masonry Structures [
2] is applied to each wall and pier. Wall failure checks are implemented for in- and out-of-plane action. The need for a code of seismic assessment of masonry structures was highlighted many years ago, and some attempts were made by laying out a framework that encompasses performance-based assessment of older traditional or heritage masonry structures with no diaphragms. More details can be found in [
19,
20,
21].
The proposed method, which is the base of the KADET, focuses on estimating the shape of lateral displacement that the structure would assume if subjected to a uniform field of acceleration throughout the building height in the event of an earthquake. The shape is scaled to the spectral displacement associated with the end of the plateau of the total acceleration design spectrum that corresponds to the building site. Drift ratios are quantified to determine seismic demand for the structure from the relative displacements between significant points of the structure after normalizing with the distance between those points of reference. These values are compared with deformation capacities for in-plane and out-of-plane distortion and bending of the walls, associated with critical levels of performance, to assess the level of anticipated damage and the localization of its occurrence in the structure [
22]. The practical seismic assessment procedure for masonry buildings consists of two steps. First is the determination of local demands of the examined buildings during seismic excitation in terms of relative drift ratios referring to the in-plane and out-of-plane relative deviation of the piers and wall ends from the member chord. Second is the definition of local member capacities and the acceptance criteria [
23,
24].
The selected structural analysis method combined with the method of evaluating the load—bearing capacity of the structural elements of the masonry building, which is in accordance with the proposed method for seismic assessment of masonry heritage structures based on the modern Eurocode 8—Part 3 [
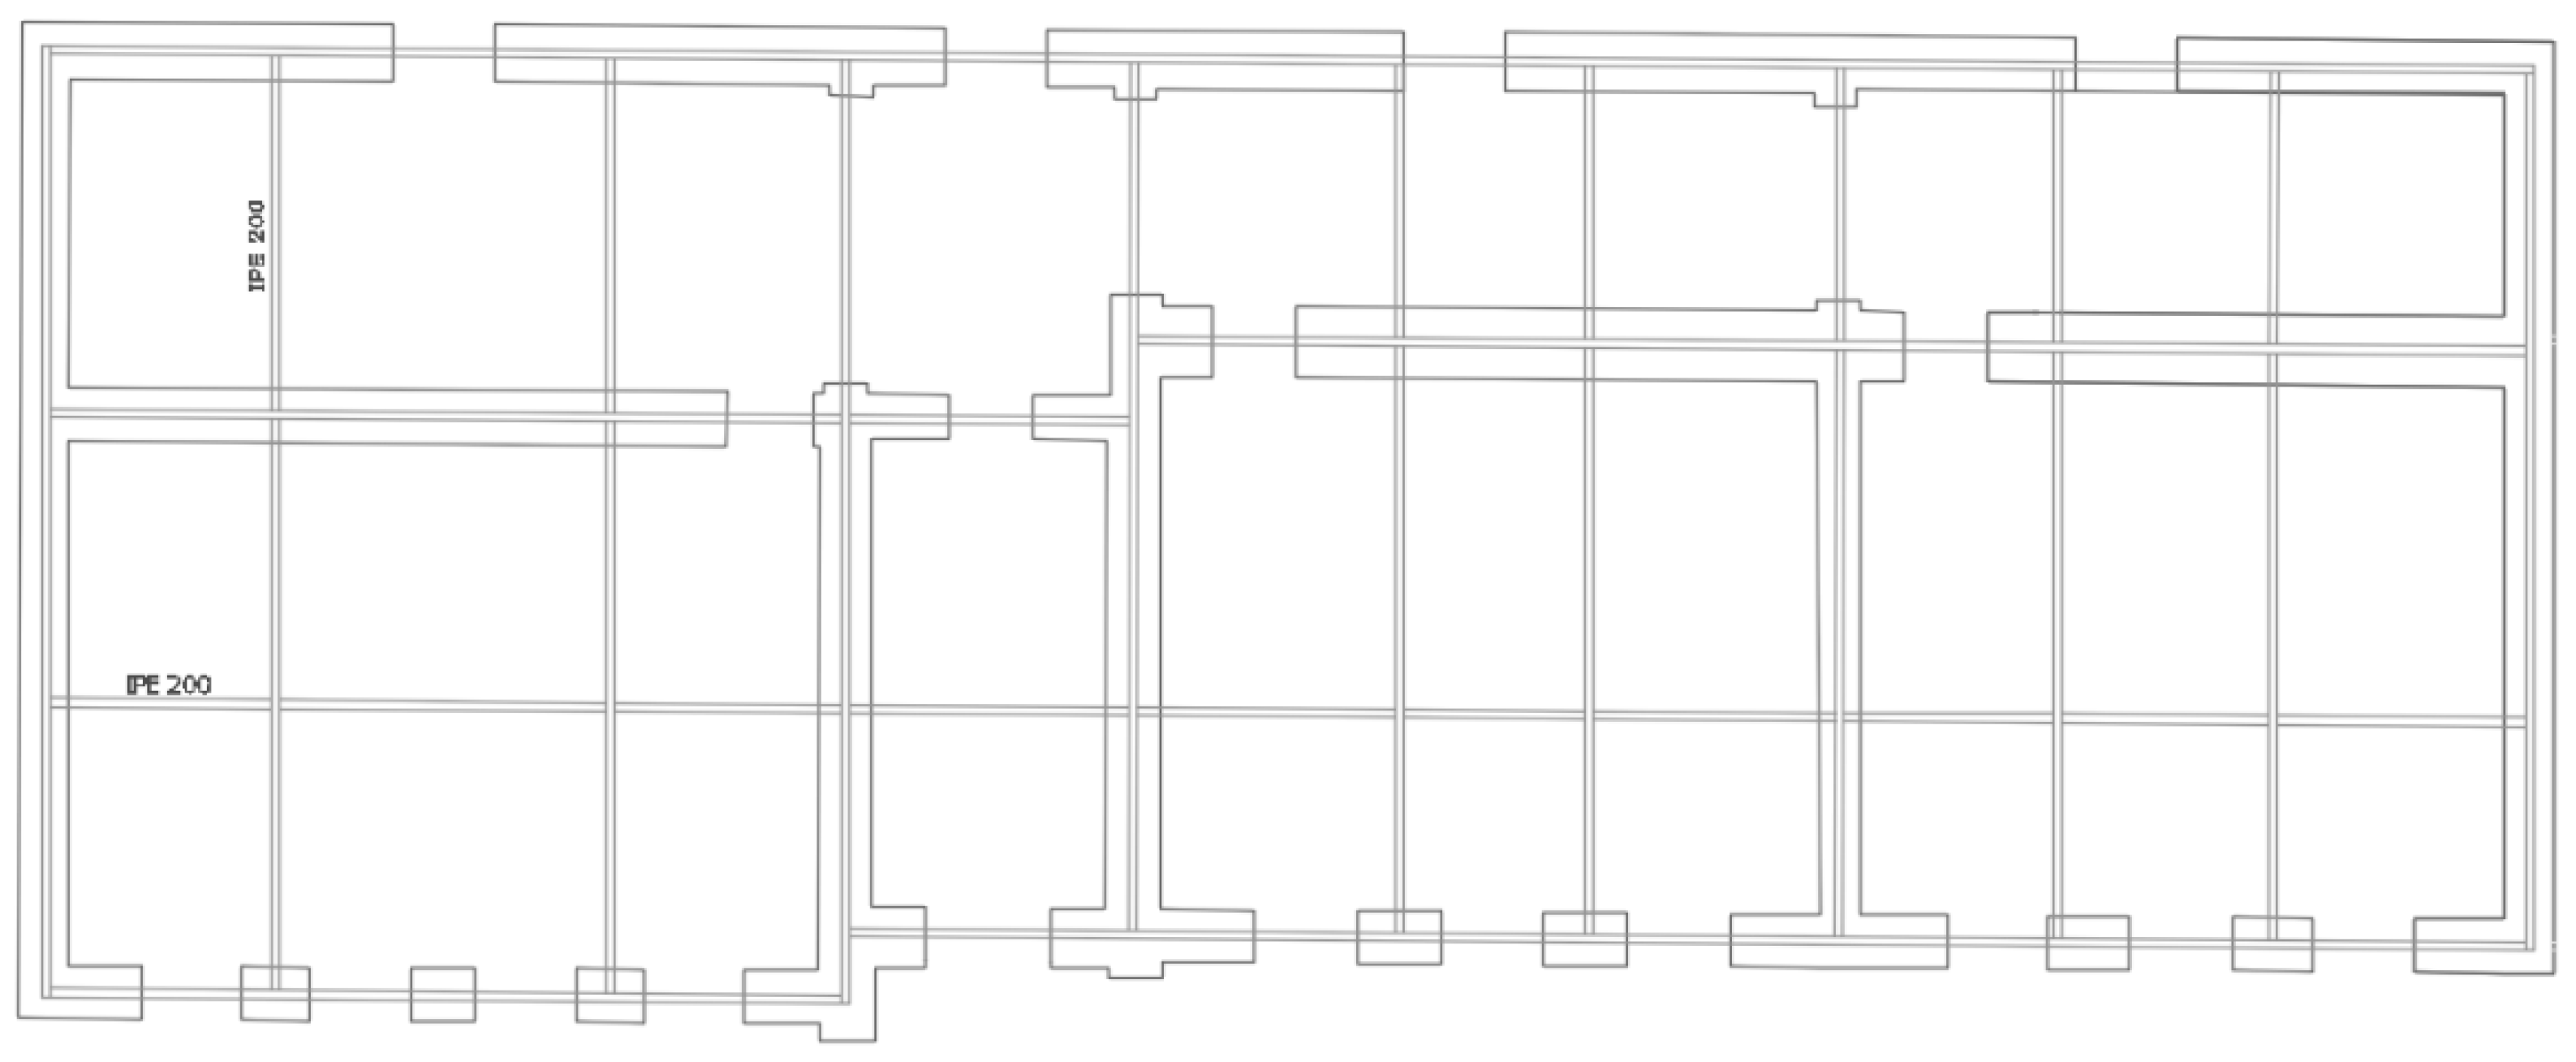
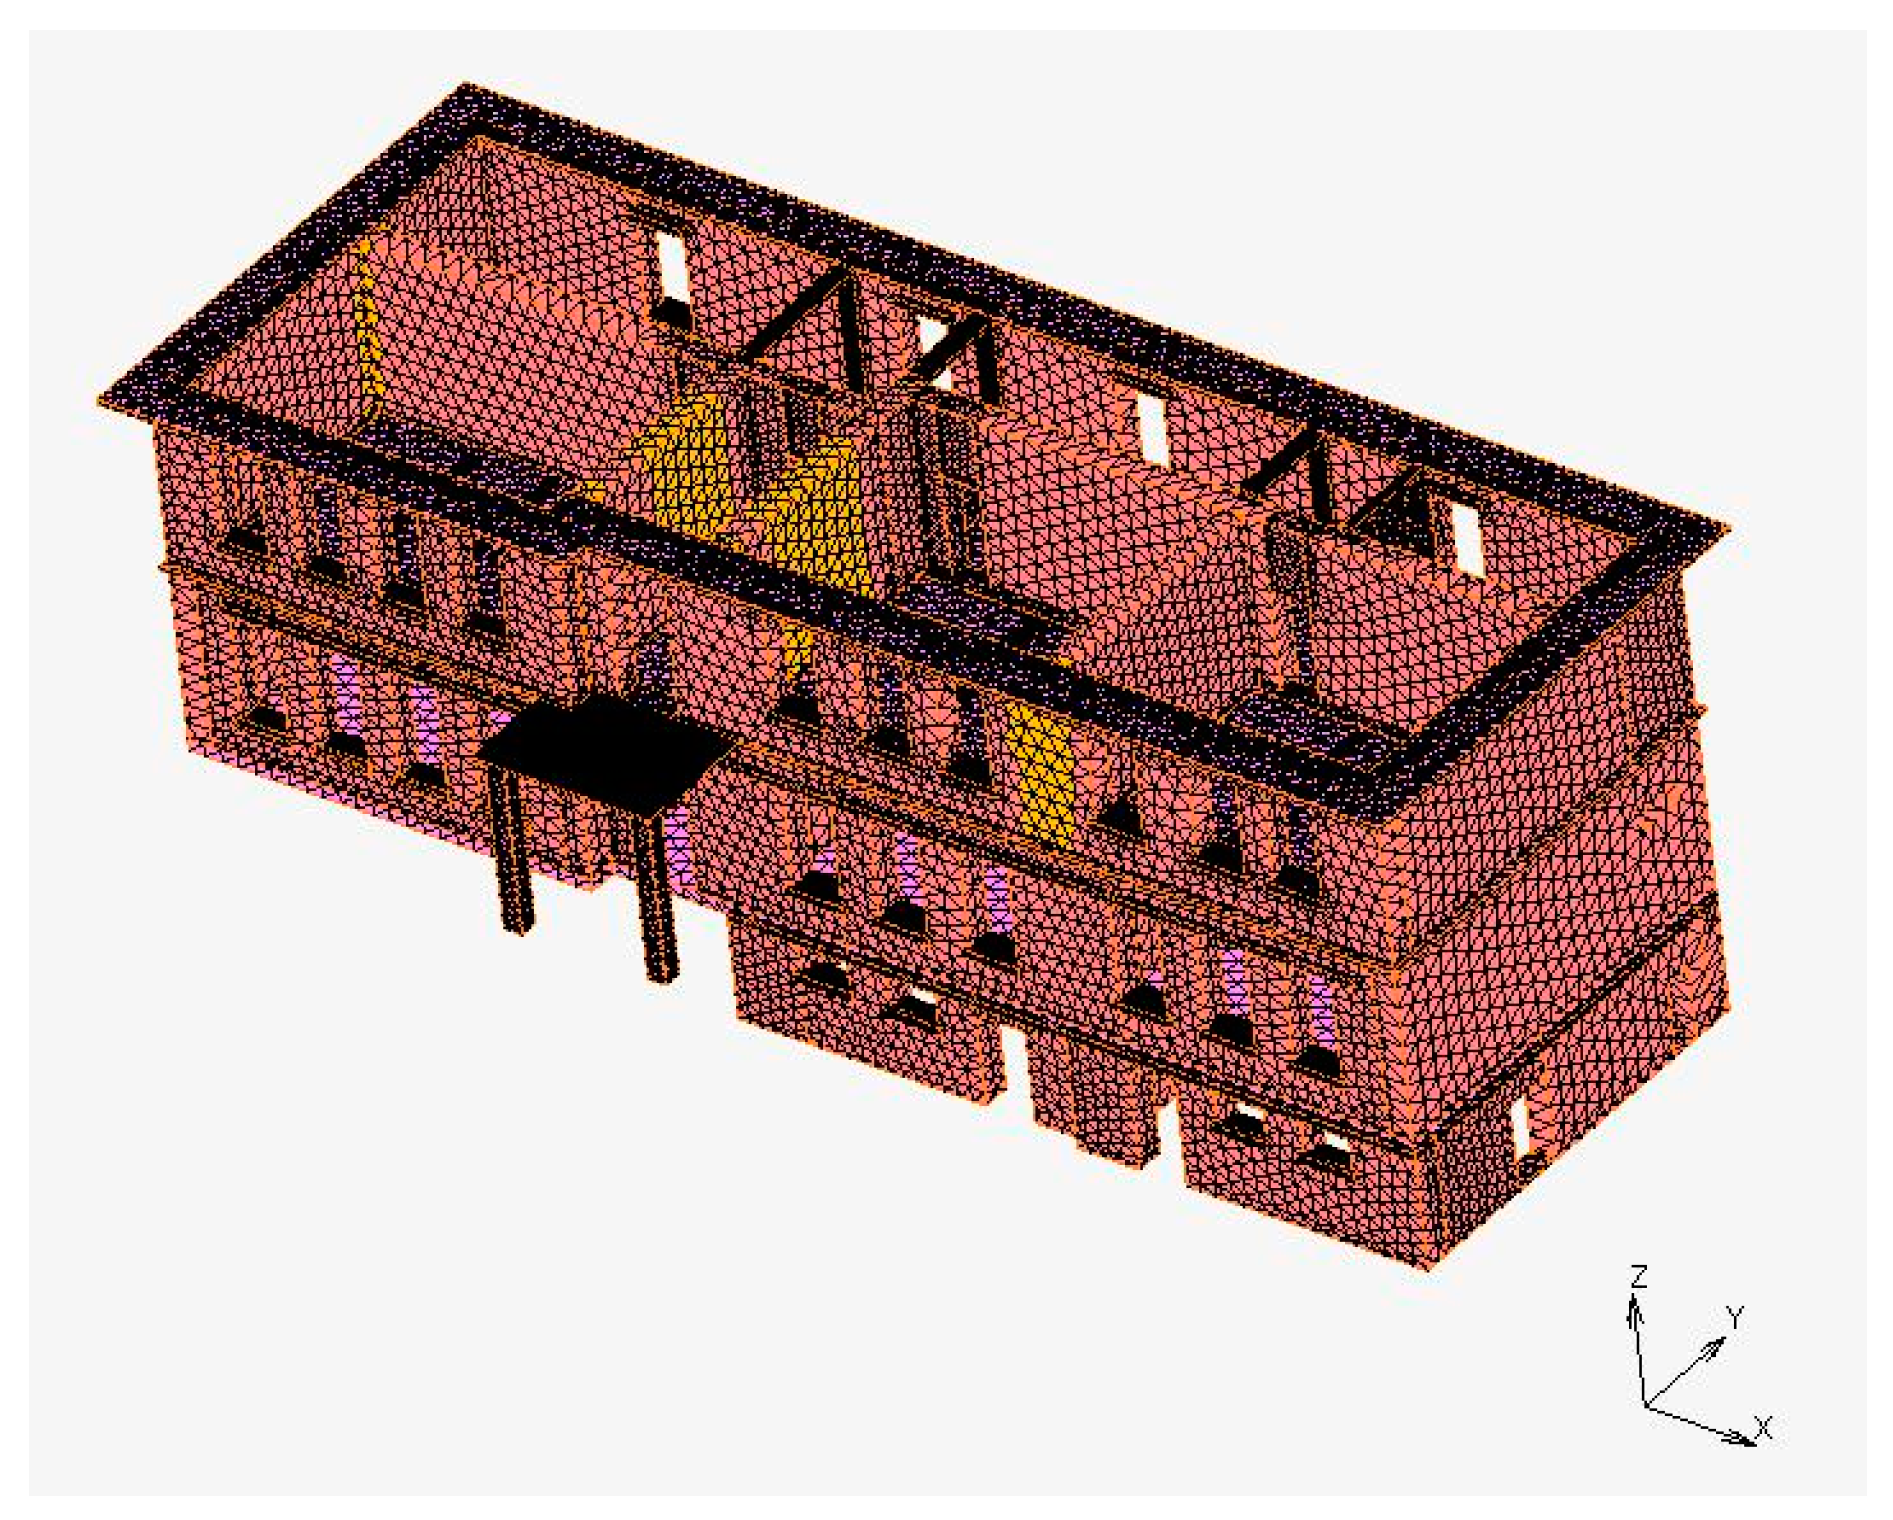
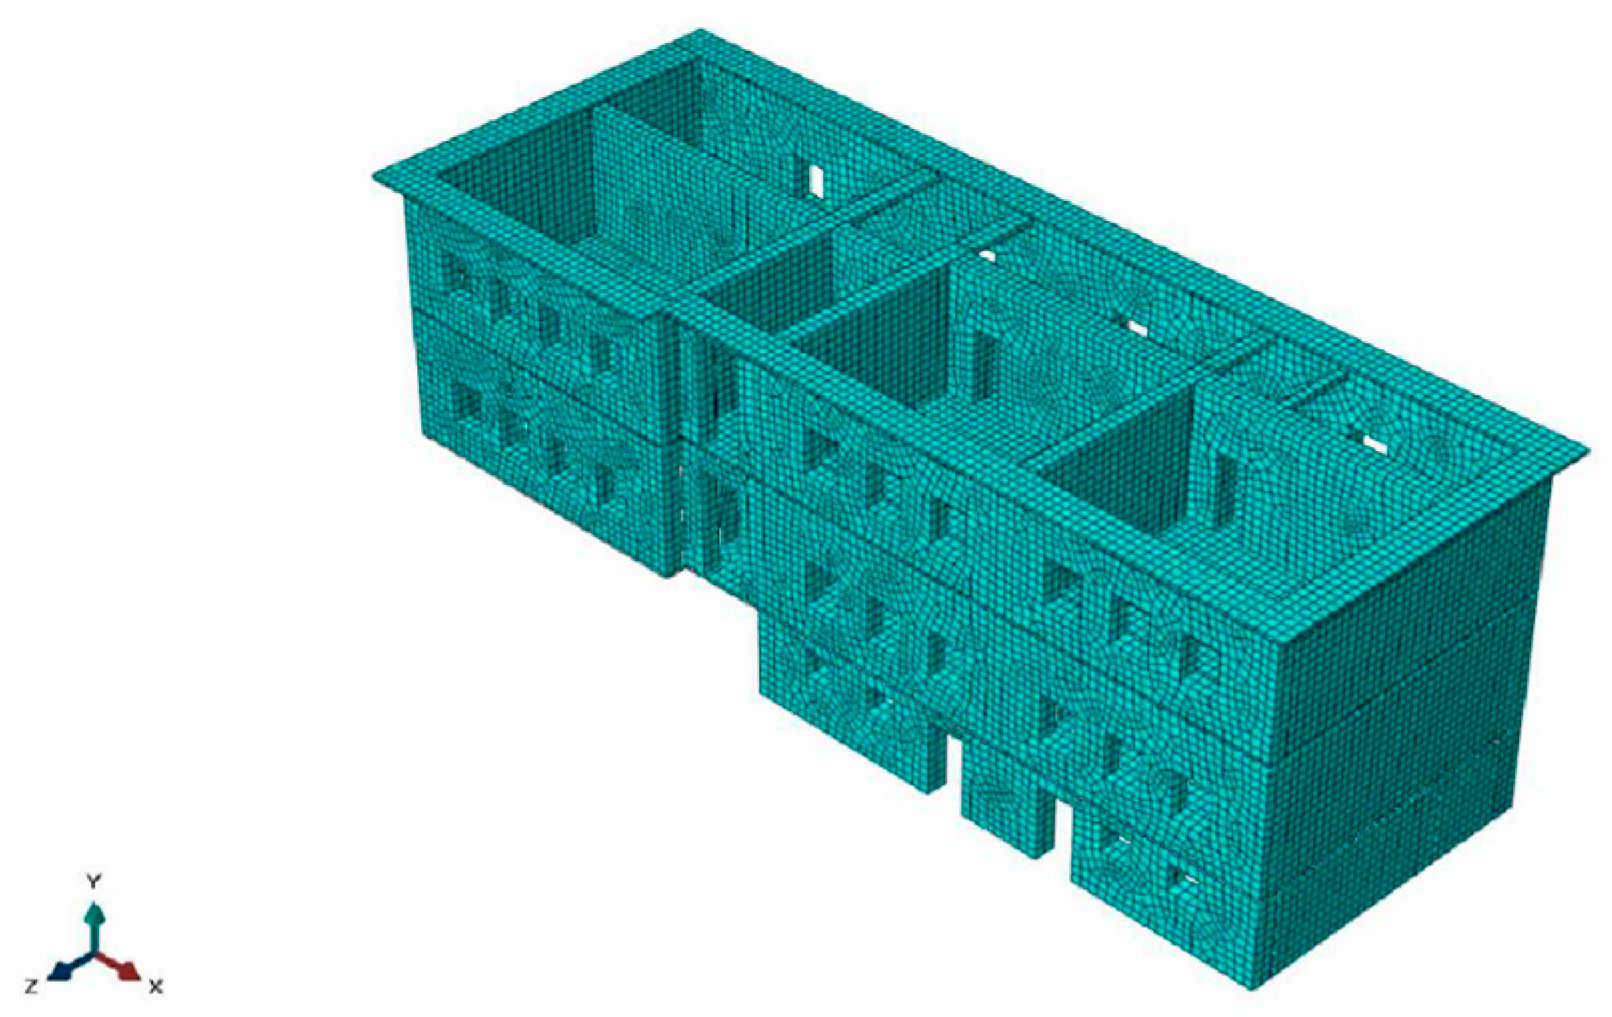
25] and Greek Code for Interventions of Masonry Structures regulations has been applied for the study of a three-story building with stone and brick masonry, floors with metal and timber beams and a timber roof [
26]. The defined performance levels—an important parameter introduced by the modern codes—were used as they determine the level of the applied seismic demands. Both load-based and displacement-based assessments were applied, and it was concluded that the displacement-based method allows for the usage of the nonlinear response of the masonry components, leading to a less conservative evaluation and limiting the extent of the required strengthening schemes, something useful, especially in heritage buildings, where extended interventions are not recommended.
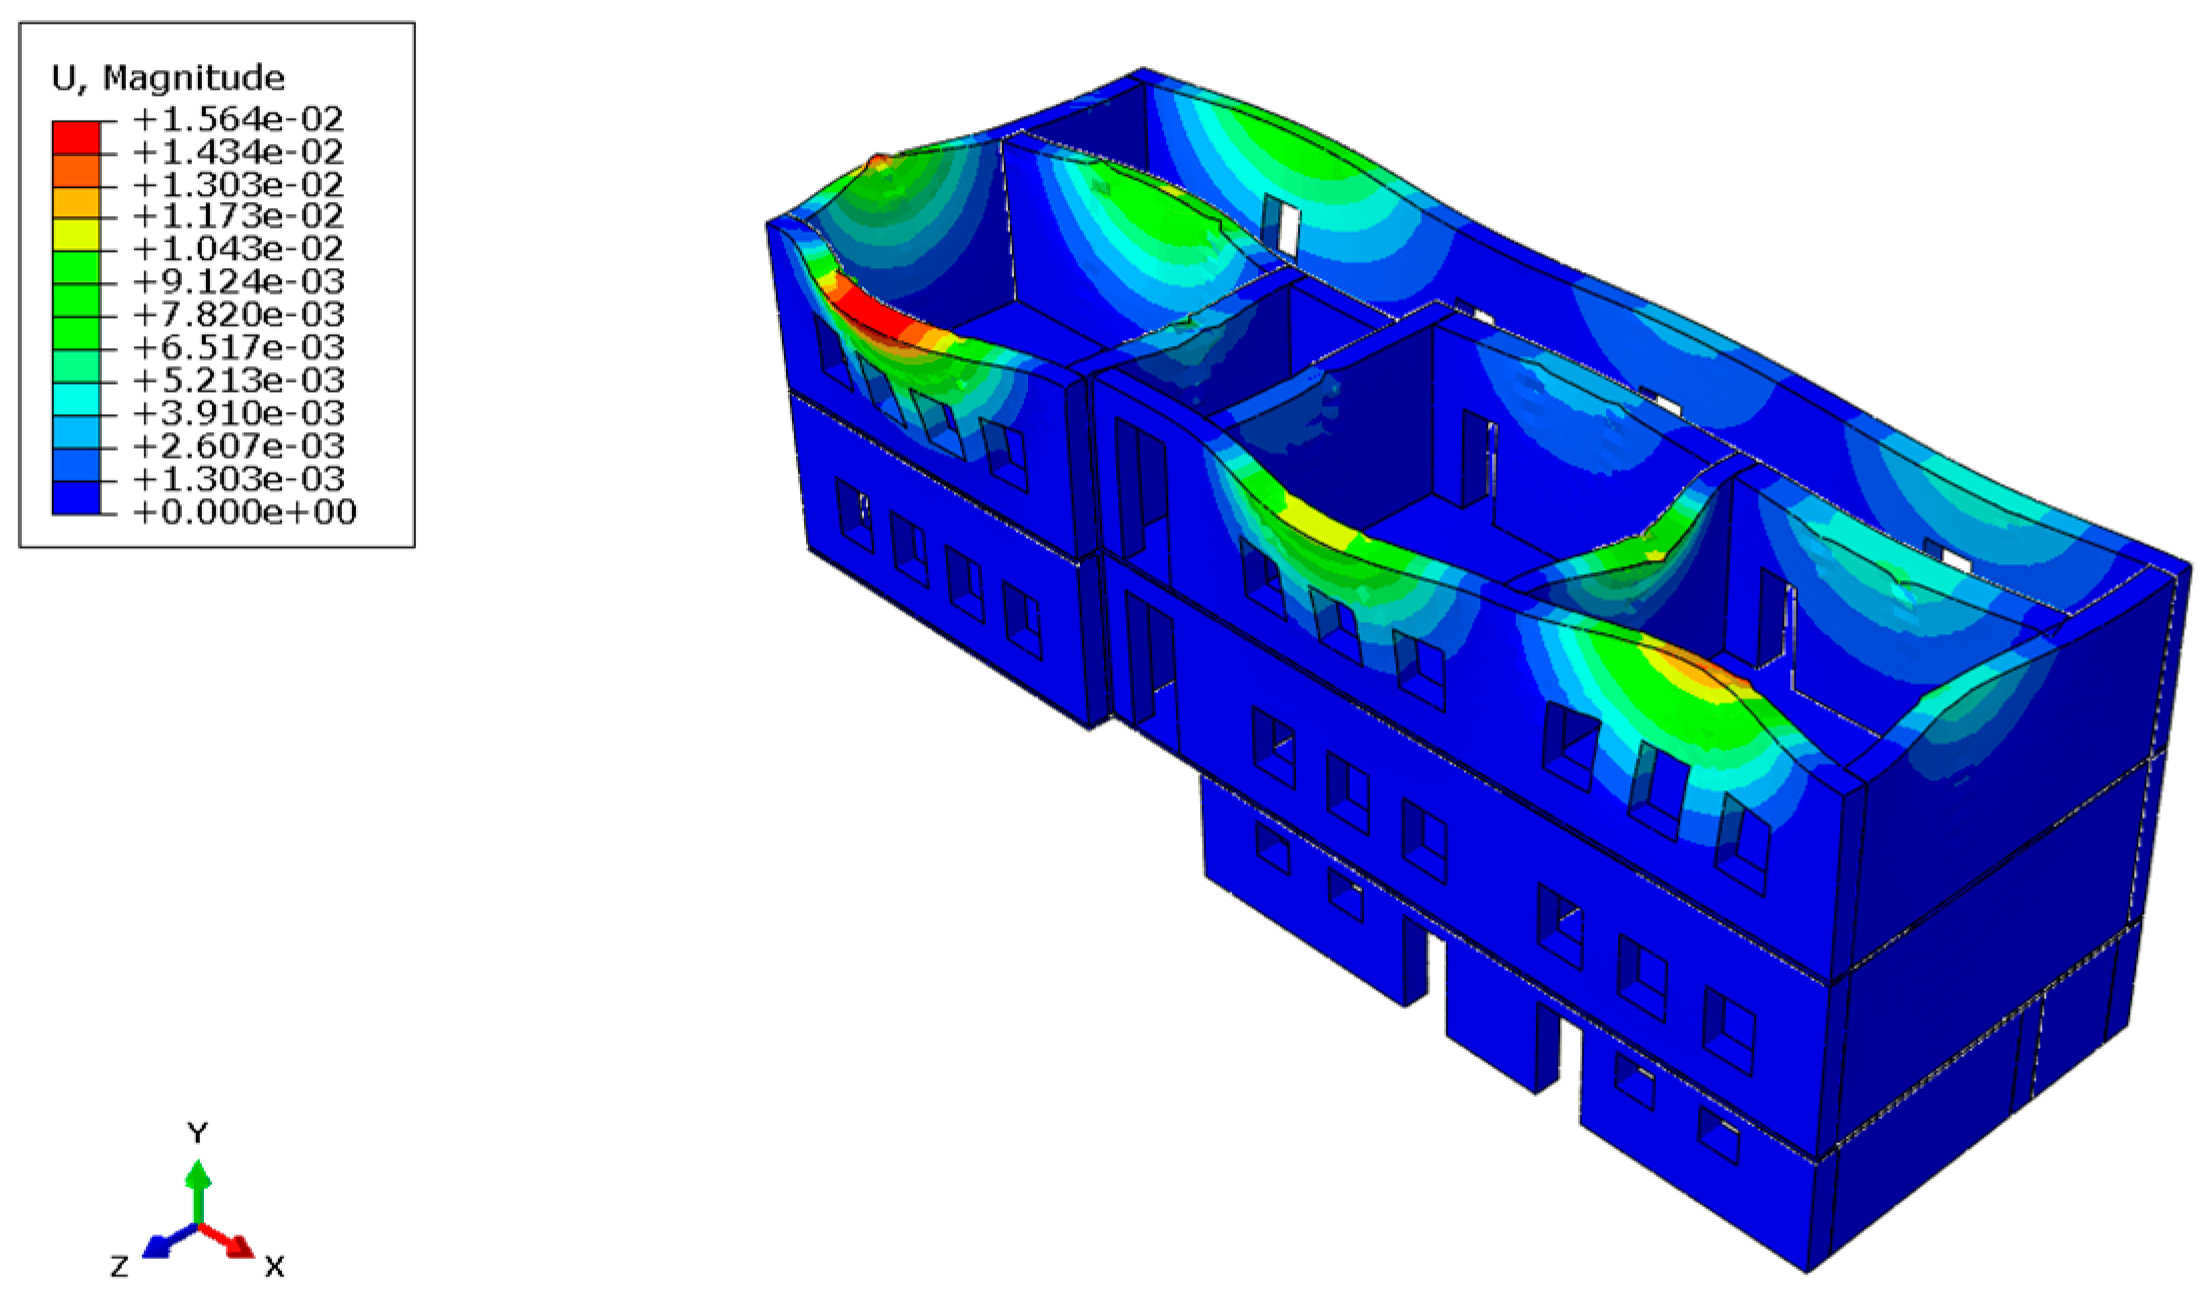
In our case study, based on the results of the spectral analysis method and considering the overestimation of the stresses that this method provides, stress results were collected in selected cross-sections of walls and columns, and then the corresponding vertical and horizontal stresses were calculated. These forces were used to estimate the resistance of the elements to bending and shear, as well as the limit values of deformation. This was followed by a check in terms of forces and deformations according to the KADET. To ensure a sufficient safety margin, the capacity of the wall controlled by bending can be expressed in terms of relative displacement and is taken equal to the corresponding nominal values of δu, θu, determined for in-plane and out-of-plane bending of the walls. Accordingly, the shear-controlled wall capacity can be expressed in terms of relative displacement or rotation and is taken equal to the corresponding nominal values of δu, θu, determined for the in-plane and out-of-plane bending action of the walls.
3.2.2. Failure Control for In-Plane Wall Action
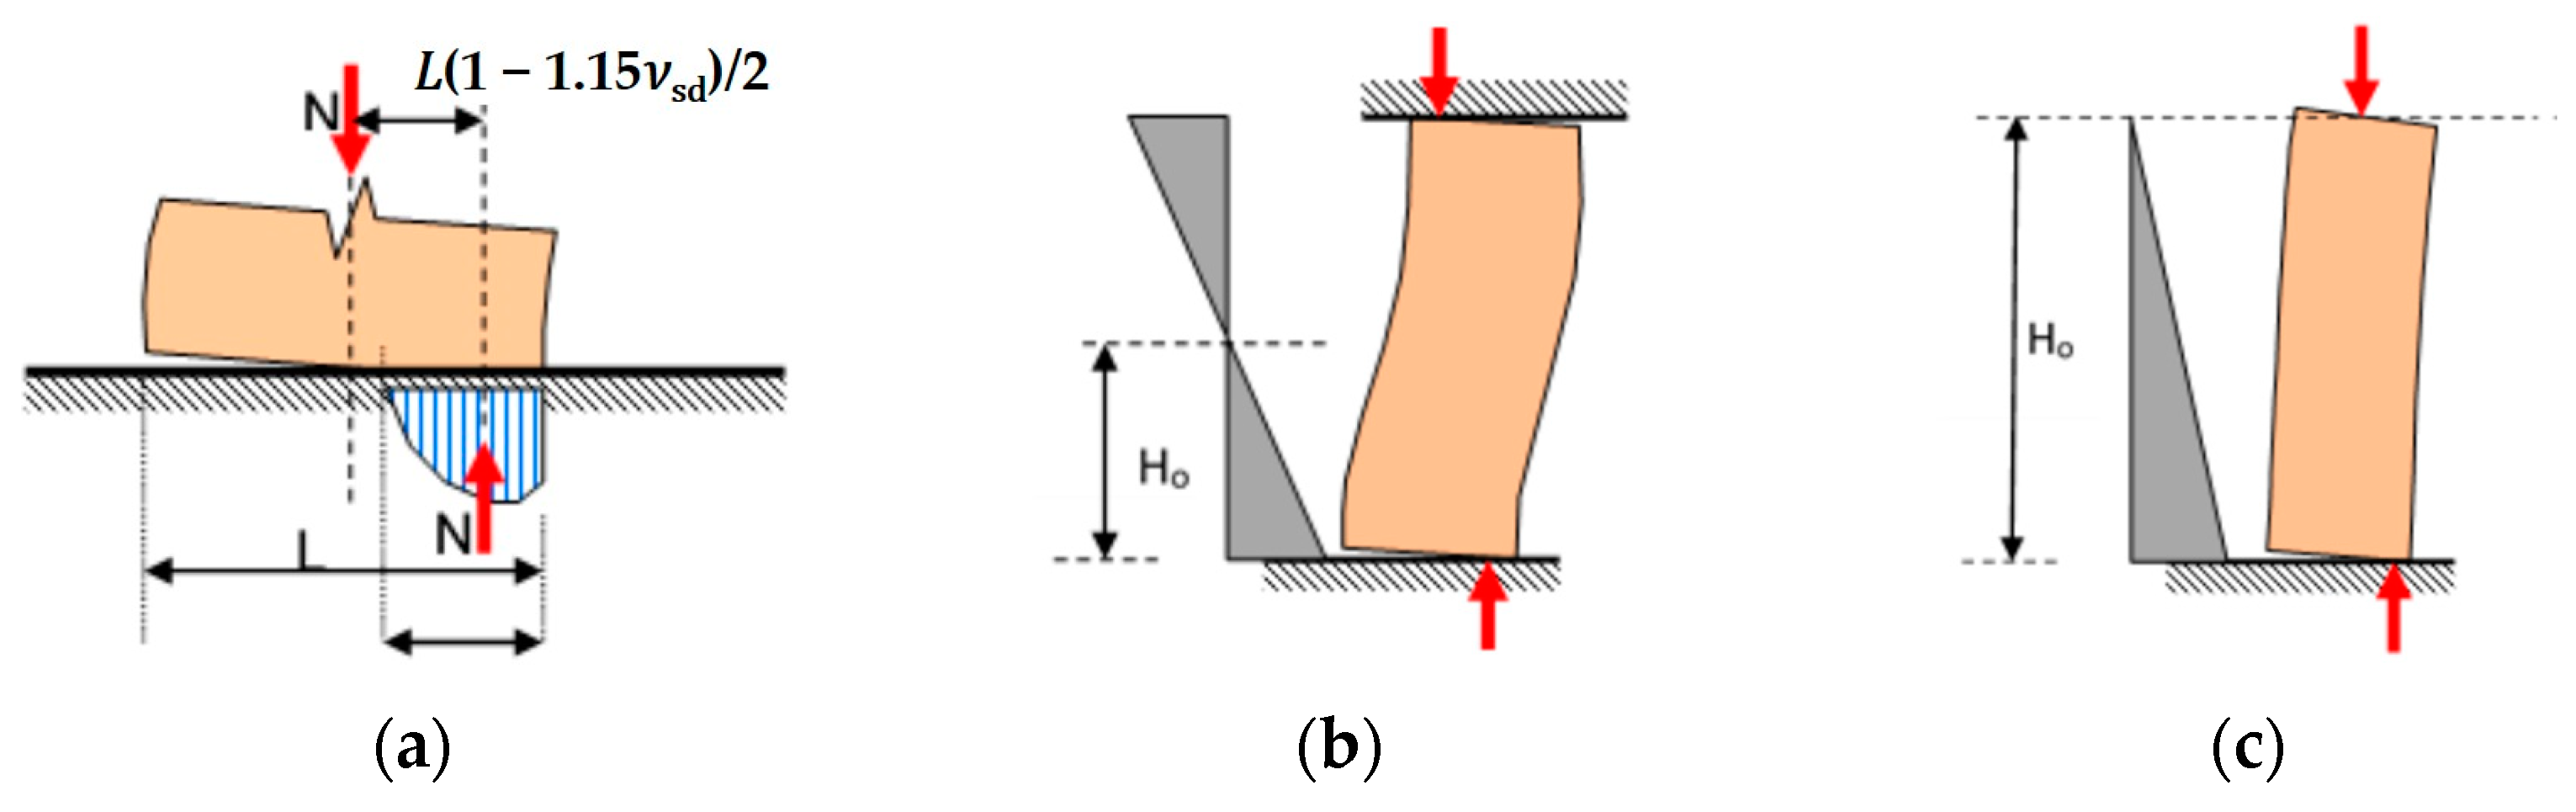
Structural elements such as unreinforced masonry (URM) subjected to vertical axial force and in-plane horizontal shear are considered. When checking a cross-section against in-plane bending, the tensile strength of the masonry is neglected, and, accordingly, an inactive part of the cross-section area is assumed. The bending moment that the cross-section can take depends on the compressive strength of the masonry and on the value of the (beneficial) axial load, according to the following relationship (
Figure 19) as follows:
where
Nsd is the axial load of the wall for the seismic combination
L is the horizontal in-plane dimension of the wall (length)
ν
sd = N
sd/(L × t × f
md,c) is the reduced axial load with f
md,c = f
mc/γ
m, where f
mc is the average compressive strength of the masonry as obtained from in situ tests and from additional sources of information, and γ
m is the safety factor for the masonry according to the data reliability level according to [
2], t is the wall thickness.
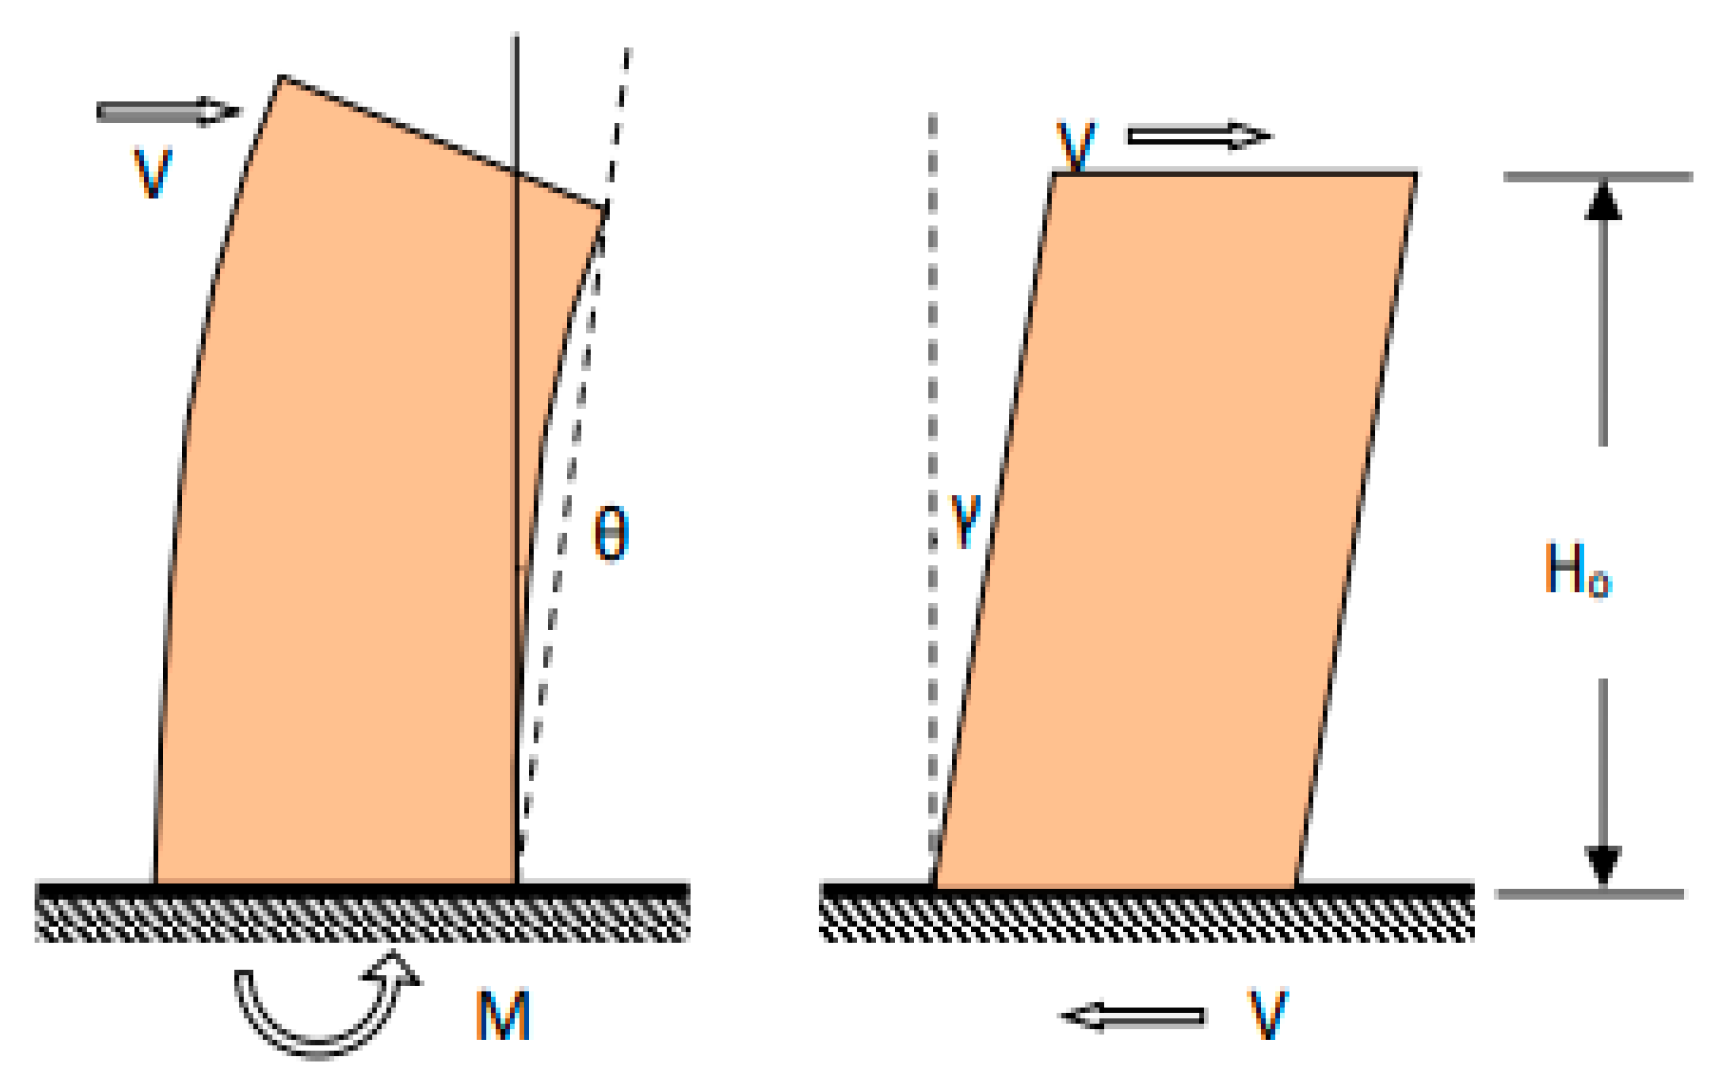
During the shear test, the shear capacity V
f (
Figure 20, Figure S7.3 KADET) is calculated from the equation,
where H
0 is the distance between the cross-section at which the maximum moment is developed and the point of zeroing of the moments.
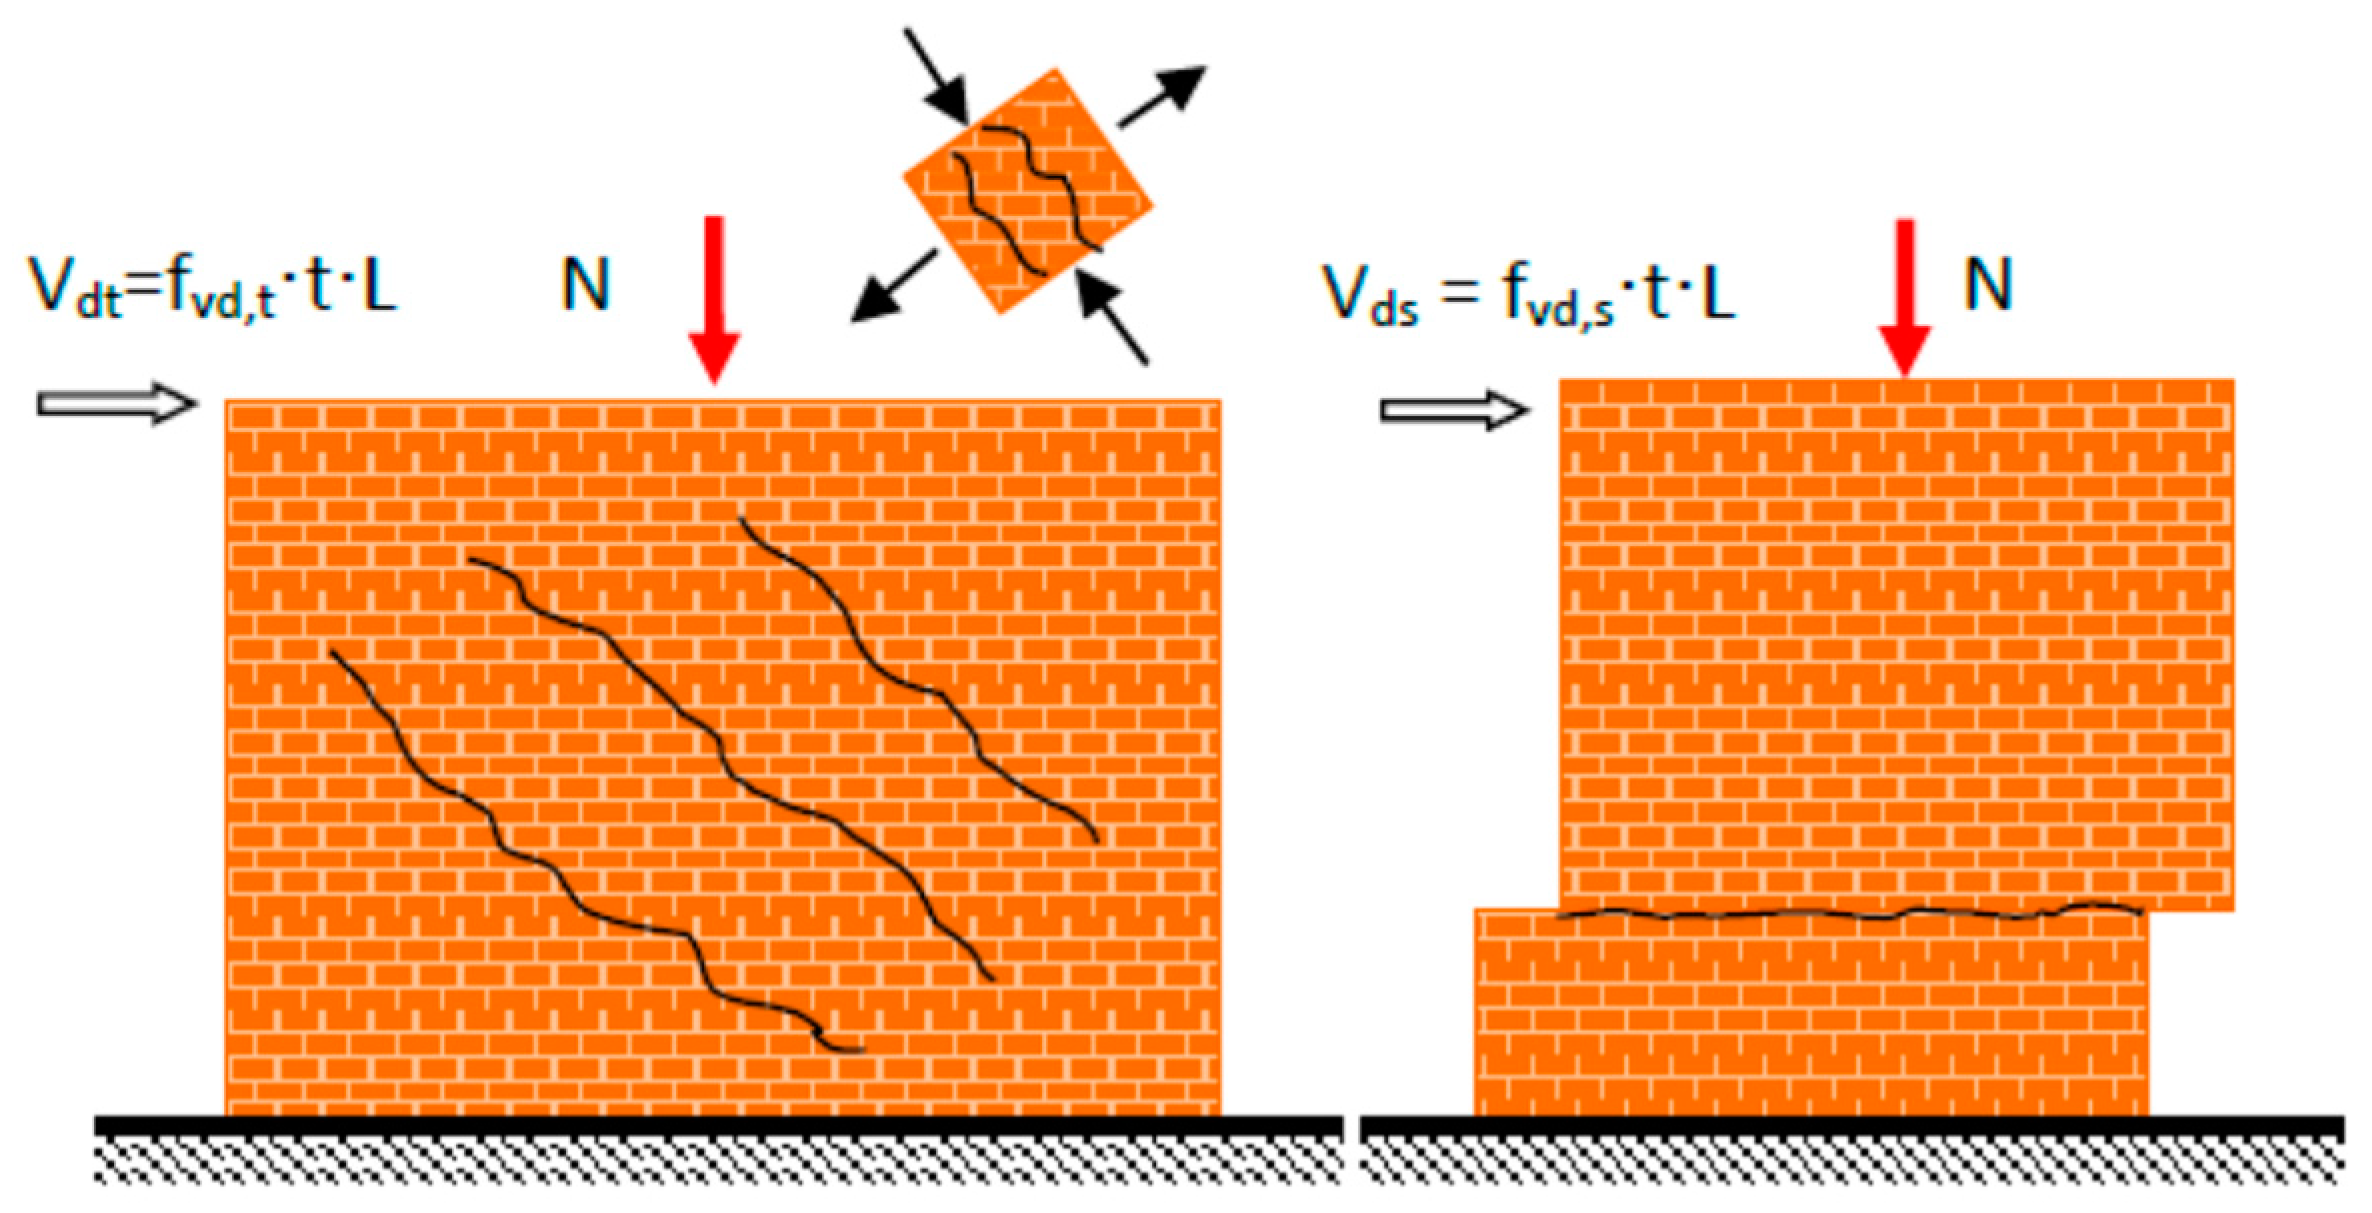
The in-plane shear strength of the wall is defined as the minimum of the following two shear failure mechanisms (
Figure 20):
Due to diagonal tensile failure [
2]
where
f vd,t is the shear strength of the masonry related to diagonal tensile cracking.
f md,t is the representative value of the tensile strength of the masonry.
Due to sliding along horizontal joints, the shear resistance develops on the surface of the wall under compression only [
2].
where
L′ is the compressed area of the wall and is calculated as a function of the eccentricity of the load, ey:
L′ = L when ey ≤ L/6
L′ = 3 (0.5 − ey/L) when L/6 < ey < L/2
L′ = 0.0 when L/2 ≤ ey
t is the wall thickness
f vd,s the shear strength of masonry associated with sliding along a friction surface.
fvm0 is the cohesion that develops at the mortar–stone interface.
μ is the apparent coefficient of friction along the sliding surface, taken equal to 0.4.
Ultimate shear resistance of the wall: Vv = min (Vv,t, Vv,s)
The wall is controlled by shear if V
v ≤ V
f; otherwise, the wall is considered to be controlled by bending. The yield resistance f
y is obtained as the minimum of the capacity shear V
f, when the moment is critical, and the shear strength V
v when the shear is critical for failure [
2]. Therefore, during the adequacy check, the design shear is compared with the minimum of the values V
v and V
f. More details can be found in [
19,
20,
21].
Based on the results of the spectral analysis, the horizontal seismic force has been calculated for the application of the method with a force control criterion.
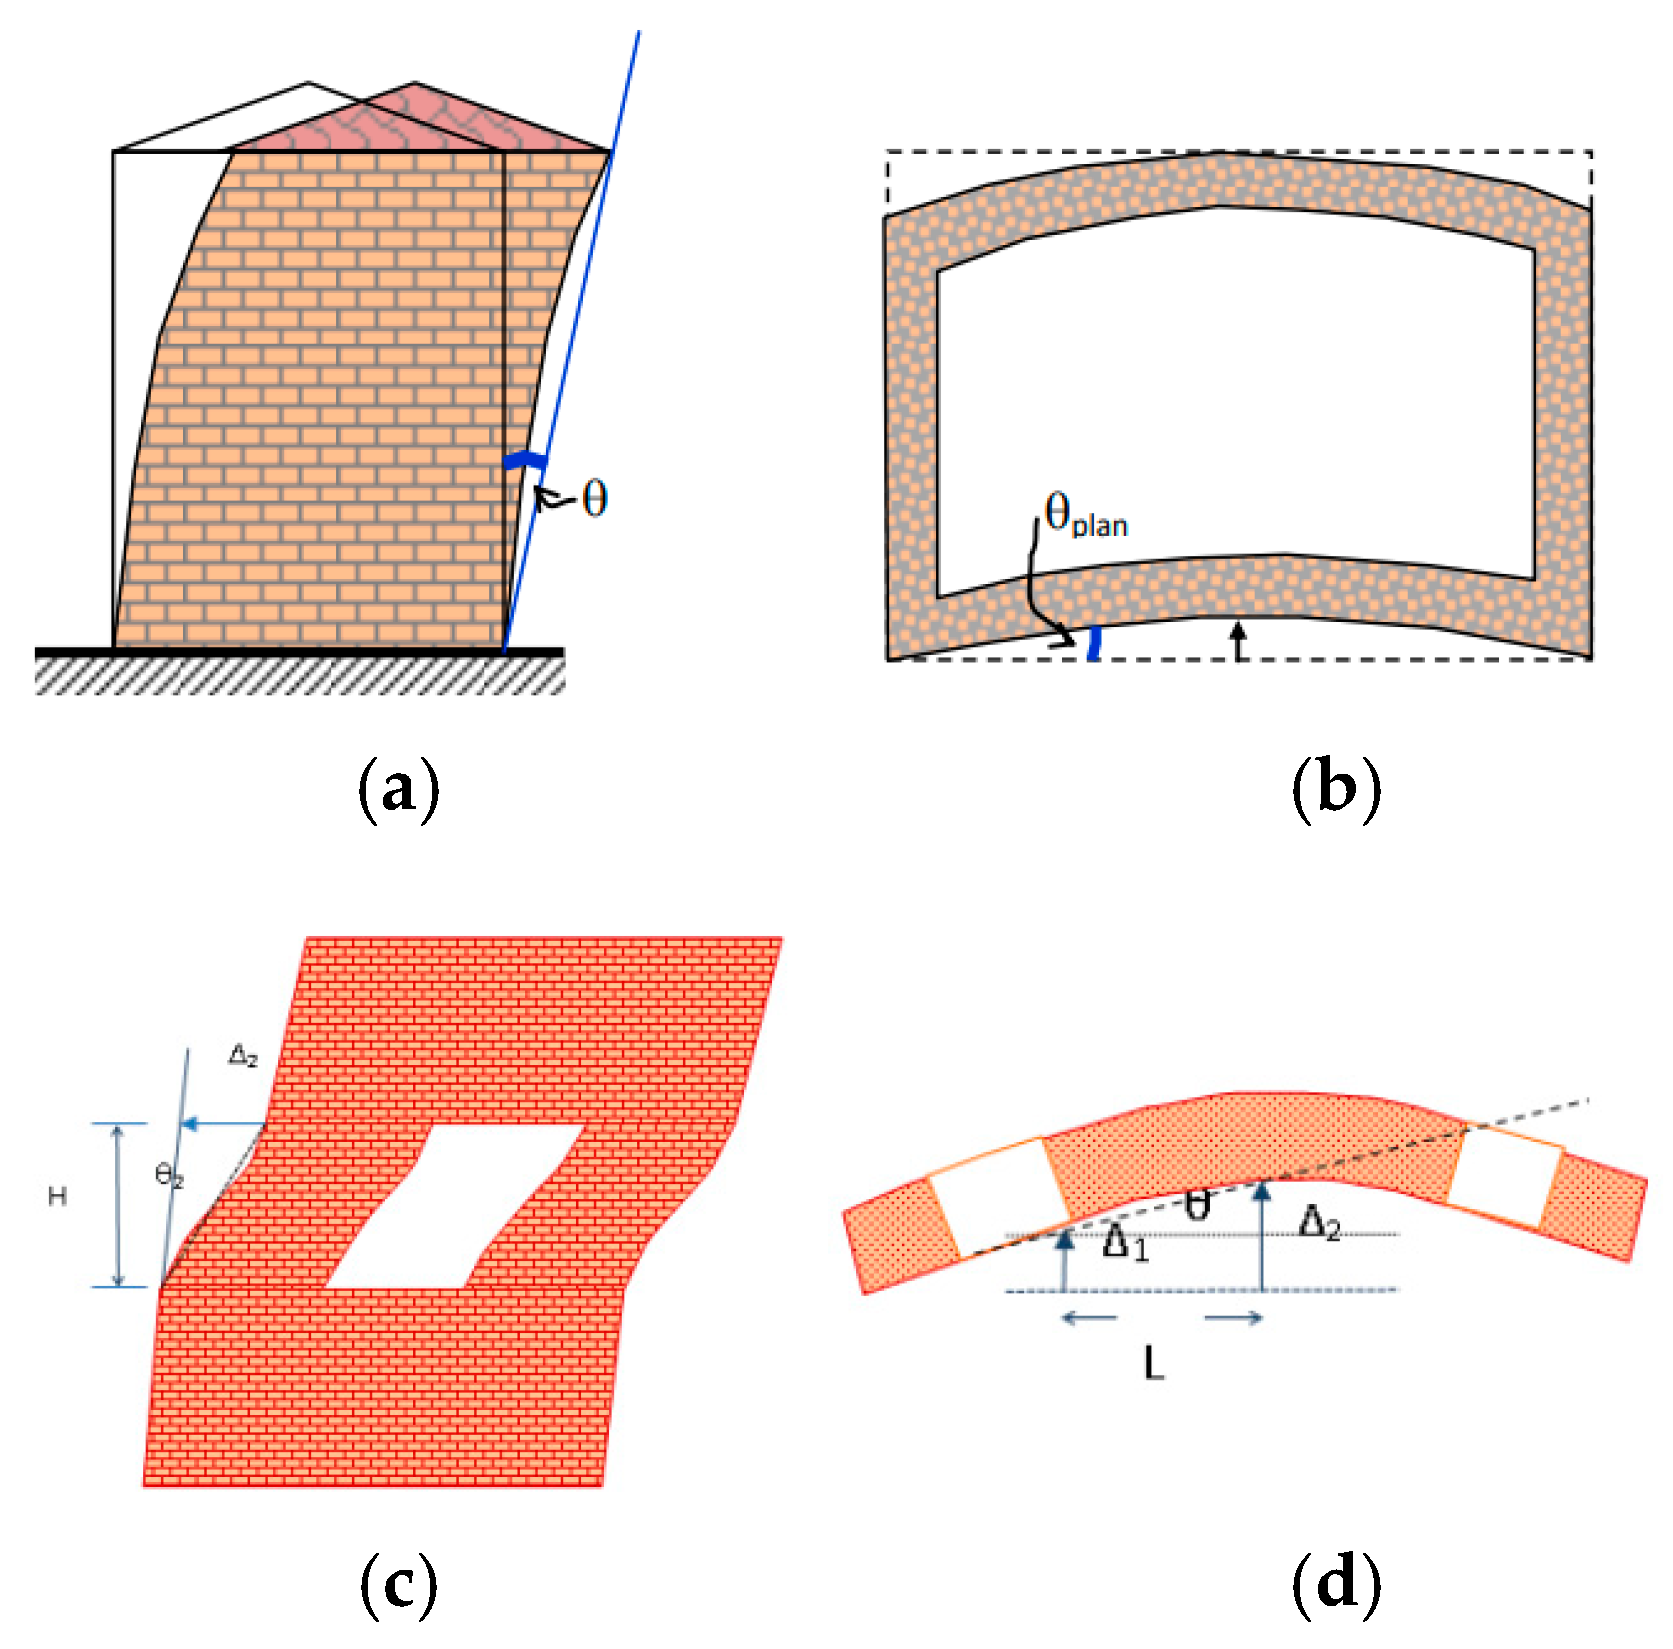
For the displacement-based assessment, the ultimate in-plane failure strain, θu, depends on the shear failure mechanism and on whether the wall is a primary or secondary member (
Figure 21). For the control in terms of deformation, we have the following [
2]:
(a) The capacity of a wall made of unreinforced masonry, which is controlled by bending, can be expressed in terms of relative displacement and is obtained from the relations:
where
L is the horizontal in-plane dimension of the wall (length), and Ho is the distance between the cross-section at which the bending capacity is achieved and the point of zeroing of the moments.
(b) The capacity of a wall of unreinforced masonry controlled by shear can be expressed in terms of reduced relative displacement and is taken equal to
The relative rotation is defined as the deviation of the chord joining two points in the deformed state of the element, compared to the straight line joining these two points before any deformation is imposed (
Figure 22). For the definition of this reference line, the rotation of the supports is taken into account as shown in
Figure 22b [
2].
It should be mentioned that the deformation capacity of a load-bearing element that fails due to in-plane bending depends on many parameters, such as the way the masonry is constructed, the presence of “reinforcement” elements in the masonry body, etc. Therefore, the estimation of appropriate deformation capacity values can be based on appropriate experimental results. In the absence of more precise data, the above-mentioned values for primary and secondary walls can be used, according to KADET.
Furthermore, according to the KADET, the walls that contribute to the load-bearing capacity and stability of the building under seismic loads will be characterized as primary. The remaining load-bearing elements that contribute to the bearing of vertical loads, but do not contribute significantly to earthquake resistance, or their degree of contribution is rather unreliable, due to low stiffness or strength or ductility (or due to uncontrolled construction methods), may be characterized as secondary. Such elements include the so-called ‘tsatmades’, i.e., cases of wall construction with a wooden frame and facade panels (sandwich wall). According to EC 8-1, it is indicated that load-bearing elements that do not satisfy the appropriate limits for the ratios of their geometric dimensions may be characterized as secondary.
The initial shear strength f
vm0 (cohesion) of the masonry may be determined from the evaluation of a database on the results of tests or from the values which are given in Eurocode 6 for various general-purpose mortars and masonry units. In Eurocode 6, cohesion between lime mortar and stone bed is 0.10 MPa [
5]
The tension strength of the masonry unit, fmd,t, is the nominal value fm,t divided by the safety factor, γm. According to KADET, the safety factor γm is related to the knowledge level regarding the geometric and material properties of the examined building (a higher value of γm refers to a lower knowledge level). It takes values 1.35, 1.20, or 1.50 for the load-based method of assessment, and 1.10, 1.00, or 1.20 for the displacement-based method of assessment. According KADET, for stone masonry, in the absence of more precise data, the tensile strength of the masonry, fm,t, may be taken equal to 0.10 MPa, when the compressive strength of the mortar does not exceed 2.0 MPa, equal to 0.20 MPa, when the compressive strength of the structural mortar is between 2.0 and 5.0 MPa and equal to 0.40 MPa, when the compressive strength of the mortar is greater than 5.0 MPa.
The rotation corresponding to the stage of yield strain of surface elements of load-bearing masonry, θ
y, is the average reduced deviation between the deformed element and its chord at the onset of cracking (
Figure 21). This relative movement (drift) within the plane is θ
y = 0.0015 [
2].
The ductility index is defined as μ
θ = θ
u/θ
y. If the available value of the ductility index μ
θ of a structural element, a critical area of an element, or a connection of wall elements, exceeds a certain limit, the behavior is characterized as ductile, so its safety inequality will be expressed in terms of deformations δ. The boundary between ductile and brittle behavior is conventionally taken to be equal to 1.5 when referring to an available ductility index value that is based on the reduced relative displacements (i.e., chord rotation) of the walls, μ
θ. The control is carried out in terms of resultant forces and bending moments [
2], and specifically is carried out by checking the developed stresses from the three-dimensional analysis of the structure using the finite element method. In fact, based on the expected failure type (brittle or ductile), force- or displacement-based assessments are proposed to use [KADET]. Conventionally, if the available local plasticity, ductility index is ≥1.5, i.e., if the behavior is quasi-ductile, the controls are performed in terms of deformations. Otherwise, if the behavior is quasi-brittle, the controls are performed in terms of forces. Since URM structures are brittle, the ductility index measures mainly the mechanical behavior of the structure as a whole system and not the brittle behavior of one individual element. Nevertheless, it can be used for prioritizing intervention measures on a damaged building.
3.2.3. Failure Control for Out-of-Plane Wall Action
The yield resistance F
y of the element (wall or pier) is obtained for out-of-plane bending about a horizontal axis with axial force (
Figure 23) as [
2]
where
is the average compressive stress due to axial action in the control cross-section.
l and t are the length and thickness of the cross-section
fmb,c is the compressive strength of the masonry
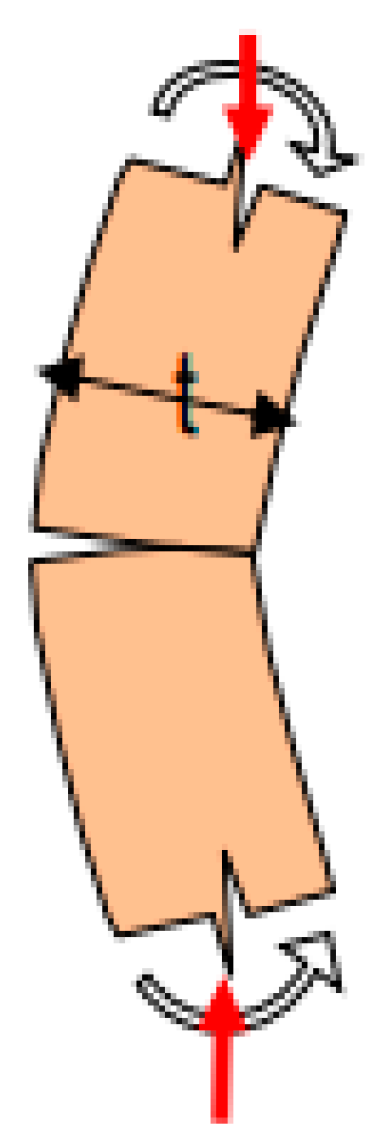
In this case, of the out-of-plane bending moment about the vertical axis, the bending moment that the critical cross-section can take is estimated based on the corresponding tensile strength of the masonry:
where
ℓ and t are the length and thickness of the bent section of the element, respectively; in this case, ℓ corresponds to the height of the wall.
fmd,t the representative tensile strength of the masonry (equal to fmt/γw).
Taking into account the wall support conditions, the resultant force V
f that stresses the wall in out-of-plane action is calculated from the ratio of the corresponding moment to the shear length of the wall, H
o, i.e., the distance from the critical section where the maximum moment is developed, to the point of zeroing of the moment (
Figure 24).
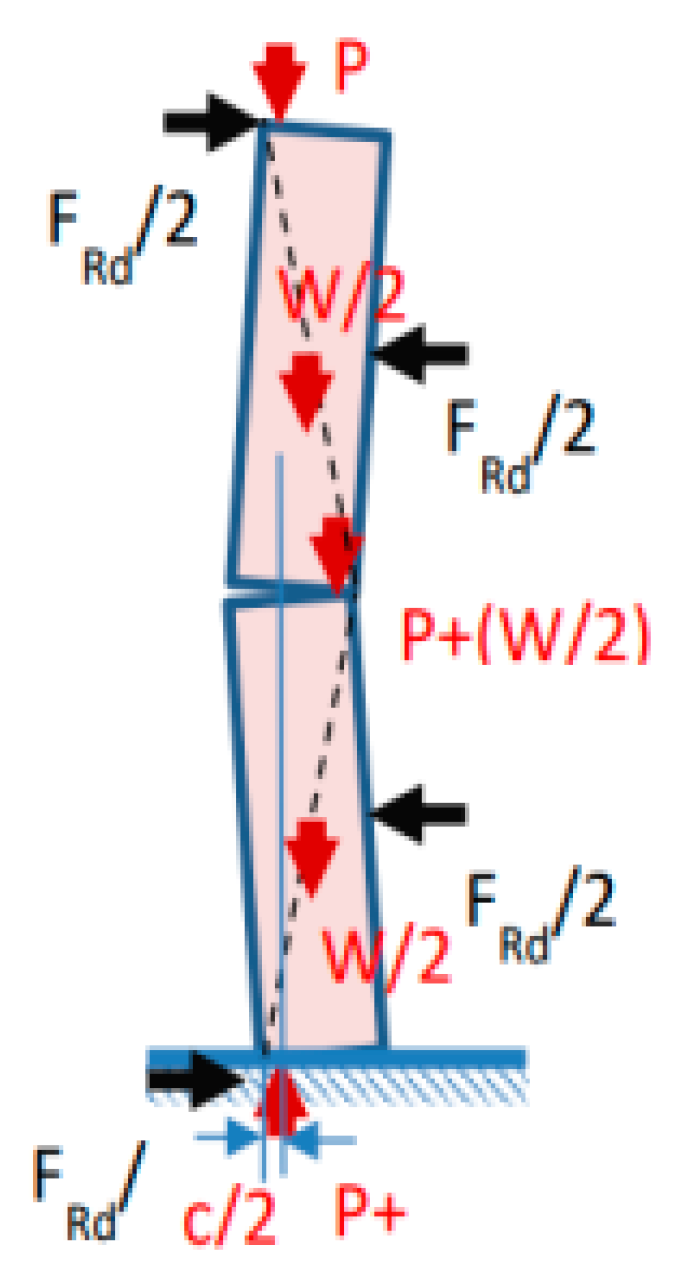
As F
Rd is defined, the resistance of the element against overturning, and it is calculated (
Figure 25) as [
2]
where
W is the weight
P is the vertical load on the top
λ = 2 for a wall with top and bottom, or left and right support (fixed support)
λ = 1 for all other cases (i.e., cantilever wall)
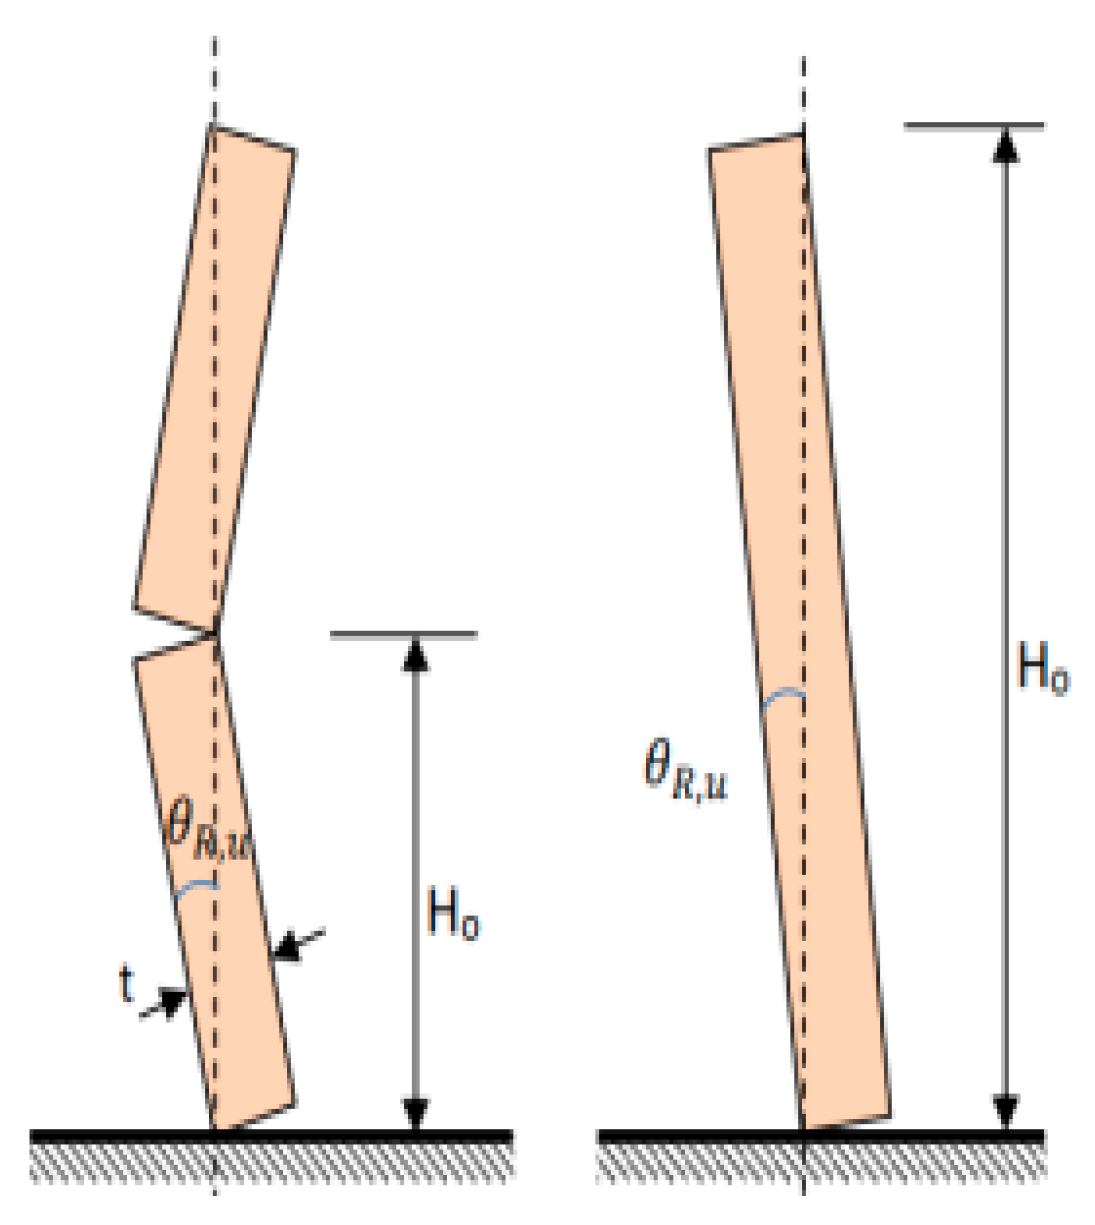
For the displacement-based assessment, the overturning rotation of a section of the wall that is bent about an axis, the limiting deformation (
Figure 24) is taken as
where H
o is the distance of the point of maximum displacement from the failure edge.
(a) For walls controlled by bending in out-of-plane action, the deformation capacity is defined as follows [
2]:
The minimum of the values will be taken as the failure angle
(b) For floors where there are rigid partitions, that is, where a floor shear is defined, the following limits can be used for the relative horizontal movement of a floor from load-bearing unreinforced masonry, based on the method of construction of the masonry:
- -
0.7% for masonry with solid bricks;
- -
0.45% for masonry with perforated bricks;
- -
0.6% for masonry made of adobe.
For the yield strain θ
y, according to [
2], the chord rotation angle for out-of-plane bending is θ
y = 0.002
The ductility index is defined as μθ = θu/θy, and if the available value exceeds a certain limit, the behavior is characterized as ductile, so its safety inequality will be expressed in terms of deformations δ.
3.2.4. Performance Levels
The performance levels of the load-bearing structure are defined as a function of the tolerable degree of damage as follows, specifically for the needs of the Greek code for interventions (KADET) [
2]:
Performance level (A) “Limited damage”. The structure has only suffered minor damage. The structural elements retain a high degree of load-bearing capacity and stiffness.
Performance level (B), “Significant damage”. The structure has suffered significant damage, some of which may be severe, without local collapse, but it has residual load-bearing capacity and stiffness.
Performance level (C), “Impaired collapse”. The structure has suffered severe damage, most of which is beyond repair. The residual load-bearing capacity and stiffness are low, but the vertical elements are still able to carry the vertical loads.
The check about the performance level in terms of internal forces and deformations is carried out for individual structural members.
For performance level A, acceptance criteria are expressed in terms of elastic forces/deformations, and for levels B and C, performance checks for brittle members/and or failure modes are carried out in terms of forces, whereas checks for nominally ductile members the checks may be expressed preferably in terms of deformation [
15].
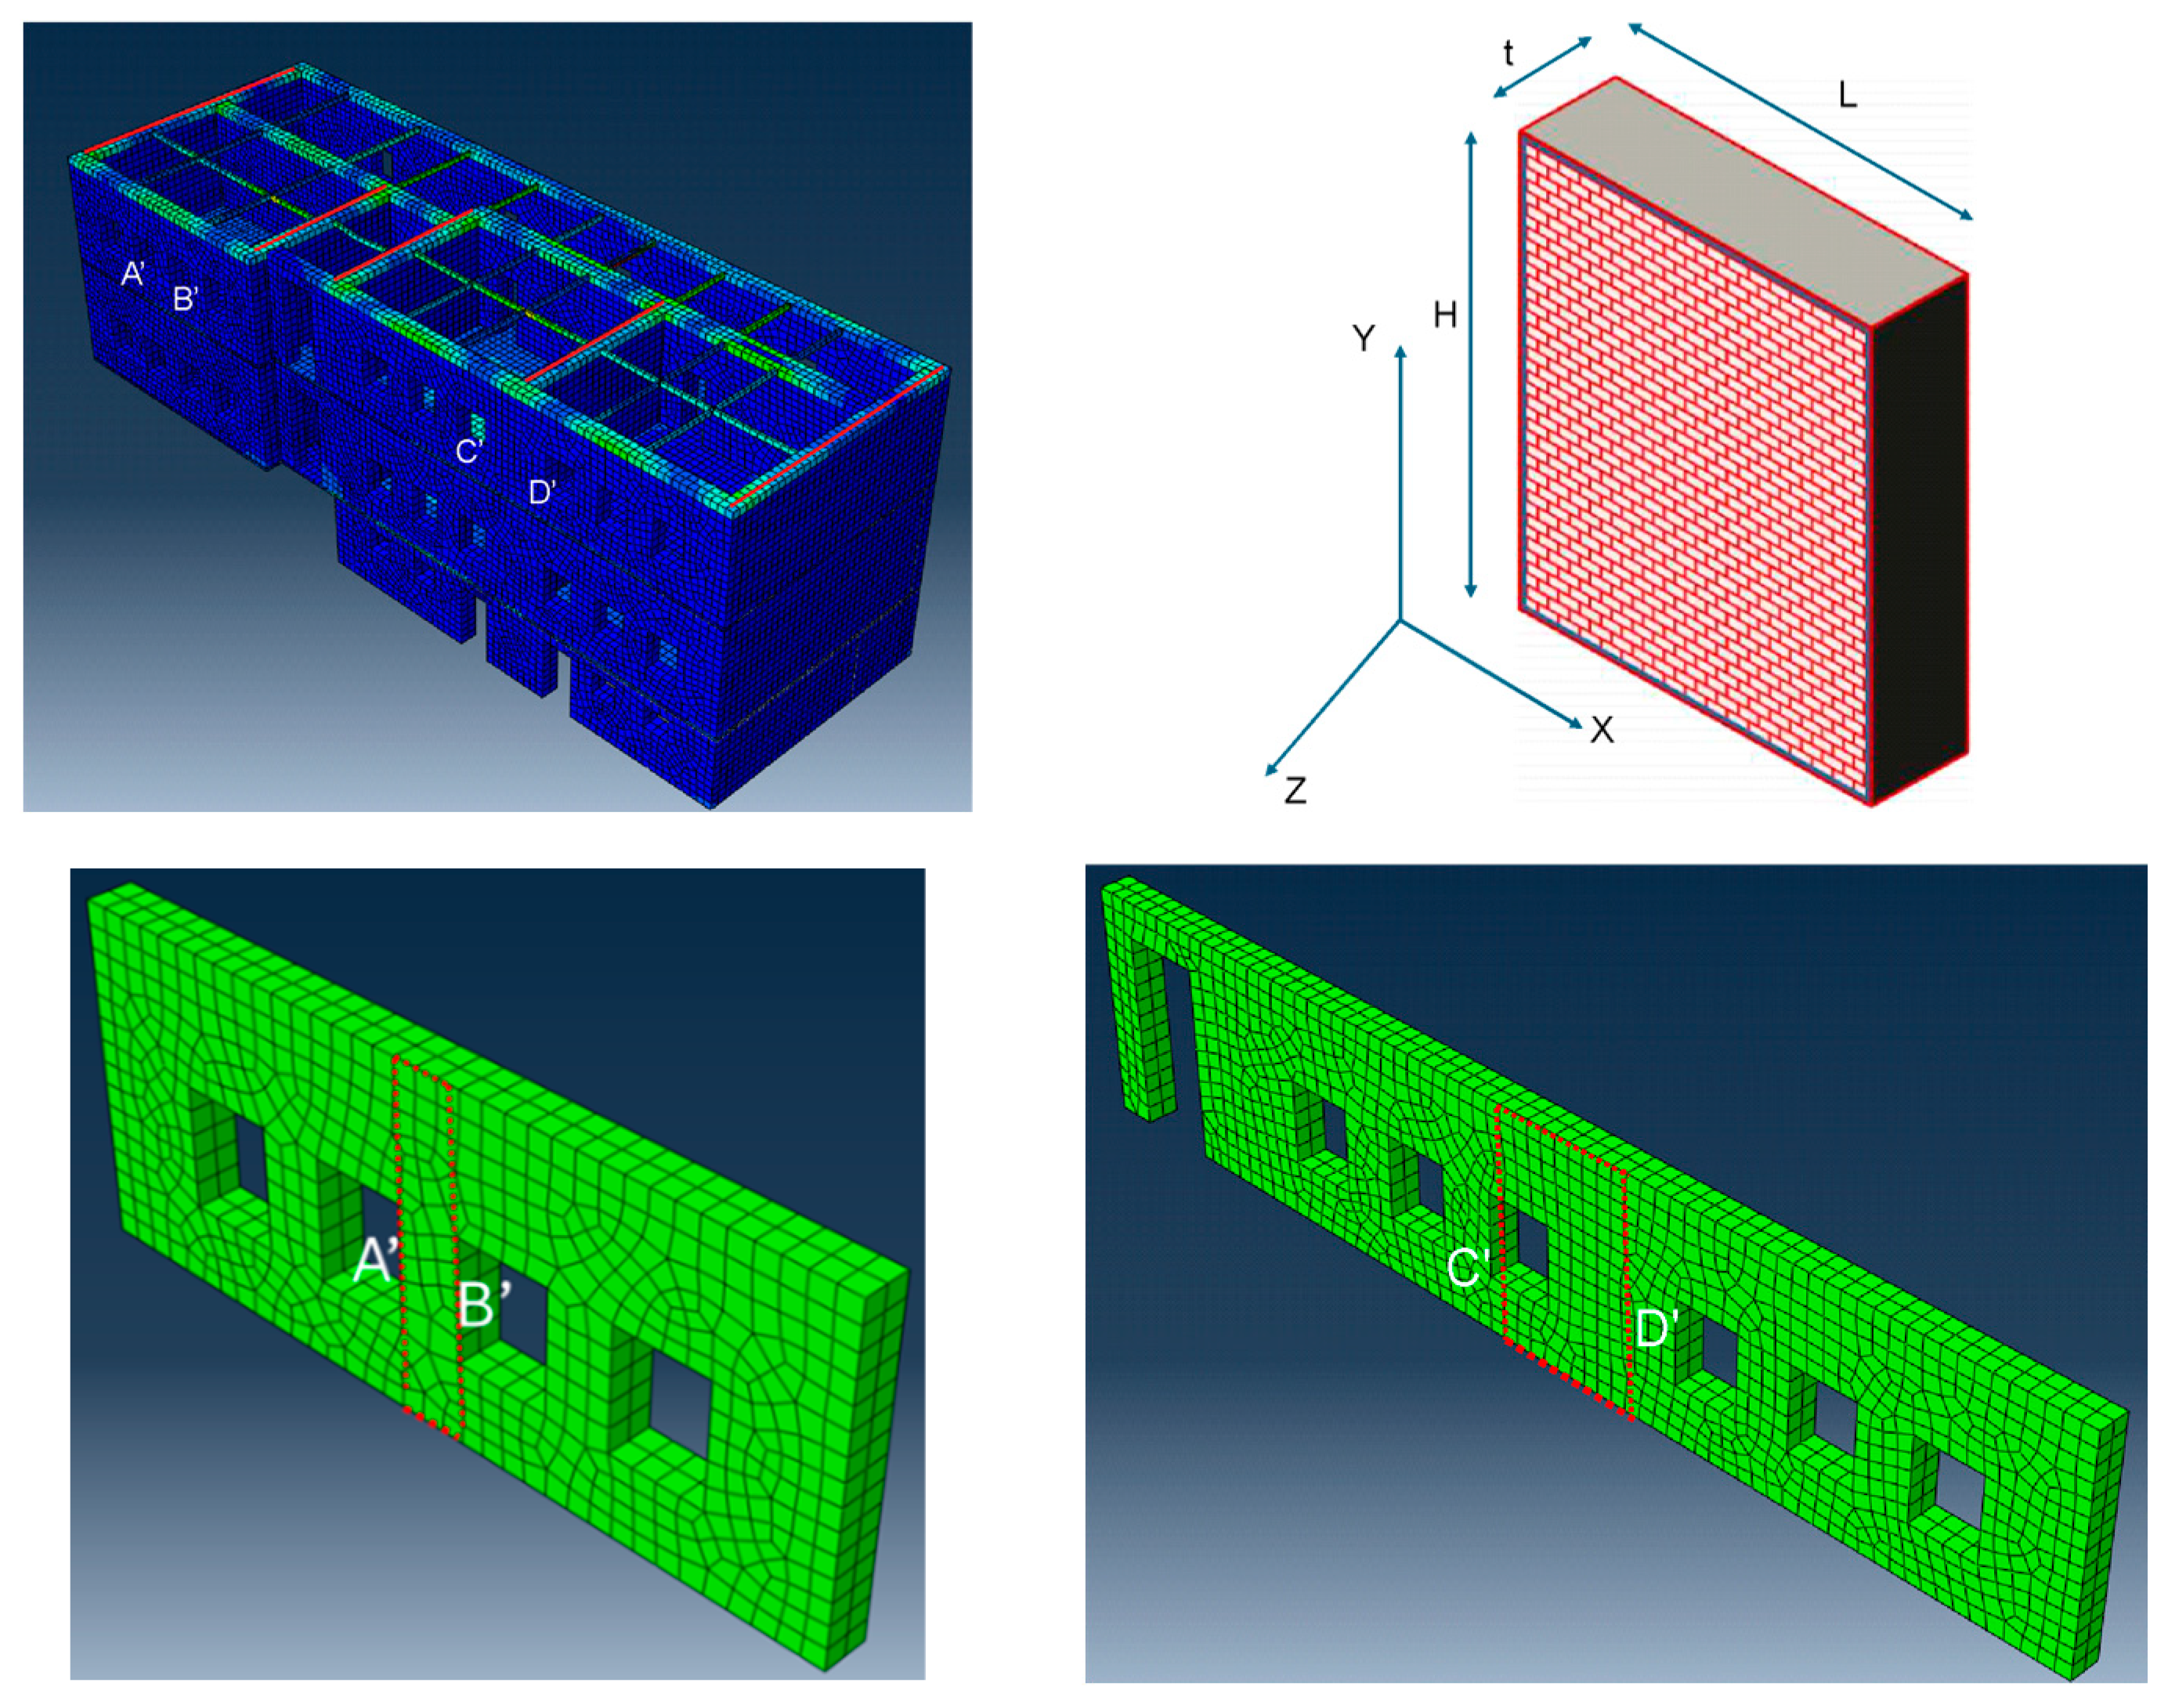
Based on the results of the spectral analysis of the final finite element model, control in terms of forces and deformations according to the KADET of selected piers (facade columns A’B’ and C’D’) is presented indicatively for selected pillars (
Figure 26). The results are given in
Table A1 and
Table A2 (see “
Appendix A”), where for these two piers, the performance level A and B control is presented.
In general, for the walls and piers of the floor on which the control was carried out, cover the deformation check (performance level B). The control in terms of forces (performance level A) is satisfied for all the piers for in-plane behavior and for some of them for out-of-plane behavior. The control in terms of deformation (performance level B) is satisfied for all the piers and the walls for both in-plane and out-of-plane behavior. This is critical to the selection of interventions.


