1. Introduction
As the majority of building stock in Europe has aged beyond its original design lifespan [
1,
2], there is a need for proper interventions. The assessment of building seismic vulnerability has gained importance in recent years, with researchers using various methods for preliminary evaluation by analyzing structural integrity and earthquake resistance [
3]. The holistic demolition and reconstruction (DaR) of massive RC buildings may not be a viable solution in some cases, due to high economic cost, environmental impact, and social disruption [
4,
5,
6]. Studies indicate that the DaR process relative to renovation could potentially have two to six times higher relative cost [
4]. The large-scale demolition of RC stock may have a negative impact on the environment, despite the recycled nature of some materials, as the carbon footprint from demolition equipment, waste transportation, and production of new concrete is significant [
5]. Furthermore, finding temporary housing and commercial spaces while maintaining community cohesion can be challenging [
6].
Consequently, the seismic and energy upgrade of RC buildings is a more feasible solution and has been proposed by many studies [
7,
8,
9,
10,
11,
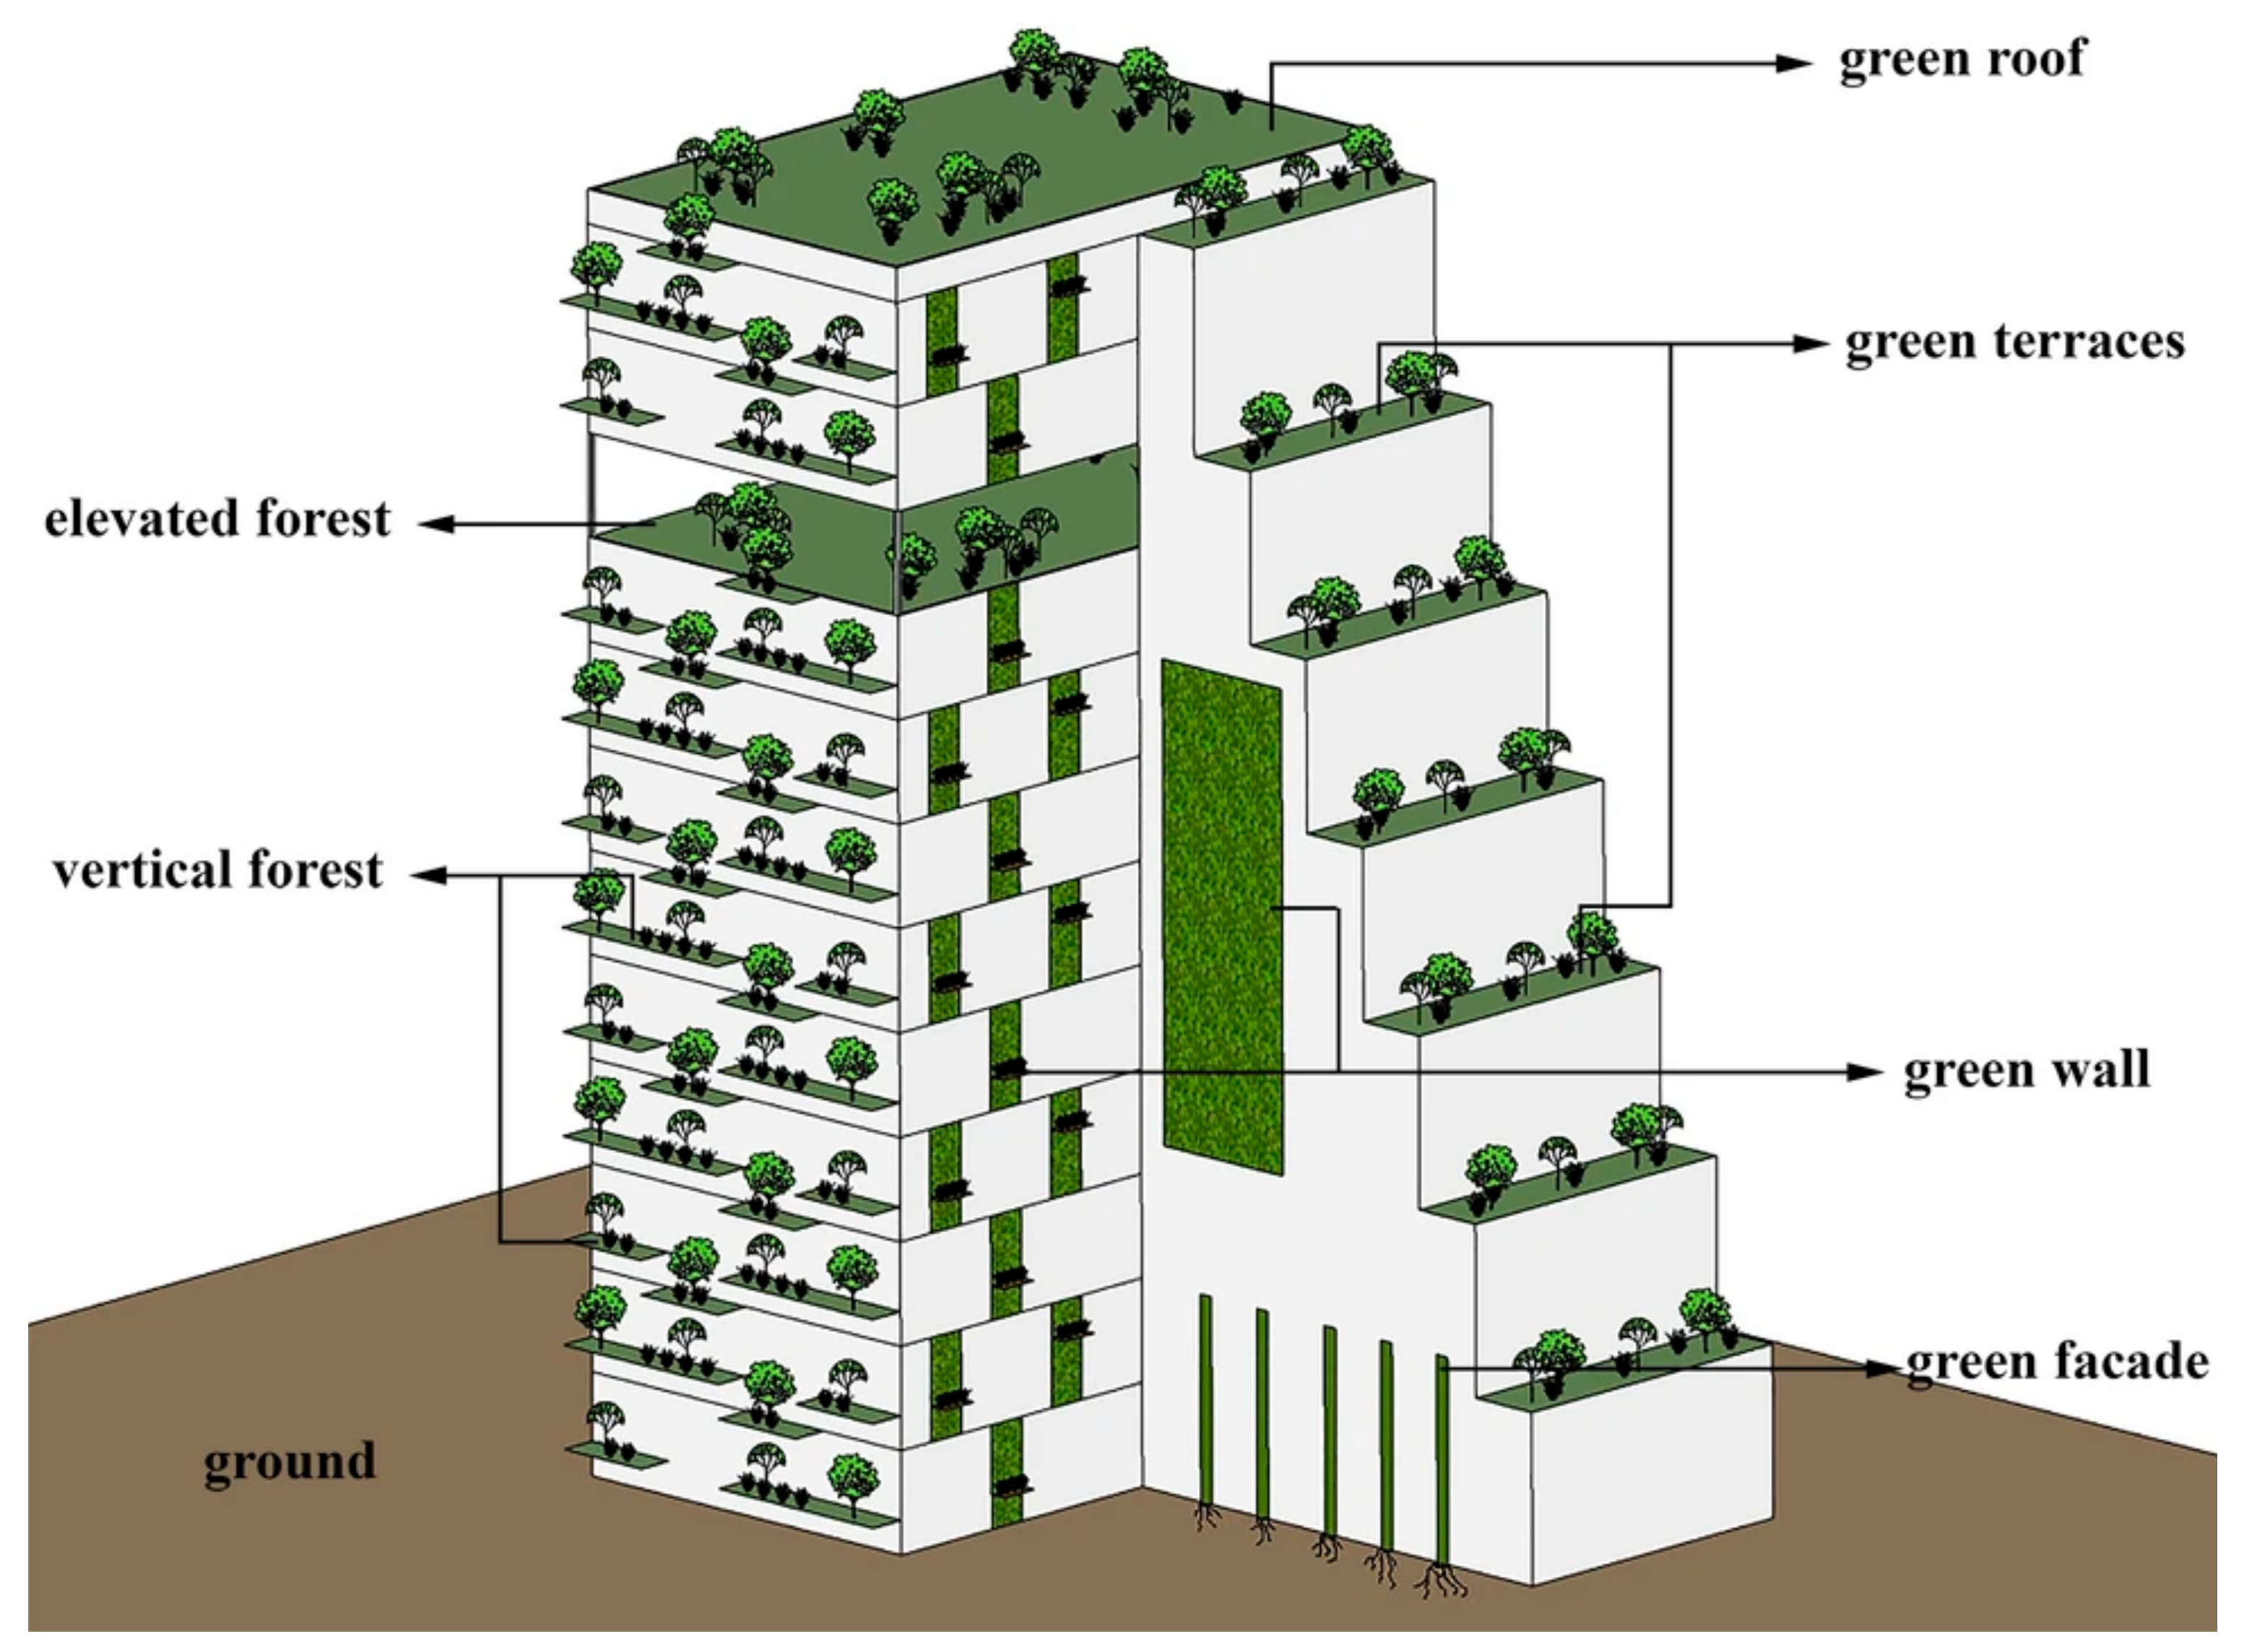
12]. Additionally, in the concept of reducing the carbon footprint, studies and building construction techniques have proposed the incorporation of Vertical Forest (VF) systems into existing buildings [
13,
14,
15]. VF systems may include (see
Figure 1) green facades (vegetation rooted in the ground and either using the wall itself to climb or independent support systems), green walls (type of living wall system where the plants, substrate, and structural support are directly attached to the building wall), green terraces and green roofs (plants growing on the horizontal terraces, which are built at different heights and levels), and vertical forests (groups of trees which grow on cantilevered balconies around the envelope of a building) [
16]. Despite the beneficial impact of VFs, the characteristics of the systems have not been extensively examined as a holistic solution but more like separate subsystems [
17,
18,
19].
Recent advances in artificial intelligence (AI) have shown promising applications in structural health monitoring and damage assessment. Convolutional Neural Networks (CNNs) have demonstrated significant capability in addressing missing measurement data recovery in structural monitoring [
20], while hybrid approaches combining CNNs with Bidirectional Gated Recurrent Unit (BiGRU) and squeeze-and-excitation mechanisms have proven effective in reconstructing structural acceleration responses under varying environmental conditions [
21]. Furthermore, innovative combinations of data augmentation techniques with adaptive optimization neural networks (DA-ASAPSO-CNN) have enhanced damage identification capabilities in steel bridges, particularly when dealing with limited data samples [
22] Deep learning approaches, such as the combination of Deep Convolutional Neural Network (DCNN) with Long Short-Term Memory (LSTM) networks, have shown remarkable accuracy in modeling nonlinear temperature-induced structural responses, with a prediction accuracy of 99.8% [
23]. These AI-based methodologies provide promising tools for enhancing the monitoring and assessment capabilities of vertical forest systems integrated with RC buildings.
The current review aims to properly define reliable damage and hazard intensity measures for holistic renovation of existing RC buildings, mainly in European region buildings from approximately 1920 onwards [
1,
2], incorporating vertical forest systems. More than one hundred high-quality technical publications were identified and screened through an exhaustive search of hazard identification and damage quantification to thoroughly evaluate the integration of VF systems on reinforced concrete buildings. A systematic search of scientific databases like Scopus, Google Scholar, and Web of Science were conducted within 1945–2025 range. Structural performance, monitoring systems, and risk assessment were part of secondary keywords, apart from fundamental keywords that were connected to vertical forests and reinforced concrete buildings. Peer-reviewed journal articles, conference proceedings, technical standards, and documented case studies that provided empirical data or rigorous analysis were of higher priority. Multidisciplinary literature that integrated structural engineering, environmental performance, monitoring systems, and well-being of individuals were brought within narrow focus. Publications were evaluated based on usability on VF systems, practical applicability, data quality, and methodological rigor, keeping real-world practice-oriented outcomes along with validated performance metrics of interest. Firstly, the most reliable global damage indicators for existing RC buildings are defined. Subsequently, the study separates the structural and non-structural components and then inspects the vegetation and forestry components, simultaneously. This review greatly considers the human factor, as ultimately the occupants’ comfort is a crucial factor that is sometimes neglected. In the Appendices, preliminary analyses of Monte Carlo for global behavior of the VF systems and System-Theoretic Process Analysis (STPA) for specific systems (VF balcony and vertical wall) based on the literature review and the empirically assessed multiparametric interrelations are presented.
2. Damage Measures and Methods
The research focused mainly on RC frames with infills. Based on the literature review, reliable global damage measures for performance-based seismic analysis commonly used by engineers include: Interstory Drift Ratio (IDR), Residual Deformation (RD), Concrete and Reinforcement Strains/Stresses (CaRSS), and Energy Dissipation (ED). These parameters are all measurable experimentally as well. While these measures can be applied to other categories with appropriate modifications, they are discussed in detail in the Structural Components section. The summarized results can be found in
Table 1.
These damage measures, among others, were subsequently utilized in advanced elaborations including empirical, Monte Carlo, and STPA methods to address, for the first time -to the authors’ knowledge-, combined effects related to VF cases. The methodology and results of these elaborations are presented in
Section 4 and
Appendix A,
Appendix B and
Appendix C.
2.1. Structural Components
The concept of IDR has been integrated into structural engineering for decades and is a fundamental aspect of performance-based seismic design. It is a unitless quantity (denoted often as d, sometimes defined as percentage, and calculated as the relative horizontal displacement between adjacent floors Δ, normalized by the corresponding story height h, as expressed in Equation (1):
This normalized quantity assists in the development of performance-based design criteria, since it directly relates elastic and inelastic structural behavior and enables threshold definitions corresponding to different performance levels. Standards like Eurocode 8 [
24] and ASCE 41 [
25], with some different notation, include levels ranging from Operational Level to Collapse Prevention that guide engineers during design and assessment analysis. Experimentally, the IDR of a structure can be measured with Linear Variable Differential Transformers (LVDTs), Draw-wire sensors, Laser-Based Displacement Sensors [
26], or, for high-rise buildings and long-term monitoring, through the use of GPS technology.
The residual deformations in structural systems may not be properly assessed without consideration of material nonlinearity, geometric changes, and cyclic deterioration during seismic events [
27]. Holistic prediction requires, among others, advanced computational models, path-dependent constitutive behavior, and geometric nonlinearities.
Subsequently, probabilistic evaluations are proposed for proper assessment of uncertainties in seismic demands, as the link between residual deformations and serviceability criteria for performance-based design is significant [
28,
29]. Additionally, in the concept of robust structural systems, multi-objective optimization algorithms have been extensively examined, e.g., Generic Algorithms (GA) [
30], Sunflower Optimization Algorithm (SFO) [
31], Particle Swarm Optimization (PSO) [
32], and Simulated Annealing (SA) [
33,
34]. Furthermore, the post-event functionality and seismic performance methodologies are enhanced, as ultimately, the structural performance is a crucial factor that is sometimes neglected [
35,
36].
As the Concrete and Reinforcement Strains/Stresses (CaRSS) are significant indicators of RC structures under seismic loading [
37], there is a need for proper measurements of deformations and internal forces. The holistic assessment of concrete and reinforcement may identify potential failure zones, among others, with signs of cracking or yielding, which are crucial factors for ductility and damage evaluation. Additionally, strain gauges, fiber optic, piezoelectric sensors, and acoustic emission techniques have been proposed as the real-time data monitoring of the behavior of materials, including retrofitted materials, is significant [
38,
39,
40,
41,
42,
43]. Furthermore, higher-order probabilistic methods like Gaussian Bayesian Networks have proven efficient in the structural system’s damage detection capability, thus enhancing identifications and location of probable zones of failure with statistical modeling approaches [
44].
Subsequently, the thresholds for CaRSS are defined by design codes, despite the challenging nature of sensor installation in structures with vertical forest (VF) systems. The large-scale research indicates that CaRSS applications have a significant impact on identifying damage zones and supporting targeted retrofits [
45,
46,
47]. Furthermore, future innovations in wireless and non-invasive sensors may enhance RC structure maintenance while satisfying the particular requirements of VF-integrated buildings [
48].
As the Energy Dissipation (ED) in RC buildings plays a crucial role in structural behavior [
49], there is a need for proper assessment of its ability to absorb and dissipate seismic energy. The holistic ED process may not be the ultimate solution without understanding the mechanisms, among others, of plastic hinge formation, reinforcement yielding, and frictional sliding, as they have a significant impact on reducing stress during earthquakes. The studies indicate that high ED capacity relative to conventional solutions could potentially have more relative seismic resilience [
49,
50]. The large-scale quantification through hysteresis loop analysis and equivalent viscous damping ratios has been proposed by many different studies [
51,
52].
Consequently, the implementation of ED in design frameworks like Eurocode 8 is a more feasible solution and has been proposed through correlation with reduced deformation and damage. Additionally, in the concept of VF systems optimization, proper ED assessment is required, despite the complex nature of added mass and vegetation dynamics. Furthermore, the incorporation of advanced materials and innovative designs into existing ED systems [
53] enhances the optimization capacity while maintaining the VF benefits, as ultimately, the holistic consideration of both seismic performance and vegetation requirements is a crucial factor that is sometimes neglected.
2.2. Non-Structural Building Envelope and VF Façade Systems
The advanced analytical frameworks for cladding displacement and connector damage are proposed, as there is a need for proper modeling of interactions between structural deformations and façade responses. The holistic multiscale modeling techniques have been extensively examined, combining finite element analyses with global response models [
54,
55], as the precise predictions of, among others, damage mechanisms, clamping loss, and shear deformation, are significant. The study [
56] indicates that probabilistic evaluations enhance connection designs, ensuring resilience, durability, and cost-efficiency.
Consequently, the seismic performance assessment of glazing and airtightness is a more feasible solution through finite element and fluid-structure interaction models. The large-scale integration of simulations may have a significant impact on thermal, acoustic, and structural properties [
57], despite the complex nature of material brittleness and airflow patterns.
Additionally, in the concept of planter stability under seismic loads, nonlinear analyses and probabilistic methods have been proposed [
58,
59]. The optimization designs enhance resistance to seismic actions while maintaining aesthetic and maintenance requirements, thus satisfying both safety and functionality.
2.3. Vegatation and Forestry Components
Computer vision and Artificial Intelligence (AI) models have a significant impact in automatic and real-time plant health monitoring [
60]. There is an extensive review on how to use different AI models for detecting and monitoring plants stress [
61]. Throughout its lifespan, a plant on a daily basis undergoes different stresses from factors, among others, drought, temperature, and nutrients. Deep learning models like Convolutional Neural Networks (CNNs) [
62] or Deep Convolutional Neural Networks (DCNNs) [
63,
64] can be used for image analysis and feature extraction. They are particularly effective in processing complex plant images and can detect variations in plant physiology. Traditional Machine Learning models like Support Vector Machines (SVMs) [
65] can be used to classify types of plant stresses with accuracy as high as 99% in some cases. For water stress discrimination Random Forest (RF) [
66] models can be used. For real-time and effective monitoring changes over time, Recurrent Neural Networks (RNNs) [
67] can and has successfully been applied for water stress detection. It is important to mention that these damage monitoring models depend on the application and type of stress being monitored; the models can achieve accuracy rates between 80–99%. A summary of the content and additional references can be found in
Table 2.
2.4. Occupants Satisfaction and Comfort Measures
The occupants’ satisfaction is an ambiguous measurement, as it directly relates to the human factor and primarily collects qualitative data (personal opinions of occupants) that often requires proper analysis to be interpreted into quantitative data for mathematical analysis, though this is not always necessary (e.g., Decision Trees). Initially, proper assessment of occupants through detailed questionnaires is proposed. Several validated questionnaires can be used, among others, Building Use Studies (BUS) Questionnaire [
74]: measures occupant satisfaction systematically; Questionnaire on User Satisfaction (QUIS) [
75]: originally developed for human-computer interactions satisfaction studies, but can be adapted to include built habitats. The latter must undergo validation and reliability testing to ensure that the survey accurately measures its intended outcomes. Different techniques are applied, among others, (a) Confirmatory Factor Analysis (CFA) [
76]: Validates the factor structure of a questionnaire; (b) Cronbach’s Alpha [
77]: assesses the internal consistency reliability of survey scales and defines how closely related a set of items are as a group; (c) Test-Retest [
78]: evaluates the stability of responses over time. Afterwards, the data can be converted into quantitative data (if not already) using methods like (i) thematic analysis with numerical tagging that is systematic coding and categorization approach to identify patterns, (ii) rating scales based on qualitative descriptions that define numerical scales e.g., 1–5 to qualitative descriptions like “Very Dissatisfied” = 1 − “Very Satisfied” = 5, (iii) dichotomization simplifying qualitative data into binary categories (e.g., yes/no, present/absent). Then the data can be fed into statistical methods like Structural Equation Modeling (SEM) [
79], Hierarchical Linear Modeling (HLM) [
80], or even with Neural Networks and Deep Learning techniques [
81] for further analysis. Summary of the content and additional references can be found in
Table 3.
3. Hazard-Related Intensity Measures and Methods
3.1. Seismic Intensity Measures
Traditional seismic demand assessment using intensity measures relies on strong mathematical models representing probabilistic correlations between characteristics of ground motion and parameters of structural response [
97,
98,
99,
100]. The Peak Ground Acceleration (PGA), despite its computational efficiency and widespread use, may not be sufficient for complex dynamic behaviors, multi-degree-of-freedom systems and higher mode contributions. The study from [
101] indicates that Spectral Acceleration (Sa) at the fundamental period enhances response predictions in probabilistic frameworks. Additionally, in the concept of comprehensive assessment, Peak Ground Velocity (PGV) has been proposed for nonstructural components and façade systems through advanced signal-processing methodologies [
102]. Subsequently, the proper understanding and quantification of these intensity measures requires systematic examination. Different approaches are presented, among others.
3.1.1. Seismic Accelerometer Recording and Microzoning
Basic research into seismic microzoning and site amplification is important for understanding earthquake hazards on both micro and macro scales. The Swiss Seismological Service has extensively examined detailed models of site amplification based on geophysical measurements and earthquake records [
103]. The holistic models may include, among others, local site response knowledge at approximately 245 seismic stations and geospatial prediction methods for amplification factors across diverse areas.
Subsequently, the quantification of site-specific amplification is a more feasible solution through the integration of geophysically measured data and recorded ground motions. Studies indicate that techniques incorporating empirical spectral modeling methodologies have been successful in forecasting the observed site amplification factors at instrumented sites [
104]. The large-scale interpolation of amplification may have a significant impact on larger areas despite the complex nature of site condition proxies such as topographic slope and geological classification.
Additionally, in the concept of site response analysis at the building level, a proper understanding of local soil conditions affecting ground shaking intensity has been proposed [
105]. The multi-scale approach is a crucial factor that is sometimes neglected, as ultimately, the combination of instrumentation data with site characterization provides valuable insight into both regional hazard mapping and building-specific analyses.
3.1.2. DYFI and Q-Felt Maps
As the collection of earthquake impact data requires proper citizen science approaches, the USGS has developed the ‘Did You Feel It?’ (DYFI) system. Studies indicate that since its establishment in the 1990s, the DYFI system has extensively examined data collection methods, among others, through millions of individual intensity reports and digital questionnaires [
106]. The large-scale production of Community Internet Intensity Maps may have a significant impact on macroseismic data resolution, despite the conventional nature of postal surveys.
Subsequently, the search engine query analysis for mapping felt areas is a more feasible solution. The study from [
107] indicates that real-time monitoring of earthquake-related keywords could potentially have a significant impact on quick estimation of earthquake effects distribution. The Q-Felt Map system has been extensively examined through machine learning to assess the reliability of more than 1 million queries within 3 min following an earthquake, as the correlation with official intensity maps in populated areas is significant.
Additionally, in the concept of earthquake alert systems, proper incorporation of various data sources has been proposed [
106]. The thorough integration of social and crowd-source information with conventional seismic observations is an important feature that requires further attention. In addition, an apt illustration can be taken from the case of the Swiss Seismological Service, describing an organized scheme of information regarding earthquakes through a blending of instrumental recordings, macroseismic observations, and quick impact evaluation tools [
105].
3.1.3. Remote Sensing and Building Collapse Detection
Remote sensing has become a commonly used means for fast post-earthquake damage assessment, particularly in identifying collapsed buildings. The study by [
108] investigated a total of 25 different remote sensing features while identifying collapsed buildings. The results showed that Homogeneity, Energy, Local Entropy, Local Standard Deviation, and Gradient were helpful in finding the rapid damage effect. They could apply such features to large-scale imagery with high recognition accuracy featuring F1-scores in the range of 0.71–0.94.
Deep learning approaches have achieved state-of-the-art performance regarding automated building damage assessment. For detecting collapsed buildings in post-earthquake remote sensing images, an enhanced YOLOv3 model was developed by [
109]. By replacing a conventional Darknet53 neural network with a lightweight ShuffleNet v2 backbone and some other modifications in terms of the loss function, they attained detection speeds as high as 29.23 frames per second at 90.89% accuracy. Those were significant gains over the original YOLOv3 in both speed and accuracy. Similarly, there has been an evolution of computer vision-based frameworks with advanced models proposed for crack detection in concrete and dimension identification by a three-tier approach of deep learning with image processing to precisely estimate damage [
110].
With reference to disaster response capabilities, the integration of detection technologies with established assessment methods presents significant advantages. The study from [
108] indicates that framework effectiveness depends on various parameters that include, among others, image resolution and population density around the epicenter. Building on these results, their system detects structural failures within minutes after post-disaster image acquisition. In terms of performance validation, the work of [
109] demonstrated that the improved deep learning approach maintains high accuracy under difficult conditions like fluctuating lighting and complicated backgrounds.
3.2. Hazard Intensity Measures for Environmental and Climate Aspects
3.2.1. Wind Intensity Considerations
The determination of wind impact for integral façade vegetation structures involves a thorough analysis with complex mathematical frameworks describing atmospheric boundary layer behavior and structural behavior, respectively. Successful estimation of wind loads is dependently determined with simulations of turbulence and application of statistical postprocessing techniques [
111,
112]. In addition, in relation to proper correlation factors, a thorough analysis of wind intensity factors and system performance has been developed, thus creating a sound determination between deterministic and stochastic atmospheric actions. Computational fluid dynamics (CFD) simulations can have a significant impact with regard to façade stability and vegetative behavior [
113]. In addition, multi-criterion decision-support frameworks, utilized through air resistance analysis techniques, promote aerodynamic, structural, and vegetative viability [
114,
115].
3.2.2. Rainfall Intensity Analysis
The analysis of rain loads in integral buildings can fall short if not accompanied by a thorough consideration of complex mathematics capable of effectively describing the coupled behavior between hydraulic and structural dynamics. The proper integration of hydrological modeling with structural analysis has been proposed [
116,
117], as ultimately, the system responses under combined loading conditions are significant factors. Studies indicate that analytical frameworks incorporate, among others, time-distribution patterns and spatial variability through statistical methods [
118,
119]. Subsequently, probabilistic theories have been extensively examined for proper correlation between rainfall parameters and system performance. The multimodal assessment methodologies enhance drainage system quantification while maintaining the balance between infiltration phenomena and numerical simulations. Furthermore, the post-earthquake response evaluation requires systematic examination of environmental loading and system damage states.
4. Preliminary Studies Based on the Literature Review
Besides the remarkable reviews concerning combined structural and energy upgrades [
120] or integrated comfort analyses [
121], the subject of Vertical Forest analysis is highly interdisciplinary and multidisciplinary, and needs further investigation. To the authors’ knowledge, this is the first time the Vertical Forest Renovation is the central focus of the review, gathering and directly utilizing VF specific damage and hazard assessment methods. The scope and depth of the presented review manages to identify and evaluate VF-related critical parameters of the renovation process. From the literature review, it was concluded that proper questionnaires may provide relevant information for later application to complex mathematical and probabilistic models. Thus, three preliminary studies were conducted to support this review: (a) empirical multiparametric assessment through expert opinion table rating system (see
Appendix A), (b) Monte Carlo analysis (see
Appendix B), and (c) two specific domain and length STPA analyses (see
Appendix C).
Subsequently, five different empirical aspects (damage assessment, analysis assessment, modeling assessment, retrofit assessment, and structural health monitoring assessment) were provided, identifying and rating different multiparametric limit states and the indirect contribution of different parameters to VF renovation. The rated risks range from 1 to 3 (Level 1 for allowable deteriorations without immediate action, Level 2 for further investigation requirements, and Level 3 for dangerous conditions requiring urgent response), producing three tables that allow for some preliminary, but very significant, quantification elaborations that further utilize the review outcomes. The study provides detailed tables in
Appendix A (
Table A1,
Table A2,
Table A3 and
Table A4) that document the potential causes and severity of damage in four key areas: (i) Common Reinforced Concrete Buildings, Greenery-Covered Buildings (ii) with focus on structural performance, (iii) with focus on greenery performance (iv) with focus to Human-Related Factors. These tables attempt to provide a thorough and systematic documentation of each category. The common buildings have been extensively examined for, among others, material-related issues, design defects, and reinforcing details. Additionally, in the concept of green buildings, the tripartite model has been proposed while maintaining the balance between structural performance, greenery efficacy, and human welfare, as root invasion, moisture management, and occupant safety are significant factors. The scoring mechanism through risk categorization enhances proper assessment, among others, low (5–8), medium (9–12), and high (13+) priorities (maximum risk value is considered 15), as ultimately, the maintenance planning and future designs are crucial factors that require systematic examination. Furthermore, the framework integration with traditional structural engineering and sustainability has been examined through multi-expert evaluations while maintaining reliability and consensus between Common Reinforced Concrete Buildings and Greenery Covered Buildings parameters.
The Monte Carlo analysis application in the current study aimed to assess expert evaluations, as the probability distribution of risk levels in different system subcomponents is significant. Such analytical methodology enables the identification of probabilities for each subcomponent falling into three predefined risk levels and, consequently, results in computing the average risk value for the whole system. The methodology converts discrete damage ratings into continuous intervals with partial overlapping: rating 1 corresponds to [0.0, 1.3], rating 2 corresponds to [0.7, 2.3], and rating 3 corresponds to [1.7, 3.0]. Additionally, this enables more detailed modeling of expert estimates and takes into consideration uncertainty in boundary regions.
The simulation run overall takes 10,000 runs to produce a reliable output in terms of statistics. During each run, the process samples randomly from the pool of ratings by every expert in each category for the various types of damages. These discrete ratings, having thus been sampled, undergo conversion into continuous values based on overlapping ranges and are subsequently summed up to develop a total damage score. The approach establishes a sound distribution of possible outcomes while maintaining the variability due to expert opinions. Furthermore, the test proceeds with deterministic calculations in which the risk level falls into three categories: low risk, between 5 and 8 points; medium risk, between 8 and 12 points; high risk, between 12 and 15 points.
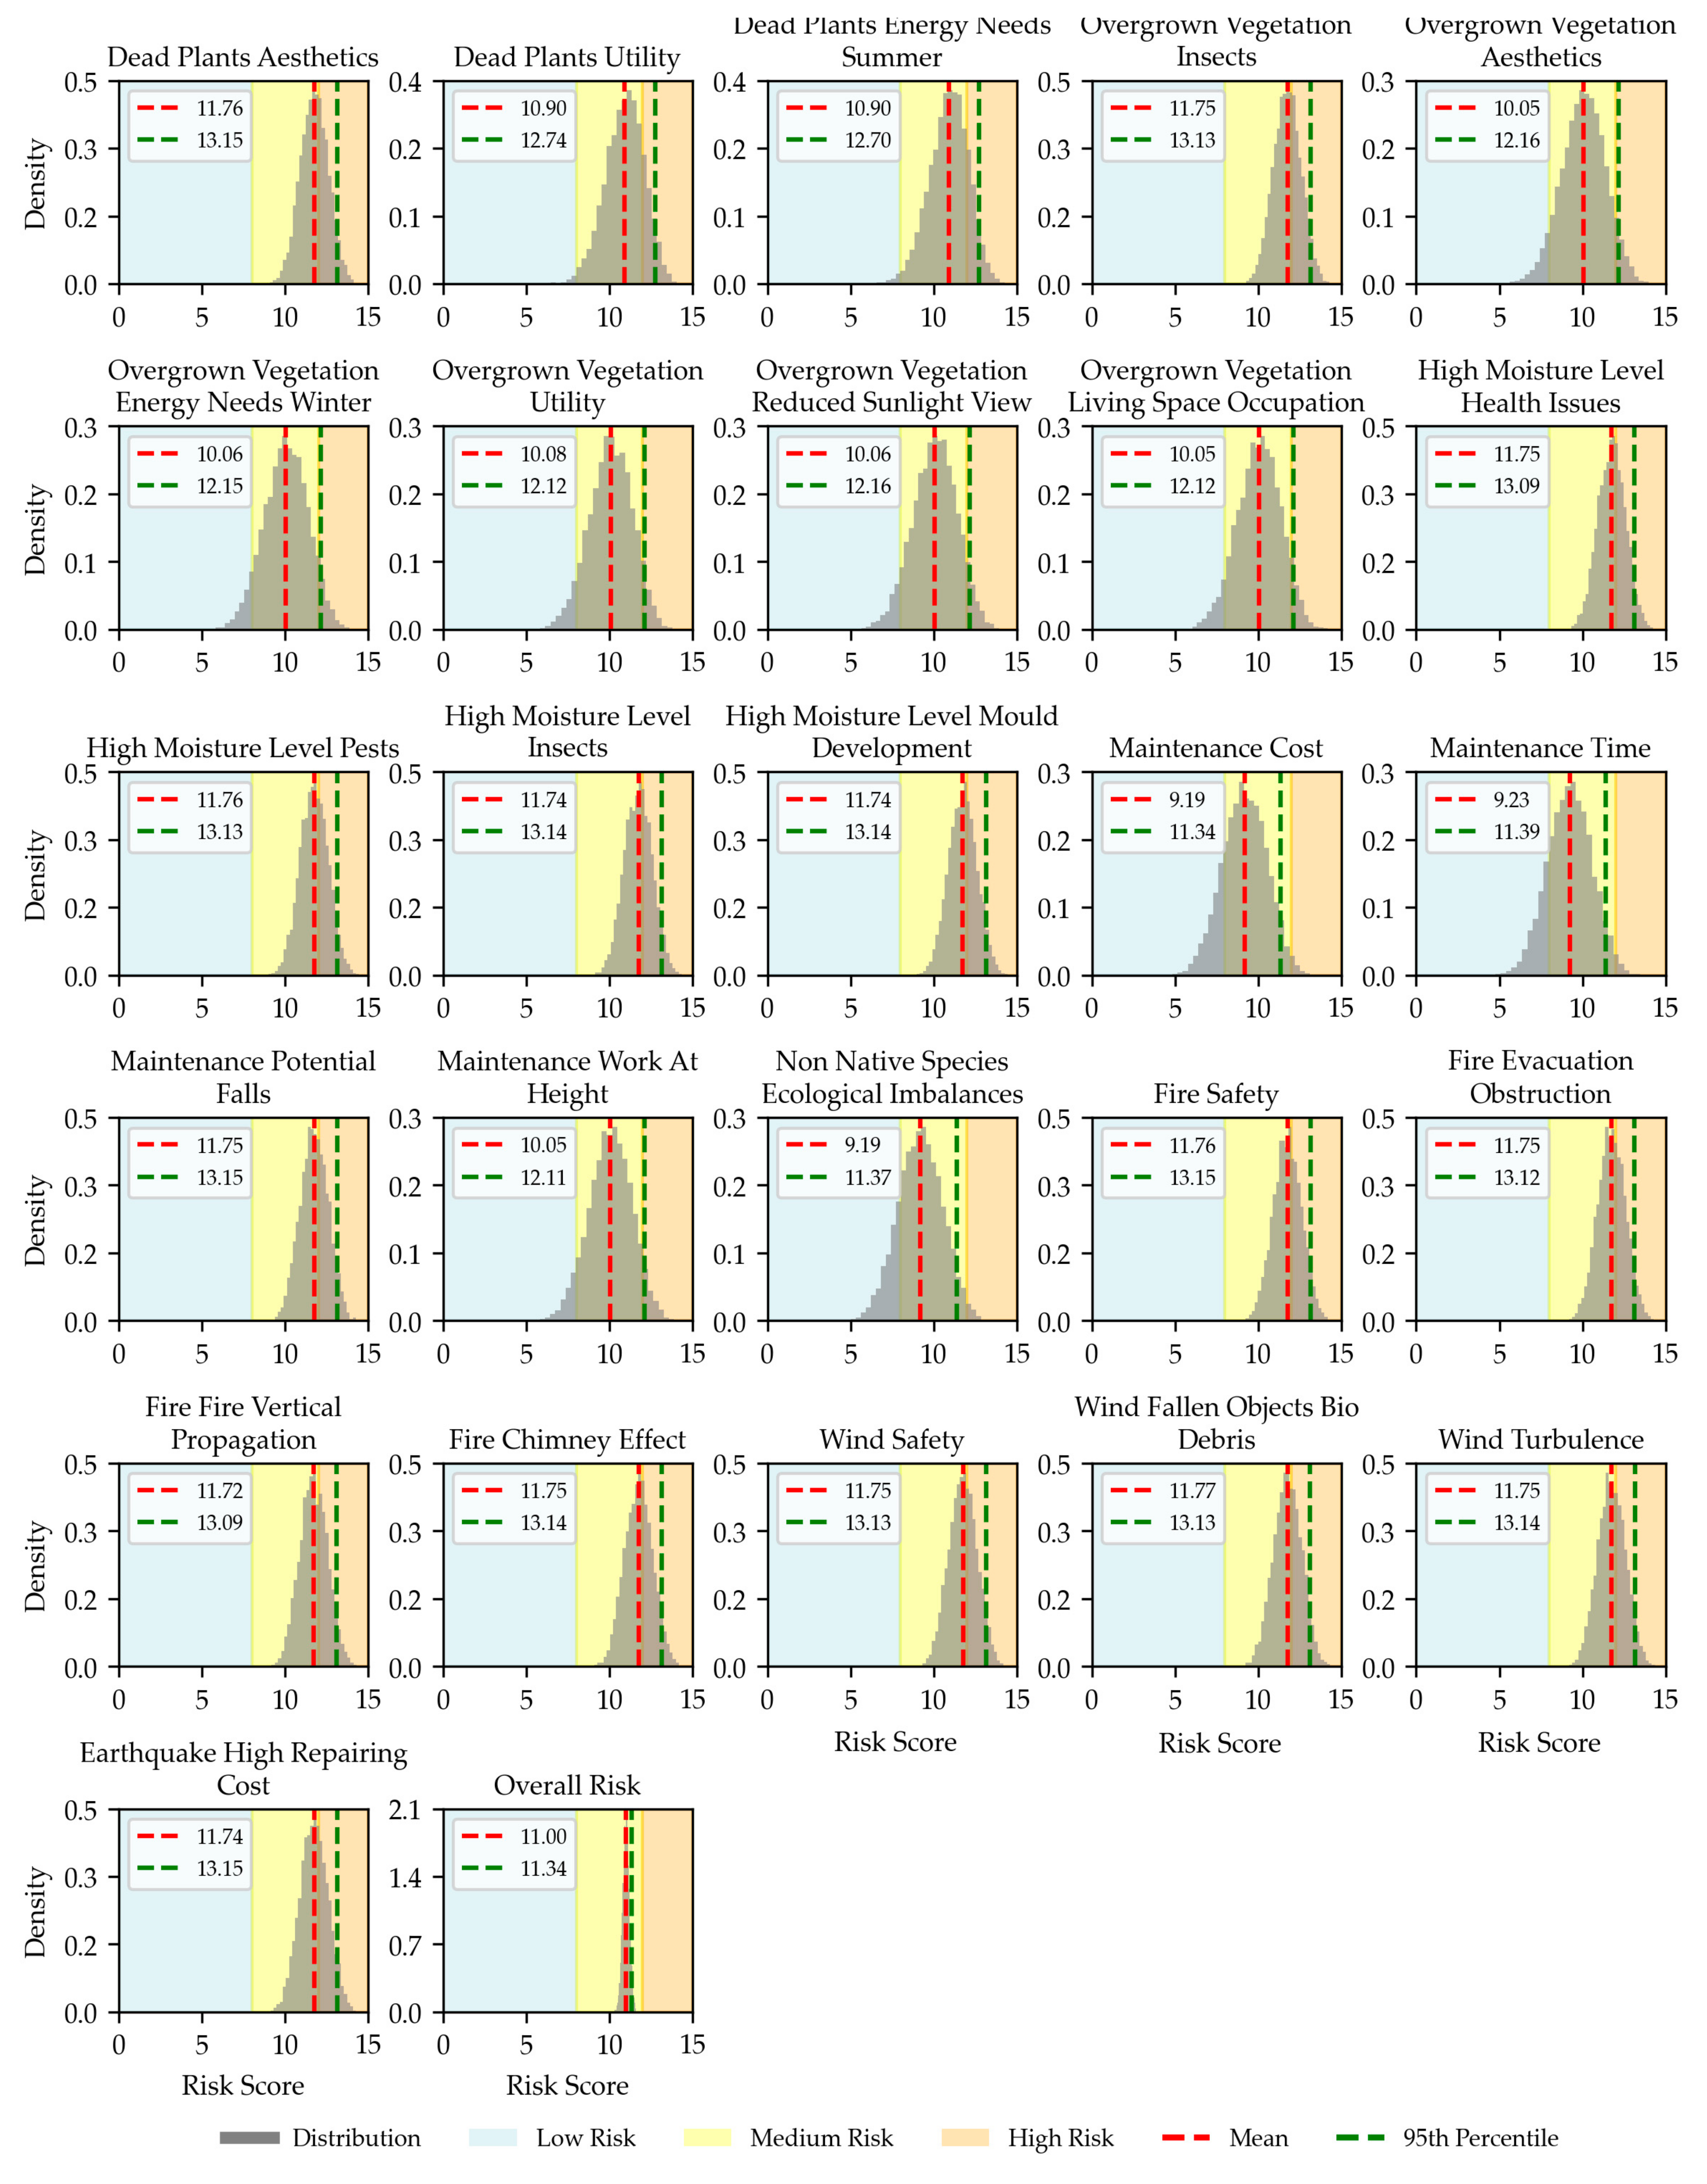
For each type of damage, the simulation calculates statistical indicators, among others, average scores, standard deviations, and 95th percentile values. These measures provide thorough information about central tendency and variance in terms of assessments of risk, both for normative and extreme case identifications. The last step represents the consolidation of results for overall risk profile indication. In this, individual risk assessments are combined to compute mean overall risk probabilities while presenting results through visualization methods, including risk score distribution, risk zone demarcation, and crucial statistical measures.
The visualization of Common RC Buildings distribution is depicted in
Figure A1 and statistical results are denoted in
Table A5.
The visualization of Greenery-Covered Buildings (Structural Performance) distribution is depicted in
Figure A2 and
Figure A3 and statistical results are denoted in
Table A6.
The visualization of Greenery-Covered Buildings (Greenery Performance) distribution is depicted in
Figure A4 and statistical results are denoted in
Table A7.
The visualization of Greenery-Covered Buildings (Human Welfare) distribution is depicted in
Figure A5 and statistical results are denoted in
Table A8.
Additionally, in the concept of hazard analysis, the STPA has been extensively examined for vertical forest applications, as there is a need for proper identification of specific hazards in complex systems. The study from MIT by Leveson and Thomas indicates that safety requires a control-based approach rather than component failure analysis [
122]. Subsequently, two main systems have been proposed for detailed examination, among others, the VF balcony system and the living wall system as depicted in
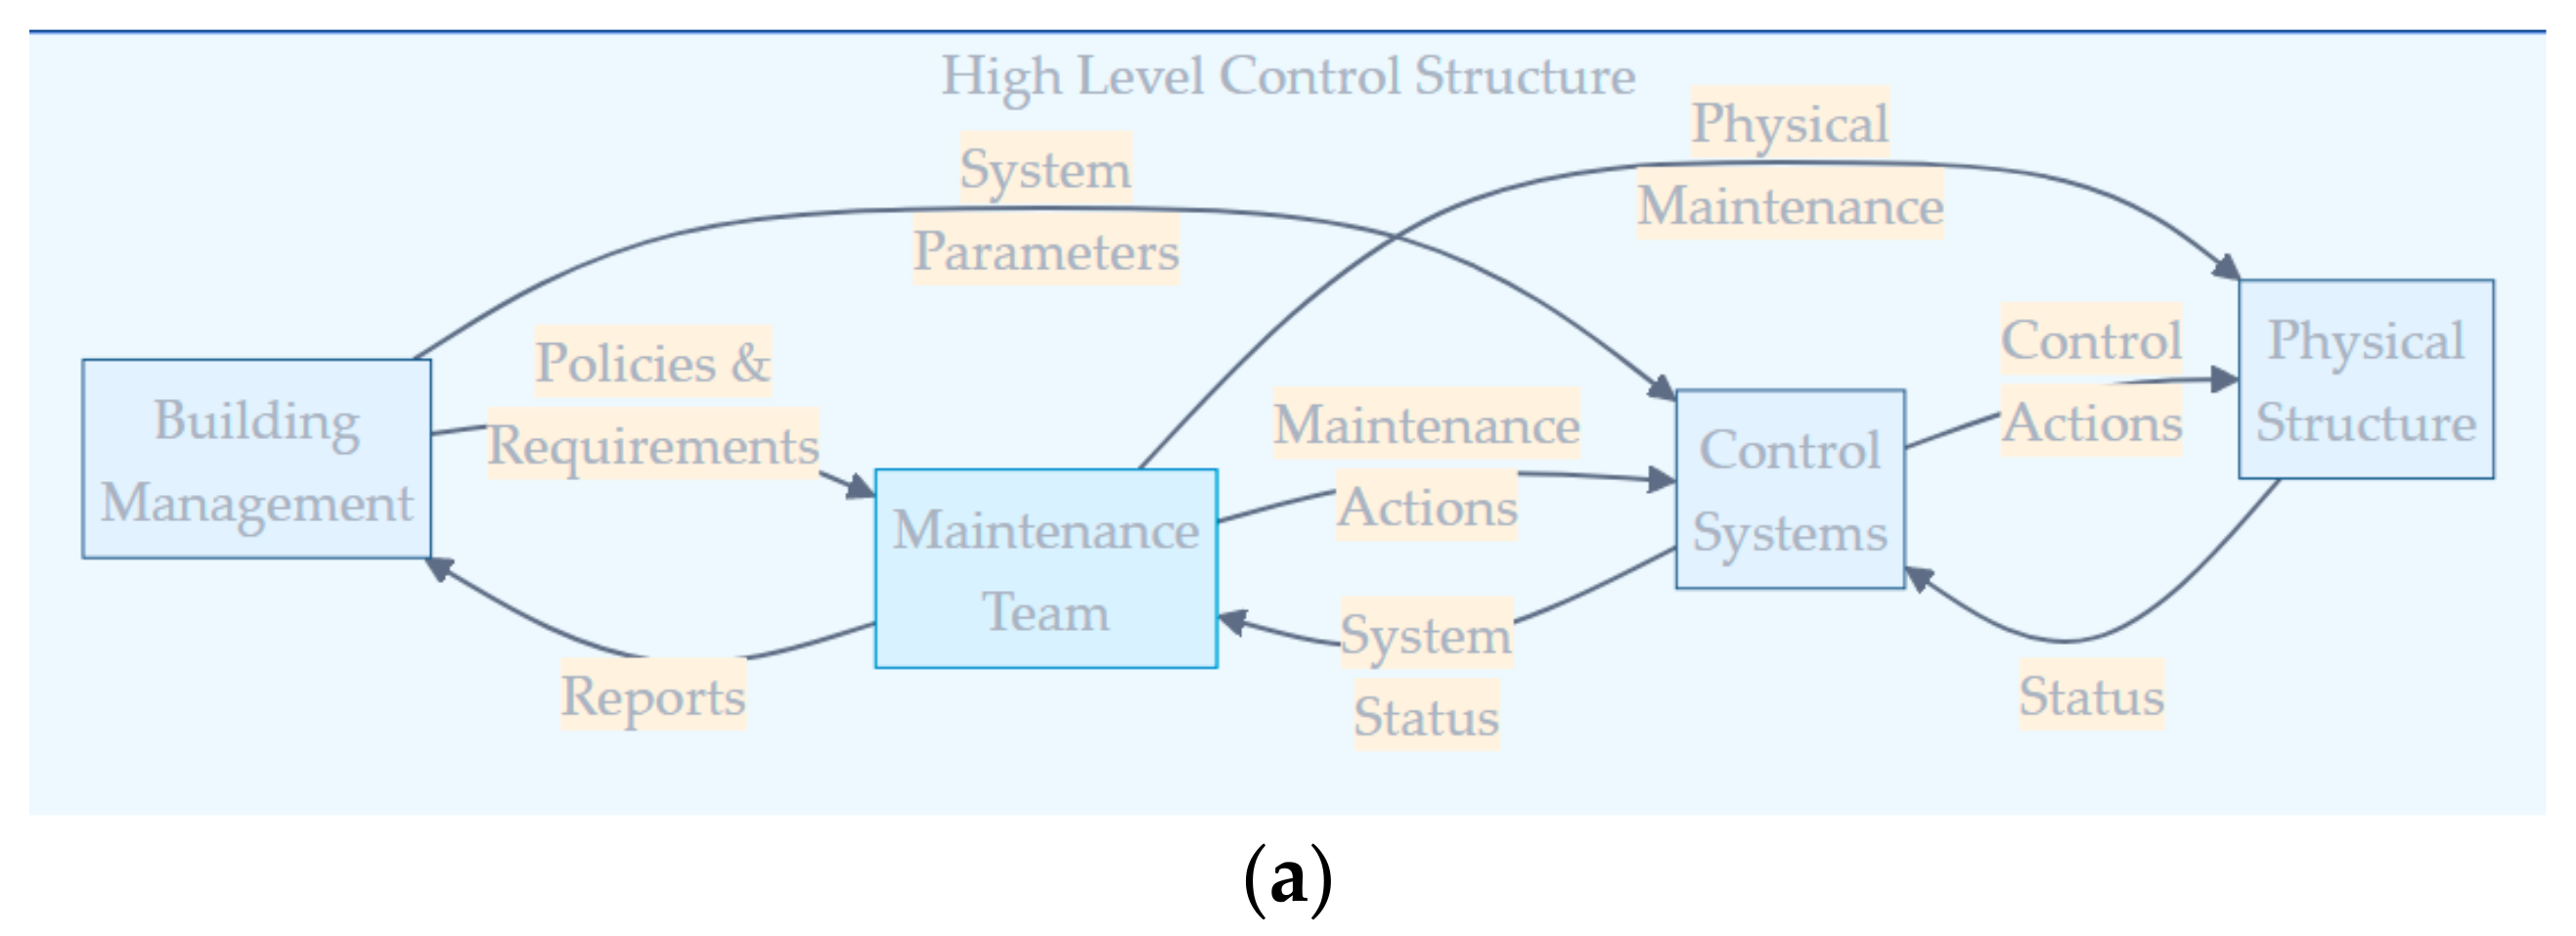
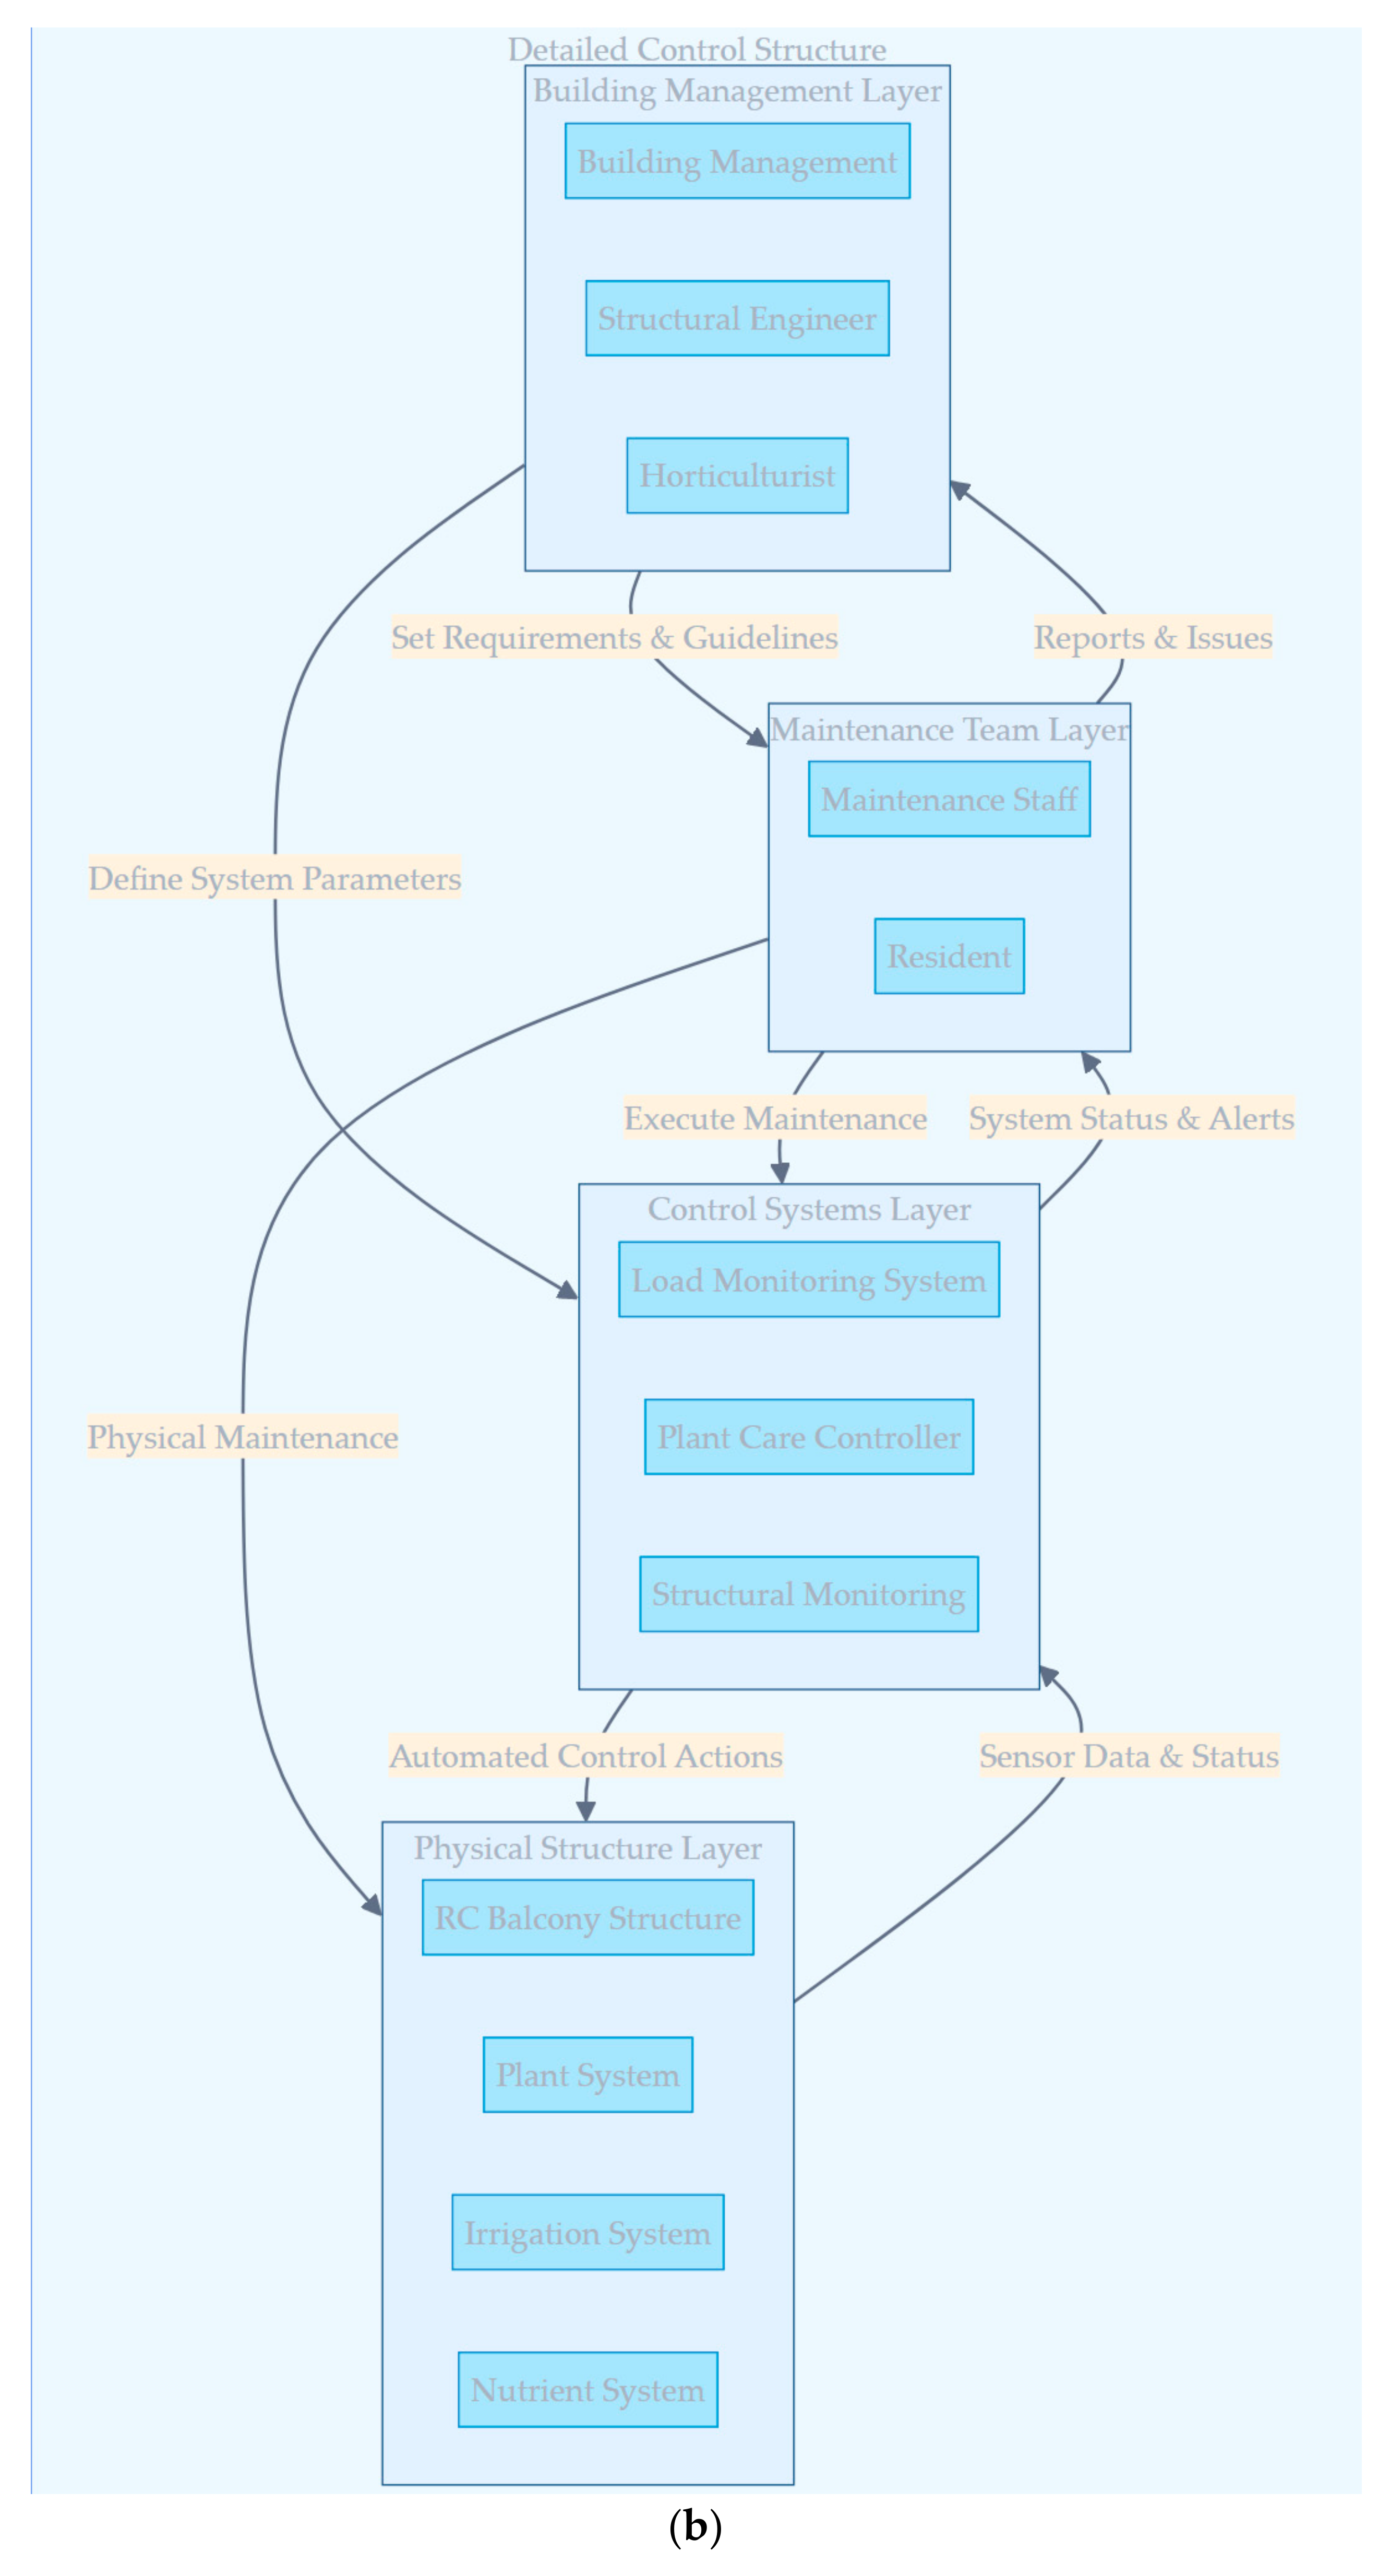
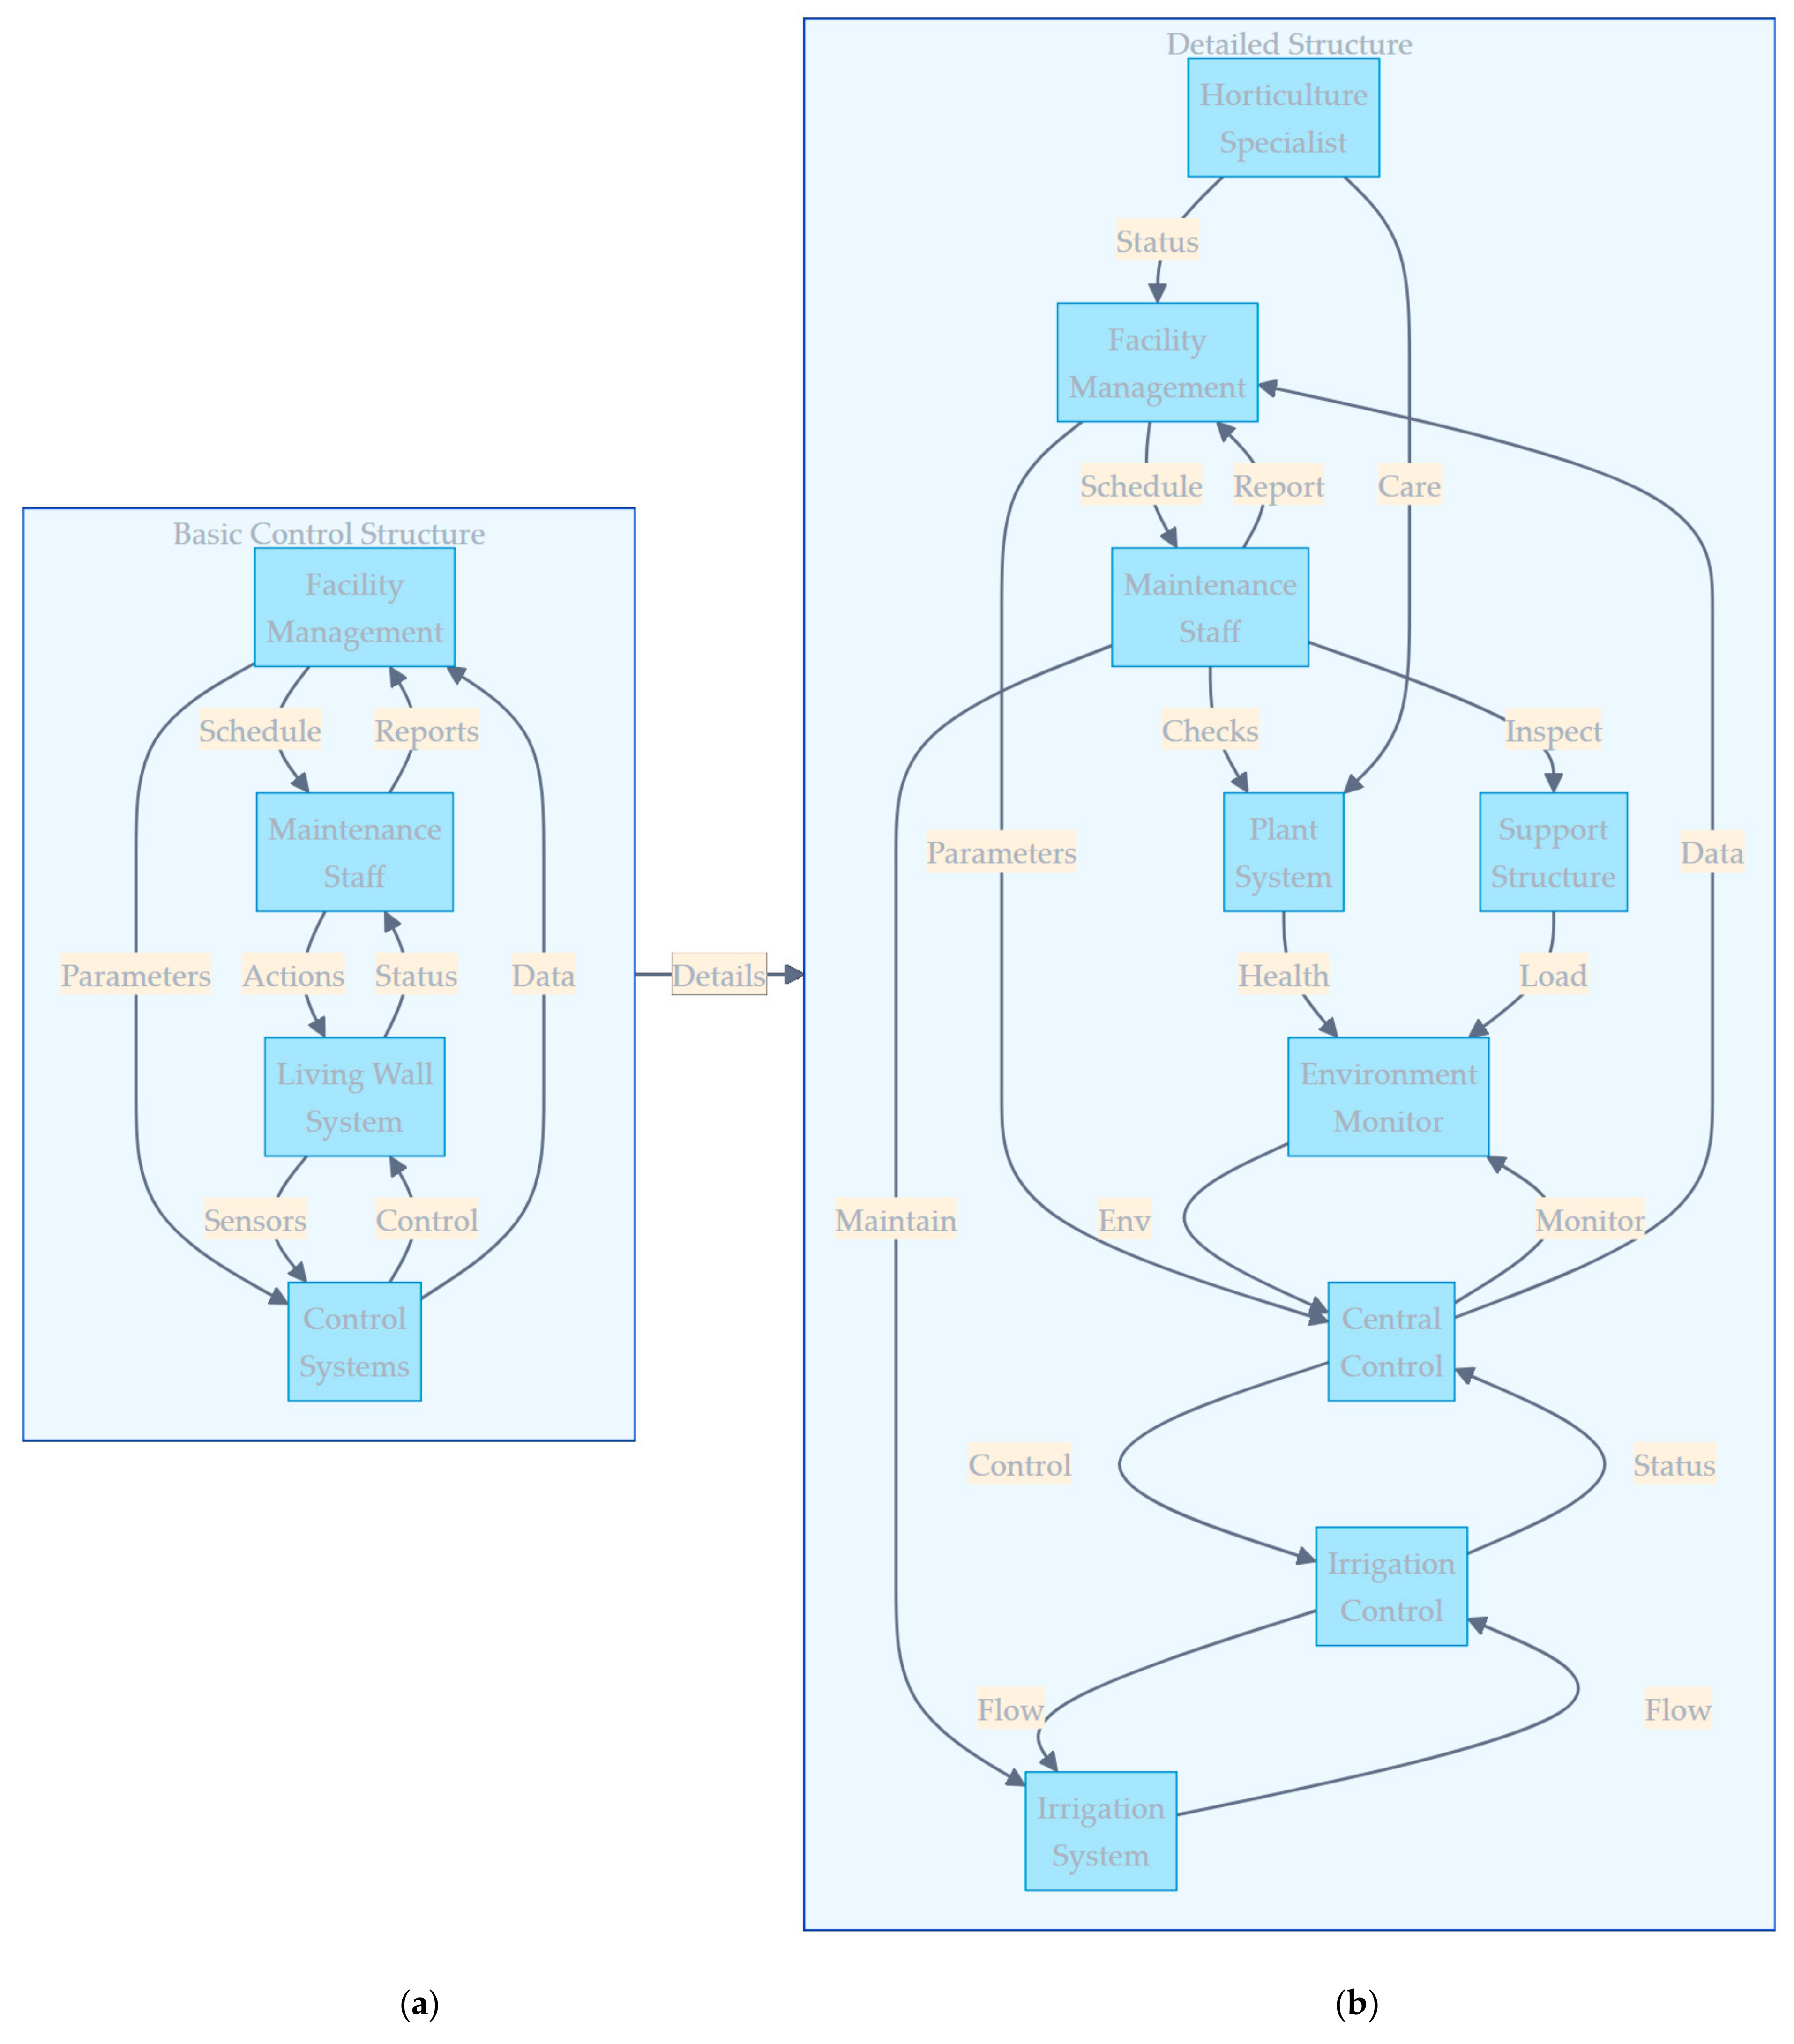
Figure 2.
The VF balcony system integration requires proper assessment of structural elements, supportive plant structure, and plant care systems while maintaining the balance between load monitoring, drainage management, and safety protocols. The relevant implementation tables can be found in
Appendix C from
Table A9,
Table A10,
Table A11,
Table A12,
Table A13 and
Table A14. The living wall system incorporating mechanical and biological components are examined in
Table A15,
Table A16 and
Table A17. The Control Structure scheme for both Balcony and Living Wall can be found in
Figure A6 and
Figure A7, respectively. Study [
15] indicates that self-climbing vegetation support and automatic irrigation mechanisms have been extensively examined, as the proper integration of watertight membranes and control systems is significant. Furthermore, environmental monitoring enhances building envelope integrity while maintaining the balance between plant vitality, seasonal changes, and meteorological conditions. The results from STPA were used to create a Risk Matrix to evaluate the risk level of each system, as depicted in
Figure 3.
As depicted in
Figure 3, a simple tool for rating potential risks in both VF RC Building Balcony and RC Building Living Wall structures is the risk evaluation matrix. In this arrangement, risks are organized according to a dual-axis scheme that considers both consequence severity and likelihood of occurrence, creating a 5 × 5 grid pattern in its totality. Each cell in the grid holds a level of danger, represented with a letter (L, M, or H) and a number; L for low danger (in green), M for medium (in yellow), and H for high (in red). The grid not only portrays an intensification of danger through severity of impact but through an events’ likelihood, as well. For instance, any events with a 5 (Very Likely) rating will have at least a rating of medium (M5 regardless of consequence level). The matrix accurately reflects how a combination of consequence and likelihood can produce a range of risks, starting with a minimum rating (L1) for events with negligible consequences and a high chance of not happening, and culminating in a rating of H25 for events with high consequences and a high chance of happening.
5. Discussion
As the integration of Vertical Forest systems into existing Reinforced Concrete buildings has been extensively examined, there is a need for proper assessment of structural performance, environmental sustainability, and occupant well-being. The holistic damage quantification and hazard intensity measurement may not be the ultimate solution through individual subsystem analysis. The reliable global damage indicators have been proposed, among others, (a) Interstory Drift Ratio (IDR), (b) Residual Deformation (RD), (c) Concrete and Reinforcement Strains/Stresses (CaRSS), and (d) Energy Dissipation (ED). Studies indicate that structural metrics require integration with vegetation components, as the added mass and vegetation-induced damping are significant factors for dynamic behavior in some cases. Furthermore, the non-structural elements assessment, through façade systems and planter stability, has a significant impact on proper evaluation.
Consequently, occupant satisfaction and comfort are more feasible solutions for performance assessment. The proper methodologies for qualitative data analysis have been proposed while maintaining the balance between renovation outcomes and living conditions. Additionally, in the concept of reducing monitoring complexity, AI-driven plant health assessments and real-time structural sensors enhance seismic performance evaluation. The environmental hazard intensity measures, among others, seismic, wind, and rainfall impacts, have been extensively examined through comprehensive risk assessments. The large-scale integration of these approaches requires systematic examination, given that the aesthetic advantages, structural safety, and occupant well-being are critical factors urging for further attention.
As the four main categories of the Monte Carlo analysis results have been extensively examined, there is a need for proper risk distribution patterns evaluation. The study indicates that common RC buildings analysis may not be the ultimate solution without proper categorization, as 100% of cases cluster in the medium risk category with a mean score of 9.47/15. Subsequently, the reinforcement-related issues show high risk classification while maintaining 35.3% of cases and mean scores of 11.15/15. The slippage, shear cracking, and connection failures are significant factors that require systematic examination.
The STPA analysis results require proper evaluation of two main configurations, among others: (a) VF balcony system and (b) living wall system. The study from the balcony system indicates that four key hazard categories have been proposed, as the structural integrity, plant systems, and control mechanisms are significant factors. Additionally, in the concept of risk matrix analysis, the high risk scenarios through structural monitoring system failure (H10, 5,2) have been extensively identified. Subsequently, the living wall system analysis shows six major accident categories while maintaining the balance between structural integrity and operational problems. The water-related hazards have been proposed for proper assessment, as ultimately, the water infiltration (H12, 4,3) and critical system failure (H16, 4,4) are crucial factors that require systematic examination.
The STPA uncovered a variety of unanticipated failure modes, specifically in the behavior between different subsystems that might not have been identified through traditional analysis methods. The Control System Interactions investigation uncovered unforeseen cascading interactions between the automation of plant maintenance and structural monitoring systems. In particular, automated irrigation responses during windy conditions may mask indicators of structural deterioration by temporarily alleviating symptoms visible to the naked eye while potentially exacerbating loading issues (H-3.3,
Table A11). For Bio-Structural Feedback, one key observation was the complex interrelationship between biological and structural monitoring systems, suggesting that degradation of the root barrier system may cause failure in moisture sensors and, in turn, have a cumulative effect towards integrity monitoring (H-2.3, H-3.1). Additionally for Time-Sensitive Activities, the analysis showed unanticipated risks with regards to maintenance activity timing; such routine maintenance operations, namely pruning or inspections performed during high demand times, may cause overall system destabilization (
Table A11 and
Table A12). These unexpected failure modes have led to enhanced safety requirements and constraints as detailed in
Table A12 and
Table A16, particularly in the areas of integrated system monitoring and control.
As both analyses require proper integration, there is a need for correlation patterns assessment. The study indicates three main aspects, among others:
Structural Integrity Assessment: The Monte Carlo analysis shows medium to high risk categories with a mean score of 9.72/15 while maintaining correlation with STPA structural hazards findings (H-1.1 through H-1.4). Furthermore, seismic considerations have been extensively examined through high risk scenarios in both methods (Monte Carlo: 11.75/15, STPA: H10).
Moisture Management Correlation: The proper evaluation of moisture-related risks has been proposed, as the Monte Carlo analysis indicates persistent high risk scores (11.74/15–11.75/15). Additionally, in the concept of living wall systems, STPA water hazard findings (H.2.1 through H.2.3) enhance risk understanding.
Control Systems Requirements: The large-scale implementation of control systems may have a significant impact on risk mitigation, as both analyses indicate. The proper monitoring and control actions have been extensively examined while maintaining the balance between probabilistic assessment and specific safety protocols.
6. Conclusions
As the holistic renovation of RC buildings through VF systems requires proper evaluation, there is a need for systematic assessment of damage quantification and hazard intensity measures. The study indicates that structural components, among others, IDR, RD, CaRSS, and ED, have been extensively examined while maintaining the balance between conventional solutions and green modifications.
Subsequently, the proper integration of non-structural elements and VF façade systems has been proposed, as ultimately, the cladding displacement, glazing performance, and planter stability are crucial factors that require systematic examination. Additionally, in the context of vegetation components, AI-driven plant health monitoring using different models—such as (a) CNN, (b) DCNN, and (c) RNN—may, in some cases, enhance detection accuracy to between 80% and 99%.
The proper assessment of occupants’ satisfaction has been extensively examined through validated questionnaires while maintaining the balance between qualitative and quantitative data analysis. Furthermore, the hazard intensity measures for seismic, wind, and rainfall impacts may have a significant impact on proper evaluation methods.
Subsequently, the analytical results from Monte Carlo and STPA analyses indicate several crucial findings, among others:
The green modifications relative to traditional RC buildings could potentially have higher risk profiles (mean scores 9.72/15–11.41/15 versus 9.47/15).
The moisture management and structural integrity have been proposed for systematic examination.
The proper control systems implementation enhances risk mitigation strategies.
Additionally, in the concept of future developments, the study indicates several directions that require proper assessment, among others:
The specialized design codes development, as the current standards may not be sufficient.
The holistic monitoring systems integration through advanced technologies.
The standardized maintenance protocols enhance both structural and biological components.
The large-scale implementation of control systems.
While this review presents extensive information on VF systems in RC buildings, it is necessary to highlight some gaps in the knowledge that need to be addressed in the future. The risk assessments aim, for the first time, to take into account combined effects for VF installations; therefore future long-term performance data will be very helpful for rigorous recalibrations of estimated risks. Future reviews may need to pay special attention to complex interactions between structural and biological components. The STPA analysis focused on specific subsystems, i.e., the balcony and living wall, and might require extension to cover other VF configurations. Also, the environmental impact assessments mainly consider Mediterranean climate conditions, and the results might need to be adjusted to suit different climatic zones.
Furthermore, vertical forest renovations require proper consideration of seismic resilience, as ultimately, the earthquake-related parameters are crucial factors that sometimes largely interact with VF components and holistic system resilience assessment. Sustainable urban transformation through VF systems has been extensively reviewed, with special attention to structural stability, environmental efficiency, and occupant safety issues.
Author Contributions
Conceptualization, V.V., T.R., T.F., M.V., M.M., A.Z., I.T., M.S., K.V., G.M., V.K. and C.C.; methodology, V.V., T.R., T.F., M.V., M.M., A.Z., I.T., M.S., K.V., G.M., V.K. and C.C.; software, V.V.; validation, V.V., T.R., T.F., M.V., M.M., A.Z., I.T., M.S., K.V., G.M., V.K. and C.C.; formal analysis, V.V., T.R., T.F., M.V., M.M., A.Z., I.T., M.S., K.V., G.M., V.K. and C.C.; investigation, V.V., T.R., T.F., M.V., M.M., A.Z., I.T., M.S., K.V., G.M., V.K. and C.C.; resources, V.V., T.R., T.F., M.V., M.M., A.Z., I.T., M.S., K.V., G.M., V.K. and C.C.; data curation, V.V.; writing—original draft preparation, V.V., T.R., T.F., M.V., M.M., A.Z., I.T., M.S., K.V., G.M., V.K. and C.C.; writing—review and editing, V.V., T.R., T.F., M.V., M.M., A.Z., I.T., M.S., K.V., G.M., V.K. and C.C.; visualization, V.V.; supervision, T.R., M.V. and G.M; project administration, T.R.; funding acquisition, T.R., M.V. and G.M. All authors have read and agreed to the published version of the manuscript.
Funding
The research project is implemented in the framework of H.F.R.I call “Basic research Financing (Horizontal support of all Sciences)” under the National Recovery and Resilience Plan “Greece 2.0” funded by the European Union—NextGenerationEU (H.F.R.I. Project Number: 015376).
Data Availability Statement
The analyses presented in this study are included in the article; further inquiries can be directed to the corresponding authors.
Conflicts of Interest
The authors declare no conflicts of interest.
Appendix A
For all
Table A1,
Table A2,
Table A3 and
Table A4, the following notations are applied.
| Individual Level Rating |
| Levels | Color and Rating | Description |
| Low | 1 | Acceptable damage, no need of repair |
| Moderate | 2 | Under investigation, component replacement/reinforcement may happen |
| High | 3 | Urgent action, life threating conditions |
| Total Level Rating |
| Low Importance | [5–8] | |
| Medium Importance | (8–12] | |
| High Importance | (12–more] | |
Five different experts provided their assessments based on their expertise and experience, incorporating varying weights of importance for different damage causes in their evaluations. Then, the overall performance was considered as the average of the weighted scores.
For the Total Level Rating, the cutoff values of 8 and 12 were chosen based on the design of the rating system in which five experts rated each factor on a 1–3 rating scale. The lowest score possible is 5, where all experts rated a factor a rating of 1 (1 + 1 + 1 + 1 + 1 = 5), and the highest is 15, where all experts rated a factor a rating of 3 (3 + 3 + 3 + 3 + 3 = 15). In addition, using the 5–15 range, the intervals were divided into three ranges of: (a) low importance = 5–8, (b) medium importance = 8–12, and (c) high importance = 12–15. This division also further aligns with the three-level individual rating system, 1—Low, 2—Moderate, and 3—High, used by the experts to provide a more balanced threshold in categorizing their aggregated expert opinions.
Table A1.
Expert assessment of damage causes and severity in Common Reinforced Concrete Buildings.
Table A1.
Expert assessment of damage causes and severity in Common Reinforced Concrete Buildings.
| Common Reinforced Concrete Buildings | Levels | Total |
|---|
| Structural Performance |
|---|
| Causes of Damages | Damages | EO1 | EO2 | EO3 | EO4 | EO5 |
|---|
| Material | Poor concrete quality | Cracking | 2 | 2 | 2 | 3 | 3 | 12 |
| Reduced load-bearing capacity | 2 | 2 | 2 | 3 | 3 | 12 |
| Surface spalling | 2 | 2 | 2 | 3 | 3 | 12 |
| Permeability issues | 2 | 2 | 2 | 3 | 3 | 12 |
| Corrosion | Reinforcement deterioration | 2 | 2 | 2 | 3 | 3 | 12 |
| Loss of structural integrity | 2 | 2 | 2 | 3 | 3 | 12 |
| Water leakage | 2 | 2 | 2 | 3 | 3 | 12 |
| Design | Non-compliance with the earthquake
regulations | Structural cracking | 2 | 2 | 2 | 3 | 2 | 11 |
| Short column | HRF of structural elements (columns, beams and joints), Loss of structural integrity during design EQ | 2 | 2 | 2 | 3 | 2 | 11 |
Strong beam-
weak column | HRF during design EQ | 2 | 2 | 2 | 2 | 2 | 10 |
Insufficient shear
capacity | HRF load-bearing capacity during design EQ | 2 | 2 | 2 | 2 | 2 | 10 |
| Soft and weak story | HRF of Soft story failure, Joint failures during design EQ | 2 | 2 | 2 | 2 | 2 | 10 |
| Weak attachment to the frames | HRF of elements like infill walls, ceilings and facades during design EQ | 2 | 2 | 2 | 2 | 2 | 10 |
Reinforcement
details | Insufficient reinforcement ratio | Reinforcement slippage | 3 | 3 | 3 | 3 | 3 | 15 |
| Insufficient transverse reinforcement | Shear cracking | 3 | 3 | 3 | 3 | 3 | 15 |
| Smooth stirrups | Loss of structural integrity | 3 | 3 | 3 | 2 | 3 | 14 |
| Lack of crossties | Buckling of longitudinal reinforcement | 3 | 3 | 3 | 3 | 3 | 15 |
| Lack of transverse reinforcement in connection region | Reduced load-bearing capacity | 3 | 3 | 3 | 3 | 3 | 15 |
| 90° hooks instead of 135° | Joint and connection failure | 3 | 3 | 3 | 3 | 3 | 15 |
| Others | Adjacent buildings effect | Collision damage, Structural instability, Cracking | 2 | 3 | 2 | 2 | 2 | 11 |
| Insufficient determination of soil properties | Structural tilting, Cracks in walls and floors,
Foundation failure | 2 | 3 | 3 | 2 | 2 | 12 |
| Infill wall damages | Loss of lateral stability, Loss of lateral stability | 3 | 3 | 2 | 3 | 2 | 13 |
Table A2.
Expert assessment of damage causes and severity in Greenery-Covered Buildings (Structural Performance).
Table A2.
Expert assessment of damage causes and severity in Greenery-Covered Buildings (Structural Performance).
| Greenery-Covered Buildings | Levels | Total |
|---|
| Structural Performance |
|---|
| Causes of Damages | Damages | EO1 | EO2 | EO3 | EO4 | EO5 |
|---|
| Root penetration (growth/action) | Wall and foundation integrity | 2 | 2 | 2 | 2 | 3 | 11 |
| Potential instability issues | 2 | 2 | 2 | 2 | 3 | 11 |
| Cracks | 2 | 2 | 2 | 2 | 3 | 11 |
| Potential damage to technical features (e.g., pipelines) | 2 | 2 | 2 | 2 | 3 | 11 |
| Plants direct attachment/green layer removal | Wall and foundation integrity | 2 | 2 | 2 | 2 | 2 | 10 |
| Lifted blocks | 2 | 2 | 2 | 2 | 2 | 10 |
| Cracks | 2 | 2 | 2 | 2 | 2 | 10 |
| Scarring | 2 | 2 | 2 | 2 | 2 | 10 |
| Plaster removal | 2 | 3 | 2 | 2 | 2 | 11 |
| Local wetness | 2 | 3 | 2 | 2 | 2 | 11 |
| High level of moisture (due to evapotranspiration) | Mold development | 3 | 3 | 3 | 3 | 3 | 15 |
| Indoor and outdoor dampness | 2 | 3 | 2 | 3 | 3 | 13 |
| Material covers damages | 3 | 3 | 3 | 3 | 3 | 15 |
| Slow drying | 3 | 3 | 3 | 3 | 3 | 15 |
| High level of moisture (due to watering/irrigation systems) | Water leaks | 3 | 3 | 3 | 3 | 3 | 15 |
| Water pooling | 3 | 3 | 3 | 3 | 3 | 15 |
| Dripping water | 3 | 3 | 3 | 3 | 3 | 15 |
| Indoor and outdoor dampness | 3 | 3 | 3 | 3 | 3 | 15 |
| Mold development | 3 | 3 | 3 | 3 | 3 | 15 |
| Corrosion | 3 | 3 | 3 | 3 | 3 | 15 |
| Streaking | 3 | 3 | 3 | 3 | 3 | 15 |
| Material covers damages | 3 | 2 | 3 | 3 | 3 | 14 |
| Soil moisture changes | Wall and foundation integrity | 2 | 2 | 2 | 1 | 2 | 9 |
| Potential instability issues | 2 | 2 | 2 | 1 | 2 | 9 |
| Subsidence | 2 | 2 | 2 | 1 | 2 | 9 |
| Soil microbial flora and organic acids | Concrete erosion | 2 | 3 | 2 | 2 | 2 | 11 |
| Overgrown vegetation | Overtaking space | 2 | 2 | 2 | 2 | 2 | 10 |
| Blocking windows | 2 | 2 | 2 | 2 | 2 | 10 |
| Cascading branches | 2 | 2 | 2 | 2 | 2 | 10 |
| Technical features obstruction (e.g., drip grooves, pipes) | 2 | 2 | 3 | 3 | 2 | 12 |
| Additional weight and stresses (plants/planting media) | Potential instability issues (e.g., reinforced concrete planting balcony) | 1 | 2 | 3 | 2 | 2 | 10 |
| Fire | Structural integrity | 3 | 3 | 3 | 3 | 3 | 15 |
| Burned materials | 3 | 3 | 3 | 3 | 3 | 15 |
| Collapse | 3 | 3 | 3 | 3 | 3 | 15 |
| Wind | Structural integrity | 2 | 3 | 2 | 3 | 3 | 13 |
| Cracks | 2 | 1 | 2 | 3 | 3 | 11 |
| Collapse | 3 | 3 | 2 | 3 | 3 | 14 |
| Blown out | 2 | 2 | 2 | 3 | 3 | 12 |
| Debris | 3 | 2 | 2 | 3 | 3 | 13 |
| Earthquake | Structural integrity | 3 | 3 | 3 | 3 | 3 | 15 |
| Cracks | 3 | 3 | 3 | 3 | 3 | 15 |
| Collapse | 3 | 3 | 3 | 3 | 3 | 15 |
| Spalling | 3 | 3 | 3 | 3 | 3 | 15 |
| Instability | 3 | 3 | 3 | 3 | 3 | 15 |
Table A3.
Expert assessment of damage causes and severity in Greenery-Covered Buildings (Greenery performance).
Table A3.
Expert assessment of damage causes and severity in Greenery-Covered Buildings (Greenery performance).
| Greenery-Covered Buildings | Levels | Total |
|---|
| Greenery Performance |
|---|
| Causes of Damages | Damages | EO1 | EO2 | EO3 | EO4 | EO5 |
|---|
| High level of moisture (due to evapotranspiration) | Pests | 3 | 3 | 3 | 3 | 3 | 15 |
| Degradation of planting media | 3 | 3 | 3 | 3 | 3 | 15 |
| Low level of moisture (due to watering/irrigation systems) | Plant stress | 3 | 3 | 3 | 3 | 3 | 15 |
| Dry vegetation | 3 | 3 | 3 | 3 | 3 | 15 |
| Dead plants | 3 | 3 | 3 | 3 | 3 | 15 |
| Wilting | 3 | 3 | 3 | 3 | 3 | 15 |
| Gaps | 3 | 3 | 3 | 3 | 3 | 15 |
| Degradation of planting media | 3 | 3 | 3 | 3 | 3 | 15 |
| Improper maintenance | Overgrown vegetation | 3 | 3 | 3 | 3 | 3 | 15 |
| Dead biomass | 3 | 3 | 3 | 3 | 3 | 15 |
| Bio debris | 2 | 3 | 3 | 3 | 3 | 14 |
| Gaps | 2 | 3 | 3 | 3 | 3 | 14 |
| Degradation of planting media | 3 | 3 | 3 | 3 | 3 | 15 |
| Loss | 3 | 3 | 3 | 3 | 3 | 15 |
| Compaction | 3 | 3 | 3 | 3 | 3 | 15 |
| Inadequate space | Distorted vegetation growth | 2 | 2 | 3 | 2 | 2 | 11 |
| Environmental stressors (harsh sunlight, strong wind) | Plant stress | 3 | 3 | 3 | 3 | 3 | 15 |
| Dehydration | 2 | 3 | 3 | 3 | 3 | 14 |
| Fire | Burnt vegetation | 3 | 3 | 3 | 3 | 3 | 15 |
| Wind | Uprooting | 3 | 3 | 3 | 3 | 3 | 15 |
| Mechanical stress | 3 | 3 | 3 | 3 | 3 | 15 |
| Dehydration | 3 | 3 | 3 | 3 | 3 | 15 |
| Reduced plant growth rate | 3 | 2 | 3 | 3 | 3 | 14 |
| Wilting | 3 | 3 | 3 | 3 | 3 | 15 |
| Bended trees | 3 | 3 | 3 | 3 | 3 | 15 |
| Falling bio debris | 3 | 2 | 3 | 2 | 2 | 12 |
| Earthquake | Planter anchorage and instability | 3 | 3 | 3 | 3 | 3 | 15 |
| Tree pot anchorage and instability | 3 | 3 | 3 | 3 | 3 | 15 |
Table A4.
Expert assessment of damage causes and severity in Greenery-Covered Buildings (Human Welfare).
Table A4.
Expert assessment of damage causes and severity in Greenery-Covered Buildings (Human Welfare).
| Greenery-Covered Buildings | Levels | Total |
|---|
| Human Welfare |
|---|
| Causes of Damages | Damages | EO1 | EO2 | EO3 | EO4 | EO5 |
|---|
| Dead plants | Aesthetics | 3 | 3 | 3 | 3 | 3 | 15 |
| Utility | 3 | 3 | 2 | 3 | 3 | 14 |
| Energy needs (increased during summer) | 3 | 3 | 2 | 3 | 3 | 14 |
| Overgrown vegetation | Insects | 3 | 3 | 3 | 3 | 3 | 15 |
| Aesthetics | 2 | 2 | 3 | 3 | 3 | 13 |
| Energy needs (increased during winter) | 2 | 2 | 3 | 3 | 3 | 13 |
| Utility | 2 | 2 | 3 | 3 | 3 | 13 |
| Reduced sunlight/view | 2 | 2 | 3 | 3 | 3 | 13 |
| Living space occupation | 2 | 2 | 3 | 3 | 3 | 13 |
| High moisture level | Health issues | 3 | 3 | 3 | 3 | 3 | 15 |
| Pests | 3 | 3 | 3 | 3 | 3 | 15 |
| Insects | 3 | 3 | 3 | 3 | 3 | 15 |
| Mold development | 3 | 3 | 3 | 3 | 3 | 15 |
| Maintenance | Cost | 2 | 2 | 3 | 2 | 3 | 12 |
| Time | 2 | 2 | 3 | 2 | 3 | 12 |
| Potential falls | 3 | 3 | 3 | 3 | 3 | 15 |
| Work at height | 2 | 3 | 3 | 2 | 3 | 13 |
| Non-native species | Ecological imbalances | 2 | 2 | 3 | 2 | 3 | 12 |
| Fire | Safety | 3 | 3 | 3 | 3 | 3 | 15 |
| Evacuation obstruction | 3 | 3 | 3 | 3 | 3 | 15 |
| Fire vertical propagation | 3 | 3 | 3 | 3 | 3 | 15 |
| Chimney effect | 3 | 3 | 3 | 3 | 3 | 15 |
| Wind | Safety | 3 | 3 | 3 | 3 | 3 | 15 |
| Fallen objects/bio-debris | 3 | 3 | 3 | 3 | 3 | 15 |
| Turbulence | 3 | 3 | 3 | 3 | 3 | 15 |
| Earthquake | High repairing cost | 3 | 3 | 3 | 3 | 3 | 15 |
Appendix B
The primary steps of Monte Carlo Simulations include [
123,
124]:
Problem Definition: Define the system, process, or decision analyzed, and its objectives.
Model the System: One must develop a mathematical or computational model of the system.
Define Input Variables: Identify which inputs are random, assign a probability distribution to the random variables or sample from a defined range of numbers.
Monte Carlo Simulation: Run many iterations, sampling randomly each time from the input distributions; then calculate the output.
Analyze results: Integrate data to identify trends, probabilities, or expected risks to different outcome scenarios.
The Monte Carlo analysis has been conducted for proper assessment of expert evaluations, as there is a need for probability distribution examination of risk levels in different system subcomponents. The study indicated that discrete ratings conversion into continuous intervals enhances the modeling precision: (a) rating 1 [0.0, 1.3], (b) rating 2 [0.7, 2.3], and (c) rating 3 [1.7, 3.0]. Additionally, in the concept of statistical reliability, 10,000 simulation runs have been extensively examined while maintaining the balance between expert opinions and sampling methodology. The risk categorization through deterministic calculations provides proper assessment, among others, low risk (5–8 points), medium risk (8–12 points), and high risk (12–15 points), and the average scores, standard deviations, and 95th percentile values are crucial factors that require systematic examination. Furthermore, the overall risk profile integration has been proposed through consolidated results visualization while maintaining reliability between probabilistic outcomes and specific risk thresholds.
The visualization of Common RC Buildings distribution is depicted in
Figure A1, and statistical results are denoted in
Table A5.
The visualization of Greenery-Covered Buildings (Structural Performance) distribution is depicted in
Figure A2 and
Figure A3, and statistical results are denoted in
Table A6.
The visualization of Greenery-Covered Buildings (Greenery Performance) distribution is depicted in
Figure A4, and statistical results are denoted in
Table A7.
The visualization of Greenery-Covered Buildings (Human Welfare) distribution is depicted in
Figure A5, and statistical results are denoted in
Table A8.
Figure A1.
Monte Carlo analysis distribution results for Common RC Buildings based on
Table A1 and Overall Risk.
Figure A1.
Monte Carlo analysis distribution results for Common RC Buildings based on
Table A1 and Overall Risk.
Figure A2.
Monte Carlo analysis distribution results for Greenery-Covered Buildings (Structural Performance) based on
Table A2 (part 1 of 2).
Figure A2.
Monte Carlo analysis distribution results for Greenery-Covered Buildings (Structural Performance) based on
Table A2 (part 1 of 2).
Table A5.
Statistical results of Monte Carlo analysis distribution results for Common RC Buildings based on
Table A1.
Table A5.
Statistical results of Monte Carlo analysis distribution results for Common RC Buildings based on
Table A1.
| Group | Damage Type | Mean Score | Standard Deviation | 95th Percentile | Low Risk (%) | Medium Risk (%) | High Risk (%) |
|---|
| Material | poor concrete cracking | 9.18 | 1.34 | 11.36 | 19.73 | 78.69 | 1.58 |
| poor concrete load bearing | 9.19 | 1.32 | 11.37 | 19.12 | 79.47 | 1.41 |
| poor concrete spalling | 9.19 | 1.34 | 11.38 | 19.29 | 79.00 | 1.71 |
| poor concrete permeability | 9.20 | 1.33 | 11.38 | 18.89 | 79.74 | 1.37 |
| corrosion reinforcement | 9.19 | 1.34 | 11.38 | 19.21 | 79.35 | 1.44 |
| corrosion structural | 9.19 | 1.31 | 11.37 | 18.56 | 80.05 | 1.39 |
| corrosion water leakage | 9.21 | 1.33 | 11.41 | 18.16 | 80.24 | 1.60 |
| Design | earthquake structural cracking | 8.36 | 1.25 | 10.44 | 39.04 | 60.77 | 0.19 |
| structural element failure | 8.36 | 1.25 | 10.48 | 39.78 | 60.01 | 0.21 |
| partial collapse | 7.51 | 1.03 | 9.21 | 67.56 | 32.44 | 0.00 |
| load bearing capacity | 7.49 | 1.03 | 9.20 | 68.32 | 31.68 | 0.00 |
| story failure | 7.51 | 1.04 | 9.23 | 67.70 | 32.30 | 0.00 |
| element falling | 7.49 | 1.02 | 9.17 | 68.19 | 31.81 | 0.00 |
| Reinforcement | slippage | 11.76 | 0.83 | 13.16 | 0.00 | 61.58 | 38.42 |
| shear cracking | 11.76 | 0.83 | 13.12 | 0.00 | 61.04 | 38.96 |
| structural integrity loss | 10.91 | 1.15 | 12.70 | 0.88 | 81.84 | 17.28 |
| buckled reinforcement | 11.77 | 0.85 | 13.15 | 0.00 | 59.93 | 40.07 |
| reduced load capacity | 11.75 | 0.84 | 13.14 | 0.00 | 61.48 | 38.52 |
| connection failure | 11.75 | 0.85 | 13.15 | 0.00 | 61.60 | 38.40 |
| Others | collision damage | 8.35 | 1.27 | 10.47 | 40.20 | 59.63 | 0.17 |
| structural tilting | 9.17 | 1.32 | 11.34 | 19.22 | 79.27 | 1.51 |
| lateral stability loss | 10.05 | 1.30 | 12.11 | 6.26 | 87.45 | 6.29 |
| Overall Score | 9.47 | 0.25 | 9.88 | 0.00 | 100.00 | 0.00 |
Figure A3.
Monte Carlo analysis distribution results for Greenery-Covered Buildings (Structural Performance) based on
Table A2 (part 2 of 2) and Overall Risk.
Figure A3.
Monte Carlo analysis distribution results for Greenery-Covered Buildings (Structural Performance) based on
Table A2 (part 2 of 2) and Overall Risk.
Table A6.
Statistical results of Monte Carlo analysis distribution results for Greenery-Covered Buildings (Structural Performance) based on
Table A2.
Table A6.
Statistical results of Monte Carlo analysis distribution results for Greenery-Covered Buildings (Structural Performance) based on
Table A2.
| Group | Damage Type | Mean Score | Standard Deviation | 95th Percentile | Low Risk (%) | Medium Risk (%) | High Risk (%) |
|---|
| Root | penetration wall foundation integrity | 8.35 | 1.26 | 10.47 | 39.81 | 59.96 | 0.23 |
| penetration potential instability | 8.33 | 1.26 | 10.41 | 40.61 | 59.18 | 0.21 |
| penetration cracks | 8.35 | 1.26 | 10.47 | 39.71 | 60.05 | 0.24 |
| penetration technical features damage | 8.33 | 1.26 | 10.42 | 40.12 | 59.63 | 0.25 |
| Plants | attachment wall foundation integrity | 7.49 | 1.03 | 9.22 | 68.45 | 31.55 | 0.00 |
| attachment lifted blocks | 7.52 | 1.05 | 9.24 | 67.35 | 32.65 | 0.00 |
| attachment cracks | 7.50 | 1.03 | 9.21 | 68.17 | 31.83 | 0.00 |
| attachment scarring | 7.49 | 1.04 | 9.23 | 67.90 | 32.10 | 0.00 |
| attachment plaster removal | 8.33 | 1.24 | 10.40 | 39.85 | 60.03 | 0.12 |
| attachment local wetness | 8.35 | 1.24 | 10.43 | 39.63 | 60.14 | 0.23 |
| Moisture Evapotranspiration | mold development | 11.75 | 0.84 | 13.11 | 0.00 | 61.15 | 38.85 |
| dampness | 10.04 | 1.31 | 12.11 | 6.80 | 87.21 | 5.99 |
| material covers damages | 11.74 | 0.84 | 13.12 | 0.00 | 62.15 | 37.85 |
| slow drying | 11.76 | 0.85 | 13.14 | 0.00 | 60.77 | 39.23 |
| Moisture Irrigation | water leaks | 11.76 | 0.84 | 13.15 | 0.00 | 61.32 | 38.68 |
| water pooling | 11.74 | 0.84 | 13.12 | 0.00 | 61.21 | 38.79 |
| dripping water | 11.76 | 0.83 | 13.14 | 0.00 | 61.29 | 38.71 |
| dampness | 11.75 | 0.84 | 13.11 | 0.00 | 61.59 | 38.41 |
| mold development | 11.74 | 0.84 | 13.11 | 0.00 | 61.60 | 38.40 |
| corrosion | 11.74 | 0.84 | 13.12 | 0.00 | 61.83 | 38.17 |
| streaking | 11.76 | 0.84 | 13.13 | 0.00 | 60.83 | 39.17 |
| material covers damages | 10.91 | 1.16 | 12.72 | 1.00 | 81.02 | 17.98 |
| Soil Moisture | wall foundation integrity | 6.65 | 1.25 | 8.69 | 85.35 | 14.65 | 0.00 |
| potential instability | 6.64 | 1.25 | 8.70 | 85.92 | 14.08 | 0.00 |
| subsidence | 6.65 | 1.25 | 8.70 | 85.89 | 14.11 | 0.00 |
| soil microbial concrete erosion | 8.34 | 1.26 | 10.40 | 39.72 | 60.14 | 0.14 |
| Overgrown Vegetation | overtaking space | 7.50 | 1.04 | 9.22 | 68.30 | 31.70 | 0.00 |
| blocking windows | 7.51 | 1.03 | 9.21 | 67.52 | 32.48 | 0.00 |
| cascading branches | 7.51 | 1.03 | 9.22 | 68.18 | 31.82 | 0.00 |
| technical features obstruction | 9.21 | 1.33 | 11.38 | 18.21 | 80.24 | 1.55 |
| Additional Weight | potential instability | 7.48 | 1.55 | 10.05 | 62.94 | 36.92 | 0.14 |
| structural integrity | 10.91 | 1.18 | 12.73 | 1.04 | 80.80 | 18.16 |
| Fire | burned materials | 11.76 | 0.84 | 13.14 | 0.00 | 60.69 | 39.31 |
| collapse | 11.77 | 0.84 | 13.14 | 0.00 | 60.47 | 39.53 |
| Wind | structural integrity | 10.01 | 1.31 | 12.10 | 6.82 | 87.12 | 6.06 |
| cracks | 8.34 | 1.69 | 11.06 | 41.97 | 57.06 | 0.97 |
| collapse | 10.91 | 1.16 | 12.73 | 0.84 | 81.60 | 17.56 |
| blown out | 9.21 | 1.35 | 11.38 | 18.91 | 79.57 | 1.52 |
| debris | 10.05 | 1.30 | 12.13 | 5.95 | 87.77 | 6.28 |
| Earthquake | structural integrity | 11.74 | 0.84 | 13.14 | 0.00 | 61.92 | 38.08 |
| cracks | 11.75 | 0.83 | 13.12 | 0.00 | 61.37 | 38.63 |
| collapse | 11.76 | 0.84 | 13.15 | 0.00 | 61.32 | 38.68 |
| spalling | 11.74 | 0.84 | 13.11 | 0.00 | 61.90 | 38.10 |
| instability | 11.74 | 0.85 | 13.16 | 0.00 | 61.79 | 38.21 |
| Overall Score | 9.72 | 0.17 | 9.99 | 0.00 | 100.00 | 0.00 |
Figure A4.
Monte Carlo analysis distribution results for Greenery-Covered Buildings (Greenery Performance) based on
Table A3 and Overall Risk.
Figure A4.
Monte Carlo analysis distribution results for Greenery-Covered Buildings (Greenery Performance) based on
Table A3 and Overall Risk.
Table A7.
Statistical results of Monte Carlo analysis distribution results for Greenery-Covered Buildings (Greenery Performance) based on
Table A3.
Table A7.
Statistical results of Monte Carlo analysis distribution results for Greenery-Covered Buildings (Greenery Performance) based on
Table A3.
| Group | Damage Type | Mean Score | Standard Deviation | 95th Percentile | Low Risk (%) | Medium Risk (%) | High Risk (%) |
|---|
| High Moisture Evapotranspiration | pests | 11.76 | 0.84 | 13.12 | 0.00 | 60.84 | 39.16 |
| planting media degradation | 11.76 | 0.84 | 13.14 | 0.00 | 60.65 | 39.35 |
| Low Moisture | irrigation plant stress | 11.74 | 0.83 | 13.12 | 0.00 | 61.94 | 38.06 |
| irrigation dry vegetation | 11.75 | 0.84 | 13.14 | 0.00 | 61.64 | 38.36 |
| irrigation dead plants | 11.76 | 0.84 | 13.16 | 0.00 | 61.30 | 38.70 |
| irrigation wilting | 11.75 | 0.84 | 13.15 | 0.00 | 61.41 | 38.59 |
| irrigation gaps | 11.74 | 0.84 | 13.14 | 0.00 | 61.49 | 38.51 |
| irrigation planting media degradation | 11.75 | 0.83 | 13.11 | 0.00 | 61.55 | 38.45 |
| Improper Maintenance | overgrown vegetation | 11.75 | 0.83 | 13.10 | 0.00 | 61.46 | 38.54 |
| dead biomass | 11.74 | 0.83 | 13.10 | 0.00 | 61.87 | 38.13 |
| bio debris | 10.90 | 1.16 | 12.73 | 1.08 | 81.23 | 17.69 |
| gaps | 10.90 | 1.17 | 12.73 | 0.99 | 81.54 | 17.47 |
| planting media degradation | 11.75 | 0.82 | 13.11 | 0.00 | 62.03 | 37.97 |
| loss | 11.74 | 0.85 | 13.14 | 0.00 | 61.57 | 38.43 |
| compaction | 11.76 | 0.84 | 13.15 | 0.00 | 60.90 | 39.10 |
| Inadequate | space distorted vegetation growth | 8.35 | 1.25 | 10.46 | 39.64 | 60.17 | 0.19 |
| Environmental Stressors | plant stress | 11.75 | 0.83 | 13.14 | 0.00 | 61.29 | 38.71 |
| dehydration | 10.90 | 1.16 | 12.71 | 1.16 | 81.23 | 17.61 |
| Fire | burnt vegetation | 11.75 | 0.83 | 13.13 | 0.00 | 61.57 | 38.43 |
| Wind | uprooting | 11.75 | 0.84 | 13.11 | 0.00 | 61.25 | 38.75 |
| mechanical stress | 11.73 | 0.83 | 13.10 | 0.00 | 62.22 | 37.78 |
| dehydration | 11.75 | 0.84 | 13.13 | 0.00 | 60.89 | 39.11 |
| reduced plant growth rate | 10.90 | 1.14 | 12.68 | 0.91 | 81.86 | 17.23 |
| wilting | 11.76 | 0.84 | 13.14 | 0.00 | 60.93 | 39.07 |
| bended trees | 11.75 | 0.84 | 13.15 | 0.00 | 60.65 | 39.35 |
| falling bio debris | 9.20 | 1.34 | 11.41 | 18.93 | 79.24 | 1.83 |
| Earthquake | planter anchorage instability | 11.76 | 0.84 | 13.13 | 0.00 | 60.90 | 39.10 |
| tree pot anchorage instability | 11.75 | 0.84 | 13.15 | 0.00 | 61.68 | 38.32 |
| Overall Score | 11.42 | 0.18 | 11.71 | 0.00 | 99.97 | 0.03 |
Figure A5.
Monte Carlo analysis distribution results for Greenery-Covered Buildings (Human welfare) based on
Table A4 and Overall Risk.
Figure A5.
Monte Carlo analysis distribution results for Greenery-Covered Buildings (Human welfare) based on
Table A4 and Overall Risk.
Table A8.
Statistical results of Monte Carlo analysis distribution results for Greenery-Covered Buildings (Human Welfare) based on
Table A4.
Table A8.
Statistical results of Monte Carlo analysis distribution results for Greenery-Covered Buildings (Human Welfare) based on
Table A4.
| Group | Damage Type | Mean Score | Standard Deviation | 95th Percentile | Low Risk (%) | Medium Risk (%) | High Risk (%) |
|---|
| Dead Plants | aesthetics | 11.76 | 0.84 | 13.15 | 0.00 | 60.55 | 39.45 |
| utility | 10.90 | 1.16 | 12.74 | 0.90 | 81.66 | 17.44 |
| energy needs summer | 10.90 | 1.17 | 12.70 | 1.16 | 80.90 | 17.94 |
| Overgrown Vegetation | insects | 11.75 | 0.83 | 13.13 | 0.00 | 61.16 | 38.84 |
| aesthetics | 10.05 | 1.31 | 12.16 | 6.32 | 87.00 | 6.68 |
| energy needs winter | 10.06 | 1.30 | 12.15 | 6.21 | 87.20 | 6.59 |
| utility | 10.08 | 1.29 | 12.12 | 5.94 | 87.94 | 6.12 |
| reduced sunlight view | 10.06 | 1.32 | 12.16 | 6.56 | 86.77 | 6.67 |
| living space occupation | 10.05 | 1.30 | 12.12 | 6.25 | 87.43 | 6.32 |
| High Moisture Level | health issues | 11.75 | 0.82 | 13.09 | 0.00 | 61.40 | 38.60 |
| pests | 11.76 | 0.84 | 13.13 | 0.00 | 60.74 | 39.26 |
| insects | 11.74 | 0.84 | 13.14 | 0.00 | 61.18 | 38.82 |
| mold development | 11.74 | 0.85 | 13.14 | 0.00 | 61.62 | 38.38 |
| Maintenance | cost | 9.19 | 1.33 | 11.34 | 19.03 | 79.65 | 1.32 |
| time | 9.23 | 1.32 | 11.39 | 18.18 | 80.33 | 1.49 |
| potential falls | 11.75 | 0.84 | 13.15 | 0.00 | 61.09 | 38.91 |
| work at height | 10.05 | 1.29 | 12.11 | 6.39 | 87.59 | 6.02 |
| Fire | ecological imbalances | 9.19 | 1.34 | 11.37 | 18.92 | 79.56 | 1.52 |
| safety | 11.76 | 0.85 | 13.15 | 0.00 | 61.14 | 38.86 |
| evacuation obstruction | 11.75 | 0.84 | 13.12 | 0.00 | 61.37 | 38.63 |
| vertical propagation | 11.72 | 0.84 | 13.09 | 0.00 | 62.61 | 37.39 |
| chimney effect | 11.75 | 0.84 | 13.14 | 0.00 | 61.27 | 38.73 |
| Wind | safety | 11.75 | 0.84 | 13.13 | 0.00 | 61.44 | 38.56 |
| fallen objects bio debris | 11.77 | 0.84 | 13.13 | 0.00 | 60.13 | 39.87 |
| turbulence | 11.75 | 0.84 | 13.14 | 0.00 | 61.14 | 38.86 |
| Earthquake | high repairing cost | 11.74 | 0.85 | 13.15 | 0.00 | 61.62 | 38.38 |
| Overall Score | 11.00 | 0.21 | 11.34 | 0.00 | 100.00 | 0.00 |
Appendix C
Two specific domain systems were analyzed using System-Theoretic Process Analysis (STPA), developed by [
122] (see
Figure 2), until the stage of safety constraint identification to provide adequate data for creating proper risk assessment matrices. In this study, the following steps were taken for STPA:
System Definition
Control Structure Development (both high-level and detailed)
Accidents (Losses) and Hazards Identification
Unsafe Control Actions (UCAs) Analysis
Safety Requirements (SR) and Constraints (SC)
Appendix C.1. System Definition for VF RC Building Balcony
Structural Elements
The VF balcony system consists of a load-carrying concrete slab resting on structural beams. The superimposed loads on the system include, among others, dead loads from permanent weight of planters, soil, and mature plants, and the live loads related to maintenance activities and environmental forces. Additionally, the system incorporates a parapet/railing component that ensures occupant safety.
Supportive Plant Structure
Self-designed planter boxes line the balcony, as there is a need for proper containment of growth medium and plant system fastening. The planter design considers, among others, adequate soil volume calculations for plant growth while maintaining minimal structural load impact from the container system. Subsequently, the anchoring systems provide stability during adverse weather conditions.
Plant Care System Integration
Irrigation Infrastructure: Distributes water through precise irrigation delivery system, consisting of pipes with pressure-regulated drippers and in-ground moisture sensors with real-time monitoring ensuring optimal watering levels.
Nutrient Management Framework: Sophisticated fertigation system manages plant nutrition through:
Centralized nutrient storage containers.
Precision dosing equipment to track and adjust nutrient concentration.
Inbuilt distribution network within the irrigation network.
Smart controls: Selectively regulating nutrient delivery in respect to plant needs and growth cycles.
Monitoring Framework
The system leverages a surveillance network with the following coverage:
Load monitoring sensors that provide constant weight distribution tracking.
Structural Health Monitoring Systems that would identify any significant deflection or cracking.
Soil moisture, nutrient level, and growing condition-measuring environmental sensors.
Smart controllers with the integration of sensor information to manage irrigation and nutrient applications.
Human Interface and Management
This involves concurrent monitoring by different interested parties:
Residents participate in basic system monitoring and report any problems to the appropriate staff.
Periodical testing and low-level maintenance by system maintenance personnel.
Horticulturists manage plant health and adjust care parameters.
Standby power supply for basic monitoring and control functions.
Figure A6.
Control Structure for VF RC Buildings Balcony system: (a) high system approach; (b) detailed system approach.
Figure A6.
Control Structure for VF RC Buildings Balcony system: (a) high system approach; (b) detailed system approach.
Safety and Emergency Protocol
A comprehensive monitoring system is equipped with fail-safes and emergency protocols:
Automatic shut-down of liquid distribution systems when a leak event occurs.
Overloading warning systems.
Emergency drainage capability after an extreme event.
Table A9.
Accident (Loses) definition for VF RC Buildings Balcony system.
Table A9.
Accident (Loses) definition for VF RC Buildings Balcony system.
| Accident (Loses) | Description |
|---|
| A-1: Loss of human life or injury | A-1.1: People injured/killed by falling plants/containers |
| A-1.2: People injured/killed by structural collapse |
| A-1.3: People injured/killed by slipping on wet surfaces |
| A-1.4: Injuries/fatalities during maintenance activities |
| A-2: Property damage | A-2.1: Damage to balcony structure |
| A-2.2: Damage to apartment interior due to water/nutrient leakage |
| A-2.3: Damage to lower floors/apartments |
| A-2.4: Damage to personal property on balcony |
| A-3: Environmental damage | A-3.1: Plant death/ecosystem disruption |
| A-3.2: Chemical/nutrient runoff affecting environment |
| A-3.3: Excessive water waste |
| A-3.4: Soil contamination from system failures |
| A-4: Mission losses | A-4.1: Failure to maintain healthy vertical forest |
| A-4.2: System abandonment due to maintenance issues |
| A-4.3: Loss of property value |
| A-4.4: Loss of system certification/compliance status |
Table A10.
Hazards definition for VF RC Buildings Balcony system.
Table A10.
Hazards definition for VF RC Buildings Balcony system.
| Hazards | Description |
|---|
| H-1: Structural Integrity Hazards | H-1.1: Balcony load capacity exceeded |
| H-1.2: Uneven load distribution creates structural stress |
| H-1.3: Structural deterioration from water/chemical exposure |
| H-1.4: Plant anchoring system failure |
| H-2: Plant System Hazards | H-2.1: Over-saturated growing medium |
| H-2.2: Nutrient imbalance in delivery system |
| H-2.3: Root system compromises structural elements |
| H-2.4: Plants grow beyond designed size/weight limits |
| H-3: Control System Hazards | H-3.1: Incorrect sensor readings lead to system malfunction |
| H-3.2: Failure of automated irrigation/nutrient delivery |
| H-3.3: Monitoring system failure masks dangerous conditions |
| H-3.4: Control system provides incorrect commands |
| H-4: Environmental Interaction Hazards | H-4.1: High wind conditions affect plant/container stability |
| H-4.2: Extreme weather compromises system integrity |
| H-4.3: Excessive heat/cold damages system components |
| H-4.4: Water accumulation creates unsafe conditions |
Table A11.
Identification of UCSs for VF RC Buildings Balcony system.
Table A11.
Identification of UCSs for VF RC Buildings Balcony system.
| Controller | Control Action | Not Providing Causes Hazard | Providing Causes Hazard | Wrong Timing/Order | Stopped Too Soon/Applied Too Long | Related Hazards |
|---|
| Load Monitoring System | Emergency System Shutdown | System continues operating under dangerous load conditions | Unnecessary shutdown when load is within safe limits | Delayed shutdown after critical load detected | Partial shutdown leaving some systems running | H-1.1, H-1.2, H-4.2 |
| Load Warning Alerts | No warning of dangerous loading conditions | False alarms causing unnecessary evacuations | Delayed warnings after critical conditions | Warning stops before condition resolved | H-1.1, H-1.2, H-3.3 |
| Weight Distribution Control | Uneven load distribution not corrected | Incorrect load redistribution causing stress | Adjustment during peak usage times | Redistribution process incomplete | H-1.2, H-2.4, H-4.1 |
| Maximum Load Limit Enforcement | Overloading condition not prevented | System restricts necessary maintenance access | Limit enforcement during emergency operations | Temporary override remains active too long | H-1.1, H-1.2, H-2.4 |
| Dynamic Load Response | Wind/weather load effects not managed | Excessive movement restrictions applied | Response during stabilization period | Dynamic response ends prematurely | H-1.2, H-4.1, H-4.2 |
| Plant Care System | Irrigation Control | Plants die from lack of water | Oversaturation causing excess weight | Watering during high wind conditions | Continuous watering leading to saturation | H-2.1, H-4.4, H-3.2 |
| Nutrient Delivery | Plant health deterioration | Excess nutrients damaging structure | Delivery during rain events | Extended delivery causing accumulation | H-2.2, H-3.2, H-3.4 |
| Growth Rate Monitoring | Excessive growth not detected | False growth alerts triggering pruning | Delayed growth assessment | Monitoring interruption during growth season | H-2.4, H-2.3, H-3.1 |
| Root System Control | Root invasion not prevented | Excessive root restriction | Root check during critical growth | Partial root management | H-2.3, H-1.3, H-3.3 |
| Environmental Adjustment | Climate stress not mitigated | Excessive environmental modification | Adjustment during plant dormancy | Incomplete climate adaptation | H-4.2, H-4.3, H-3.4 |
| Maintenance Staff | Plant Pruning | Excessive growth exceeding loads | Excessive pruning damaging plants | Pruning during flowering/growth | Incomplete pruning cycle | H-2.4, H-4.1, H-1.1 |
| System Inspection | Component deterioration undetected | Invasive inspection damage | Inspection during peak loads | Partial system check | H-3.3, H-1.3, H-2.3 |
| Equipment Maintenance | System failure from wear | Improper maintenance procedures | Maintenance during critical operations | Incomplete maintenance routine | H-3.2, H-3.4, H-3.1 |
| Safety Check Protocol | Safety hazards unidentified | Disruptive safety procedures | Checks during emergency conditions | Abbreviated safety assessment | H-3.3, H-4.4, H-1.2 |
| Drainage Cleaning | Blockage leading to water damage | Aggressive cleaning damaging pipes | Cleaning during heavy water use | Partial drainage clearance | H-4.4, H-2.1, H-1.3 |
| Structural Monitoring System | Crack Monitoring | Structural damage undetected | False crack detection alerts | Delayed crack assessment | Monitoring gaps during stress | H-1.3, H-3.3, H-1.2 |
| Deflection Assessment | Critical deformation missed | Incorrect deflection readings | Assessment during loading | Incomplete deflection analysis | H-1.1, H-1.2, H-3.3 |
| Strain Measurement | Stress concentration undetected | False strain readings | Measurement during movement | Partial strain assessment | H-1.2, H-3.1, H-3.3 |
| Vibration Monitoring | Dangerous resonance missed | False vibration alerts | Monitoring during stabilization | Interrupted vibration analysis | H-4.1, H-4.2, H-3.1 |
| Material Degradation Check | Corrosion/damage undetected | Invasive material testing | Check during peak stress | Incomplete degradation assessment | H-1.3, H-3.3, H-2.3 |
| Building Management | Maintenance Schedule | System deterioration unchecked | Excessive maintenance disruption | Schedule during peak usage | Incomplete maintenance cycle | H-3.3, H-2.4, H-1.3 |
| Emergency Response | No response to critical conditions | Unnecessary system shutdown | Delayed emergency procedures | Premature procedure termination | H-3.3, H-4.2, H-1.1 |
| Resource Allocation | Critical supplies not provided | Excess resource commitment | Resource delivery timing wrong | Partial resource provision | H-3.2, H-2.2, H-2.1 |
| Inspection Protocol | System problems unidentified | Overly invasive inspections | Inspection during critical ops | Incomplete inspection coverage | H-3.3, H-1.3, H-1.2 |
| Access Control | Unauthorized maintenance allowed | Excessive access restrictions | Access during critical operations | Temporary access left active | H-3.3, H-1.1, H-2. |
Table A12.
Identification of main UCSs Causal Factors and proposal of Safety Requirements for VF RC Buildings Balcony system.
Table A12.
Identification of main UCSs Causal Factors and proposal of Safety Requirements for VF RC Buildings Balcony system.
| System Component | Main Unsafe Control Actions | Primary Causal Factor | Safety Requirement |
|---|
| Load Monitoring System | Not providing shutdown when load exceeds critical threshold | Sensor calibration drift | System must initiate automatic shutdown at 85% of maximum design load |
| No warning issued when dangerous loading condition exists | Communication system failure | Redundant warning systems with independent power supplies must be maintained |
| Uneven load distribution not corrected | Load distribution sensor malfunction | Real-time monitoring system must verify load distribution every 15 min |
| Overloading condition not prevented | Incorrect load calculation algorithm | Automated load monitoring system must prevent addition of new loads when at 90% capacity |
| Wind/weather load effects not managed | Weather sensor system failure | Automatic response system must adjust for wind loads exceeding 30 km/h |
| Plant Care System | Excessive water delivery causing oversaturation | Moisture sensor failure | Moisture content must be maintained between 40–70% with automated cutoff |
| Excess nutrients damaging structure | Nutrient concentration sensor malfunction | Nutrient delivery must stop if concentration exceeds prescribed limits |
| Excessive growth not detected | Monitoring camera system failure | Weekly physical verification of plant size against growth limits |
| Root invasion not prevented | Root barrier system degradation | Monthly inspection of root barrier integrity with documentation |
| Climate stress not mitigated | Temperature sensor failure | Environmental parameters must be maintained within specified ranges |
| Maintenance Staff | Excessive growth exceeding design loads | Lack of maintenance schedule adherence | Mandatory monthly pruning schedule with documentation |
| Critical component deterioration undetected | Inadequate inspection training | Quarterly certified inspection by qualified personnel |
| System failure from lack of maintenance | Poor maintenance documentation | Computerized maintenance management system with alerts |
| Safety hazards unidentified | Incomplete safety checklist | Daily safety checks with electronic verification |
| Blockage leading to water damage | Missed cleaning schedule | Weekly drainage system cleaning with flow verification |
| Structural Monitoring System | Structural damage undetected | Monitoring sensor malfunction | Automated crack detection system with weekly calibration |
| Critical deformation missed | Incorrect baseline measurements | Monthly professional structural assessment with documentation |
| Stress concentration undetected | Strain gauge failure | Redundant strain monitoring system with automatic alerts |
| Dangerous resonance missed | Vibration sensor calibration drift | Daily vibration monitoring with automated threshold alerts |
| Corrosion/damage undetected | Inspection tool malfunction | Quarterly material integrity testing with certification |
| Building Management | System deterioration unchecked | Poor schedule management | Computerized maintenance tracking with mandatory deadlines |
| No response to critical conditions | Emergency protocol confusion | Clear emergency response procedures with annual drills |
| Critical supplies not provided | Inadequate inventory tracking | Automated inventory management system with minimum stock alerts |
| System problems unidentified | Lack of systematic approach | Standardized inspection protocols with electronic checklists |
| Unauthorized maintenance allowed | Access control system failure | Multi-factor authentication for system access with logging |
Table A13.
Risk matrix (see
Figure 3) numbering explanation and risk level calculation examples for VF RC Buildings Balcony system.
Table A13.
Risk matrix (see
Figure 3) numbering explanation and risk level calculation examples for VF RC Buildings Balcony system.
| Level | (Consequences)—Scale 1–5 | (Likelihood)—Scale 1–5 |
|---|
| 1 | Negligible | - -
Sensor calibration drift within acceptable range - -
Minor plant growth issues - -
Temporary irrigation interruption - -
Small moisture sensor misreading - -
Documentation delays
| Very
Unlikely | - -
Rare maintenance oversight - -
Highly unlikely system failure - -
Almost no environmental stress - -
Exceptional preventive measures in place - -
No historical precedent
|
| 2 | Minor | - -
Partial nutrient system malfunction - -
Minor load distribution variance - -
Temporary monitoring system interruption - -
Plant pruning delays - -
Non-critical sensor failure
| Unlikely | - -
Annual maintenance issues - -
Uncommon sensor drift - -
Limited environmental exposure - -
Strong preventive measures - -
Rare occurrence in similar systems
|
| 3 | Moderate | - -
Complete irrigation system failure - -
Multiple sensor system failures - -
Significant plant die-off - -
Moderate structural stress detected - -
Control system malfunction
| Possible | - -
Monthly calibration needs - -
Occasional sensor issues - -
Moderate environmental exposure - -
Standard preventive measures - -
Known to occur in similar systems
|
| 4 | Significant | - -
Major structural deflection - -
Critical monitoring system failure - -
Complete plant system failure - -
Severe water/nutrient leakage - -
Multiple control system failures
| Likely | - -
Weekly maintenance required - -
Regular sensor adjustments - -
Frequent environmental stress - -
Basic preventive measures - -
Common in similar systems
|
| 5 | Severe | - -
Complete structural failure - -
Total system collapse - -
Life-threatening structural damage - -
Complete control system breakdown - -
Catastrophic water damage to building
| Very
Likely | - -
Daily system stress - -
Constant environmental exposure - -
Multiple risk factors present - -
Minimal preventive measures - -
Frequently observed issues measures
|
| Risk Level Calculations (Examples) |
| Low Risk (L) Scenarios | Medium Risk (M) Scenarios | High Risk (H) Scenarios |
| L1 (1,1): Minor sensor calibration drift with rare occurrence | M4 (2,2): Plant care system requiring recalibration | H10 (5,2): Critical structural monitoring system failure |
| L2 (1,2): Temporary irrigation interruption during routine maintenance | M5 (3,1): Single control loop failure with backup systems active | H12 (4,3): Major load distribution anomaly |
Appendix C.2. System Definition for RC Building Living Wall
Overview
Purpose of the Living Wall System
- -
Enhance the building’s aesthetics and energy efficiency.
- -
Provide a “green facade” that offers insulation benefits, improved air quality, and ecological value (habitat for birds, insects, etc.).
- -
Protect the structural envelope from direct weathering (in some cases) while also requiring robust safeguards against moisture intrusion and root damage.
Primary Components
Building Interface and Protection
- -
Reinforced Concrete Façade: The load-bearing wall onto which the living wall system is attached.
- -
Watertight/Root-Resistant Membrane: Applied over the concrete to seal out water and root intrusion.
Structural and Mechanical Support
- -
Bolts/Anchors: Firmly anchored into concrete (sealed at penetrations) to secure membrane integrity.
- -
Stainless Steel Cable/Mesh System: Fastened to the anchors, spaced a small distance apart from the wall. Serves as a supportive trellis for climbers and permits airflow behind foliage.
Organic Elements
- -
Self-Climbing Vegetation: Typically vines or creepers (e.g., ivy, Boston ivy, climbing hydrangea).
- -
These plants can attach naturally via adhesive rootlets or tendrils.
- -
They are guided to primarily adhere to the cable/mesh and minimize direct contact with the membrane.
Irrigation and Nutrient Delivery
- -
Drip Lines or Emitter Tubes: Positioned near the root zone (often in a planter box at the base, or in pockets along the wall) to provide controlled water delivery.
- -
Water Source and Recovery: Can utilize mains water, stored rainwater, or recycled greywater (subject to viability).
- -
Nutrient Injection: Automated fertilization through drip lines.
Sensing and Control
- -
Soil Moisture Sensors: Inset near root level to monitor watering requirements.
- -
Temperature/Environmental Sensors: Monitor ambient temperature, humidity, and sometimes sunlight exposure.
- -
Central Control System (CCS): Takes in sensor feedback, controls irrigation scheduling, and can issue maintenance/alarm messages for out-of-spec behavior.
- -
Irrigation Controller: Subset that executes the CCS directives—e.g., opening/shutting off valves, modulating nutrition dosing.
Maintenance and Oversight
- -
Facility Management: Sets operational specs, organizes inspections, and insures financial and structural integrity.
- -
Maintenance Staff: Undertakes routine operations such as pruning, drip line cleaning, and checking for structural integrity (anchorage, cable, membrane integrity).
- -
Horticultural Experts: Maintains flora integrity—pruning methodologies, disease/pest management, and even distribution of foliage cover.
Around-the-Clock Operation
- -
Adjusts watering, fertilization, and maintenance of plants according to season and weather in the region (temperature, rain, etc.).
- -
Inspects regularly, especially after storms and extreme weather, for any damage and overloads in cables and anchors to make sure no such problem occurs.
Figure A7.
Control Structure for RC Buildings Living Wall: (a) high system approach; (b) Detailed system approach.
Figure A7.
Control Structure for RC Buildings Living Wall: (a) high system approach; (b) Detailed system approach.
Table A14.
Accident (Loses) and Hazard definition for RC Building Living Wall system.
Table A14.
Accident (Loses) and Hazard definition for RC Building Living Wall system.
| Accident Category and ID | Accident (Loss) Description | Hazard ID | Associated Hazards |
|---|
| A.1 Structural Integrity | | | |
| A.1-1 | Building structural damage due to excessive load | H.1.1 | Plant mass exceeds structural design limits |
| A.1-2 | Facade material deterioration | H.1.2 | Root system penetrates waterproofing membrane |
| A.1-3 | Support system failure | H.1.3 | Cable/mesh attachment points fail or deteriorate |
| A.2 Water-Related | | | |
| A.2-1 | Internal water damage to building | H.2.1 | Irrigation system leakage into building envelope |
| A.2-2 | Foundation damage from water accumulation | H.2.2 | Drainage system blockage or failure |
| A.2-3 | Mold/moisture damage to building materials | H.2.3 | Inadequate ventilation between plants and wall |
| A.3 Plant System | | | |
| A.3-1 | Complete plant die-off requiring system replacement | H.3.1 | Critical irrigation system failure |
| A.3-2 | Uncontrolled plant growth damaging building systems | H.3.2 | Plant growth monitoring system failure |
| A.3-3 | Invasive plant spread to unintended areas | H.3.3 | Containment system breach |
| A.4 Human Safety | | | |
| A.4-1 | Injury from falling plant material or debris | H.4.1 | Dead plant material accumulation |
| A.4-2 | Injury during maintenance operations | H.4.2 | Unsafe access for maintenance |
| A.4-3 | Health issues from mold/biological agents | H.4.3 | Harmful biological growth in plant system |
| A.5 Environmental Control | | | |
| A.5-1 | Building energy efficiency loss | H.5.1 | Gap formation between wall and plant coverage |
| A.5-2 | Building envelope thermal damage | H.5.2 | Excessive heat buildup between plants and wall |
| A.5-3 | Local ecosystem disruption | H.5.3 | Introduction of invasive species or pests |
| A.6 Operational | | | |
| A.6-1 | System maintenance cost overrun | H.6.1 | Control system malfunction |
| A.6-2 | Building operation disruption | H.6.2 | Integration failure with building systems |
| A.6-3 | Aesthetic value loss | H.6.3 | Uneven or patchy plant growth |
Table A15.
Identification of UCSs for RC Building Living Wall system.
Table A15.
Identification of UCSs for RC Building Living Wall system.
| Controller | Control Action | Not Providing Causes Hazard | Providing Causes Hazard | Wrong Timing/Order | Stopped Too Soon/Applied Too Long | Related Hazards |
|---|
| Facility Management | Set Maintenance Schedule | No maintenance schedule established | Schedule too infrequent or intensive | Maintenance scheduled during inappropriate weather conditions | Schedule terminated before critical checks completed | H.1.2, H.2.2, H.3.1, H.4.2 |
| | Define Operating Parameters | No system parameters defined | Parameters set outside safe limits | Parameters changed during critical operations | Parameters modified before verification complete | H.2.1, H.3.1, H.5.1, H.6.1 |
| Maintenance Staff | Perform Plant Maintenance | Required pruning not performed | Excessive/improper pruning performed | Maintenance during extreme weather | Incomplete maintenance operation | H.3.2, H.3.3, H.4.1, H.6.3 |
| Check Support Structure | Structure inspection skipped | Incorrect load assessment | Delayed inspection after storm events | Inspection stopped before completion | H.1.1, H.1.3, H.4.1 |
| Maintain Irrigation System | Required cleaning skipped | Improper system modification | Maintenance during peak usage | Partial system maintenance | H.2.1, H.2.2, H.3.1 |
| Horticultural Specialist | Plant Care Actions | Required treatment not provided | Wrong treatment applied | Treatment during stress conditions | Treatment stopped mid-process | H.3.1, H.3.2, H.3.3 |
| Growth Management | Growth limits not enforced | Incorrect growth training | Late intervention in growth pattern | Incomplete growth management | H.1.1, H.3.2, H.6.3 |
| Central Controller | Irrigation Control | No water provided | Excessive water provided | Watering at wrong time | Watering duration incorrect | H.2.1, H.2.2, H.3.1 |
| Environmental Monitoring | No monitoring active | Wrong parameters monitored | Delayed response to conditions | Monitoring interrupted | H.3.1, H.5.1, H.5.2 |
| Irrigation Controller | Water Flow Control | No water flow when needed | Excessive water flow | Wrong timing of water delivery | Water flow duration incorrect | H.2.1, H.2.2, H.3.1 |
| Nutrient Dosing | No nutrients provided | Excessive nutrients provided | Wrong timing of nutrient delivery | Nutrient cycle incomplete | H.3.1, H.3.2, H.6.3 |
Table A16.
Safety Constraint for RC Building Living Wall system.
Table A16.
Safety Constraint for RC Building Living Wall system.
| Hazard | Control Action | Unsafe Control Action | Safety Constraint | Safety Requirements | Verification Method |
|---|
| H.1.1: Plant mass exceeds structural limits | Growth Management | UCA-1: No load monitoring | SC-1: Must prevent excessive loading | SR-1.1: Load monitoring system | - -
Load cell data
|
| UCA-2: Wrong growth control | SR-1.2: Growth limits protocol | - -
Growth measurements
|
| UCA-3: Missed inspections | SR-1.3: Regular inspections | - -
Inspection logs
|
| H.1.2: Root penetration | Root Management | UCA-4: No root barriers | SC-2: Must contain root system | SR-2.1: Root barrier system | - -
Barrier integrity tests
|
| UCA-5: Wrong root pruning | SR-2.2: Root monitoring | - -
Root imaging
|
| UCA-6: Missed checks | SR-2.3: Inspection schedule | - -
Check records
|
| H.2.1: Water leakage | Irrigation Control | UCA-7: Excess water flow | SC-3: Must prevent water infiltration | SR-3.1: Leak detection | - -
Leak sensors
|
| UCA-8: Wrong timing | SR-3.2: Flow control | - -
Flow meters
|
| UCA-9: No monitoring | SR-3.3: Moisture monitoring | - -
Moisture data
|
| H.2.2: Drainage failure | Drainage Management | UCA-10: No cleaning | SC-4: Must maintain drainage | SR-4.1: Flow monitoring | - -
Flow rates
|
| UCA-11: Wrong maintenance | SR-4.2: Cleaning protocol | - -
Maintenance logs
|
| UCA-12: Blocked flow | SR-4.3: Blockage detection | - -
Sensor data
|
| H.3.1: Irrigation system failure | System Control | UCA-13: No water supply | SC-5: Must maintain irrigation | SR-5.1: Backup systems | - -
System status
|
| UCA-14: Wrong settings | SR-5.2: Alert protocols | - -
Alert logs
|
| UCA-15: System shutdown | SR-5.3: Emergency response | - -
Response times
|
| H.3.2: Uncontrolled growth | Growth Control | UCA-16: No pruning | SC-6: Must control growth | SR-6.1: Growth monitoring | - -
Growth data
|
| UCA-17: Wrong technique | SR-6.2: Pruning schedule | - -
Maintenance records
|
| UCA-18: Missed areas | SR-6.3: Coverage checks | - -
Coverage maps
|
| H.4.1: Falling debris | Maintenance | UCA-19: No removal | SC-7: Must prevent debris fall | SR-7.1: Debris monitoring | - -
Inspection reports
|
| UCA-20: Wrong timing | SR-7.2: Removal protocol | - -
Removal logs
|
| UCA-21: Incomplete check | SR-7.3: Safety checks | - -
Safety audits
|
| H.4.2: Unsafe access | Access Control | UCA-22: No safety gear | SC-8: Must ensure safe access | SR-8.1: Safety protocols | - -
Safety records
|
| UCA-23: Wrong procedure | SR-8.2: Access systems | - -
Training logs
|
| UCA-24: Missed checks | SR-8.3: Safety training | - -
Audit reports
|
| H.5.1: Energy efficiency loss | Coverage Control | UCA-25: Coverage gaps | SC-9: Must maintain coverage | SR-9.1: Coverage monitoring | - -
Coverage data
|
| UCA-26: Wrong density | SR-9.2: Density control | - -
Thermal imaging
|
| UCA-27: No monitoring | SR-9.3: Gap prevention | - -
Efficiency tests
|
| H.6.1: Control system failure | System Management | UCA-28: No monitoring | SC-10: Must maintain control | SR-10.1: System redundancy | - -
System logs
|
| UCA-29: Wrong settings | SR-10.2: Fault detection | - -
Error reports
|
| UCA-30: System conflicts | SR-10.3: Backup protocols | - -
Backup tests
|
Table A17.
Risk matrix (see
Figure 3) numbering explanation and risk level calculation examples for RC Building Living Wall system.
Table A17.
Risk matrix (see
Figure 3) numbering explanation and risk level calculation examples for RC Building Living Wall system.
| Level | (Consequences)—Scale 1–5 | (Likelihood)—Scale 1–5 |
|---|
| 1 | Negligible | - -
Temporary sensor drift within range - -
Minor plant health issues - -
Short irrigation interruptions - -
Small drainage blockages - -
Documentation delays
| Very
Unlikely | - -
Rare maintenance issues - -
Highly unlikely failures - -
Minimal environmental stress - -
Strong preventive measures - -
No historical precedent
|
| 2 | Minor | - -
Localized root barrier stress - -
Partial drainage system blockage - -
Minor load distribution issues - -
Limited plant growth problems - -
Non-critical control issues
| Unlikely | - -
Annual maintenance needs - -
Uncommon sensor issues - -
Limited environmental exposure - -
Regular inspections - -
Rare in similar systems
|
| 3 | Moderate | - -
Complete irrigation failure - -
Multiple sensor failures - -
Significant plant die-off - -
Moderate structural stress - -
Water management issues
| Possible | - -
Monthly maintenance needs - -
Regular sensor calibration - -
Moderate environmental exposure - -
Standard maintenance - -
Known in similar systems
|
| 4 | Significant | - -
Major structural loading issues - -
Critical monitoring failure - -
Extensive water damage - -
Severe root penetration - -
Multiple system failures
| Likely | - -
Weekly maintenance needs - -
Frequent adjustments - -
High environmental stress - -
Basic preventive measures - -
Common in similar systems
|
| 5 | Severe | - -
Complete structural failure - -
Total system collapse - -
Severe building damage - -
Complete control failure - -
Critical water infiltration
| Very
Likely | - -
Daily system stress - -
Constant exposure - -
Multiple risk factors - -
Minimal prevention - -
Frequently observed
|
| Risk Level Calculations (Examples) |
| Low Risk (L) Scenarios | Medium Risk (M) Scenarios | High Risk (H) Scenarios |
| L2 (2,1): Temporary irrigation interruption during maintenance | M6 (2,3): Nutrient delivery system temporary malfunction | H15 (5,3): Complete plant support system failure |
| L3 (3,1): Single non-critical sensor failure with backup | M8 (4,1): Non-critical monitoring system interruption | H16 (4,4): Severe structural stress detection |
| | H12: Major water infiltration (4,3) |
| | H10 (5,2): Critical structural monitoring system failure |
References
- European Commission: Joint Research Centre; Palermo, V.; Maio, R.; Sousa, M.; Tsionis, G. Framework for Resilience Analysis of EU Buildings; Publications Office of the European Union: Luxembourg, 2017. [Google Scholar]
- European Commission: Joint Research Centre; Pohoryles, D.; Bournas, D. IRESIST+, Innovative Seismic and Energy Retrofitting of the Existing Building Stock—Numerical Simulations and Impact Assessment; Publications Office of the European Union: Luxembourg, 2021. [Google Scholar]
- Kassem, M.M.; Beddu, S.; Ooi, J.H.; Tan, C.G.; Mohamad El-Maissi, A.; Mohamed Nazri, F. Assessment of Seismic Building Vulnerability Using Rapid Visual Screening Method through Web-Based Application for Malaysia. Buildings 2021, 11, 485. [Google Scholar] [CrossRef]
- Del Vecchio, C.; Ludovico, M.D.; Prota, A. Repair Costs of Reinforced Concrete Building Components: From Actual Data Analysis to Calibrated Consequence Functions. Earthq. Spectra 2020, 36, 353–377. [Google Scholar] [CrossRef]
- Chamasemani, N.F.; Kelishadi, M.; Mostafaei, H.; Najvani, M.A.D.; Mashayekhi, M. Environmental Impacts of Reinforced Concrete Buildings: Comparing Common and Sustainable Materials: A Case Study. Constr. Mater. 2023, 4, 1–15. [Google Scholar] [CrossRef]
- Kim, H.; Marcouiller, D.W.; Choi, Y. Urban Redevelopment with Justice Implications: The Role of Social Justice and Social Capital in Residential Relocation Decisions. Urban Aff. Rev. 2019, 55, 288–320. [Google Scholar] [CrossRef]
- Formisano, A.; Vaiano, G. Combined Energy-Seismic Retrofit of Existing Historical Masonry Buildings: The Novel “DUO System” Coating System Applied to a Case Study. Heritage 2021, 4, 4629–4646. [Google Scholar] [CrossRef]
- Gkournelos, P.D.; Bournas, D.A.; Triantafillou, T.C. Combined Seismic and Energy Upgrading of Existing Reinforced Concrete Buildings Using TRM Jacketing and Thermal Insulation. Earthq. Structures 2019, 16, 625–639. [Google Scholar] [CrossRef]
- Clemett, N.; Carofilis Gallo, W.W.; Gabbianelli, G.; O’Reilly, G.J.; Monteiro, R. Optimal Combined Seismic and Energy Efficiency Retrofitting for Existing Buildings in Italy. J. Struct. Eng. 2023, 149, 04022207. [Google Scholar] [CrossRef]
- Pertile, V.; Stella, A.; De Stefani, L.; Scotta, R. Seismic and Energy Integrated Retrofitting of Existing Buildings with an Innovative ICF-Based System: Design Principles and Case Studies. Sustainability 2021, 13, 9363. [Google Scholar] [CrossRef]
- Saracco, U.; Meglio, E.; Formisano, A. Seismic-Energy Combined Retrofit Systems of Historical Buildings: The Use of Light Metal Exoskeletons. Tech. Ann. 2023, 1, 1–25. [Google Scholar] [CrossRef]
- Manos, G.; Melidis, L.; Katakalos, K.; Kotoulas, L.; Anastasiadis, A.; Chatziastrou, C. Out-of-Plane Flexure of Masonry Panels with External Thermal Insulation. Buildings 2021, 11, 335. [Google Scholar] [CrossRef]
- Irga, P.J.; Torpy, F.R.; Griffin, D.; Wilkinson, S.J. Vertical Greening Systems: A Perspective on Existing Technologies and New Design Recommendation. Sustainability 2023, 15, 6014. [Google Scholar] [CrossRef]
- Manouchehri, M.; Santiago López, J.; Valiente López, M. Sustainable Design of Vertical Greenery Systems: A Comprehensive Framework. Sustainability 2024, 16, 3249. [Google Scholar] [CrossRef]
- Wang, P.; Wong, Y.H.; Tan, C.Y.; Li, S.; Chong, W.T. Vertical Greening Systems: Technological Benefits, Progresses and Prospects. Sustainability 2022, 14, 12997. [Google Scholar] [CrossRef]
- Wang, X.; Gard, W.; Borska, H.; Ursem, B.; Van De Kuilen, J.W.G. Vertical Greenery Systems: From Plants to Trees with Self-Growing Interconnections. Eur. J. Wood Prod. 2020, 78, 1031–1043. [Google Scholar] [CrossRef]
- Antoniadou, P.; Chantzis, G.; Theodoridou, I.; Christodoulou, A.; Symeonidou, M.; Kyriaki, E.; Giama, E.; Chadiarakou, S.; Boemi, S.-N.; Kontos, M.; et al. Innovative Construction Typologies for Ventilated Façades in the Mediterranean Region. In Proceedings of the 2023 8th International Conference on Smart and Sustainable Technologies (SpliTech), Split/Bol, Croatia, 20–23 June 2023; pp. 1–6. [Google Scholar]
- Pérez-Fenoy, J.; Rivera-Gómez, C.; Roa-Fernández, J.; Galán-Marín, C. Full-Scale Assessment of Seismic and Wind Load Performance in the Design of a Flexible Solar-Shading Double-Skin Façade. Buildings 2023, 13, 2945. [Google Scholar] [CrossRef]
- Guo, X.; Chen, X.; Yu, Y.; Wei, S.; Chen, W. A Simplified Modeling Method for Studying the Thermal Performance of Buildings with Vertical Greening Systems. J. Clean. Prod. 2024, 467, 142940. [Google Scholar] [CrossRef]
- Zhang, J.; Huang, M.; Wan, N.; Deng, Z.; He, Z.; Luo, J. Missing Measurement Data Recovery Methods in Structural Health Monitoring: The State, Challenges and Case Study. Measurement 2024, 231, 114528. [Google Scholar] [CrossRef]
- Huang, M.; Wan, N.; Zhu, H. Reconstruction of Structural Acceleration Response Based on CNN-BiGRU with Squeeze-and-Excitation under Environmental Temperature Effects. J. Civ. Struct. Health Monit. 2024, 1–19. [Google Scholar] [CrossRef]
- Huang, M.; Zhang, J.; Li, J.; Deng, Z.; Luo, J. Damage Identification of Steel Bridge Based on Data Augmentation and Adaptive Optimization Neural Network. Struct. Health Monit. 2024. [Google Scholar] [CrossRef]
- Huang, M.; Zhang, J.; Hu, J.; Ye, Z.; Deng, Z.; Wan, N. Nonlinear Modeling of Temperature-Induced Bearing Displacement of Long-Span Single-Pier Rigid Frame Bridge Based on DCNN-LSTM. Case Stud. Therm. Eng. 2024, 53, 103897. [Google Scholar] [CrossRef]
- EC8 Eurocode 8: Design of Structures for Earthquake Resistance. Part 2005, 1, 1998-1.
- Pekelnicky, R.; Engineers, S.; Chris Poland, S.; Engineers, N. ASCE 41-13: Seismic Evaluation and Retrofit Rehabilitation of Existing Buildings. Proc. SEAOC 2012, 1–12. [Google Scholar]
- Providakis, C.P.; Mousteraki, M.G.; Providaki, G.C. Operational Modal Analysis of Historical Buildings and Finite Element Model Updating Using α Laser Scanning Vibrometer. Infrastructures 2023, 8, 37. [Google Scholar] [CrossRef]
- Ibarra, L.F.; Krawinkler, H. Global Collapse of Frame Structures under Seismic Excitations; Pacific Earthquake Engineering Research Center: Berkeley, CA, USA, 2005. [Google Scholar]
- Mackie, K.; Stojadinović, B. Seismic Demands for Performance-Based Design of Bridges; Pacific Earthquake Engineering Research Center: Berkeley, CA, USA, 2003. [Google Scholar]
- Jalayer, F.; Cornell, C.A. A Technical Framework for Probability-Based Demand and Capacity Factor Design (DCFD) Seismic Formats; Pacific Earthquake Engineering Research Center: Berkeley, CA, USA, 2003. [Google Scholar]
- Huang, M.-S.; Gül, M.; Zhu, H.-P. Vibration-Based Structural Damage Identification under Varying Temperature Effects. J. Aerosp. Eng. 2018, 31, 04018014. [Google Scholar] [CrossRef]
- Ulucan, M.; Yildirim, G.; Alatas, B.; Alyamac, K.E. A New Intelligent Sunflower Optimization Based Explainable Artificial Intelligence Approach for Early-age Concrete Compressive Strength Classification and Mixture Design of RAC. Struct. Concr. 2023, 24, 7400–7418. [Google Scholar] [CrossRef]
- Annicchiarico, W.D.; Cerrolaza, M. Improved Dynamical Particle Swarm Optimization Method for Structural Dynamics. Math. Probl. Eng. 2019, 2019, 8250185. [Google Scholar] [CrossRef]
- Tzan, S.-R.; Pantelides, C.P. Annealing Strategy for Optimal Structural Design. J. Struct. Eng. 1996, 122, 815–827. [Google Scholar] [CrossRef]
- Ghannadi, P.; Kourehli, S.S.; Mirjalili, S. A Review of the Application of the Simulated Annealing Algorithm in Structural Health Monitoring (1995–2021). Fract. Struct. Integr. 2023, 17, 51–76. [Google Scholar] [CrossRef]
- Yoon, G.H. Topology Optimization for Stationary Fluid–Structure Interaction Problems Using a New Monolithic Formulation. Numer. Meth Eng. 2010, 82, 591–616. [Google Scholar] [CrossRef]
- Picelli, R.; Vicente, W.M.; Pavanello, R. Evolutionary Topology Optimization for Structural Compliance Minimization Considering Design-Dependent FSI Loads. Finite Elem. Anal. Des. 2017, 135, 44–55. [Google Scholar] [CrossRef]
- Hoehler, M.S.; Eligehausen, R. Behavior and Testing of Anchors in Simulated Seismic Cracks. ACI Struct. J. 2008, 105, 348. [Google Scholar]
- Glisic, B.; Inaudi, D. Development of Method for In-Service Crack Detection Based on Distributed Fiber Optic Sensors. Struct. Health Monit. 2012, 11, 161–171. [Google Scholar] [CrossRef]
- Mpalaskas, A.C.; Aggelis, D.G.; Matikas, T.E. Monitoring the Fracture Behavior of Epoxy Resin Repaired Fiber Reinforced Concrete Specimens by Acoustic Emission. In Proceedings of the Sensors and Smart Structures Technologies for Civil, Mechanical, and Aerospace Systems 2021; Zonta, D., Huang, H., Su, Z., Eds.; SPIE: San Diego, CA, USA, 2021; p. 78. [Google Scholar]
- Mpalaskas, A.C.; Matikas, T.E.; Aggelis, D.G.; Alver, N. Acoustic Emission for Evaluating the Reinforcement Effectiveness in Steel Fiber Reinforced Concrete. Appl. Sci. 2021, 11, 3850. [Google Scholar] [CrossRef]
- Naoum, M.C.; Papadopoulos, N.A.; Sapidis, G.M.; Voutetaki, M.E. Efficacy of PZT Sensors Network Different Configurations in Damage Detection of Fiber-Reinforced Concrete Prisms under Repeated Loading. Sensors 2024, 24, 5660. [Google Scholar] [CrossRef]
- Thomoglou, A.K.; Falara, M.G.; Gkountakou, F.I.; Elenas, A.; Chalioris, C.E. Smart Cementitious Sensors with Nano-, Micro-, and Hybrid-Modified Reinforcement: Mechanical and Electrical Properties. Sensors 2023, 23, 2405. [Google Scholar] [CrossRef]
- Voutetaki, M.E.; Providakis, C.P.; Chalioris, C.E. FRP Debonding Prevention of Strengthened Concrete Members under Dynamic Load Using Smart Piezoelectric Materials (PZT). In Proceedings of the 15th European Conference on Composite Materials (ECCM15); Venice, Italy, 24–28 June 2012, p. 2170.
- Sun, X.; Xin, Y.; Wang, Z.; Yuan, M.; Chen, H. Damage Detection of Steel Truss Bridges Based on Gaussian Bayesian Networks. Buildings 2022, 12, 1463. [Google Scholar] [CrossRef]
- Karayannis, C.; Golias, E. An Innovative Technique for the Strengthening of RC Columns and Their Connections with Beams Using C-FRP ROPES. Appl. Sci. 2024, 14, 8395. [Google Scholar] [CrossRef]
- Karayannis, C.; Golias, E.; Kalogeropoulos, G.I. Influence of Carbon Fiber-Reinforced Ropes Applied as External Diagonal Reinforcement on the Shear Deformation of RC Joints. Fibers 2022, 10, 28. [Google Scholar] [CrossRef]
- Moretti, M.L. Effect of GFRP and CFPR Hybrid Confinement on the Compressive Performance of Concrete. Fibers 2025, 13, 12. [Google Scholar] [CrossRef]
- Koutsoupakis, I.; Tsompanakis, Y.; Soupios, P.; Kirmizakis, P.; Kaka, S.; Providakis, C. Seismic Risk Assessment of Chania, Greece, Using an Integrated Computational Approach. Appl. Sci. 2021, 11, 11249. [Google Scholar] [CrossRef]
- Hu, D.-Z.; Zhang, X.-X.; Li, G.-Q.; Sun, F.-F.; Jin, H.-J. Application of Energy Dissipation Technology in High-Rise Buildings. Int. J. High Rise Build. 2021, 10, 137–147. [Google Scholar] [CrossRef]
- Duan, J.; Yang, D.; Liu, X.; Xiang, P. Seismic Energy Dissipation and Hysteresis Performances of Distinctly Shaped Steel-Reinforced Concrete Column–Beam Joints under Cyclic Loading. Buildings 2024, 14, 2777. [Google Scholar] [CrossRef]
- Liu, Q.; Wang, Y.; Sun, P.; Wang, D. Comparative Analysis of Viscous Damping Model and Hysteretic Damping Model. Appl. Sci. 2022, 12, 12107. [Google Scholar] [CrossRef]
- Hesam, P.; Irfanoglu, A.; Hacker, T.J. A Method to Estimate Effective Viscous Damping Ratio and Restoring Force From the Dynamic Response Data of Structures. Front. Built Environ. 2019, 5, 19. [Google Scholar] [CrossRef]
- Titirla, M.D. A State-of-the-Art Review of Passive Energy Dissipation Systems in Steel Braces. Buildings 2023, 13, 851. [Google Scholar] [CrossRef]
- Maneetes, H.; Memari, A.M. Finite Element Modeling of Reinforced Concrete Cladding Panels H. EJSE 2009, 9, 62–72. [Google Scholar] [CrossRef]
- Huang, B.; Lu, W.; Mosalam, K.M. Shaking Table Testing of Granite Cladding with Undercut Bolt Anchorage. Eng. Struct. 2018, 171, 488–499. [Google Scholar] [CrossRef]
- Hunt, J.P.; Stojadinovic, B. Seismic Performance Assessment and Probabilistic Repair Cost Analysis of Precast Concrete Cladding Systems for Multistory Buildings; Pacific Earthquake Engineering Research Center: Berkeley, CA, USA, 2010. [Google Scholar]
- D’Amore, S.; Bianchi, S.; Ciurlanti, J.; Pampanin, S. Seismic Assessment and Finite Element Modeling of Traditional vs Innovative Point Fixed Glass Facade Systems (PFGFS). Bull. Earthq. Eng. 2023, 21, 2657–2689. [Google Scholar] [CrossRef]
- Xiao, Y.; Yue, F.; Wang, X.; Zhang, X. Reliability-Based Design Optimization of Structures Considering Uncertainties of Earthquakes Based on Efficient Gaussian Process Regression Metamodeling. Axioms 2022, 11, 81. [Google Scholar] [CrossRef]
- Monjardin-Quevedo, J.G.; Valenzuela-Beltran, F.; Reyes-Salazar, A.; Leal-Graciano, J.M.; Torres-Carrillo, X.G.; Gaxiola-Camacho, J.R. Probabilistic Assessment of Buildings Subjected to Multi-Level Earthquake Loading Based on the PBSD Concept. Buildings 2022, 12, 1942. [Google Scholar] [CrossRef]
- Navaneetha, D.; Maringanti, T.; Repaka, S.; Basalingwar, V.; Vasavi, Y.; Manasa, N.V. Analysis of Automatic Health Monitoring in Agricultural Crops Using Artificial Intelligence Methods. In Proceedings of the 2024 International Conference on Data Science and Network Security (ICDSNS), Tiptur, India, 26–27 July 2024; IEEE:; pp. 1–4. [Google Scholar]
- Islam, S.; Reza, M.N.; Samsuzzaman; Ahmed, S.; Cho, Y.J.; Noh, D.H.; Chung, S.-O.; Hong, S.J. Machine Vision and Artificial Intelligence for Plant Growth Stress Detection and Monitoring: A Review. Precis. Agric. Sci. Technol. 2024, 6, 33–57. [Google Scholar] [CrossRef]
- Rojanarungruengporn, K.; Pumrin, S. Early Stress Detection in Plant Phenotyping Using CNN and LSTM Architecture. In Proceedings of the 2021 9th International Electrical Engineering Congress (iEECON), Pattaya, Thailand, 10–12 March 2021; pp. 389–392. [Google Scholar]
- Tran, T.-T.; Choi, J.-W.; Le, T.-T.; Kim, J.-W. A Comparative Study of Deep CNN in Forecasting and Classifying the Macronutrient Deficiencies on Development of Tomato Plant. Appl. Sci. 2019, 9, 1601. [Google Scholar] [CrossRef]
- Taha, M.F.; Abdalla, A.; ElMasry, G.; Gouda, M.; Zhou, L.; Zhao, N.; Liang, N.; Niu, Z.; Hassanein, A.; Al-Rejaie, S.; et al. Using Deep Convolutional Neural Network for Image-Based Diagnosis of Nutrient Deficiencies in Plants Grown in Aquaponics. Chemosensors 2022, 10, 45. [Google Scholar] [CrossRef]
- Moshou, D.; Pantazi, X.-E.; Kateris, D.; Gravalos, I. Water Stress Detection Based on Optical Multisensor Fusion with a Least Squares Support Vector Machine Classifier. Biosyst. Eng. 2014, 117, 15–22. [Google Scholar] [CrossRef]
- Kumar, P.; Eriksen, R.L.; Simko, I.; Mou, B. Molecular Mapping of Water-Stress Responsive Genomic Loci in Lettuce (Lactuca spp.) Using Kinetics Chlorophyll Fluorescence, Hyperspectral Imaging and Machine Learning. Front. Genet. 2021, 12, 634554. [Google Scholar] [CrossRef]
- Concepcion Ii, R.; Lauguico, S.; Almero, V.J.; Dadios, E.; Bandala, A.; Sybingco, E. Lettuce Leaf Water Stress Estimation Based on Thermo-Visible Signatures Using Recurrent Neural Network Optimized by Evolutionary Strategy. In Proceedings of the 2020 IEEE 8th R10 Humanitarian Technology Conference (R10-HTC), Kuching, Malaysia, 1–3 December 2020; pp. 1–6. [Google Scholar]
- Sharma, M.; Kumar, C.J.; Deka, A. Early Diagnosis of Rice Plant Disease Using Machine Learning Techniques. Arch. Phytopathol. Plant Prot. 2022, 55, 259–283. [Google Scholar] [CrossRef]
- Liu, Z.; Bashir, R.N.; Iqbal, S.; Shahid, M.M.A.; Tausif, M.; Umer, Q. Internet of Things (IoT) and Machine Learning Model of Plant Disease Prediction–Blister Blight for Tea Plant. IEEE Access 2022, 10, 44934–44944. [Google Scholar] [CrossRef]
- Taghavi Namin, S.; Esmaeilzadeh, M.; Najafi, M.; Brown, T.B.; Borevitz, J.O. Deep Phenotyping: Deep Learning for Temporal Phenotype/Genotype Classification. Plant Methods 2018, 14, 66. [Google Scholar] [CrossRef]
- Ferentinos, K.P. Deep Learning Models for Plant Disease Detection and Diagnosis. Comput. Electron. Agric. 2018, 145, 311–318. [Google Scholar] [CrossRef]
- Rumpf, T.; Mahlein, A.-K.; Steiner, U.; Oerke, E.-C.; Dehne, H.-W.; Plümer, L. Early Detection and Classification of Plant Diseases with Support Vector Machines Based on Hyperspectral Reflectance. Comput. Electron. Agric. 2010, 74, 91–99. [Google Scholar] [CrossRef]
- Ahmed, F.; Al-Mamun, H.A.; Bari, A.S.M.H.; Hossain, E.; Kwan, P. Classification of Crops and Weeds from Digital Images: A Support Vector Machine Approach. Crop Prot. 2012, 40, 98–104. [Google Scholar] [CrossRef]
- Gou, Z.; Prasad, D.; Siu-Yu Lau, S. Are Green Buildings More Satisfactory and Comfortable? Habitat Int. 2013, 39, 156–161. [Google Scholar] [CrossRef]
- Hajesmaeel-Gohari, S.; Khordastan, F.; Fatehi, F.; Samzadeh, H.; Bahaadinbeigy, K. The Most Used Questionnaires for Evaluating Satisfaction, Usability, Acceptance, and Quality Outcomes of Mobile Health. BMC Med. Inf. Decis Mak 2022, 22, 22. [Google Scholar] [CrossRef]
- Brown, T.A. Confirmatory Factor Analysis for Applied Research; Guilford Publications: New York, NY, USA, 2015. [Google Scholar]
- Tavakol, M.; Dennick, R. Making Sense of Cronbach’s Alpha. Int. J. Med. Educ. 2011, 2, 53–55. [Google Scholar] [CrossRef] [PubMed]
- Koo, T.K.; Li, M.Y. A Guideline of Selecting and Reporting Intraclass Correlation Coefficients for Reliability Research. J. Chiropr. Med. 2016, 15, 155–163. [Google Scholar] [CrossRef] [PubMed]
- Hair, J.F.; Hult, G.T.M.; Ringle, C.M.; Sarstedt, M.; Danks, N.P.; Ray, S. An Introduction to Structural Equation Modeling. In Partial Least Squares Structural Equation Modeling (PLS-SEM) Using R: A Workbook; Classroom Companion: Business; Springer International Publishing: Cham, Switzerland, 2021; pp. 1–29. ISBN 978-3-030-80518-0. [Google Scholar]
- Woltman, H.; Feldstain, A.; MacKay, J.C.; Rocchi, M. An Introduction to Hierarchical Linear Modeling. Tutor. Quant. Methods Psychol. 2012, 8, 52–69. [Google Scholar] [CrossRef]
- LeCun, Y.; Bengio, Y.; Hinton, G. Deep Learning. Nature 2015, 521, 436–444. [Google Scholar] [CrossRef]
- Mishra, M. Confirmatory Factor Analysis (CFA) as an Analytical Technique to Assess Measurement Error in Survey Research: A Review. Paradig. A Manag. Res. J. 2016, 20, 97–112. [Google Scholar] [CrossRef]
- Agbo, A.A. Cronbach’s Alpha: Review of Limitations and Associated Recommendations. J. Psychol. Afr. 2010, 20, 233–239. [Google Scholar] [CrossRef]
- Guttman, L. A Basis for Analyzing Test-Retest Reliability. Psychometrika 1945, 10, 255–282. [Google Scholar] [CrossRef]
- Clarke, V.; Braun, V. Thematic Analysis. J. Posit. Psychol. 2017, 12, 297–298. [Google Scholar] [CrossRef]
- Joffe, H. Thematic Analysis. In Qualitative Research Methods in Mental Health and Psychotherapy: A Guide for Students and Practitioners; Wiley: New York, NY, USA, 2011; pp. 209–223. [Google Scholar]
- Friedman, H.H.; Amoo, T. Rating the Rating Scales. J. Mark. Manag. Winter 1999, 114–123. [Google Scholar]
- Linacre, J.M. Others Optimizing Rating Scale Category Effectiveness. J. Appl. Meas. 2002, 3, 85–106. [Google Scholar]
- MacCallum, R.C.; Zhang, S.; Preacher, K.J.; Rucker, D.D. On the Practice of Dichotomization of Quantitative Variables. Psychol. Methods 2002, 7, 19. [Google Scholar] [CrossRef]
- Fedorov, V.; Mannino, F.; Zhang, R. Consequences of Dichotomization. Pharm. Stat. 2009, 8, 50–61. [Google Scholar] [CrossRef]
- Fan, Y.; Chen, J.; Shirkey, G.; John, R.; Wu, S.R.; Park, H.; Shao, C. Applications of Structural Equation Modeling (SEM) in Ecological Studies: An Updated Review. Ecol. Process 2016, 5, 19. [Google Scholar] [CrossRef]
- Marcoulides, G.A. (Ed.) Modern Methods for Business Research; Quantitative methodology series; Lawrence Erlbaum: Mahwah, NJ, USA, 1998; ISBN 978-1-4106-0438-5. [Google Scholar]
- Albandar, J.M.; Goldstein, H. Multi-Level Statistical Models in Studies of Periodontal Diseases. J. Periodontol. 1992, 63, 690–695. [Google Scholar] [CrossRef]
- Kotsiantis, S.B. Decision Trees: A Recent Overview. Artif. Intell. Rev. 2013, 39, 261–283. [Google Scholar] [CrossRef]
- De Ville, B. Decision Trees. WIREs Comput. Stats 2013, 5, 448–455. [Google Scholar] [CrossRef]
- Rokach, L.; Maimon, O. Decision Trees. In Data Mining and Knowledge Discovery Handbook; Maimon, O., Rokach, L., Eds.; Springer: New York, NY, USA, 2005; pp. 165–192. ISBN 978-0-387-24435-8. [Google Scholar]
- Baker, J.W.; Cornell, C.A. Vector-Valued Ground Motion Intensity Measures for Probabilistic Seismic Demand Analysis; Pacific Earthquake Engineering Research Center: Berkeley, CA, USA, 2006. [Google Scholar]
- Vargas-Alzate, Y.F.; Hurtado, J.E.; Pujades, L.G. New Insights into the Relationship between Seismic Intensity Measures and Nonlinear Structural Response. Bull. Earthq. Eng. 2022, 20, 2329–2365. [Google Scholar] [CrossRef]
- Kavvadias, I.E.; Papachatzakis, G.A.; Bantilas, K.E.; Vasiliadis, L.K.; Elenas, A. Rocking Spectrum Intensity Measures for Seismic Assessment of Rocking Rigid Blocks. Soil Dyn. Earthq. Eng. 2017, 101, 116–124. [Google Scholar] [CrossRef]
- Lazaridis, P.C.; Kavvadias, I.E.; Demertzis, K.; Iliadis, L.; Vasiliadis, L.K. Structural Damage Prediction of a Reinforced Concrete Frame under Single and Multiple Seismic Events Using Machine Learning Algorithms. Appl. Sci. 2022, 12, 3845. [Google Scholar] [CrossRef]
- Cantagallo, C.; De Risi, R.; Terrenzi, M.; Camata, G.; Spacone, E. Sufficiency Assessment of Intensity Measures for Natural and Spectral-Matched Ground Motion Records. Bull. Earthq. Eng. 2024, 22, 6305–6326. [Google Scholar] [CrossRef]
- Wang, T.; Shang, Q.; Li, J. Seismic Force Demands on Acceleration-Sensitive Nonstructural Components: A State-of-the-Art Review. Earthq. Eng. Eng. Vib. 2021, 20, 39–62. [Google Scholar] [CrossRef]
- Bergamo, P.; Fäh, D.; Panzera, F.; Cauzzi, C.; Glueer, F.; Perron, V.; Wiemer, S. A Site Amplification Model for Switzerland Based on Site-Condition Indicators and Incorporating Local Response as Measured at Seismic Stations. Bull. Earthq. Eng. 2023, 21, 5831–5865. [Google Scholar] [CrossRef]
- Edwards, B.; Michel, C.; Poggi, V.; Fah, D. Determination of Site Amplification from Regional Seismicity: Application to the Swiss National Seismic Networks. Seismol. Res. Lett. 2013, 84, 611–621. [Google Scholar] [CrossRef]
- Böse, M.; Danciu, L.; Papadopoulos, A.; Clinton, J.; Cauzzi, C.; Dallo, I.; Mizrahi, L.; Diehl, T.; Bergamo, P.; Reuland, Y.; et al. Towards a Dynamic Earthquake Risk Framework for Switzerland. Nat. Hazards Earth Syst. Sci. 2024, 24, 583–607. [Google Scholar] [CrossRef]
- Wald, D.J.; Quitoriano, V.; Worden, C.B.; Hopper, M.; Dewey, J.W. USGS “Did You Feel It?” Internet-Based Macroseismic Intensity Maps. Ann. Geophys. 2011, 54, 6. [Google Scholar] [CrossRef]
- Zhu, H.; Sun, Y.; Zhao, W.; Zhuang, F.; Wang, B.; Xiong, H. Rapid Learning of Earthquake Felt Area and Intensity Distribution with Real-Time Search Engine Queries. Sci. Rep. 2020, 10, 5437. [Google Scholar] [CrossRef]
- Liu, R.; Zhu, W.; Yang, X. Screening Image Features of Collapsed Buildings for Operational and Rapid Remote Sensing Identification. Remote Sens. 2023, 15, 5747. [Google Scholar] [CrossRef]
- Ma, H.; Liu, Y.; Ren, Y.; Yu, J. Detection of Collapsed Buildings in Post-Earthquake Remote Sensing Images Based on the Improved YOLOv3. Remote Sens. 2019, 12, 44. [Google Scholar] [CrossRef]
- Qi, Y.; Ding, Z.; Luo, Y.; Ma, Z. A Three-Step Computer Vision-Based Framework for Concrete Crack Detection and Dimensions Identification. Buildings 2024, 14, 2360. [Google Scholar] [CrossRef]
- Wächter, M.; Heißelmann, H.; Hölling, M.; Morales, A.; Milan, P.; Mücke, T.; Peinke, J.; Reinke, N.; Rinn, P. The Turbulent Nature of the Atmospheric Boundary Layer and Its Impact on the Wind Energy Conversion Process. J. Turbul. 2012, 13, N26. [Google Scholar] [CrossRef]
- Kareem, A. Emerging Frontiers in Wind Engineering: Computing, Stochastics, Machine Learning and Beyond. J. Wind Eng. Ind. Aerodyn. 2020, 206, 104320. [Google Scholar] [CrossRef]
- Qin, H.; Hong, B.; Jiang, R.; Yan, S.; Zhou, Y. The Effect of Vegetation Enhancement on Particulate Pollution Reduction: CFD Simulations in an Urban Park. Forests 2019, 10, 373. [Google Scholar] [CrossRef]
- Ma, J.; Siddhpura, M.; Haddad, A.; Evangelista, A.; Siddhpura, A. A Multi-Criteria Decision-Making Approach for Assessing the Sustainability of an Innovative Pin-Connected Structural System. Buildings 2024, 14, 2221. [Google Scholar] [CrossRef]
- Villalba, P.; Sánchez-Garrido, A.J.; Yepes, V. A Review of Multi-Criteria Decision-Making Methods for Building Assessment, Selection, and Retrofit. J. Civ. Eng. Manag. 2024, 30, 465–480. [Google Scholar] [CrossRef]
- Hu, X.; Zhang, H.; Yu, H. Numerical Simulation Study on the Hygrothermal Performance of Building Exterior Walls under Dynamic Wind-Driven Rain Condition. Build. Simul. 2024, 17, 207–221. [Google Scholar] [CrossRef]
- GhoshDastider, J.; Pal, D.; Mishra, P.K. Evidence of Kolmogorov like Scalings and Multifractality in the Rainfall Events. arXiv 2024, arXiv:2405.03463. [Google Scholar]
- Cristiano, E.; Ten Veldhuis, M.-C.; Van De Giesen, N. Spatial and Temporal Variability of Rainfall and Their Effects on Hydrological Response in Urban Areas—A Review. Hydrol. Earth Syst. Sci. 2017, 21, 3859–3878. [Google Scholar] [CrossRef]
- Monjo, R. Measure of Rainfall Time Structure Using the Dimensionless N-Index. Clim. Res. 2016, 67, 71–86. [Google Scholar] [CrossRef]
- Pohoryles, D.A.; Bournas, D.A.; Da Porto, F.; Caprino, A.; Santarsiero, G.; Triantafillou, T. Integrated Seismic and Energy Retrofitting of Existing Buildings: A State-of-the-Art Review. J. Build. Eng. 2022, 61, 105274. [Google Scholar] [CrossRef]
- Huang, L.; Zhu, Y.; Ouyang, Q.; Cao, B. A Study on the Effects of Thermal, Luminous, and Acoustic Environments on Indoor Environmental Comfort in Offices. Build. Environ. 2012, 49, 304–309. [Google Scholar] [CrossRef]
- Leveson, N.G.; Thomas, J.P. STPA Handbook; MIT Partnership for Systems Approaches to Safety and Security (PSASS): Cambridge, MA, USA, 2018. [Google Scholar]
- Bonate, P.L. A Brief Introduction to Monte Carlo Simulation. Clin. Pharmacokinet. 2001, 40, 15–22. [Google Scholar] [CrossRef] [PubMed]
- Harrison, R.L. Introduction to Monte Carlo Simulation. In Proceedings of the Fifth International Summer School on Nuclear Physics Methods and Accelerators in Biology and Medicine, AIP Conference Proceedings, Bratislava, Slovakia, 5 January 2010; Volume 1204, pp. 17–21. [Google Scholar] [CrossRef]
| Disclaimer/Publisher’s Note: The statements, opinions and data contained in all publications are solely those of the individual author(s) and contributor(s) and not of MDPI and/or the editor(s). MDPI and/or the editor(s) disclaim responsibility for any injury to people or property resulting from any ideas, methods, instructions or products referred to in the content. |
© 2025 by the authors. Licensee MDPI, Basel, Switzerland. This article is an open access article distributed under the terms and conditions of the Creative Commons Attribution (CC BY) license (https://creativecommons.org/licenses/by/4.0/).


 ,
, 


