Article

Factors Affecting Synthesized C-S-H CO2 Uptake: Initial Alkalinity and Ca/Si

1
College of Hydraulic and Civil Engineering, Xinjiang Agricultural University, Urumqi 830052, China
2
Xinjiang Key Laboratory of Hydraulic Engineering Security and Water Disasters Prevention, Urumqi 830052, China
*
Author to whom correspondence should be addressed.
Buildings 2025, 15(8), 1264; https://doi.org/10.3390/buildings15081264
Submission received: 6 March 2025 / Revised: 30 March 2025 / Accepted: 3 April 2025 / Published: 11 April 2025
(This article belongs to the Section Building Materials, and Repair & Renovation)

Abstract

The dynamic evolution of alkalinity during hydration/carbonation of CO2-conditioned cements results in the formation of polymorphic hydrated calcium silicates (C-S-H), whose differences in carbon sequestration capacity have not been systematically investigated. However, the micro-nano structures and carbon sequestration capacities of C-S-H are controlled by the dynamic effects of pore solution alkalinity and Ca/Si. Accordingly, different alkalinity and Ca/Si were set to simulate the cement hydration environment for the synthesis of C-S-H, and tests such as thermogravimetric and 29Si nuclear magnetic resonance (NMR) were used to investigate the effects and mechanisms of initial alkalinity and Ca/Si on the morphology of the synthesized C-S-H, the CO2 uptake. The results showed that the C-S-H synthesized at pH 7.2–12.0 and Ca/Si ratio of 1.0–2.3 was in flocculated and acicular forms, which were well crystallized and dominated by Q2, while its CO2 uptake was positively correlated with Ca/Si. On the contrary, the synthesized C-S-H was poorly crystallized under the conditions of pH increasing to 13.5 and Ca/Si ratios of 1.0–2.3. With the increase in Ca/Si, the synthesized C-S-H evolved from Q2-dominated foil to Q1-dominated porous structure, and its CO2 uptake was non-positively correlated with Ca/Si. This was mainly related to the average pore diameter of C-S-H and its silica-oxygen tetrahedral structure. This was mainly related to the average pore diameter of C-S-H and its silica-oxygen tetrahedral structure.

1. Introduction

CO2 mineralized concrete has been recognized as a promising approach to reducing carbon emissions in the cement industry [1,2]. Existing studies have found that the carbon sequestration capacity of CO2-cured concrete can exceed 24% [3,4]. For hardened cement-based materials, the reaction with CO2 mainly involves the hydration products of cement (such as CH, C-S-H, and AFt) [5], and the carbonation reaction formula is as follows: Equations (1)–(3) [6,7,8,9].
Ca(OH)2 + CO2 → CaCO3 + H2O
xCaO·ySiO2·zH2O + xCO2 → xCaCO3 + ySiO2·wH2O + (z − yw)H2O
3CaO·Al2O3·3CaSO4·32H2O + 3CO2 → 3(CaSO4·2H2O) + 3CaCO3 + Al2O3·xH2O + (26 − x)H2O
Among the cement hydration products, the carbonation reaction rate is highest for CH, followed by C-S-H [10]. In hydrated cement paste, C-S-H accounts for 50% to 70%, while mineral phases such as CH and AFt collectively account for 20% to 25% [11,12,13]. Therefore, C-S-H has great potential in CO2 sequestration. Based on previous research findings, the CO2 sequestration capacity of C-S-H depends on its pore structure and pore size distribution [14]. However, scholars have found that C-S-H synthesized in environments with a pH range of 10.0 to 13.5 and an initial Ca/Si ratio of 0.56 to 1.50 exhibit significant differences in their pore structures [14,15]. To this end, it is a fundamental task to increase the Ca/Si ratio and alkalinity, and systematically investigate the synergistic effects of both on the evolution of C-S-H pore structure and its mechanism of influencing C-S-H carbon sequestration.
It has been reported that C-S-H with different Ca/Si ratios exhibits various micro-nano morphologies, such as spherical, plate-like, and needle-like structures [16,17,18], which are primarily related to the content of Qn in C-S-H synthesized with different Ca/Si ratios [19]. Meanwhile, some scholars have studied the effect of the initial Ca/Si ratio on the pore structure and specific surface area of synthesized C-S-H. They found that a higher initial Ca/Si ratio leads to larger pore structures, but there is no significant change in the specific surface area of C-S-H [14]. In addition to Ca/Si ratio, recent studies have found that the alkalinity during the synthesis of C-S-H can also significantly alter its pore structure and molecular structure [20]. For example, Duque-Redondo [21] and Chen et al. [22] found that C-S-H synthesized in environments with a pH range of 11.16 to 11.88 undergoes decalcification, while environments with a pH greater than 11 reduce the formation rate of C-S-H [23]. Shen et al. [24] found that pH primarily affects the surface charge of the silicon-oxygen tetrahedron and the ability to accommodate cations, which in turn further influences the Ca/Si ratio of C-S-H. Building on this, the effects of the initial Ca/Si ratio and alkalinity on the CO2 sequestration capacity of synthesized C-S-H have been studied separately. Influenced by the initial Ca/Si ratio (0.67 to 1.60) as a single factor, the CO2 uptake capacity of synthesized C-S-H shows a positive correlation with the initial Ca/Si ratio [25,26,27,28]. However, Bei, Sevelsted, Black et al. argued that for C-S-H synthesized in environments with a Ca/Si ratio ranging from 0.40 to 1.75, the CO2 uptake capacity exhibits a negative correlation with the initial Ca/Si ratio after CO2 curing [29,30].
Existing studies primarily focus on the effects of single factors such as Ca/Si (0.40 to 1.75) or pH (11.58 to 13.40) on the micro-nano structures of C-S-H. However, the alkalinity of cement hydration is generally in the range of pH = 11 to 13, and the Ca/Si ratio is between 1.0 and 2.0. Therefore, in order to more comprehensively and systematically simulate the influence of alkalinity and Ca/Si ratio on the micro-nano structure and carbon sequestration capacity of C-S-H in the process of cement hydration, it is necessary to set a wider range of Ca/Si ratios and alkalinity gradient and consider the synergistic effect of the two on the micro-nano structure of C-S-H. Although the effects and mechanisms of the single-factor Ca/Si (0.40 to 1.75) on the carbon sequestration capacity of synthesized C-S-H have been systematically studied, the influence and mechanisms of the synergistic effect of both Ca/Si and alkalinity, especially when expanding their ranges, on the carbon sequestration capacity of C-S-H remain unclear.
Therefore, in this study, C-S-H was synthesized in alkaline solutions with Ca/Si between 1.0 and 2.3 and pH between 12.0 and 13.5. The effects of alkalinity and Ca/Si on the crystallinity and microstructure of C-S-H were characterized using X-ray diffraction (XRD) and scanning electron microscopy (SEM). Based on the above findings, thermogravimetric analysis (TGA) and a moisture analyzer were used to measure the weight loss of CO2-cured C-S-H and calculate its CO2 uptake capacity. Additionally, BET and NMR were employed to characterize the pore size distribution and decalcification degree of the synthesized C-S-H, thereby revealing the mechanisms by which alkalinity and Ca/Si influence the carbon uptake capacity of CO2-cured C-S-H. Based on the optimal CO2 uptake capacity of synthesized C-S-H, the best synthesis conditions were selected, providing a theoretical reference for the future use of synthesized C-S-H to partially replace cement and enhance the carbon sequestration capability of cement-based materials.

2. Materials and Methods

2.1. Materials

The experimental reagents used were analytically pure CaO, SiO2 and NaOH. The purity of CaO (Guangzhou Metallurgy Co., Ltd., Guangzhou, China) was 99.99%, with a particle size of 10 μm and a specific surface area of 0.35 m2/g. The purity of SiO2 (Hengyuan New Materials Co., Ltd., Zhengzhou, China) was greater than 98.1%, with a particle size of 3 μm and a specific surface area of 22.1 m2/g. The purity of NaOH (Tianjin Beilian Fine Chemicals Development Co., Ltd., Tianjin, China) was 96%.

2.2. Synthesis and Mineralization of C-S-H

Considering that the synthetic C-S-H will be mixed with cement as admixture in the follow-up study, the hydrothermal synthesis method with simple synthesis method and large scale is selected. At the same time, the water bath curing temperature is set to be 80 °C to promote the better crystallization of C-S-H and accelerate the formation rate of C-S-H [31,32,33]. Table 1 presents the experimental mix ratios for synthesizing C-S-H and the testing methods for commonly used indicators. First, NaOH and ultrapure water (pH = 7.2) were used to prepare solutions with pH values of 12.0 and 13.5. Next, the CaO and SiO2 were weighed according to molar ratios of 1.0, 1.6, and 2.3, mixed thoroughly, and then combined with NaOH solution or ultrapure water in a 1:10 ratio. Two portions of slurry for each sample were transferred into sealed polypropylene boxes and placed in a constant-temperature (80 °C) water bath for curing up to 14 days, with periodic manual shaking. After curing for the specified age, the samples were repeatedly soaked, washed, and filtered with ultrapure water. One portion of the filtrate was immersed in anhydrous ethanol for 48 h to terminate the hydration process, then dried in an oven at 45 °C until a constant weight was reached. The dried filtrate was ground to 200 mesh and sealed for storage. The other portion of the filtrate was placed in a constant-temperature (20 ± 0.3 °C), constant-humidity (75% ± 0.5%) CO2 curing box (with CO2 concentration of 90%) for 6 h. After CO2 curing, the sample preparation method for the C-S-H powder before and after mineralization remained the same.

2.3. Microstructural Characterization of C-S-H

The microstructure of C-S-H synthesized under different Ca/Si ratios and alkalinities was observed using scanning electron microscopy (SEM, SU8010, HITACHI, Tokyo, Japan). Prior to testing, the powder samples were uniformly dispersed on the surface of conductive films and gold-coated. The tests were conducted at an acceleration voltage of 15 kV.

2.4. Mineral Composition Analysis

The mineral composition of the synthesized C-S-H samples was analyzed using X-ray diffraction (XRD, ADVANCE D8, Bruker, Billerica, MA, USA). XRD measurements were performed in the 2θ range of 10° to 65° with a step size of 0.02° and a counting time of 0.24 s per step.

2.5. Structural Testing of C-S-H

The silicon-oxygen tetrahedron structure in the synthesized C-S-H was tested using 29Si MAS nuclear magnetic resonance (NMR) spectrometer (AVANCE III 400 MHz, Bruker, Billerica, MA, USA). The magnetic field strength was set at 9.4 T, with a single π/2 pulse width of 4.97 μs, a spinning speed of 5 kHz, a relaxation delay of 10 s, and an RF power of 50 kHz. In this process, tetramethylsilane was used as a chemical shift reference. The relative proportion of Qn was calculated through deconvolution of the Gaussian peak distribution spectrum. Based on this, the mean chain length (MCL) of the silicate chain was calculated using Equation (4) [34]. Q represents the silicon-oxygen tetrahedron in C-S-H, and n refers to the number of oxygen atoms attached to adjacent silicon-oxygen tetrahedron, ranging from 0 to 4.
MCL = 2 ( Q 1 + Q b 2 + Q p 2 + Q 3 + Q 4 ) Q 1

2.6. Pore Size Distribution Testing of Synthesized C-S-H

A multipoint nitrogen physical adsorption device (ASAP 2460, Mack Instruments Inc., Westford, MA, USA) was used to measure the specific surface area and pore size distribution of the synthesized C-S-H samples. The samples were degassed at 40 °C for 24 h to remove physically adsorbed gases, followed by testing. The specific surface area was calculated using the Brunauer–Emmett–Teller (BET) method, and the pore size distribution was calculated using the Barrett–Joyner–Halenda ‌(BJH) method.

2.7. Calculation of CO2 Uptake

The CO2 uptake during the curing of C-S-H was tested using a thermogravimetric-differential thermal analyzer (STA7300, HITACHI, Tokyo, Japan). The thermogravimetric test was conducted in an N2 atmosphere, with a temperature ranging from 20 °C to 1000 °C and a heating rate of 10 °C/min. According to previous studies, the decomposition temperature of aragonite, vaterite, and amorphous CaCO3 is about 500–750 °C [35,36], and the decomposition temperature of stable calcite is more than 750 °C [37]. The decomposition temperature of CH is about 420–510 °C [38]. In order to accurately calculate the mass of CaCO3 and CH, the TG/DTG curve was tangent and extended by the epitaxial method [39]. The mass of CaCO3 and CH was obtained by the difference between the beginning and the end of the decomposition of CaCO3 and CH. The thermogravimetric curve and its first-order differential curve were used to calculate the mass of CaCO3, as shown in Equation (5).
M CC ( g / 100 g ) = 100 100 44 ( m CC start m CC end )
MCC represents the mass of CaCO3 in the CO2-cured synthesized C-S-H sample (g/100 g). m C C s t a r t and m C C e n d correspond to the masses at start and end points of CaCO3 decomposition on the thermogravimetric curve, as illustrated in Figure 1.
Figure 2 shows the mineral composition of the synthesized C-S-H samples. From Figure 2, it can be observed that not all of the CaO and SiO2 reacted to form C-S-H, with some CH crystals precipitating. This is mainly because when CaO and SiO2 are used as raw materials for the synthesis of C-S-H, with a Ca/Si ratio greater than 1.5, CaO in the synthesized C-S-H sample does not react completely due to excess, thus existing in the state of CH. With the increase in the initial Ca/Si ratio, the content of CH in the synthesized C-S-H gradually increases [22]. Therefore, the CO2 uptake of synthesized C-S-H (PDF: 00-034-002) should exclude the CO2 uptake by CH (PDF: 96-100-8782) and include the CO2 uptake corresponding to the residual CO32− in the sample, as outlined in Equations (6)–(8).
M CH C O 2 ( g / 100 g ) = 44 74 100 74 18 ( m CH start m CH end )
M C H C O 2 represents the CO2 uptake of CH in the synthesized C-S-H sample. As shown in Figure 1, m C H s t a r t and m C H e n d correspond to the masses at start and end points of CH decomposition on the thermogravimetric curve.
The CO32− solution was obtained through a solid–liquid extraction method. First, the sealed C-S-H samples were prepared by mixing with ultrapure water at a solid-to-liquid ratio of 1:15. The mixture was then stirred for 30 min at 350 rpm using a magnetic stirrer, followed by 2 h of standing, with the cup sealed using plastic wrap to prevent carbonation from air exposure. Finally, the concentration of CO32− in the supernatant was measured using a moisture analyzer (DV1005, METTLER TOLEDO, Zurich, Switzerland).
The mass of CO32− was calculated using Equation (7):
M C O 3 2 ( g / 100 g ) = C V M A
M C O 3 2 represents the mass (g) of CO32− in the synthesized C-S-H sample, C represents the measured concentration (mg/mL) of CO32−, V is the volume of the C-S-H extract (mL), and MA is the mass (g) of the synthesized C-S-H sample used in the test.
The CO2 uptake in the C-S-H samples was calculated according to Equation (8):
M C O 2 netC-S-H ( g / 100 g ) = M C O 3 2 44 60 + M CC 44 100 M CH C O 2
M C O 2 netC-S-H represents the net mass of CO2 absorbed by C-S-H.

3. Results

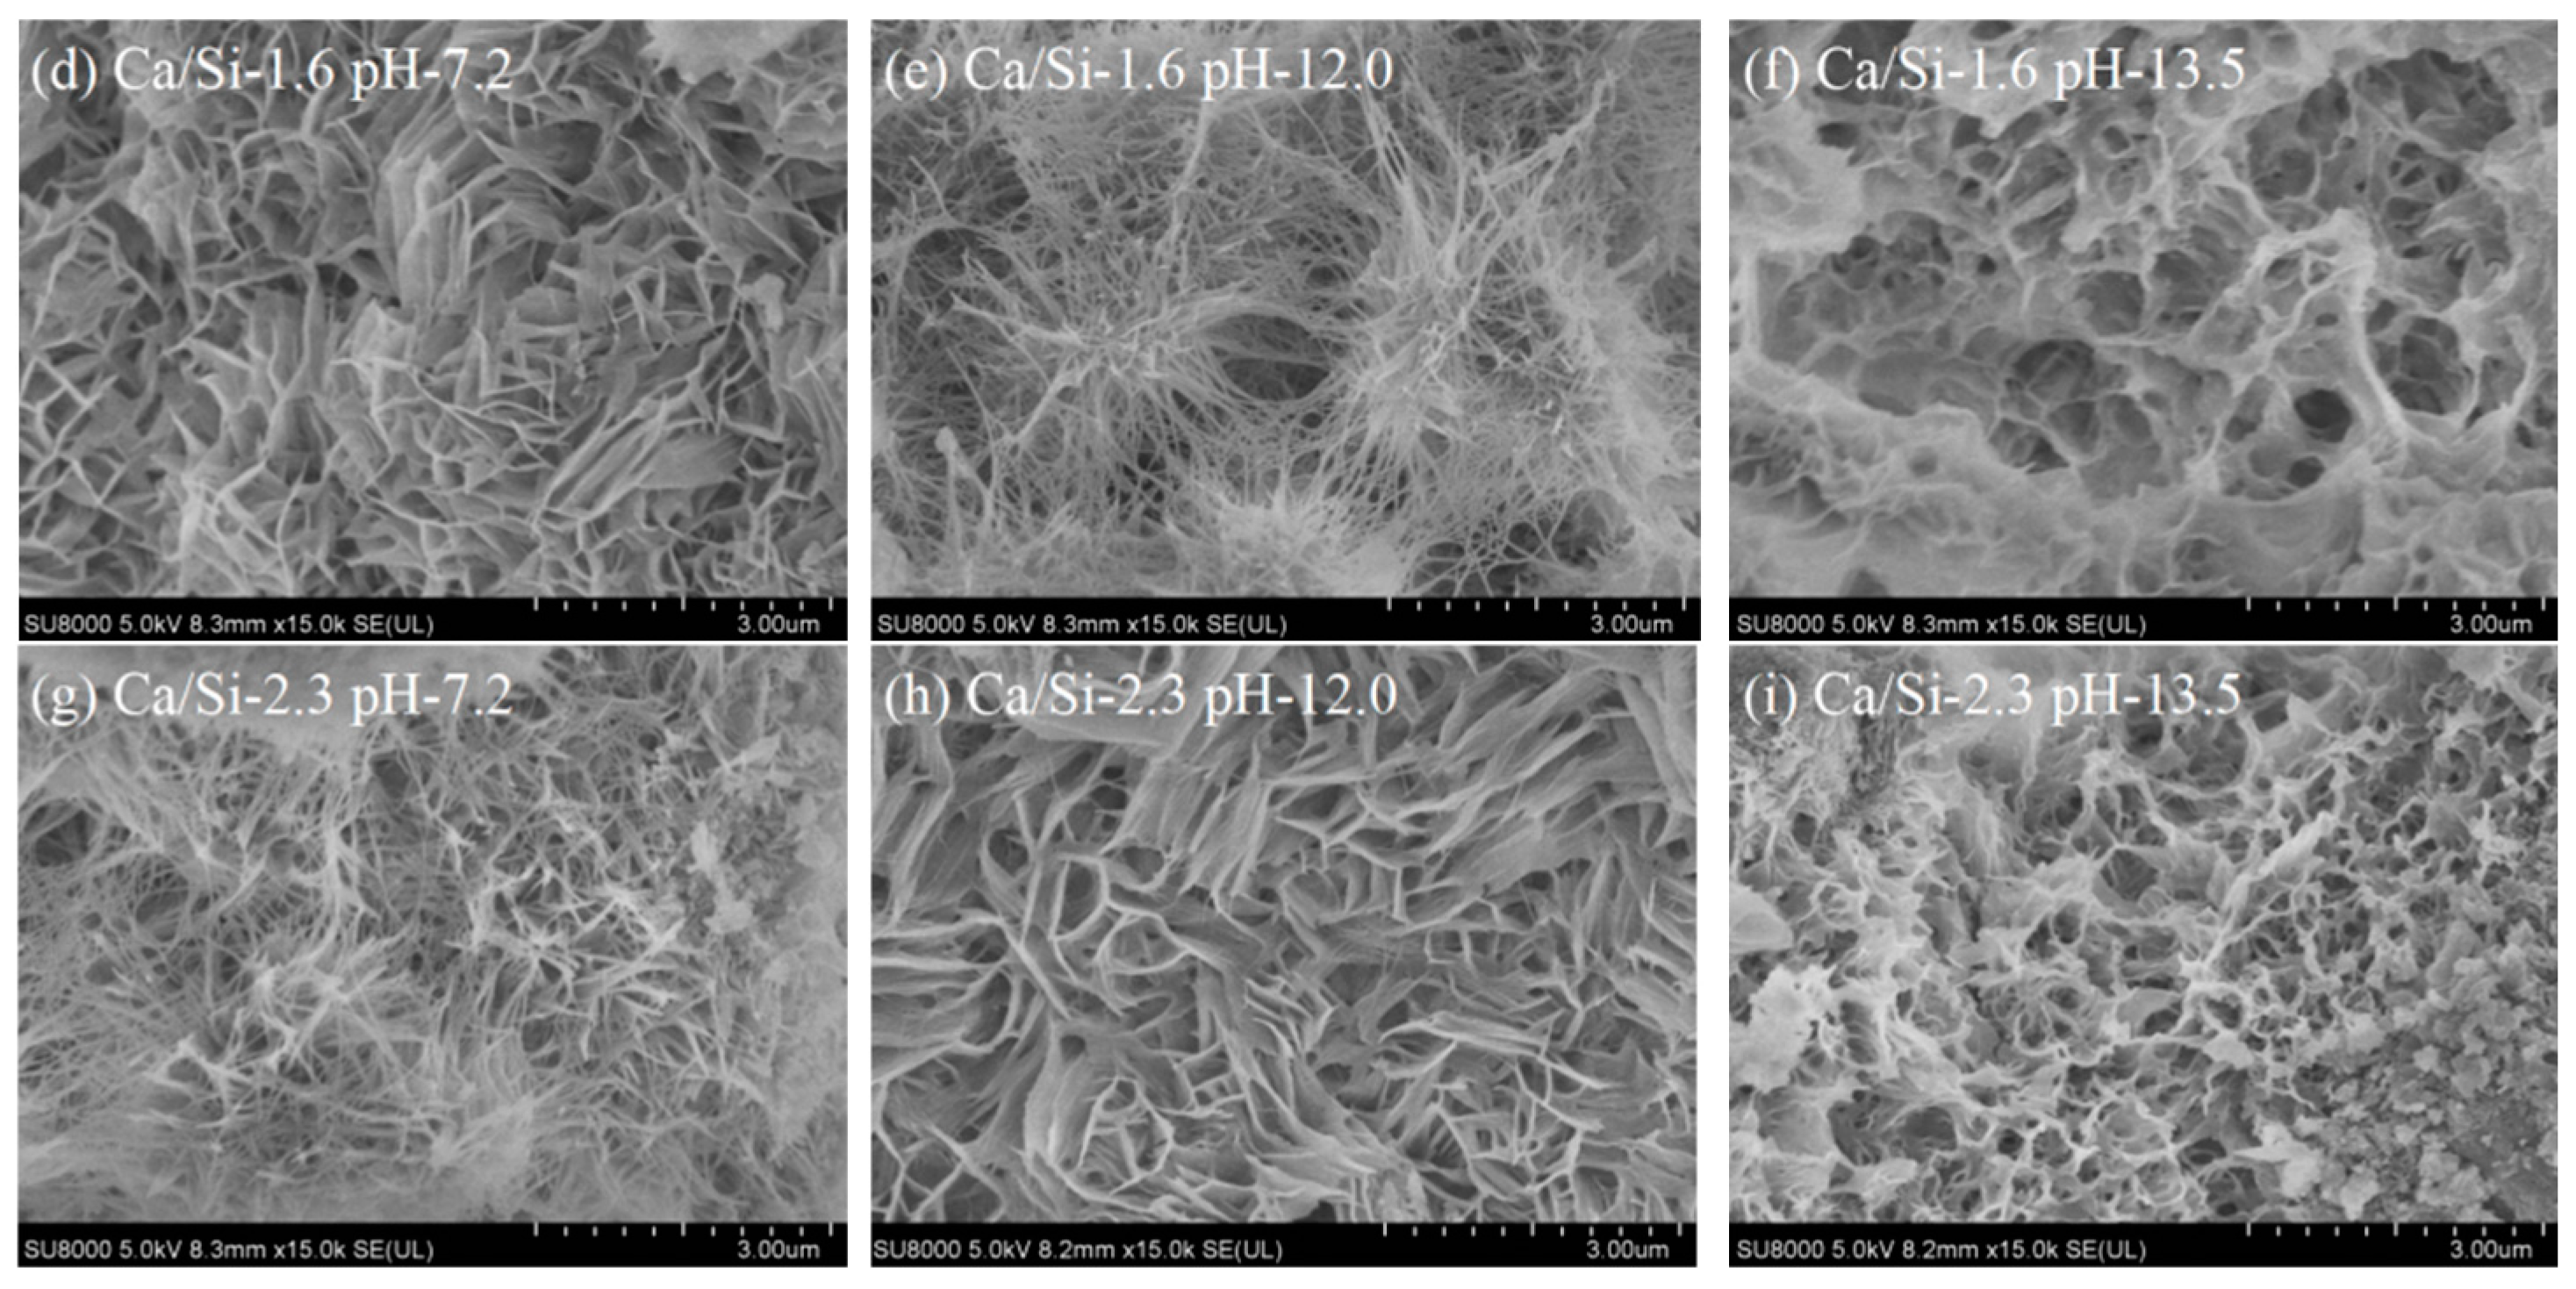
3.1. Microstructure of Synthesized C-S-H

Figure 3 shows the microstructure of the synthesized C-S-H. As can be seen from Figure 3a–c, when the Ca/Si ratio is 1.0 and the pH ranges from 7.2 to 12.0, the C-S-H is flocculent; at pH 13.5, the C-S-H evolves from a flocculent structure to a flaky structure. Previous studies have found that when the Ca/Si ratio is between 1.0 and 1.2 and the pH exceeds 13.0, C-S-H also crystallizes into a flaky form, which is consistent with the findings of this study. The difference is that when the pH ranges from 10.0 to 12.0, C-S-H exhibits a spherical shape [13,40,41]. This may be due to the differences in materials and synthesis methods for the synthesis of C-S-H. Figure 3d–f shows that when the Ca/Si ratio is 1.6, as the pH increases from 7.2 to 12.0, the C-S-H evolves from a honeycomb structure to a fibrous structure. When the pH increases to 13.5, the C-S-H becomes porous. For the Ca/Si ratio of 2.3, as the pH increases from 7.2 to 13.5, the C-S-H gradually evolves from a needle-like structure to a porous one, as shown in Figure 3g–i. Overall, as the Ca/Si ratio approaches 1.0 and the pH approaches 12.0, the morphology of C-S-H tends to become more flocculent. In contrast, as the Ca/Si ratio approaches 1.6 to 2.3 and the pH approaches 13.5, the morphology of C-S-H tends to become more porous. This is primarily due to the varying effects of alkalinity and Ca/Si on the crystallinity, silicon-oxygen tetrahedron bonding, and polymerization degree of C-S-H, which leads to significant morphological differences under different alkalinities and Ca/Si ratios.

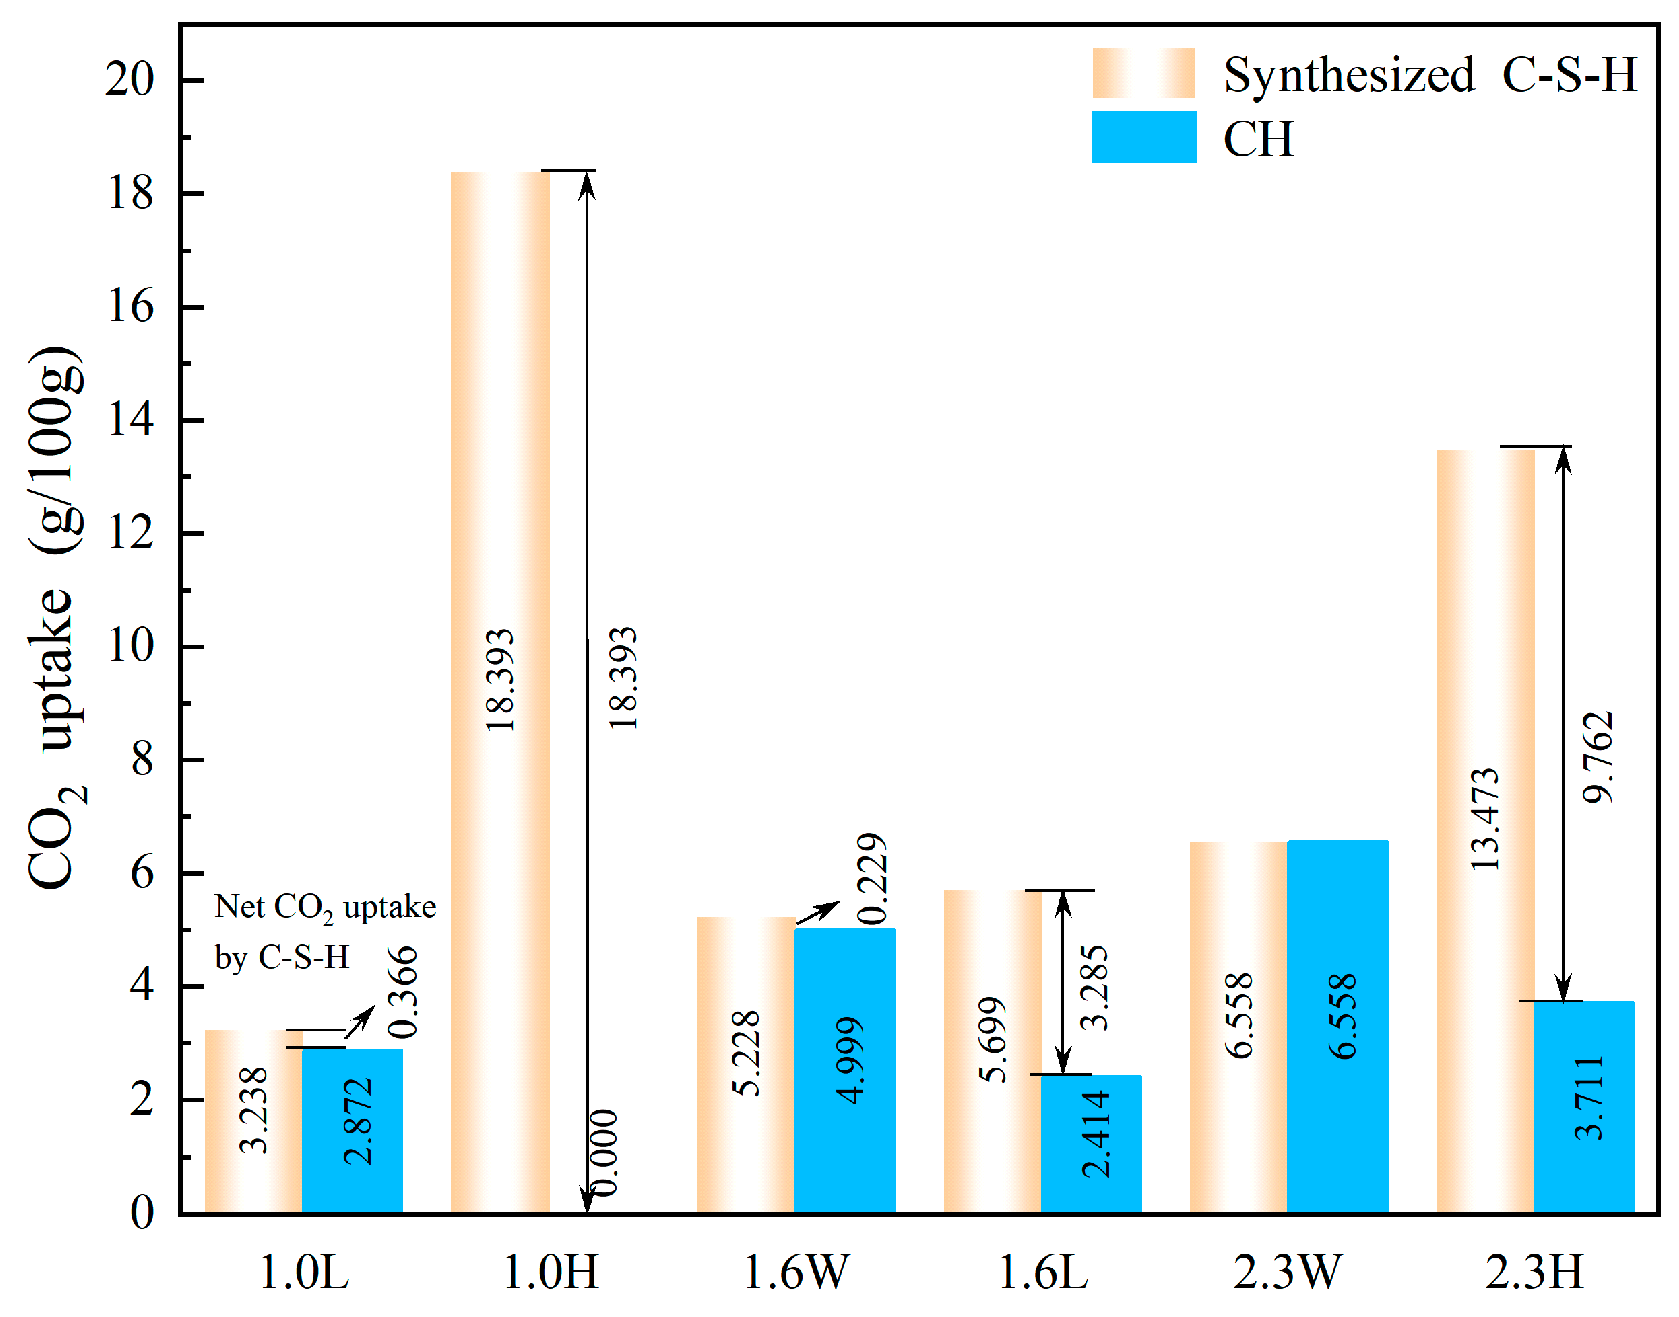
3.2. CO2 Uptake by Synthesized C-S-H

Figure 4 shows the CO2 uptake of synthesized C-S-H samples cured in CO2. As seen from Figure 4, when the pH is not greater than 12.0, the CO2 uptake of the synthesized C-S-H and CH shows a positive correlation with the initial Ca/Si ratio. Although the presence of CH in the sample interferes with the net CO2 uptake by C-S-H and the pH remains the same, the net CO2 uptake still shows a positive correlation with the Ca/Si ratio. These findings are consistent with previous studies, which found that under ultrapure water conditions, the CO2 uptake of synthesized C-S-H with a Ca/Si ratio of 0.2 to 1.5 increases with the Ca/Si ratio [26,28,42]. It shows that under the condition of low alkalinity, the CO2 uptake of synthetic C-S-H and the higher initial Ca/Si ratio can provide sufficient calcium source for the carbonation reaction, so that the amount of CaCO3 produced by the synthesis of C-S-H is greatly increased. In contrast, when the pH is 13.5, the CO2 uptake and the net uptake of synthesized C-S-H show a negative correlation with Ca/Si ratios. Studies by Chang and Sevelsted found that when the pH is greater than 13.0, the CO2 uptake of synthesized C-S-H increases with the Ca/Si ratio [14,29], indicating that the initial Ca/Si ratio and alkalinity are not the sole determinants of CO2 uptake by C-S-H. The CO2 uptake of C-S-H is also related to its own micro-nano structural characteristics.

4. Discussion

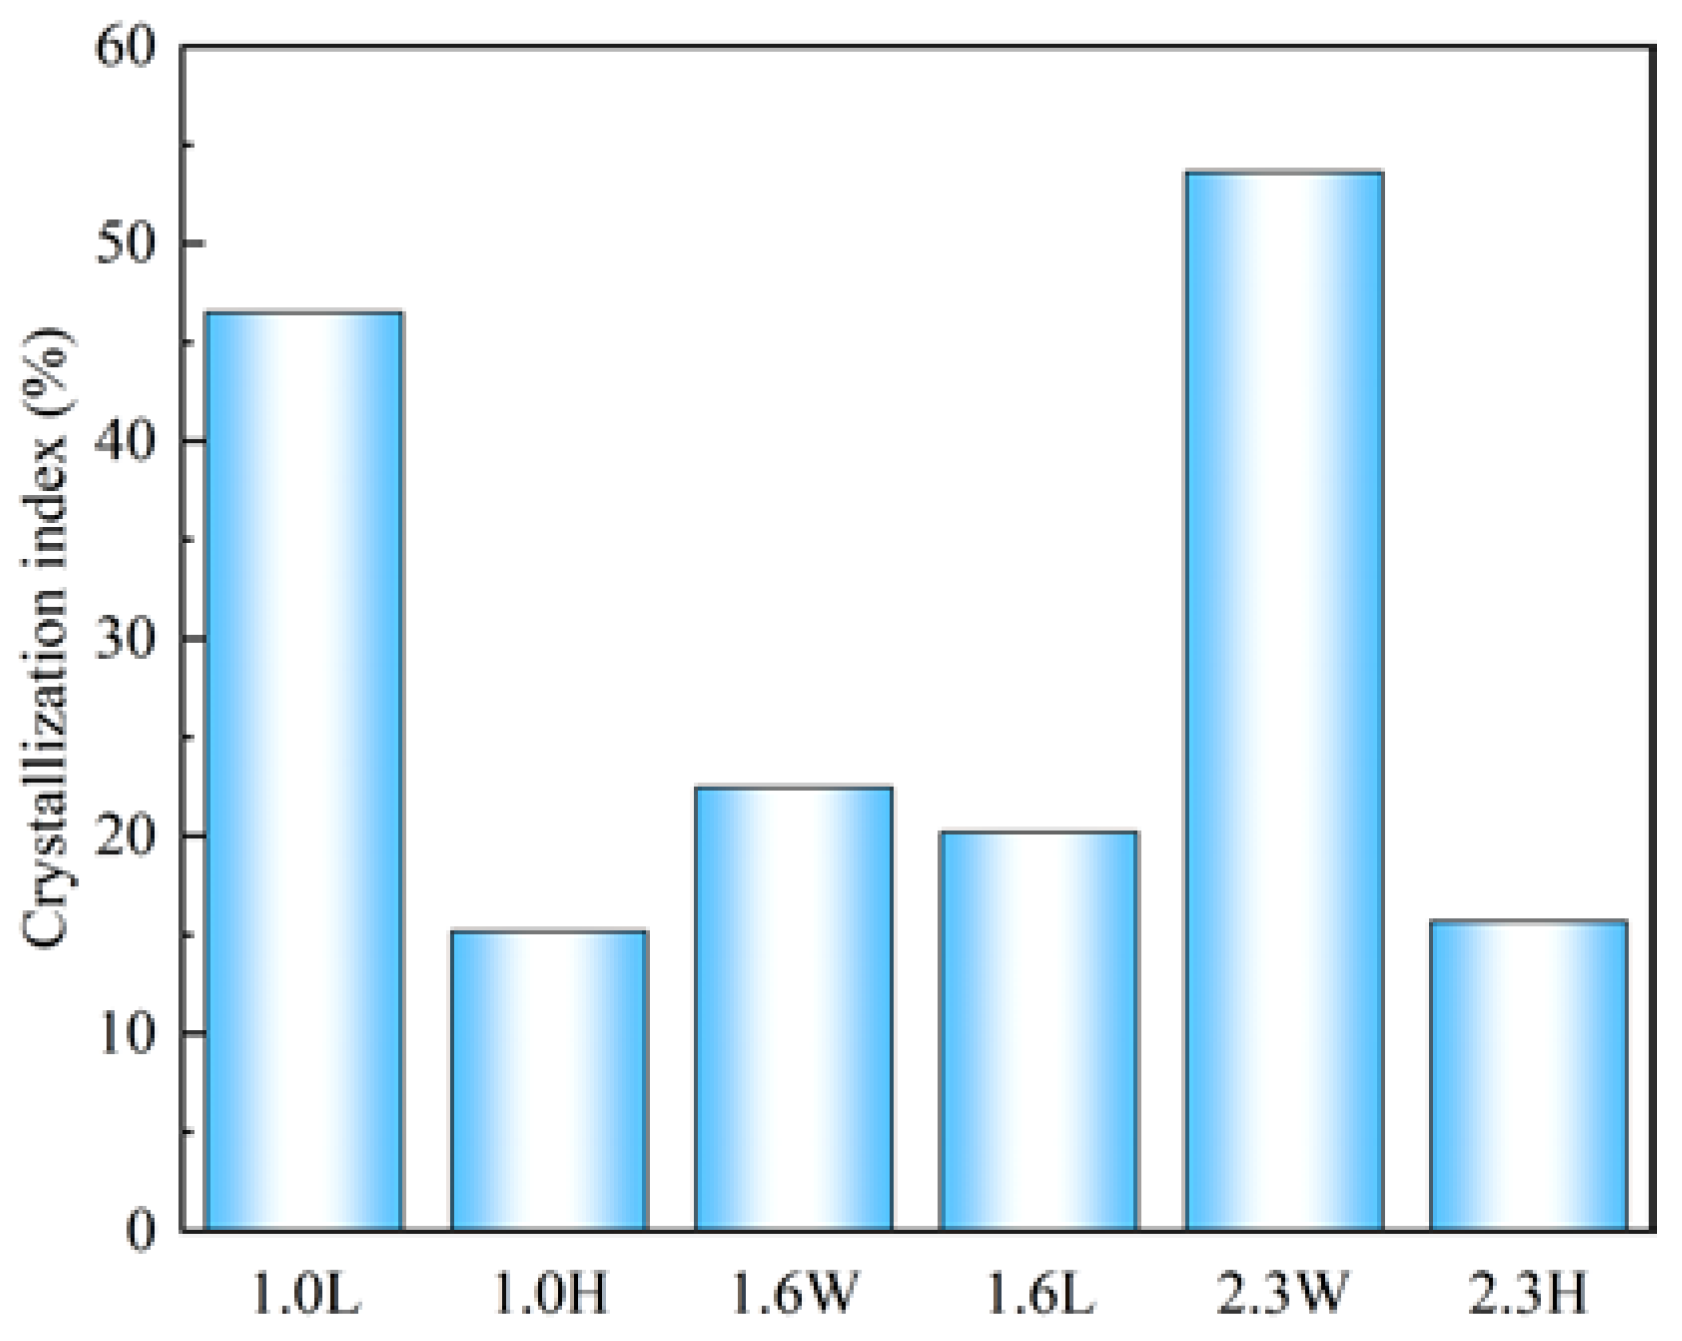
4.1. Effect of Alkalinity and Ca/Si on the Crystallinity and Polymerization Degree of C-S-H

Figure 5 is the crystallization index of the synthesized C-S-H phase on the 110 crystal plane in the XRD pattern. It can be seen from Figure 5 that when Ca/Si ratios are the same, increasing the alkalinity decreases the crystallinity of the synthesized C-S-H. This may be due to the higher OH concentration, which reduces the degree of crosslinking between [SiO4]4− [43,44], leading to the lower crystallinity of 1.0H and 2.3H. At the same time, the higher OH concentration also promoted the combination of calcium ions and [SiO4]4− in the solution, resulting in a significant decrease in the CH peak intensity with the increase in alkalinity in Figure 2. But the correlation between the crystallinity of C-S-H and its morphology has not been extensively reported in the literature. However, as shown in Figure 3 of this study, the crystallinity of the C-S-H synthesized under the Ca/Si ratios of 1.0 and 2.3, and a pH of 13.5, is found to be the lowest, corresponding to a relatively loose, flaky, and porous morphology. In order to reveal the effect mechanism of alkalinity and Ca/Si ratio on the crystallinity and microstructure of synthesized C-S-H, the C-S-H structure obtained from the 29Si nuclear magnetic resonance (NMR) spectrometer was used for interpretation.
Figure 6 presents the 29Si NMR spectra of C-S-H synthesized under different Ca/Si ratios and alkalinity conditions, Table 2 shows the proportion of silicon-oxygen tetrahedron and the mean chain length, and Figure 7 illustrates the schematic diagram of the effect of alkalinity and Ca/Si ratio on the silicon-oxygen tetrahedral structure of C-S-H. According to Table 2 and Figure 6a,b, it is evident that, when the pH is 13.5 and the Ca/Si ratio increases from 1.0 to 2.3, the quantity ratio of Q1 increases from 40.2% to 59.0%, and the MCL (mean chain length) decreases from 5.0 to 3.4. As shown in Figure 7, this is mainly due to the fact that, as the Ca/Si ratio increases from 1.0 to 2.3 under the same alkalinity conditions, the large amount of Ca2+ in the solution, carrying two units of positive charge, becomes more likely to bind with [SiO4]4−, preventing significant crosslinking between [SiO4]4− during the formation.
As can be seen from Figure 6a,b and Table 2, when the Ca/Si ratio is 2.3 and the pH increases from 7.2 to 13.5, the number of [SiO4]4− monomers gradually increases, and the mean chain length gradually shortens, indicating the weakening of C-S-H polymerization. This is mainly due to the increase in OH concentration, which causes [SiO4]4− in the formation process to evolve from a protonated state (>Si−OH2)+ to a neutral (>Si−OH), and finally to a deprotonated state (>Si−O−). As a result, there are more negative charges on C-S-H at higher pH values, and the charge repulsion between [SiO4]4− makes crosslinking between silicate chains more difficult [45] (Figure 7—Deprotonation process before chain formation), while the exposed negative charge sites on [SiO4]4− attract Ca2+ and bind with it. Moreover, as the OH concentration increases, OH will also react with groups in the already crosslinked chains, leading to pentacoordinate bonding of silicon atoms with OH, and other OH will pull oxygen atoms from opposite directions in the Si−O−Si bond, causing the bond to dissociate as shown in the reaction of Equation (9) [46,47,48], thereby leading to the depolymerization of the silicon chains (Figure 7—Process of breaking silicate chains by OH attacks after chain formation). This leads to the manifestation of more Q1 [SiO4]4− at higher pH levels. The increase in alkalinity and Ca/Si ratio causes the Q2 groups in C-S-H to gradually depolymerize and convert into Q1 groups (as shown in Figure 6 and Table 2), significantly decreasing the degree of polymerization and gradually shortening the silicon chains. The shorter chains prevent C-S-H from forming larger crystals [19], leading to a transformation in the morphology of C-S-H from a more compact flocculent form to a larger structure with pores (as shown in Figure 3 and Figure 8).
S i 2 O 7 6 + OH Si O 4 H 3 + Si O 4 4

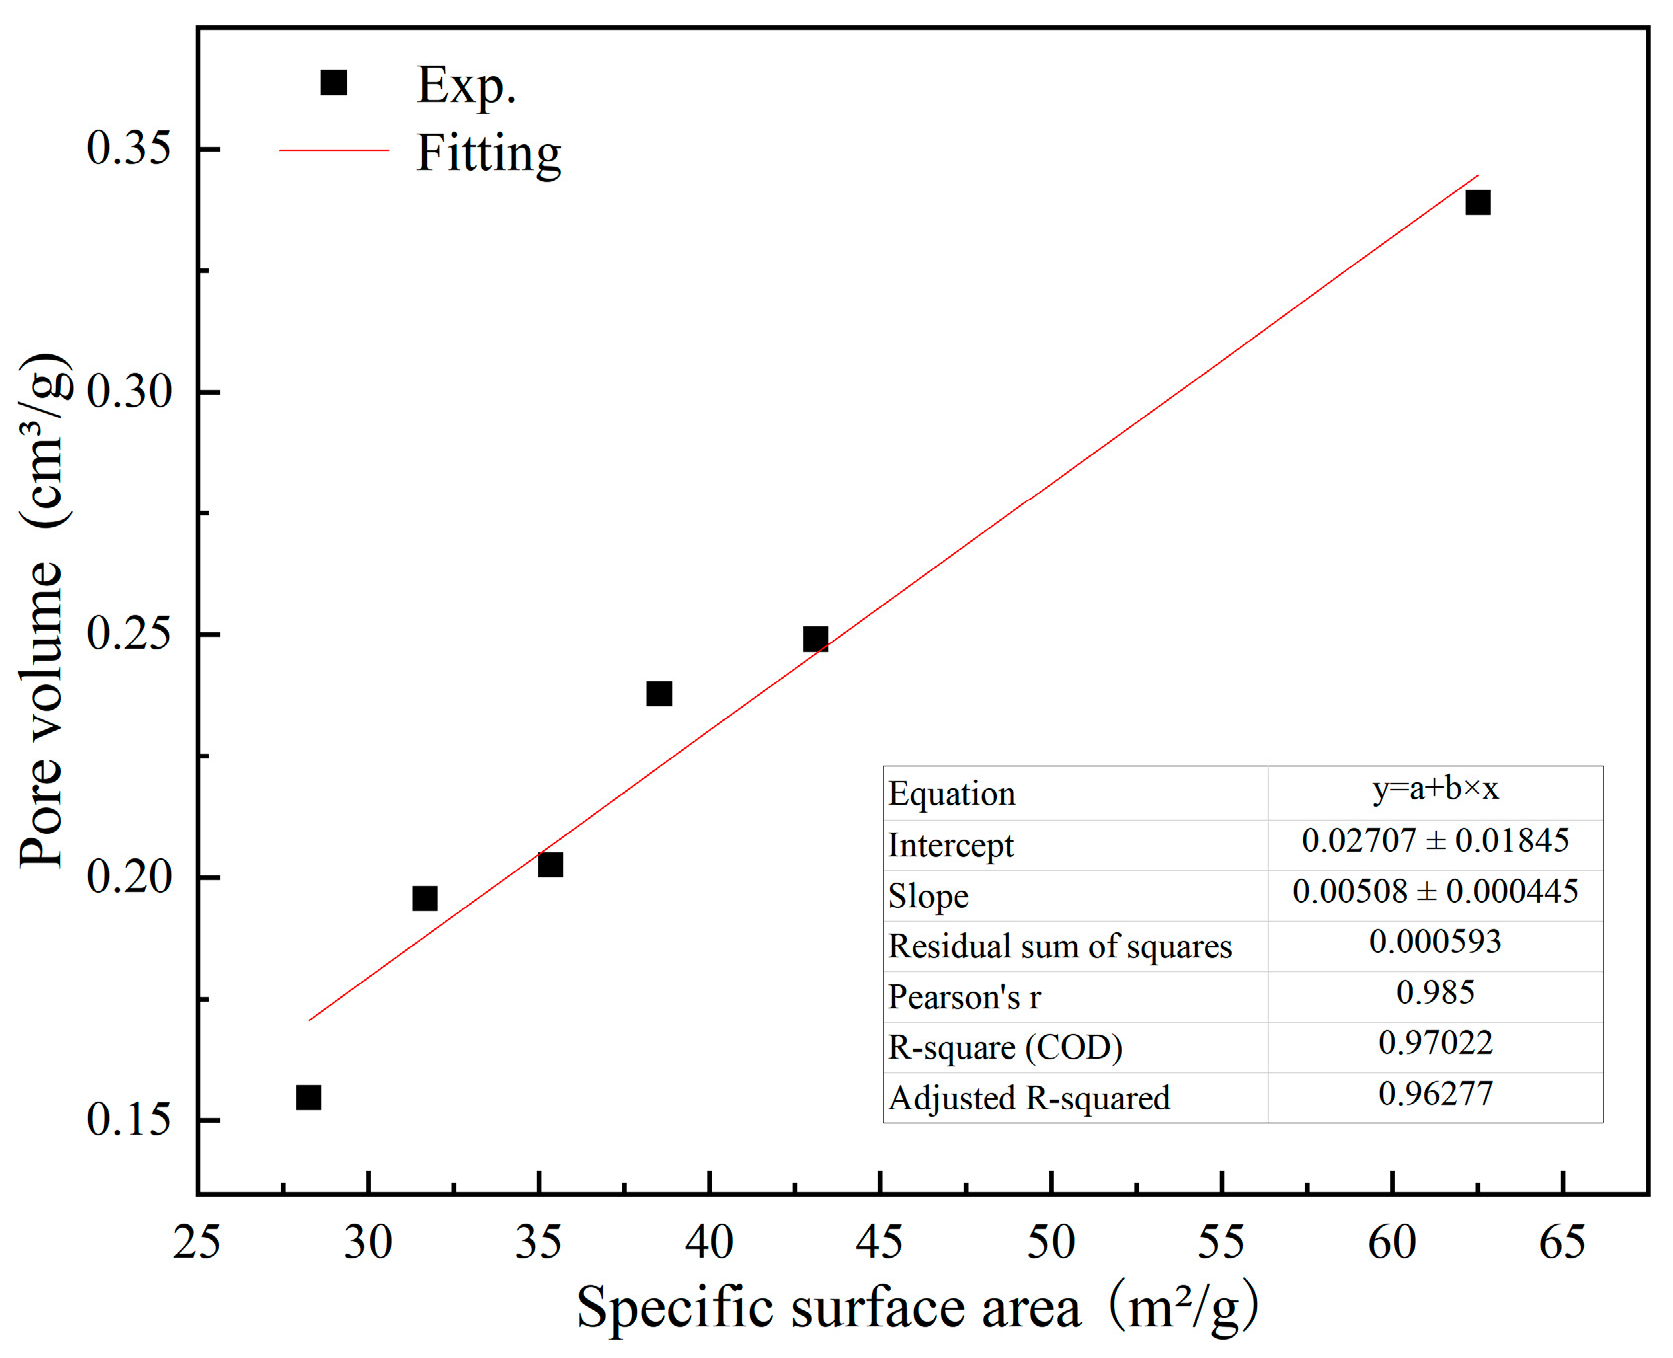
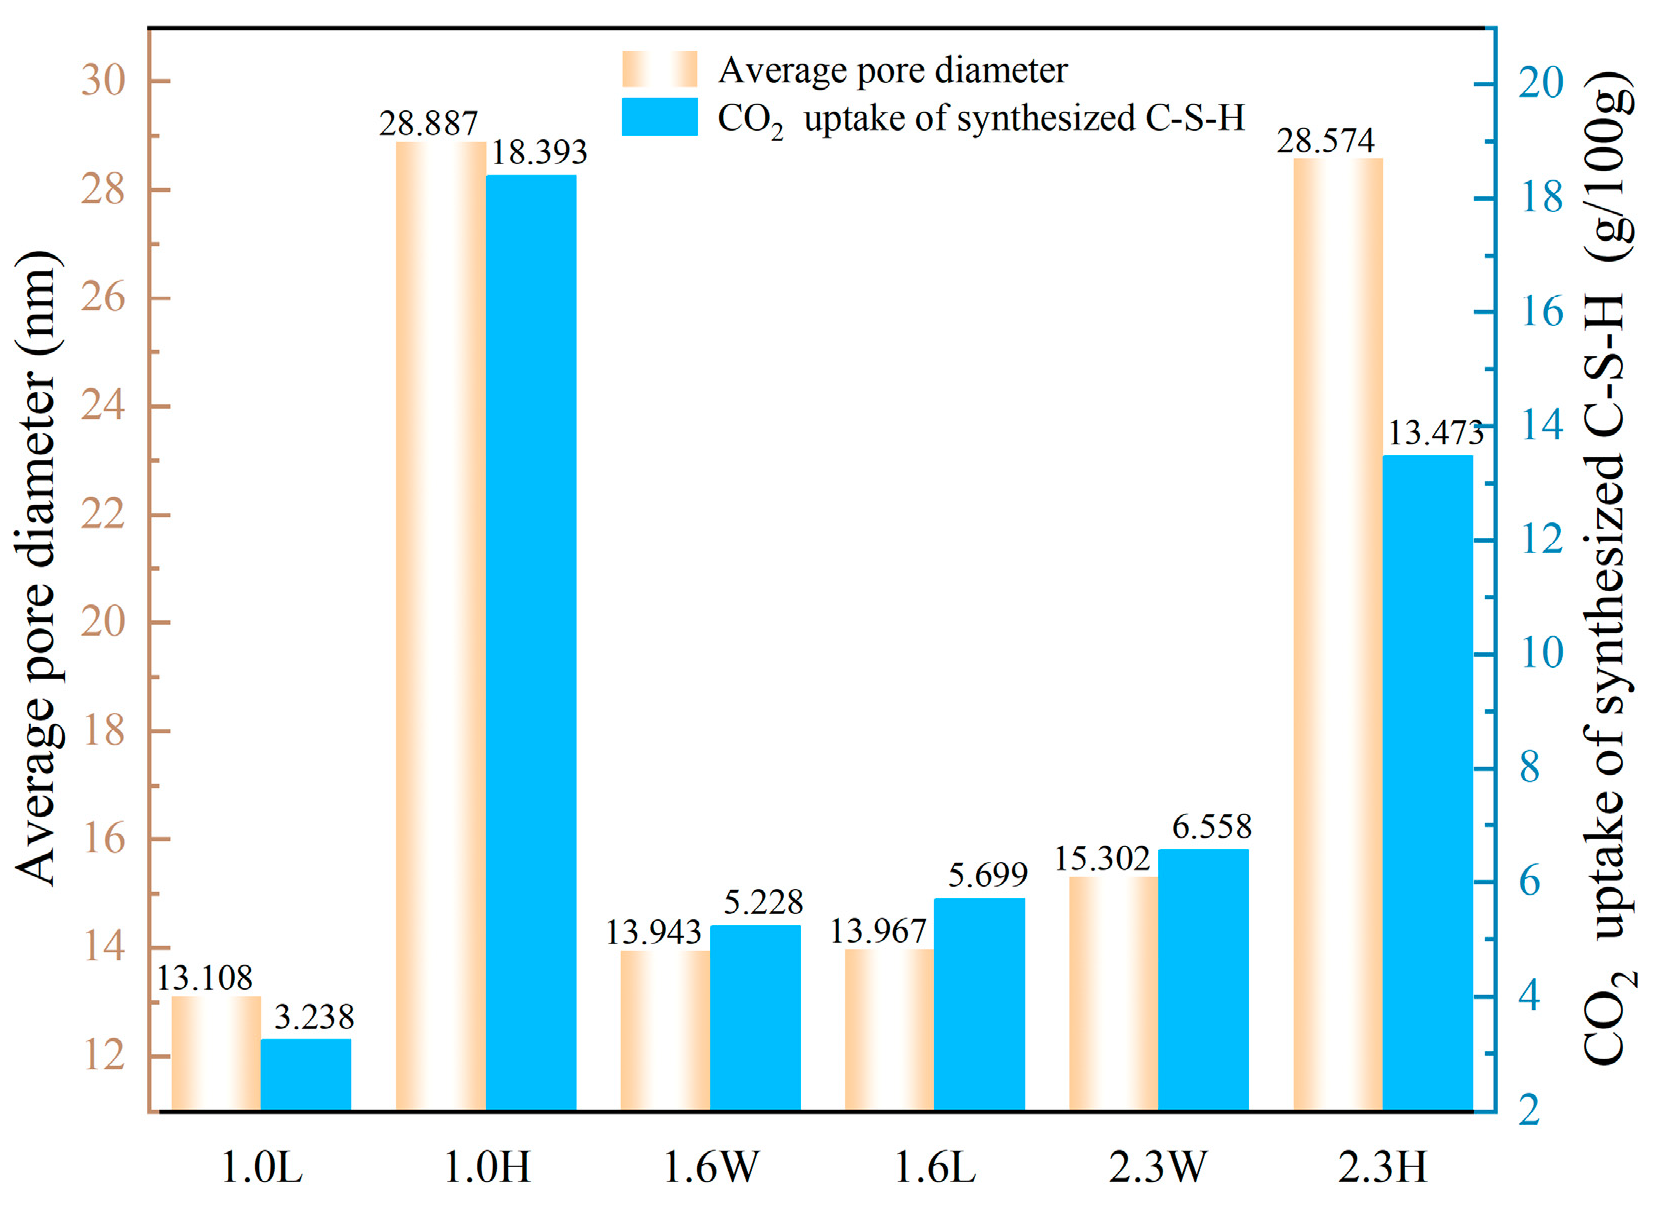
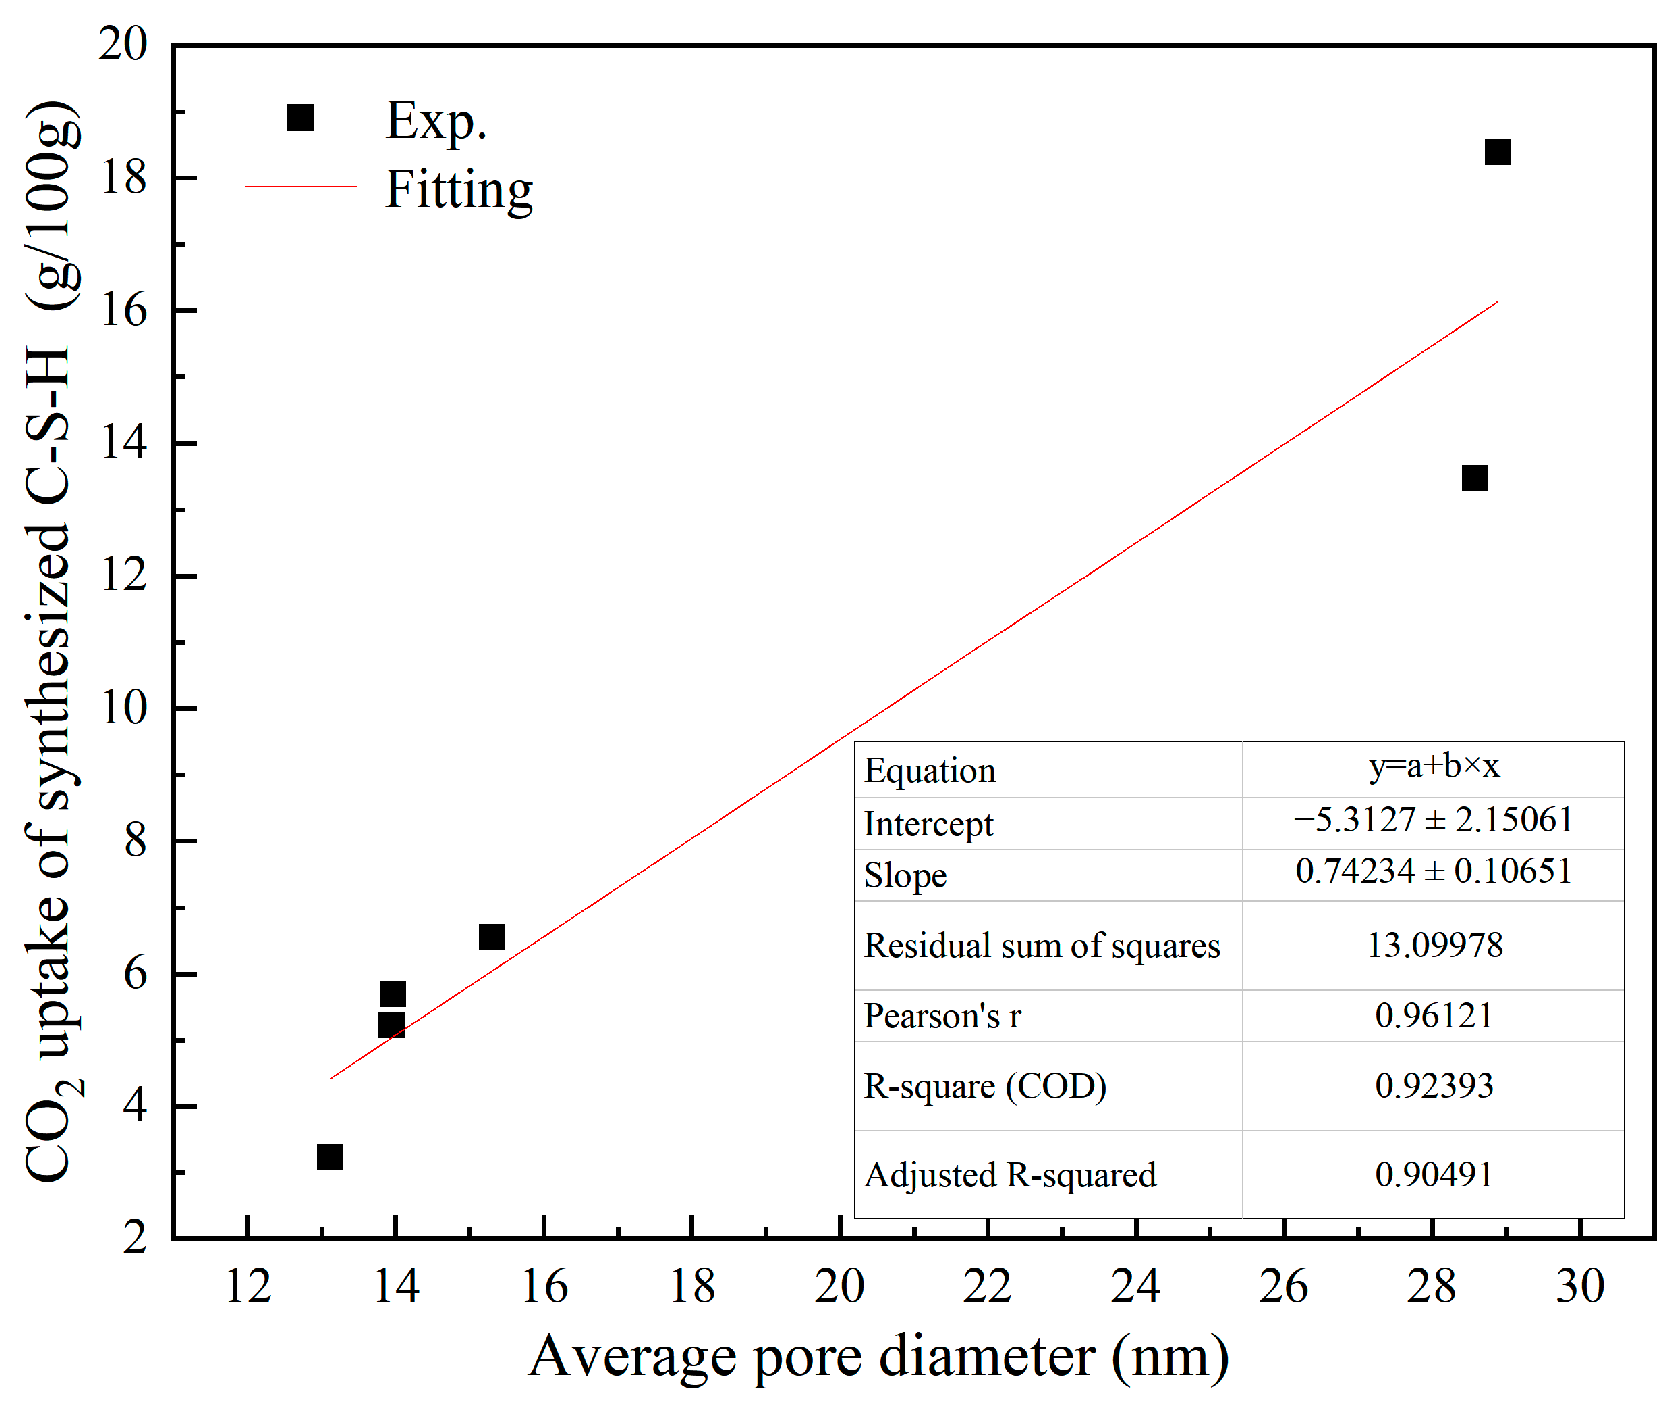
4.2. Effect of Pore Structure of Synthesized C-S-H on CO2 Uptake

Figure 8 shows the correlation between the specific surface area and pore volume of the synthesized C-S-H samples. As shown in Figure 8, the specific surface area and pore volume of the synthesized C-S-H samples follow a linear relationship. This suggests that the external surface area of synthesized C-S-H is relatively small, and most of the exposed surface area consists of internal pore surfaces. Therefore, the structure of synthesized C-S-H is loose and porous with a high proportion of pores. These finding aligns with the results described by Li [49], who characterized C-S-H as having a layered and porous structure. The diffusion and uptake of CO2 within synthesized C-S-H primarily depend on the pore size. As shown in Figure 9, the average pore diameter of synthesized C-S-H increases with increasing alkalinity and Ca/Si ratio, which is similar to the findings of Chang J et al. [14], where an increase in the initial Ca/Si ratio (ranging from 0.56 to 1.5) led to an expansion in the pore diameter of C-S-H. This is mainly due to the fact that an increase in Ca/Si ratio and alkalinity results in a decrease in the crystallinity of C-S-H (as shown in Figure 5). The reduced crystallinity causes the internal pore structure of C-S-H to be larger, leading to significant differences in pore diameter under different alkalinities and Ca/Si ratios.
Figure 8. Linear fitting results of the specific surface area and pore volume of synthesized C-S-H.
Buildings 15 01264 g008
In addition, in Figure 9, the average pore diameter and the CO2 uptake of the synthesized C-S-H are compared, and it is found that the trend correlation between the CO2 uptake of the synthesized C-S-H and the average pore diameter is strong. In order to further clearly show the relationship between the average pore diameter and the CO2 uptake of the synthesized C-S-H, the average pore diameter and the CO2 uptake test results are linearly fitted (as shown in Figure 10). It can be seen from Figure 10 that the average pore diameter of the synthesized C-S-H is positively correlated with the CO2 uptake, and the linear fitting result is good (R square is 0.92393), indicating that the diffusion degree and uptake amount of CO2 in the synthesized C-S-H mainly depend on the pore diameter. Therefore, when the alkalinity is between 7.2 and 12.0, the average pore diameter of the synthesized C-S-H increases with the increasing Ca/Si ratio, which leads to an increasing trend in CO2 uptake. When the alkalinity is 13.5, the average pore diameter of the synthesized C-S-H decreases with the increase in Ca/Si ratio. At the same time, the CO2 uptake of the synthesized C-S-H decreases with the decrease in the average pore diameter, indicating that under the condition of high alkalinity, the CO2 uptake of the synthesized C-S-H is less affected by the initial Ca/Si ratio, which mainly depends on the average pore diameter. The larger average pore diameter can promote the diffusion of CO2 in the synthesized C-S-H, thereby improving the degree of carbonization reaction.

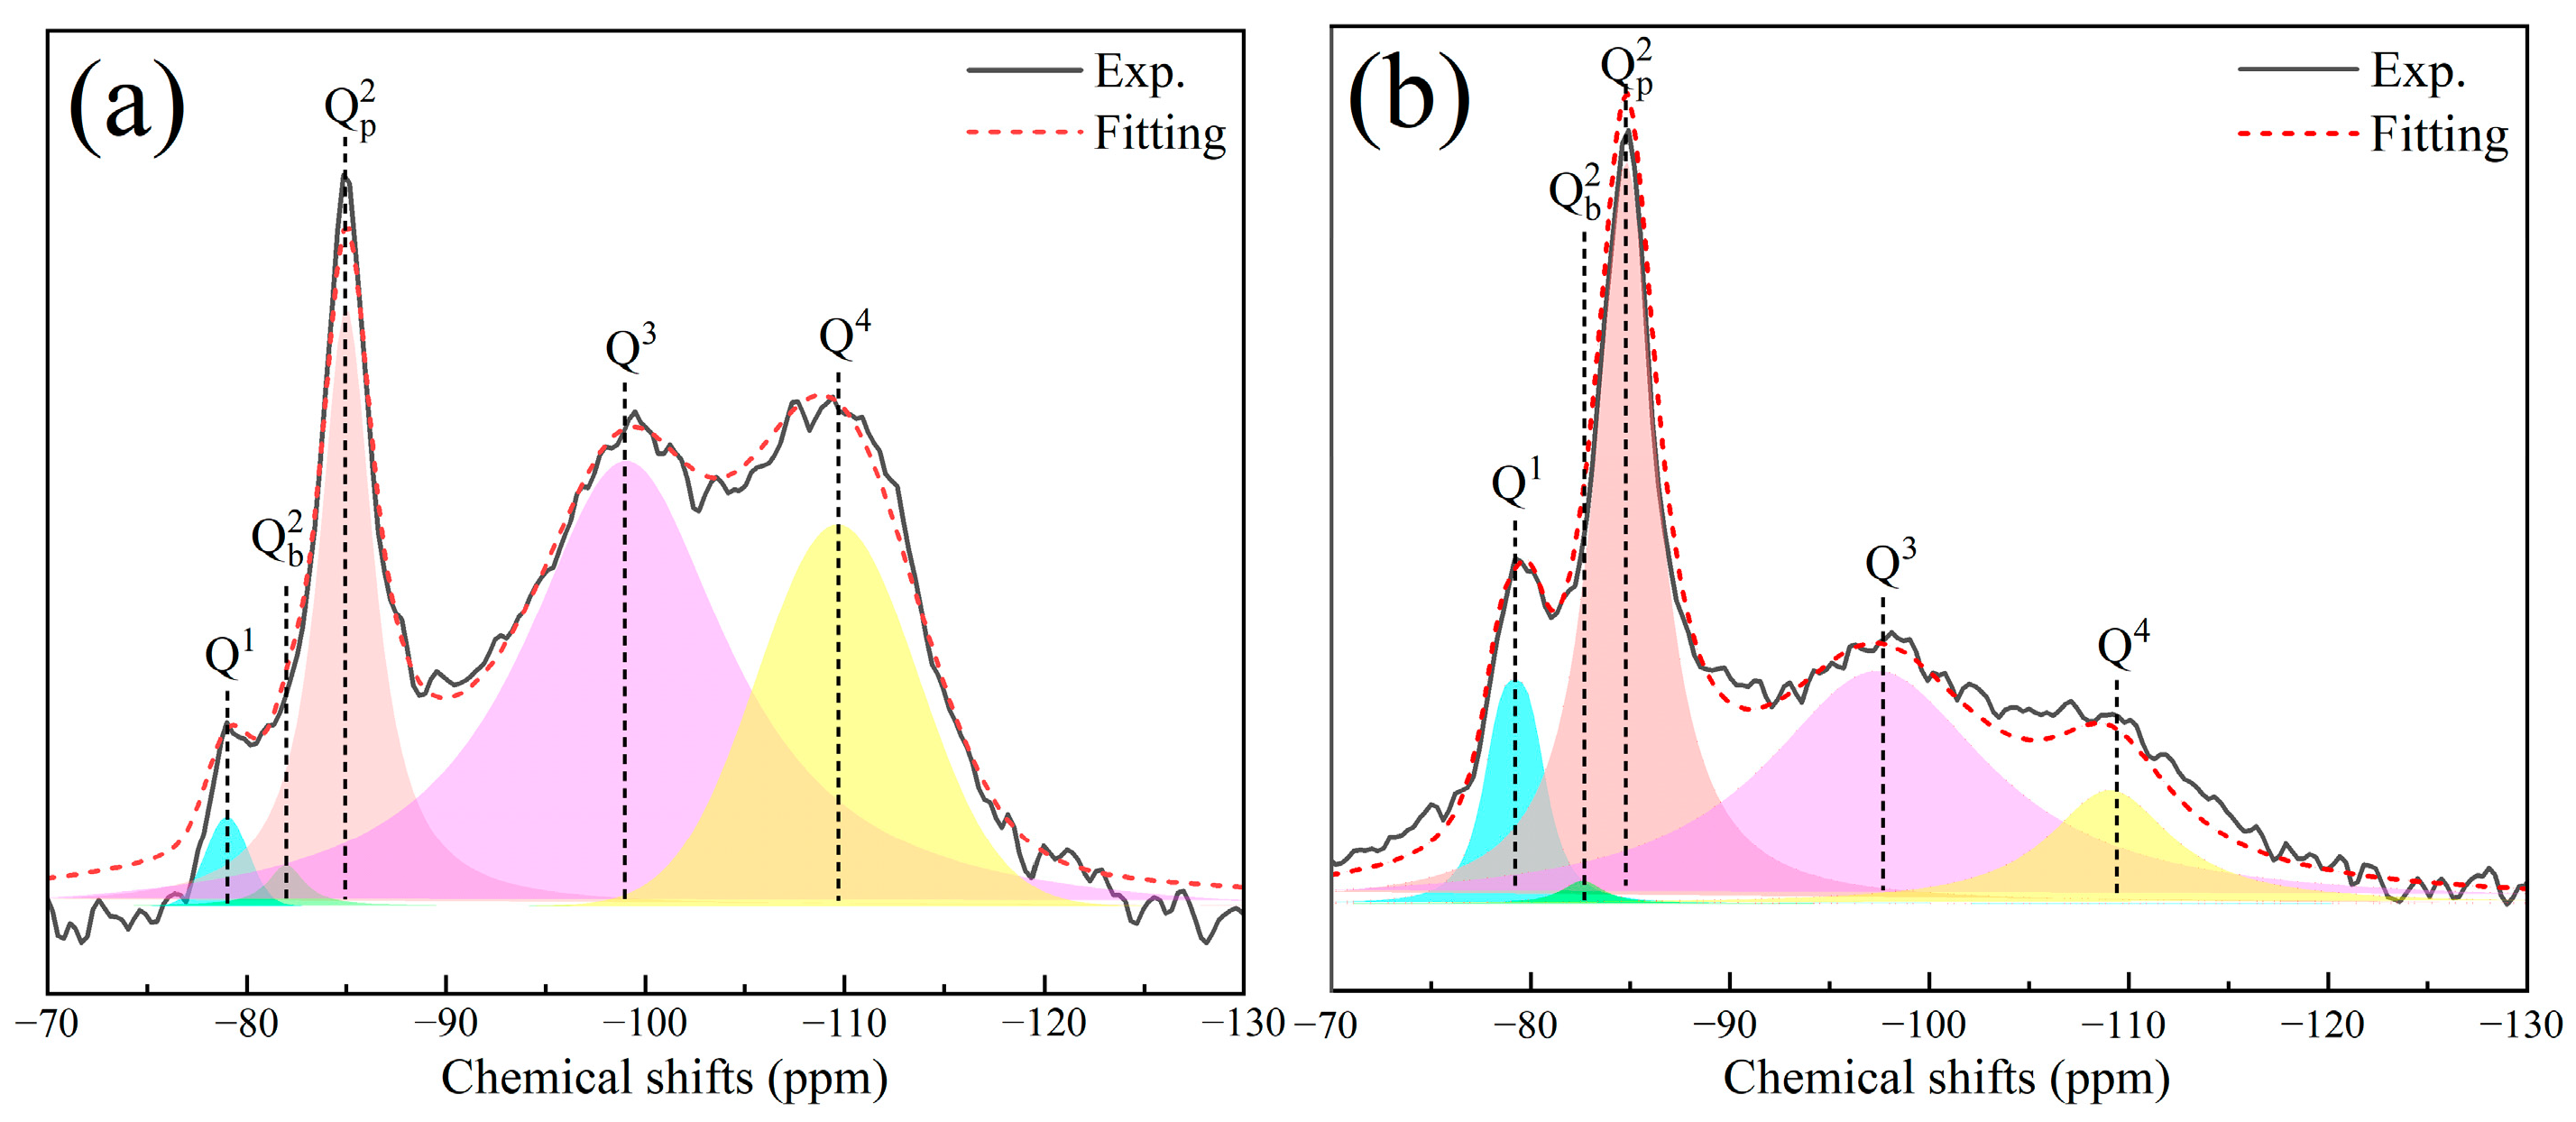
4.3. Effect of C-S-H Nanostructural Characteristics on CO2 Uptake

A comparative discussion on the nano-structural characteristics of C-S-H in 1.0H and 2.3H before and after CO2 curing was conducted since 1.0H and 2.3H samples showed higher CO2 uptake after CO2 curing. The NMR results are shown in Figure 11 and Table 3. Compared to the results before CO2 curing, the proportion of Q1 groups in 1.0H and 2.3H samples decreased by 38.7% and 51.2%, respectively, while the proportion of Q2 groups decreased by 40.1% and 2.7%, respectively. With reference to the schematic diagram of the demineralization process of silicon chains in C-S-H during CO2 curing (Figure 12), CO32− ions compete with Ca2+ for uptake after they enter the interlayer gaps of C-S-H, leading to carbonation reactions on some Q1 and Q2 groups, thereby forming CaCO3. As shown in Figure 11 and Table 3, the conversion rates from Q1 and Q2 to Q3 and Q4 are higher in 1.0H than those in 2.3H, indicating that under the same CO2 curing conditions, 1.0H is more prone to demineralization than 2.3H. This explains why the CO2 uptake of 1.0H is higher than that of 2.3H in Figure 10, and further confirms that under 6 h of CO2 curing at 99% concentration, the CO2 uptake of 1.0H is stronger than that of 2.3H according to the demineralization degree of synthesized C-S-H.
In summary, alkalinity significantly affects the morphology and micro-nano structural characteristics of synthesized C-S-H. Under high alkalinity conditions, the depolymerization and difficulty in crosslinking of silicon chains reduce the polymerization degree of C-S-H, resulting in the gradual expansion of its pore structure. Additionally, from the perspective of the demineralization degree of synthesized C-S-H and the amount of carbonation products, it is shown that after CO2 curing at a concentration of 99% for 6 h under high-alkalinity conditions, the CO2 uptake of synthesized C-S-H does not increase with the increasing Ca/Si ratio. Instead, it depends on the internal pore structure of the synthesized C-S-H.

5. Conclusions

In this study, methods such as SEM, XRD, BET, TGA, and NMR were used to investigate the effects and mechanisms of the synergistic effect of Ca/Si (1.0 to 2.3) and alkalinity (7.2 to 13.5) on the morphology, structure, and CO2 uptake of synthesized C-S-H. Key conclusions are as follows:
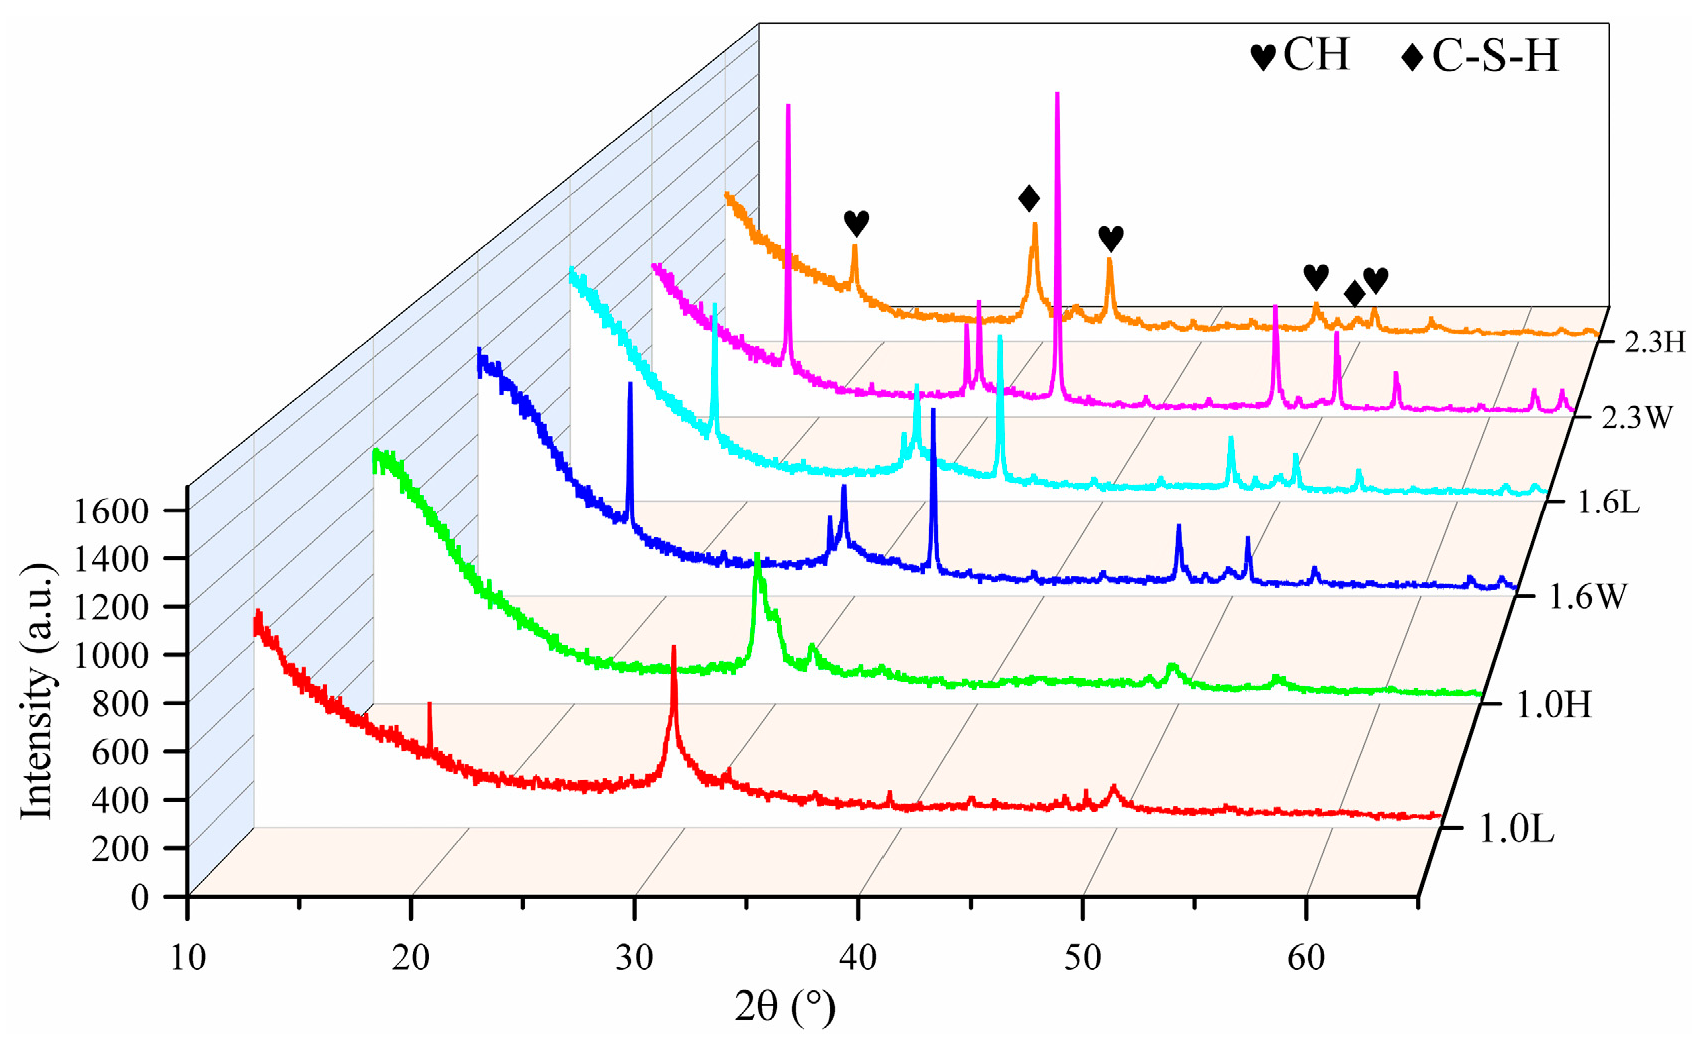
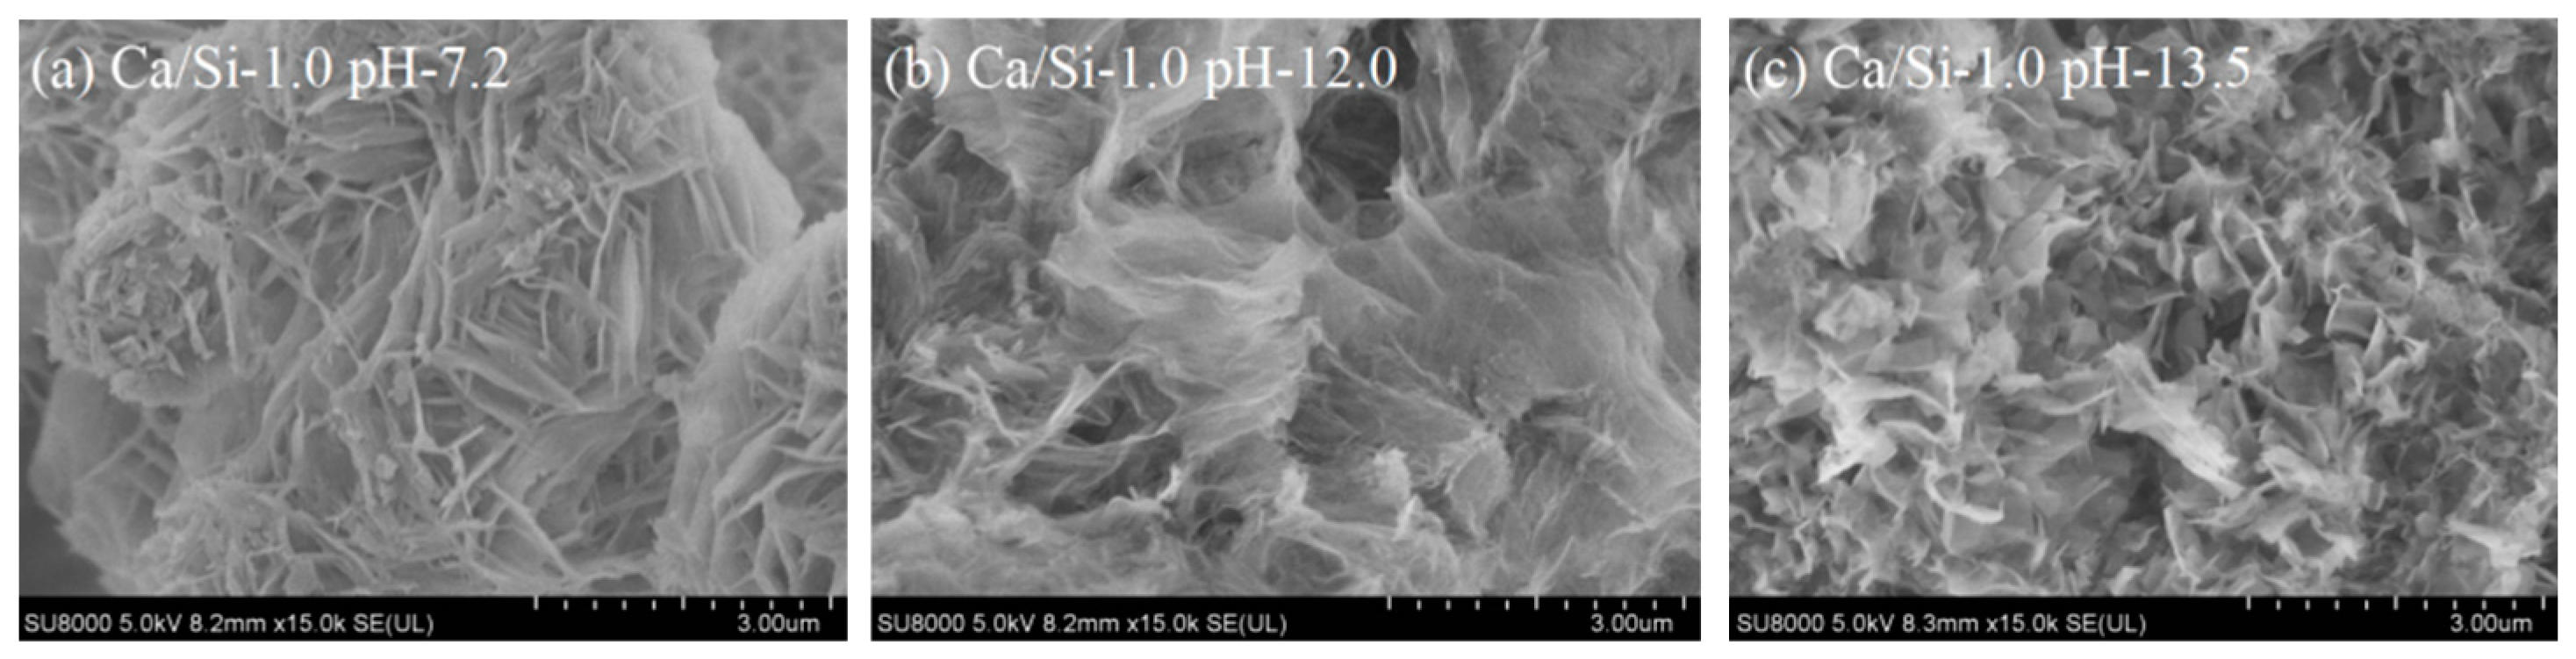
  • C-S-H synthesized under conditions of pH 7.2 to 12.0 and Ca/Si ratios of 1.0 to 2.3 are flocculent, fibrous, and needle-like structures with high crystallinity and mainly linked by Q1. At the same pH, increasing the Ca/Si ratio leads to an increase in the proportion of Q1. The C-S-H synthesized under conditions of pH 12.0 to 13.5 and Ca/Si ratios of 1.0 to 2.3 is closer to a poor crystallinity structure with a predominant Q1 group when the Ca/Si ratio approaches 1.6 to 2.3 and the pH approaches 13.5, resembling a short-chain structure of silicon-oxygen tetrahedron and exhibiting a porous structure. This is primarily attributed to the tendency of OH ions to protonate the silanol groups (>Si–OH), which facilitates the uptake of Ca2+ ions. This, in turn, weakens the extent of crosslinking between Si–OCa+ in Q1 and thus reduces the formation of Q2.
  • Under the pH ranging from 7.2 to 13.5 and Ca/Si ratio from 1.0 to 2.3, the C-S-H synthesized after 6 h of CO2 curing shows that an increase in Ca/Si ratio results in higher CO2 uptake by the C-S-H when the pH is between 7.2 and 12.0. However, once the pH reaches 13.5, there is no positive correlation between the CO2 uptake and Ca/Si ratio. Instead, C-S-H synthesized at a Ca/Si ratio of 1.0 exhibits the highest CO2 uptake (18.393 g/100 g). This can be attributed to two factors: first, the average pore diameter of C-S-H synthesized at high pH (13.5) is larger; second, the silicon-oxygen tetrahedral chains primarily consisting of Q2 units are more likely to release Ca2+ and participate in carbonation reactions.
The research results can provide a theoretical reference for optimizing the C-S-H seed crystal with excellent carbon fixation ability as an admixture to greatly improve the carbon fixation ability of cement-based materials while reducing the energy consumption and CO2 emission of cement production.

Author Contributions

Conceptualization, funding acquisition, methodology, J.G. and K.S.; writing—original draft, visualization, resources and validation, K.Z.; writing—review and editing, resources, G.X.; data curation, formal analysis, Y.Z. All authors have read and agreed to the published version of the manuscript.

Funding

This research was funded by the Natural Science Foundation of Xinjiang Uygur Autonomous Region Outstanding Youth Fund (2022D01E44) and Natural Science Foundation of China (52369025).

Data Availability Statement

The original contributions presented in the study are included in the article, further inquiries can be directed to the corresponding author.

Conflicts of Interest

The authors declare no conflicts of interest.

References

  1. Bertos, M.F.; Simons, S.J.R. A review of accelerated carbonation technology in the treatment of cement-based materials and sequestration of CO2. J. Hazard. Mater. 2004, 112, 193–205. [Google Scholar]
  2. Shtepenko, O.; Hills, C. The effect of carbon dioxide on β-dicalcium silicate and Portland cement. Chem. Eng. J. 2006, 118, 107–118. [Google Scholar]
  3. Monkman, S.; Shao, Y.-X. Assessing the carbonation behavior of cementitious materials. J. Mater. Civ. Eng. 2006, 18, 768–776. [Google Scholar]
  4. El-Hassan, H.; Shao, Y.-X. Carbon storage through concrete block carbonation curing. J. Clean Energy Technol. 2014, 2, 287–291. [Google Scholar]
  5. Liu, B.; Qin, J. New perspectives on utilization of CO2 sequestration technologies in cement-based materials. Constr. Build. Mater. 2021, 272, 121660. [Google Scholar]
  6. Wang, T.; Huang, H.; Hu, X.-T. Accelerated mineral carbonation curing of cement paste for CO2 sequestration and enhanced properties of blended calcium silicate. Chem. Eng. J. 2017, 323, 320–329. [Google Scholar] [CrossRef]
  7. Morandeau, A.; Thiery, M. Investigation of the carbonation mechanism of CH and C-S-H in terms of kinetics, microstructure changes and moisture properties. Cem. Concr. Res. 2014, 56, 153–170. [Google Scholar]
  8. Justnes, H.; Skocek, J. Microstructural changes of hydrated cement blended with fly ash upon carbonation. Cem. Concr. Res. 2020, 137, 106192. [Google Scholar]
  9. Visser, J.H.M. Influence of the carbon dioxide concentration on the resistance to carbonation of concrete. Constr. Build. Mater. 2014, 67, 8–13. [Google Scholar] [CrossRef]
  10. Li, L.; Liu, Q. Dimensional change of cement paste subjected to carbonation in CO2 sequestration and utilization context: A critical review on the mechanisms. J. CO2 Util. 2023, 70, 102444. [Google Scholar] [CrossRef]
  11. Richardson, I.G. The nature of the hydration products in hardened cement pastes. Cem. Concr. Compos. 2000, 22, 97–113. [Google Scholar] [CrossRef]
  12. Bullard, J.W.; Jennings, H.M. Mechanisms of cement hydration. Cem. Concr. Res. 2011, 41, 1208–1223. [Google Scholar] [CrossRef]
  13. Stark, J. Recent advances in the field of cement hydration and microstructure analysis. Cem. Concr. Res. 2011, 41, 666–678. [Google Scholar] [CrossRef]
  14. Chang, J.; Fang, Y.-F. Effects of calcium to silicon ratios on accelerating carbonation of calcium silicate hydrate. J. Chin. Ceram. Soc. 2014, 42, 1377–1382. [Google Scholar]
  15. Liu, X.; Feng, P. Effects of pH on the nano/micro structure of calcium silicate hydrate (C-S-H) under sulfate attack. Cem. Concr. Res. 2021, 140, 106306. [Google Scholar] [CrossRef]
  16. ROSENQVIST, M.; BERTRON, A. Concrete alteration due to 55 years of exposure to river water: Chemical and mineralogical characterisation. Cem. Concr. Res. 2017, 92, 110–120. [Google Scholar] [CrossRef]
  17. Chen, Y.-Z.; Zhong, H.-X. Effect of Calcium-Silicon Ratio of Calcium Silicate Hydrate on Its Structure, Zeta Potential and Adsorption Capacity of Superplasticizer. Bull. Chin. Ceram. Soc. 2020, 39, 1798–1804. [Google Scholar]
  18. He, Y.; Zhao, X. Effect of C/S ratio on morphology and structure of hydrothermally synthesized calcium silicate hydrate. J Wuhan Univ Technol. 2011, 26, 770–773. [Google Scholar] [CrossRef]
  19. Zhang, Z.-W.; Liu, Z.-T. Decalcification Behavior of Calcium Silicate Hydrate with Different Ca/Si Ratios. J. Chin. Ceram. Soc. 2023, 51, 2924–2930. [Google Scholar]
  20. Matsuyama, H.; Young, J.F. Effects of pH on precipitation of quasi-crystalline calcium silicate hydrate in aqueous solution. Adv. Cem. Res. 2000, 12, 29–33. [Google Scholar] [CrossRef]
  21. Duque-Redondo, E.; Bonnaud, P.A. A comprehensive review of C-S-H empirical and computational models, their applications, and practical aspects. Cem. Concr. Res. 2022, 156, 106784. [Google Scholar]
  22. Chen, J.J.; Thomas, J.J. Solubility and structure of calcium silicate hydrate. Cem. Concr. Res. 2004, 34, 1499–1519. [Google Scholar]
  23. Ntafalias, E.; Koutsoukos, P.G. Spontaneous precipitation of calcium silicate hydrate in aqueous solutions. Cryst. Res. Technol. 2010, 45, 39–47. [Google Scholar]
  24. Shen, X.; Feng, P. Toward the formation mechanism of synthetic calcium silicate hydrate (C-S-H)-pH and kinetic considerations. Cem. Concr. Res. 2023, 172, 107248. [Google Scholar]
  25. Liu, X.; Feng, P. Carbonation behavior of calcium silicate hydrate (C-S-H): Its potential for CO2 capture. Chem. Eng. J. 2022, 431, 134243. [Google Scholar]
  26. Steiner, S.; Lothenbach, B. Effect of relative humidity on the carbonation rate of portlandite, calcium silicate hydrates and ettringite. Cem. Concr. Res. 2020, 135, 106116. [Google Scholar]
  27. Black, L.; Garbev, K. Surface carbonation of synthetic C-S-H samples: A comparison between fresh and aged C-S-H using X-ray photoelectron spectroscopy. Cem. Concr. Res. 2008, 38, 745–750. [Google Scholar]
  28. Li, J.; Yu, Q.J. Effects of Ca/Si ratio, aluminum and magnesium on the carbonation behavior of calcium silicate hydrate. Materials 2019, 12, 1268. [Google Scholar] [CrossRef]
  29. Sevelsted, T.F.; Skibsted, J. Carbonation of C–S–H and C–A–S–H samples studied by 13C, 27Al and 29Si MAS NMR spectroscopy. Cem. Concr. Res. 2015, 71, 56–65. [Google Scholar]
  30. Wu, B.; Ye, G. Carbonation mechanism of different kind of C-S-H: Rate and products. In Proceedings of the RILEM Conference on Materials, Systems and Structures in Civil Engineering 2016-Segment on Concrete with Supplementary Cementitious Materials, Hong Kong, China, 9 September 2016. [Google Scholar]
  31. Lei, Y.S.; Han, T.; Wang, H.Q. Preparation and characterization of calcium silicate hydrate (C-S-H) synthesized by the hydrothermal method. Bull. Chin. Ceram. Soc. 2014, 33, 465–469. [Google Scholar]
  32. Zhu, Y.Y.; Zhu, G.Y.; Qi, F. Research progress on preparation and comprehensive utilization of solid waste based calcium silicate hydrates. Bull. Chin. Ceram. Soc. 2024, 43, 517–531. [Google Scholar]
  33. Zeng, L.; He, M.; Mao, D. Influence of hydrothermal synthesis conditions on pore structure of calcium silicate hydrates. Non-Met. Mines 2017, 40, 10–13. [Google Scholar]
  34. Tajuelo, R.E.; Richardson, I.G. Composition, silicate anion structure and morphology of calcium silicate hydrates (C-S-H) synthesized by silica-lime reaction and by controlled hydration of tricalcium silicate (C3S). Adv. Appl. Ceram. 2015, 114, 362–371. [Google Scholar] [CrossRef]
  35. Xie, J.; Yang, F.; Tan, N. Calcium sulphoaluminate cement from solid waste with nano-TiO2 addition for high-efficiency CO2 capture. Constr. Build. Mater. 2023, 367, 130267. [Google Scholar]
  36. Lu, B.; He, P.; Liu, J. Microstructure of Portland cement paste subjected to different CO2 concentrations and further water curing. J. CO2 Util. 2021, 53, 101714. [Google Scholar]
  37. Khan, R.I.; Ashraf, W.; Olek, J. Amino acids as performance-controlling additives in carbonation-activated cementitious materials. Cem. Concr. Res. 2021, 147, 106501. [Google Scholar]
  38. Zelić, J.; Rušić, D.; Krstulović, R. Kinetic analysis of thermal decomposition of Ca(OH)2 formed during hydration of commercial Portland cement by DSC. J. Therm. Anal. Calorim. 2002, 67, 613–622. [Google Scholar]
  39. Francioso, V.; Moro, C.; Martinez-Lage, I. Curing temperature: A key factor that changes the effect of TiO2 nanoparticles on mechanical properties, calcium hydroxide formation and pore structure of cement mortars. Cem. Concr. Comp. 2019, 104, 103374. [Google Scholar]
  40. Plank, J.; Schönlein, M. Study on the early crystallization of calcium silicate hydrate (C-S-H) in the presence of polycarboxylate superplasticizers. J. Organomet. Chem. 2018, 869, 227–232. [Google Scholar]
  41. Kanchanason, V.; Plank, J. Role of pH on the structure, composition and morphology of C-S-H–PCE nanocomposites and their effect on early strength development of Portland cement. Cem. Concr. Res. 2017, 102, 90–98. [Google Scholar]
  42. Black, L.; Breen, C. Structural features of C–S–H (I) and its carbonation in air–a Raman spectroscopic study. Part II: Carbonated phases. J. Am. Ceram. 2007, 90, 908–917. [Google Scholar] [CrossRef]
  43. Yan, Y.; Yang, S.Y.; Miron, G.D. Effect of alkali hydroxide on calcium silicate hydrate (CSH). Cem. Concr. Res. 2022, 151, 106636. [Google Scholar] [CrossRef]
  44. Wu, J.; Liao, H.; Ma, Z. Effect of different initial CaO/SiO2 molar ratios and curing times on the preparation and formation mechanism of calcium silicate hydrate. Materials 2023, 16, 717. [Google Scholar] [CrossRef]
  45. La Plante, E.C.; Oey, T. Enhancing silicate dissolution kinetics in hyperalkaline environments. J. Phys. Chem. C 2019, 123, 3687–3695. [Google Scholar] [CrossRef]
  46. Garg, N.; Özçelik, V.O. Nanoscale ordering and depolymerization of calcium silicate hydrates in the presence of alkalis. J. Phys. Chem. C 2019, 123, 24873–24883. [Google Scholar] [CrossRef]
  47. Dupuis, R.; Pellenq, R. Dissociation mechanisms of dissolved alkali silicates in sodium hydroxide. J. Phys. Chem. C 2020, 124, 8288–8294. [Google Scholar] [CrossRef]
  48. Zhang, X.-Q.; Trinh, T.T. Mechanism of the initial stage of silicate oligomerization. J. Am. Chem. Soc. 2011, 133, 6613–6625. [Google Scholar] [CrossRef]
  49. Li, D.-K.; Zhao, W.-Y. Molecular dynamics study on the chemical bound, physical adsorbed and ultra-confined water molecules in the nano-pore of calcium silicate hydrate. Constr. Build. Mater. 2017, 151, 563–574. [Google Scholar] [CrossRef]
Figure 1. TG/DTG curves.
Buildings 15 01264 g001
Figure 2. XRD pattern of synthesized C-S-H samples.
Buildings 15 01264 g002
Figure 3. SEM images of C-S-H under different alkalinities and Ca/Si ratios.
Buildings 15 01264 g003aBuildings 15 01264 g003b
Figure 4. CO2 uptake by the synthesized C-S-H.
Buildings 15 01264 g004
Figure 5. Crystallinity index of the synthesized C-S-H from the XRD pattern.
Buildings 15 01264 g005
Figure 6. 29Si MAS NMR test results of C-S-H samples: (a) Ca/Si = 1.0H; (b) Ca/Si = 2.3H; and (c) Ca/Si = 2.3W.
Buildings 15 01264 g006
Figure 7. Schematic diagram of the influence of different alkalinities and Ca/Si ratios on the nano-structural characteristics of C-S-H.
Buildings 15 01264 g007
Figure 9. Average pore diameter and CO2 uptake of synthesized C-S-H.
Buildings 15 01264 g009
Figure 10. Fitting results of average pore diameter and CO2 uptake of synthesized C-S-H.
Buildings 15 01264 g010
Figure 11. 29Si MAS NMR results of synthesized C-S-H samples after CO2 curing: (a) 1.0HC and (b) 2.3HC.
Buildings 15 01264 g011
Figure 12. Schematic diagram of nanostructural variations of synthesized C-S-H under CO2 Curing.
Buildings 15 01264 g012
Table 1. Synthesis ratio and testing methods of C-S-H.
Sample No.Ca/SipH
1.0W1.07.2
1.0L1.012
1.0H1.013.5
1.6W1.67.2
1.6L1.612
1.6H1.613.5
2.3W2.37.2
2.3L2.312
2.3H2.313.5
1.0LC1.012
1.0HC1.013.5
1.6WC1.67.2
1.6LC1.612
2.3WC2.37.2
2.3HC2.313.5
Notes: 1.0, 1.6 and 2.3 in the table represent the initial Ca/Si ratio for the synthesis of C-S-H; W represents the initial pH = 7.2; L represents the initial pH = 12; H represents the initial pH = 13.5; C represents the synthetic C-S-H cured by CO2.
Table 2. Proportions of Qn in C-S-H samples.
Sample No. Q 1 Q b 2 Q p 2 Q 3 Q 4 MCL
(ppm)(%)(ppm)(%)(ppm)(%)(ppm)(%)(ppm)(%)
1.0 H−78.840.2−82.324.6−84.535.2/ / 5.0
2.3 H−78.459.0−81.814.2−84.726.7/ / 3.4
2.3 W−79.250.2−82.19.3−84.940.5/ / 4.0
Table 3. Qn proportions of C-S-H samples after CO2 curing.
Sample No. Q 1 Q b 2 Q p 2 Q 3 Q 4 MCL
(ppm)(%)(ppm)(%)(ppm)(%)(ppm)(%)(ppm)(%)
1.0 H−78.840.2−82.324.6−84.535.2/ / 5.0
2.3 H−78.459.0−81.814.2−84.726.7/ / 3.4
1.0 HC−79.11.5−82.00.8−85.018.9−99.055.2−109.723.6135.2
2.3 HC−79.37.8−82.70.8−84.937.4−97.442.6−108.911.425.5
Disclaimer/Publisher’s Note: The statements, opinions and data contained in all publications are solely those of the individual author(s) and contributor(s) and not of MDPI and/or the editor(s). MDPI and/or the editor(s) disclaim responsibility for any injury to people or property resulting from any ideas, methods, instructions or products referred to in the content.

