Article

Sulphoaluminate-Aluminate Cement-Based Composites: Mechanical Behaviors and Negative Poisson’s Ratio Mechanism Under Static Loads

1
School of Civil Engineering, Qingdao University of Technology, Qingdao 266520, China
2
Department of Automobile Roads, Don State Technical University, Rostov-on-Don 344000, Russia
3
Engineering Research Center of Concrete Technology Under Marine Environment, Ministry of Education, Qingdao 266520, China
*
Authors to whom correspondence should be addressed.
Buildings 2025, 15(8), 1251; https://doi.org/10.3390/buildings15081251
Submission received: 17 March 2025 / Revised: 6 April 2025 / Accepted: 8 April 2025 / Published: 10 April 2025

Abstract

Because of their excellent properties, calcium aluminate cement (CAC) and sulphoaluminate cement (SAC), as building materials, have been used in infrastructure construction. However, due to the defects in microstructure, their application and development have been limited. In this study, we explored the negative Poisson’s ratio modification design of cement-based composites by changing the ratio of composite cement’s raw materials and adjusting the stacking method of crystals. On this basis, three types of crystal modifiers were added into cement-based composites. Then, compression and tensile tests were performed to explore the effect of crystal modifiers on the structure of negative Poisson’s ratio. The deformation behavior of the specimens under static load was performed by the digital speckle correlation method (DSCM). The results show that Formula 4 (the mass ratio of CAC is 30% and SAC is 70%) was the most effective in optimizing mechanical properties. In addition, the morphology of crystallization products confirmed that the addition of the crystal modifiers would affect the formation of negative Poisson’s ratio structure. According to the mechanical properties and microstructure, adipic acid is the best crystal modifier. With the mechanism of the negative Poisson’s ratio effect of cement-based composites being analyzed, two crystal stacking modes were predicted, and an ideal calculation model was obtained.

1. Introduction

In addition to ordinary Portland cement, the most widely used are special cements such as CAC and SAC owing to their unique properties [1,2,3]. CAC is mainly composed of calcium aluminate, high in early hydration rate [4] and strength [5,6]. However, hydrates are transformed over time [7,8], and the strength of CAC in the later stage is lower than that in the early stage, which limits its widespread application in engineering [9]. SAC is mainly composed of anhydrous calcium sulphoaluminate and dicalcium silicate [10,11]. It is excellent in frost resistance, corrosion resistance, impermeability, and steel bar adaptability [12,13].
Therefore, it is necessary to conduct a diversified combination of the microstructure of cement-based materials with other various materials. With their unique cellular structure [14,15,16], negative Poisson’s ratio materials have excellent mechanical properties [17], fracture toughness [18,19], and great capacity in energy absorption [20,21]. Therefore, because of its unique deformation mechanism [22,23], it is the development trend of building materials to introduce the concept of negative Poisson’s ratio into infrastructure construction [24,25,26,27].
In the field of negative Poisson’s ratio materials, concave polygonal structures have been widely studied due to their promise for large-scale applications in engineering environments [28,29,30]. Lee et al. [31] found that negative Poisson’s ratio structures make the system absorb more energy during the impact resistance process. Fang et al. [32] proposed a subdomain size optimization method to design specimens with negative Poisson’s ratio honeycomb structure and performed three-point bending tests, and the results showed that specimens with negative Poisson’s ratio structure have a greater load carrying capacity with a relatively lighter weight. Ha et al. [33] found that Poisson’s ratio is related to the geometric shape of the lattice and can be adjusted to a negative value. Lv et al. [34] introduced boundary effects when studying folding mechanical materials and changed their negative Poisson’s ratio by adjusting the angle and height of the structure. Izadifar et al. [35] used reduced graphene oxide to form reinforced cementitious nanocomposites and found that hydroxyl/rGO layers significantly improved the elastic constants of the composites. Moreover, the negative Poisson’s ratio effect on the cement matrix can be improved by introducing auxetic reinforcements, architecting the crystals in the cement matrix into auxetic geometries [36]. Many researchers have modulated the Poisson’s ratio of materials by crystal modifiers. Li et al. [37] added NaCl into polypropylene resin to prepare swelling foam. The results show that the content of NaCl can regulate the magnitude of the negative Poisson’s ratio in the composite material. The Poisson’s ratio of materials varies with the changes in the crystal axis, accompanied by structural transitions and other physical properties [38]. Even large and anisotropic materials also showed a negative Poisson’s ratio along the direction of the specific crystal [39]. The Poisson’s ratio of blocks or film materials were adjusted by external factors such as chemical composition, temperature, electric field, pressure, and mismatch strain. Among these factors, the practical feasibility lies in altering the chemical composition of the base material to modify its crystal structure and induce a negative Poisson’s ratio phenomenon. Crystals with special structures, such as silicon dioxide and silicate, have been shown to exhibit negative Poisson’s ratio effects [24].
The properties of cementitious materials can be improved by regulating the hydration process [40]. Gastaldi et al. [41] investigated the hydration behavior of composite cements containing calcium sulfoaluminate cements to obtain a binder with good mechanical properties. However, there is a relative lack of research on regulating the Poisson’s ratio of cementitious materials. In this paper, the concept of negative Poisson’s ratio is introduced into composite cementitious materials, and a cementitious composite of SAC-CAC with strong structural stability is developed by regulating the crystalline morphology of hydration products, with the help of superior mechanical properties and high energy absorption capacity of negative Poisson’s ratio materials. The cement matrix is composed of cementitious materials and crystalline materials. The shape of cementing materials is irregular [42], while that of crystals is unique and symmetrical. Therefore, compared to cementitious materials, designing a negative Poisson’s ratio in the microstructure of crystals is relatively achievable. The main hydration product of CAC is calcium aluminate hydrate [7], which belongs to the hexagonal and equiaxed crystal systems, whose shape is sheets, needles, and monoclinic dodecahedrons, among others. The main hydration product of SAC is calcium sulphoaluminate hydrate [43], which belongs to the hexagonal or pseudohexagonal crystal system, whose shape is acicular or hexagonal lamellar. The negative Poisson’s ratio materials are various in structures, such as concave polygons, rotating rigid bodies, and node-fiber structure. Therefore, it is feasible to mix and arrange the hydration products of the two types of cement in a certain proportion to achieve the characteristics of a negative Poisson’s ratio material.
In the study, the ratio of raw materials was changed, and the crystal combination arrangement was adjusted to explore the negative Poisson’s ratio modification design of cement-based composites. On this basis, three different types of crystal regulators were added into cement-based composites to explore the effect of crystal regulators on the negative Poisson’s ratio structure. Scanning electron microscopy (SEM) and transmission electron microscope (TEM) were used to characterize the microstructure of the material and obtain the crystal morphology and stacking mode on the inside. The DSCM and ANSYS were used to characterize its microstructure deformation mode. The purpose of this study is to develop a new type of cement-based composite, which not only possesses the excellent properties of CAC and SAC but also acquires the properties of negative Poisson’s ratio structure.

2. Materials and Methods

2.1. Materials

The cements used in this test were CAC (P.O 42.5 MPa, produced by Wuxi Cheng Yuexiang Building Materials Co., Ltd., Wuxi, China) and SAC (CA-50A700 type, produced by Zhengzhou Jiannai Special Aluminate Co., Ltd., Zhengzhou, China) The chemical composition of cements is shown in Table 1. The mineralogical composition of the raw cements is shown in Table 2. Sodium sulfate [44,45], adipic acid [46], and gelatin [47] can be used as crystal modifiers to attach to the crystal surface and affect the crystal habit. Therefore, these three crystal modifiers were selected, the purity of which is analytically pure, and are used by the East China Chemical Glass Instrument Co., Qingdao, China. The specific content of the crystal modifier is determined to be 0.20%.

2.2. Sample Design and Preparation

2.2.1. Mixing Design

Eleven specimens with different formulations of SAC-CAC were used to perform a negative Poisson’s ratio design, and the water–cement ratio was 0.45. The specific formula is shown in Table 3. The best ratio of mechanical properties is shown in Formula (4) (the mass ratio of CAC is 30%) by testing the basic mechanical properties of the 11 specimens. Secondly, six different batches of the specimens were designed to explore the effect of crystal modifiers on the material structure on the basis of Formula (4). The specific formula is shown in Table 4.

2.2.2. Preparation and Maintenance

The detailed preparation of Formulations (1)–(11) is as follows. First, SAC and CAC were adequately combined in different ratios. Secondly, the cement and admixture were stirred at low speed to ensure adequate mixing. Finally, the cement-based composites were loaded into the molds for 1d before demolding. The test blocks were placed in a standard curing room with a temperature of 20 °C ± 2 °C and relative humidity of 95%RH for 1d, 3d, 7d, 14d, and 28d. After the test blocks were taken out, the compression, tensile strength, and three-point bending toughness were tested according to the experimental protocol.
The detailed preparation of the specimens for the deformation test is as follows. Firstly, the SAC and CAC were adequately combined. Secondly, crystal modifiers were gradually added to water. Thirdly, the mixer was poured into the cement and mixed evenly. Fourthly, the remaining water was poured into the cement. The dry and wet materials were mixed evenly by high-speed mixing for 40~80 s. Finally, the composite cement was loaded into the molds for 1d before demolding. The test blocks were placed in a standard curing room with a temperature of 20 °C ± 2 °C and relative humidity of 95%RH for 28d. After the test blocks were taken out, the compression and tensile strength was tested.

2.3. Test Method

2.3.1. Mechanical Property Test

The mechanical properties of cement-based composites were measured by electronic universal testing machines. All tests were performed according to the national standard GB/T50081-2016 [48]. The size of the compression and bending test specimens was 40 mm × 40 mm × 160 mm, that of the tensile test specimens was 330 mm × 60 mm × 15 mm, and the size of the tensile part was 80 mm × 30 mm × 15 mm.

2.3.2. Deformation Behavior Test

The deformation behavior of cement-based composites was characterized by the digital speckle correlation method [49,50]. DSCM has been shown to overcome the limitations of traditional displacement/strain measurement techniques [51,52]. The experiments were conducted using the HN-0816-5M-C2/3X CCD produced by China Daheng (Group) Co., Ltd., Beijing, China, and the FASTCAM SA-Z high-speed camera produced by Photron Corporation of Japan, Tokyo, Japan, for image acquisition. The acquired images of each stage were imported into Vic-2D 4.2 software to draw the displacement distribution field image and strain distribution field image of the specimen.

2.3.3. Finite Element Simulation

The lattice model of negative Poisson’s ratio crystal was proposed by the microstructure and morphology of the specimens. The finite element simulation software ANSYS 15.0 was used to predict the theoretical deformation behavior of the lattice model. The relationship between the computational model and theoretical model was determined by the comparison of the Poisson’s ratio of the model.

2.3.4. Microstructure Test

A scanning electron microscope (TESCAN VEGA3-SBH, produced by Beijing Oubotong Optical Technology Co., Ltd., Beijing, China) was used to obtain the microstructure images. The morphology and composition of the surface ultrastructure of cement-based composites were observed using the microstructure images, and the internal morphology and stacking mode of crystals were obtained. Using a transmission electron microscope (JEM-ARM300F2, produced by Japan Electronics Co., Ltd., Tokyo, Japan), the microscopic morphologic structure of individual crystals of the sample was observed.

3. Results and Discussion

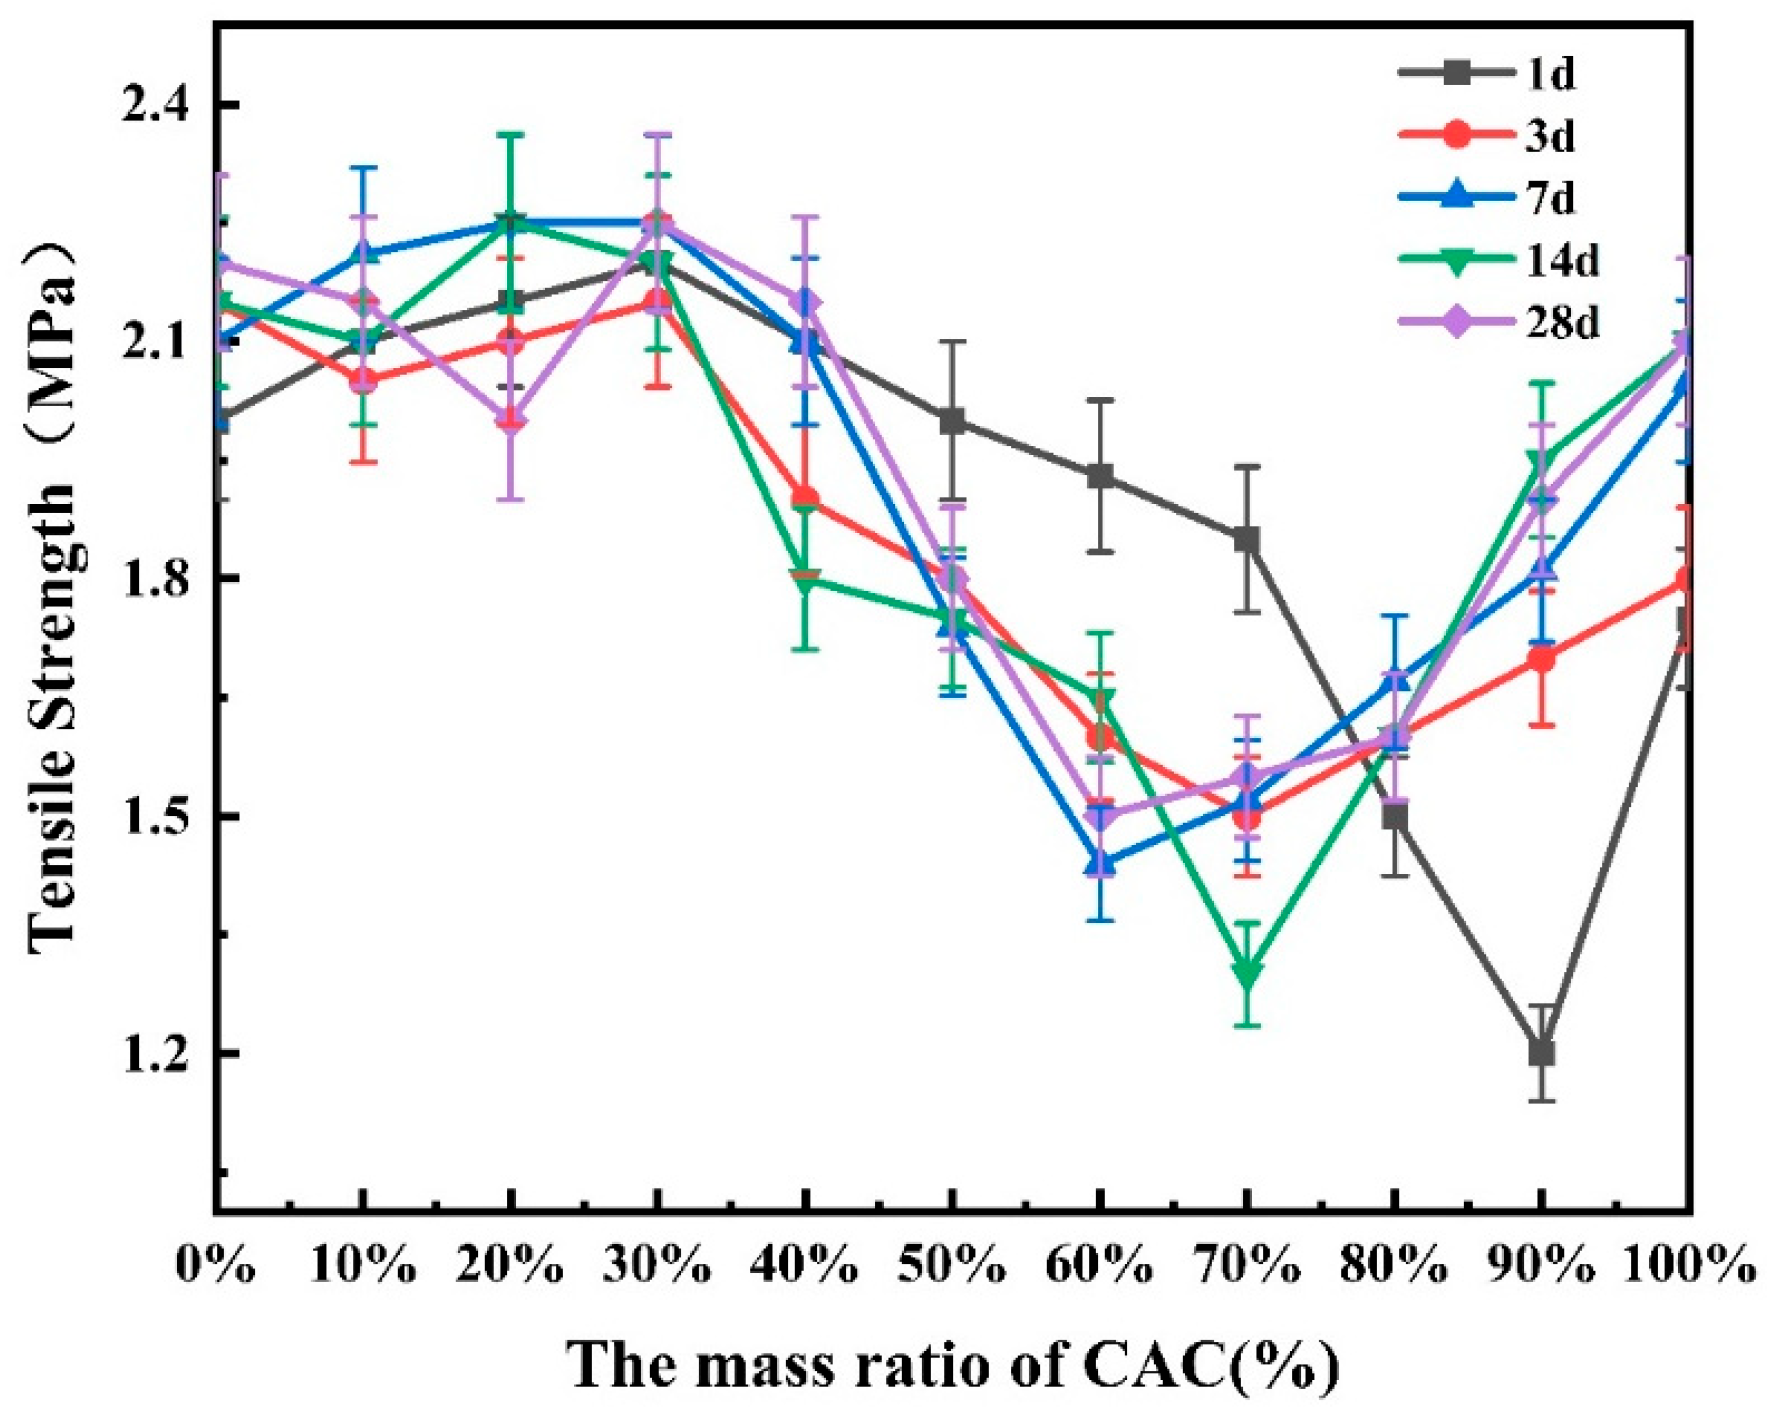
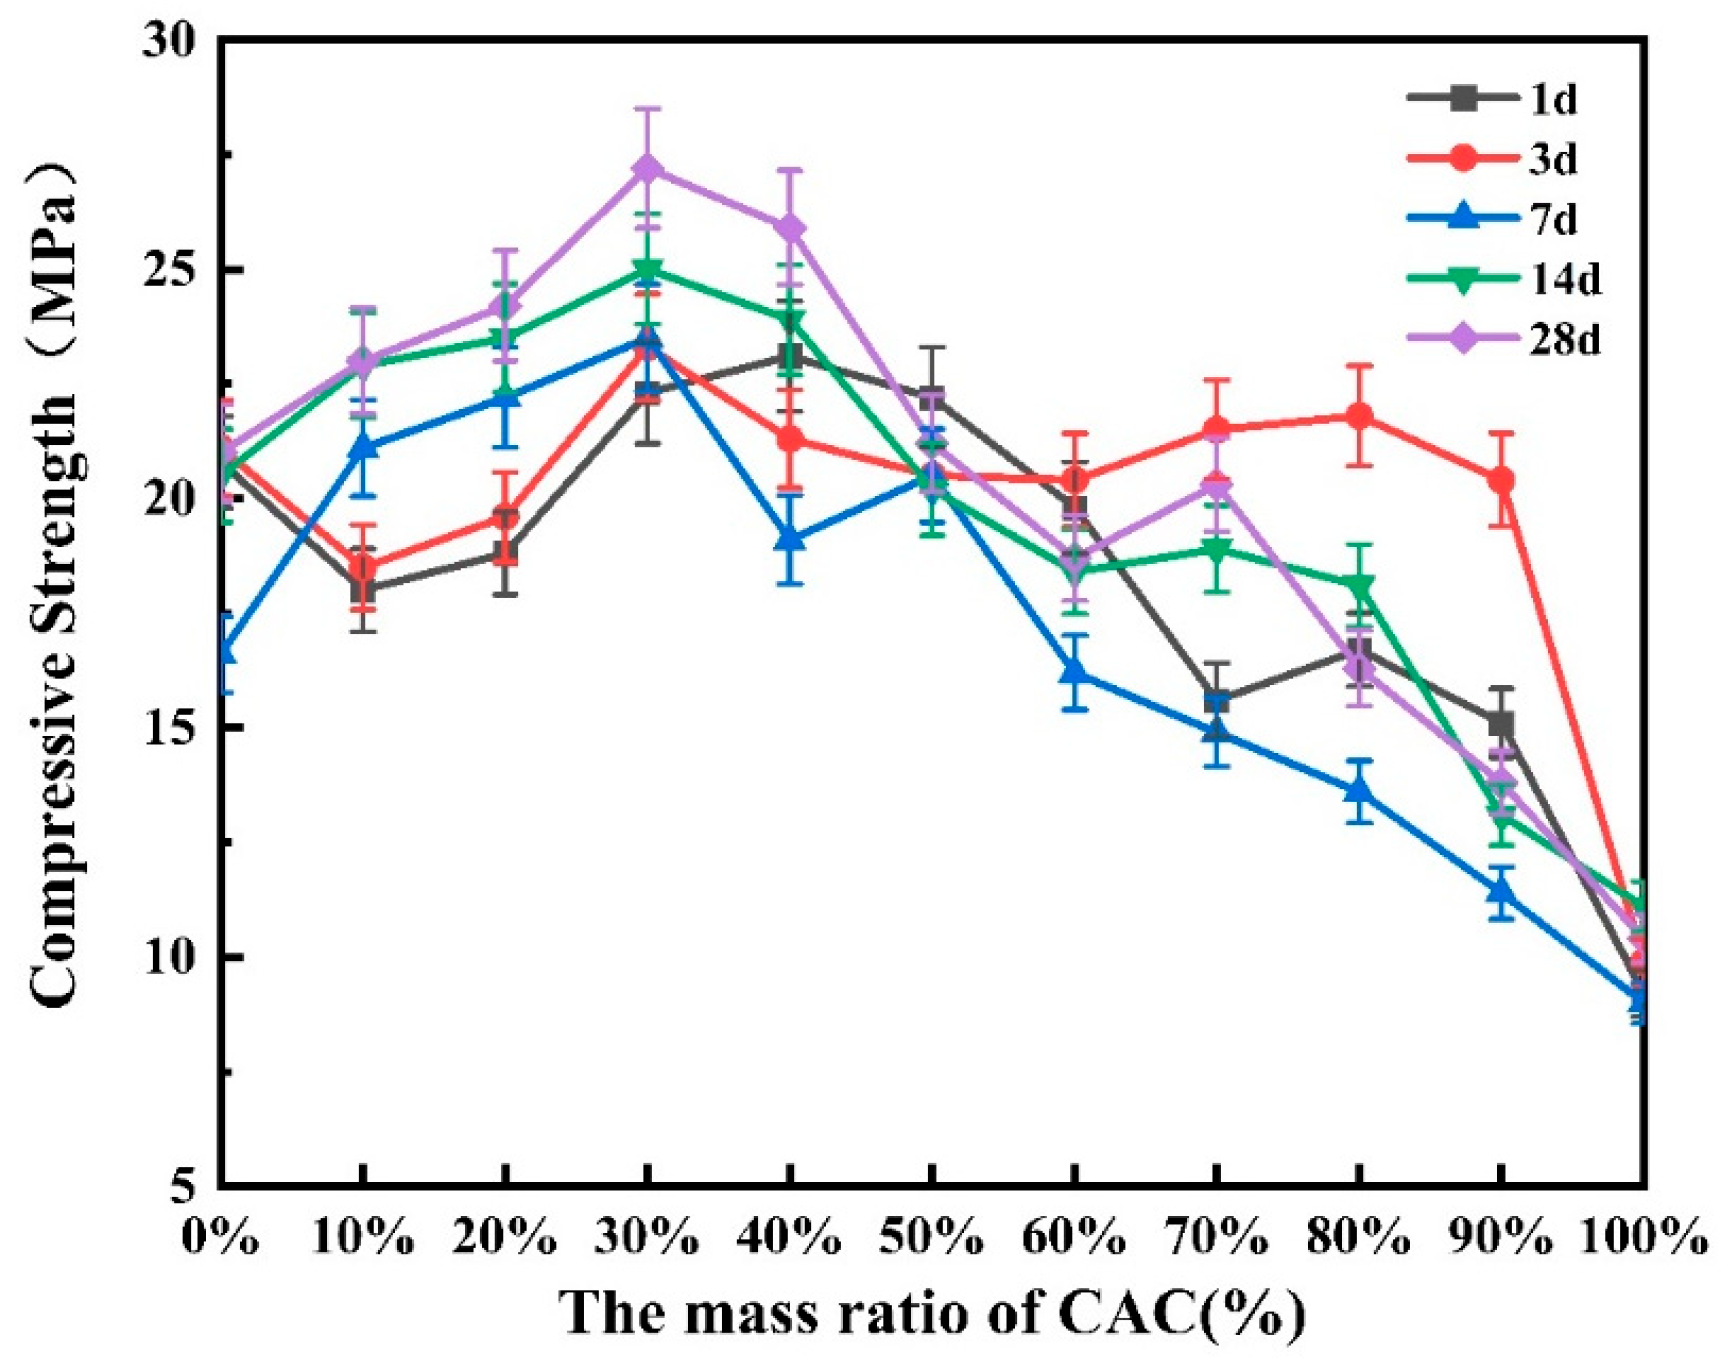
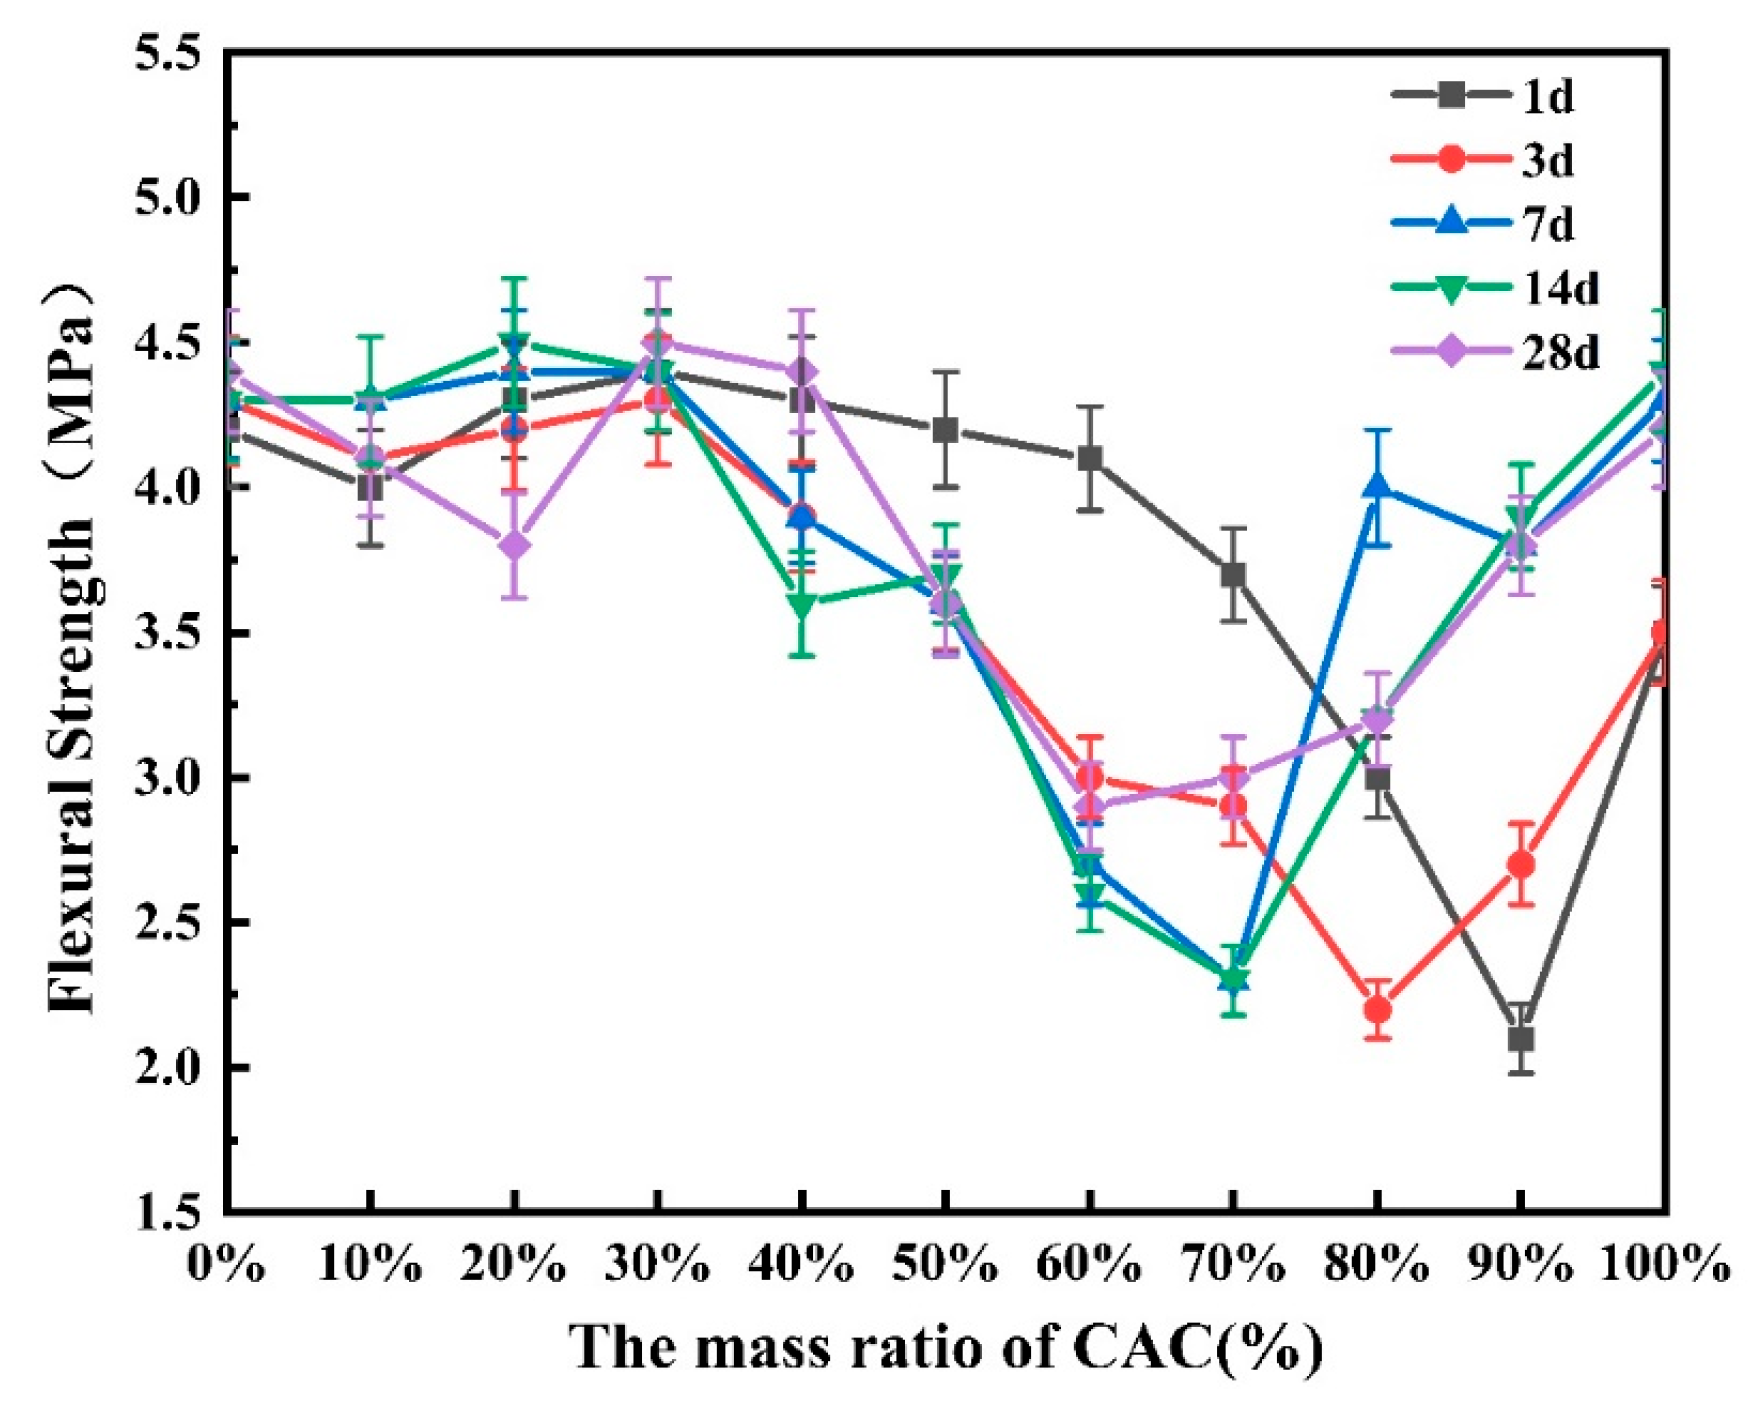
3.1. Mechanical Properties of SAC-CAC Composite Cement Under Different Proportions

Eleven groups of the specimens in Table 3 were prepared, and their tensile, compressive, and flexural strengths were tested. The tensile strength results of the SAC-CAC composites are shown in Figure 1. It can be seen that the change in tensile strength of cement-based composites at different curing periods follows the law of “increase-decrease-increase”. The tensile strength increases slowly when the proportion of CAC was less than 30% and then decreases sharply when the proportion of CAC was 30~90%. After that, it increases all the time. It can be seen that the tensile strength of composite cement reached the maximum when the CAC content is 20% and 30% at different curing periods. Among them, the tensile strength of the cement-based composites reached a maximum of 2.24 MPa when the CAC mass ratio is 30%. The tensile strength of SAC-CAC composites increased by 1.82% and 6.67% in a 28-day curing period compared to SAC and CAC, respectively.
Figure 2 shows the compressive strength results of the SAC-CAC composites. It can be seen that the change in compressive strength of cement-based composites follows the law of “increase-decrease” at different curing periods. When the CAC content is less than 30%, the compressive strength of cement-based composites increased, and after the CAC content reaches 30%, the compressive strength decreased significantly. The compressive strength of the cement-based composites reached a maximum of 27.2 MPa when the CAC mass ratio is 30%. The compressive strength of SAC-CAC composites increased by 28.94% and 161.54% in 28 days compared to that of SAC and CAC, respectively.
Figure 3 illustrates the flexural strength results of the SAC-CAC composites. It can be seen that the change in flexural strength of cement-based composites follows the law of “stable-decrease-increase” at different curing periods. The curve of tensile strength is stable when the proportion of CAC is less than 30%. The curve decreased sharply when the proportion of CAC was 30~90% and then increased all the time. The flexural strength of composite cement reached the maximum when the CAC mass ratio was 30% at different curing periods. Among them, the flexural strength of the cement-based composites reached a maximum of 4.5 MPa when the CAC mass ratio was 30%. The flexural strength of SAC-CAC composites increased by 2.27% and 7.14% in 28 days compared to that of SAC and CAC, respectively. Because CAC hydration is extremely fast, there is an early generation of CAH10, C2AH8, and other hydrides, the formation of a crystal intertwined structure, and faster formation of early strength. AFt and C-S-H gel are generated during hydration of SAC. Calcite is a needle-like crystal which fills the pores and forms a dense network structure, and the late strength continues to grow, while C-S-H gel wraps the crystals and enhances the interfacial bonding, and the product is highly stabilized, which improves the problem of the decline in the late strength of a single CAC, and improves the overall strength.
Formula (4) (30% CAC with 70% SAC) was the most effective in optimizing the mechanical properties of the 11 kinds of CAC-SAC composites. Based on this formulation, three different types of crystalline modifiers were added (as shown in Table 5) to investigate the mechanical performance and deformation behavior of the specimens.

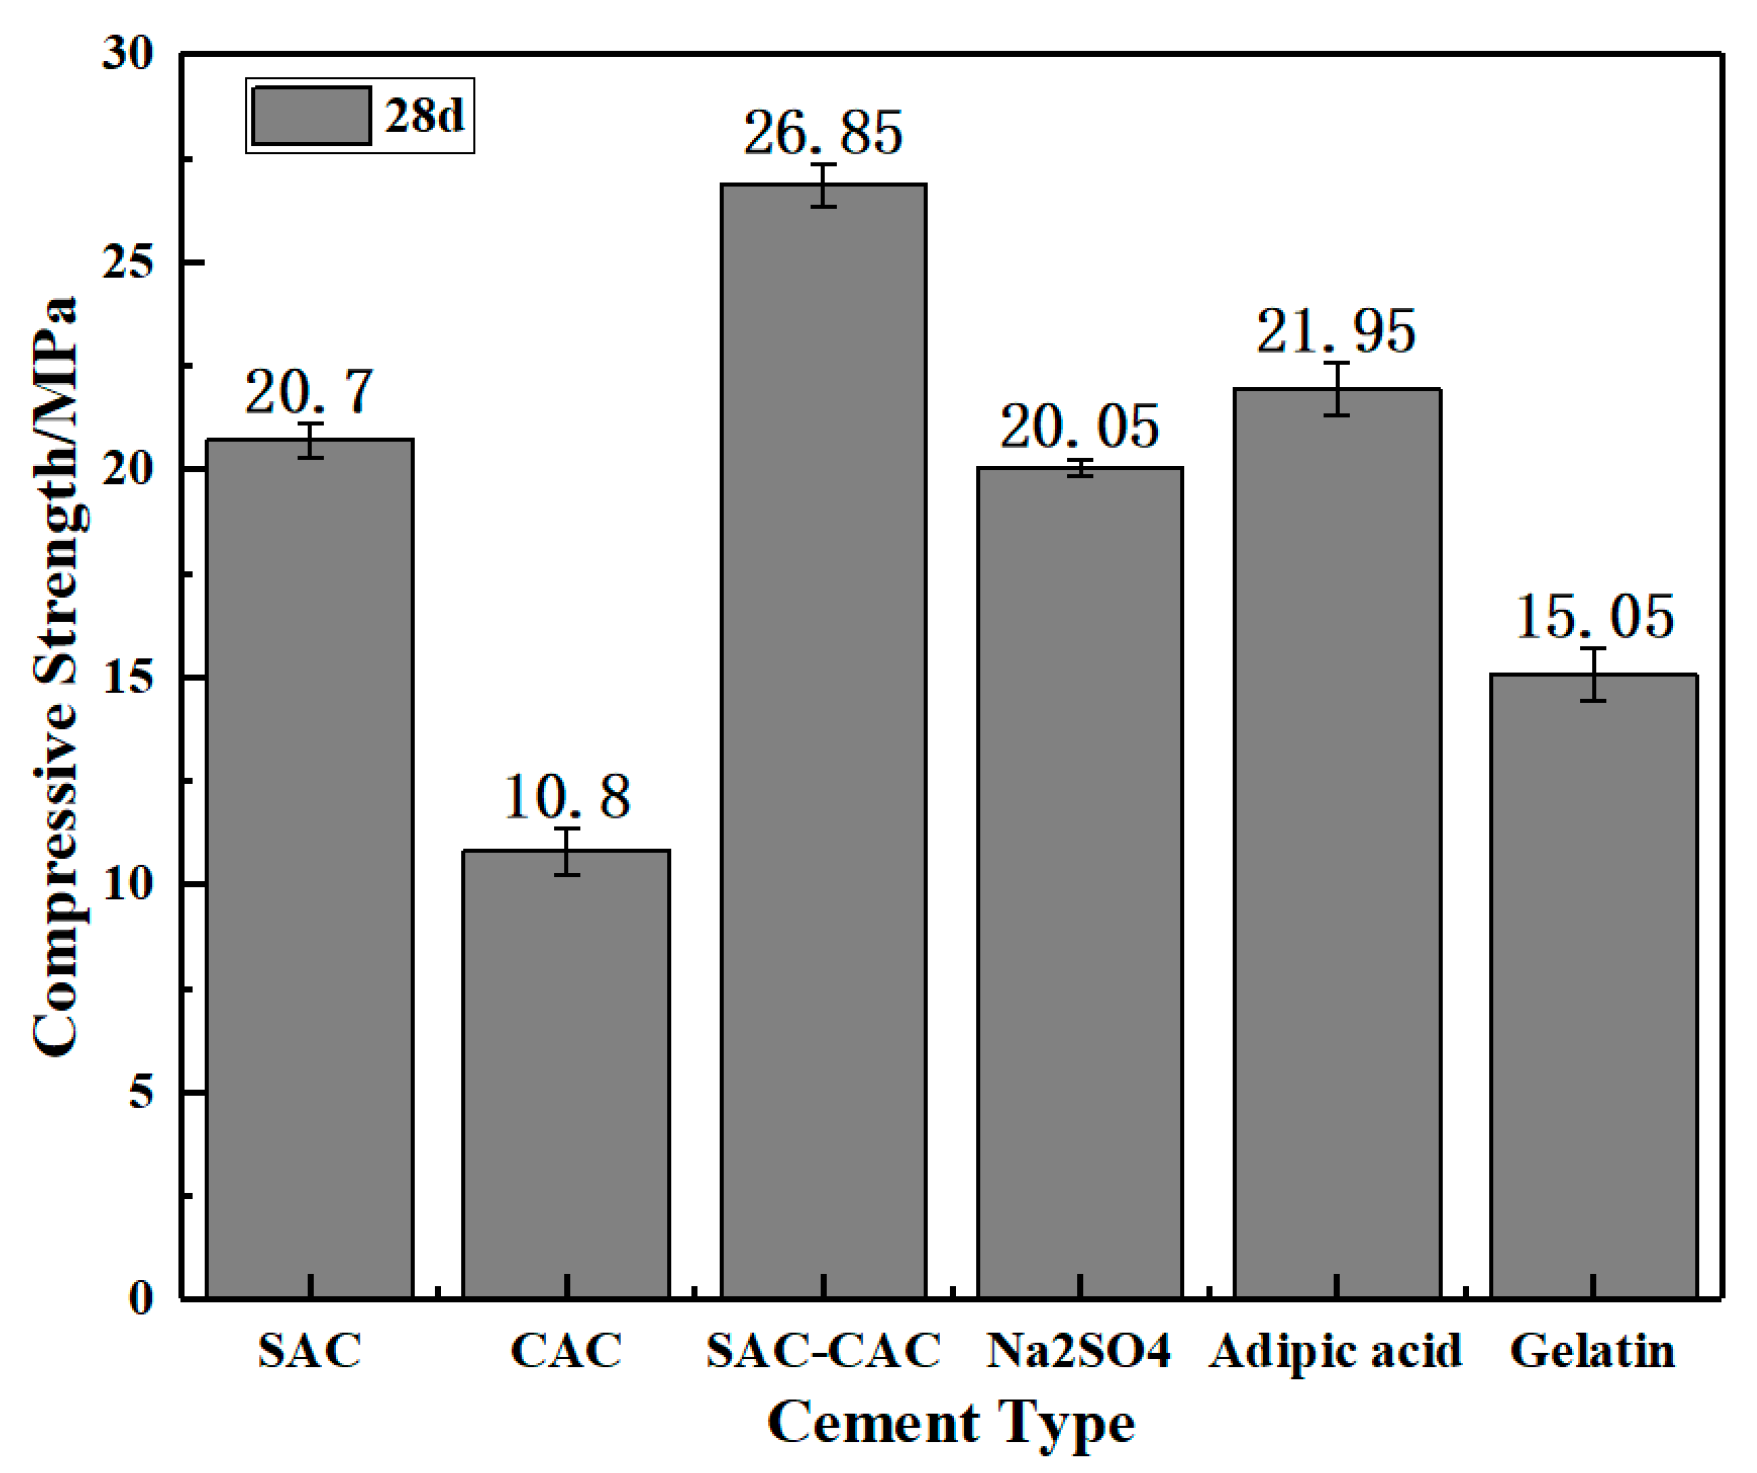
3.2. Mechanical Properties of Composite Cement Under Different Crystal Modifiers

3.2.1. Mechanical Properties

As can be found in Figure 4, the compressive strength of the specimens with crystal modifiers showed a decreasing trend compared with that of SAC-CAC. Among them, the sodium sulfate composite is the worst in compressive strength, at 20.05 MPa, while adipic acid composite cement is the best, at 21.95 MPa, which is 18.25% lower than that of SAC-CAC.
It can be seen from Figure 5 that the tensile strength of SAC-CAC has been greatly improved compared with that of SAC and CAC. Compared with the blank group, the tensile strength of the specimens with the crystal modifiers showed a downward trend. Among them, the sodium sulfate composite cement is the worst in tensile strength, at 1.66 MPa, while adipic acid composite cement is the best, at 2.07 MPa, decreased by 5.25% compared with that of SAC-CAC.

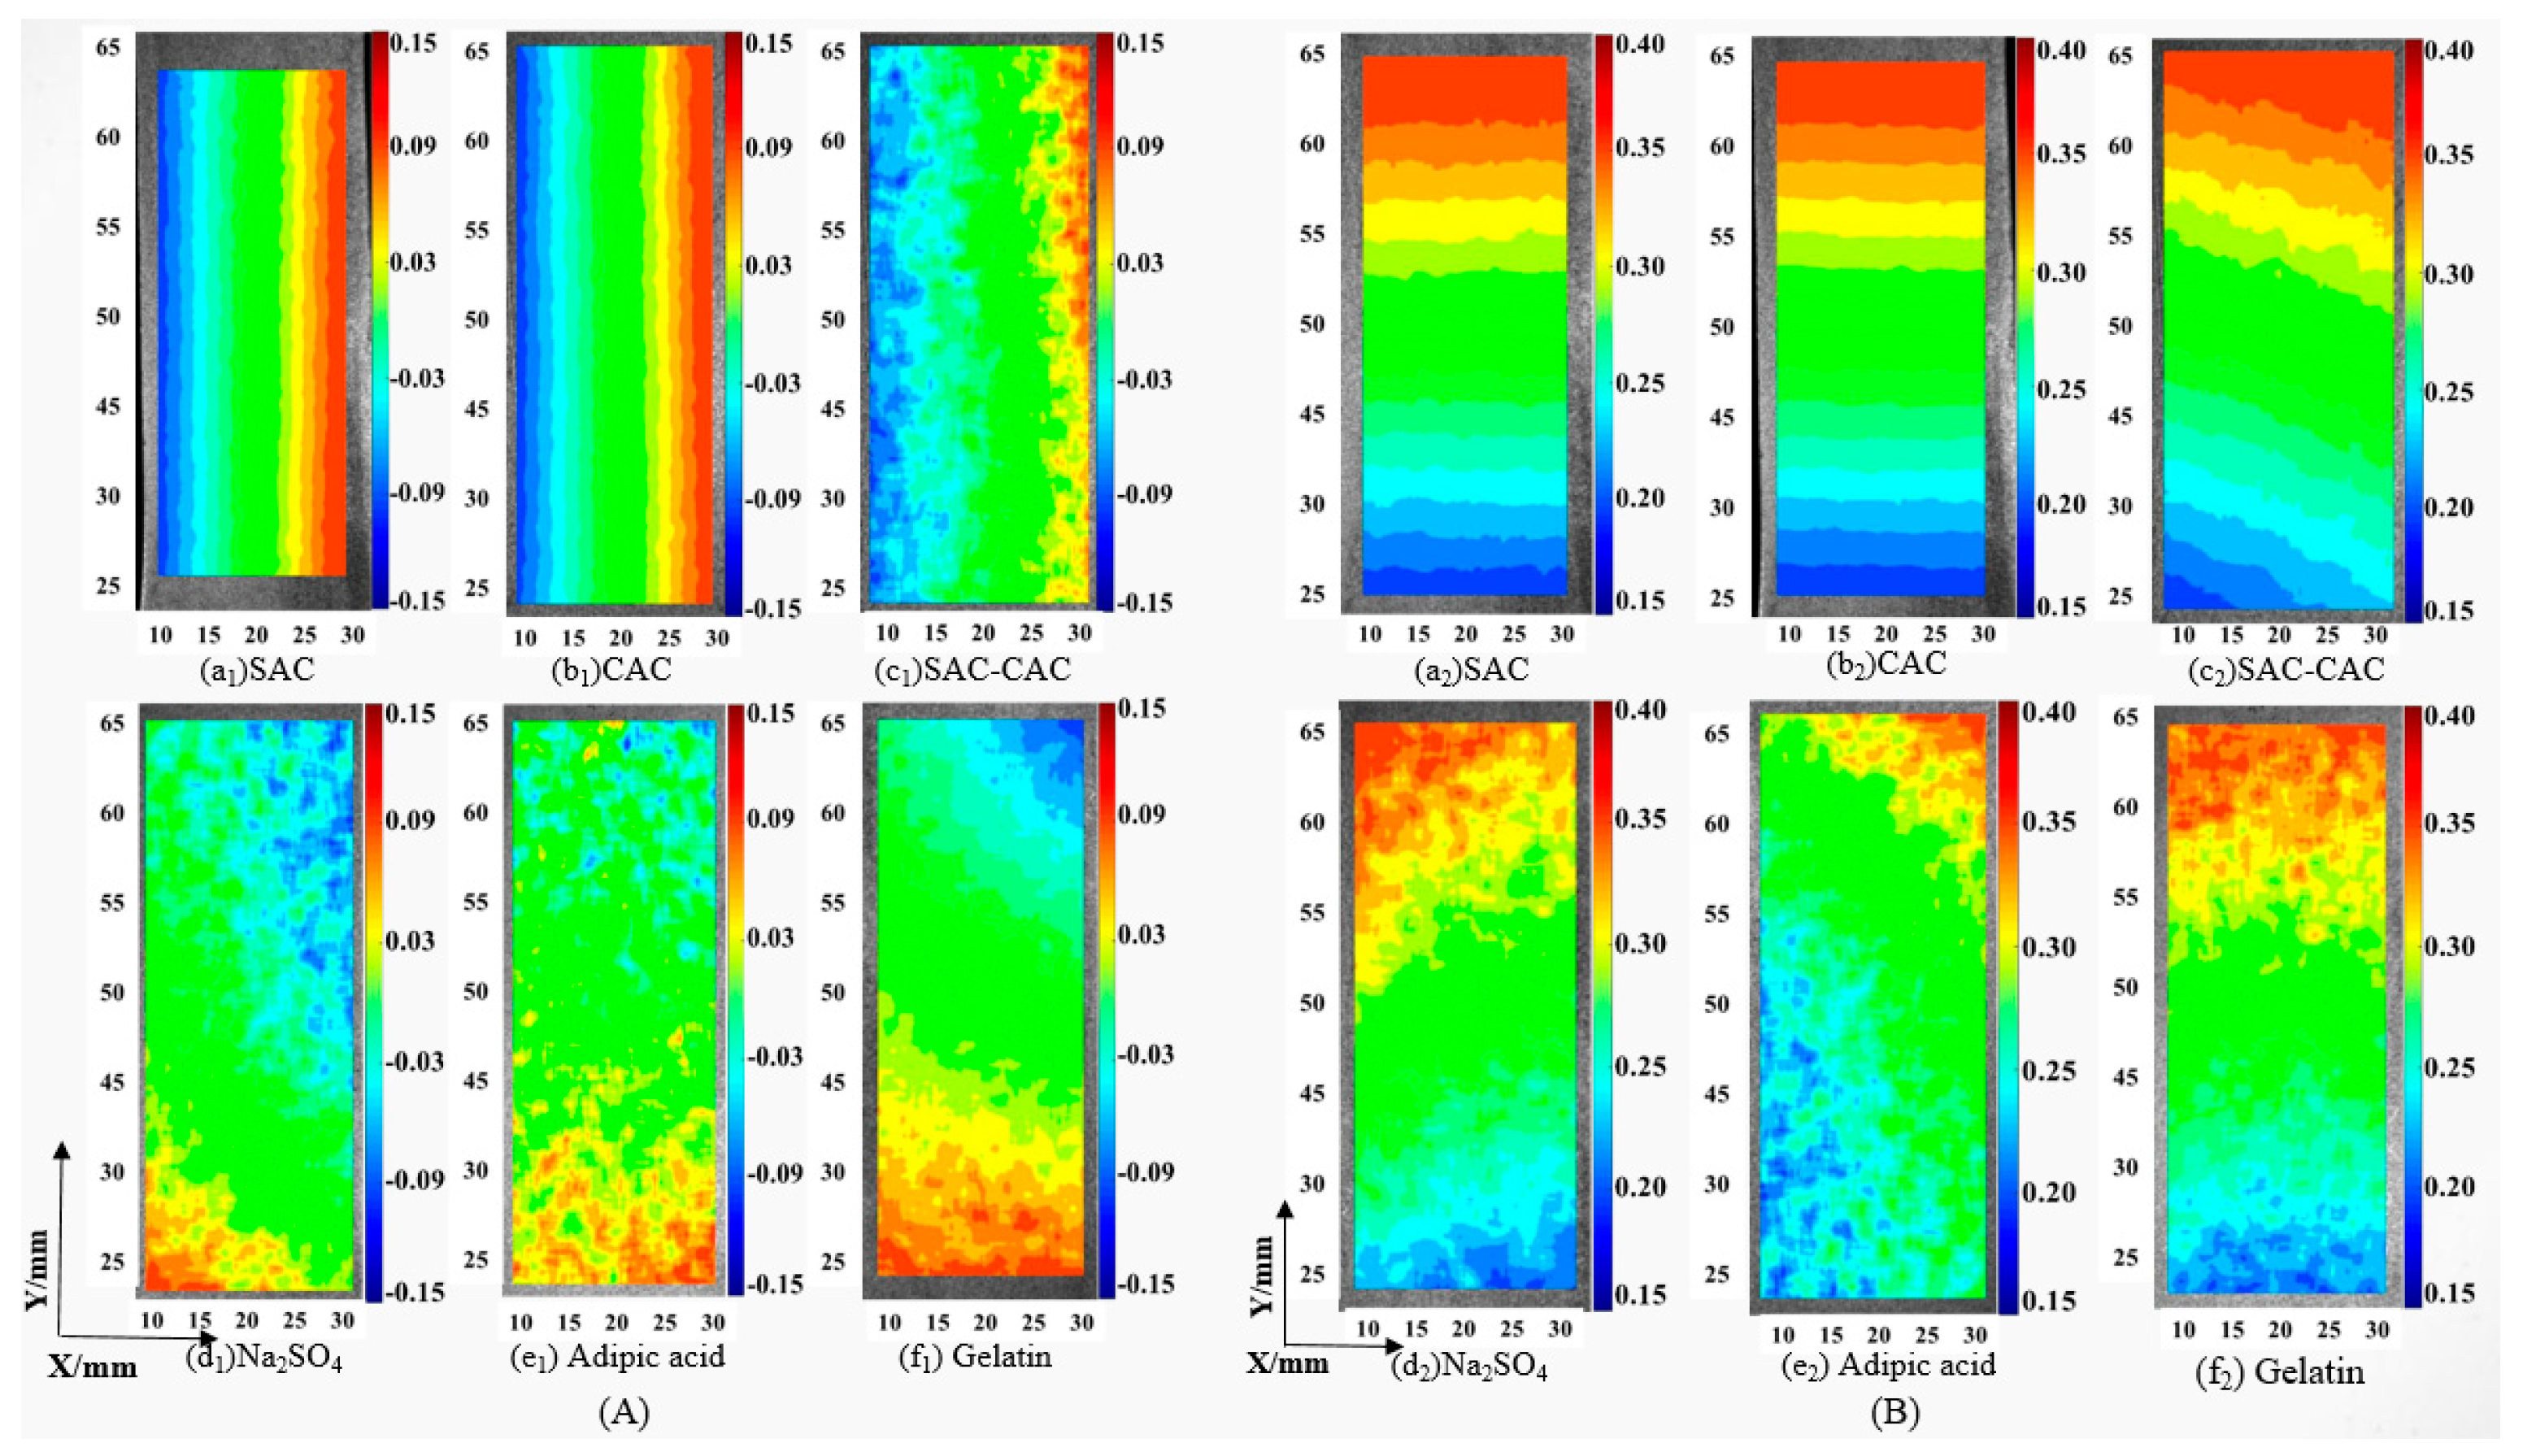
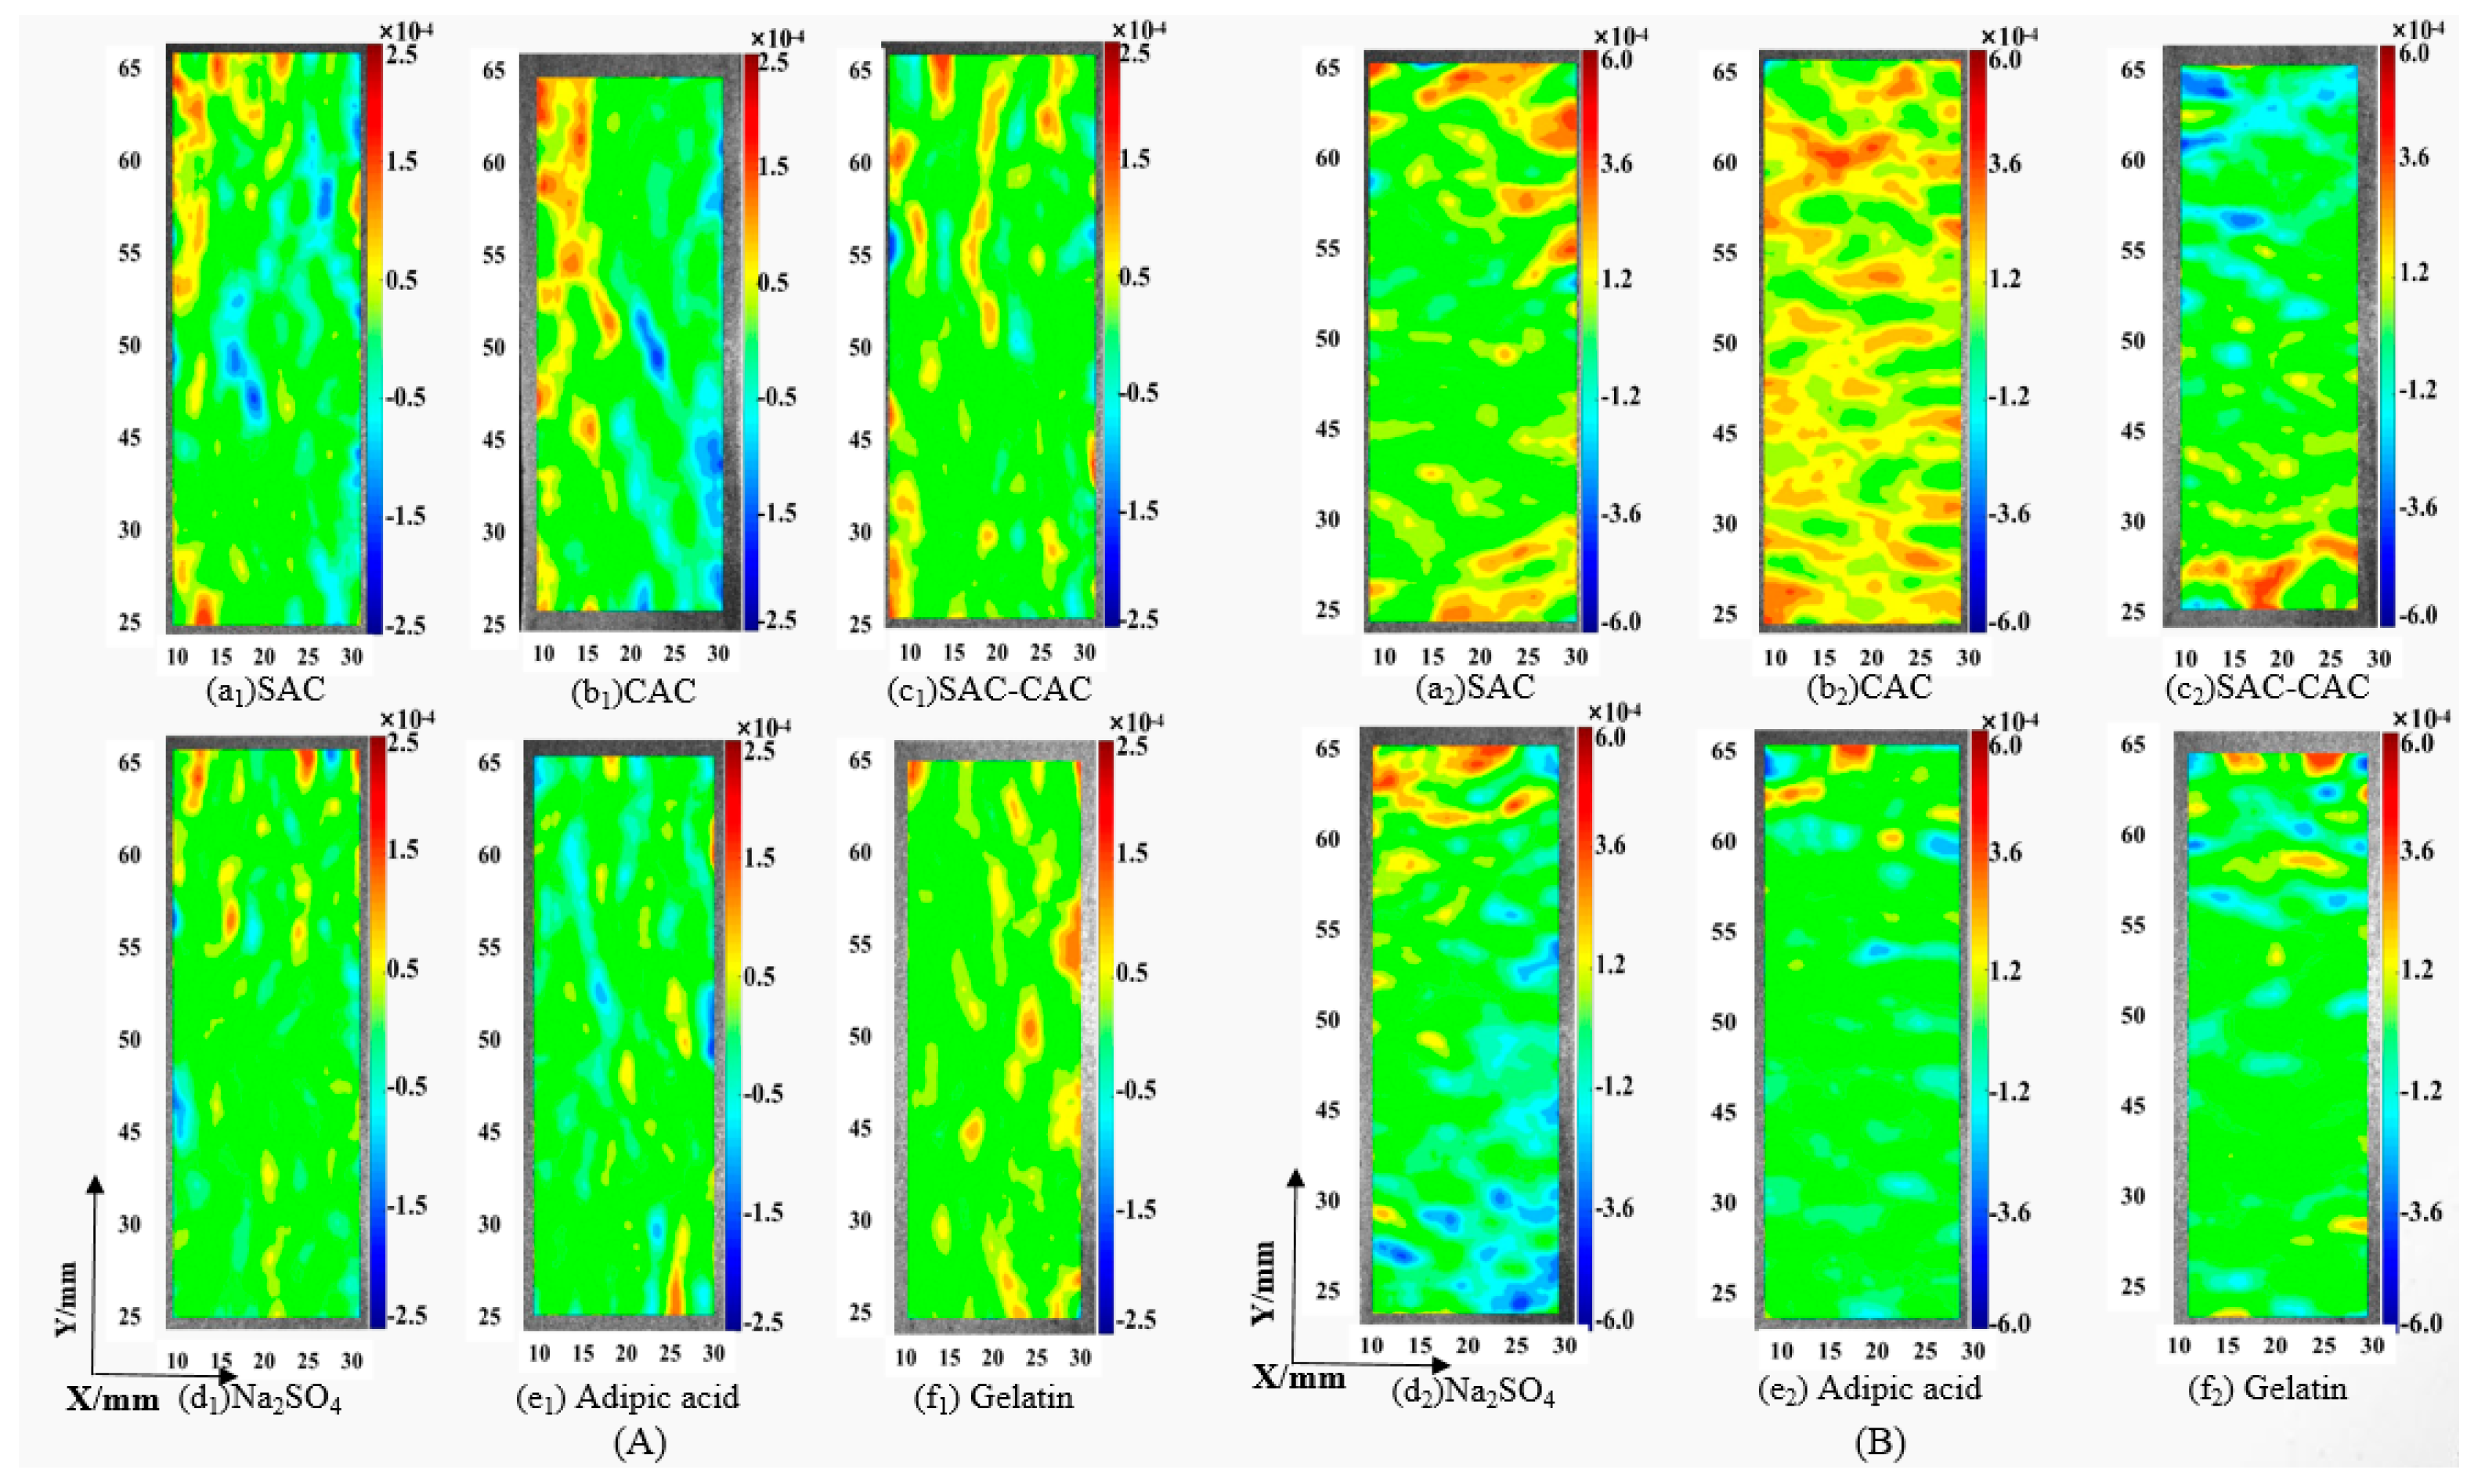
3.2.2. Deformation Behavior

The damage deformation behavior of the specimens under compression was characterized by DSCM. The horizontal and longitudinal displacement and strain field images were drawn by the deformation of the specimen during compression. The results are shown in Figure 6.
As can be seen from Figure 6A, the central deformation zone of those specimens is near the X = 20 mm in Figure 6(a1,b1). Taking X = 20 mm as the symmetry axis, the right displacement is positive, the left displacement is negative, and the displacement value is the same. The longitudinal banded deformation zone with the same displacement value verified the accuracy of the DSCM. The outline of overall deformation in Figure 6(c1) is roughly the same as Figure 6(a1,b1). However, the displacement of micro-regions is disordered, and there is no banded deformation zone with the same displacement value. The phenomenon confirms the formation of negative Poisson’s ratio structure in the composites. In contrast, the micro deformation of SAC-CAC is disordered. The deformation in Figure 6(d1,e1,f1) is more chaotic than that in Figure 6(c1), and there is no banded deformation zone with the same displacement value. It shows that the addition of the crystal modifiers increased the number of the negative Poisson’s ratio structure in the cement-based composites. Regarding the absolute value of the displacement, the average displacement of SAC is 0.12 mm, that of CAC is 0.13 mm, that of SAC-CAC is 0.10 mm, that of sodium sulfate composite cement is 0.07 mm, that of adipic acid composite cement is 0.06 mm, and that of gelatin composite cement is 0.09 mm.
As shown in Figure 6B, the compression contact surface and the maximum deformation zone of the specimens are near the Y = 35 mm in Figure 6(a2,b2). Between Y = 35 mm and Y = 5 mm, both compressive load and deformation displacement propagate uniformly downwards, and the deformation displacement gradually decreases. The longitudinal banded deformation zone with the same displacement value verified the accuracy of the DSCM. The outline of overall deformation in Figure 6(c2) is roughly the same as Figure 6(a2,b2), with the difference being the oblique distribution of band-shaped deformation regions with identical displacement values. The phenomenon confirms the formation of negative Poisson’s ratio structure in the composites, leading to the uneven transmission of displacement from top to bottom. Compared with Figure 6(c2), the deformation in Figure 6(d2,e2,f2) is more chaotic. Although the banded deformation zone with the same displacement appears in some areas, the displacement is disordered as a whole. This shows that the addition of the crystal modifiers increased the number of the negative Poisson’s ratio structure in the composite cement, resulting in the uneven transmission of compressive load and displacement. Regarding the absolute value of the displacement, the average displacement of SAC is 0.32 mm, that of CAC is 0.32 mm, that of SAC-CAC is 0.30 mm, that of sodium sulfate composite cement is 0.27 mm, that of adipic acid composite cement is 0.26 mm, and that of gelatin composite cement is 0.29 mm. Combined with the analysis of horizontal and longitudinal displacement cloud maps, the compressive strength of SAC-CAC is stronger than that of SAC and CAC.
Figure 7 indicates the strain field image in the X and Y directions when the specimens are under compressive load. The mutational regions indicated that the microcracks were observed in the specimens under compression load. The value of the strain and the size of the mutational regions reflect the size of the crack.
In Figure 7A, the increase in mutational regions of strain indicates the increase in microcracks of the specimens under compression load. The maximum strain in Figure 7(a1) is 1.6 × 10⁻³, and that of Figure 7(b1) is 1.7 × 10⁻³. And the mutational region of Figure 7(a1) is smaller than that of Figure 7(b1). This shows that the crack size of CAC is larger than that of SAC. The strain mutation region shown in Figure 7(c1) is less than that in Figure 7(a1,b1). The maximum strain value is 1.6 × 10⁻³, which is the same as that in Figure 7(a1). The results show that the number of microcracks produced by SAC-CAC is less than SAC and CAC when the maximum crack size is the same. The mutational region of strain in Figure 7(d1,e1,f1) is less than other groups, and the maximum strain is 1.3 × 10⁻³, 1.2 × 10⁻³ and 1.4 × 10⁻³, respectively. The results shows that the number of microcracks in the composite cement is reduced, the crack size is smaller than before, and the compressive strength of composites is enhanced by the addition of crystal modifiers.
In Figure 7B, Figure 7(a2,b2) contain large and concentrated regions in high-strain, and the maximum strain is 4.0 × 10⁻³ and 4.2 × 10⁻³, respectively. The results show that SAC and CAC specimens produce microcracks with large sizes and concentrated distribution under compression load. The area of high strain shown in Figure 7(c2) is less than that of Figure 7(a2,b2), but it is also concentrated in a specific region, and the maximum strain is 4.0 × 10⁻³. The results show that the composite of the two kinds of cement can reduce the number of microcracks caused by compression. The area of high strain in Figure 7(d2,e2,f2) is smaller and more dispersed than other groups, and the maximum strain is 3.8 × 10⁻³, 3.6 × 10⁻³ and 3.8 × 10⁻³, respectively. The results show that the size and number of microcracks is reduced by the addition of crystal modifiers.
Figure 7A shows the strain field images of the specimens under compression load in the X direction. Among them, the average strain of the specimens is 1.0 × 10⁻³, 1.1 × 10⁻³, 0.9 × 10⁻³, 0.7 × 10⁻³, 0.6 × 10⁻³, and 0.8 × 10⁻³, respectively. Figure 7B shows the strain in the Y direction of the specimens under compression load. Among them, the average strain of specimens is 3.2 × 10⁻³, 3.3 × 10⁻³, 3.1 × 10⁻³, 2.8 × 10⁻³, 2.7 × 10⁻³, and 2.9 × 10⁻³, respectively. The definition of Poisson’s ratio is v = ε x / ε y (a negative ratio of transverse strain to longitudinal strain). The values of Poisson’s ratio of the six groups of specimens are 0.31, 0.33, 0.29, 0.25, 0.22, and 0.27, respectively. These results provide evidence for the existence of a negative Poisson’s ratio structure in the hydration products of the composite cement, which leads to a reduction in the Poisson’s ratio.
Figure 8 indicates the strain field images of the specimens under tensile load in the X and Y directions. Regarding the absolute value of the displacement in Figure 8A, the overall average displacement of SAC is 0.08 mm, that of CAC is 0.08 mm, that of SAC-CAC is 0.07 mm, that of sodium sulfate composite cement is 0.06 mm, that of adipic acid composite cement is 0.05 mm, and that of gelatin composite cement is 0.07 mm. This shows that the displacement of SAC-CAC is larger than that of SAC and CAC after tension. The addition of crystal modifiers reduced the tensile displacement of the specimens. Regarding the absolute value of the displacement in Figure 8B, the overall average displacement of SAC is 0.28 mm, that of CAC is 0.28 mm, that of SAC-CAC is 0.26 mm, that of sodium sulfate composite cement is 0.25 mm, that of adipic acid composite cement is 0.23 mm, and that of gelatin composite cement is 0.25 mm, which is in accordance with the deformation law of Figure 8A. This shows that the composite of SAC and CAC increased the tensile strength. The addition of the crystal modifier reduced the average displacement of the cementitious material in the transverse and longitudinal directions, effectively improving the overall deformation properties of the material.
Figure 9 indicates the strain field images in the X and Y directions when the specimen is subjected to the tensile load. As can be seen from Figure 9A, the average transverse strain of the specimen is 5.0 × 10⁻⁴, 5.5 × 10⁻⁴, 4.2 × 10⁻⁴, 3.5 × 10⁻⁴, 3.1 × 10⁻⁴, and 3.8 × 10⁻⁴, respectively. In Figure 9B, the average longitudinal strains of the specimens are 1.5 × 10⁻³, 1.6 × 10⁻³, 1.5 × 10⁻³, 1.4 × 10⁻³, 1.3 × 10⁻³, and 1.4 × 10⁻³, respectively. According to the definition of Poisson’s ratio, the values of Poisson’s ratio of the six groups of specimens were 0.33, 0.34, 0.28, 0.25, 0.24 and 0.27, respectively. The decreases in the value of Poisson’s ratio proved the formation of negative Poisson’s ratio structures. The Poisson’s ratio of the cementitious materials with the addition of crystal modifiers decreased to different degrees, among which the Poisson’s ratio of CAC and SAC is the largest. Through the analysis of their hydration products, the hydration product of CAC is mainly hydrated calcium aluminate, and the hydration product of SAC is mainly AFt and C-S-H gel. The more ordered the crystal structure, the stronger the anisotropy, and the lower the Poisson’s ratio, while the amorphous structure or isometric structure, such as C-S-H gel and C3AH6, has a higher Poisson’s ratio. Thus, the Poisson’s ratio of CAC and SAC is higher, and the addition of crystal modifiers changed the morphology of crystal hydration products, increased the number of the structure of the negative Poisson’s ratio in cements, and further reduced the Poisson’s ratio.

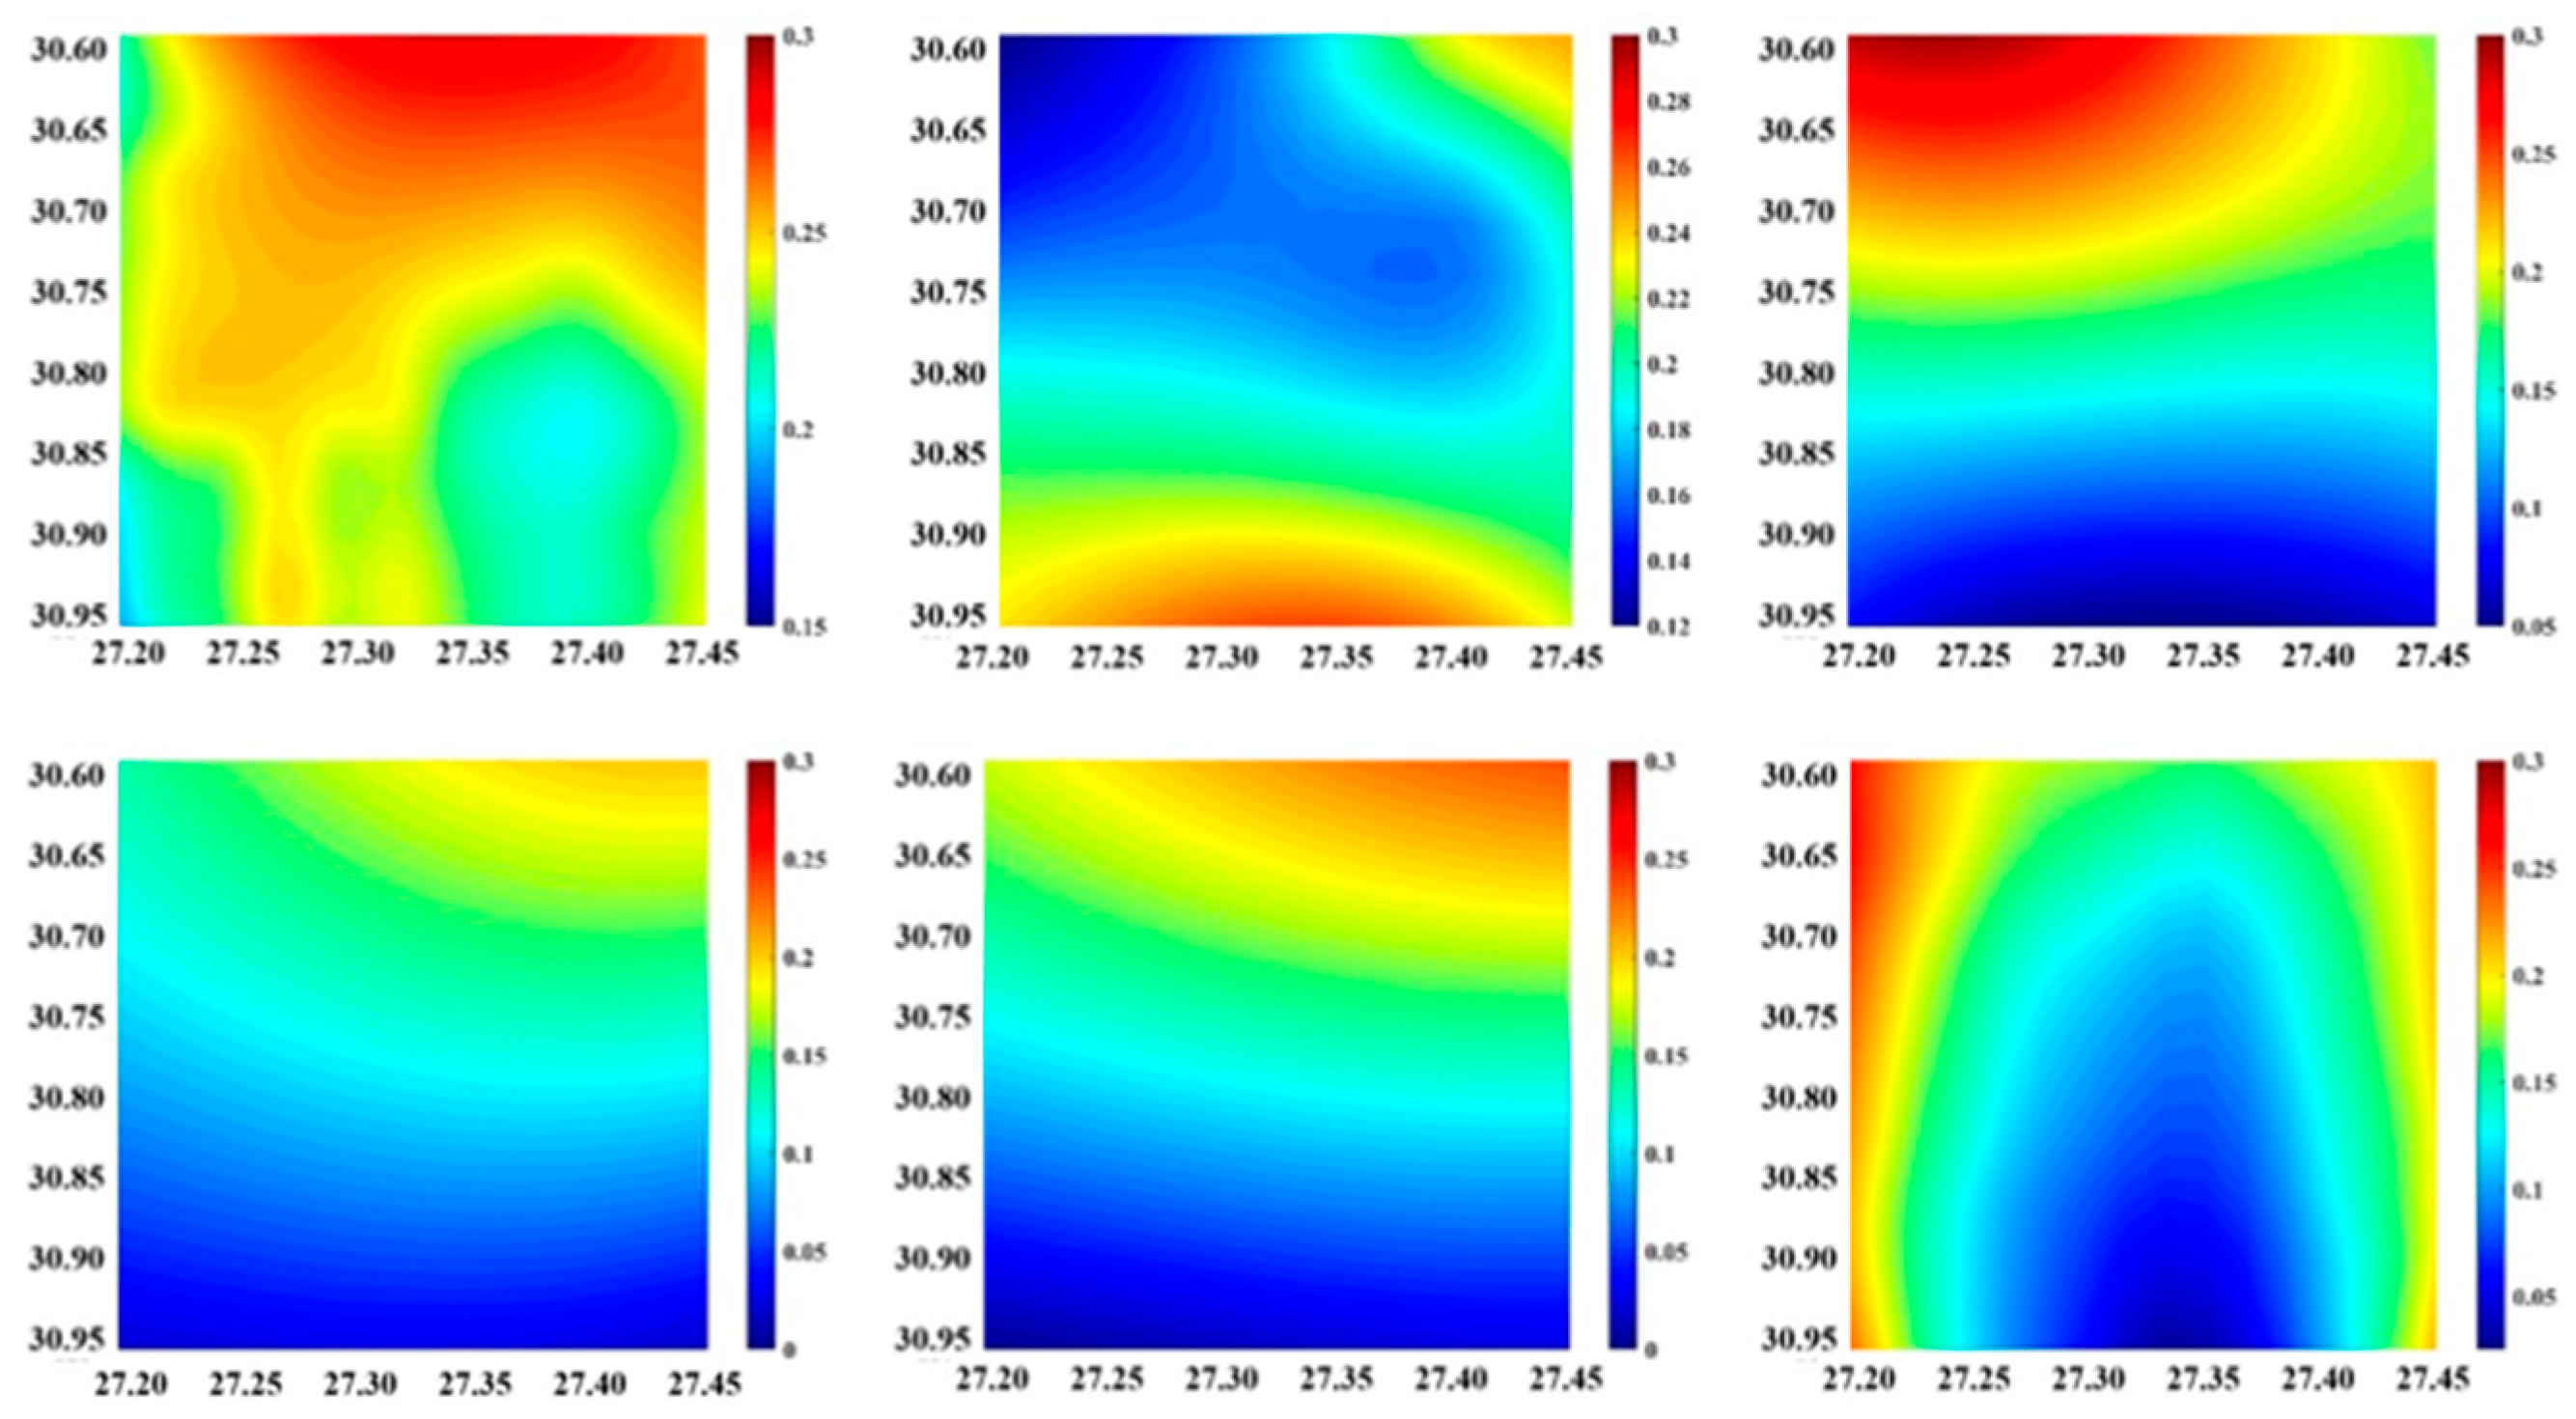
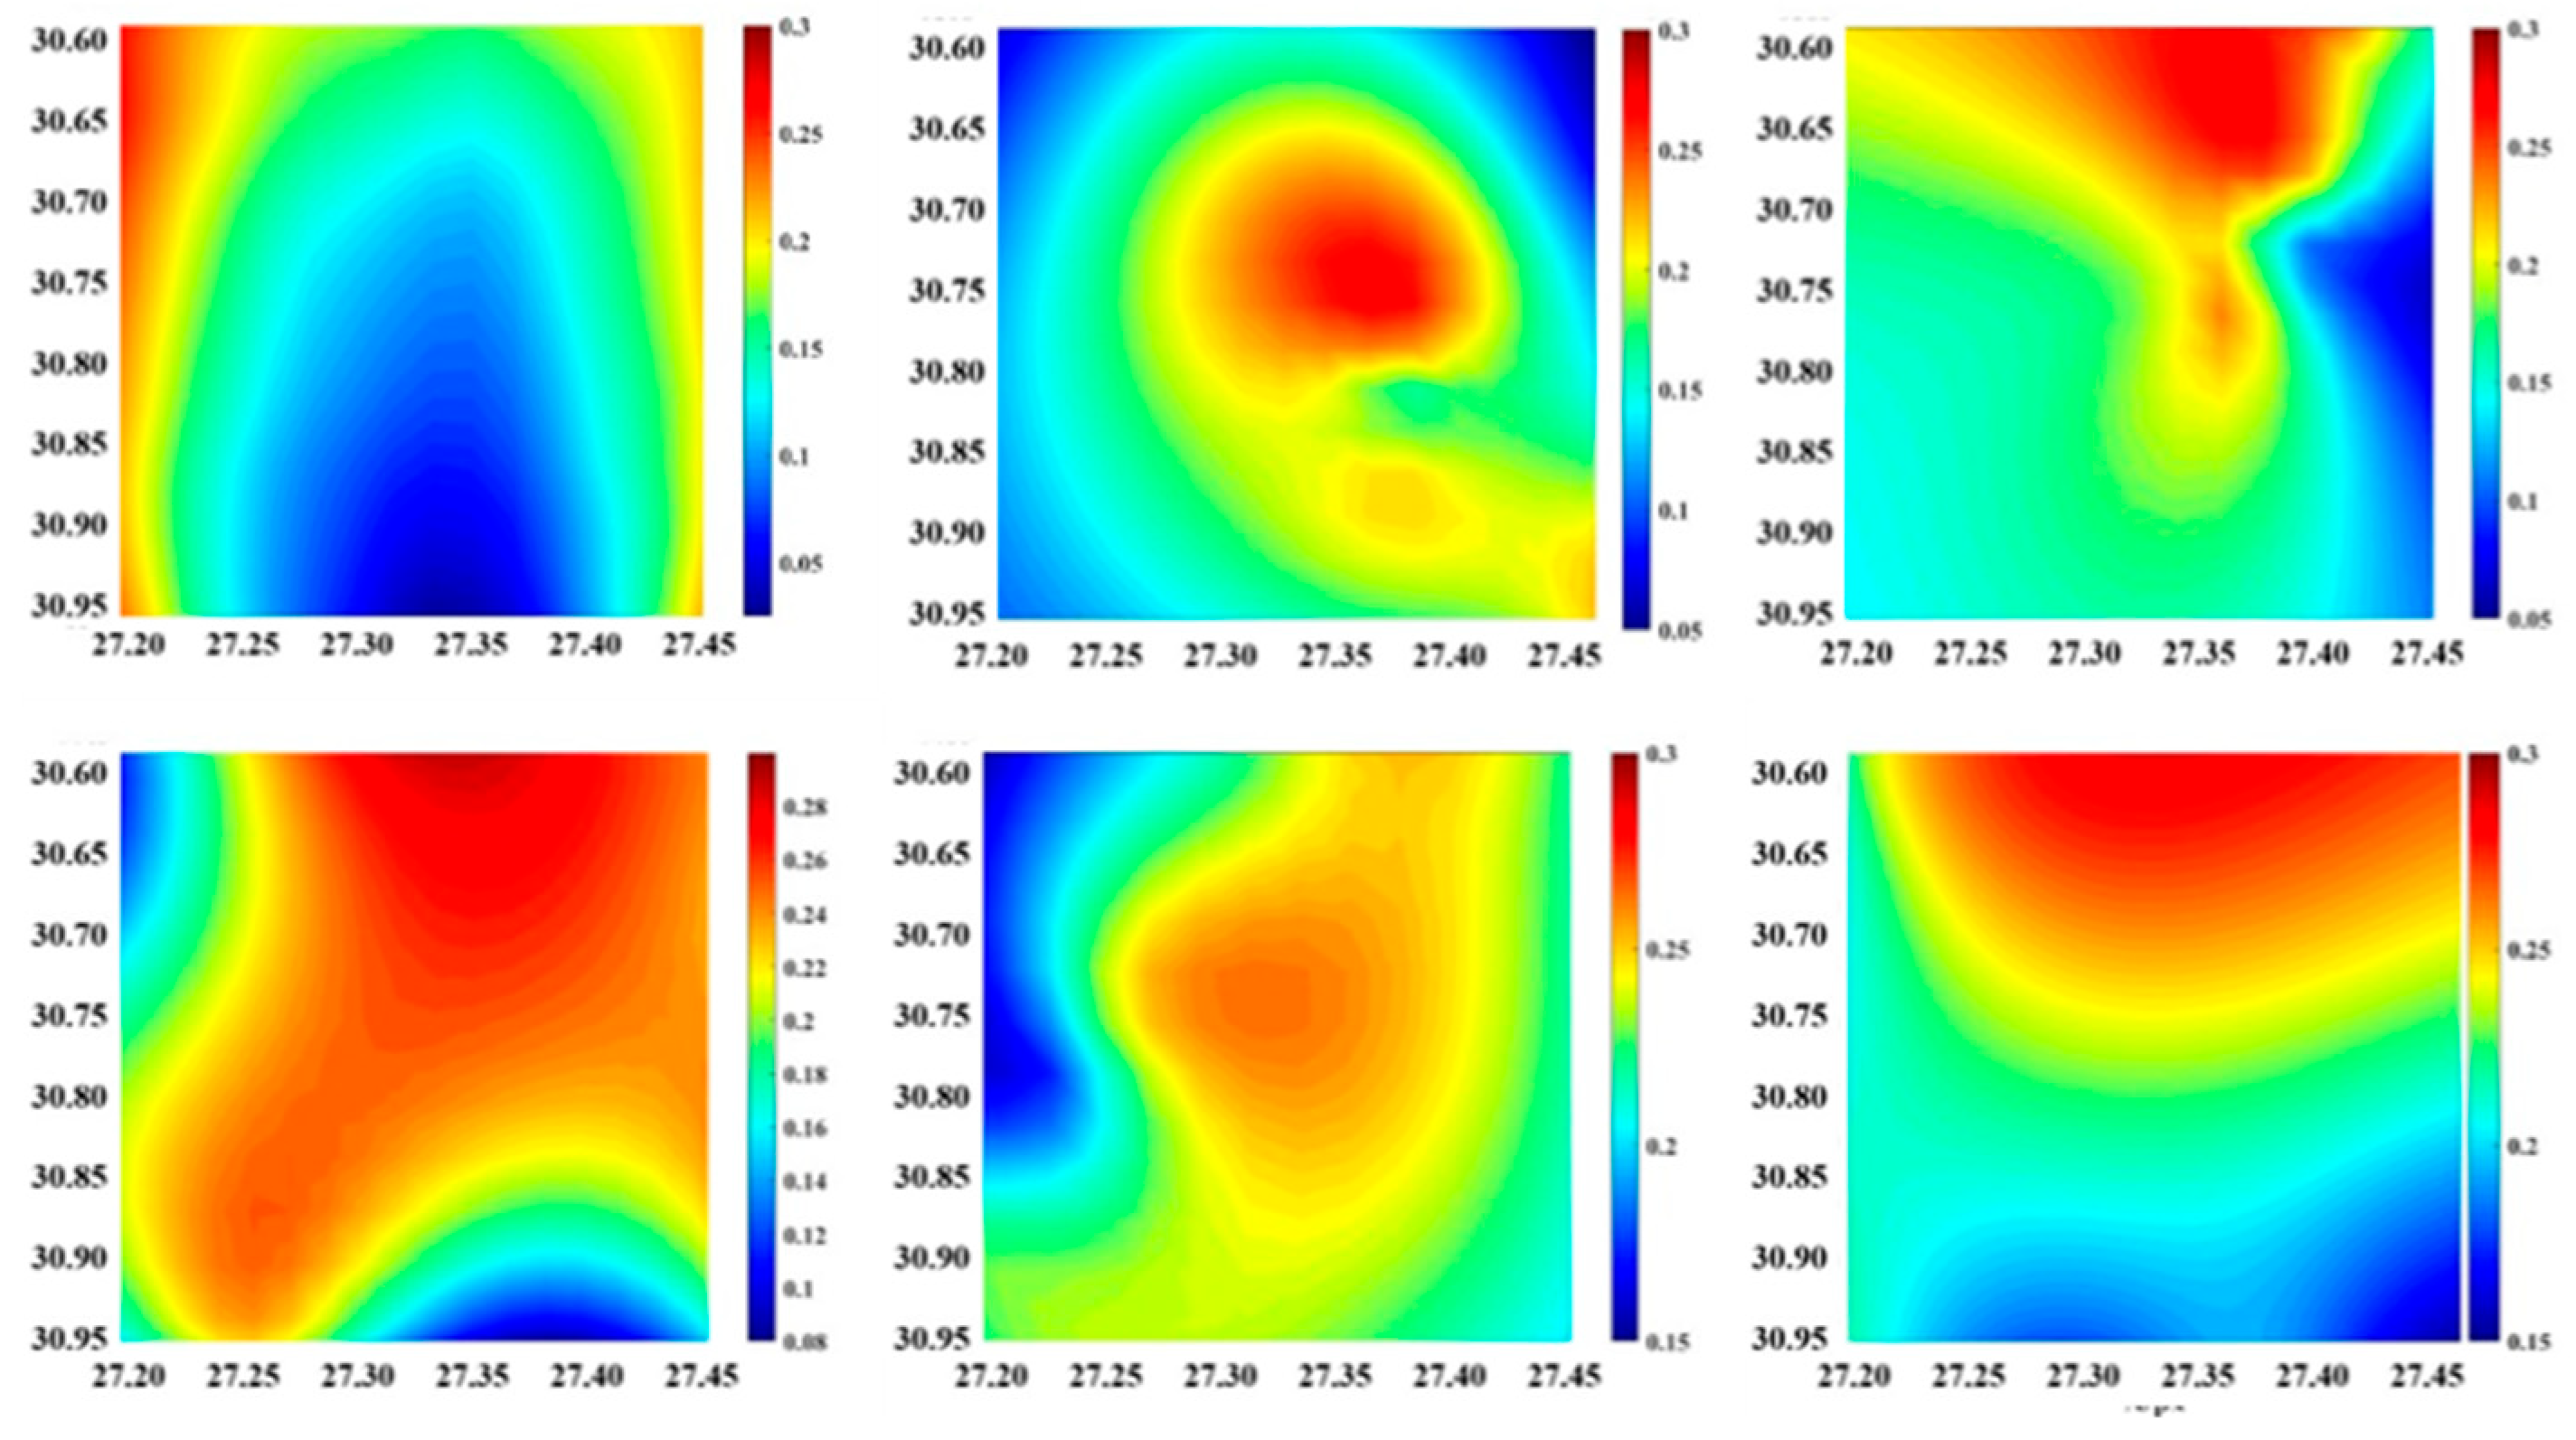
3.2.3. Micro-Area Dynamic Poisson’s Ratio Distribution

The Poisson’s ratio of 11 kinds of cement-based composites under compression load is shown in Table 5, and the Poisson’s field images of them are shown in Figure 10 and Figure 11.
At the initial loading stage, the average Poisson’s ratio of Formulas (1)–(11) decreased. With the increase in loading, the average Poisson’s ratio of Formulas (1)–(11) increased. It indicates that the specimens have a tendency of lateral expansion. The average Poisson’s ratio of Formulas (1) and (11) (SAC and CAC) is in accordance with the range of Poisson’s ratio of ordinary concrete materials. When the two kinds of cement were combined, the Poisson’s ratio decreased to different degrees. Among them, the average Poisson’s ratios of Formulas (4) and (5) were the lowest, which were 0.15. The minimum Poisson’s ratio of Formula (4) was the lowest, which was 0. It can be proved that the Poisson’s ratio of composite cement is smaller than that of ordinary cement. The minimum Poisson’s ratio of composite cement is 0 when the content of CAC was 30% and SAC was 70%.
The Poisson’s ratio of 11 kinds of cement-based composites under tensile load is shown in Table 4, and the Poisson’s field images of them are shown in Figure 12 and Figure 13.
The average Poisson’s ratio of cement-based composites showed the same trend as that under compression. At the initial loading stage, the average Poisson’s ratio of Formulas (1)–(11) decreased. With the increase in loading, the average Poisson’s ratio of Formulas (1)–(11) increased. This indicates that the specimens have a tendency of lateral expansion. The average Poisson’s ratio of Formula (1) and (11) (SAC and CAC) is in line with the range of Poisson’s ratio of ordinary concrete materials. When the two kinds of cement were combined, the Poisson’s ratio decreased to different degrees. Among them, the average Poisson’s ratio of Formula (4) was the lowest, which was 0.13. The minimum Poisson’s ratio of Formula (4) was the lowest, which was −0.005. The formation of negative Poisson’s ratio indicates that the addition of two kinds of cement can produce the negative Poisson’s ratio effect.

3.3. Negative Poisson’s Ratio Constitutive Mechanism

3.3.1. Microstructure Evolution Mechanism of Negative Poisson’s Ratio Effect

Figure 14a shows the microstructure of the composite cement paste without an added crystal modifier. It can be found that the crystal surface is smooth and flat. There are no structural branches and protrusions, and the crystals are short and thick. From Figure 14b–d, it can be found that the effects of different crystal modifiers on the crystal morphology are different. Na2SO4 makes the surface of the crystals produce slight protrusions. Adipic acid makes the crystals thick and hard, with obvious protrusions on the crystal surface and more branching of the structure, and the addition of gelatin results in branching of the structure on the original smooth crystal surface. The crystal modifier can change the microstructure of the net slurry hydration product, affect the crystal habit by attaching to the crystal surface, change the crystal growth mode, and thus change the crystal morphology.
Combining Figure 4 with Figure 5, the strength of SAC-CAC is the highest, and some decrease in strength occurs with the addition of a crystal modifier. This is due to the fact that the hydration products of aluminate and sulfoaluminate cements exist in the form of crystals, and these crystals form a dense mesh structure by lapping over each other, which is the main support for strength. Crystal modifiers adsorb at the crystal growth interface and inhibit the growth of specific crystal faces, resulting in a shift in crystal morphology. This morphology change will reduce the effective contact area and mechanical interlocking effect between crystals and reduce the structural compactness, and thus the strength will be attenuated to a certain extent, and the realization of negative Poisson’s ratio needs to sacrifice part of the strength for the optimization of the deformation and energy-absorbing capacity. The crystal modifier regulates the microcrystal structure to achieve Poisson’s ratio regulation, and the crystal laps appear to be slightly weakened, resulting in a reduction in the strength of aluminate and sulfoaluminate cementitious materials.
The main hydration crystallization products of SAC-CAC are CAH10, C2AH8, C3AH6, AH3 gel, and AFt with C-S-H gel, as shown in Figure 15a. CAH10 and AFt are the main structural skeletons of the cementitious matrix in the early stage, which is the source of the matrix hardness and contributes to the high strength in the early stage, while C2AH8 crystals are intertwined with each other, and around the crystals, more amorphous AH3 gel can be observed, and these amorphous phase products are filled in the interstices of the crystals. With the passage of time, CAH10 and C2AH8 will undergo a crystalline transformation, and eventually produce the more stable C3AH6, accompanied by the decay of strength. At the same time, there is the interlaced growth of needle-rod and elongated AFt, and the amorphous gel-like material grows around the AFt, which makes the structure more compact and makes an important contribution to the strength and durability of the cementitious materials in the later stage [35]. This constitutes the strength of the composite cement paste, and under the action of the crystal modifier, the crystal structure is transformed, evolving from a compact structure bound to each other to a relatively independent dispersed structure, as shown in Figure 15b, the yellow line is the outline of the crystal. A new morphology was derived from the crystal structure, and a concave structure was constructed. It can be seen that the crystal modifier changes the morphology of the hydration products, increases the complexity and branching degree of the crystal structure, and reduces the Poisson’s ratio of the cement matrix.

3.3.2. Computational Modeling and Finite Element Simulation of Poisson’s Ratio

Figure 16 indicates a calculation and theoretical prediction model of a concave structure with negative Poisson’s ratio. Assuming that the six-ribbed concave structure is a Euler–Bernoulli beam, the direction of plane stress is the X direction. The origin is O, the parallel direction of the beam is the X-axis, and the vertical direction of the beam is the Y-axis. According to Castigliano’s theorem, the total deformation energy U of the beam is expressed as follows:
U 1 = 0 l P 2 x 2 s i n 2 θ 2 E s I d x
U 2 = 0 l M 2 ( x ) 2 E s I d x
U 3 = 0 l P 2 c o s 2 θ 2 E s A d x
M = 1 2 P x s i n θ
P = σ X ( h + l s i n θ )
where I = b t 3 12 is the moment of inertia, A is the sectional area, δ1 is the deformation of the beam in the X-axis, δ2 is the deformation of the beam in the Y-axis, δh is the horizontal displacement at the end of the beam, and δv is the vertical displacement at the end of the beam.
It is assumed that the deformation energy in the X direction is U X , and that in the Y direction, it is U Y . According to Castigliano’s theorem, U X   and U Y are calculated using Equations (6) and (7).
U X = U 1 + U 2 = 0 l M 2 2 E S I d x + 0 l P 2 x 2 s i n 2 θ 2 E S I d x
U Y = U 3 = 0 l P 2 c o s 2 θ 2 E s A d x
δ 1 = d U X d P = P l 3 s i n θ 12 E S I
δ 2 = d U Y d P = P l c o s θ E S A
The strain in the X and Y direction of a six-rib cell is calculated using Equations (10) and (11).
ε h = δ 1 s i n θ + δ 2 c o s θ l c o s θ = P ( P l 2 s i n 2 θ 12 E S I c o s θ + 1 E S A )
ε v = δ 2 s i n θ δ 1 c o s θ l s i n θ + l = P l s i n θ + l ( P l 2 s i n 2 θ 12 E S I c o s θ + 1 E S A )
Equations (12)–(17) are used to calculate the elastic modulus Eh, Ev, and Poisson’s ratio; v1 and v2 in the X and Y directions of the whole structure are calculated using Equations (12)–(17).
E h = E S t 3 l 3 c o s θ ( α + s i n θ ) s i n 2 θ   1 l 2 + c o t 2 θ t 2
E v = E S t 3 ( α + s i n θ ) l 3 c o s 3 θ [ 1 ( α s e c 2 θ + t a n 2 θ ) t 2 l 2 ]
v 1 = ε v ε h = c o s 2 θ ( α + s i n θ ) s i n θ   1 ( t l ) 2 1 + c o t 2 θ ( t l ) 2
v 2 = ε h ε v = ( β + s i n θ ) s i n θ c o s 2 θ   1 ( t l ) 2 1 + ( β + s e c 2 θ + c o t 2 θ ) ( t l ) 2
v 1 = ε v ε h = c o s 2 θ ( α + s i n θ ) s i n θ
v 2 = ε h ε v = ( β + s i n θ ) s i n θ c o s 2 θ
Two ideal models of negative Poisson’s ratio microstructure are established according to the crystal morphology, as shown in Figure 17. The ideal model I consists of a six-rib structure and a hexagonal structure, and the six-rib structure contains two concave angles. The ideal model II consists of a star structure and a triangular structure, and the star structure contains four concave angles. The angles θ1 and θ2 in the graph are both 120°. The ANSYS was used to simulate the deformation of the two ideal models under compression and tensile, and their structure is shown in Figure 18, Figure 19, Figure 20 and Figure 21. Among them, figure (a), figure (b), and figure (c) represent the initial stage, the middle stage, and the later stage of compression or tensile, respectively, while figure (d) shows the comparison of deformation before and after compression or tensile.
The compressive and tensile loads with the same magnitude and uniformly distributed were applied above the structure. The volume difference between model I before and after deformation is 13.4%, with this number being 19.2% for model II. The results showed that the concave structure with negative Poisson’s ratio had a strong deformation capacity before being destroyed. The deformation ability of the star structure with four concave angles is stronger than that of the six-ribbed structure with only two concave angles under the same load. This means that the negative Poisson’s ratio effect of the structure correlated positively with the number of concave angles. When the deformation of structure reached the maximum, the concave structure was destroyed, and it no longer had a negative Poisson’s ratio effect. The deformation of negative Poisson’s ratio cement-based composites includes two processes: the negative Poisson’s ratio deformation process and deformation damage process, respectively. At the initial stage of loading, the negative Poisson’s ratio structure in cement-based composites is deformed. The negative Poisson’s ratio structure in cement-based composites was destroyed when the load increased to a certain extent. The negative Poisson’s ratio effect disappears and other structures in cement-based composites deform. Compared with ordinary cement-based composites, the deformation process of negative Poisson’s ratio cement-based composites includes the process of negative Poisson’s ratio deformation. Therefore, its load bearing and energy consumption capacity have been enhanced to a certain extent.

4. Conclusions

(1)
The combination of two kinds of cement improves the compressive, flexural, and tensile strength and reduces the Poisson’s ratio of the structure. The mechanical properties of cement-based composites are the best when the content of SAC is 70% and CAC is 30%. Compared with SAC and CAC, the 28d compressive strength of the formula increased by 28.94% and 161.54%, respectively, the 28d tensile strength increased by 1.82% and 6.67%, respectively, and the 28d flexural strength increased by 2.27% and 7.14%, respectively.
(2)
The combination of the two kinds of cement reduces the Poisson’s ratio of the structure. The Poisson’s ratio of composite cement is the smallest when the content of SAC is 70% and CAC is 30%, the addition of a crystal modifier changed the crystal morphology, and the deformation behavior of cementitious materials was improved. The average displacement, average strain, and Poisson’s ratio decreased to different degrees, among which, adipic acid had the best effect on the improvement of deformation behavior.
(3)
The addition of different crystal modifiers affects the crystal structure of cement hydration. Two kinds of crystal arrangements are predicted, and an ideal calculation model is given. The deformation process of cement with negative Poisson’s ratio was analyzed by the morphology of hydration products and concave structure. The deformation process of the structure is simulated by the Finite Element Method.

Author Contributions

Q.C.: investigation, writing—review and editing. P.W.: data curation, formal analysis, investigation. Y.M.: conceptualization, investigation. Z.Z.: data curation. S.D.A.: investigation, visualization. J.L.: investigation. F.Z.: formal analysis, visualization. P.Z.: methodology, writing—original draft. All authors have read and agreed to the published version of the manuscript.

Funding

This work was financially supported by Shandong Provincial Natural Science Foundation (ZR2022ME121) and the National Natural Science Foundation of China Project (52378248).

Data Availability Statement

The original contributions presented in the study are included in the article, further inquiries can be directed to the corresponding author.

Conflicts of Interest

The authors declare that they have no known competing financial interests or personal relationships that could have appeared to influence the work reported in this paper.

References

  1. Ma, Y.; Yu, X.; Zhao, F.; Liu, J.; Zhu, P.; Zhang, P.; Zhang, J.; Wu, L. Research progress in environmental response of fiber concrete and its functional mechanisms. Adv. Mater. Sci. Eng. 2022, 26, 3059507. [Google Scholar] [CrossRef]
  2. Zhang, H.; Ji, T.; Liu, H.; Su, S. Improving the sulfate resistance of recycled aggregate concrete (RAC) by using surface-treated aggregate with sulfoaluminate cement (SAC). Constr. Build. Mater. 2021, 297, 123535. [Google Scholar] [CrossRef]
  3. Liu, G.; Li, M.; Zhang, S.; Zhang, Z.; Wu, Y. Strengthening effect and mechanism of titanium extraction slag on the mechanical property of calcium aluminate cement. Ceram. Int. 2023, 49, 30326–30334. [Google Scholar]
  4. Xue, Q.; Ni, C.; Wu, Q.; Yu, Z.; Shen, X. Effects of Nano-CSH on the hydration process and mechanical property of cementitious materials. J. Sustain. Cem.-Based Mater. 2022, 11, 378–388. [Google Scholar] [CrossRef]
  5. Idrees, M.; Ekincioglu, O.; Sonyal, M.S. Hydration behavior of calcium aluminate cement mortars with mineral admixtures at different curing temperatures. Constr. Build. Mater. 2021, 285, 122839. [Google Scholar] [CrossRef]
  6. Engbert, A.; Plank, J. Impact of sand and filler materials on the hydration behavior of calcium aluminate cement. J. Am. Ceram. Soc. 2021, 104, 1067–1075. [Google Scholar] [CrossRef]
  7. Fernández-Carrasco, L.; Rius, J.; Miravitlles, C. Supercritical carbonation of calcium aluminate cement. Cem. Concr. Res. 2008, 38, 1033–1037. [Google Scholar] [CrossRef]
  8. Wang, F.; Chen, P.; Li, X.; Zhu, B. Effect of colloidal silica on the hydration behavior of calcium aluminate cement. Materials 2018, 11, 1849. [Google Scholar] [CrossRef]
  9. Li, Z.; Tian, B.; Li, L.; Quan, L.; Li, D. Effect of phosphates on early-age hydration process and products of calcium aluminate cement at-10 degrees C. Constr. Build. Mater. 2022, 346, 128405. [Google Scholar] [CrossRef]
  10. Chen, X.; Wang, Y.; Chong, H.; Huang, J. Use of Sulphoaluminate Cement in Grouted Macadam as Sustainable Pavement Material. J. Transp. Eng. Part B Pavements 2020, 146, 04020018. [Google Scholar] [CrossRef]
  11. Belhadi, R.; Govin, A.; Grosseau, P. Influence of polycarboxylate superplasticizer, citric acid and their combination on the hydration and workability of calcium sulfoaluminate cement. Cem. Concr. Res. 2021, 147, 106513. [Google Scholar] [CrossRef]
  12. Xu, Q.; Ji, T.; Yang, Z.; Ye, Y. Steel rebar corrosion in artificial reef concrete with sulphoaluminate cement, sea water and marine sand. Constr. Build. Mater. 2019, 227, 116685. [Google Scholar] [CrossRef]
  13. Wang, W.; Wei, X.; Cai, X.; Deng, H.; Li, B. Mechanical and Microstructural Characteristics of Calcium Sulfoaluminate Cement Exposed to Early-Age Carbonation Curing. Materials 2021, 14, 3515. [Google Scholar] [CrossRef] [PubMed]
  14. Bai, L.; Xu, W.; Wang, W.; Cheng, S. Thermal expansion regulation and bandgap analysis of a novel dual-constituent negative Poisson’s ratio lattice metamaterial. Mater. Today Commun. 2023, 35, 106311. [Google Scholar] [CrossRef]
  15. Cui, Y.J.; Liu, C.; Wang, K.F.; Wang, B.L.; Liu, Y. Effect of negative Poisson’s ratio architecture on fatigue life and output power of flexible wearable thermoelectric generators. Eng. Fract. Mech. 2023, 281, 109142. [Google Scholar] [CrossRef]
  16. Ma, Y.; Yu, X.; Zhao, F.; Liu, J.; Xu, Y.; Zhang, P.; Zhang, J.; Wu, L. Negative Poisson’s ratio design, static mechanical properties and deformation behaviors on PVA-carbon fiber reinforced concrete. J. Mater. Sci. 2023, 58, 1568–1585. [Google Scholar] [CrossRef]
  17. Zhao, Y.; Wang, Y.; Hao, J.; Wang, Y. Mechanical properties of corrugated structure with negative Poisson’s ratio and its application on energy absorbing box based on parametric modeling method. Mater. Today Commun. 2024, 38, 107921. [Google Scholar] [CrossRef]
  18. Wallbanks, M.; Khan, M.F.; Bodaghi, M.; Triantaphyllou, A.; Serjouei, A. On the design workflow of auxetic metamaterials for structural applications. Smart Mater. Struct. 2021, 31, 023002. [Google Scholar] [CrossRef]
  19. Tahir, D.; Zhang, M.; Hu, H. Auxetic materials for personal protection: A review. Phys. Status Solidi (B) 2022, 259, 2200324. [Google Scholar] [CrossRef]
  20. Gao, D.; Wang, B.; Gao, H.; Ren, F.; Guo, C.; Ma, S.; Cao, T.; Xia, Y.; Wu, Y. Strain Rate Effect on Mechanical Properties of the 3D-Printed Metamaterial Foams With Tunable Negative Poisson’s Ratio. Front. Mater. 2021, 8, 712500. [Google Scholar]
  21. Gao, S.; Liu, W.; Zhang, L.; Gain, A.K. A New Polymer-Based Mechanical Metamaterial with Tailorable Large Negative Poisson’s Ratios. Polymers 2020, 12, 1492. [Google Scholar] [CrossRef] [PubMed]
  22. Zhong, R.; Ren, X.; Zhang, X.Y.; Luo, C.; Zhang, Y.; Xie, Y.M. Mechanical properties of concrete composites with auxetic single and layered honeycomb structures. Constr. Build. Mater. 2022, 322, 126453. [Google Scholar] [CrossRef]
  23. Bouguermouh, K.; Habibi, M.; Laperrière, L. 4D printing of fiber-reinforced auxetic structures: The building blocks: A review. Smart Mater. Struct. 2024, 33, 063001. [Google Scholar]
  24. Yao, Y.; Ni, Y.; He, L.H. Rutile-mimic 3D metamaterials with simultaneously negative Poisson’s ratio and negative compressibility. Mater. Des. 2020, 200, 109440. [Google Scholar] [CrossRef]
  25. Wang, J.; Luo, X.; Wang, K.; Yao, S.; Peng, Y. On impact behaviors of 3D concave structures with negative Poisson’s ratio. Compos. Struct. 2022, 298, 115999. [Google Scholar]
  26. Xu, Y.; Zhang, H.; Schlangen, E.; Luković, M.; Šavija, B. Cementitious cellular composites with auxetic behavior. Cem. Concr. Compos. 2020, 111, 1–11. [Google Scholar] [CrossRef]
  27. Asad, M.; Zahra, T.; Thambiratnam, D.P.; Chan, T.H.; Zhuge, Y. Geometrically modified auxetic polyurethane foams and their potential application in impact mitigation of masonry structures. Constr. Build. Mater. 2021, 311, 125170. [Google Scholar] [CrossRef]
  28. Zhao, C.; Zhou, Z.; Liu, X.; Ziruo, T.; Zhang, K.; Zhang, P.; Ren, J.; Liu, Z.; Le, G.; Zhong, J. The in-plane stretching and compression mechanics of Negative Poisson’s ratio structures: Concave hexagon, star shape, and their combination. J. Alloys Compd. 2021, 859, 157840. [Google Scholar] [CrossRef]
  29. Bao, S.; Ren, X.; Qi, Y.J.; Li, H.R.; Han, D.; Li, W.; Luo, C.; Song, Z.Z. Quasi-Static Mechanical Properties of a Modified Auxetic Re-Entrant Honeycomb Metamaterial. Phys. Status Solidi (B) 2022, 159, 2200270. [Google Scholar] [CrossRef]
  30. Lu, F.; Chen, X.; Zhu, Y.; Zhang, C.; Hou, Y. A Novel Re-Entrant-Type Metamaterial with Tunable Negative Poisson’s Ratios and Coefficients of Thermal Expansion. Int. J. Appl. Mech. 2022, 14, 2250040. [Google Scholar]
  31. Lee, W.; Jeong, Y.; Yoo, J.; Huh, H.; Park, S.H.; Yoon, J. Effect of auxetic structures on crash behavior of cylindrical tube. Compos. Struct. 2019, 208, 836–846. [Google Scholar]
  32. Fang, G.; Yuan, S.; Meng, S.; Liang, J. Graded negative Poisson’s ratio honeycomb structure design and application. J. Sandw. Struct. Mater. 2019, 21, 2527–2547. [Google Scholar] [CrossRef]
  33. Ha, C.S.; Plesha, M.E.; Lakes, R.S. Chiral three-dimensional isotropic lattices with negative Poisson’s ratio. Phys. Status Solidi (B) 2016, 253, 1243–1251. [Google Scholar] [CrossRef]
  34. Lv, C.; Krishnaraju, D.; Konjevod, G.; Yu, H.; Jiang, H. Origami based Mechanical Metamaterials. Sci. Rep. 2014, 4, 5979. [Google Scholar] [CrossRef]
  35. Izadifar, M.; Dolado, J.S.; Thissen, P.; Ukrainczyk, N.; Koenders, E.; Ayuela, A. Theoretical elastic constants of tobermorite enhanced with reduced graphene oxide through hydroxyl vs epoxy functionalization: A first-principles study. J. Phys. Chem. C 2023, 127, 18117–18126. [Google Scholar] [CrossRef]
  36. Momoh, E.O.; Jayasinghe, A.; Hajsadeghi, M.; Vinai, R.; Evans, K.E.; Kripakaran, P.; Orr, J. A state-of-the-art review on the application of auxetic materials in cementitious composites. Thin-Walled Struct. 2024, 196, 111447. [Google Scholar] [CrossRef]
  37. Li, N.; Liu, Z.; Shi, X.; Fan, D.; Xing, H.; Qiu, J.; Li, M.; Tang, T. Preparing Polypropylene Auxetic Foam by a One-Pot CO2 Foaming Process. Adv. Eng. Mater. 2022, 24, 2100859. [Google Scholar] [CrossRef]
  38. He, Y. Orientational dependence of Poisson’s ratio in tetragonal γ-TiAl single crystal. MRS Commun. 2023, 13, 431–437. [Google Scholar] [CrossRef]
  39. Huang, C.W.; Chen, L. Negative Poisson’s Ratio in Modern Functional Materials. Adv. Mater. 2016, 28, 8079–8096. [Google Scholar] [CrossRef]
  40. Winnefeld, F.; Martin, L.H.; Müller, C.J.; Lothenbach, B. Using gypsum to control hydration kinetics of CSA cements. Constr. Build. Mater. 2017, 155, 154–163. [Google Scholar] [CrossRef]
  41. Gastaldi, D.; Bertola, F.; Irico, S.; Paul, G.; Canonico, F. Hydration behavior of cements with reduced clinker factor in mixture with sulfoaluminate binder. Cem. Concr. Res. 2021, 139, 106261. [Google Scholar] [CrossRef]
  42. Liu, C.; Huang, R.; Zhang, Y.; Liu, Z.; Zhang, M. Modelling of irregular-shaped cement particles and microstructural development of Portland cement. Constr. Build. Mater. 2018, 168, 362–378. [Google Scholar] [CrossRef]
  43. Deng, X.; Guo, H.; Tan, H.; Zhang, J.; Zheng, Z.; Li, M.; Chen, P.; He, X.; Yang, J.; Wang, J. Comparison on early hydration of Portland cement and sulphoaluminate cement in the presence of nano ettringite. Constr. Build. Mater. 2022, 360, 129516. [Google Scholar] [CrossRef]
  44. Wang, J.; Wang, Y.; Yu, J.; Xu, L.; Li, M.; Cheng, J.; Li, Z. Effects of sodium sulfate and potassium sulfate on the properties of calcium sulfoaluminate (CSA) cement based grouting materials. Constr. Build. Mater. 2022, 353, 129045. [Google Scholar] [CrossRef]
  45. Kartnaller, V.; Ribeiro, E.M.; Venancio, F.; Rosario, F.F.; Cajaiba, J. Preferential incorporation of sulfate into calcite polymorphs during calcium carbonate precipitation: An experimental approach. CrystEngComm 2018, 20, 2241–2244. [Google Scholar] [CrossRef]
  46. Gao, Y. Effect of crystallization additives on crystal morphology of ammonium sulfate. CIESC J. 2011, 62, 3575. [Google Scholar]
  47. Zhang, W.; Gong, J.; Dong, W.; Wu, S. Research progress in effect of gel on crystallization process. CIESC J. 2020, 71, 487. [Google Scholar]
  48. GB/T50081-2016; Standard for Test Method of Mechanical Properties on Ordinary Concrete. China Ministry of Construction: Beijing, China, 2016.
  49. Ma, Y.; Liu, J.; Zhang, Y.; Ge, Y.; Wu, R.; Song, X.; Zhang, P.; Wu, J. Mechanical behavior and self-healing mechanism of polyurea-based double-walled microcapsule/epoxy composite films. Prog. Org. Coat. 2021, 157, 106283. [Google Scholar] [CrossRef]
  50. Ma, Y.; Zhang, Y.; Liu, J.; Ge, Y.; Yan, X.; Sun, Y.; Wu, J.; Zhang, P. GO-modified double-walled polyurea microcapsules/epoxy composites for marine anticorrosive self-healing coating. Mater. Des. 2020, 189, 108547. [Google Scholar]
  51. Buttlar, W.G.; Hill, B.C.; Kim, Y.R.; Kutay, M.E.; Millien, A.; Montepara, A.; Paulino, G.H.; Petit, C.; Pop, I.O.; Romeo, E.; et al. Digital image correlation techniques to investigate strain fields and cracking phenomena in asphalt materials. Mater. Struct. 2014, 47, 1373–1390. [Google Scholar]
  52. Hao, W.; Ge, D.; Ma, Y.; Yao, X.; Shi, Y. Experimental investigation on deformation and strength of carbon/epoxy laminated curved beams. Polym. Test. 2012, 31, 520–526. [Google Scholar]
  53. Yan, F.F.; Xu, X.D. Negative Possion’s Ratio Honeycomb Structure and Its Applications in Structure Design of Morphing Aircraft. China Mech. Eng. 2012, 23, 542–546. [Google Scholar]
Figure 1. Tensile strength of cement-based composites (1d, 3d, 7d, 14d, and 28d).
Buildings 15 01251 g001
Figure 2. Compressive strength of cement-based composites (1d, 3d, 7d, 14d, and 28d).
Buildings 15 01251 g002
Figure 3. Flexural strength of cement-based composites (1d, 3d, 7d, 14d, and 28d).
Buildings 15 01251 g003
Figure 4. Compressive strength of composites.
Buildings 15 01251 g004
Figure 5. Tensile strength of the specimens.
Buildings 15 01251 g005
Figure 6. Displacement field images of cement-based composites under compressive load: (A) X direction; (B) Y direction.
Buildings 15 01251 g006
Figure 7. The strain field images of cement-based composites under compressive load: (A) X direction; (B) Y direction.
Buildings 15 01251 g007
Figure 8. Displacement field images of cement-based composites under tensile load: (A) X direction; (B) Y direction.
Buildings 15 01251 g008
Figure 9. The compressive strain field images of cement-based composites under tensile load: (A) X direction; (B) Y direction.
Buildings 15 01251 g009
Figure 10. Negative Poisson’s ratio under compressive load I (Formulas (1)–(6)).
Buildings 15 01251 g010
Figure 11. Negative Poisson’s ratio under compressive load II (Formulas (6)–(11)).
Buildings 15 01251 g011
Figure 12. Negative Poisson’s ratio under tensile load I (Formulas (1)–(6)).
Buildings 15 01251 g012
Figure 13. Negative Poisson’s ratio under tensile load II (Formulas (6)–(11)).
Buildings 15 01251 g013
Figure 14. Microstructure of hydration products under TEM test: (a) SAC-CAC; (b) Na2SO4; (c) adipic acid; (d) gelatin.
Buildings 15 01251 g014
Figure 15. Microstructure evolution of negative Poisson’s ratio crystal: (a) before regulation; (b) after regulation.
Buildings 15 01251 g015
Figure 16. The calculation and theoretical prediction model of the Poisson’s ratio structure in concave [53].
Buildings 15 01251 g016
Figure 17. Ideal model of microstructure with negative Poisson’s ratio: (a) hexagonal–hexagonal; (b) star–triangle.
Buildings 15 01251 g017
Figure 18. Compression simulation deformation of hexagonal–hexagonal microstructure model: (a) initial stage; (b) middle stage; (c) later stage; (d) comparison of deformation before and after compression.
Buildings 15 01251 g018
Figure 19. Tensile simulation deformation of hexagonal–hexagonal microstructure model: (a) initial stage; (b) middle stage; (c) later stage; (d) comparison of deformation before and after tensile.
Buildings 15 01251 g019
Figure 20. Compression simulation deformation of star–triangle microstructure model: (a) initial stage; (b) middle stage; (c) later stage; (d) comparison of deformation before and after compression.
Buildings 15 01251 g020
Figure 21. Tensile simulation deformation of star–triangle microstructure model: (a) initial stage; (b) middle stage; (c) later stage; (d) comparison of deformation before and after tensile.
Buildings 15 01251 g021
Table 1. Chemical composition of cement.
Chemical Composition (wt%)Al2O3CaOSiO2Fe2O3SO3MgOK2OTiO2Na2OP2O5LOI
CAC50.8135.87.962.410.170.40.042.010.180.060.42
SAC22.4742.78.152.6614.982.080.621.360.200.074.81
Table 2. Mineralogical composition of raw cement.
Phases (wt%)CAYe’elimiteGehleniteGrossiteMayeniteSpinelFerriteBeliteGypsumDolomite
CAC71.8\23.22.51.30.80.4\\\
SAC\65.3\\8.9\0.922.81.50.6
Table 3. Formula number and raw material mass ratio.
Formula1234567891011
SAC100%90%80%70%60%50%40%30%20%10%0%
CAC0%10%20%30%40%50%60%70%80%90%100%
Table 4. Sample number and raw material ratio of deformation test.
Sample NumberSACCACSAC-CACSodium SulfateAdipic AcidGelatin
SAC100%0%70%70%70%70%
CAC0%100%30%30%30%30%
Crystal modifier\\\Sodium sulfateAdipic acidGelatin
Table 5. Dynamic Poisson’s ratio distribution under compression and tension.
Formula1234567891011
CompressionAverage0.230.200.160.150.150.170.180.180.220.230.24
Maximum0.280.260.250.200.230.250.250.260.260.260.30
Minimum0.150.120.050.000.000.030.050.050.080.150.15
TensionAverage0.230.200.170.130.150.180.200.210.220.230.24
Maximum0.280.260.250.200.240.250.250.260.260.260.30
Minimum0.150.100.04−0.050.000.020.050.090.120.140.15
Disclaimer/Publisher’s Note: The statements, opinions and data contained in all publications are solely those of the individual author(s) and contributor(s) and not of MDPI and/or the editor(s). MDPI and/or the editor(s) disclaim responsibility for any injury to people or property resulting from any ideas, methods, instructions or products referred to in the content.

