Article

A Study on the Mechanical Properties and Performance of Fibrous Rubberized Concrete

College of Hydraulic and Civil Engineering, Xinjiang Agricultural University, Urumqi 830052, China
*
Author to whom correspondence should be addressed.
Buildings 2025, 15(8), 1245; https://doi.org/10.3390/buildings15081245
Submission received: 3 March 2025 / Revised: 28 March 2025 / Accepted: 8 April 2025 / Published: 10 April 2025
(This article belongs to the Section Building Materials, and Repair & Renovation)

Abstract

Conventional concrete does not often meet engineering needs in high-impact scenarios, such as airport runways and bridges, due to its brittleness, low tensile strength and insufficient resistance to dynamic loading. Although existing rubberized concrete exhibits an enhanced toughness, granular rubber exhibits significantly poorer mechanical properties, limiting its wide application. For this reason, in this study, we propose incorporating rubber in the form of fiber and systematically investigate the effects of the rubber fiber type (NBR, silicone rubber, EPDM), admixture amount (5%, 10%, 15%) and length (6, 12, 18 mm) on the mechanical properties and impact resistance of concrete. Through cubic compression, split tensile and drop hammer impact tests, combined with SEM microanalysis and Weibull distribution modeling, the trends in properties and the mechanisms of action were revealed. The key findings included the following: (1) The equal-volume replacement of fine aggregates with fibrous rubber significantly reduced the static strength, with NBR exhibiting the lowest compressive strength loss (13.12%) compared to silicone rubber (30.86%) and EPDM (21.52%). The splitting tensile strength decreased by 10.11%, 23.67% and 13.56%, respectively. (2) The rubber dosage was negatively correlated with static strength, while an increased fiber length partially mitigated strength degradations. (3) Fibrous rubber markedly enhanced impact resistance: the final crack impact cycles of NBR, silicone rubber and EPDM were increased by 255%, 147.5% and 212.5%, respectively, compared to plain concrete. The optimal mix (15% dosage, 12mm NBR) improved the impact life by 330%. (4) Weibull distribution analysis confirmed that the impact resistance data conformed to a two-parameter model (R2 ≥ 0.808), with a high consistency between the predicted and experimental results. The results of this research can be applied to transportation infrastructures (e.g., heavy-duty pavements, bridges) that require a high impact resistance, with environmental benefits. However, the study did not analyze the long-term durability (e.g., effects of freeze–thaw and chemical corrosion) or perform an economic analysis of rubber fiber processing costs; this needs to be further explored in the future to promote practical engineering applications.

1. Introduction

Concrete, as the most widely used construction material globally, faces inherent limitations such as its brittleness, low tensile strength and poor resistance to dynamic loads such as impact and fatigue [1]. At the same time, the rapid development of the automobile industry has led China to become the world’s largest producer of waste tires in recent years. China’s waste tire recycling rate is about 60%, and a large number of waste tires will lead to environmental pollution [2]. Rubber concrete not only has an enhanced toughness and impact resistance, but also alleviates the problems of resource waste and the environmental pollution of waste tires [3]. Rubberized concrete is mainly used in structural projects such as airport runways, embankments and bridges, which encounter problems such as vehicle crushing and collisions, the impact from gravel particles and abrasion [4,5,6]. Thus, rubber concrete requires a certain level of impact resistance and toughness.
Relevant studies have shown that rubber particles, when used to replace the coarse and fine aggregates of concrete, reduce the concrete’s compressive strength and splitting tensile strength, and the degree of reduction varies linearly with the amount of rubber particles [7,8,9,10]. Comparing rubber granules, rubber powder and acicular rubber, the smaller the rubber particle size, the greater the reduction in mechanical properties [11,12]. Due to its elastic characteristics when mixed as an aggregate into the concrete, the impact load of rubber may be compression deformation under the action of a reduced impact kinetic energy, which improves the concrete’s impact resistance [13,14]. Concrete’s energy absorption and impact resistance increase and improve with the size of the rubber particles and the admixture amount [15,16]. The addition of fibers stresses the concrete to a certain extent, reducing crack generation and development, alleviating the effect of the tip of the stress concentration between the cracks and thus improving the mechanical properties of concrete [17,18]. The rubber used in the current research on single-mixed rubber concrete is mainly granular or powdered rubber [19,20]. Combining the advantages of rubber’s elasticity and fiber morphology, it is incorporated into concrete in a fibrous form to mitigate the reduction in mechanical properties in concrete and at the same time improve the impact resistance.
This study comprehensively evaluated the mechanical properties and impact resistance of fibrous rubberized concrete. Different lengths (6, 12 and 18 mm), different dosages (5%, 10% and 15%) and different types of fibrous rubbers (nitrile, silicone and EPDM) were investigated, focusing on the compressive strength, split tensile strength and drop impact properties. Microstructural analysis via scanning electron microscopy (SEM) elucidated interfacial bonding mechanisms, while the Weibull distribution model was employed to statistically validate impact life predictions. These findings provide engineers with actionable insights for designing impact-resistant infrastructures that have a reduced environmental impact. The experimental steps are shown in Figure 1.

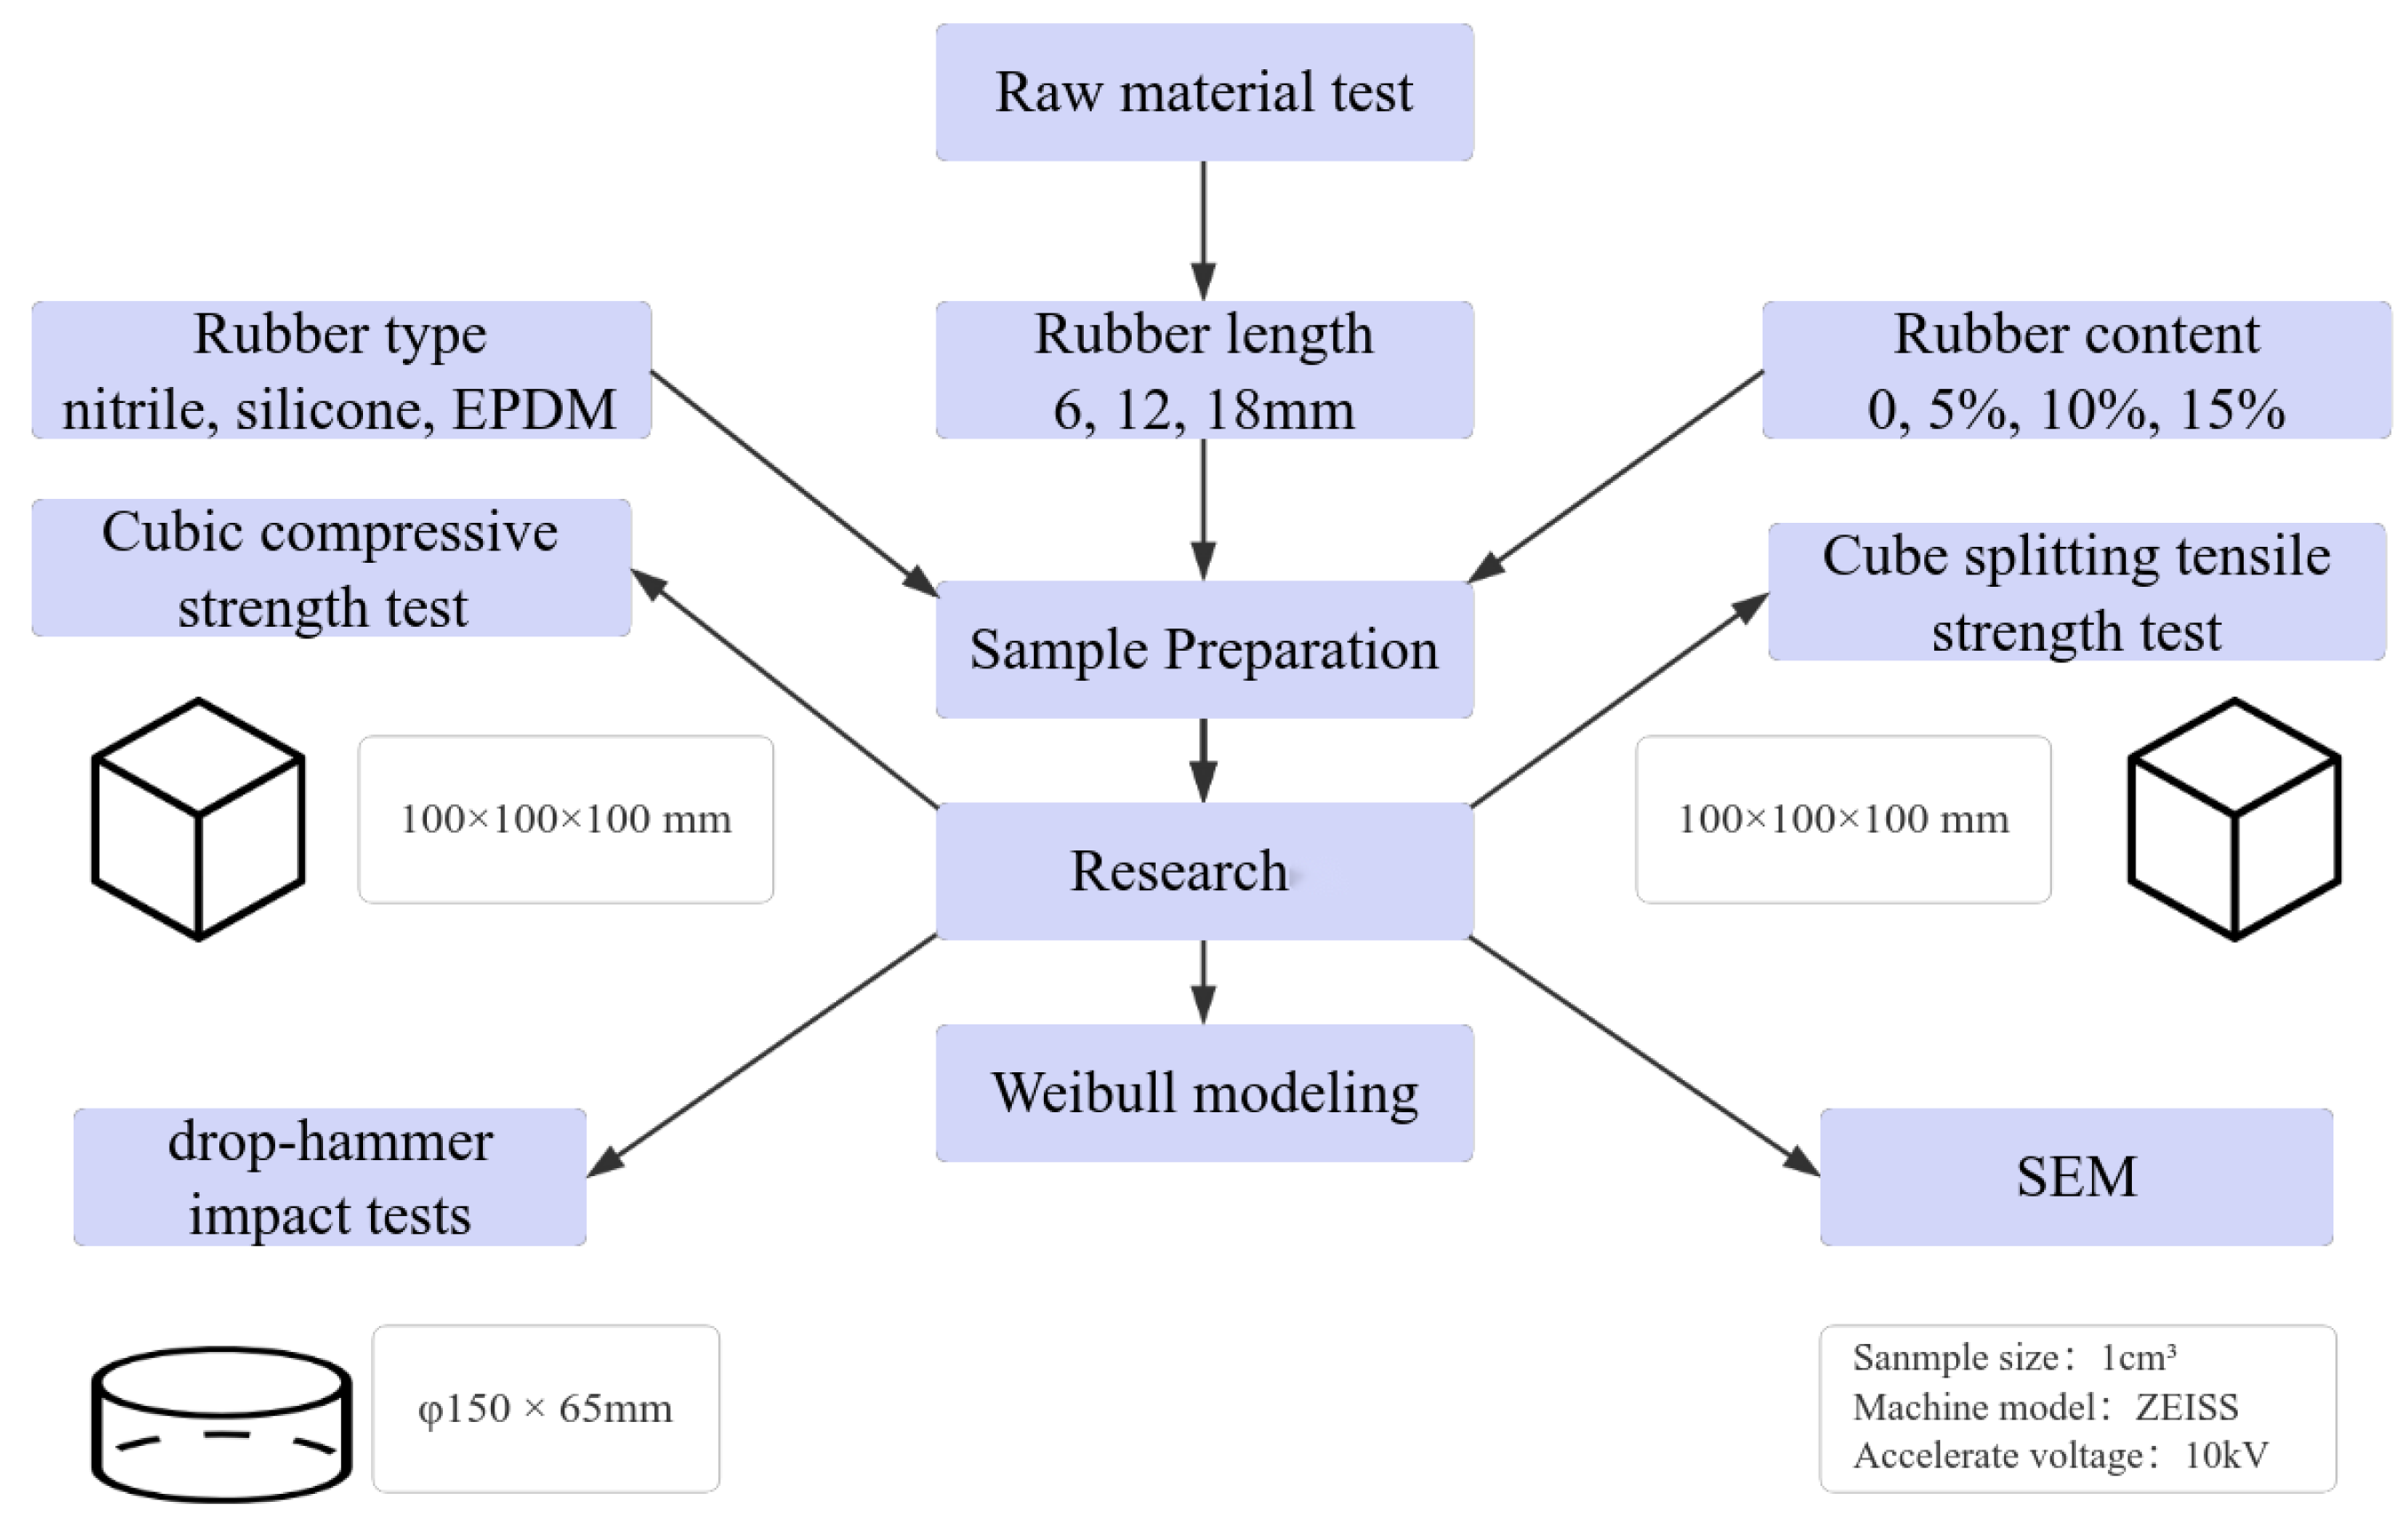
2. Materials and Methods

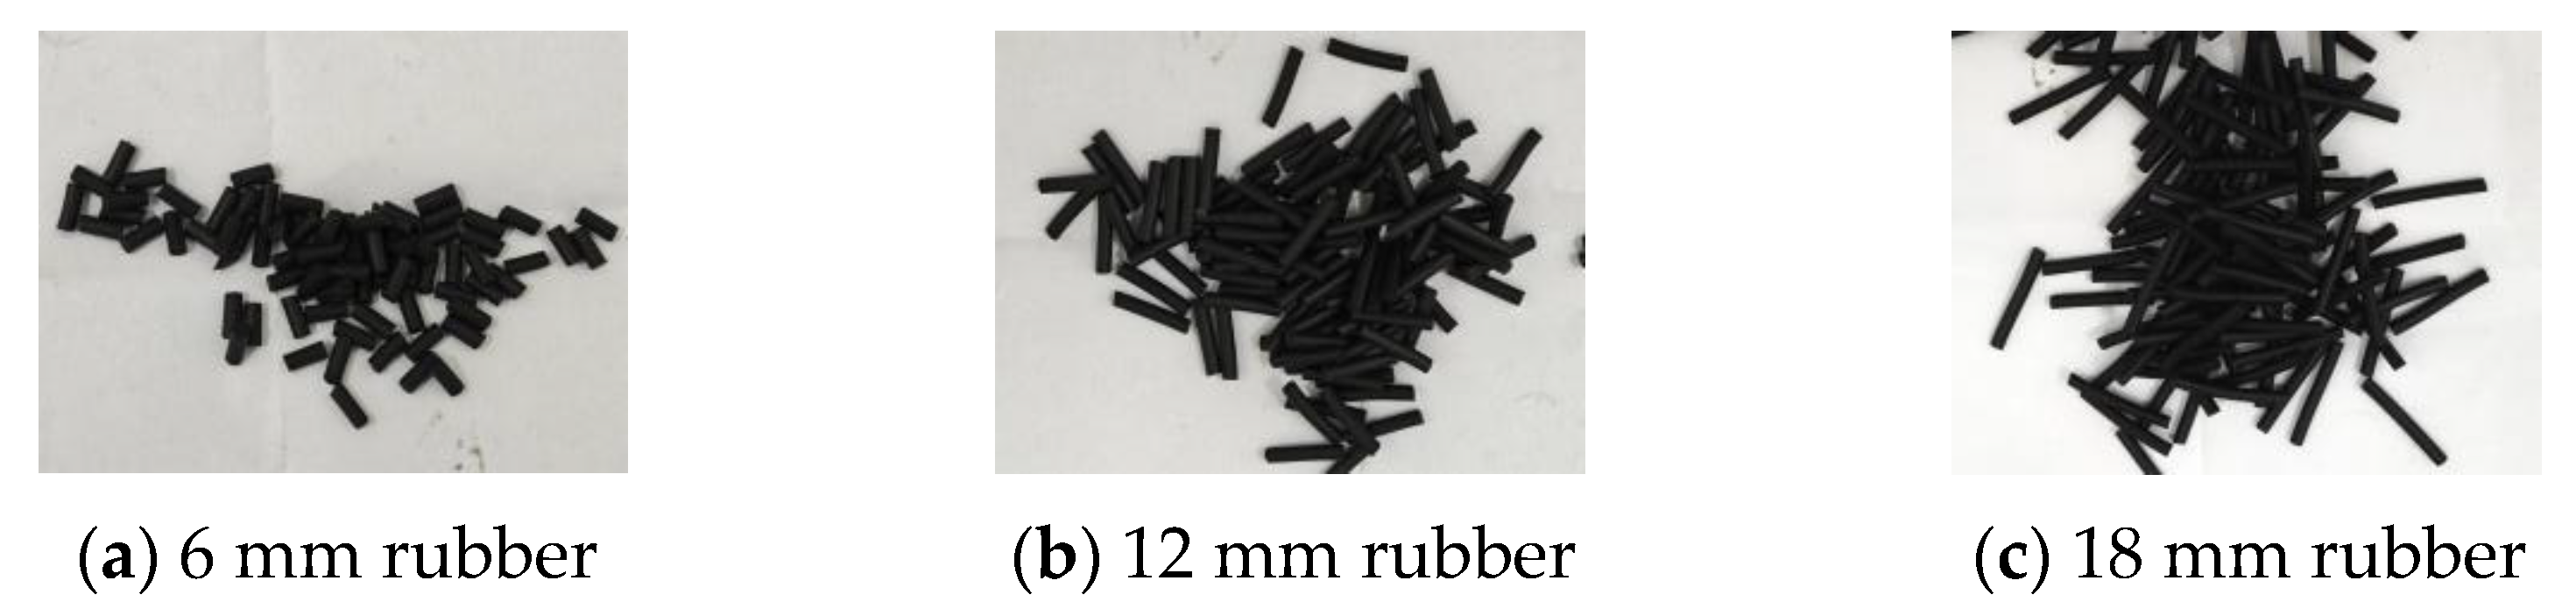
2.1. Experimental Raw Materials

The cement used was Xinjiang Tianshan Cement P-O42.5R (Xinjiang Tianshan Cement Co., Ltd., Urumqi, China). Its stability was confirmed, and its physical and mechanical properties are shown in Table 1. Fine aggregate with a fineness modulus of 2.9 and with an apparent density of 2.6 g/cm3 was used for the mechanism sand, a coarse aggregate with an apparent density of 2.66 g/cm3 was used for the 5~20 mm continuous grading gravel and polycarboxylic acid, a high-efficiency water reducing agent, was added as an additive. Fibrous rubber was used, and via shearing using a machine, lengths of 6, 12 and 18 mm were obtained with a diameter of 2 mm and a density of 1.53 g/m3, 1.35 g/m3 and 1.25 g/m3 for nitrile rubber, EPDM rubber and silicone rubber, respectively. The fibrous rubber of different lengths is shown in Figure 2, and the EDS (Energy Dispersive X-Ray Spectroscopy) results of the elemental content of each fibrous rubber sample are shown in Table 2, Table 3 and Table 4.

2.2. Fibrous Rubber Concrete Sample Preparation

The water–cement ratio of the test piece was 0.4. The volume of fibrous rubber replaced the fine aggregate; the water reducer dosage was 0.2%, and the test ratio is shown in Table 5.
According to the mix ratio of the concrete, the raw materials—cement, stone, sand and rubber fibers—were poured into the mixer and stirred for about 1 min to ensure complete mixing. The water reducer was then weighed and mixed with tap water and stirred well. After pouring and stirring for about 2~3 min, the mixer was opened, and the mixture was then poured into 100 × 100 × 100 mm and φ150 × 65 mm molds and mounted. Before use, machine oil was brushed over the inside of the mold to ensure that the test specimen could be easily removed from the mold after the test. The mold was placed on a vibration table for about 30 s. This duration was chosen because the apparent density of rubber fibers is small; thus, if the vibration time is too long, the rubber fibers will float, affecting the test results. After loading the mixture on the surface of the test mold, it was wrapped in a layer of plastic wrap to prevent water loss, and then the specimen was placed in a standard maintenance room. The temperature was adjusted to 20 ± 2 °C and the relative humidity was set to 95%. The specimen was demolded 24 h later, numbered and left to age for 28 days for the compression, splitting tensile and impact resistance tests.

2.3. Test Methods

According to the SL/T 325-2020 “Hydraulic Concrete Test Procedure” for mechanical property testing, a compressive strength loading rate of 0.5 MPa/s~0.8 MPa/s and a split tensile strength loading rate of 0.05 MPa/s~0.08 MPa/s were chosen [21].
The compressive strength was calculated according to Formula (1)
f c c = 0.95 P A × 1000
where fcc is the compressive strength, MPa; P is the destructive load, kN; and A is the specimen compressive area, mm2.
The split tensile strength was calculated using Equation (2).
f t s = 0.85 2 P π A × 1000
where fts is the splitting tensile strength, MPa; P is the destructive load, kN; and A is the area of the splitting surface of the specimen, mm2.
Referring to CECS 13:2009 “Standard Test Methods for Fiber Concrete”, a rigid horizontal plate was used as the base of the drop hammer impact device. The test specimen was cake-shaped, with a diameter of 150 mm and a height of 65 mm, and the diameter of the impact ball was 63 mm. The mass of the impact hammer was 4.5 kg, and the hammer was dropped freely from a height of 450 mm to impact the ball placed on the top surface of the test specimen. The impact hammer was lifted to the preset groove at the top of the specimen after every impact to ensure that the center of the specimen, the impact ball and the impact hammer were in the same vertical straight line. One impact was considered a complete cycle. When the first crack appeared on the surface of the specimen, this was the initial crack impact number N1, and when the crack was observed to run through the specimen, this was the final crack impact number N2 [22].
The concrete impact work was calculated as:
W = m g h n
where W is the impact work, J; m is the mass of the impact hammer, kg; g is the acceleration of gravity, taken as 9.81 m/s2; h is the falling height of the impact hammer, m; and n is the number of impacts.

3. Results

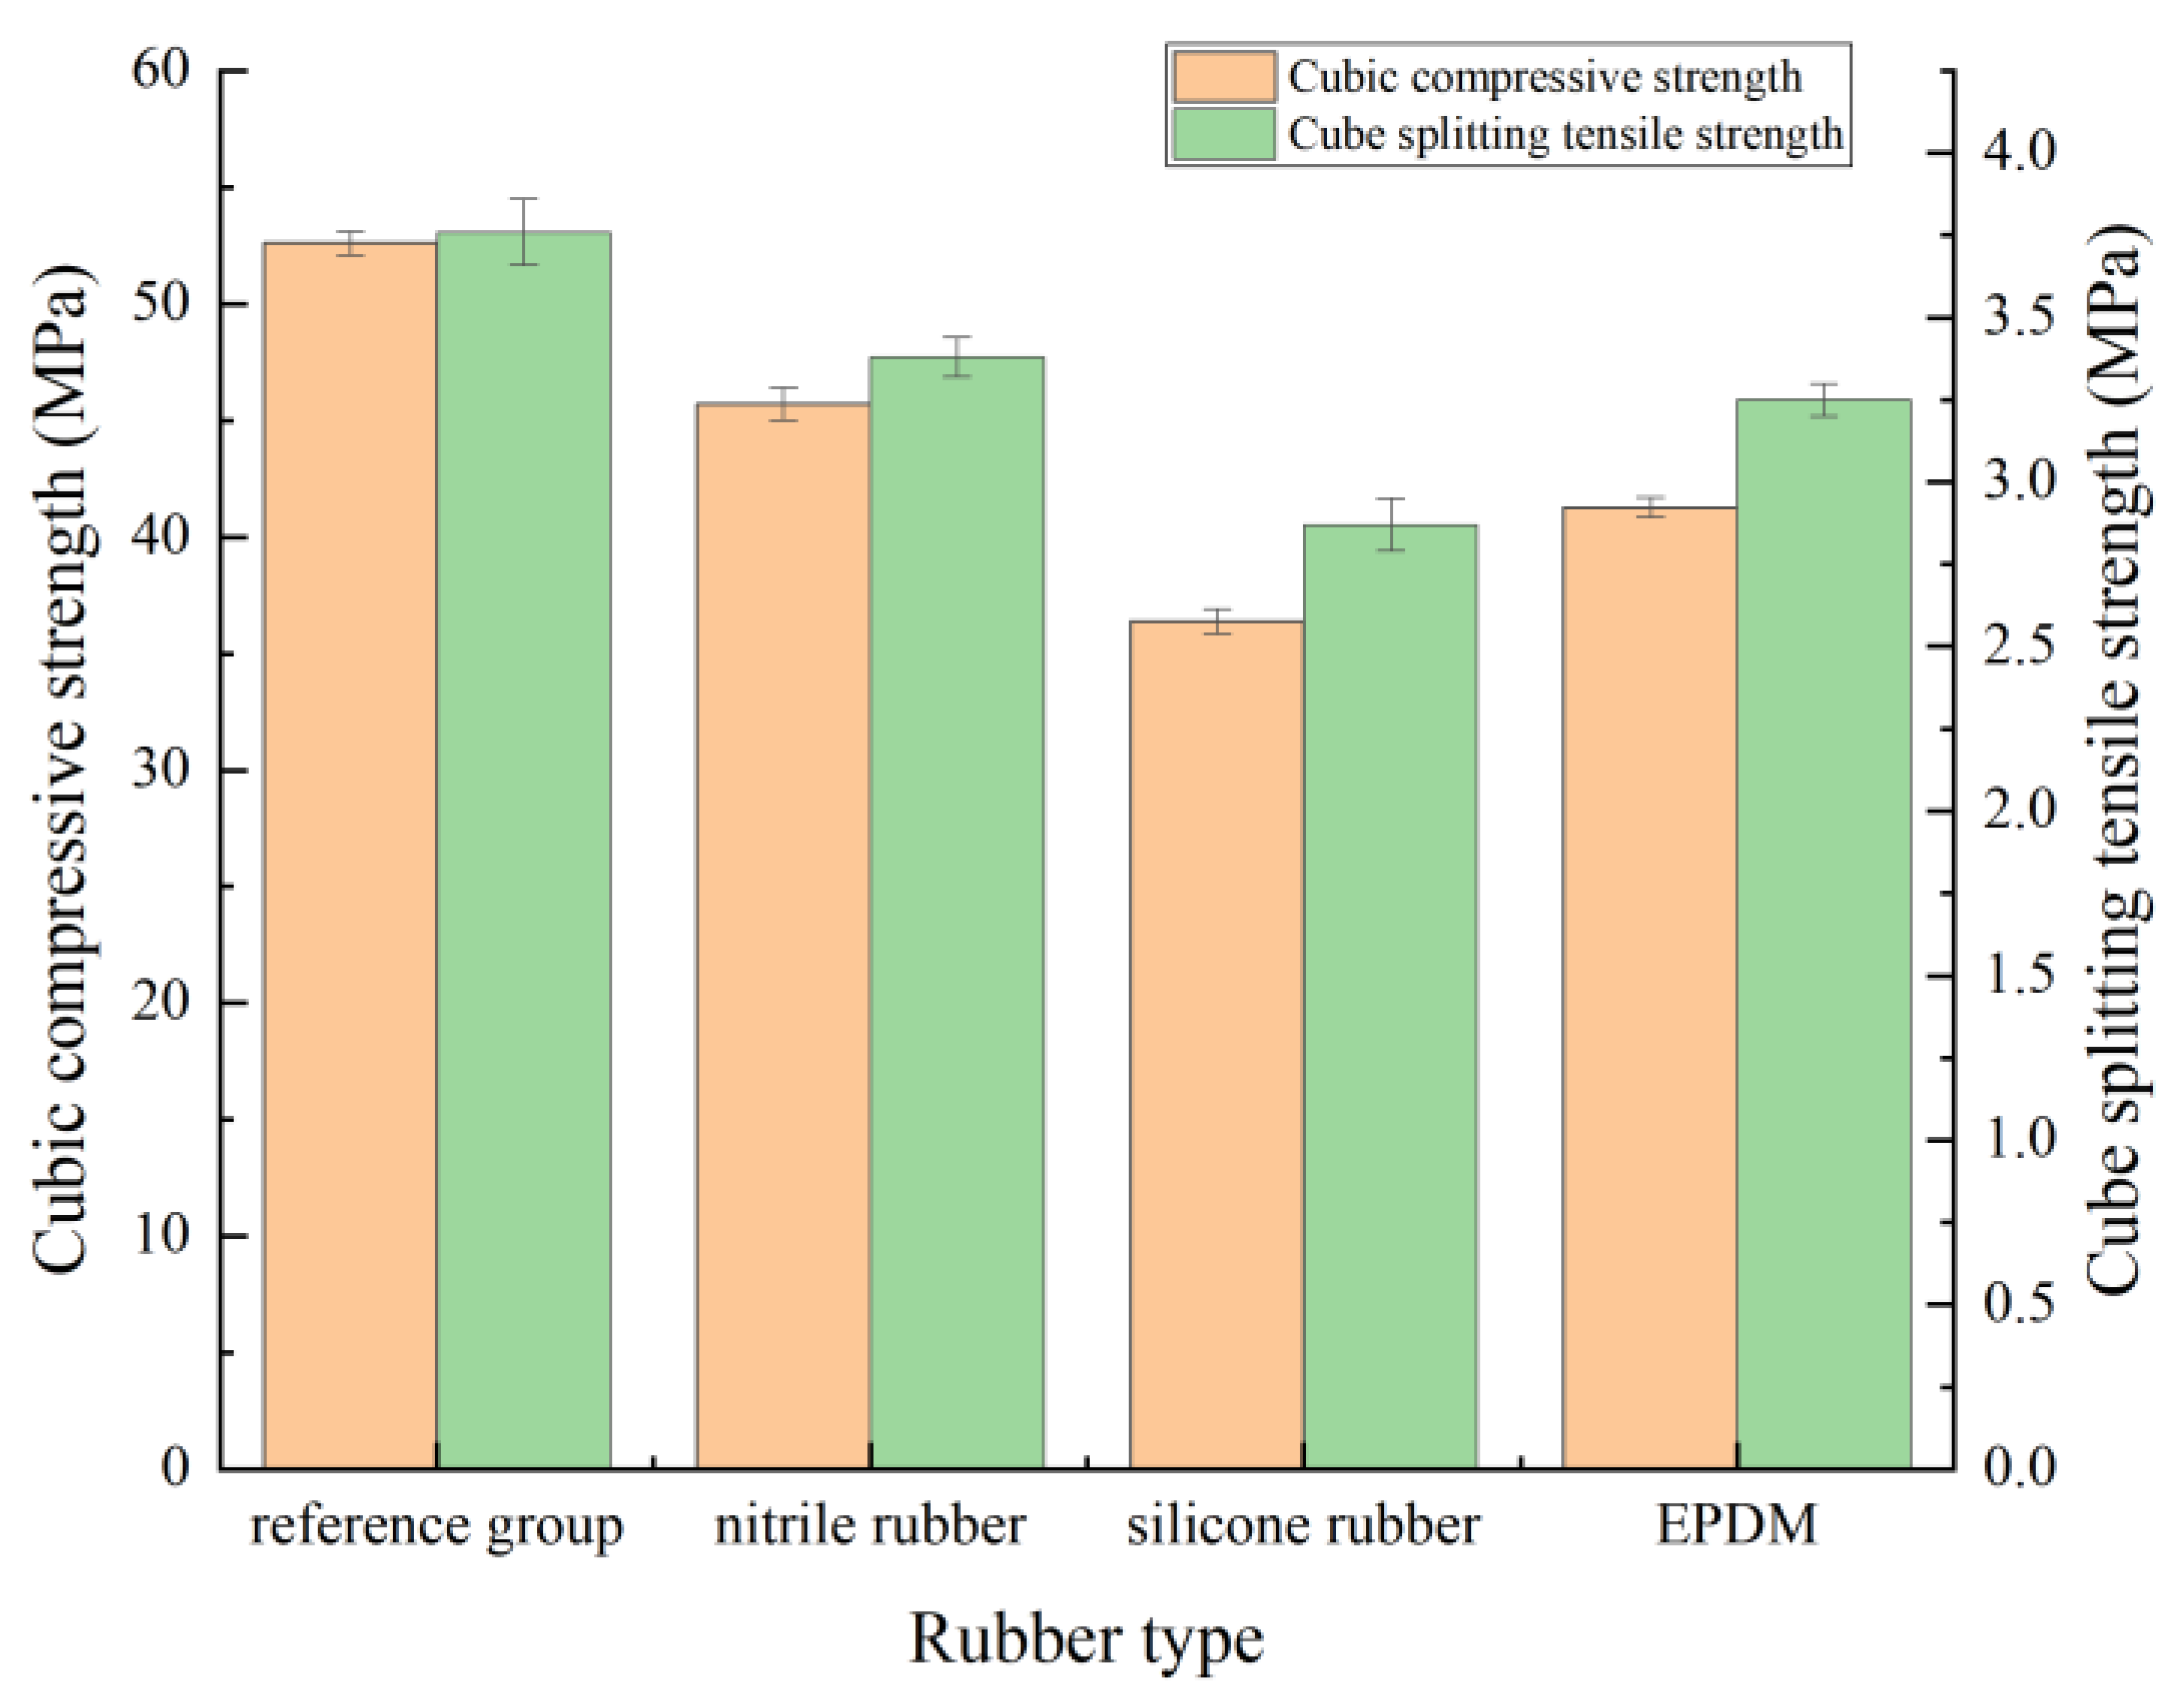
3.1. Static Mechanical Property Analysis

3.1.1. Influence of Rubber Fiber Type

As shown in Table 6 and Figure 3, the incorporation of rubber fiber significantly reduced the static strength of the concrete; however, the performance of different rubber types varied significantly. NBR concrete exhibited the lowest loss in compressive strength (13.12%, 45.7 MPa), which was better than EPDM (21.52%) and silicone rubber (30.86%). The split tensile strength showed the same trend.
The specimens (Figure 4a) underwent typical brittle fractures, with a main crack running through the specimen and a few concentrated cracks. There were few surface cracks in the NBR concrete (Figure 4b) subjected to compressive damage and they were uniformly distributed, and no clear spalling occurred. Compared with NBR concrete (Figure 4b), the silicone rubber (Figure 4c) and EPDM (Figure 4d) concrete specimens had a continuous crack distribution after damage and exhibited severe surface debonding and spalling. From the damage patterns of the specimens, it can be shown that the NBR concrete was superior to the silicone rubber concrete and EPDM concrete.
Coupled with SEM observations, it was shown that the high surface roughness of NBR fibers (Figure 5a) led to a mechanical occlusion with the cement matrix, which reduced the weakening of the interfacial transition zone (ITZ), whereas the smooth surface of silicone rubber (Figure 5b) led to an increase in interfacial slip. The level of performance of EPDM was intermediate due to the partial surface roughness (Figure 5c).
Relative values reflect the relative relationship between one value and another reference value, often expressed as a percentage. Relative value = (Comparative value ÷ Reference value) × 100%.

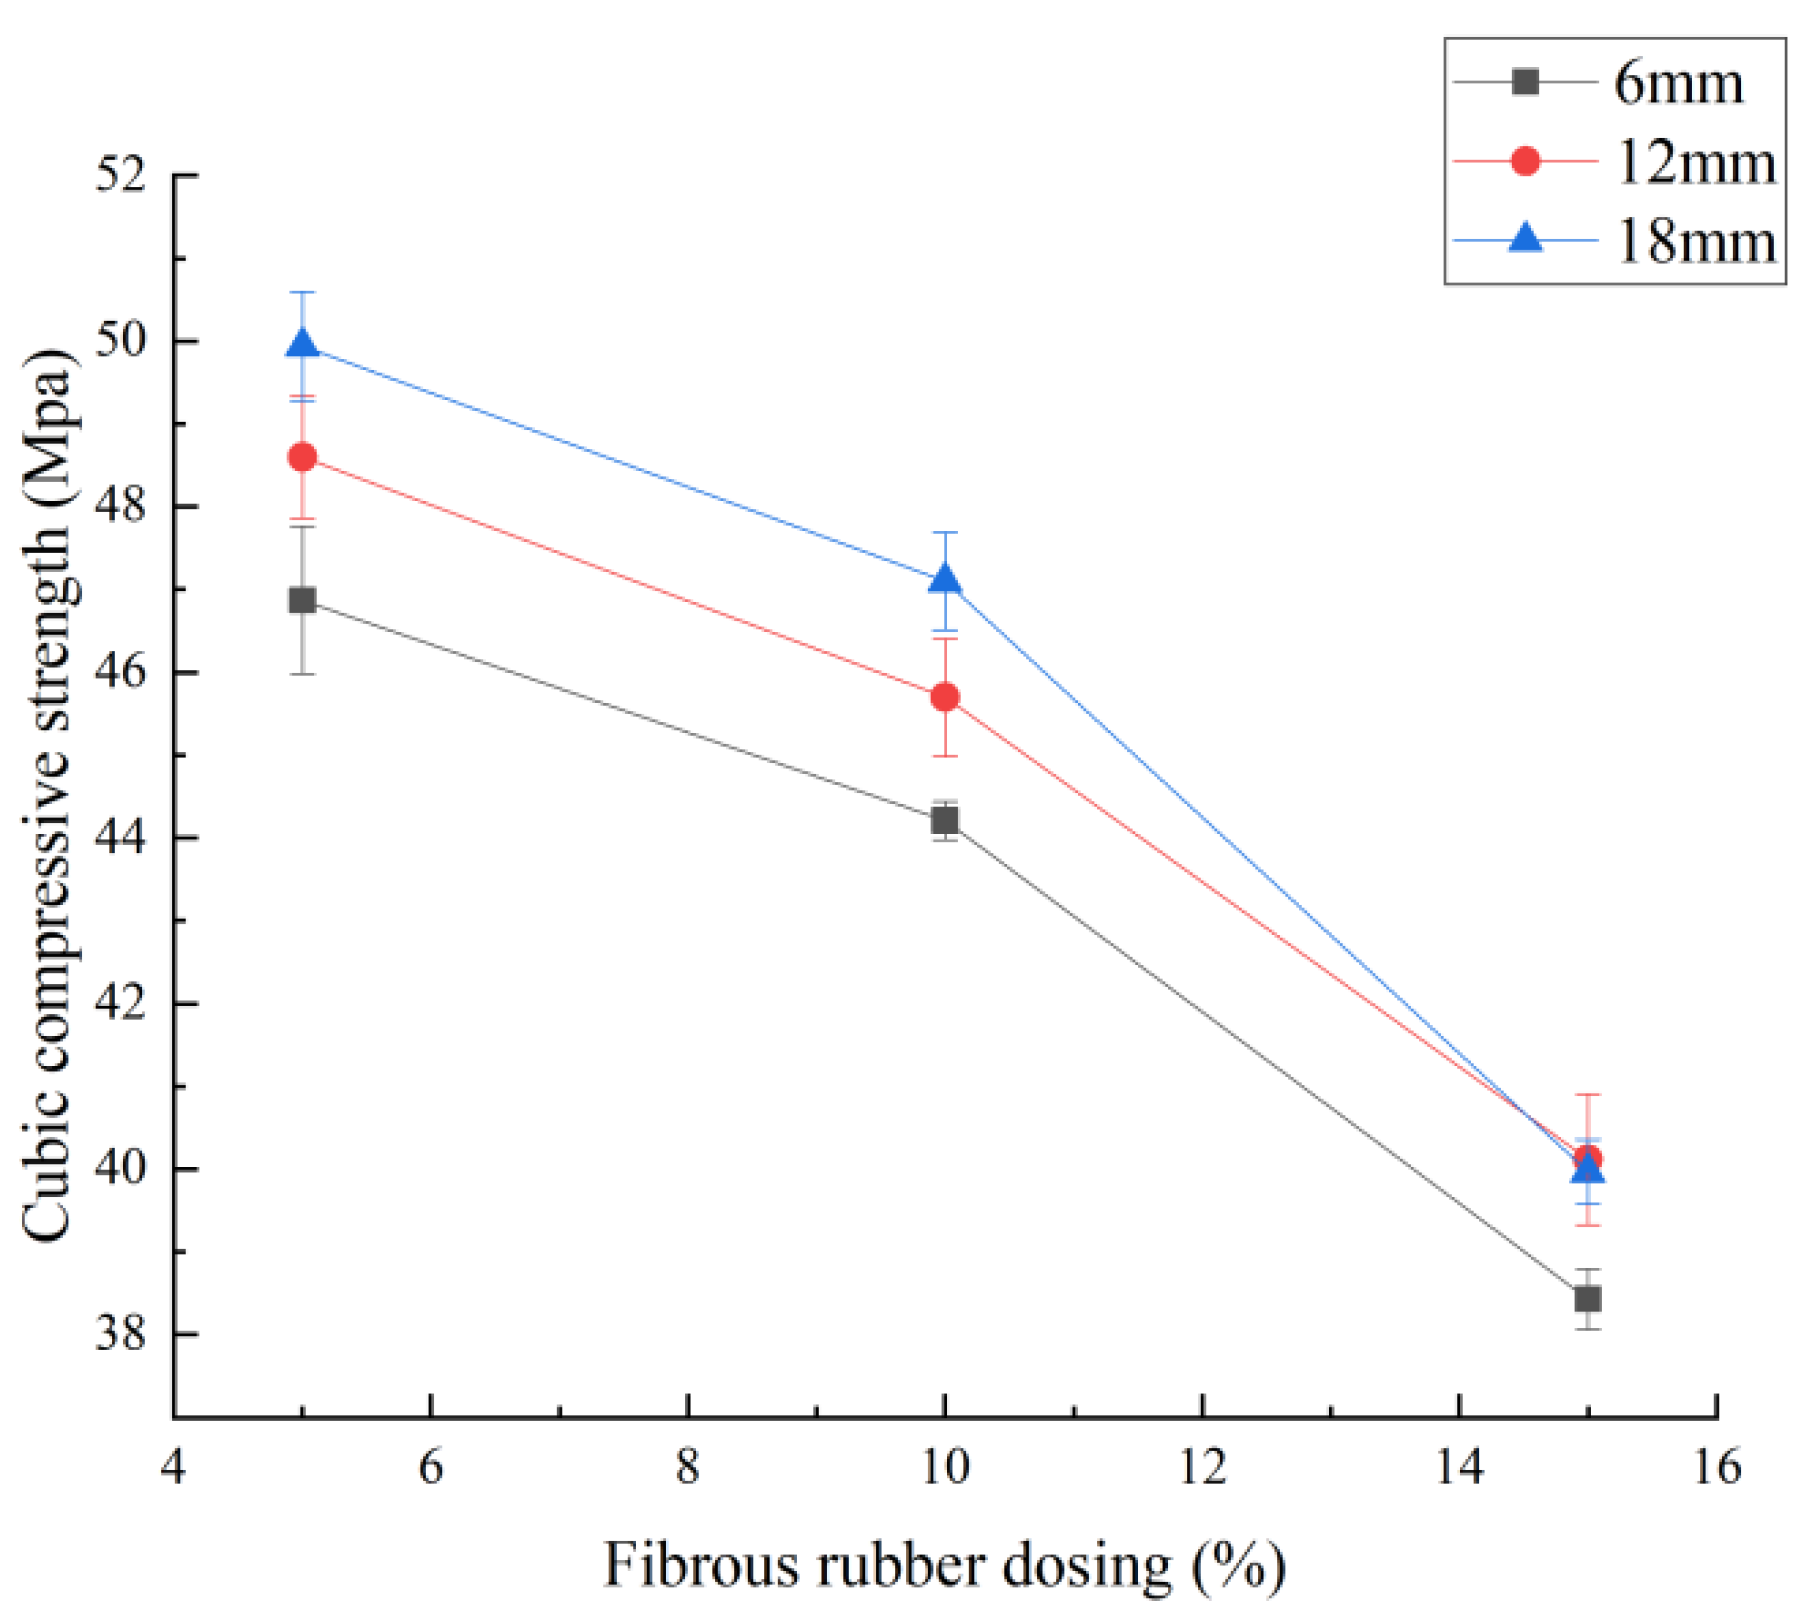
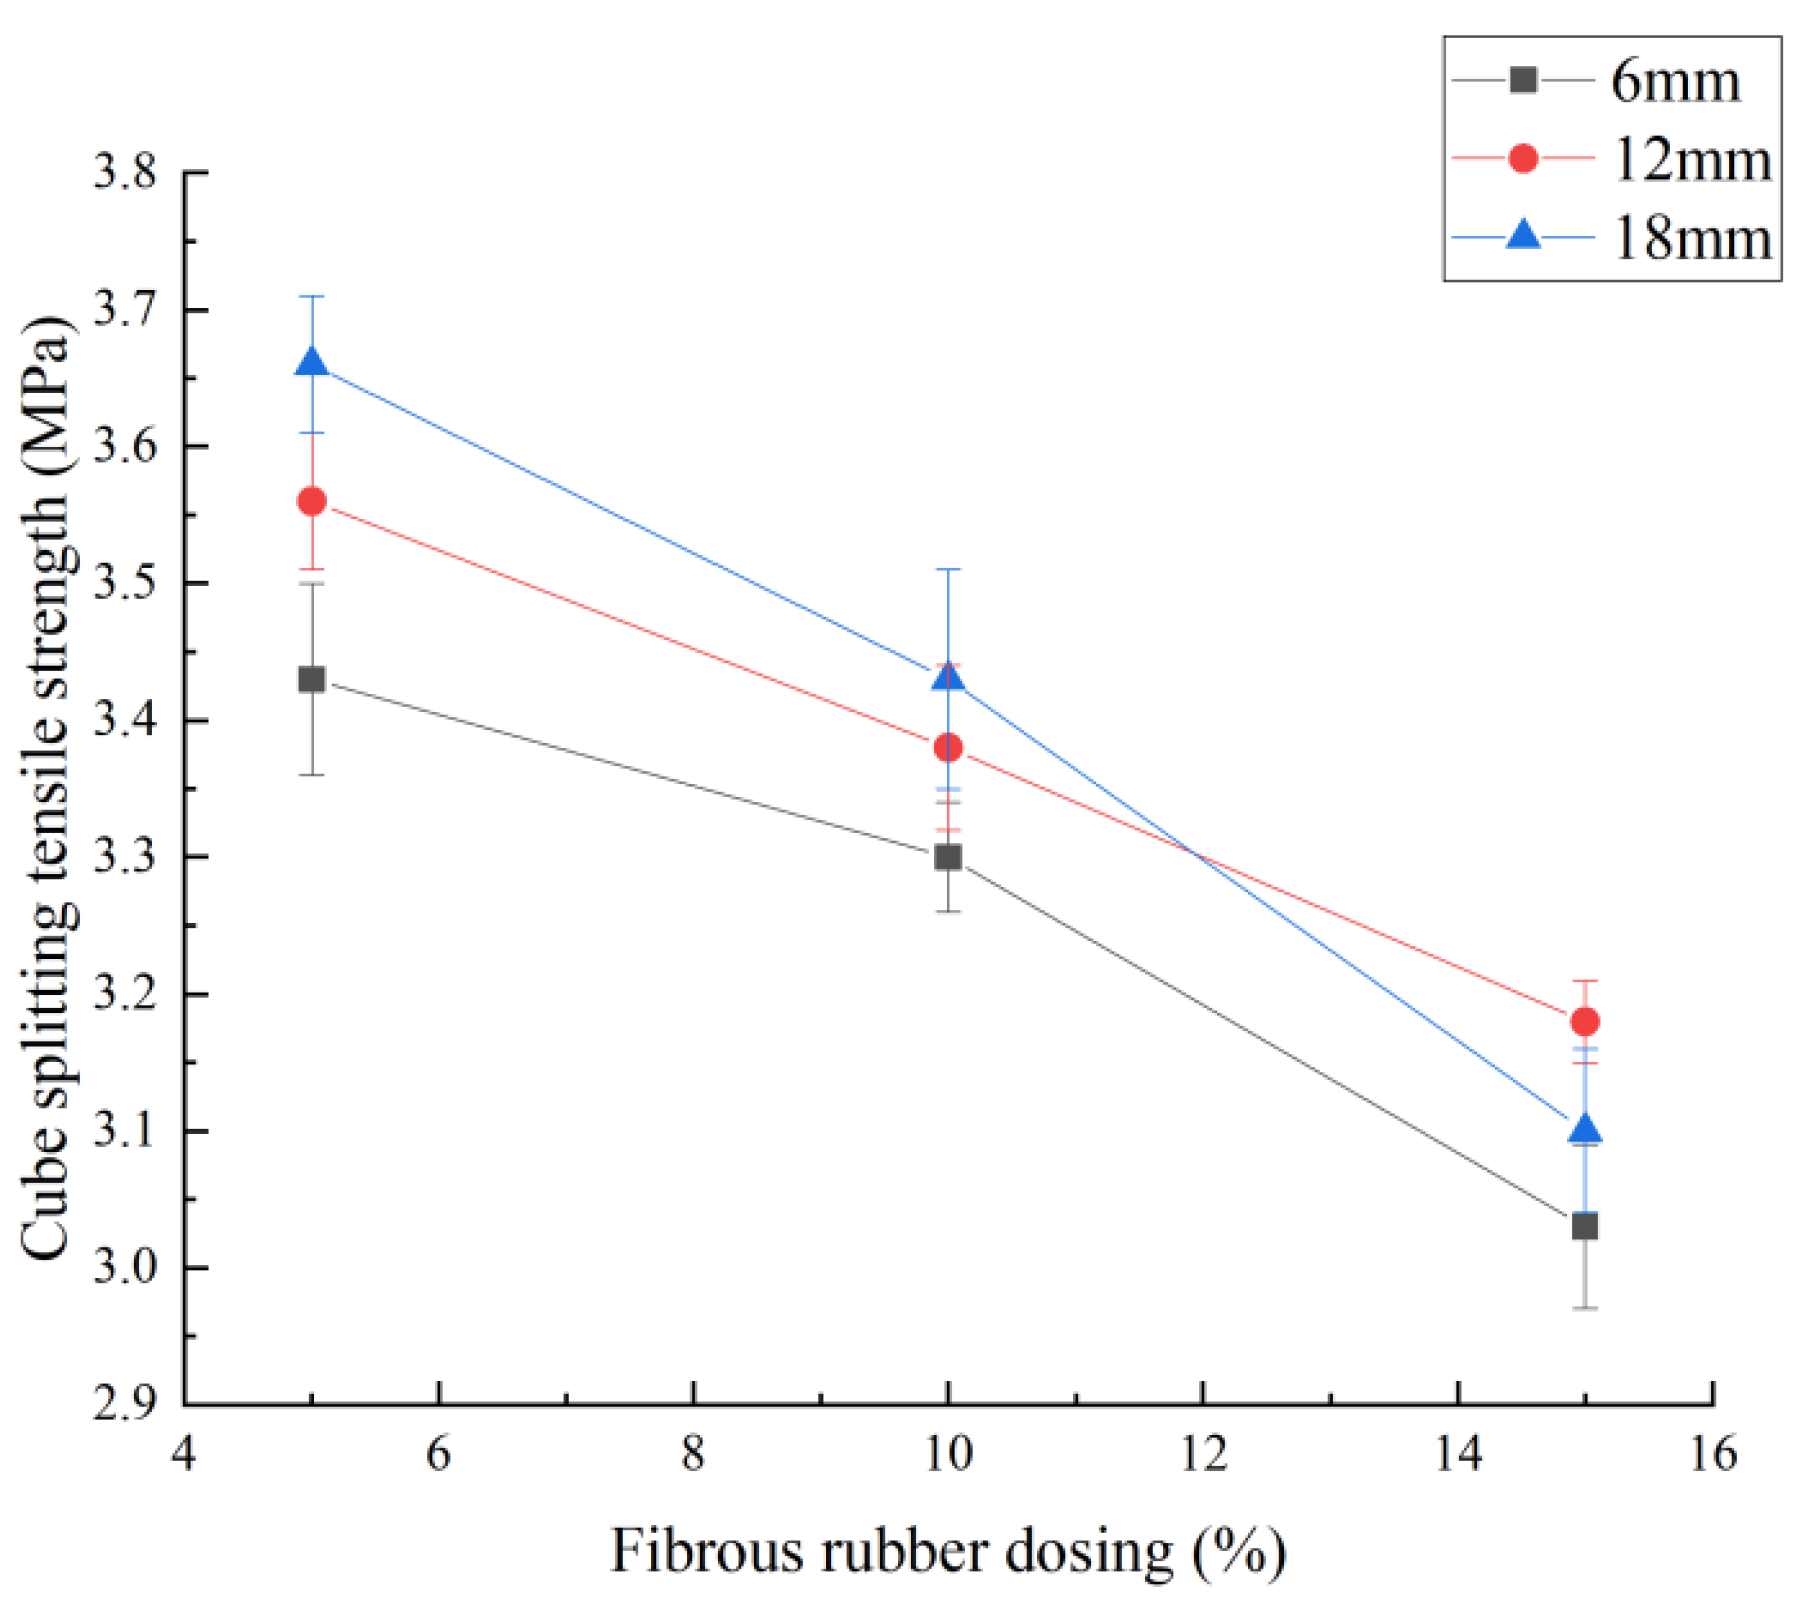
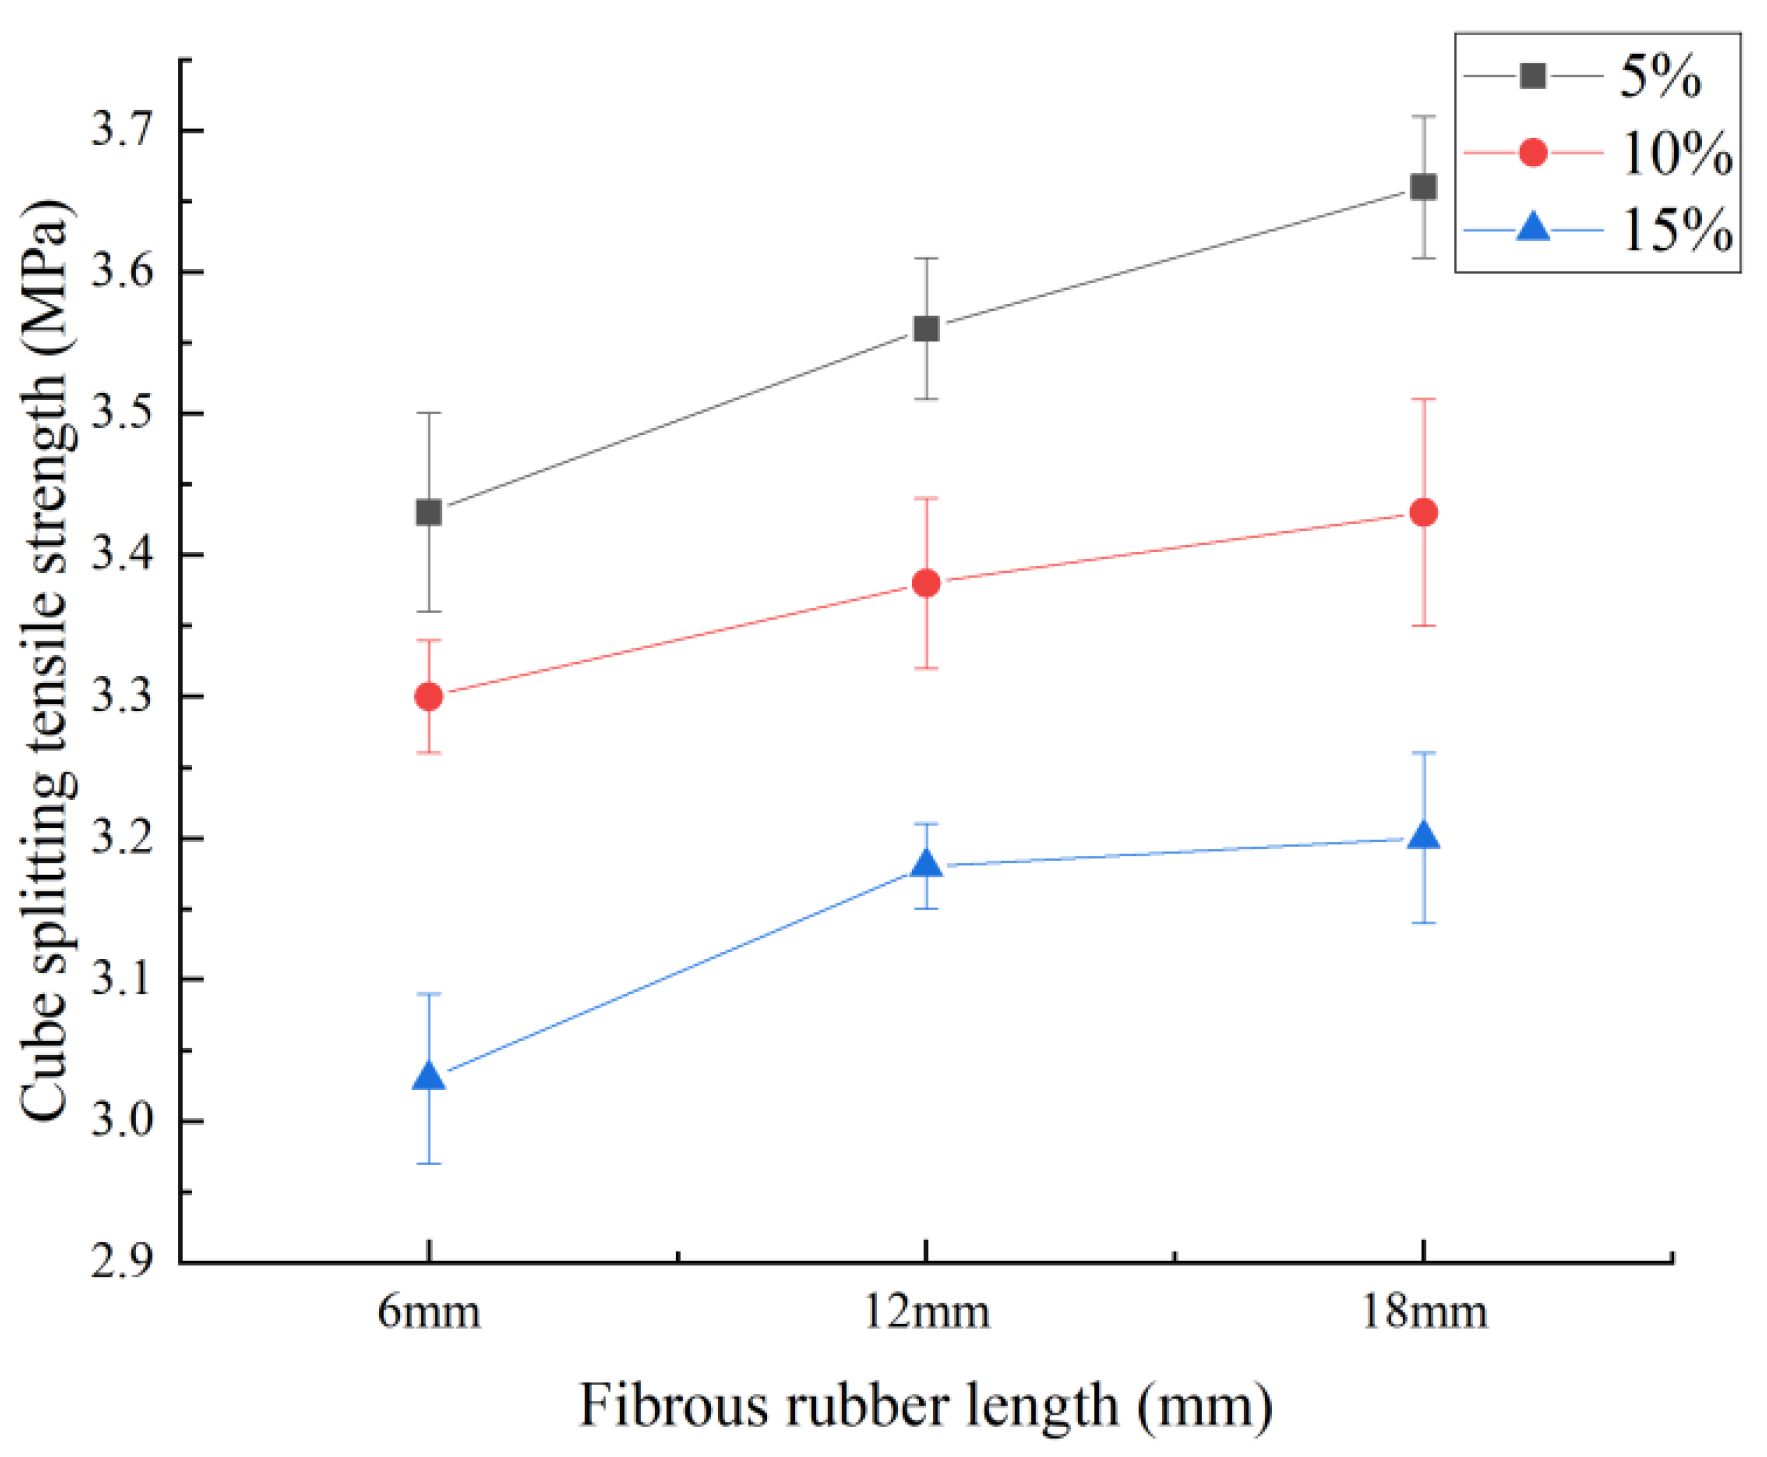
3.1.2. Synergistic Effect of Fibrous Rubber Doping and Length

From Figure 6 and Figure 7, it can be seen that the reduction in strength was related to the rubber dosage: increasing the rubber dosage consistently reduced the compressive and splitting tensile strengths. As shown in Table 6, considering fibrous rubber of the same length (12 mm), the reduction in compressive strength increased from 7.6% (48.6 MPa) to 23.73% (40.12 MPa) when the dosage was increased from 5% to 15%. An increase in dosage resulted in a continuous decrease in the split tensile strength, with this reduction amounting to 15.43% (3.18 MPa) at a dosage of 15%. When the amount of fibrous rubber (5%) was low, the specimen (Figure 10a) had a lower toughness due to there being fewer surface cracks during compressive testing. With an increase in the fibrous rubber dosage to 15%, the toughness of the specimens was evident when damaged, leading to a delay in crack extension, and only tiny cracks were present on the surface of the specimens (Figure 10b).
According to Figure 8 and Figure 9, it can be observed that the compressive strength and split tensile strength tend to increase as the length of the fibrous rubber increases, indicating that longer fibers can partially offset the strength loss. At the same dosage (10%), long fibers (18 mm) slowed down microcrack extension through stress redistribution. For example, at a dosage of 10%, the reduction in compressive strength of 18 mm fibers was only 10.46%, while it was 15.95% for 6 mm fibers; this reduction was only 8.78% (3.43 MPa) at a dosage of 5% for 18 mm fibers, which was better than the 12.23% reduction for 6 mm fibers. In the specimen in Figure 10c, the damage cracks are more concentrated, the fibrous rubber bridging effect is weak and local spalling is evident, while in the specimen in Figure 10d, the damage surface cracks are branching, the fibrous rubber bridging effect is strong and no local spalling is evident.
The interaction between dosage and length showed threshold effects. For example, at a high dosage (15%), long fibers (18 mm) may have caused increased ITZ deterioration due to aggregation defects, and the compressive strength reduction exceeded that of 12 mm fibers (24.01% vs. 23.73%). The compensatory effect of fiber length diminished at dosages over 10%, and the reduction in split tensile strength for 18 mm fibers at a 15% dosage was even higher (17.55%) than that of 12 mm fibers (15.43%).

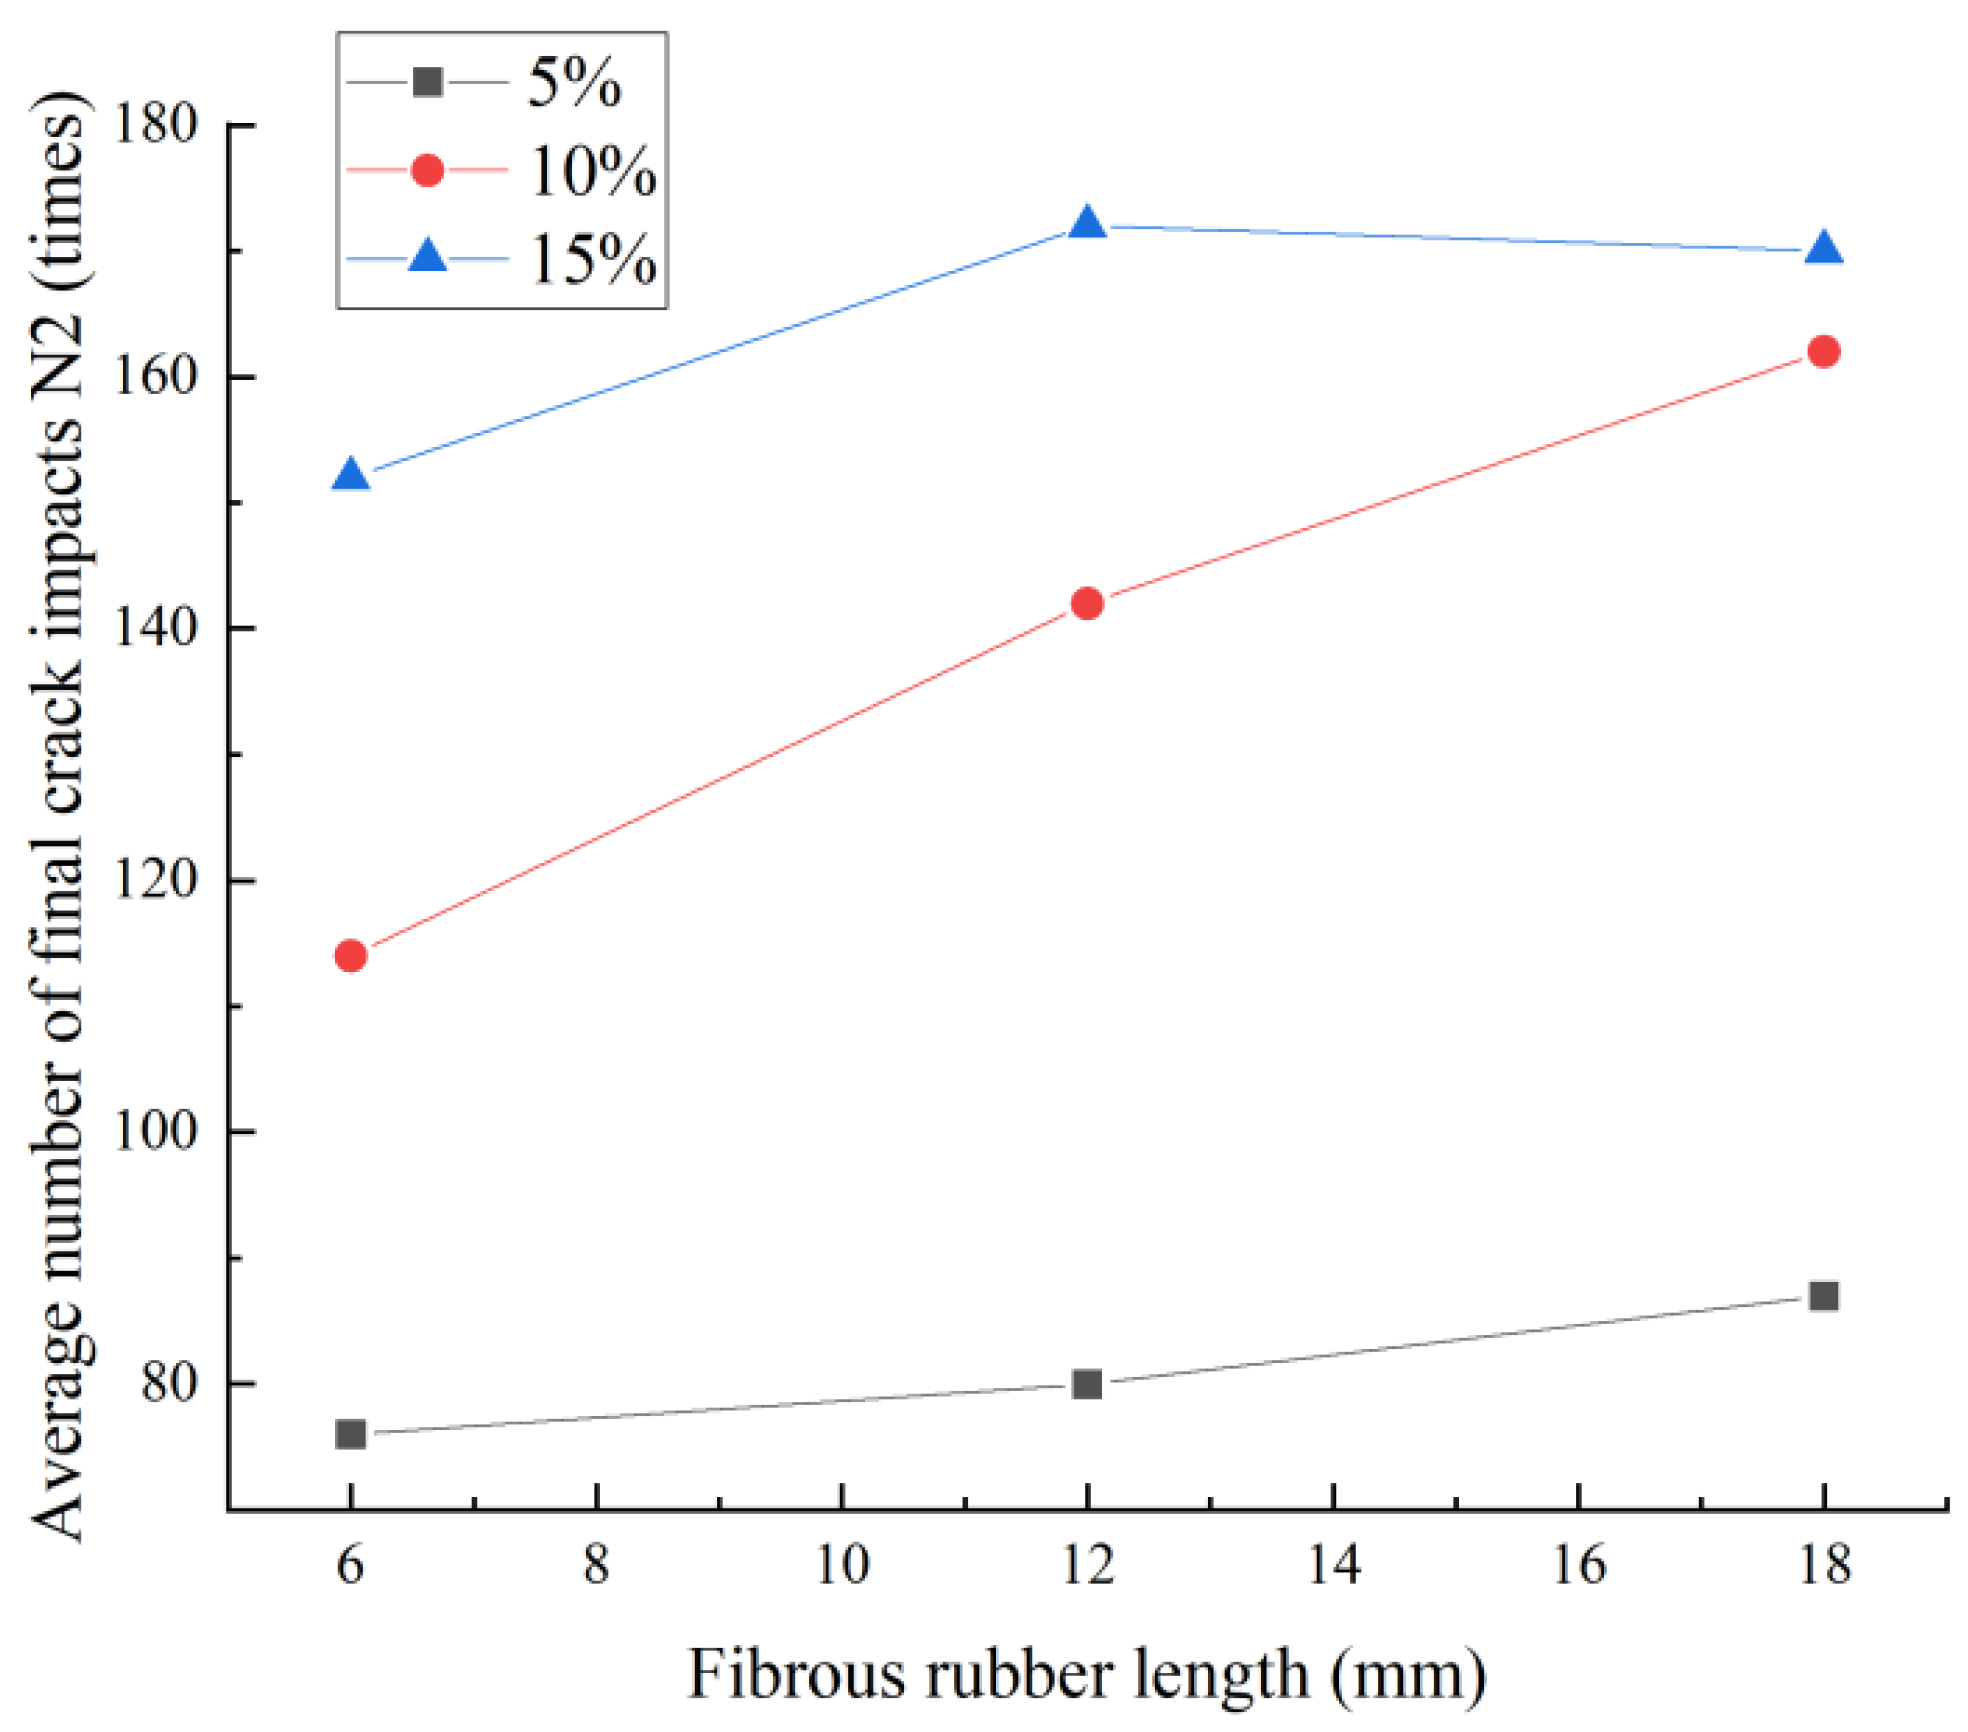
3.2. Impact Resistance

The initial and final cracking results of the impact test are shown in Table 7. As can be seen from Table 7, fibrous rubber can greatly improve the impact resistance of concrete. Different mixing amounts and lengths of fibrous rubber will also affect this impact resistance.
When using the same amount (10%) and length (12 mm) of fibrous rubber, the cumulative impact function of the final crack of the Buna-N, silicone rubber and EPDM rubber increased by 255%, 148% and 213% compared to that of the baseline group, which indicates that the fibrous rubber significantly improved the impact resistance of ordinary concrete. In Figure 11 and Figure 12, the overall trend in the impact resistance of concrete with the increase in fibrous rubber dosage and length is shown. When the dosage is higher than 10% and the fibers are long (18 mm), agglomeration defects easily form, reducing the rubber’s reinforcing effect. Thus, the average number of final cracks of the 12 mm fiber specimen is greater than that of the 18 mm fiber specimen. Table 6 shows that the difference between the initial cracking and final cracking of ordinary concrete is one time, while the maximum difference between the initial cracking and final cracking of fibrous rubber concrete is nine impacts for group 7. The cumulative initial and final cracking impact work ratios of the test groups are relatively similar; thus, the fibrous rubber mainly increases the cumulative initial cracking impact work and the number of impacts to initial cracking and suppresses the concrete under the action of impact loads. A comprehensive comparison of the final crack cumulative impact work of different types, lengths and admixtures of fibrous rubber shows that when the length of nitrile fibrous rubber is 12 mm and the admixture is 15, the enhancement rate is the largest at 330%.

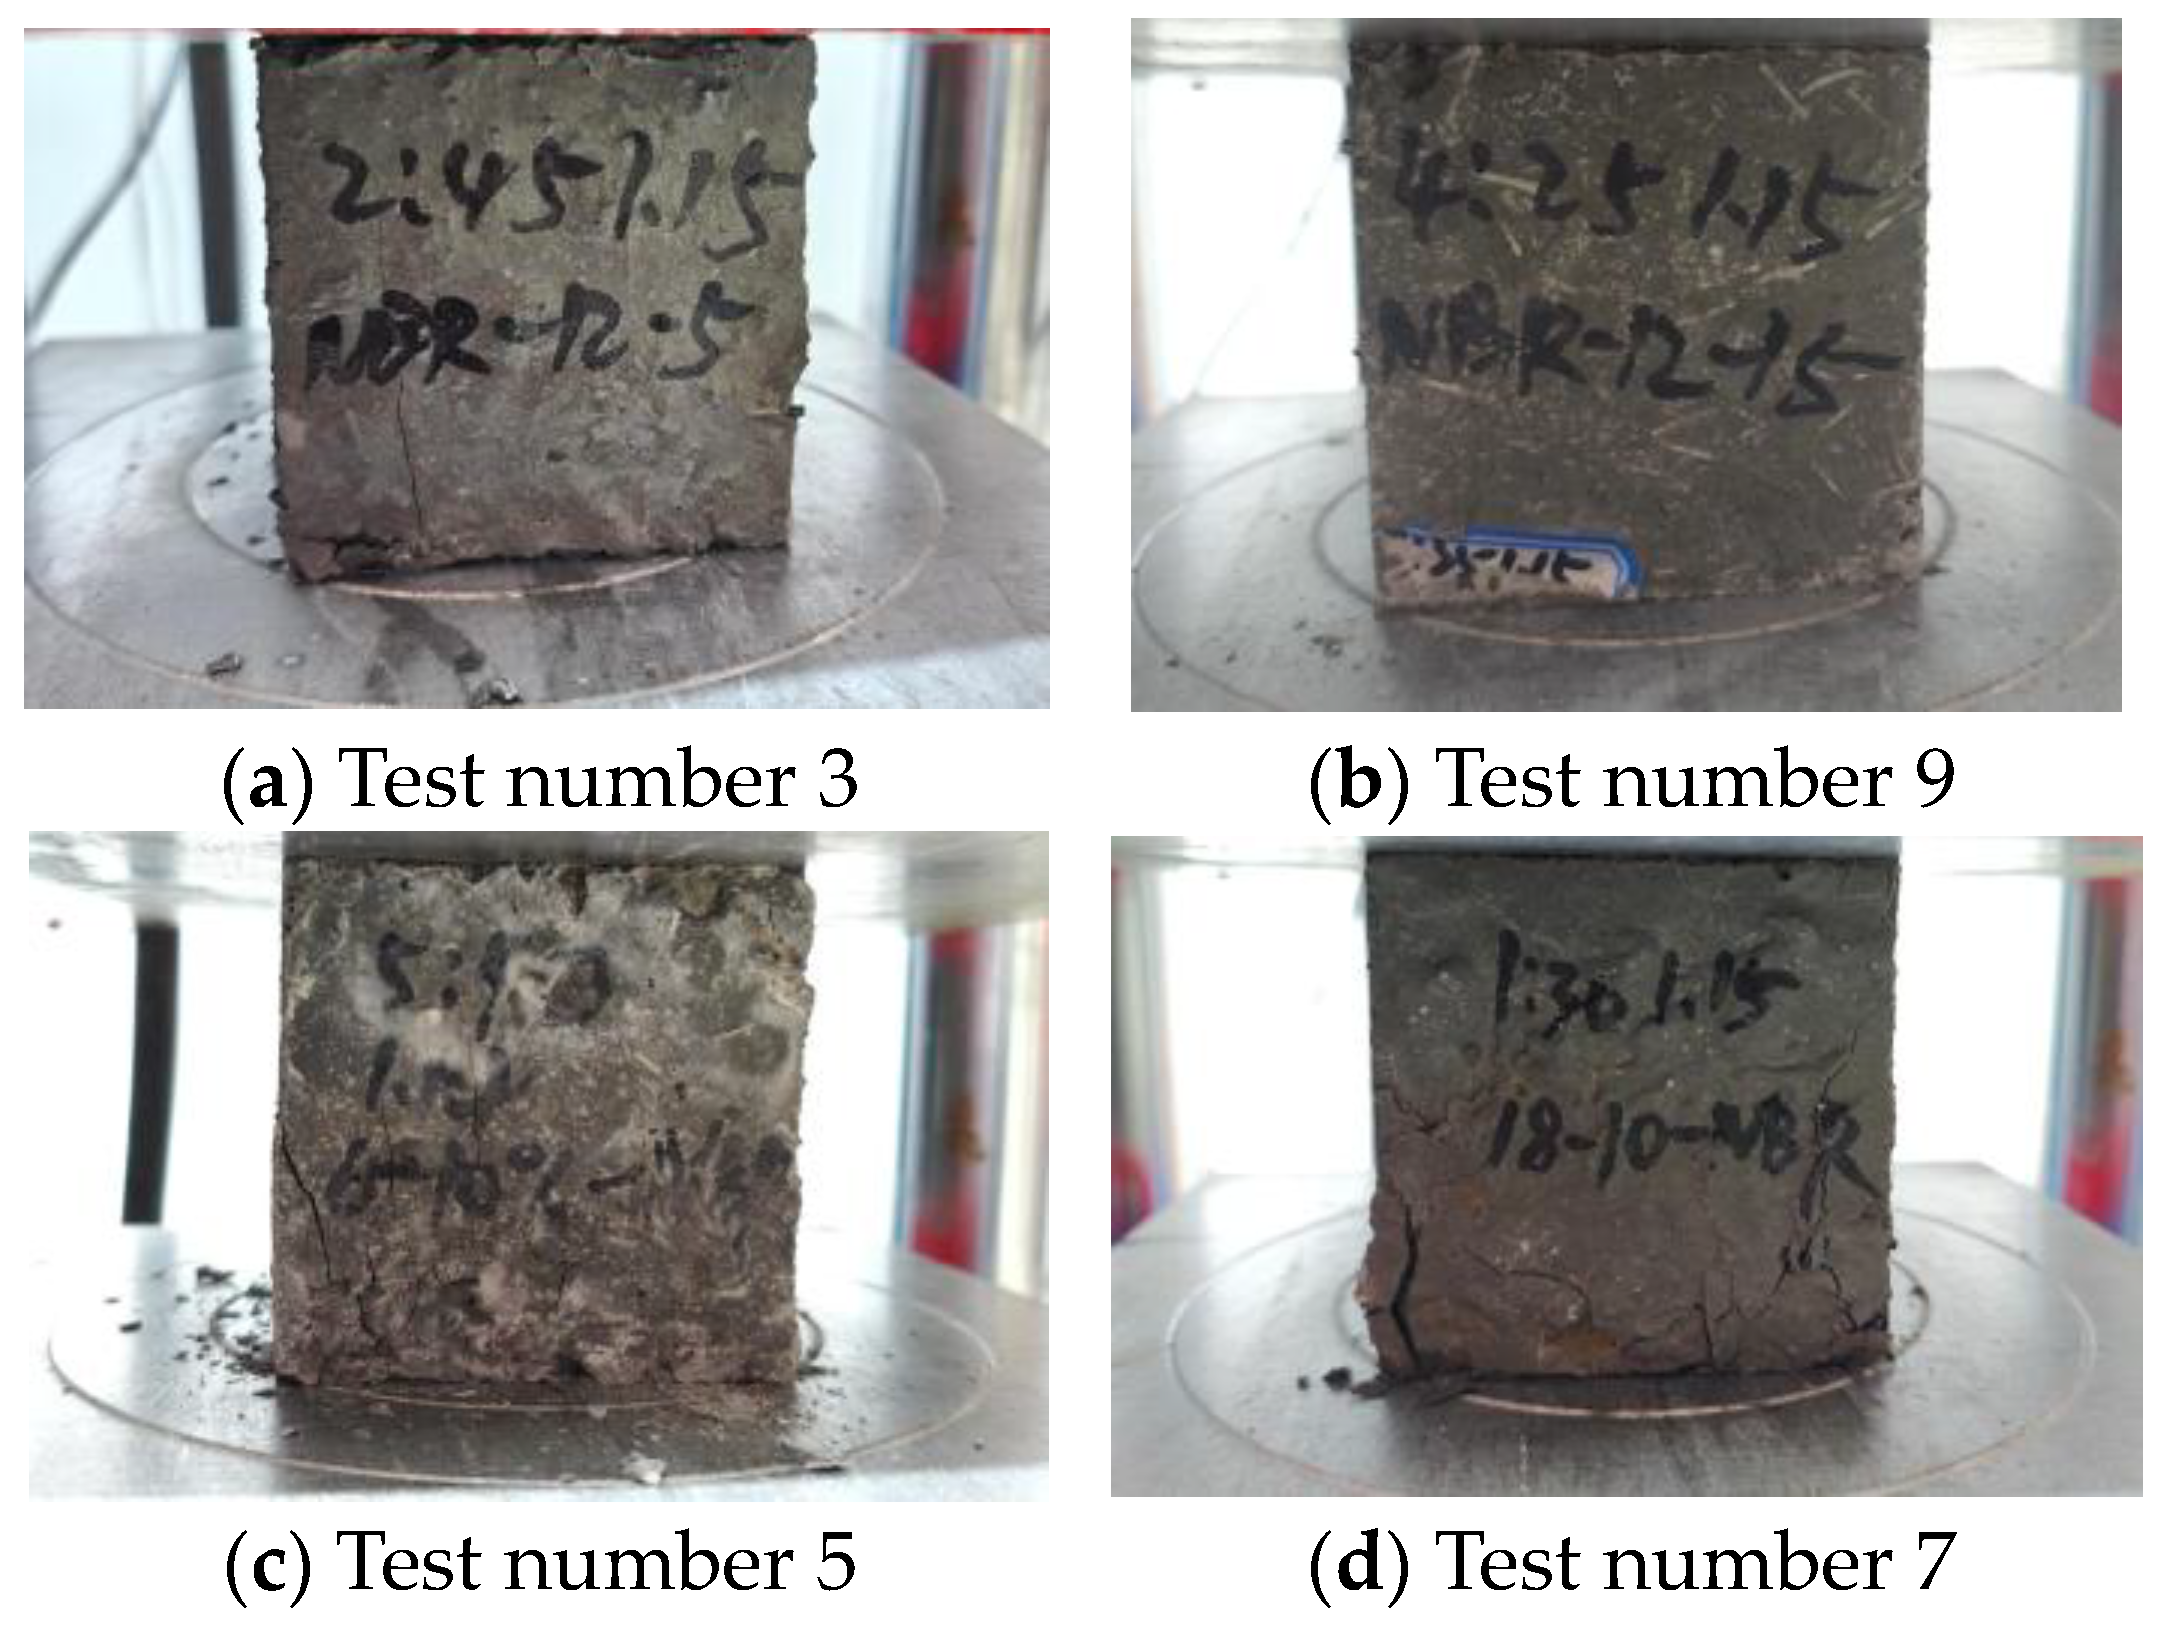
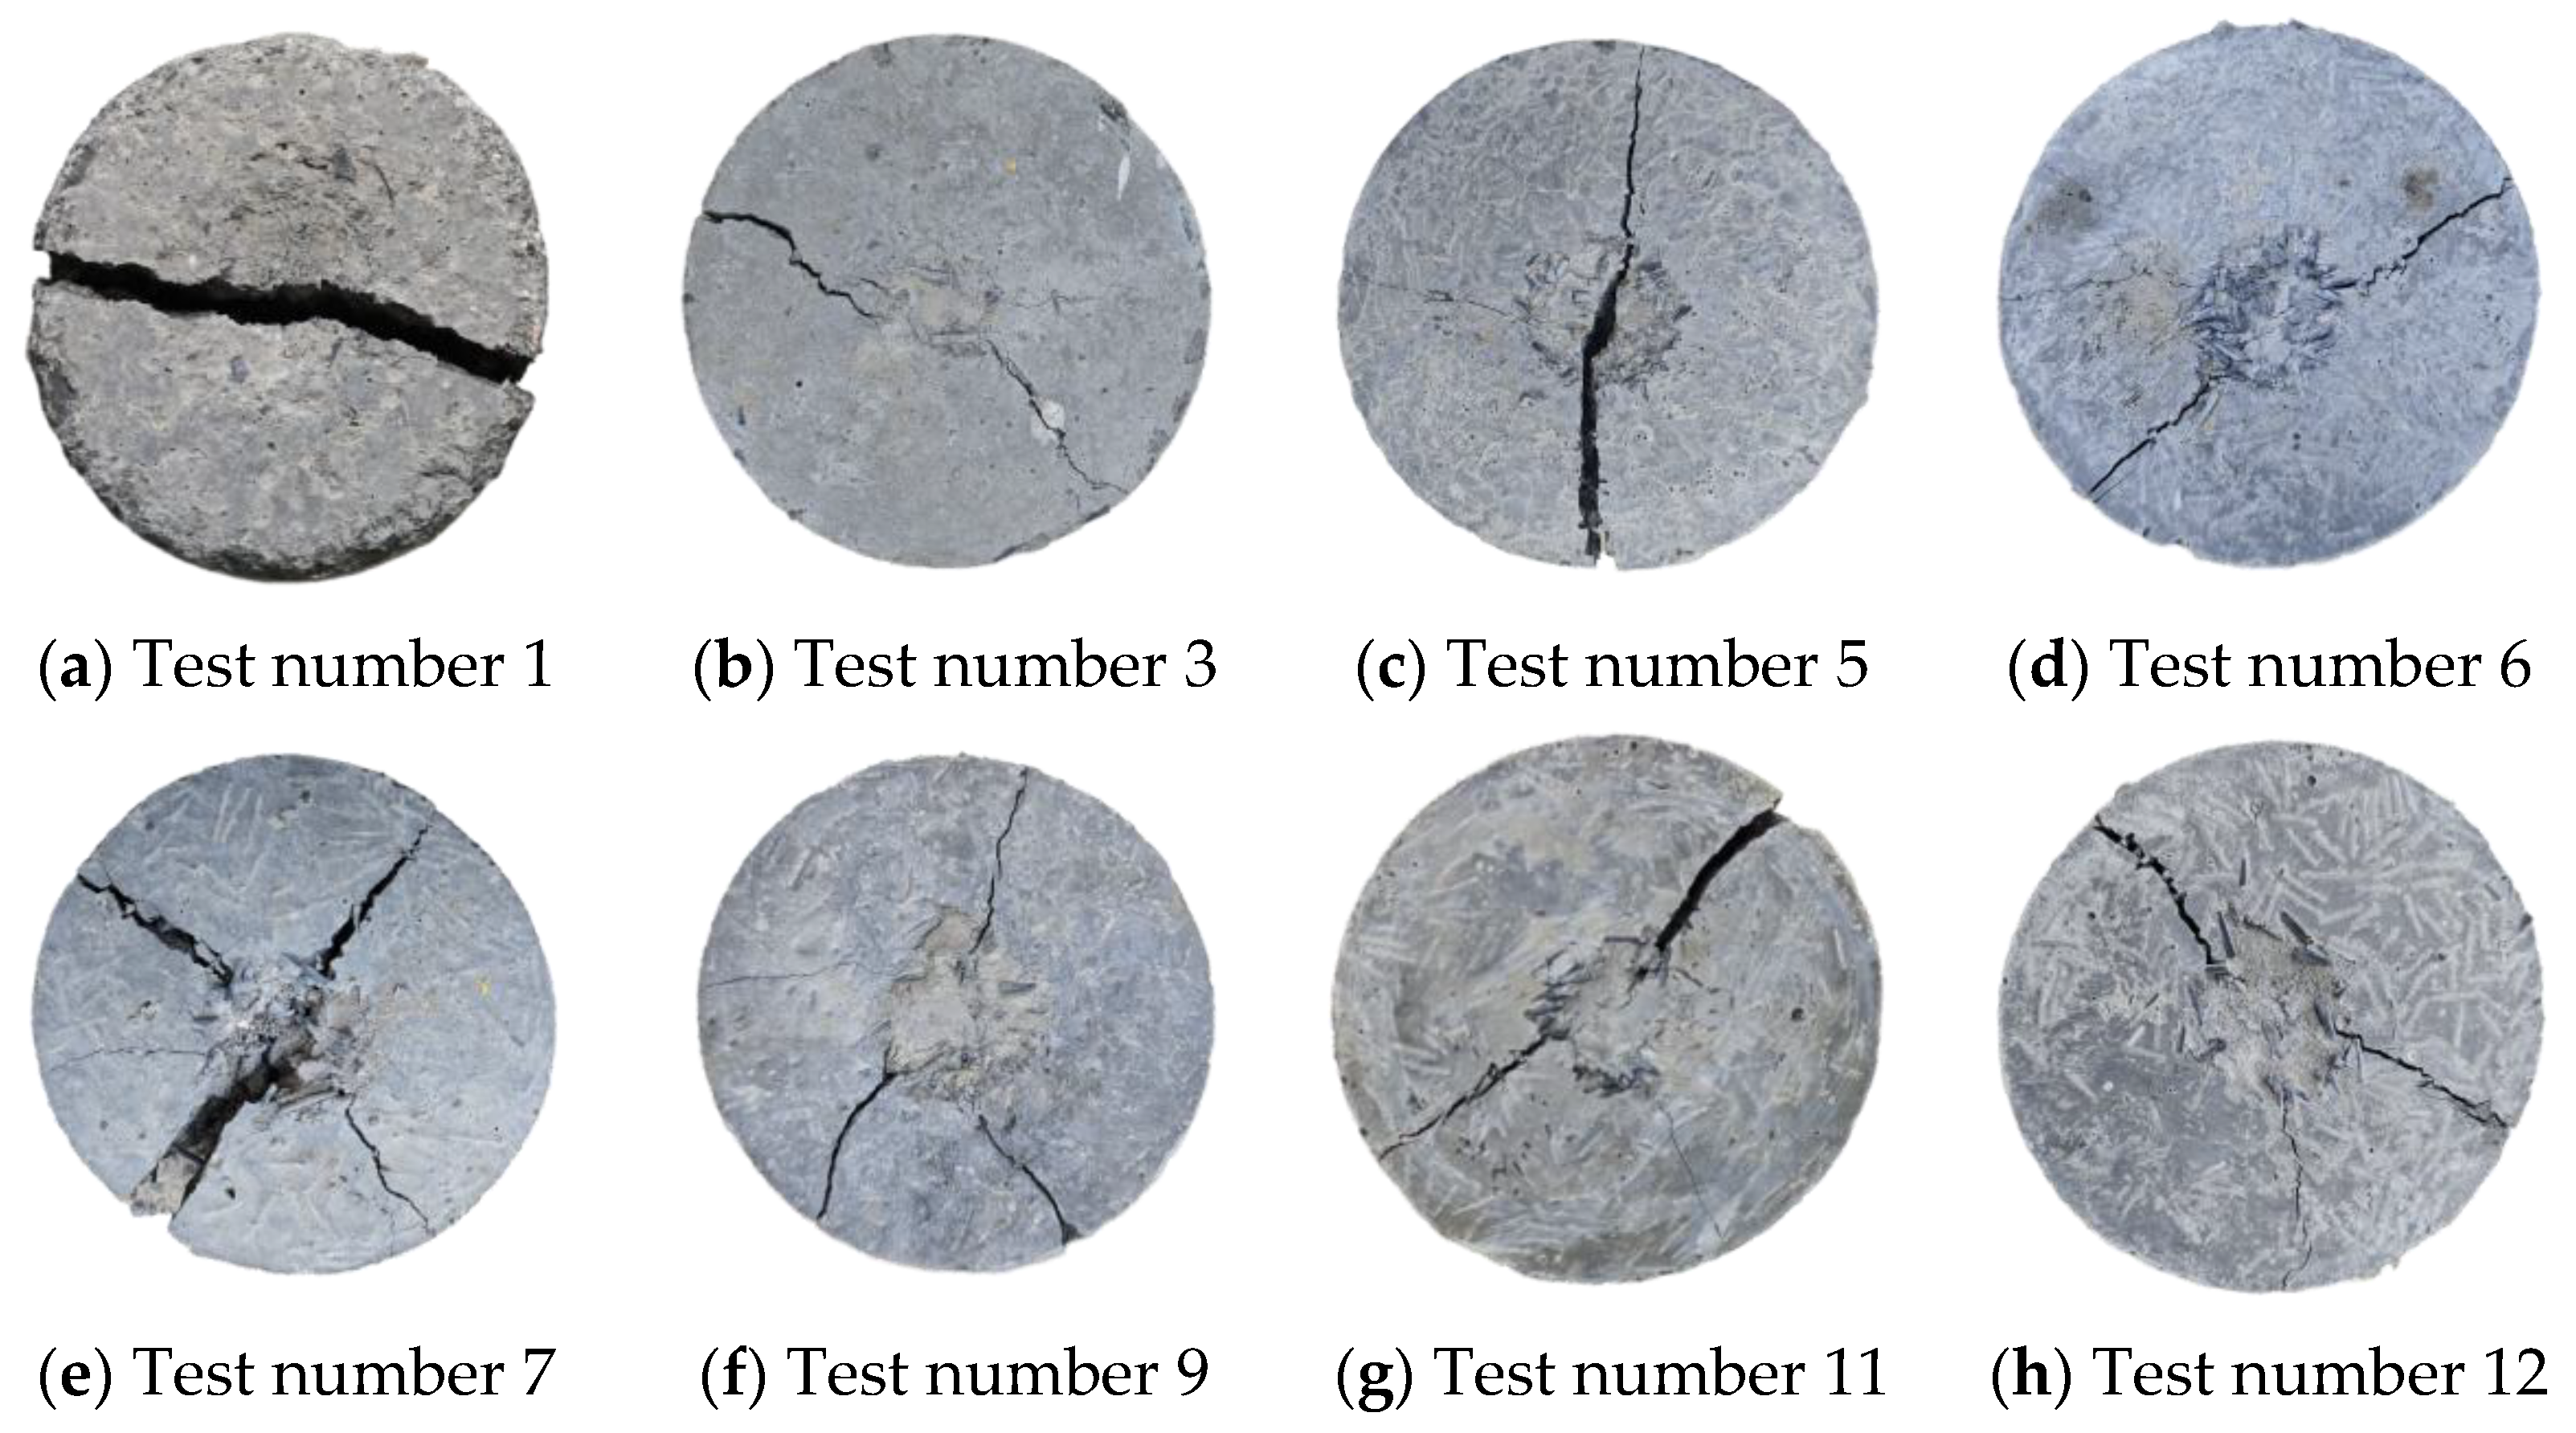
3.3. Macroscopic Enhancement of Fibrous Rubber

Under the impact load, the benchmark group (Figure 13a) cracked and split into two halves. The brittle damage characteristics of the specimen were significant, as shown in Table 6. The difference between the number of impacts leading to initial cracking and the number of impacts leading to final cracking for ordinary concrete was the smallest, with the initial and final cracks occurring at almost the same time, which indicated that its toughness was poor and the specimen had been damaged under the impact load. Under this load, damage to the specimen was characterized by only one main crack. When the concrete was mixed with fibrous rubber, the damage pattern was as follows: Incomplete penetration of the main crack occurred first, and after a number of impact loading cycles, the main crack near the middle developed one or more secondary cracks. Ultimately, the destruction of the specimen occurred via the main crack, and the difference between the initial and final crack impact numbers was greater than that of ordinary concrete. The reason for this was that in the impact process, the rubber fibers could undergo large deformations and the impact energy was converted into elastic potential energy, thus effectively absorbing and dissipating the energy. At the same time, because the rubber had a certain length, in the process of deformation, more energy could be absorbed, rebounded, dissipated and uniformly dispersed to the surrounding concrete matrix. This avoided the stress concentration phenomenon, reducing the kinetic energy acting on the specimen, and thus more energy was required for matrix cracking. Therefore, the overall damage to the specimen increased and one main crack appeared, accompanied by the emergence of secondary cracks, and ultimately the brittleness of the concrete changed, increasing its toughness. In addition, all concrete samples containing fibrous rubber did not completely crack into two halves; this was due to the fibrous rubber in the concrete exhibiting a chaotic three-dimensional distribution and the cracks between the fibrous rubber connecting the cracked specimen (Figure 13e), creating a fibrous rubber crack-blocking effect on the macro-level. With an increase in the length of the fibrous rubber, the more evident the effect of crack-blocking became.

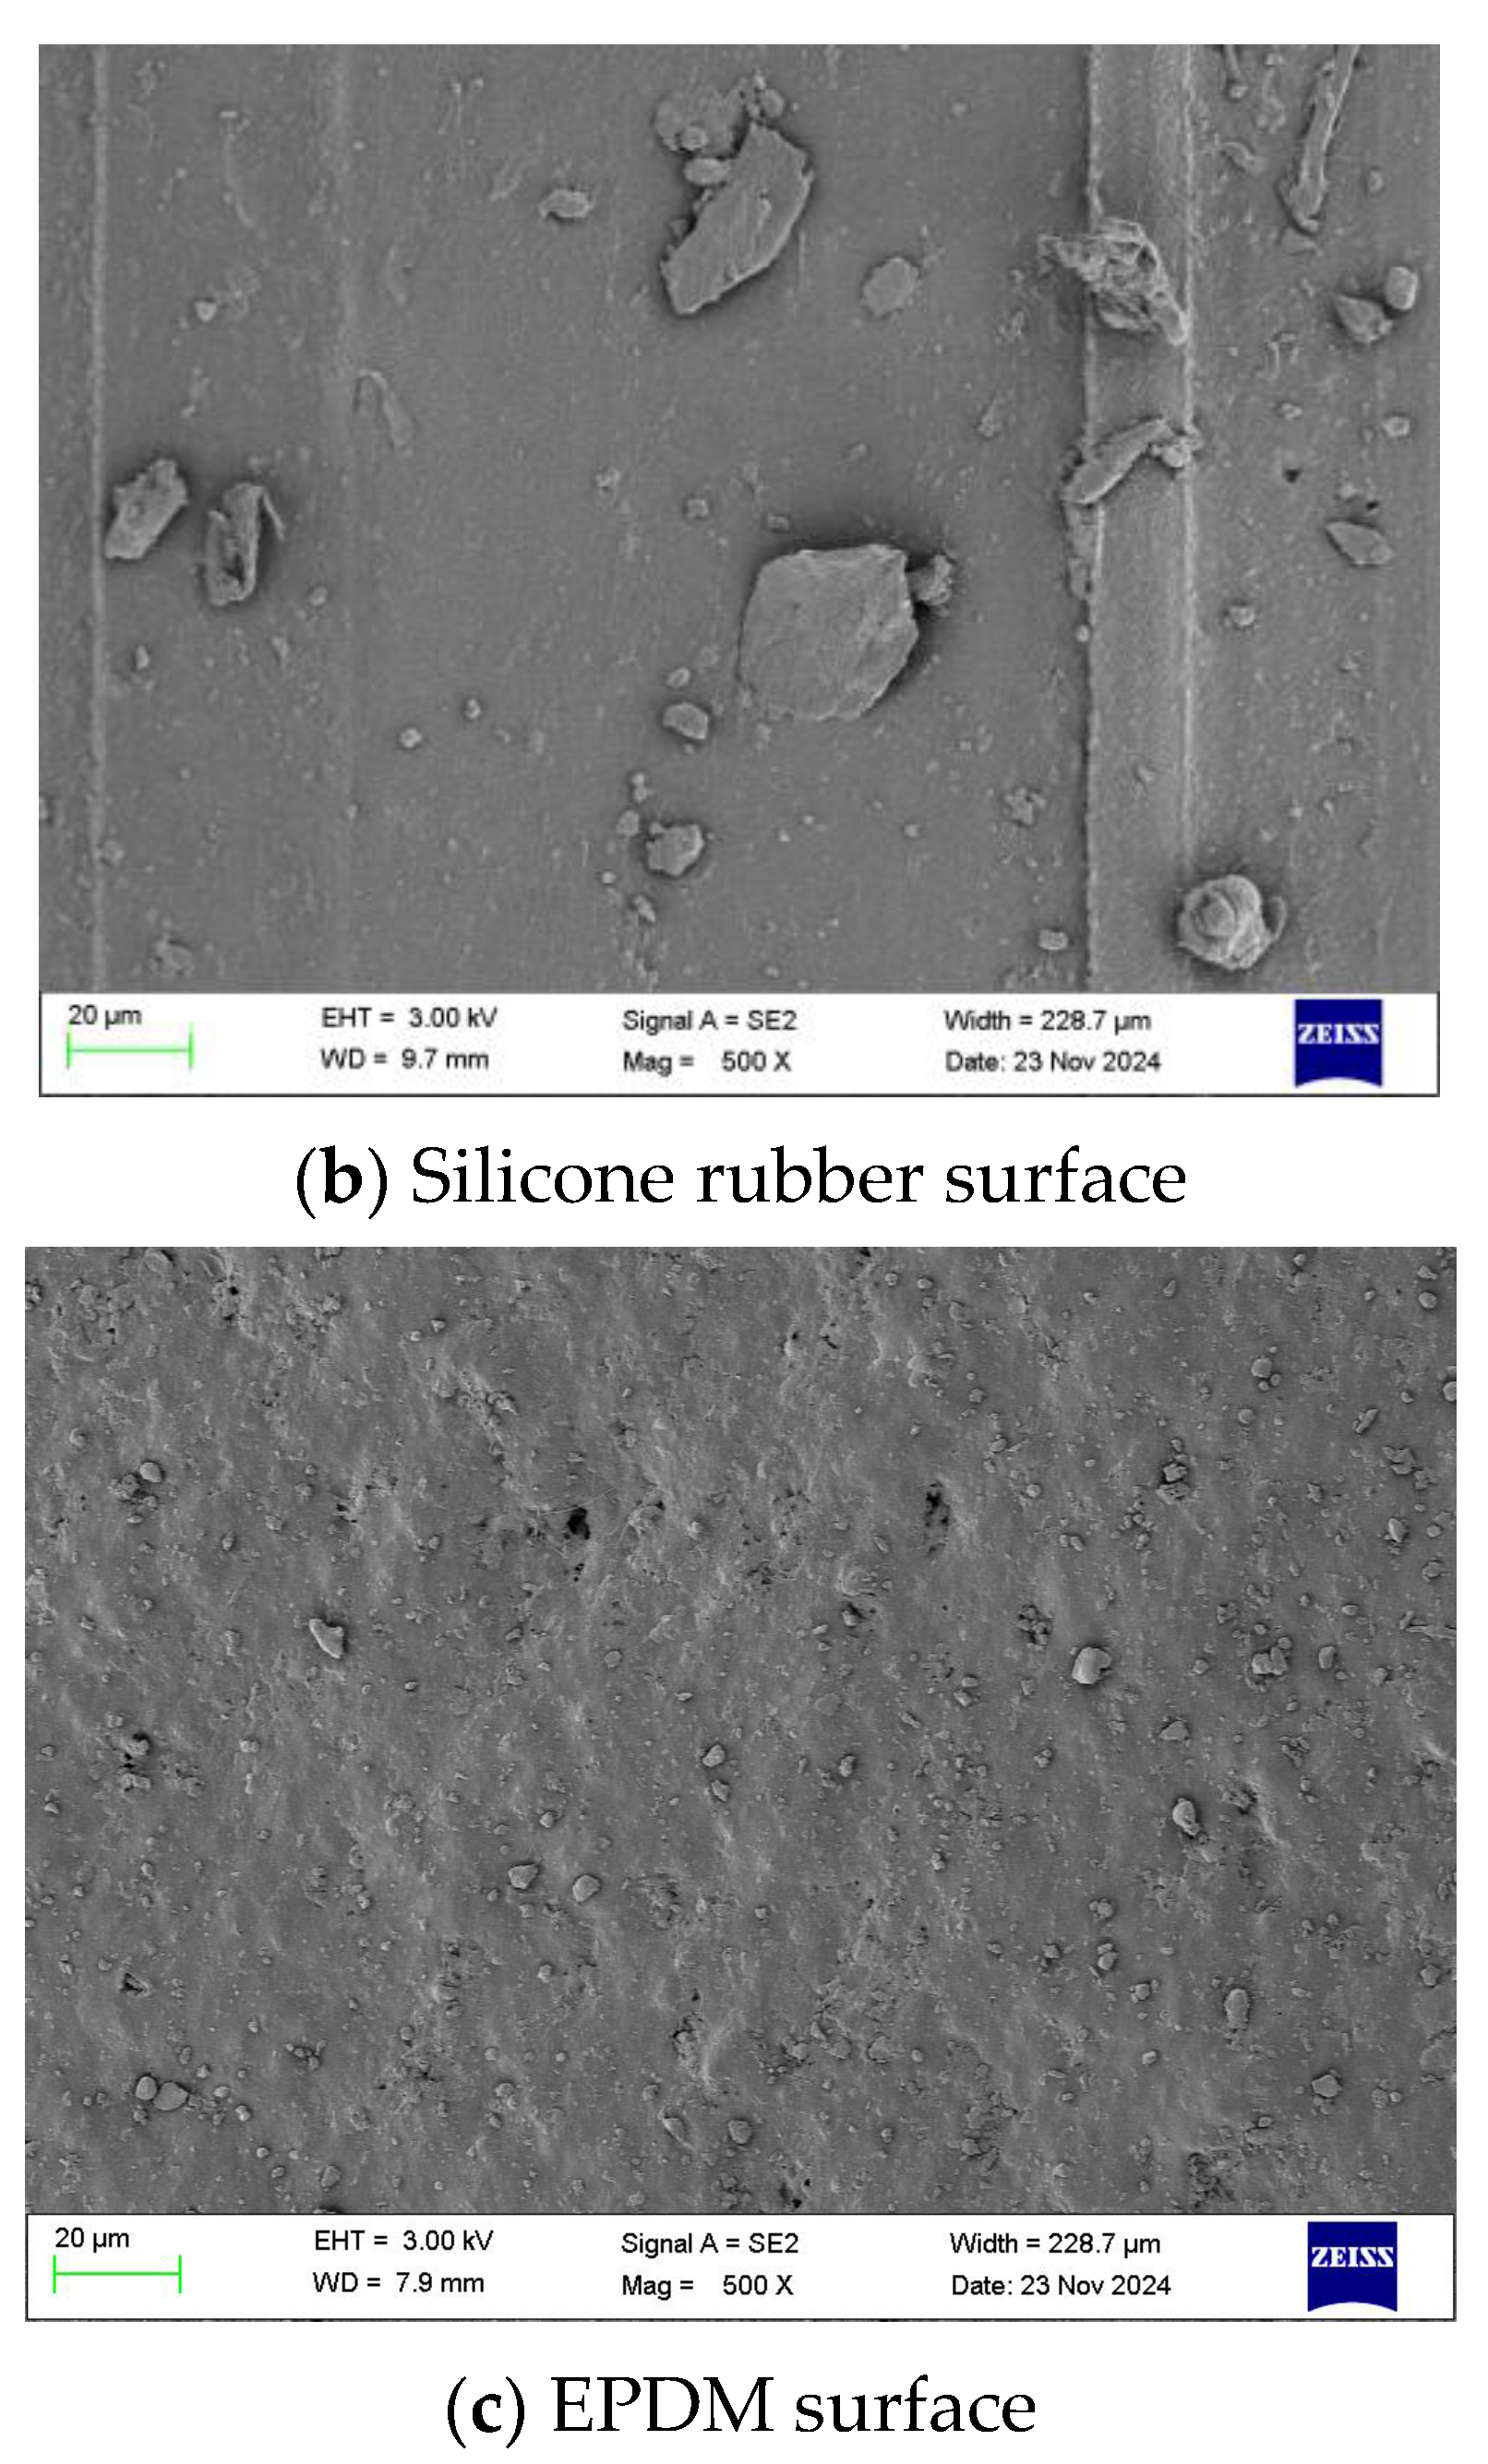
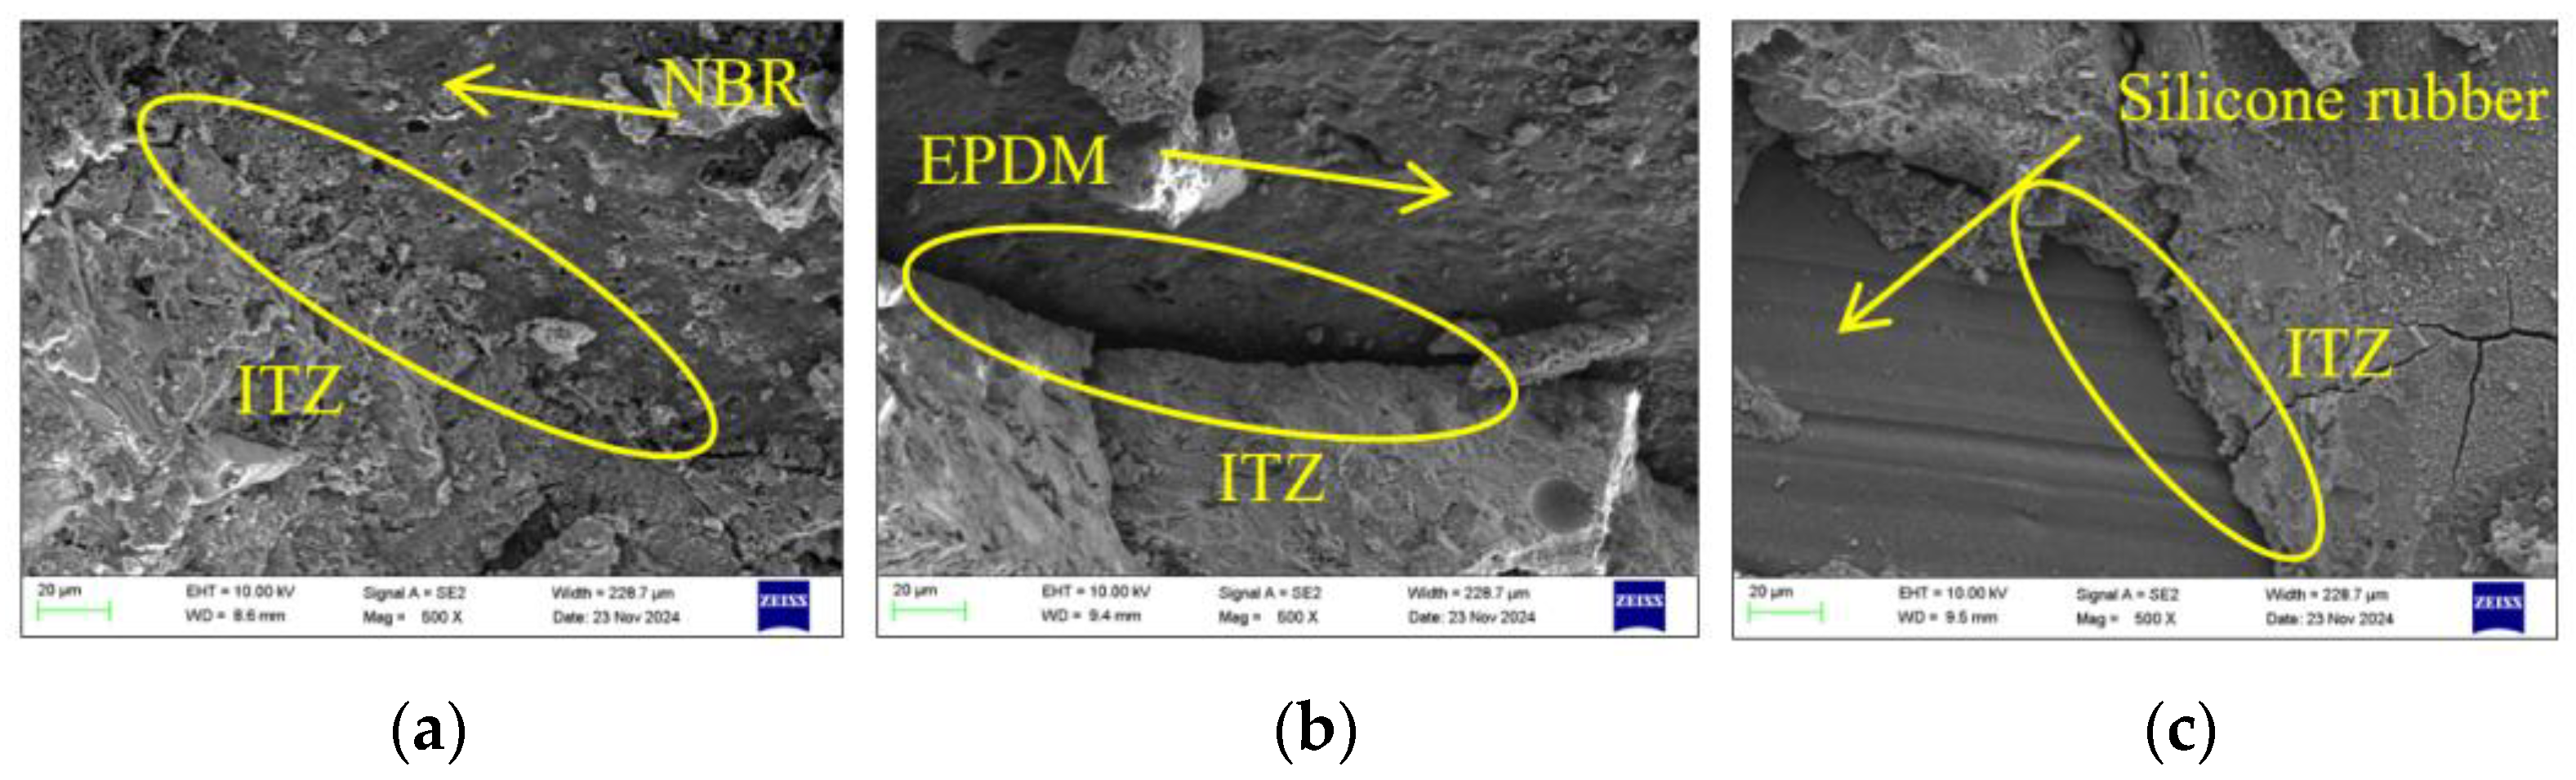
3.4. Impact Strengthening Mechanism and Microstructure Analysis of Fibrous Rubber Concrete

Combined with the mechanical and impact test data, it can be seen that doping different kinds of rubbers leads to clear differences in the mechanical properties and impact resistance performance. The best combination (15% of NBR with 12 mm fibers), as well as silicone and EPDM rubber, were chosen to observe their microstructures. Through observations, it can be found that there is a certain gap between the fibrous rubber and the cement stone matrix. This is because the surface of the fibrous rubber is uneven, which means that air can easily be introduced during the concrete mixing process, thus leading to a reduction in the concrete compactness. Furthermore, the surface roughness of the rubber also affects bonding with the cementitious matrix, and Buna-N fibers with a higher surface roughness form a tight bond with the cementitious matrix (Figure 14a), which improves the stress transfer efficiency. In contrast, the smooth surfaces of silicone and EPDM rubber (Figure 14b,c) may cause interfacial sliding and reduce the load-bearing capacity. Moreover, the 3D randomly distributed rubber also contains too many weak interfaces, which is due to the hydrophobicity of the rubber weakening the adhesion with the cement matrix, thus creating interfacial voids and lowering the static strength [23]. However, these voids can also act as micro-dampers, absorbing energy upon impact through air compression. Fibrous rubber incorporation results in increased frictional contact with the matrix, with longer fibers (12–18 mm) requiring more energy to remove. SEM shows that fiber debonding is accompanied by matrix spalling, suggesting that energy is dissipated through interfacial friction, slowing down energy transfer. This enhances the impact resistance of the concrete and prolongs the service life.

3.5. Impact Life Reliability Analysis of Fibrous Rubberized Concrete

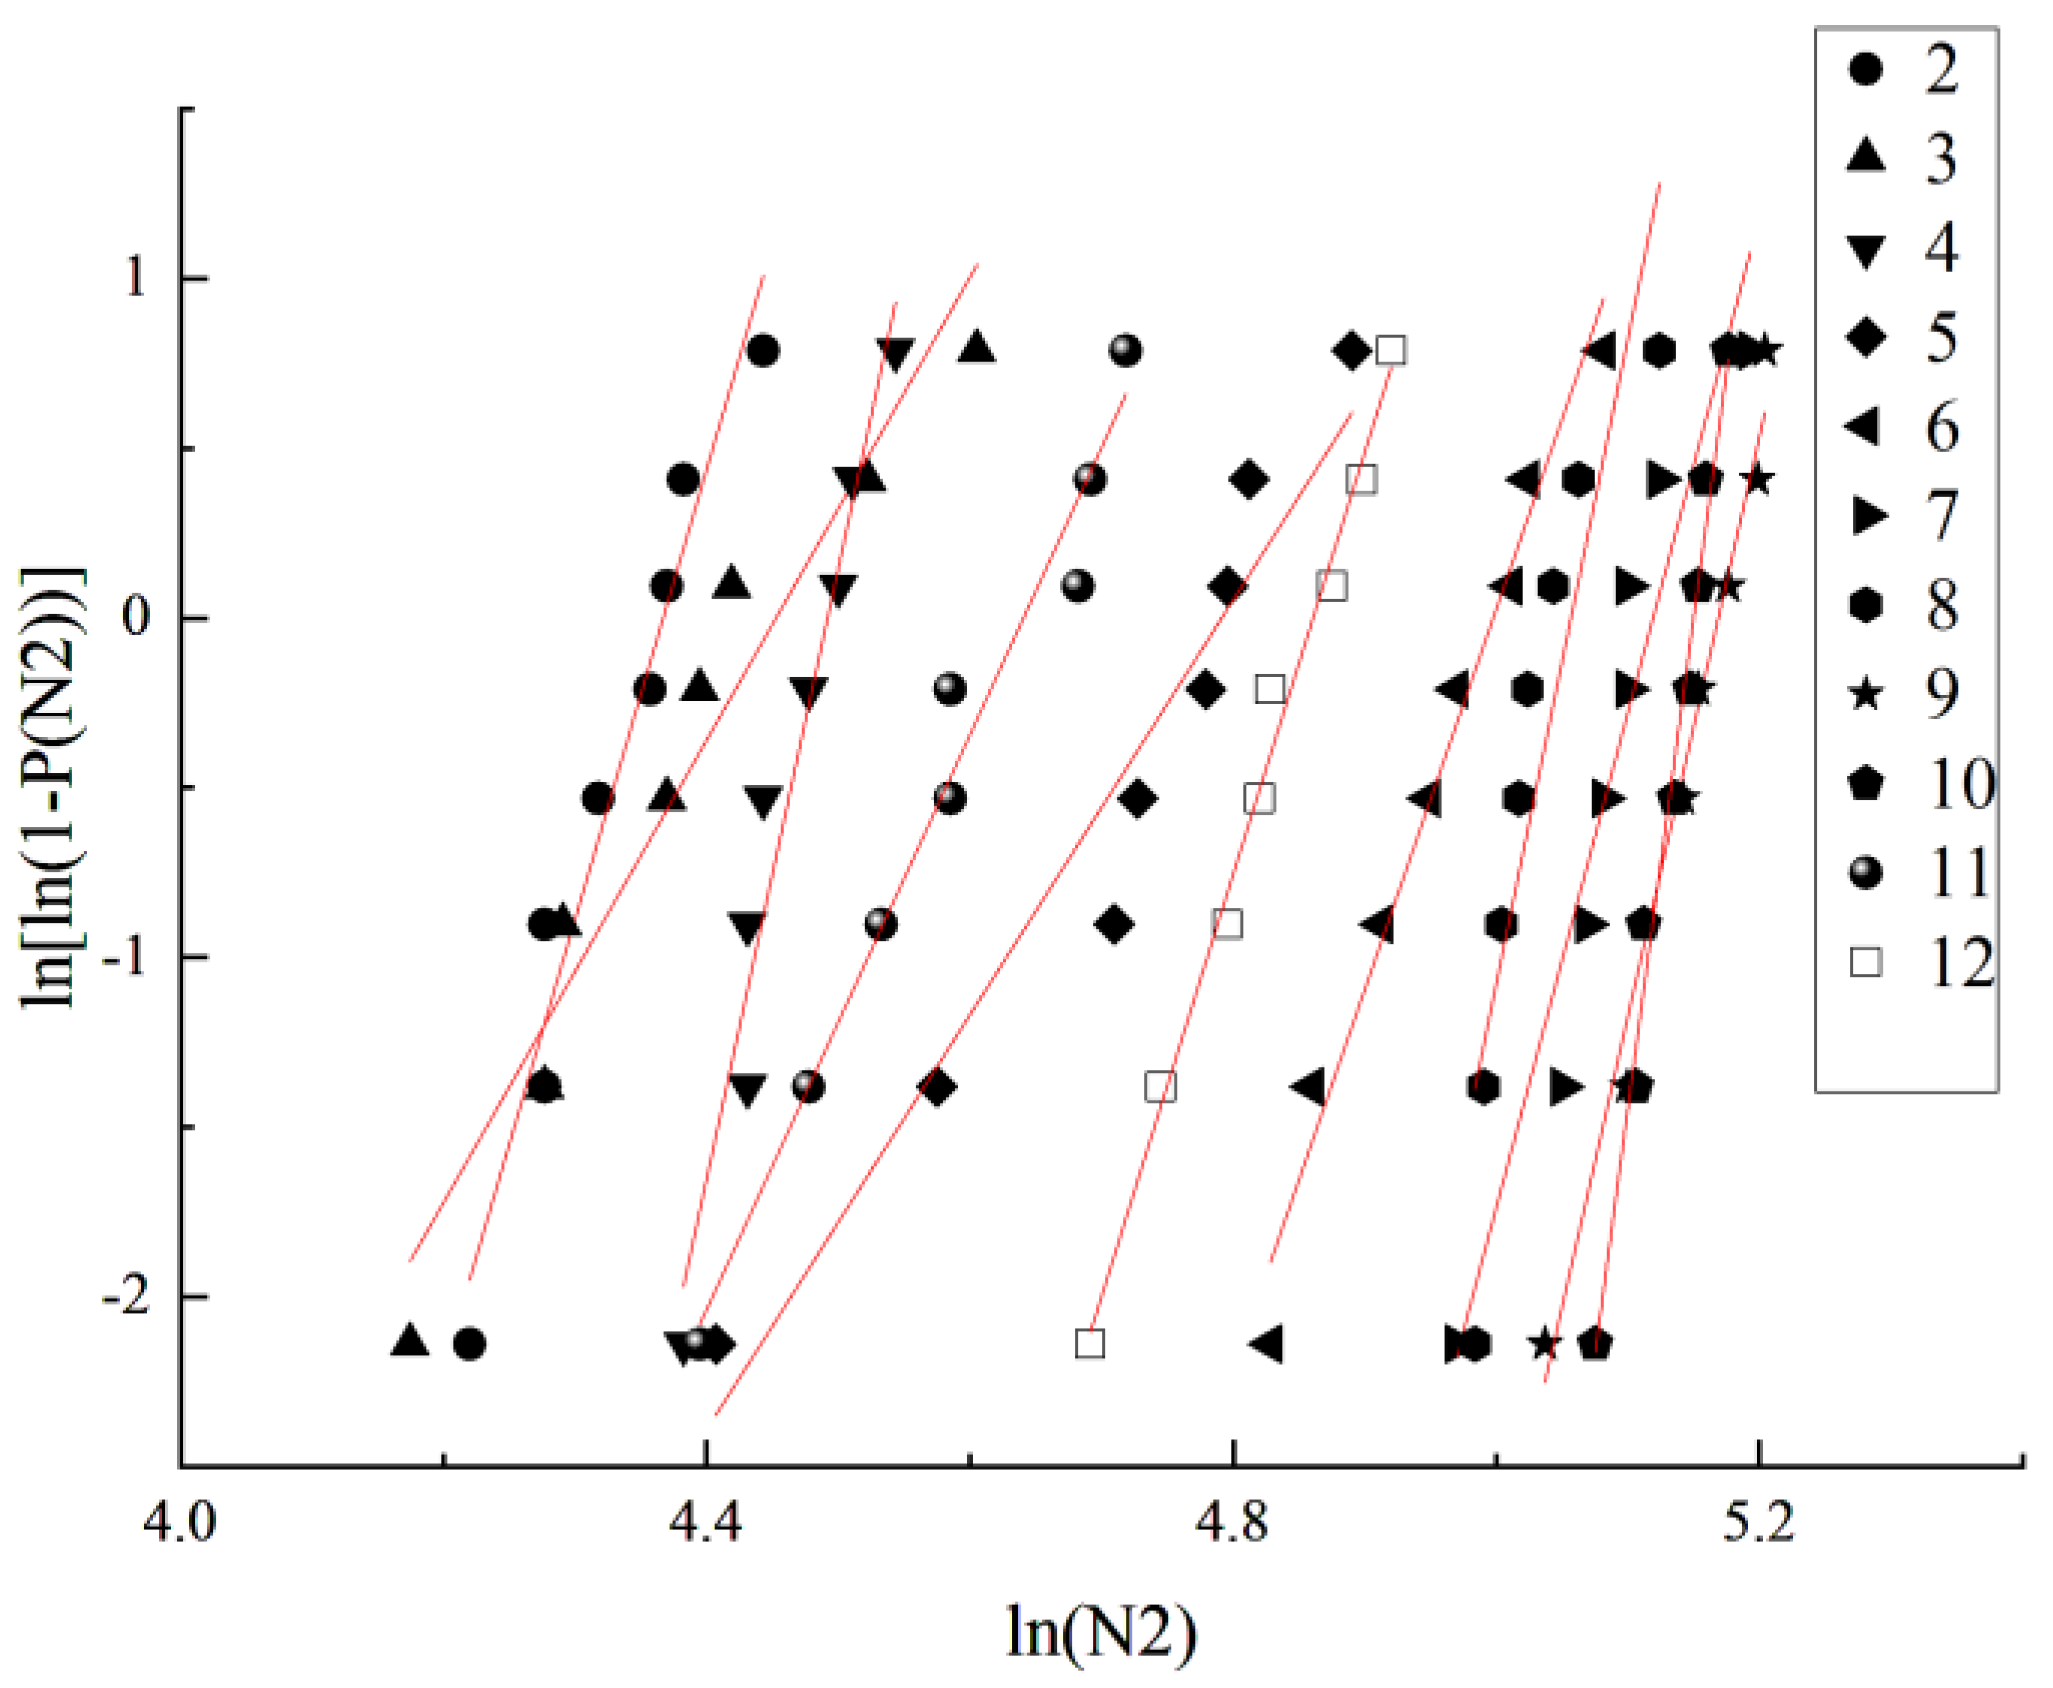
3.5.1. The Weibull Distribution Model

When researching concrete impact resistance, it is important to consider that because it is a non-homogeneous material, there are various defects in its interior, and thus its impact resistance has a certain degree of randomness. The Weibull distribution can accurately describe the statistical characteristics of the number of concrete impacts. Through an analysis of a large set of concrete specimen impact data and through fitting via the Weibull distribution function, one can obtain the distribution parameters of the number of concrete impacts and then assess the reliability of concrete impact performance and the probability characteristics. For example, the number of impacts can be predicted from the probability of concrete destruction. In the study of concrete fatigue damage, the Weibull distribution can be used to analyze the fatigue life of concrete under repeated loading. Because the time leading to destruction and the number of impacts in the fatigue process also show a certain statistical pattern, the Weibull distribution can better describe the dispersion of the fatigue life and help engineers to design more reasonable concrete structures that will be subjected to repeated loads. In fact, the drop hammer impact method, as a cumulative damage mechanism, acts repeatedly through the same force until the specimen is destroyed, which is a similar process to fatigue damage. Few studies have been conducted on whether fibrous rubber concrete can also be described by the Weibull distribution; thus, the following is an analysis of the impact resistance of fibrous rubber concrete using the Weibull distribution [24,25].
The density function of the Weibull distribution is defined as:
f ( N ) = b N a N 0 ( N N 0 N a N 0 ) b 1 exp ( N N 0 N a N 0 ) b · · · · ( N   >   N 0 )
where N0, Na and b are three parameters describing the Weibull distribution; N0 is the minimum lifetime parameter; Na controls the scale size of the horizontal coordinate, which responds to the dispersion of the data N, and is called the scale parameter; and b describes the shape of the curve of the density function of the distribution and is called the shape parameter.
In this paper, we study the probability of damage before the fatigue life N, or the probability F(N) that the life is less than or equal to N:
F ( N ) = N 0 N f ( N ) d N = N 0 N b N a N 0 ( N N 0 N a N 0 ) b 1 exp ( N N 0 N a N 0 ) b d N
Letting x = (NN0)/(NaN0), then we have dN = (NaN0)dx from the above equation:
F ( x ) = 0 x b N a N 0 x b 1 e x b ( N a N 0 ) d x = 0 x e x b d ( x b ) = 1 e x b
If F(N) = F(x), the three-parameter Weibull distribution function F(N) can be obtained as:
F ( N ) = 1 exp [ ( N N 0 N a N 0 ) b ]
For the fibrous rubbery concrete material studied in this paper, and considering the reliability and simplicity of the calculation, let N0 = 0; then, the three-parameter Weibull distribution can be transformed into a two-parameter Weibull distribution with the distribution function:
F ( N ) = 1 exp ( N N a ) b
The density function is:
f ( N ) = b N a ( N N a ) b 1 exp ( N N a ) b
Denoting the probability function of specimen destruction by P(N), we have
P ( N ) = 1 F ( N ) = exp [ ( N N a ) b ]
Equivalent transformations of Equation (10) and taking the natural logarithm twice at the same time can yield
In In ( 1 1 P ( N ) ) = b In N b In N a
Letting y = In In ( 1 1 P ( N ) ) , x = InN, α = b and β = bInNa, then we have:
y = αx − β
Under the small sample condition (n ≤ 20, n is the total number of samples in the impact resistance test, n = 8), the impact resistance test data are grouped in ascending order, and the expression of the cumulative failure probability function is [26,27]:
P ( N ) = i n + 1
where i is the number of test numbers in ascending order, i = 1, 2, …, n.
Calculated according to Equations (11)–(13), the results of the fitting analysis of impact times are shown in Table 8. From Table 8, it can be seen that, for the impact times N1 and N2 of the fibrous rubber concrete, the minimum value of the correlation coefficient, R2, is 0.808, the maximum value is 0.995, and the vast majority of the values are greater than 0.9. From the Weibull distribution of the linear fitting curves in Figure 15, it can be observed that the final cracking impact number ln(N2) and ln[−ln(1 − P(N2))] exhibit a more linear relationship, and the data points are basically in a straight line. At the same time, according to the reliability model proposed by Rahmani et al. [28], when the correlation coefficient R2 is greater than or equal to 0.7, the model is satisfactory. Thus, it can be deduced that the number of impacts on the fibrous rubber concrete obeys a two-parameter Weibull distribution.

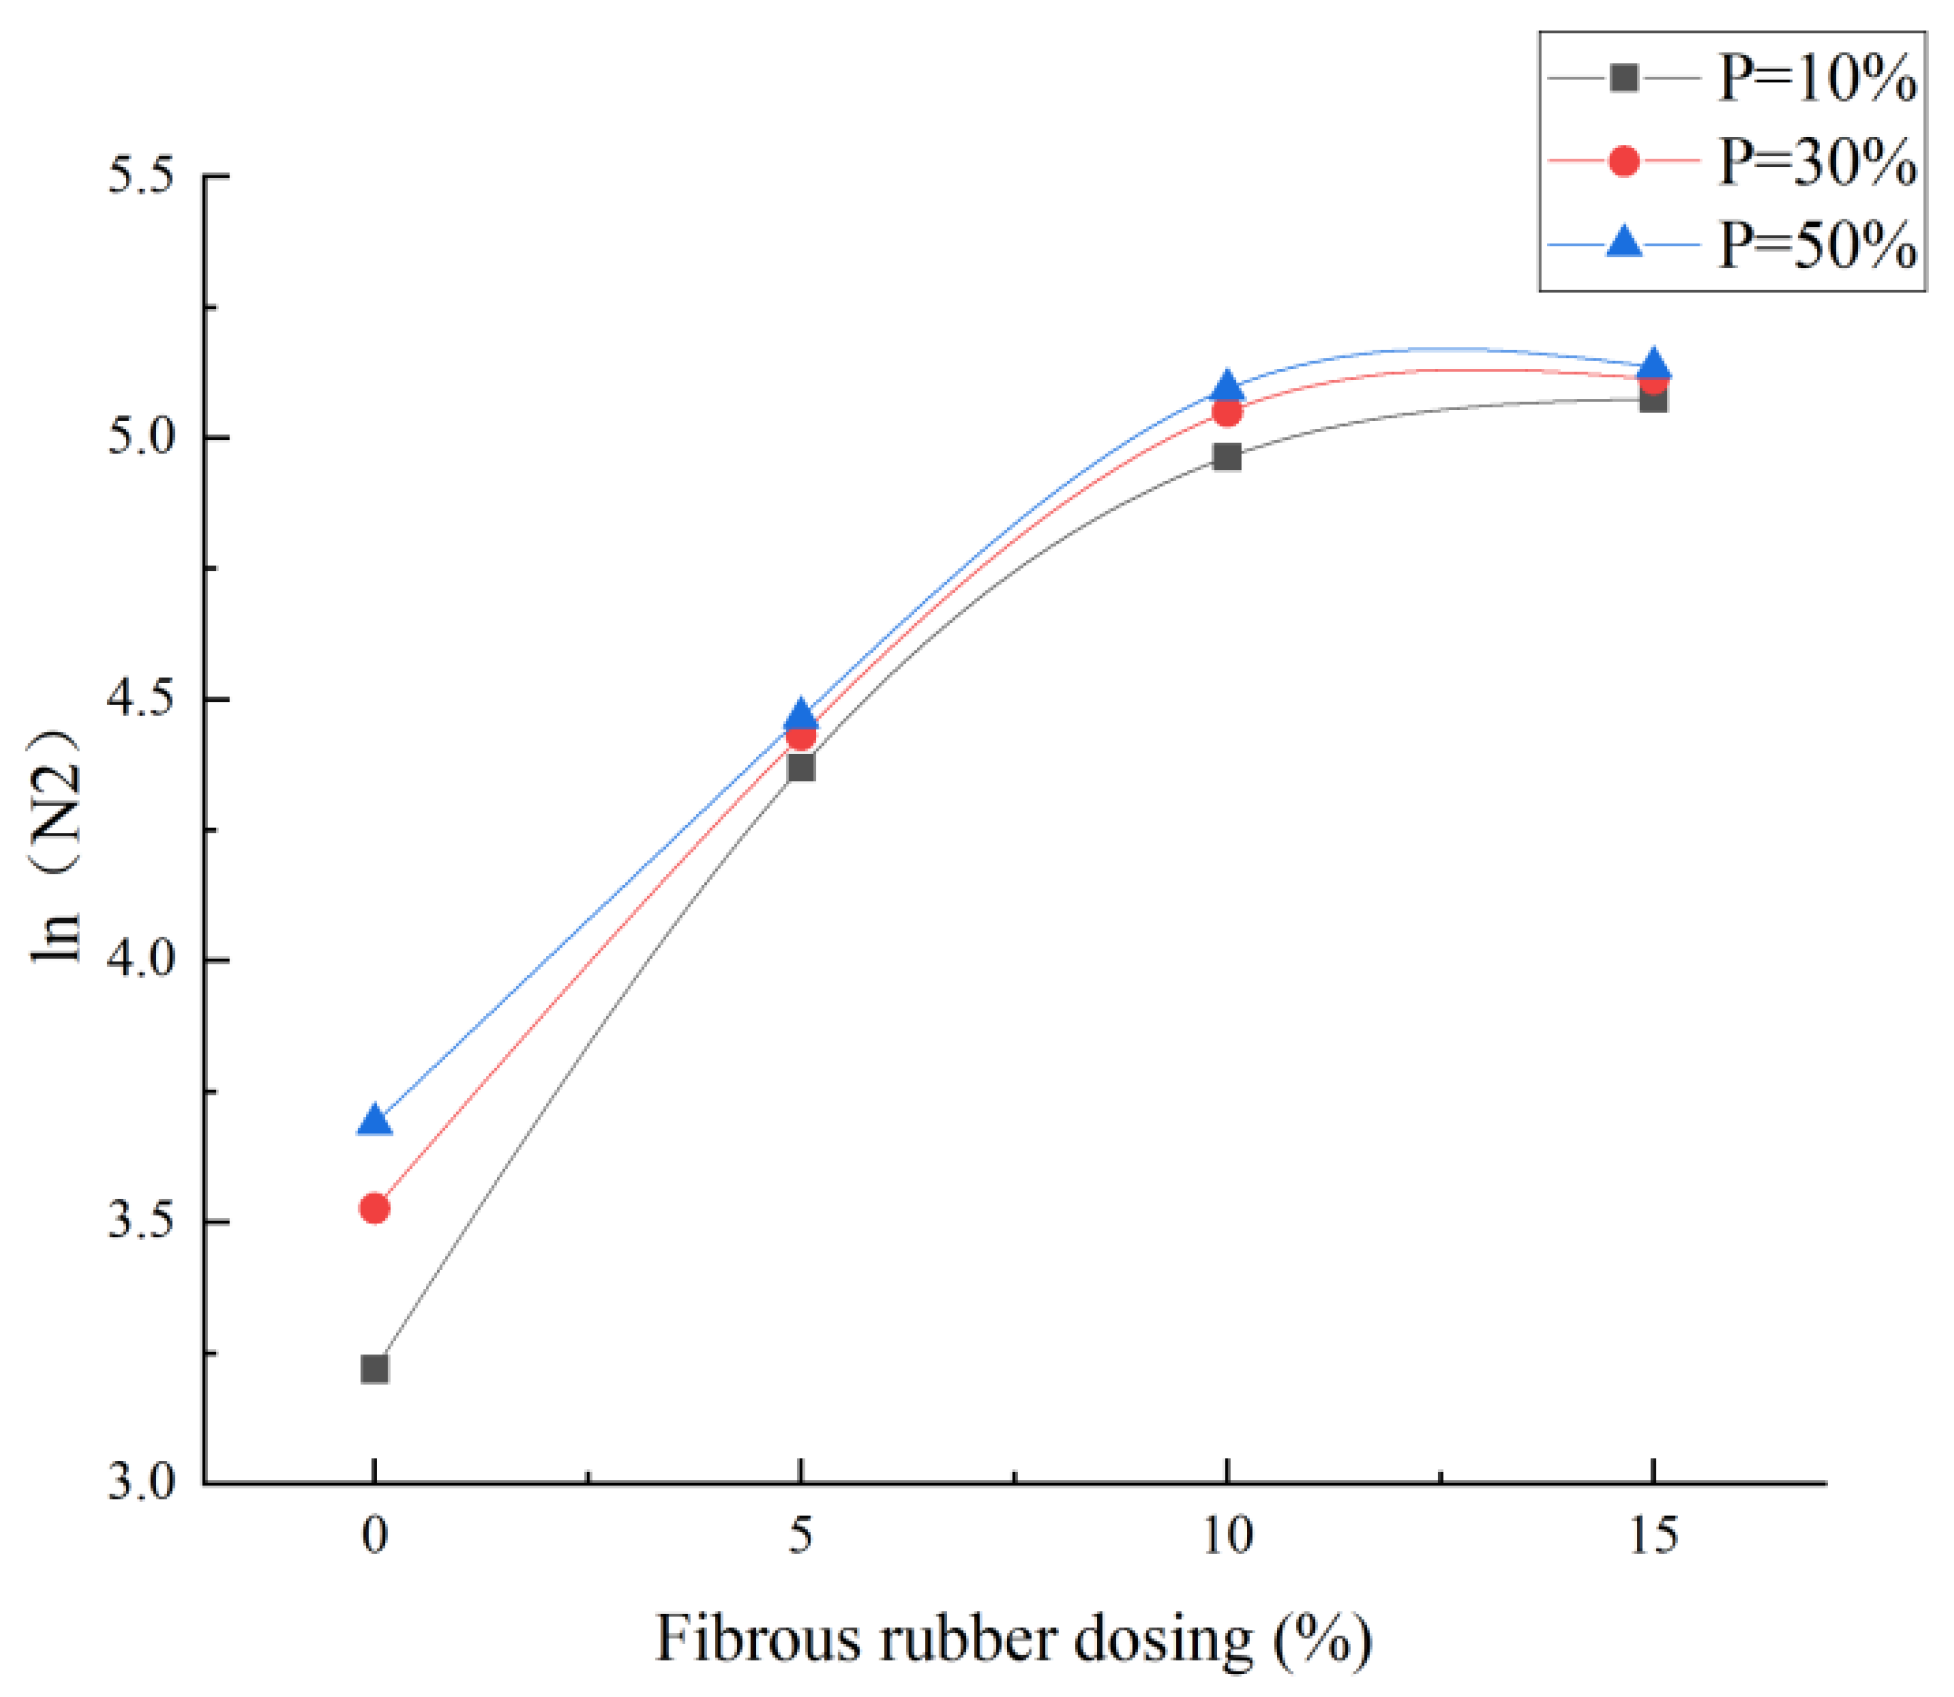
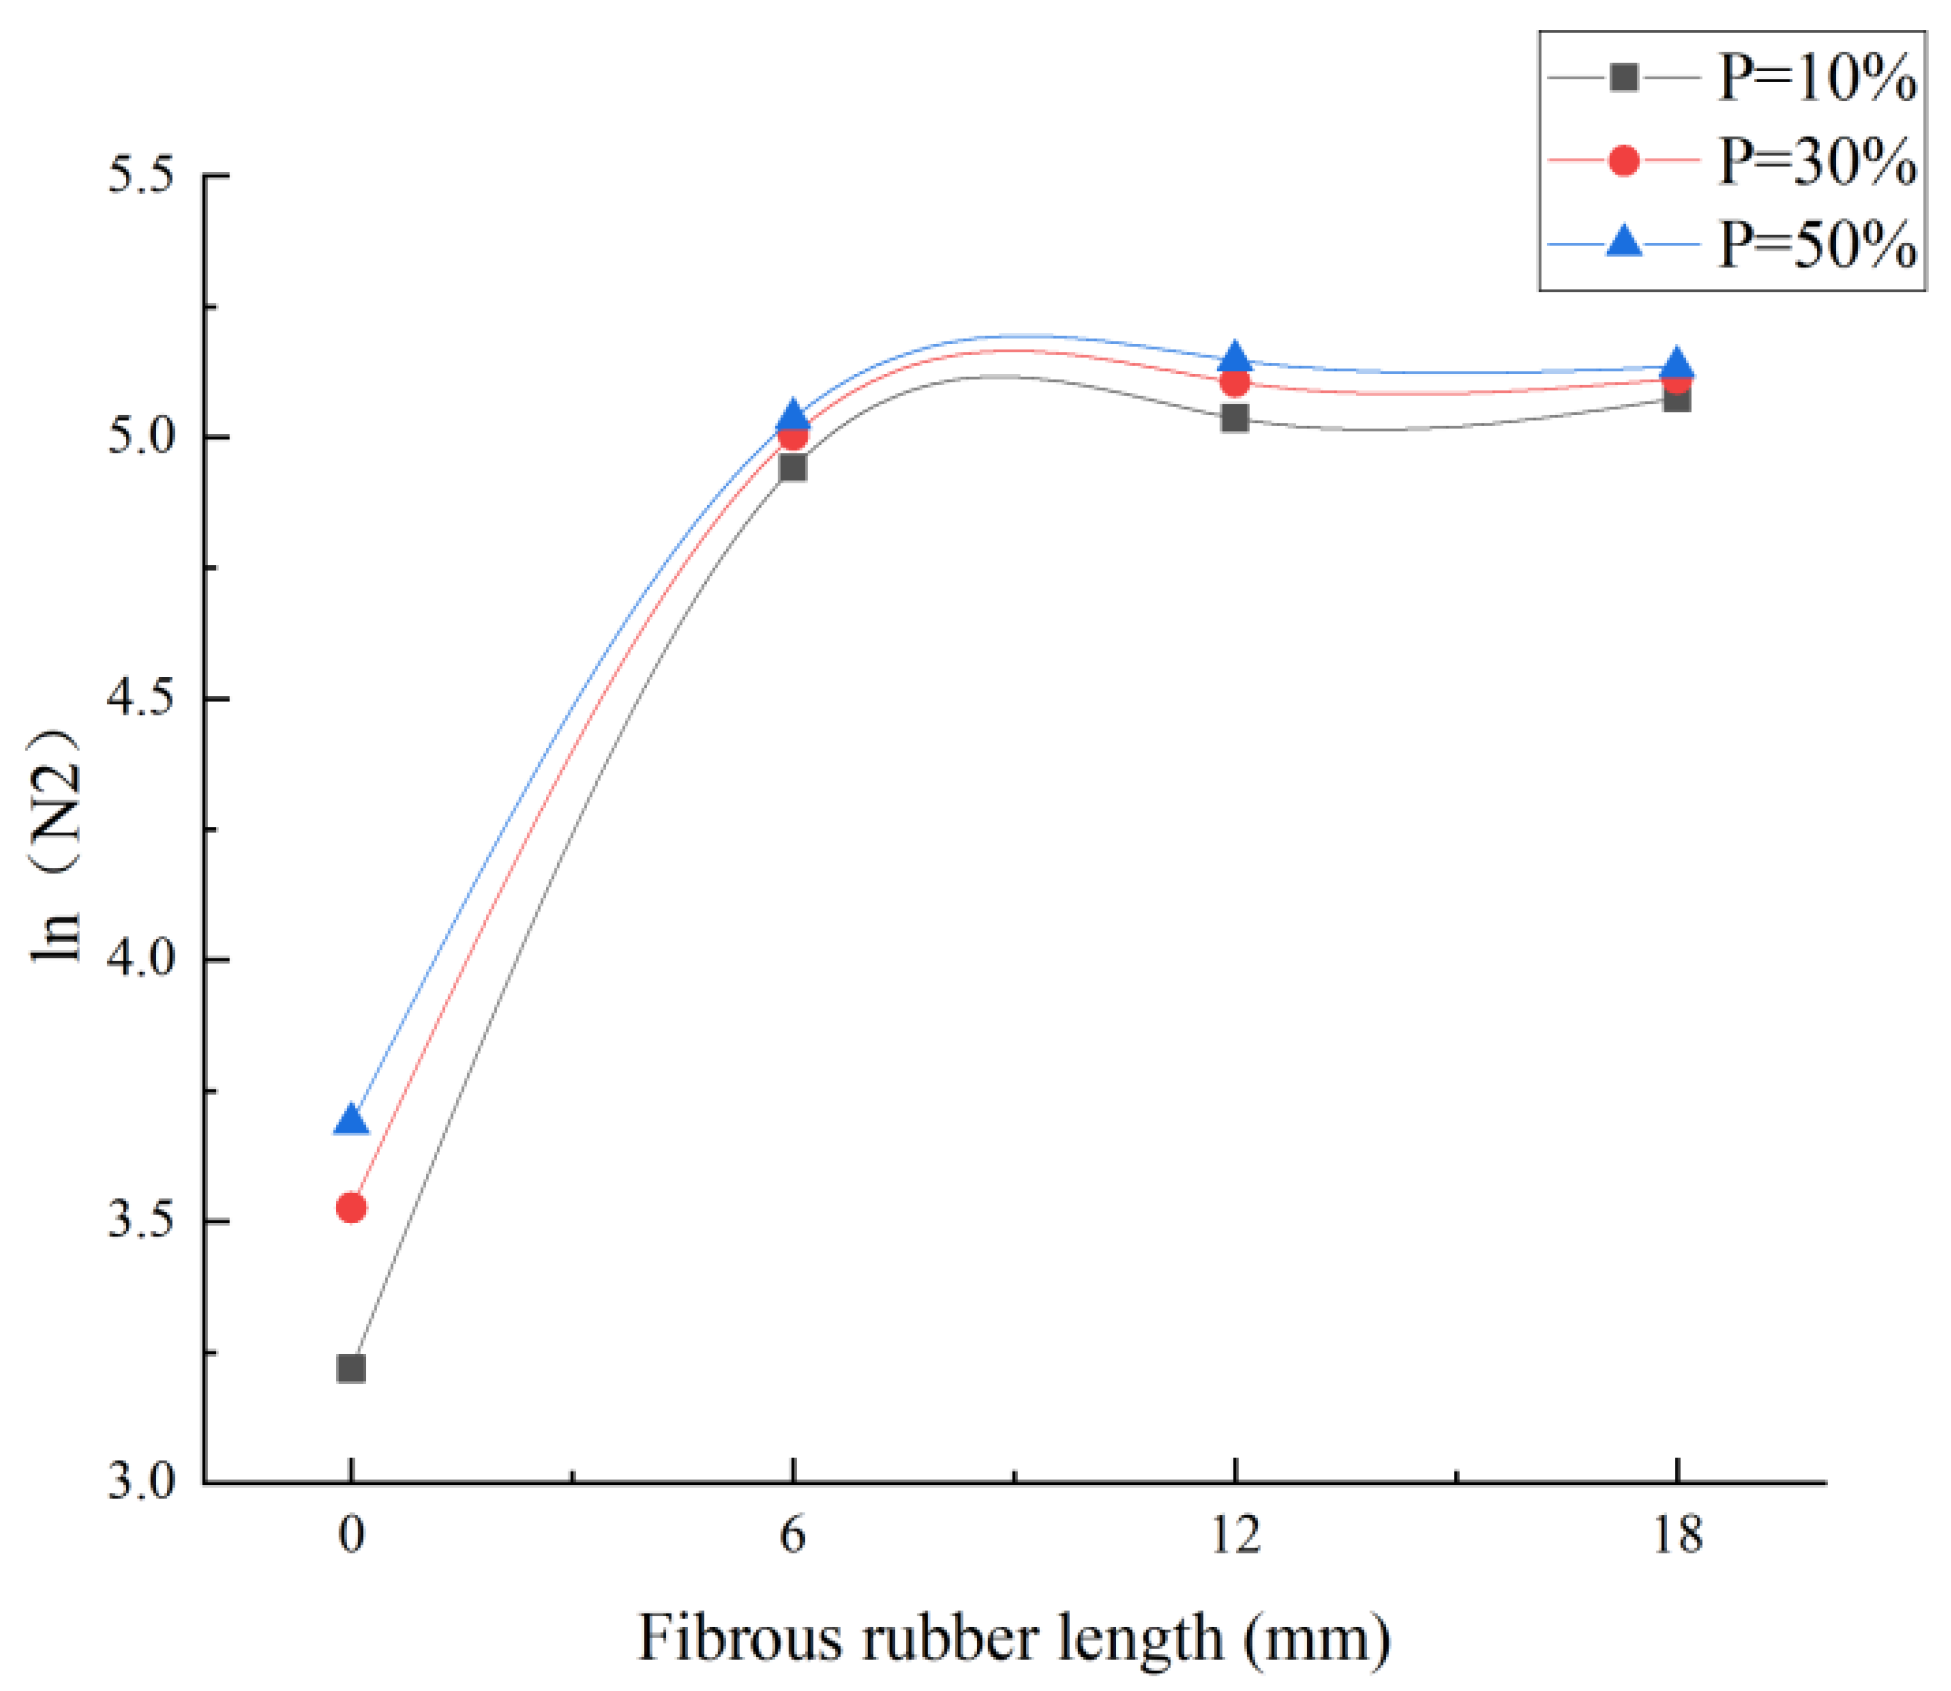
3.5.2. Number of Impacts with Different Failure Probabilities

According to Equations (10)–(12), the number of impacts resisted, N, is obtained under different failure probabilities, which are calculated via Equation (14). In addition, the number of impacts resisted, N, of fibrous rubberized concrete under the corresponding failure probabilities is also calculated according to Equation (14), and the results are shown in Table 9.
N = exp In [ In 1 P + β ] α
where α and β are the Weibull distribution regression parameters, and the regression parameters can be obtained from Table 8.
As can be seen from Table 9, when the failure probability is 10%, the number of final cracks in concrete containing fibrous rubber is much higher than that of ordinary concrete, indicating that incorporating fibrous rubber can largely improve the impact resistance of concrete. Through Figure 16 and Figure 17, it can be seen that at the same probability of failure and the same length of fibrous rubber, the higher the replacement rate of fibrous rubber in concrete, the better the impact resistance of the concrete. When the replacement rate of fibrous rubber is 15%, the impact resistance of concrete is at its maximum; at the same probability of failure and the same replacement rate, the length of fibrous rubber in concrete will be longer. When the fibrous rubber mixing rate is 15% and the length is 12, the concrete impact resistance is at its maximum, and the predicted results are consistent with the actual test results.

4. Discussion

Incorporating fibrous rubber into concrete will produce pores and defects inside the concrete (Figure 14), which will reduce its compressive strength and splitting tensile strength. Nanomaterials have a very small particle size and can thus fill the pores and defects inside the rubberized concrete. Interfacial pores are present between the rubber particles and the cement matrix, and the nanomaterials can enter these pores to make the structure denser and reduce the stress concentration, which improves the mechanical properties of the concrete [29]. Thus, fibrous rubber concrete has both good mechanical properties and a high impact resistance.
The most representative fiber-reinforced concrete is steel fiber concrete. Compared with ordinary concrete, steel fiber concrete has a higher impact resistance, and this can greatly improve the mechanical properties of pavement. According to a large number of studies and data, the impact resistance of steel fiber concrete is 50 to 100 times higher than that of ordinary concrete [30]. A 15% admixture of NBR fiber can improve the final crack impact number by 330% (compared with ordinary concrete), and thus it is more suitable for airport runways and heavy-duty pavements. In terms of cost, the unit price of steel fibers is much higher than that of rubber fibers due to the low rubber recycling cost.
Data obtained through the drop hammer impact test are generally discrete in nature. The most common statistical methods utilize normal and lognormal distributions. However, some scholars have used the normal distribution to analyze the impact resistance of steel and other fiber concretes obtained through the drop hammer impact test, with the results showing that the test data do not obey a normal distribution [31,32]. Thus, due to the data’s adaptability and simpler calculations, the Weibull distribution is more widely used. The test data in terms of impact resistance are statistically analyzed with the Weibull distribution, and it is found that it can be effectively used to describe the life span of fibrous concrete.

5. Conclusions

In this study, we systematically investigated the effects of fibrous rubber (NBR, silicone rubber, EPDM) at different dosages (5%, 10%, 15%) and lengths (6, 12, 18 mm) on the mechanical and impact resistance properties of concrete. The key conclusions are summarized as follows:
  • Correlation between Static Strength and Rubber Type
The incorporation of rubber fibers reduced the compressive and splitting tensile strength of concrete, and the degree of strength loss was closely related to the rubber’s hydrophobicity and surface morphology. NBR showed the lowest strength loss and was superior to silicone rubber and EPDM. SEM analysis showed that the rough surface of NBR enhanced the bond with the cement matrix through mechanical occlusion, while the smooth surface of silicone rubber exacerbated the interfacial slip.
2.
Fiber Length–Dosage Synergy
Longer fibers (18 mm) partially mitigated the static strength loss at low dosages (5%: 5.06% compressive reduction), but excessive fiber lengths at high dosages (15%) triggered agglomeration defects, increasing the porosity. A threshold effect was observed: 12 mm fibers at a dosage of 15% achieved the optimal balance, minimizing strength degradation while maximizing impact resistance.
3.
Enhanced Impact Resistance Mechanisms
Fibrous rubber significantly improved the concrete’s dynamic performance, with NBR (15%, 12 mm) leading to an increase in the final crack impact cycles of 330% compared to plain concrete. The 3D fiber network dissipated energy through elastic deformation, crack bridging and stress redistribution. A Weibull distribution analysis (R2 ≥ 0.808) validated the statistical reliability of impact life predictions, supporting its use in risk-sensitive engineering designs.

Author Contributions

Writing—original draft, Z.L.; Writing—review & editing, S.L.; Project administration, C.J. All authors have read and agreed to the published version of the manuscript.

Funding

The authors gratefully acknowledge financial support provided by the Natural Science Foundation of Xinjiang Uygur Autonomous Region (52269028) and the Xinjiang Autonomous Region Colleges and Universities Basic Research Operating Expenses Scientific Research Projects (XJEDU2024J045).

Data Availability Statement

The original contributions presented in the study are included in the article, further inquiries can be directed to the corresponding author.

Conflicts of Interest

The authors declare no conflict of interest.

References

  1. Diaferio, M.; Varona, F.B. Concrete Structures: Latest Advances and Prospects for a Sustainable Future. Appl. Sci. 2024, 14, 3803. [Google Scholar] [CrossRef]
  2. Chao, F.; Wang, Y. Application Status and Research Direction of Waste Tire Recycling Technology in China. Recycl. Resour. Circ. Econ. 2021, 14, 27–29. (In Chinese) [Google Scholar]
  3. Bu, C.; Zhu, D.; Liu, L.; Lu, X.; Sun, Y.; Yu, L.; OuYang, Y.; Cao, X.; Wang, F. Research progress on rubber concrete properties: A review. J. Rubber Res. 2022, 25, 105–125. [Google Scholar] [CrossRef]
  4. He, S.; Jiang, Z.; Chen, H.; Chen, Z.; Ding, J.; Deng, H.; Mosallam, A.S. Mechanical properties, durability, and structural applications of rubber concrete: A state-of-the-art-review. Sustainability 2023, 15, 8541. [Google Scholar] [CrossRef]
  5. Elshazly, F.A.; Mustafa, S.A.; Fawzy, H.M. Rubberized concrete properties and its structural engineering applications—An overview. Egypt. Int. J. Eng. Sci. Technol. 2020, 30, 1–11. [Google Scholar] [CrossRef]
  6. Hao, Y.; Fan, L.; Han, Y.; Li, H.; Han, X.; Hao, Q. Damage Study of Rubberized Concrete under Impact Loading. J. Vib. Shock 2019, 38, 73–80. (In Chinese) [Google Scholar]
  7. Murugan, R.B.; Natarajan, C. Investigation on the use of waste tyre crumb rubber in concrete paving blocks. Comput. Concr. 2017, 20, 311–318. [Google Scholar]
  8. Ling, T. Effects of compaction method and rubber content on the properties of concrete paving blocks. Constr. Build. Mater. 2012, 28, 164–175. [Google Scholar] [CrossRef]
  9. Najim, K.B.; Hall, M.R. Mechanical and dynamic properties of self-compacting crumb rubber modified concrete. Constr. Build. Mater. 2013, 27, 521–530. [Google Scholar] [CrossRef]
  10. Wang, G.; Zhang, B.; Shui, Z. Experimental study on the performance and microstructure of rubberized lightweight aggregate concrete. Prog. Rubber Plast. Recycl. Technol. 2012, 28, 147–156. [Google Scholar] [CrossRef]
  11. Yuan, Q.; Guo, X.; Feng, L.; Song, D.; Ji, W. Frost resistance of modified rubberized concrete. People’s Yellow River 2017, 39, 113–116. (In Chinese) [Google Scholar]
  12. Wei, K. Study on Impact Resistance and Abrasion Resistance of Basalt Fiber Rubberized Concrete. Master’s Thesis, Xinjiang Agricultural University, Urumqi, China, 2022. (In Chinese). [Google Scholar]
  13. Gupta, T.; Sharma, R.K.; Chaudhary, S. Impact resistance of concrete containing waste rubber fiber and silica fume. Int. J. Impact Eng. 2015, 83, 76–87. [Google Scholar] [CrossRef]
  14. Han, J.; Yuan, Q.; Feng, L.; Wang, W.; Zhao, F. Study on impact resistance of rubberized concrete. People’s Yellow River 2018, 40, 107–109. (In Chinese) [Google Scholar]
  15. Topcu, I.B.; Avcular, N. Collision behaviours of rubberized concrete. Cem. Concr. Res. 1997, 38, 351–356. [Google Scholar]
  16. Li, H. Impact Energy Dissipation of High-Content Rubberized Concrete. Master’s Thesis, Anhui University of Science and Technology, Huainan, China, 2020. (In Chinese). [Google Scholar]
  17. Ismail, M.K.; Hassan, A.; Lachemi, M. Effect of fiber type on impact and abrasion resistance of engineered cementitious composite. ACI Mater. J. 2018, 115, 957–968. [Google Scholar] [CrossRef]
  18. Gao, Z.; Cao, P.; Sun, J.; Zhao, Y. Analysis and micro-characterization of compressive strength of basalt fiber reinforced concrete. J. Hydroelectr. Eng. 2018, 37, 111–120. (In Chinese) [Google Scholar]
  19. Youssf, O.; Mills, J.E.; Hassanli, R. Assessment of the mechanical performance of crumb rubber concrete. Constr. Build. Mater. 2016, 125, 175–183. [Google Scholar] [CrossRef]
  20. Hu, Y.; Gao, P.; Li, F.; Ma, A.; Yu, Z. Experimental study on mechanical properties of rubberized concrete with different replacement rates. J. Build. Mater. 2020, 23, 85–92. (In Chinese) [Google Scholar]
  21. SL/T 325-2020; Hydraulic Concrete Test Procedure. Ministry of Water Resources of the People’s Republic of China: Beijing, China, 2020.
  22. CECS 13:2009; Standard Test Methods for Fiber Concrete. Beijing China Planning Publishing House: Beijing, China, 2009.
  23. Wen, Y.; Liu, P. Study on impact resistance of rubberized concrete. Bull. Chin. Ceram. Soc. 2018, 37, 792–799. (In Chinese) [Google Scholar]
  24. Wang, L.; Wang, H.; Liu, H. Experimental study and statistical analysis on impact resistance of steel fiber lightweight aggregate concrete. J. Dalian Univ. Technol. 2010, 50, 557–563. (In Chinese) [Google Scholar]
  25. Weibull, W. A statistical distribution function of wide applicability. J. Appl. Mech. 1951, 18, 293–297. [Google Scholar] [CrossRef]
  26. Liu, W.; Xu, S.; Li, Q. Experimental study on bending fatigue life of ultra-high toughness cementitious composites under constant-amplitude fatigue loading. J. Build. Struct. 2012, 33, 119–127. (In Chinese) [Google Scholar]
  27. Oh, B.H. Fatigue life distribution of concrete forvarious stress levels. ACI Mater. J. 1991, 88, 191–198. [Google Scholar]
  28. Rahmani, T.; Kiani, B.; Shekarchi, M.; Safari, A. Statistical and experimental analysis on the behavior of fiber reinforced concretes subjected to drop weight test. Constr. Build. Mater. 2012, 37, 360–369. [Google Scholar] [CrossRef]
  29. Abdulkadir, I. Nanomaterials in Rubberised Concrete: A Brief Review of Latest Research Trends. Adv. Offshore Struct. Eng. J. 2024, 1, 1–12. [Google Scholar]
  30. Zhou, J.; Feng, Y.; Zhang, Y.; Du, R.; Zhao, Y. Mechanical properties test of steel fiber reinforced concrete and its application in pavement construction technology. Sci. Innov. 2025, 230–232. (In Chinese) [Google Scholar] [CrossRef]
  31. Song, P.S.; Wu, J.C.; Hwang, S.; Sheu, B.C. Assessment of statistical variations in impact resistance of high-strength concrete and high-strength steel fiber-reinforced concrete. Cem. Concr. Res. 2005, 35, 393–399. [Google Scholar] [CrossRef]
  32. Nataraja, M.C.; Nagaraj, T.S.; Basavaraja, S.B. Reproportioning of steel fibre reinforced concrete mixes and their impact resistance. Cem. Concr. Res. 2005, 35, 2350–2359. [Google Scholar] [CrossRef]
Figure 1. Experimental procedure.
Buildings 15 01245 g001
Figure 2. Fibrous rubber of different lengths.
Buildings 15 01245 g002
Figure 3. Compressive strength and splitting tensile strength of concrete with different rubber types.
Buildings 15 01245 g003
Figure 4. Compression damage specimen images.
Buildings 15 01245 g004
Figure 5. Surface microscopic morphology of different rubber types.
Buildings 15 01245 g005aBuildings 15 01245 g005b
Figure 6. Compressive strength of concrete with different fibrous rubber admixtures.
Buildings 15 01245 g006
Figure 7. Splitting tensile strength of concrete with different fibrous rubber admixtures.
Buildings 15 01245 g007
Figure 8. Compressive strength of concrete with different fibrous rubber lengths.
Buildings 15 01245 g008
Figure 9. Splitting tensile strength of concrete with different fibrous rubber lengths.
Buildings 15 01245 g009
Figure 10. Compression damage specimen pictures.
Buildings 15 01245 g010
Figure 11. Impact resistance of concrete with different fibrous rubber admixtures.
Buildings 15 01245 g011
Figure 12. Impact resistance of concrete with different fibrous rubber lengths.
Buildings 15 01245 g012
Figure 13. Impact damage diagram for fibrous rubberized concrete.
Buildings 15 01245 g013
Figure 14. Microstructure of fibrous rubber concrete. (a) Bonding of the NBR to the substrate. (b) Bonding of EPDM to the substrate. (c) Bonding of silicone rubber to the substrate.
Buildings 15 01245 g014
Figure 15. Linear fitting curve of Weibull distribution for impact damage number N2.
Buildings 15 01245 g015
Figure 16. Curves of the number of impact damages ln(N2) versus fibrous rubber doping for different failure probabilities.
Buildings 15 01245 g016
Figure 17. Curves of the number of impact damages ln(N2) versus the length of fibrous rubber for different failure probabilities.
Buildings 15 01245 g017
Table 1. Physical and mechanical properties of the cement.
DensitySpecific Surface AreaStandard Consistency Water ConsumptionSetting Time (min)Compression
Strength
(MPa)
Flexural Strength
(MPa)
(g/cm3)(m2/kg)(%)Initial settingFinal
setting
3 d28 d3 d28 d
3.1336626.718423725.751.55.68.6
Table 2. NBR EDS analysis results.
Element ContentCOCaZnSNaClKSiAl
(%)66.4417.276.040.670.930.123.920.034.410.17
Table 3. Silicone rubber EDS analysis results.
Element ContentCOCaZnSNaClKSiAl
(%)47.2127.690.260.020.260.070.030.0624.250.15
Table 4. EPDM EDS analysis results.
Element ContentCOCaZnSNaClKSiAl
(%)78.1612.454.740.841.550.730.140.121.110.16
Table 5. Mix ratios of the concrete.
Test NumberCement
(kg·m−3)
Water
(kg·m−3)
Sand
(kg·m−3)
Stone
(kg·m−3)
Rubber
Length
(mm)
Rubber
Content
(%)
1475190677.51016
2475190643.6101665
3475190643.61016125
4475190643.61016185
5475190609.81016610
6475190609.810161210
7475190609.810161810
8475190575.91016615
9475190575.910161215
10475190575.910161815
11475190609.810161210
12475190609.810161210
Register: Numbers 2–10 are nitrile rubber, 11 is silicone rubber, and 12 is EPDM rubber.
Table 6. Compressive strength and splitting tensile strength of fibrous rubberized concrete.
Test NumberRubber Length (mm)Rubber Doping
(%)
Cubic Compressive Strength
(MPa)
Relative Value
(%)
Cubic Splitting Tensile Strength
(MPa)
Relative Value
(%)
152.61003.76100
26546.8789.113.4391.22
312548.692.43.5694.68
418549.9494.943.6697.34
561044.2184.053.387.77
6121045.786.883.3889.89
7181047.189.543.4391.22
861538.4373.063.0380.59
9121540.1276.273.1884.57
10181539.9775.993.182.45
11121036.3769.142.8776.33
12121041.2878.483.2586.44
Table 7. Impact test results.
Test NumberNumber of ImpactsNumber of Impacts of a Single Sample in Each Group of SpecimensAverageImpact Work
(J)
12345678
1N1312640344650335439775
N2322740354751355540795
2N16567607368757277701391
N27272687975807885761510
3N17888626773699375751490
N283926573797210081801589
4N17779828583738086811609
N28484889190808594871728
5N193111771271071161181151102185
N297113821331111211231191142265
6N11191231381541341451421281352682
N21251291441611411521501361422821
7N11591551721511471341521541533039
N21681641801591561441611641623218
8N11421501461531601411401441462900
N21491551521581681471461511523020
9N11591731471651621691561741643258
N21661811541731711771641821723417
10N11581701531661671591651631633238
N21651771601741731661701721703377
11N17610710382911028793931847
N28111210988981089398991967
12N11021131091191241291171261182344
N21091211151251311371241341252483
Table 8. Linear regression results of the Weibull distribution for the number of impacts resisted.
Test NumberαβR2
N1N2N1N2N1N2
13.7123.84614.00314.5960.960.957
211.61713.25249.74457.8680.9870.959
36.8556.81330.0830.3340.9340.948
417.78317.97978.52780.7530.9930.954
55.7816.10727.49229.2590.9190.944
610.97811.2154.32956.0220.9750.979
713.0514.57666.10574.6150.9050.922
819.1618.99396.08596.0420.840.808
916.93817.0986.75488.330.9880.983
1027.7328.934141.654149.0070.9840.984
118.0428.4636.85439.2610.9820.976
1212.20112.43158.59360.4220.9950.99
Table 9. Prediction results of the number of impacts with different failure probabilities.
Test Number10%30%50%
N1N2N1N2N1N2
1242533343940
2606666737077
3586269747681
4737978848187
5798397102109113
6115121128135136143
7133143146156154163
8134140143149148154
9147154158165164172
10153160159166163170
11747986929399
12101108112119118125
Disclaimer/Publisher’s Note: The statements, opinions and data contained in all publications are solely those of the individual author(s) and contributor(s) and not of MDPI and/or the editor(s). MDPI and/or the editor(s) disclaim responsibility for any injury to people or property resulting from any ideas, methods, instructions or products referred to in the content.

