
Climate Adaptation of Folk House Envelopes in Xinjiang Arid Region: Evaluation and Multi-Objective Optimization from Historical to Future Climates

 ,
,
Abstract
1. Introduction
- Temporal narrowness: Existing methods for optimizing thermal comfort and energy demand rely solely on the Typical Meteorological Year (TMY) and current climate data, raising concerns about their feasibility under future climate scenarios.
- Geographic imbalance: Geographic overemphasis on Turpan’s extreme hot-arid climate neglects the moderate hot-arid conditions predominant in most of Xinjiang, creating research gaps for folk houses in other sub-regions.
- Type bias: Most related studies emphasize traditional construction while inadequately addressing modern-material folk houses now proliferating across the region.
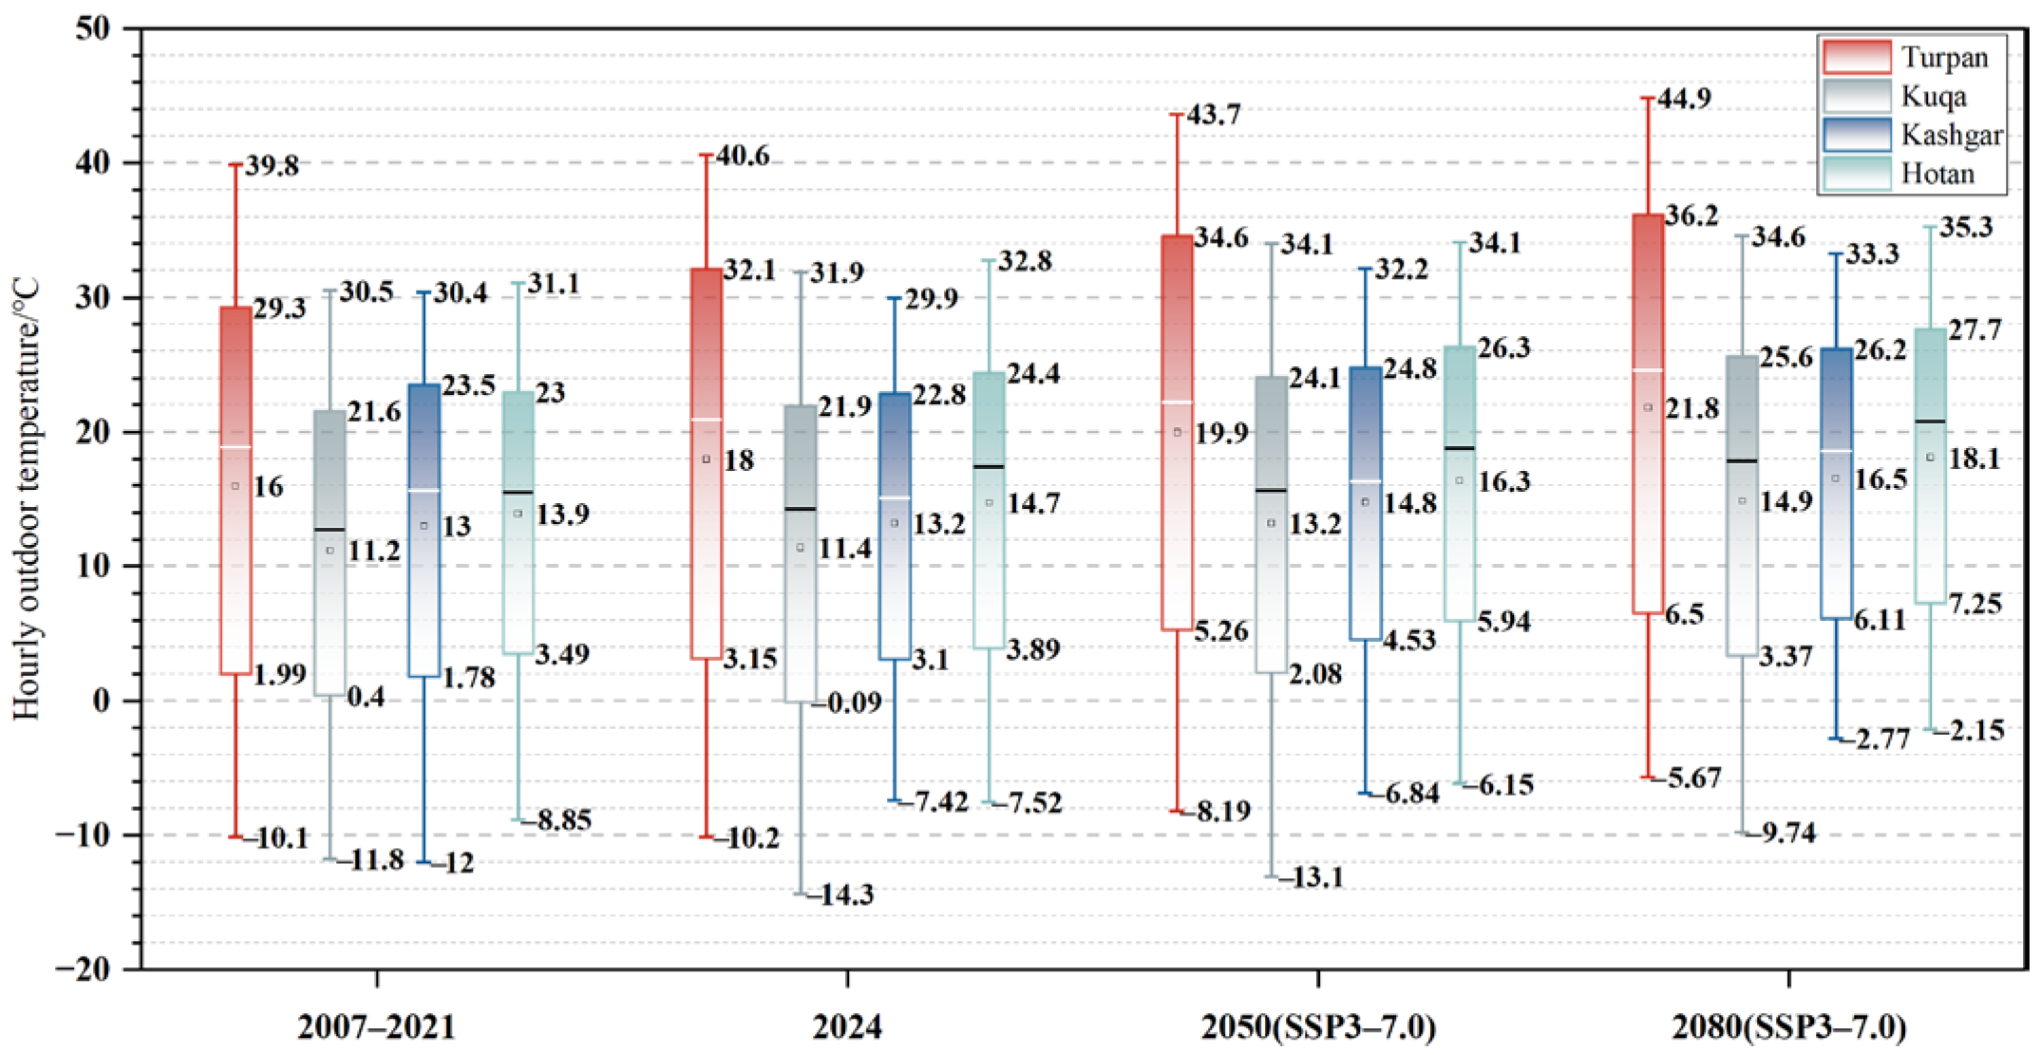
- Temporal scope expansion: This study analyzes climate impacts across historical (2007–2021 TMY data), current (2024 observed data), and future periods (2050/2080 SSP3–7.0 projected data), enabling comprehensive performance evaluation and optimization under evolving climate conditions.
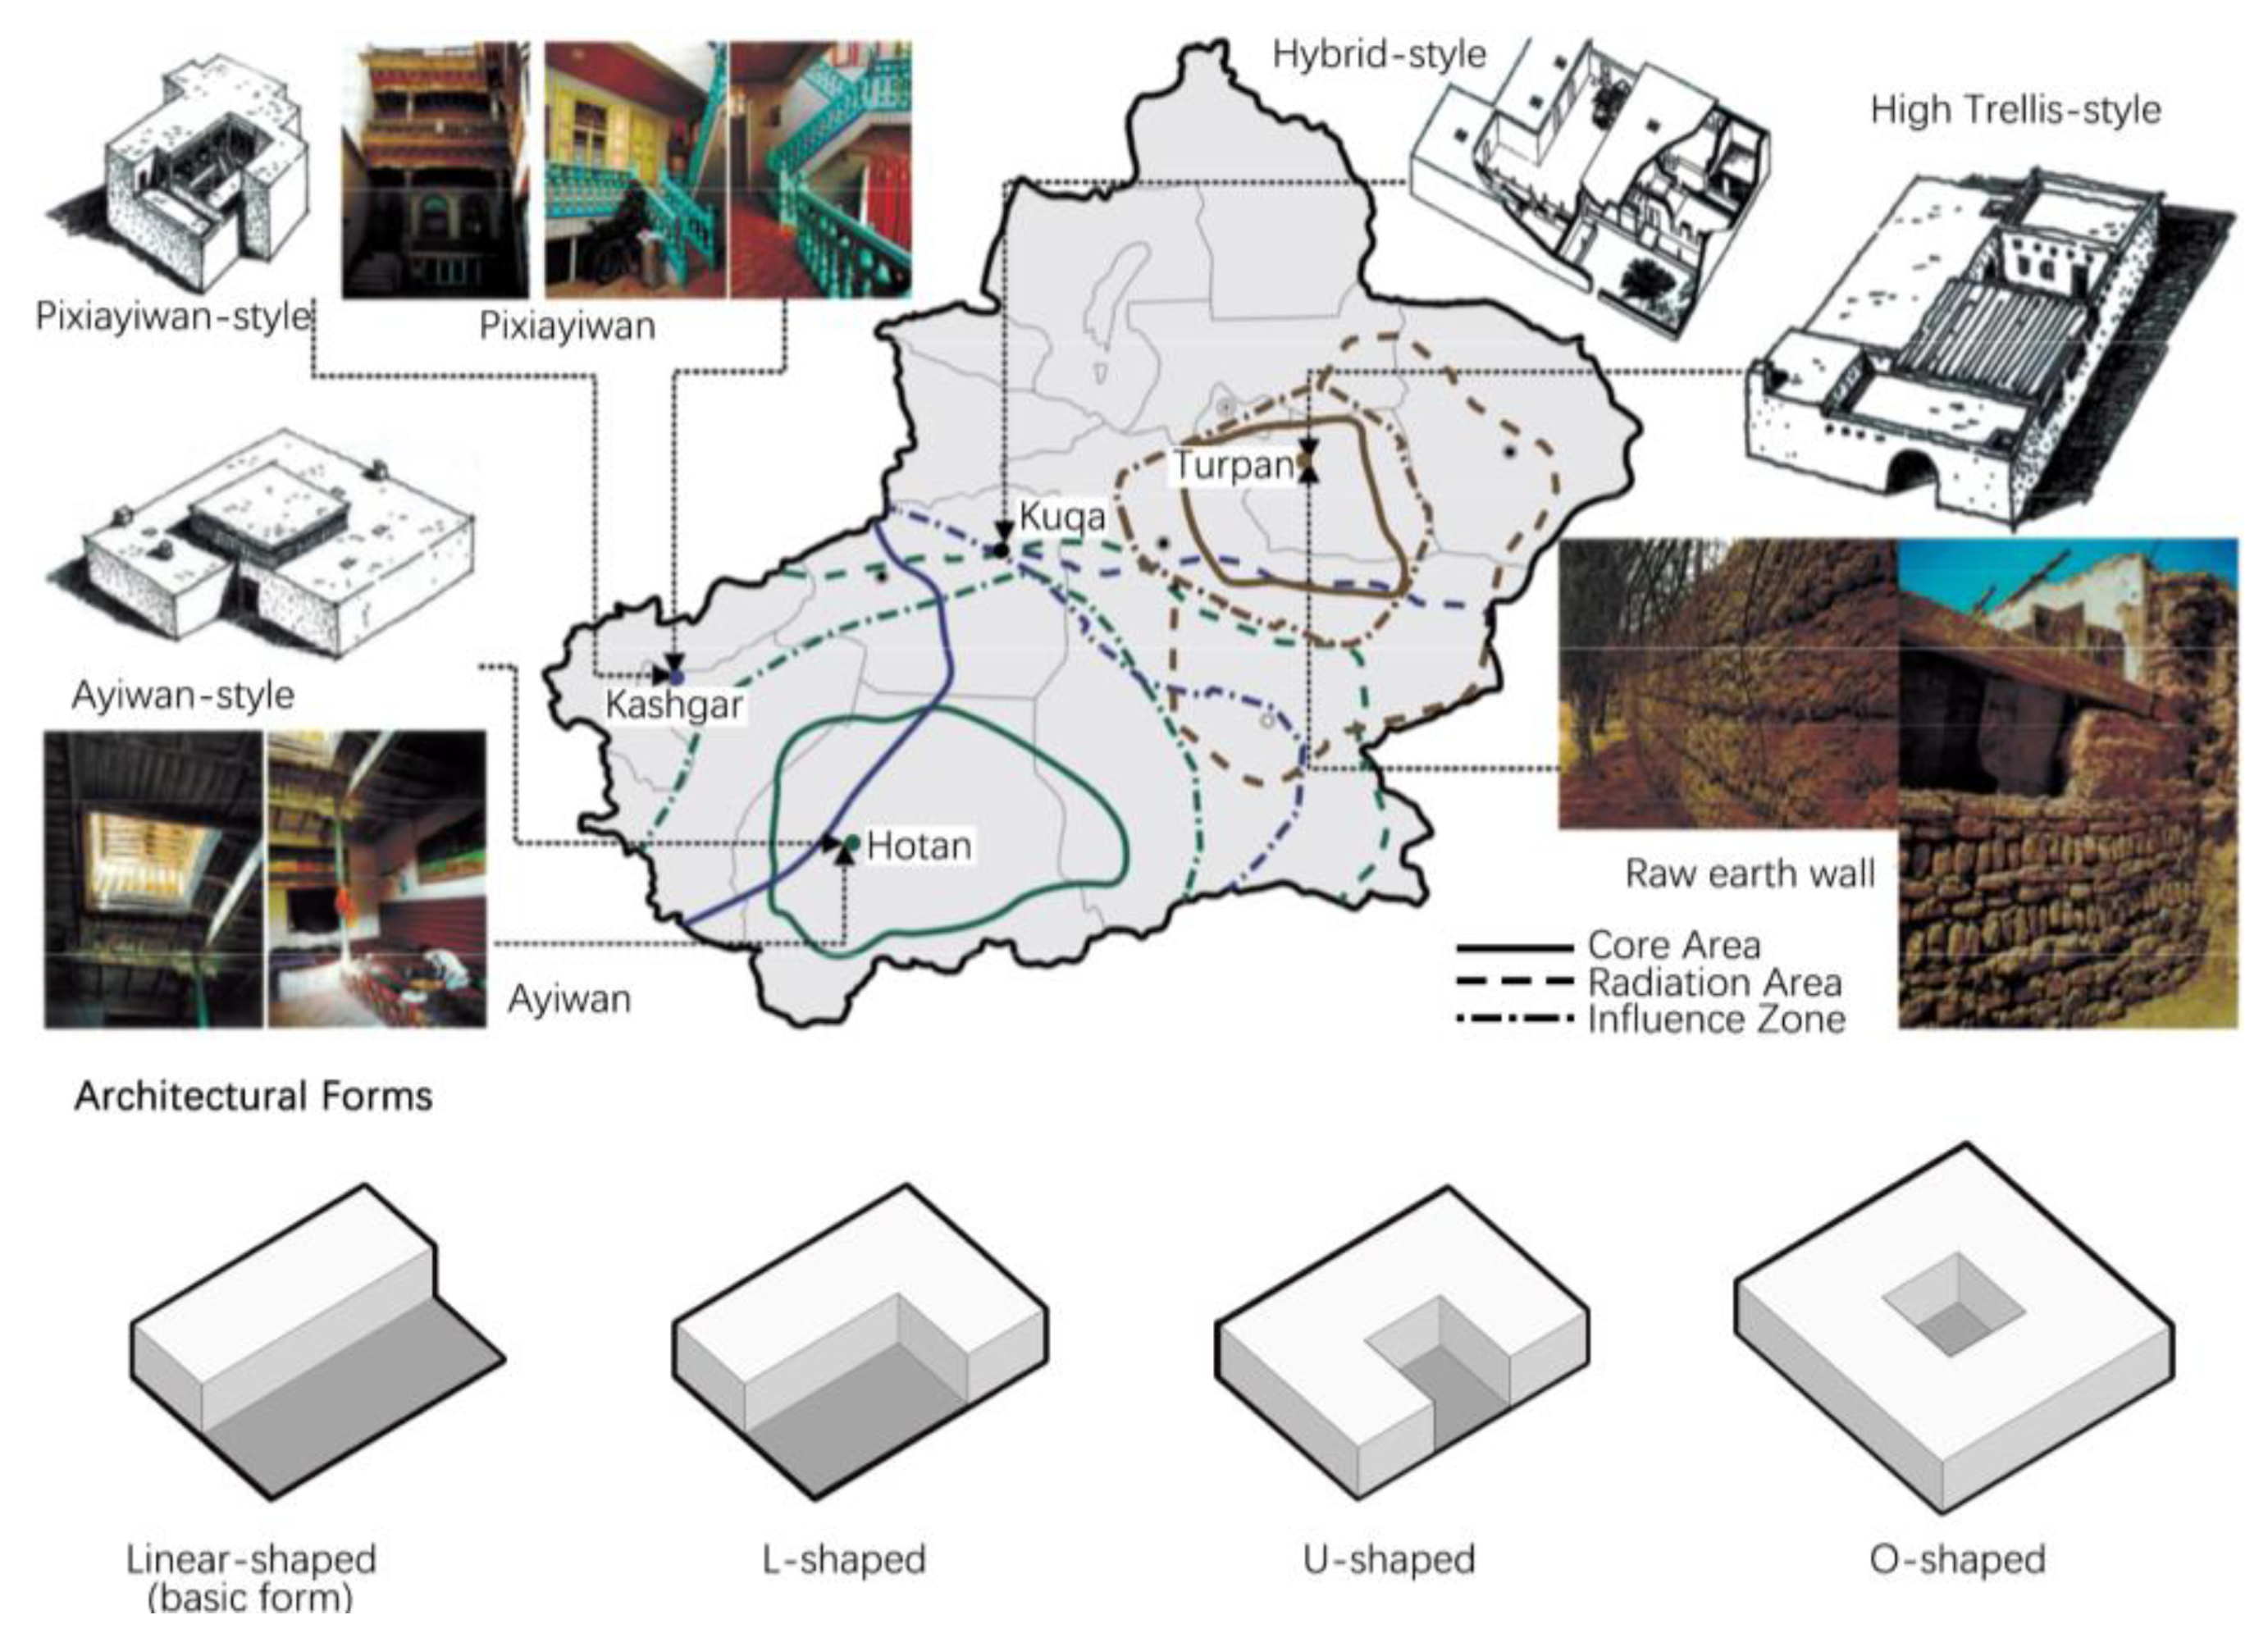
- Geographic and type diversity: The investigation covers rammed earth, brick–wood, and brick–concrete folk houses in Kashgar, Hotan, Kuqa, and Turpan, ensuring widely applicable research conclusions and outcomes.
- Integrated optimization framework: Combining the entropy-weighted TOPSIS method with the NSGA-II algorithm, this study achieves efficient multi-objective optimization to ensuring climate resilience in the optimized solutions.
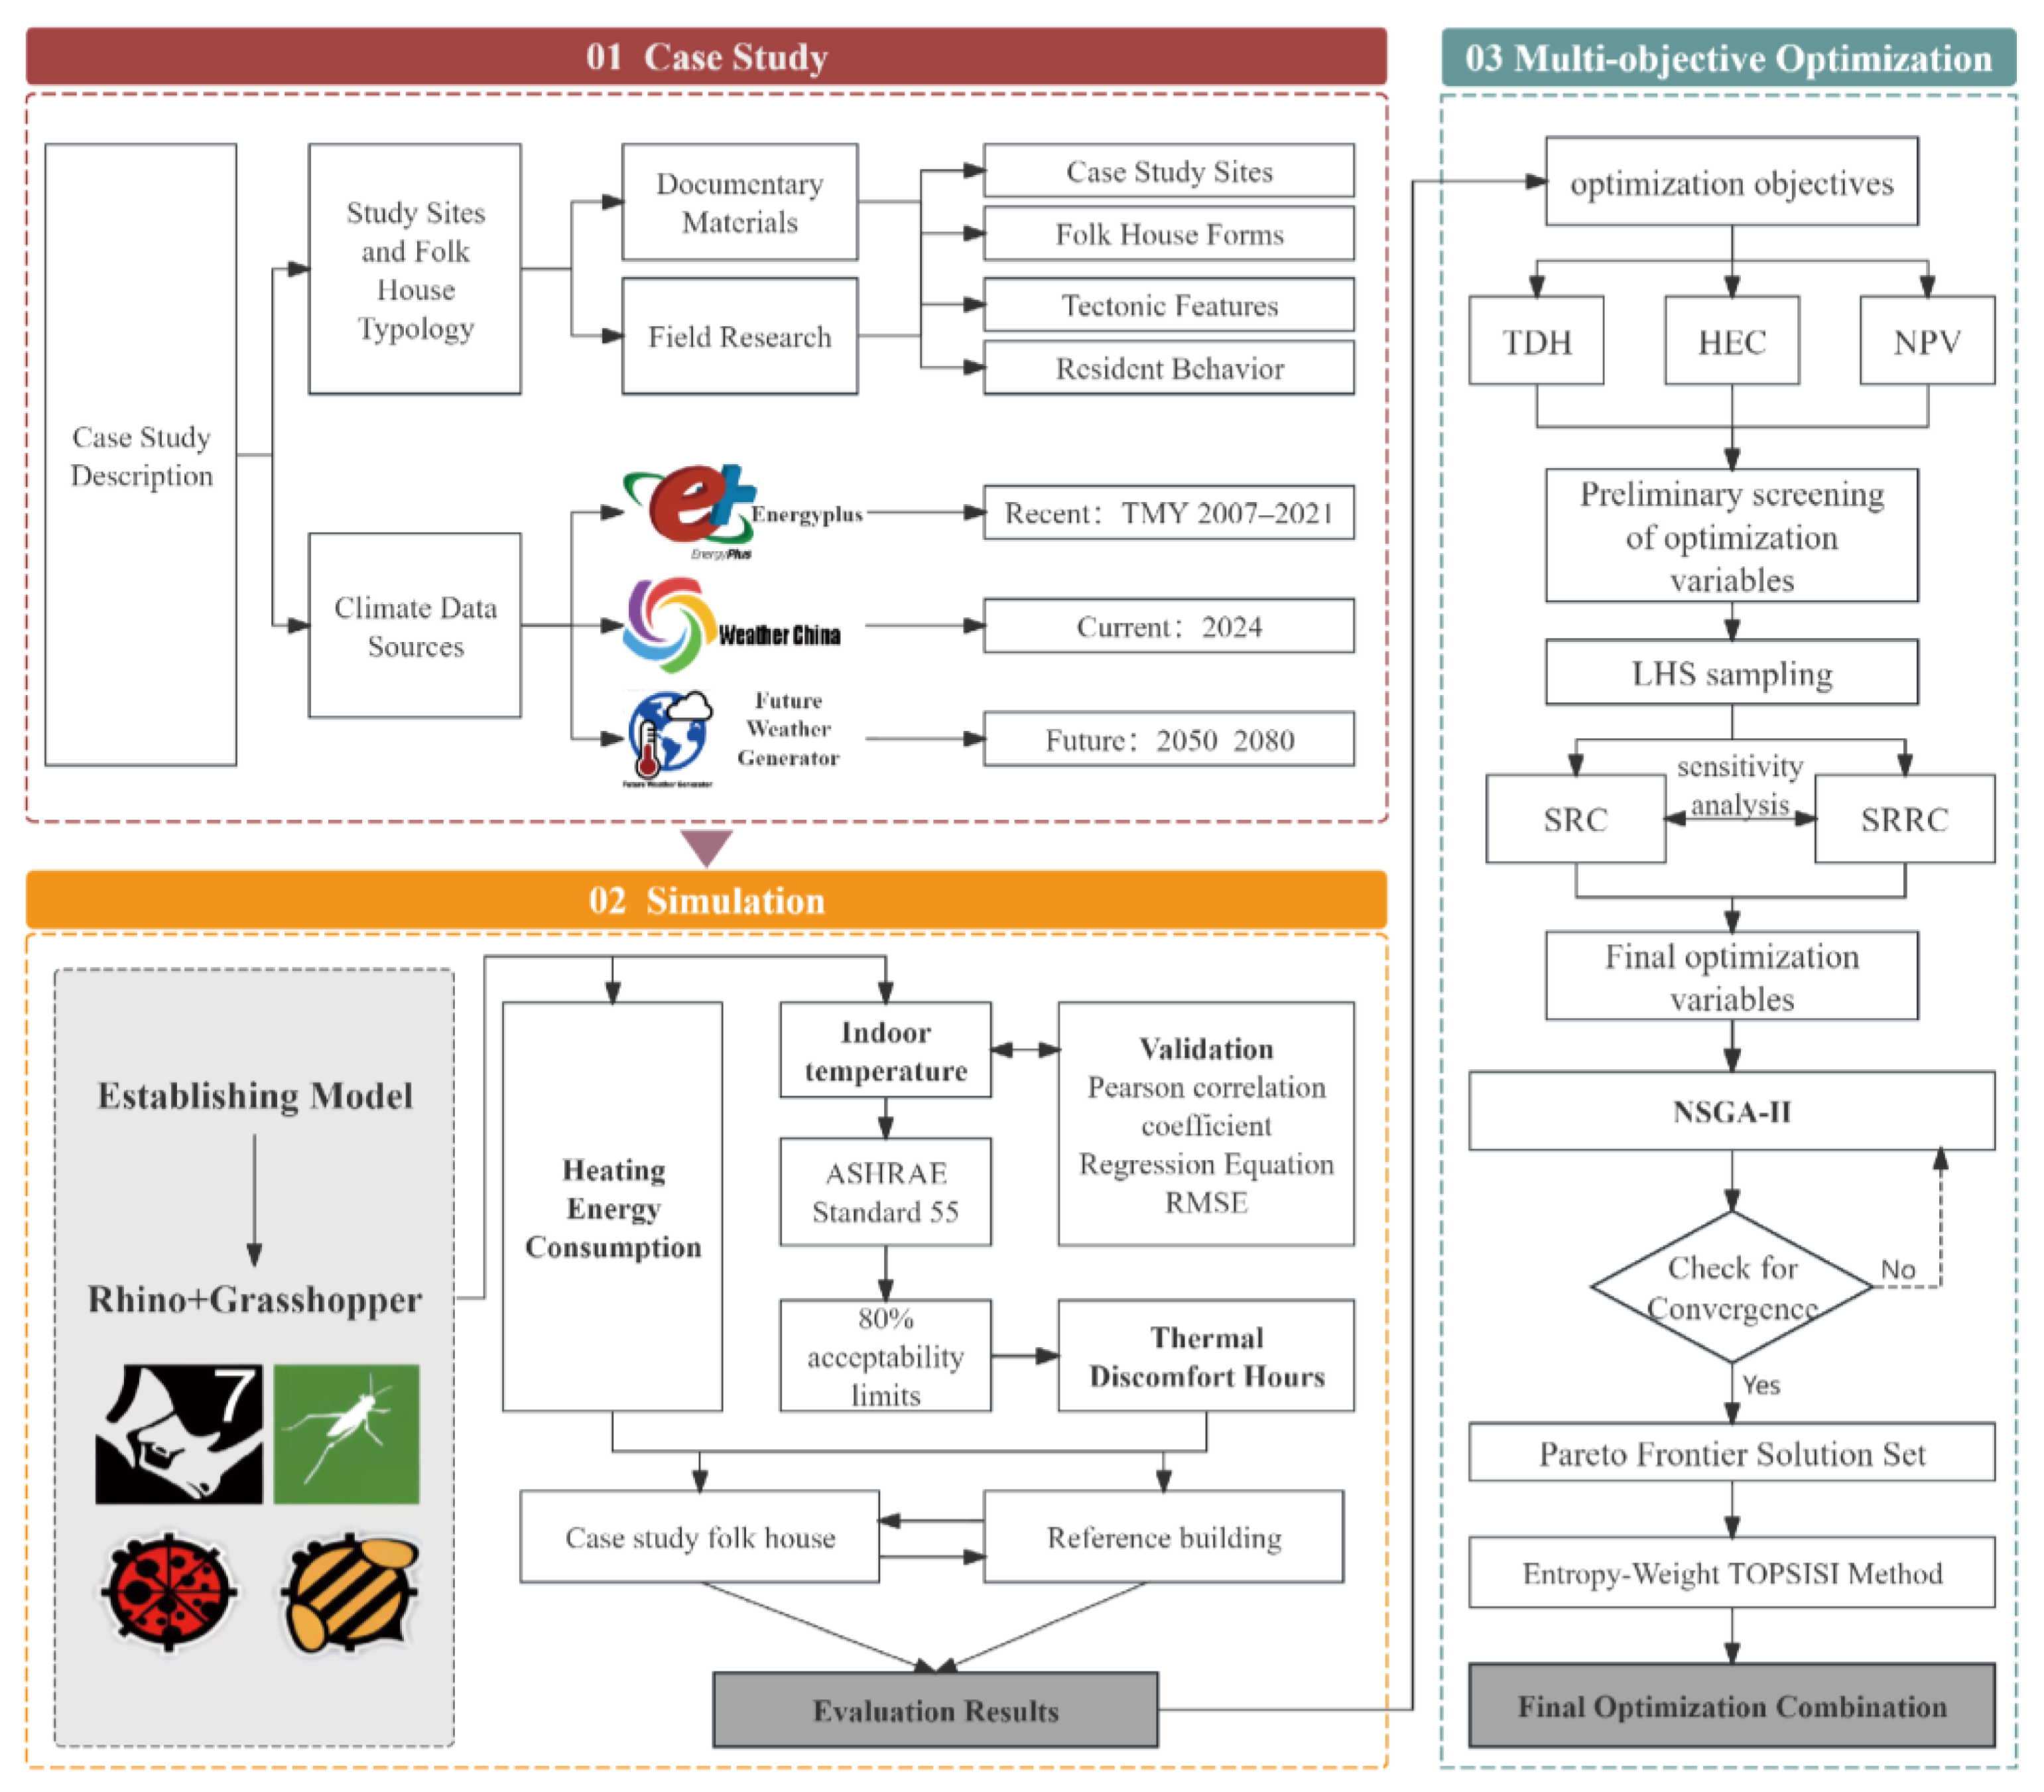
2. Materials and Methods
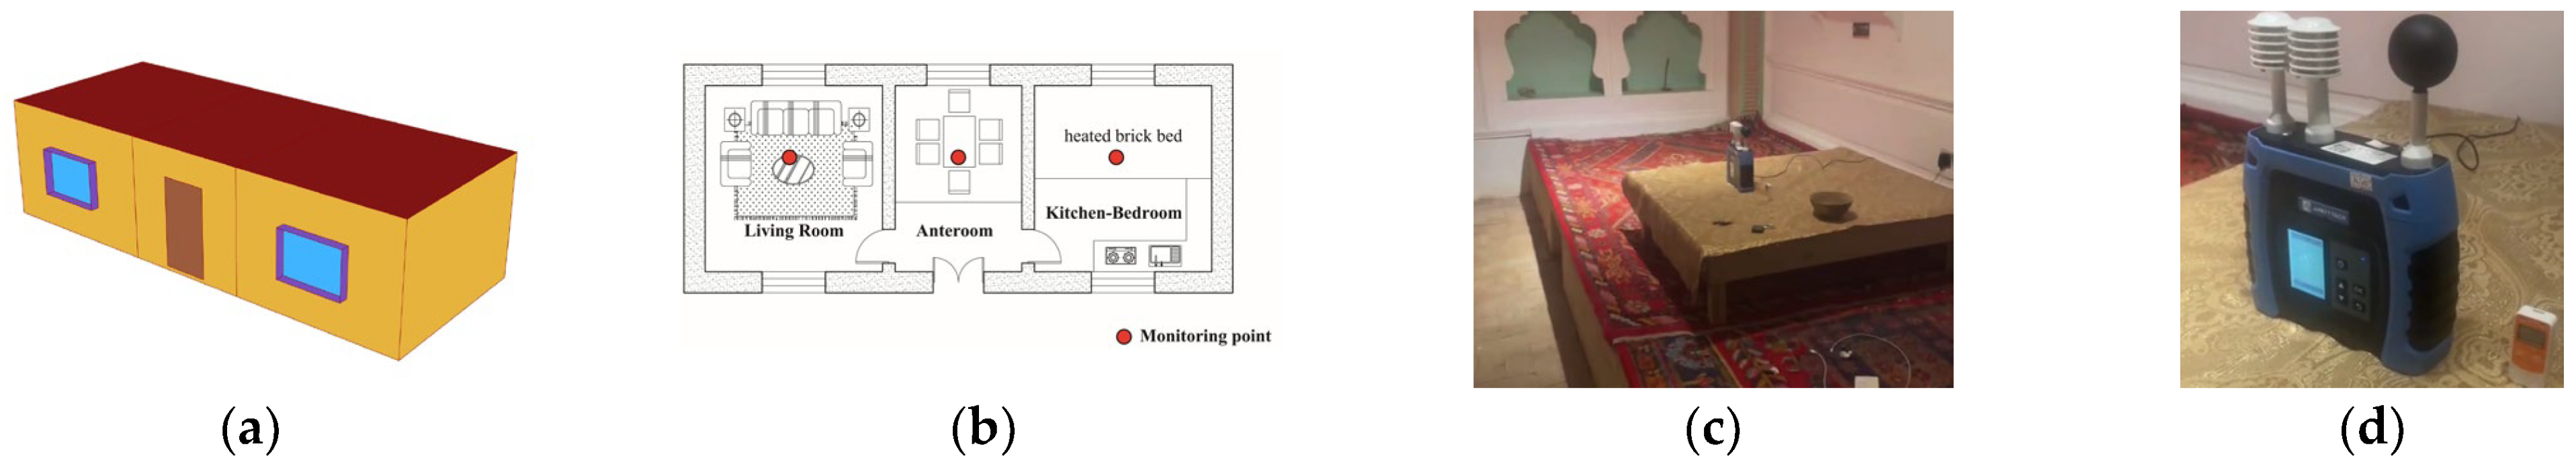
2.1. Case Study Description
2.1.1. Study Sites and Folk House Typology
2.1.2. Climate Data Sources
2.2. Simulation
2.2.1. Model Validation
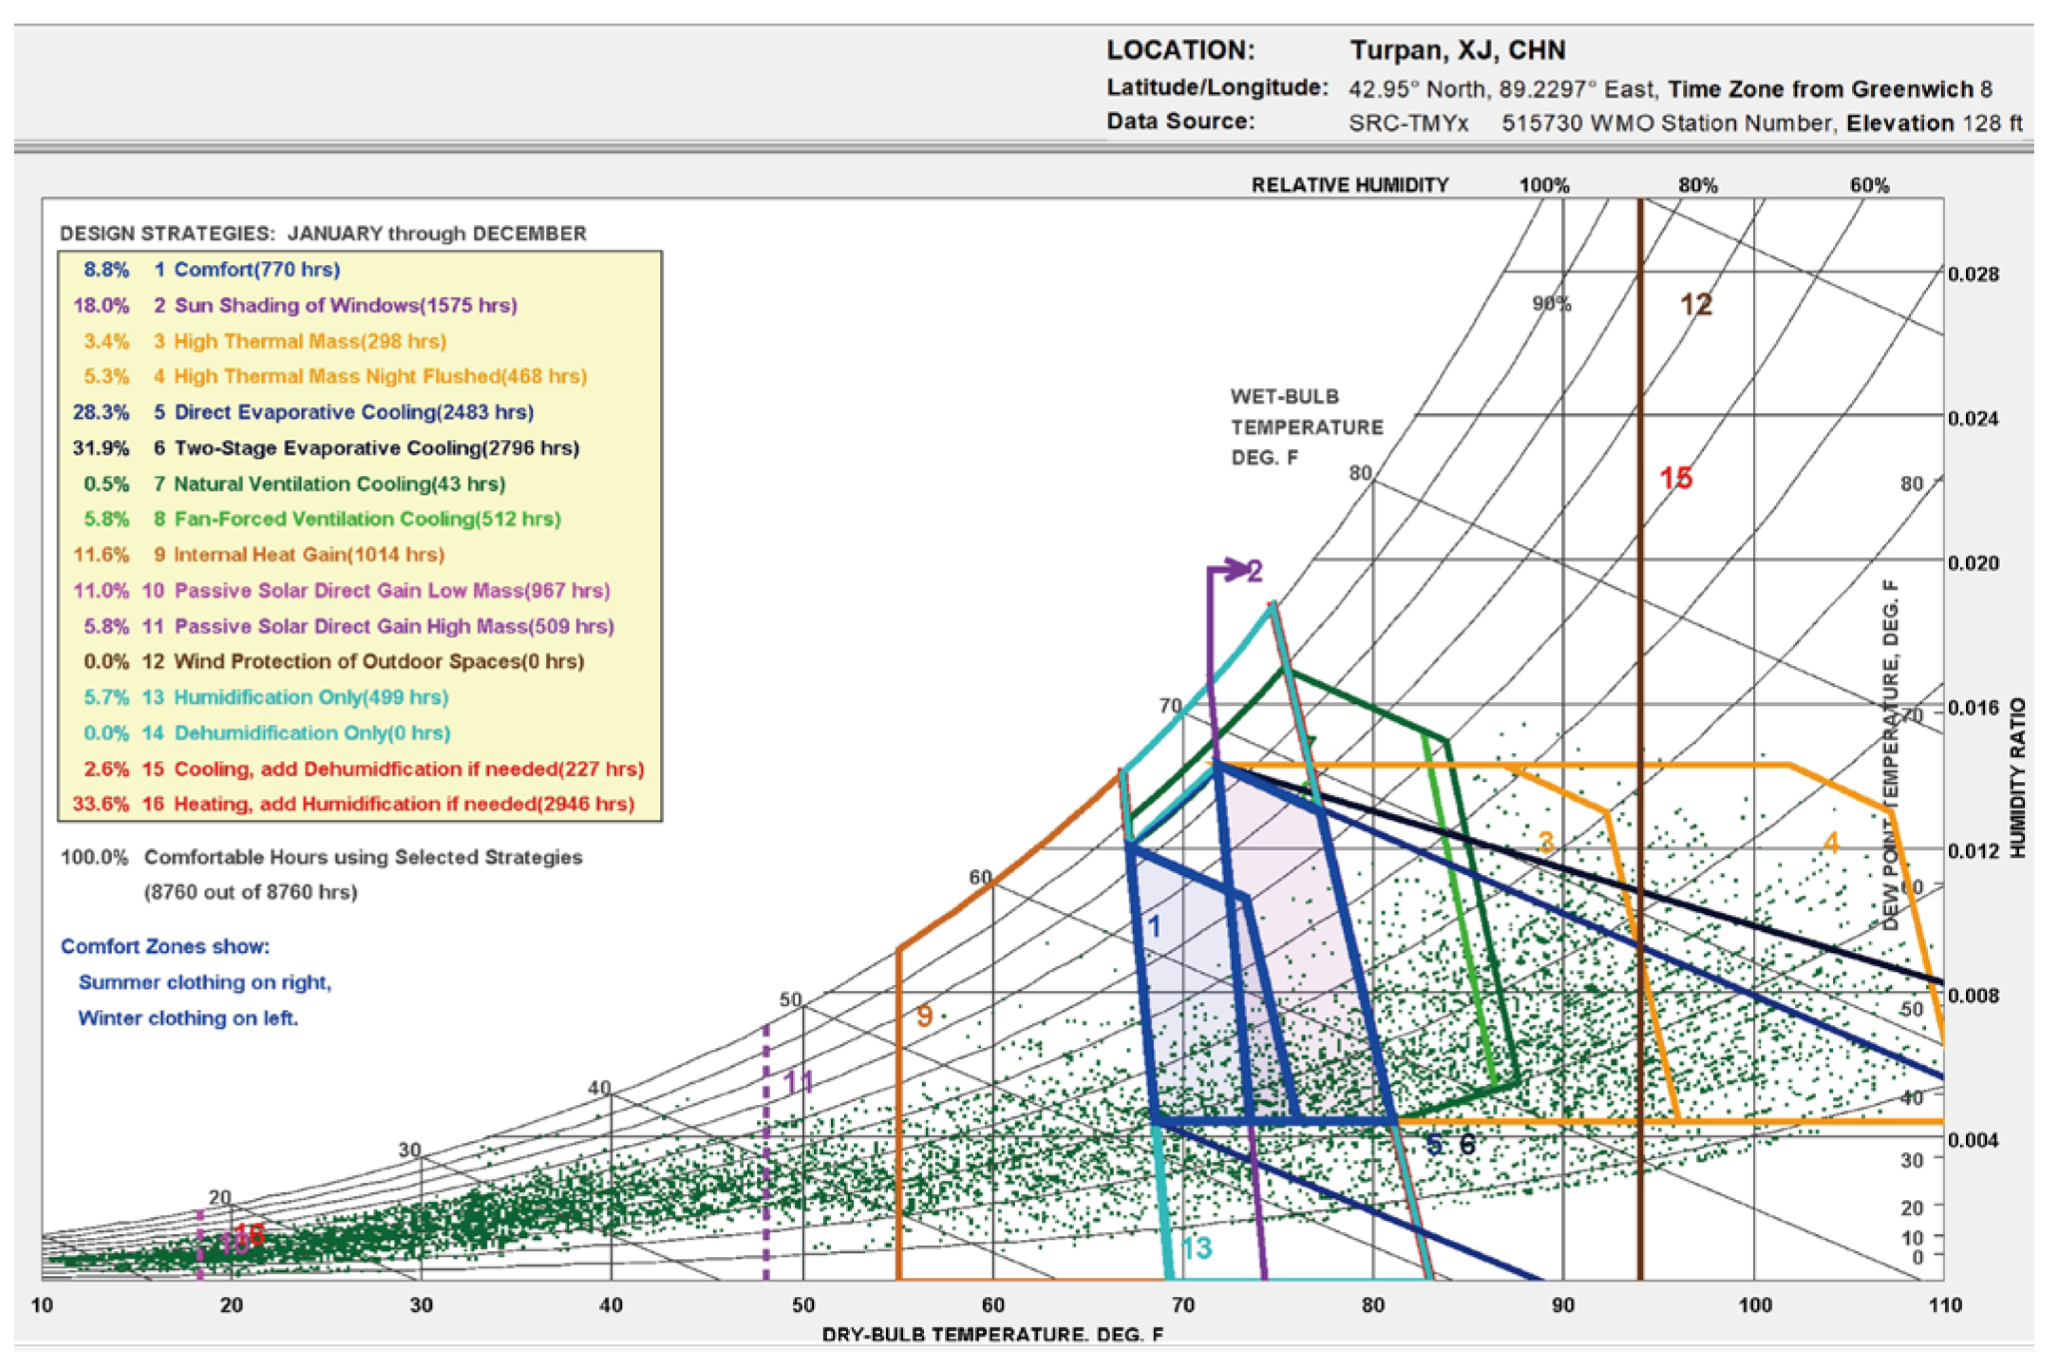
2.2.2. Meteorological Parameter Settings
2.2.3. Construction Parameters
2.2.4. Building Heating, Ventilation, and Internal Heat Gain Parameter Settings
2.2.5. Evaluation Metrics
2.3. Multi-Objective Optimization
2.3.1. Optimization Objectives
2.3.2. Optimization Variable Screening and Ranges
2.3.3. Entropy-Weighted TOPSIS Comprehensive Evaluation Method
3. Results
3.1. Validation Results
3.2. Simulation Results
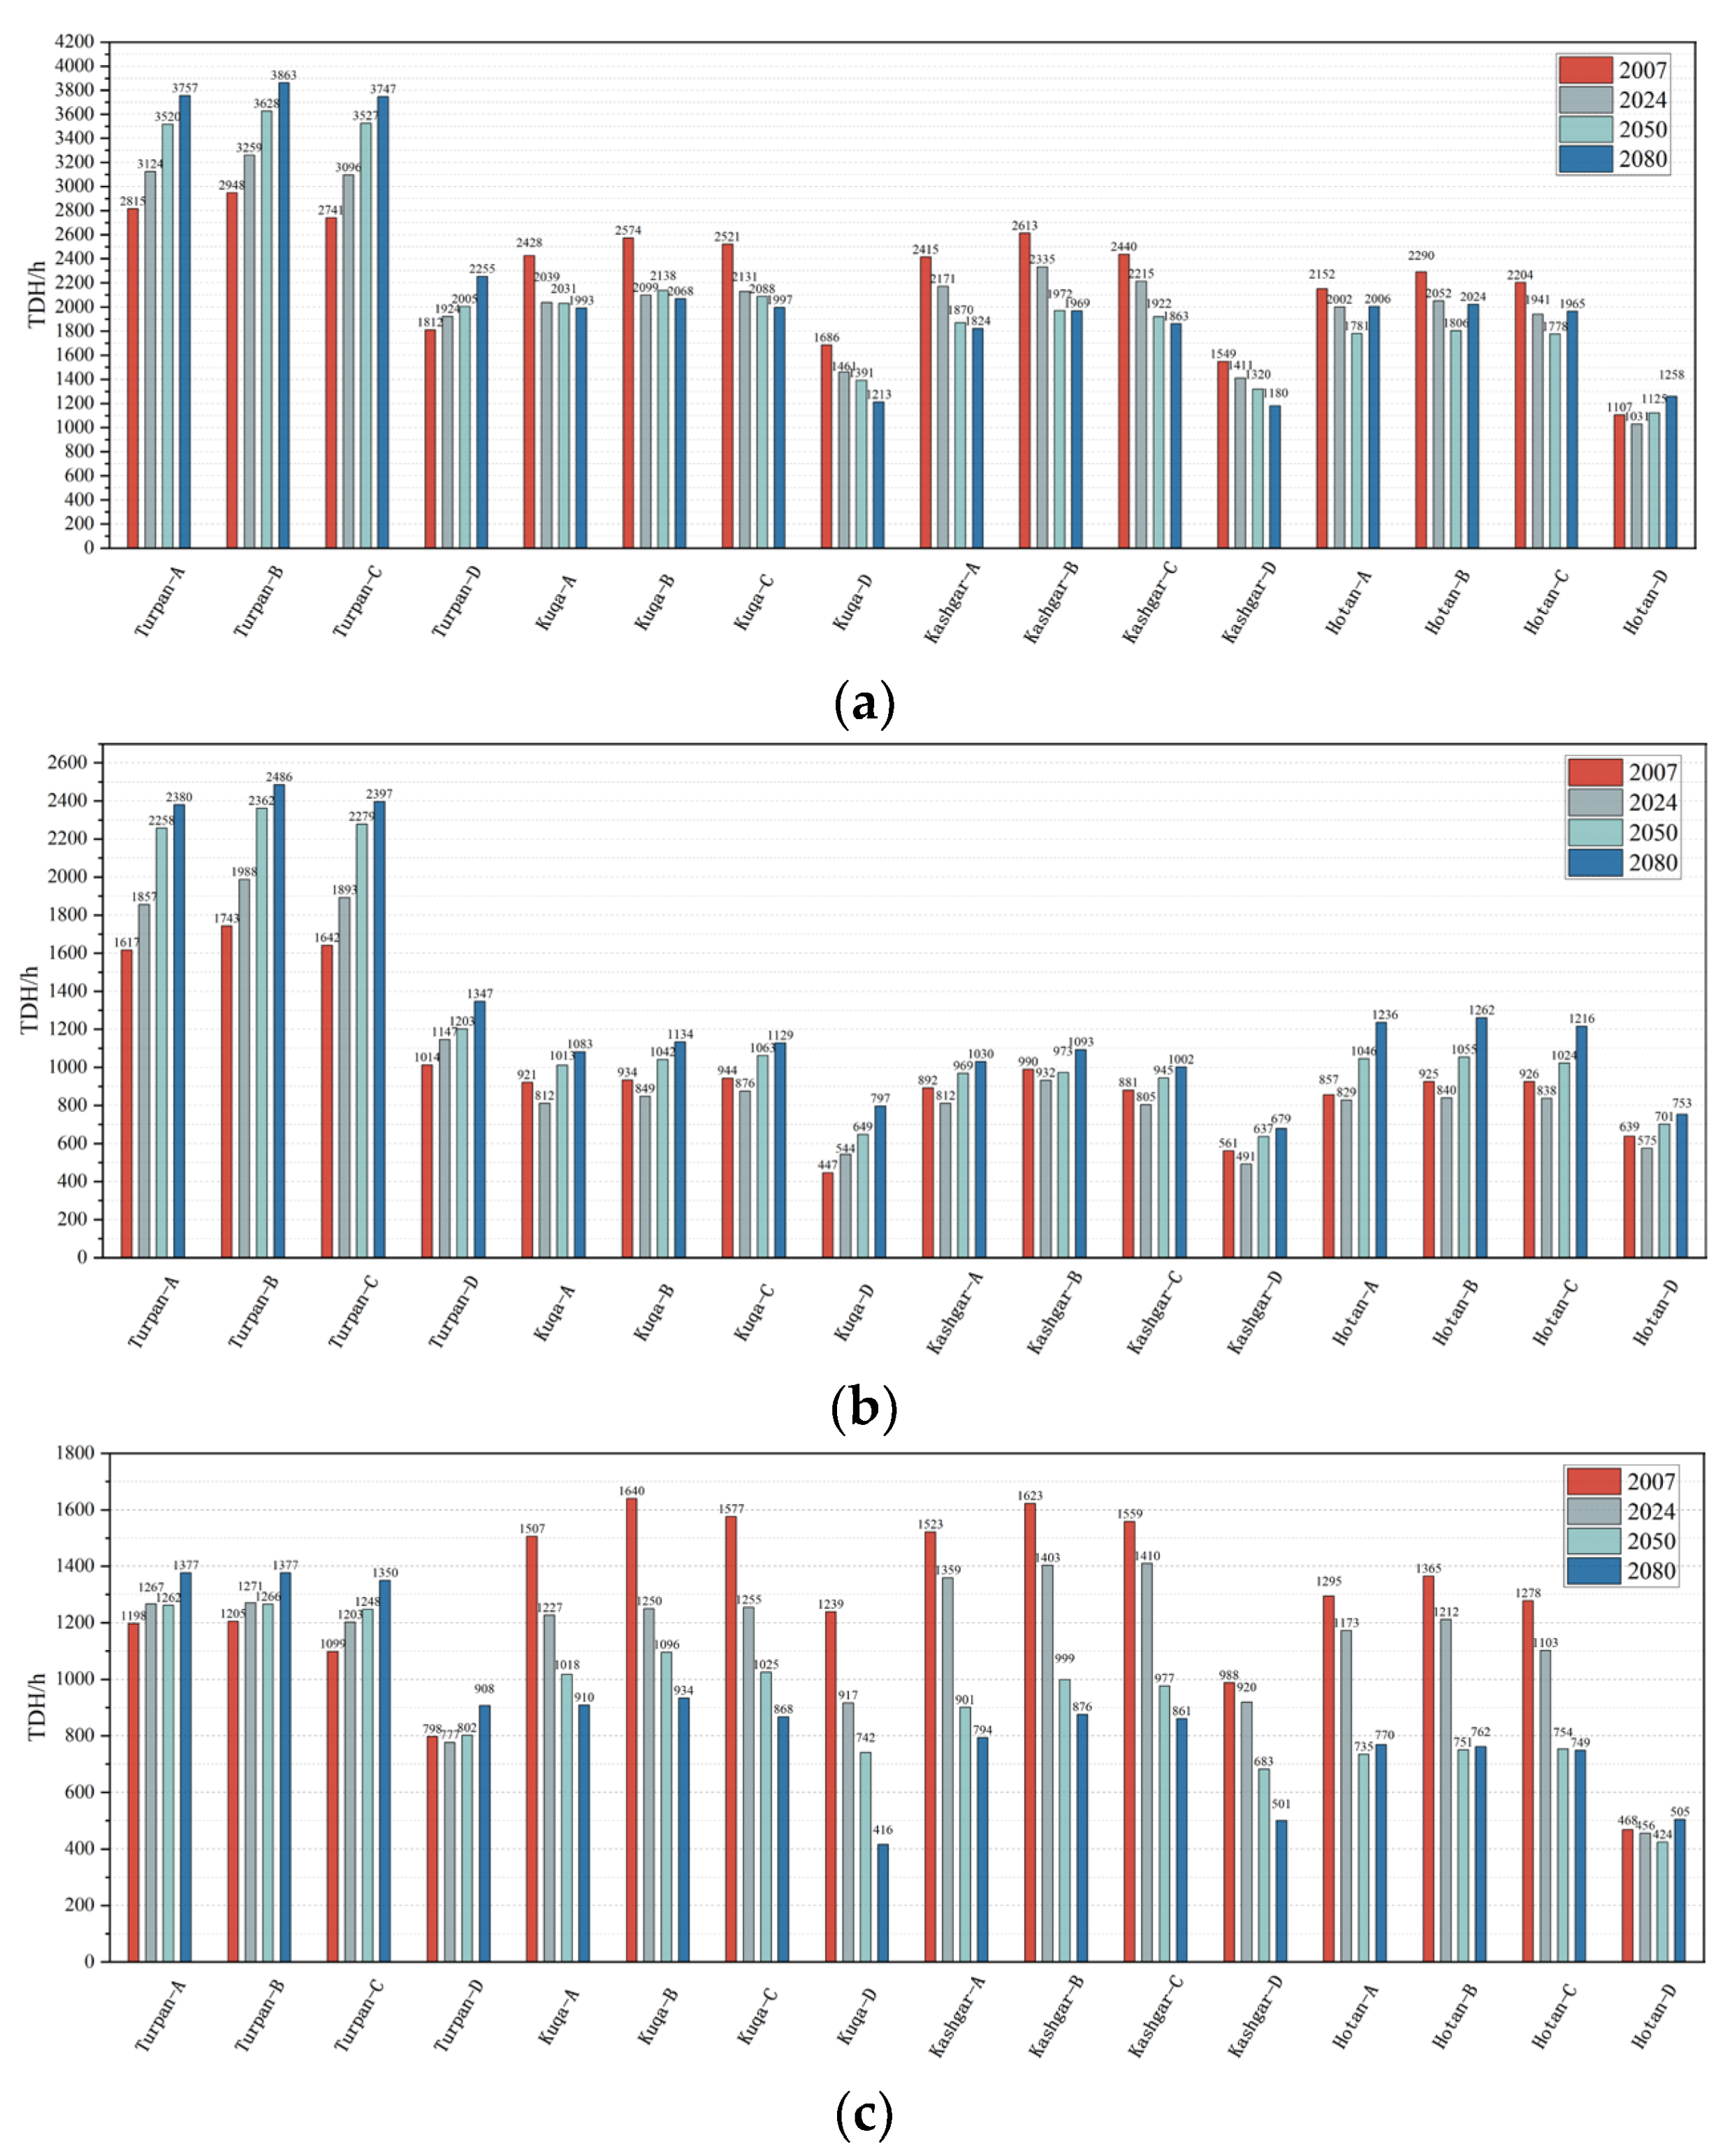
3.2.1. Thermal Discomfort Hours’ Simulation Results
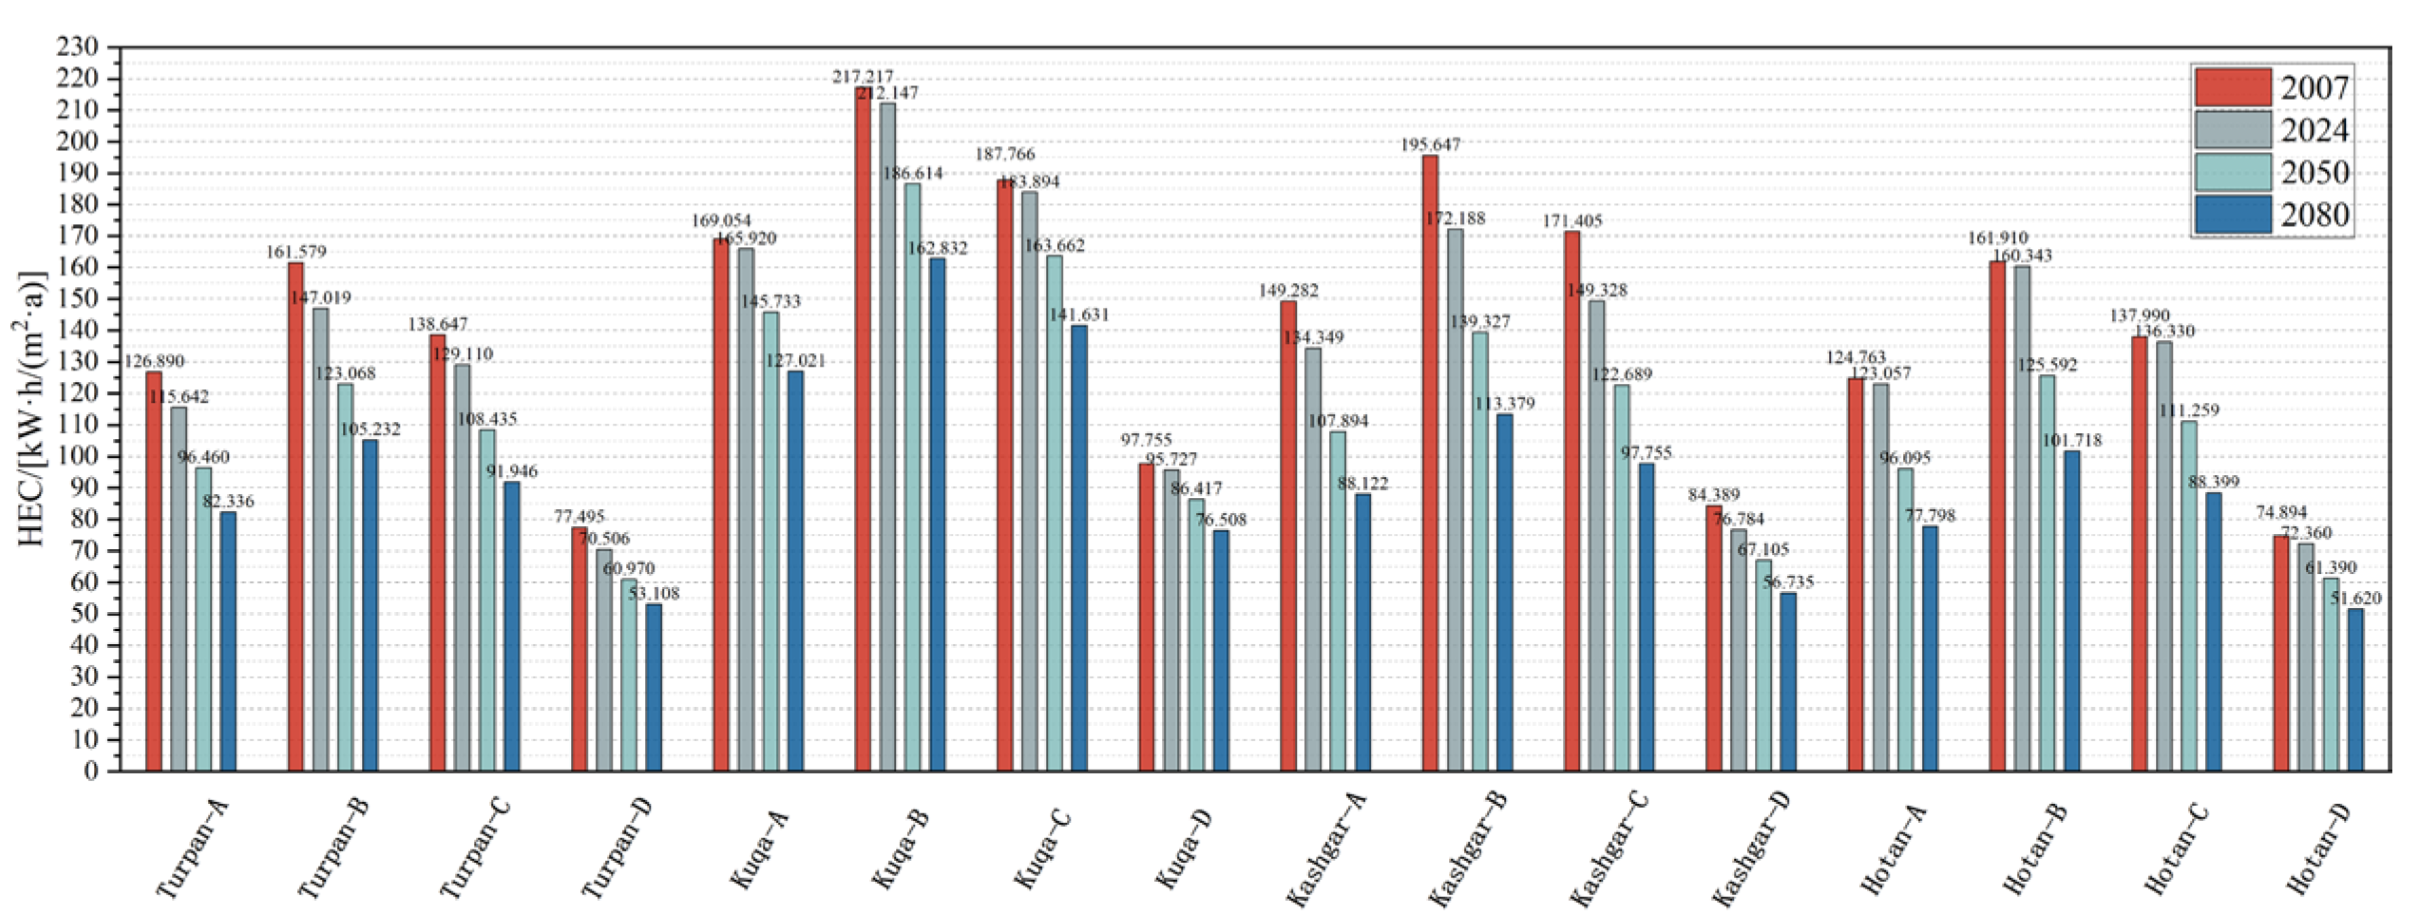
3.2.2. Heating Energy Consumption Simulation Results
3.3. Multi-Objective Optimization Results
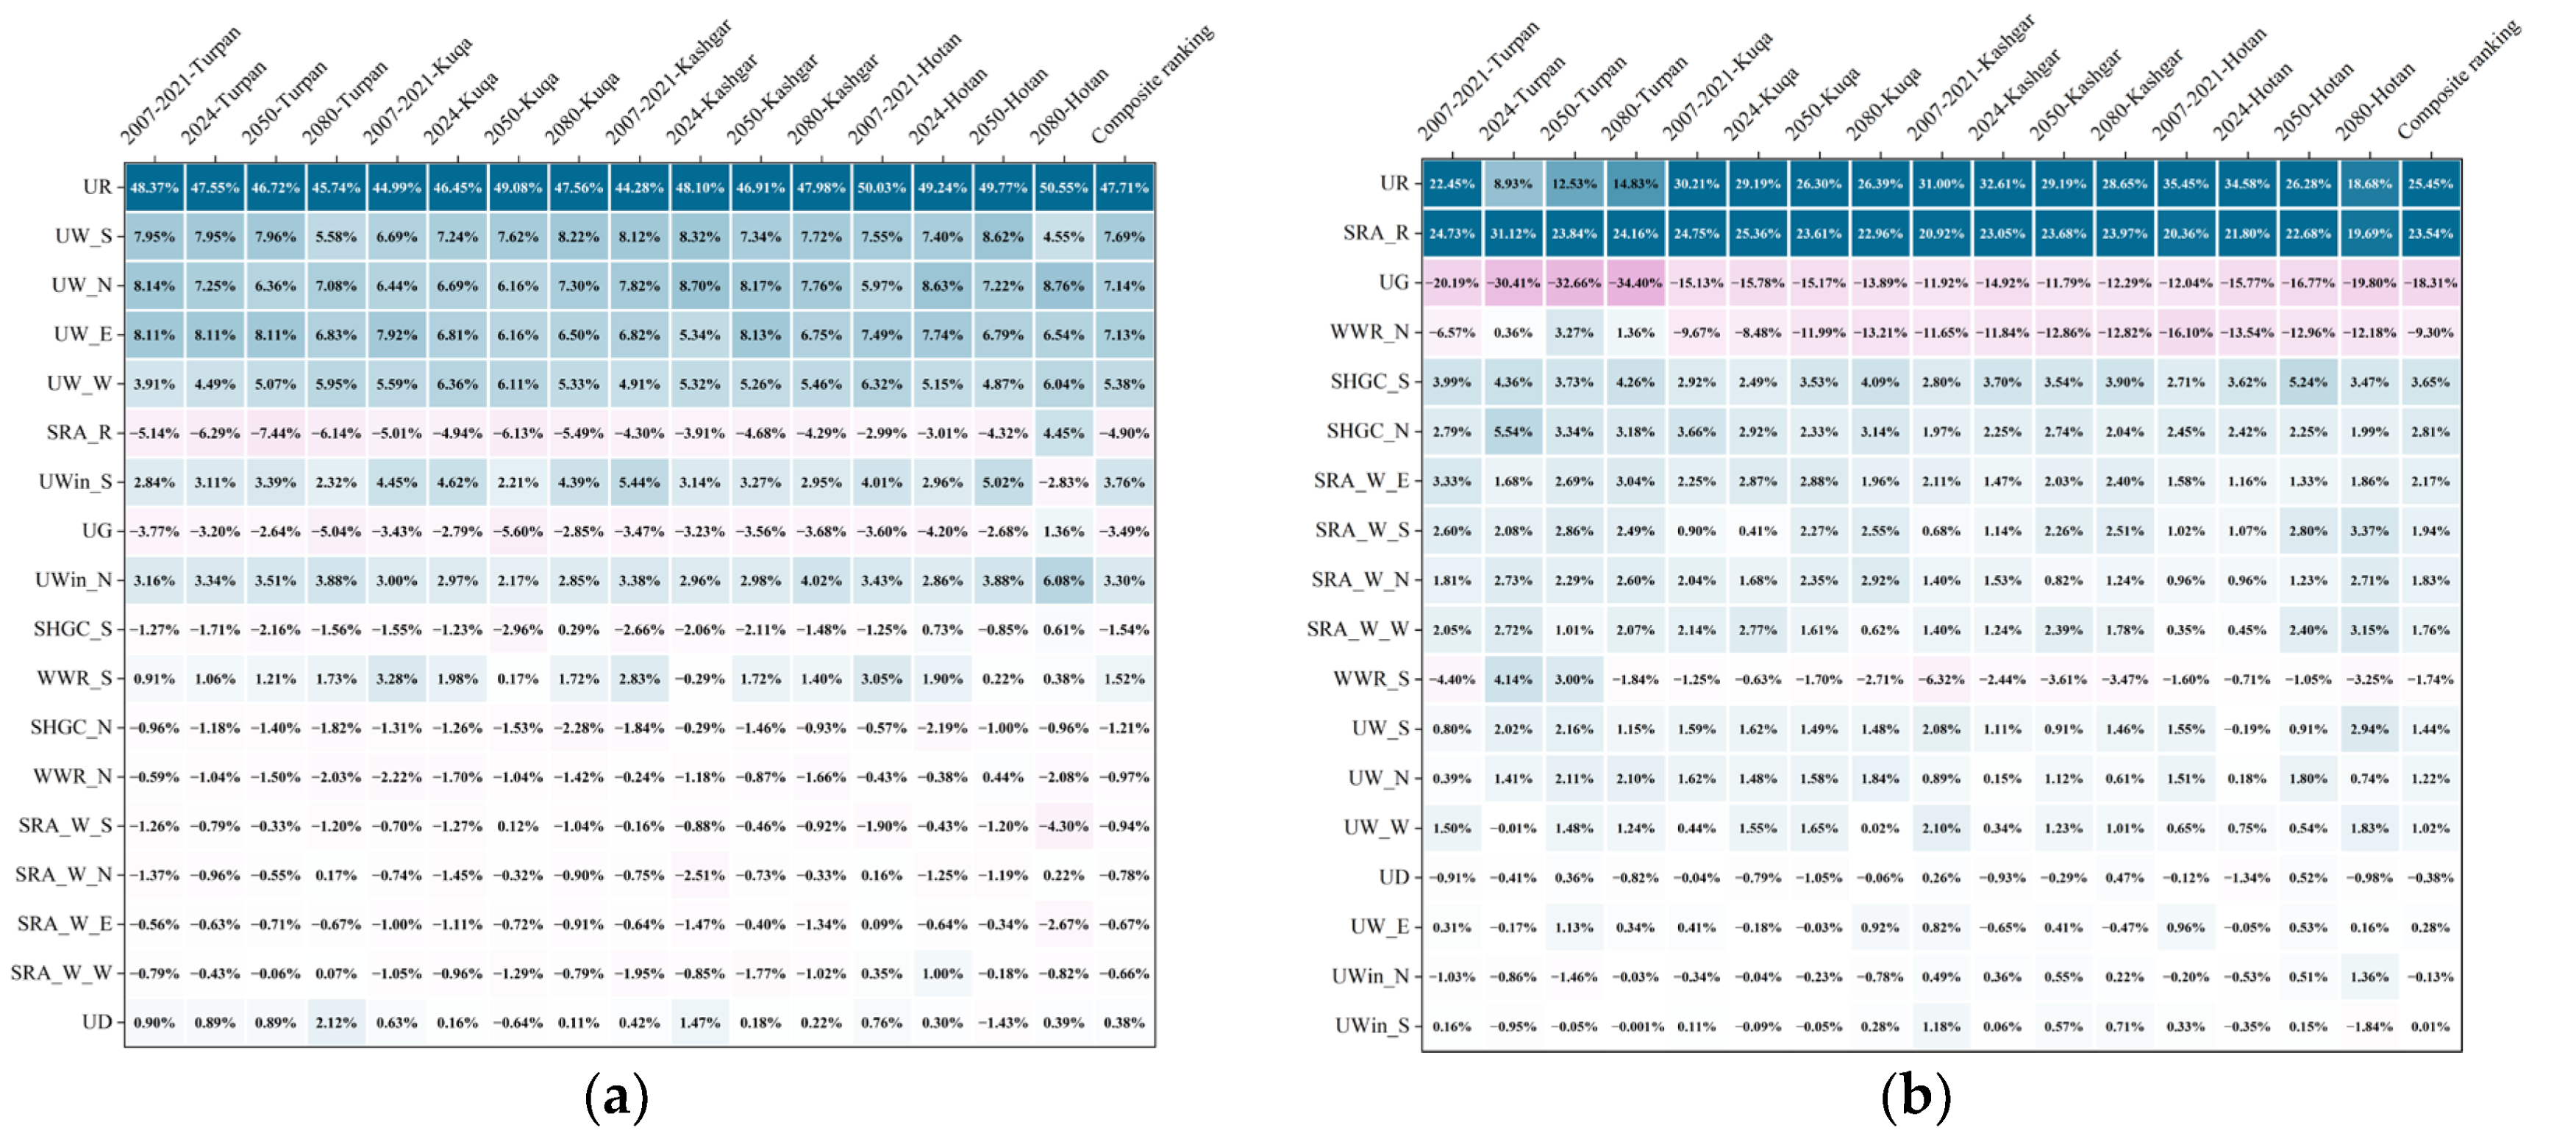
3.3.1. Sensitivity Analysis Results
3.3.2. Optimization Results
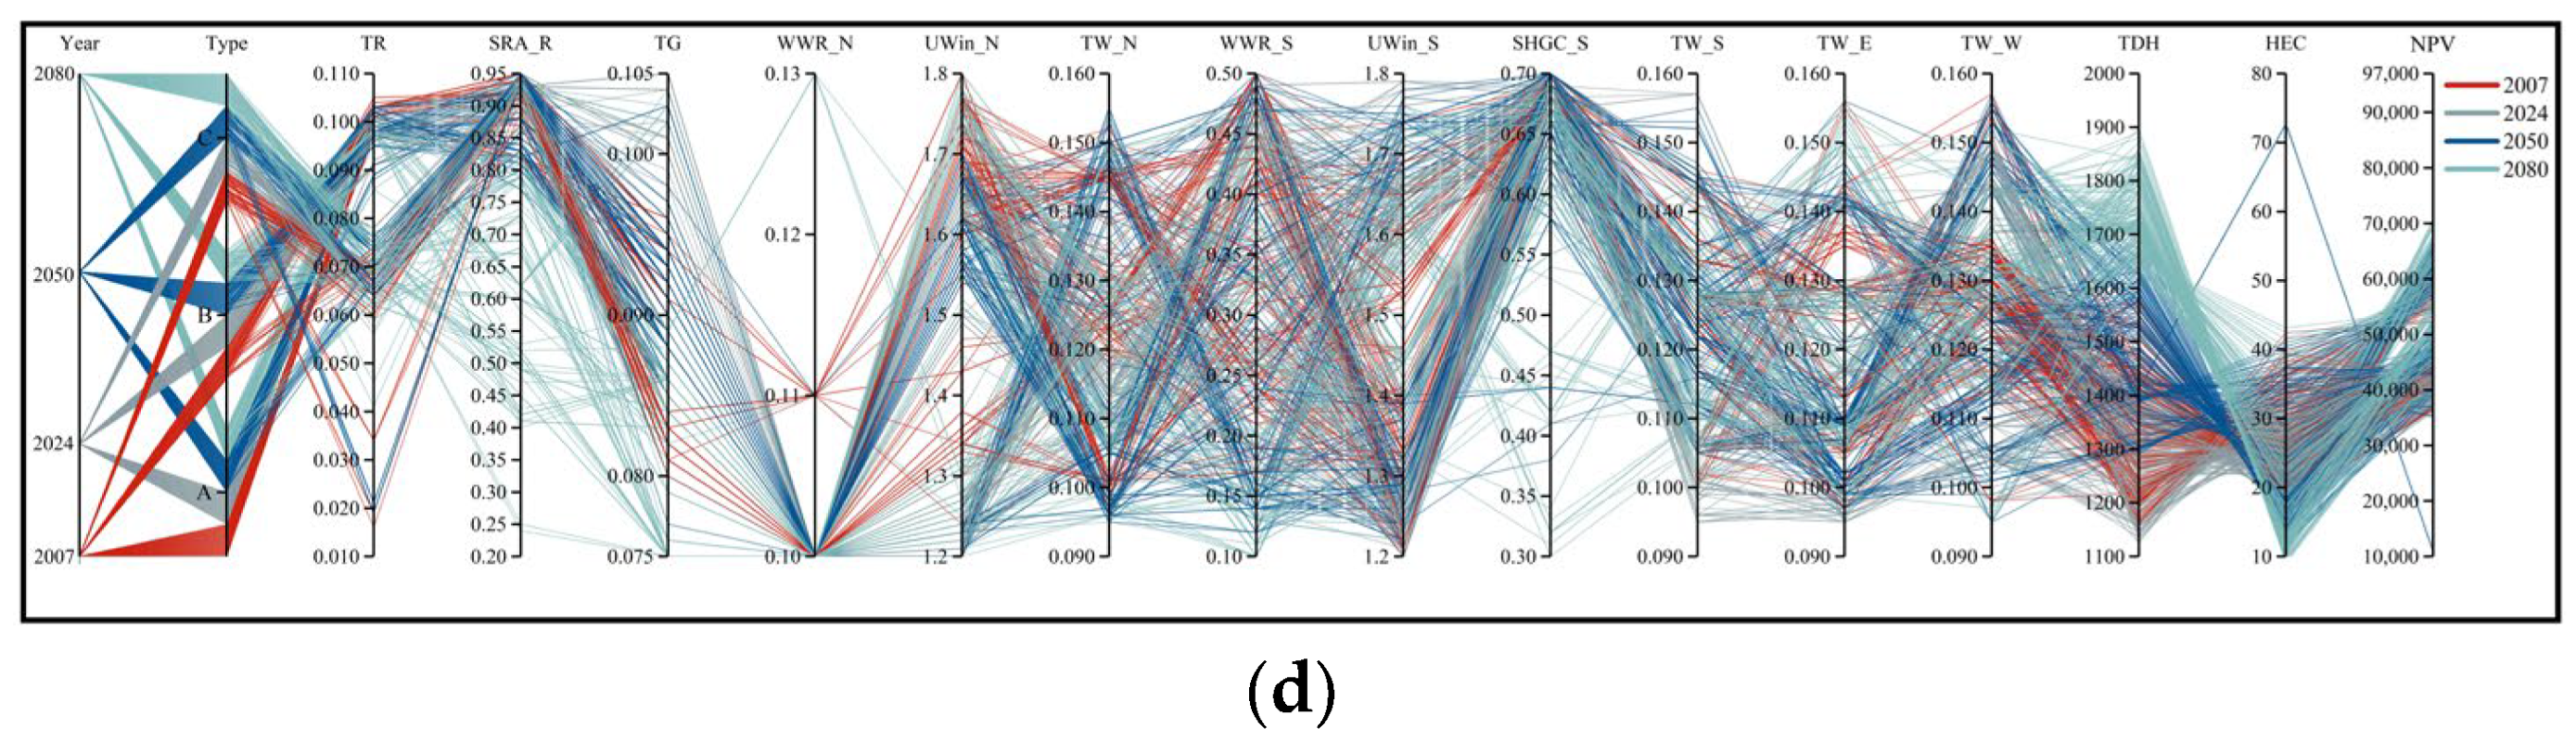
3.3.3. Optimal Solution for TDH
3.3.4. Optimal Solution for HEC
3.3.5. Optimal Solution for NPV
3.3.6. Evaluation Results of the Entropy-Weighted TOPSIS Method
4. Discussion
4.1. Strategies and Policy Proposal for Improving Climate Adaptability
4.2. Sensitivity Analysis Discussion
4.3. Pareto-Optimal Solution Set Based on the Dual Entropy-Weighted TOPSIS Method
- The optimized exterior envelope parameters of regional folk houses’ optimal equilibrium solutions under 2050/2080 climate scenarios were simulated in the 2024 observational meteorological year model to quantify HEC, TDH, and NPV.
- Then, both parameter sets’ triple-indicator outputs were evaluated against 2024 baseline data using entropy-weighted TOPSIS, measuring Euclidean distances to positive and negative ideal solutions.
- The relative closeness of the two solutions were calculated under the 2024 observational meteorological year scenario to obtain an optimized parameter for the exterior envelope structure with long-term climatic adaptability.
4.4. Decision Support Framework
4.4.1. Step 1: Objective Prioritization
4.4.2. Step 2: Climate Scenario Adaptation
4.5. Global Comparative Insights and Socioeconomic Implications
4.6. Limitations and Future Research Directions
4.6.1. Limitations
4.6.2. Future Research Directions
- Dynamic climate scenario analysis: Incorporating SSP1–2.6 (low-emission pathway) and SSP5–8.5 (high-emission pathway) scenarios would clarify how policy interventions (e.g., carbon taxation) influence building performance. This could inform adaptive design standards under varying decarbonization trajectories.
- Socio-cultural acceptance: Field surveys and participatory workshops are needed to assess residents’ preferences for retrofitting strategies. For example, replacing traditional rammed earth walls with modern insulation may face resistance due to cultural attachment. A socio-technical approach could balance innovation and heritage preservation.
- Cross-regional benchmarking: Comparative studies with other arid zones (e.g., the Atacama Desert or the Arabian Peninsula) would validate the universality of the proposed framework and identify region-specific optimization priorities.
5. Conclusions
- Climate adaptability of folk houses: Rammed earth dwellings demonstrate optimal climate adaptability in most Xinjiang arid regions. Brick–concrete structures exhibit superior summer performance in extreme hot-arid zones, while brick–wood constructions require prioritized optimization due to their poorest performance.
- Algorithm optimization effectiveness: The NSGA-II algorithm achieves efficient multi-objective optimization. Under historical-to-future climate scenarios, heating energy consumption (HEC) decreases by 76.5–90.2%, thermal discomfort hours (TDHs) reduce by 5.6–53.7% in most regions and by 5.6–22.7% in extreme hot-arid zones, and net present values (NPVs) reach CNY 40,000–97,000.
- Decision-making analysis: Solutions selected through the dual entropy-weighted TOPSIS method demonstrate 30–60 years of climate resilience. Optimized solutions achieve 51.5–84.8% HEC reduction and 15–52.9% TDH reduction while ensuring economic feasibility, providing differentiated strategies for Xinjiang’s sub-regions.
- Policy recommendations: Current standards neglect summer overheating protection and should be revised to incorporate “dual-season adaptability” requirements. Mandatory shading, night ventilation, and high thermal mass strategies could improve summer thermal comfort by 36% in Kashgar.
- Sensitivity analysis: Roof and ground thermal parameters (UR, SRA_R, and UG) dominate energy–comfort tradeoffs. Window properties (SHGC and WWR) significantly regulate TDH.
Author Contributions
Funding
Data Availability Statement
Acknowledgments
Conflicts of Interest
Abbreviations
| TMY | Typical Meteorological Year |
| TDH | Thermal discomfort hour |
| HEC | Heating energy consumption |
| NPV | Net present value |
| IPCC | The Inter-36 Governmental Panel on Climate Change |
| UR | U-value of the roof |
| SRA_R | Outer surface solar radiation absorption coefficient of the roof |
| UW_N | U-value of the north-facing wall |
| UW_S | U-value of the south-facing wall |
| UW_E | U-value of the east-facing wall |
| UW_W | U-value of the west-facing wall |
| SRA_W_N | Outer surface solar radiation absorption coefficient of the north-facing wall |
| SRA_W_S | Outer surface solar radiation absorption coefficient of the south-facing wall |
| SRA_W_E | Outer surface solar radiation absorption coefficient of the east-facing wall |
| SRA_W_W | Outer surface solar radiation absorption coefficient of the west-facing wall |
| UWin_N | U-value of the north-facing window |
| UWin_S | U-value of the south-facing window |
| WWR_N | North-facing window-to-wall ratio |
| WWR_S | South-facing window-to-wall ratio |
| SHGC_N | SHGC of north-facing window |
| SHGC_S | SHGC of south-facing window |
| UD | U-value of the external door |
| UG | U-value of the ground |
| TR | Thickness of the roof insulation layer |
| TW_N | Thickness of the north-facing wall insulation layer |
| TW_S | Thickness of the south-facing wall insulation layer |
| TW_E | Thickness of the east-facing wall insulation layer |
| TW_W | Thickness of we-facing wall insulation layer |
| TG | Thickness of the ground insulation layer |
Appendix A

| Algorithm | Applicable Objectives | Computational Efficiency | Diversity Maintenance | Parameter Sensitivity | Limitations |
|---|---|---|---|---|---|
| GA | Single or multiple custom objectives | Medium | Low | Medium | High computational cost, limited optimization ability for multi-objective problems |
| PSO | Simple single or multiple objectives | High | Medium | Low | Easily falls into the local optimum |
| MOACO | Discrete multiple objectives | Low | High | High | Low computational efficiency, sensitive parameters |
| NSGA-II | 2–3 conflicting objectives | High | High | Medium | High-dimensional target performance degradation |
| NSGA-III | ≥3 high-dimensional objectives | Medium | High | High | Three objective efficiency degradation |
| MOEA/D | Decomposable multi-objective (≥2) | Medium | Medium | High | Heavy-weight vector design |
| Equation | Explanation | Source |
|---|---|---|
| Where Y is the cost per unit area of the window (CNY/m2), U is the U-value of the window (W/(m2·K)), and g is SHGC. | The window cost equation was developed by Liu Zongjiang et al. [72]. |
| Region | Year | Type-Indv | TDH/h | HEC/kW·h/(m2·a) | NPV/CNY |
|---|---|---|---|---|---|
| Kashgar | 2050 | A-33 | 1142 | 58.717 | 35,714 |
| 2050 | B-2 | 1099 | 57.15 | 65,048 | |
| 2080 | C-7 | 1088 | 52.127 | 53,430 | |
| Turpan | 2080 | A-3 | 2798 | 56.044 | 37,887 |
| 2080 | B-4 | 2907 | 25.487 | 79,709 | |
| 2050 | C-10 | 2820 | 33.691 | 52,730 | |
| Kuqa | 2050 | A-17 | 1228 | 69.041 | 44,131 |
| 2050 | B-3 | 1200 | 73.005 | 69,509 | |
| 2080 | C-2 | 1155 | 72.913 | 51,023 | |
| Hotan | 2080 | A-2 | 1264 | 51.435 | 38,264 |
| 2080 | B-5 | 1281 | 62.404 | 39,677 | |
| 2080 | C-10 | 1228 | 48.578 | 31,340 |
References
- Core Writing Team. Climate Change 2014: Synthesis Report. Contribution of Working Groups I, II and III to the Fifth Assessment Report of the Intergovernmental Panel on Climate Change; IPCC: Geneva, Switzerland, 2014; p. 151. [Google Scholar]
- Stocker, T.F.; Qin, D.; Plattner, G.-K.; Tignor, M.; Allen, S.K.; Boschung, J.; Nauels, A.; Xia, Y.; Bex, V.; Midgley, P.M. Assessment Report 5: Summary for Policymakers; Cambridge University Press: Cambridge, UK; New York, NY, USA, 2018. [Google Scholar]
- Perkins, S.E. A review on the scientific understanding of heatwaves—Their measurement, driving mechanisms, and changes at the global scale. Atmos. Res. 2015, 164–165, 242–267. [Google Scholar] [CrossRef]
- Armstrong, B.G.; Chalabi, Z.; Fenn, B.; Hajat, S.; Kovats, S.; Milojevic, A.; Wilkinson, P. Association of mortality with high temperatures in a temperate climate: England and Wales. J. Epidemiol. Community Health 2011, 65, 340. [Google Scholar] [CrossRef] [PubMed]
- Lan, L.; Wargocki, P.; Lian, Z. Quantitative measurement of productivity loss due to thermal discomfort. Energy Build. 2011, 43, 1057–1062. [Google Scholar] [CrossRef]
- Dai, A.; Trenberth, K.E.; Qian, T. A Global Dataset of Palmer Drought Severity Index for 1870–2002: Relationship with Soil Moisture and Effects of Surface Warming. J. Hydrometeorol. 2004, 5, 1117–1130. [Google Scholar] [CrossRef]
- Ailaitijiang, K.-P.-L.-B.-Y.; Halike, S.-E.-J. Green Building Design in Arid Area Based on Oasis Environment. J. Build. Energy Effic. 2022, 50, 1–7. [Google Scholar]
- Tuluxun, N.-R.-M.-M.-T.; Halike, S.-E.-J. Energy Conservation and Low Carbon Strategies for Oasis Residential Buildings in the Arid Areas of Eastern Xinjiang Based on Climate Adaptability: Taking Bostan Village in Hami City as an Examplet. J. Build. Energy Effic. 2025, 1–12. [Google Scholar]
- Khalili, M.; Amindeldar, S. Traditional solutions in low energy buildings of hot-arid regions of Iran. Sustain. Cities Soc. 2014, 13, 171–181. [Google Scholar] [CrossRef]
- Saljoughinejad, S.; Rashidi Sharifabad, S. Classification of climatic strategies, used in Iranian vernacular residences based on spatial constituent elements. Build. Environ. 2015, 92, 475–493. [Google Scholar] [CrossRef]
- Soleymanpour, R.; Parsaee, N.; Banaei, M. Climate Comfort Comparison of Vernacular and Contemporary Houses of Iran. Procedia Soc. Behav. Sci. 2015, 201, 49–61. [Google Scholar] [CrossRef]
- Nasrollahi, N.; Hatami, M.; Khastar, S.R.; Taleghani, M. Numerical evaluation of thermal comfort in traditional courtyards to develop new microclimate design in a hot and dry climate. Sustain. Cities Soc. 2017, 35, 449–467. [Google Scholar] [CrossRef]
- Alalouch, C.; Al-Saadi, S.; AlWaer, H.; Al-Khaled, K. Energy saving potential for residential buildings in hot climates: The case of Oman. Sustain. Cities Soc. 2019, 46, 101442. [Google Scholar] [CrossRef]
- Bekleyen, A.; Melikoğlu, Y. An investigation on the thermal effects of windcatchers. J. Build. Eng. 2021, 34, 101942. [Google Scholar] [CrossRef]
- Gülmüş, S.; Alaçam, S.; Güzelci, O.Z. Harran earthen houses as a precedent for environmental comfort. J. Cult. Herit. Manag. Sustain. Dev. 2024. ahead-of-print. [Google Scholar] [CrossRef]
- Nasouri, M.; Delgarm, N. Efficiency-based Pareto Optimization of Building Energy Consumption and Thermal Comfort: A Case Study of a Residential Building in Bushehr, Iran. J. Therm. Sci. 2024, 33, 1037–1054. [Google Scholar] [CrossRef]
- Dabaieh, M.; Wanas, O.; Hegazy, M.A.; Johansson, E. Reducing cooling demands in a hot dry climate: A simulation study for non-insulated passive cool roof thermal performance in residential buildings. Energy Build. 2015, 89, 142–152. [Google Scholar] [CrossRef]
- Hebbal, B.; Marif, Y.; Hamdani, M.; Belhadj, M.M.; Bouguettaia, H.; Bechki, D. The geothermal potential of underground buildings in hot climates: Case of Southern Algeria. Case Stud. Therm. Eng. 2021, 28, 101422. [Google Scholar] [CrossRef]
- Khechiba, A.; Djaghrouri, D.; Benabbas, M.; Leccese, F.; Rocca, M.; Salvadori, G. Balancing Thermal Comfort and Energy Consumption in Residential Buildings of Desert Areas: Impact of Passive Strategies. Sustainability 2023, 15, 8383. [Google Scholar] [CrossRef]
- Yan, H.; Yang, L.; Zheng, W.; He, W.; Li, D. Analysis of behaviour patterns and thermal responses to a hot–arid climate in rural China. J. Therm. Biol. 2016, 59, 92–102. [Google Scholar] [CrossRef]
- Yang, L.; Fu, R.; He, W.; He, Q.; Liu, Y. Adaptive thermal comfort and climate responsive building design strategies in dry–hot and dry–cold areas: Case study in Turpan, China. Energy Build. 2020, 209, 109678. [Google Scholar] [CrossRef]
- Chang, S.; He, W.; Yan, H.; Yang, L.; Song, C. Influences of vernacular building spaces on human thermal comfort in China’s arid climate areas. Energy Build. 2021, 244, 110978. [Google Scholar] [CrossRef]
- Song, J.; Wang, W.; Ni, P.; Zheng, H.; Zhang, Z.; Zhou, Y. Framework on low-carbon retrofit of rural residential buildings in arid areas of northwest China: A case study of Turpan residential buildings. Build. Simul. 2023, 16, 279–297. [Google Scholar] [CrossRef]
- He, W.; Wu, Z.; Jin, R.; Liu, J. Organization and evolution of climate responsive strategies, used in Turpan vernacular buildings in arid region of China. Front. Archit. Res. 2023, 12, 556–574. [Google Scholar] [CrossRef]
- Gou, W.; Saierjiang, H.; Shang, J.; Yang, M.; Zhang, T. Multi-Objective Optimization Design of Traditional Soil Dwelling Renovation Based on Analytic Hierarchy Process—Quality Function Deployment—Non-Dominated Sorting Genetic Algorithm II: Case Study in Tuyugou Village in Turpan, Xinjiang. Buildings 2024, 14, 3584. [Google Scholar] [CrossRef]
- Bekkouche, S.M.A.; Benouaz, T.; Yaiche, M.R.; Cherier, M.K.; Hamdani, M.; Chellali, F. Introduction to control of solar gain and internal temperatures by thermal insulation, proper orientation and eaves. Energy Build. 2011, 43, 2414–2421. [Google Scholar] [CrossRef]
- Al-Saadi, S.N.; Al-Jabri, K.S. Optimization of envelope design for housing in hot climates using a genetic algorithm (GA) computational approach. J. Build. Eng. 2020, 32, 101712. [Google Scholar] [CrossRef]
- Delgarm, N.; Sajadi, B.; Kowsary, F.; Delgarm, S. Multi-objective optimization of the building energy performance: A simulation-based approach by means of particle swarm optimization (PSO). Appl. Energy 2016, 170, 293–303. [Google Scholar] [CrossRef]
- Yang, L.; Hao, T.; Liu, Y.; Yuan, W.-Q.; Liu, J.-P. Dry and Hot Climate Adaption Prototype of Traditional Dwellings. J. Build. Energy Effic. 2021, 49, 105–115. [Google Scholar]
- Wen, H.-P.; Tang, L.-H.; Liu, J.; Li, J.-X. P Sampling Survey and Preliminary Analysis on Civilian Residence in Xinjiang. Inland Earthq. 2016, 30, 293–305. [Google Scholar] [CrossRef]
- Wen, H.-P.; Tang, L.-H.; Li, S.; Chang, X.-D. Preliminary Analysis of Urban Architecture Characteristics and Earthquake Damage Risk in Xinjiang. Inland Earthq. 2021, 35, 14–21. [Google Scholar] [CrossRef]
- Halike, S.-E.-J. Description of Ecological Adaptability of Traditional Houses of Xinjang, 1st ed.; Tongji University Press: Shanghai, China, 2022; p. 275. [Google Scholar]
- Jentsch, M.F.; James, P.A.B.; Bourikas, L.; Bahaj, A.S. Transforming existing weather data for worldwide locations to enable energy and building performance simulation under future climates. Renew. Energy 2013, 55, 514–524. [Google Scholar] [CrossRef]
- Dickinson, R.; Brannon, B. Generating future weather files for resilience. In Proceedings of the 36th International Conference on Passive and Low Energy Architecture, Los Angeles, CA, USA, 11–13 July 2016. [Google Scholar]
- Rodrigues, E.; Fernandes, M.S.; Carvalho, D. Future weather generator for building performance research: An open-source morphing tool and an application. Build. Environ. 2023, 233, 110104. [Google Scholar] [CrossRef]
- Rodrigues, E.; Fereidani, N.A.; Fernandes, M.S.; Gaspar, A.R. Climate change and ideal thermal transmittance of residential buildings in Iran. J. Build. Eng. 2023, 74, 106919. [Google Scholar] [CrossRef]
- Baba, F.M.; Haj Hussein, M.; Saleh, S.; Baba, M.; Awad, J. Mitigating undercooling and overheating risk in existing desert schools under current and future climate using validated building simulation model. Build. Environ. 2023, 245, 110871. [Google Scholar] [CrossRef]
- Deng, Z.; Javanroodi, K.; Nik, V.M.; Chen, Y. Using urban building energy modeling to quantify the energy performance of residential buildings under climate change. Build. Simul. 2023, 16, 1629–1643. [Google Scholar] [CrossRef] [PubMed]
- Meinshausen, M.; Nicholls, Z.R.J.; Lewis, J.; Gidden, M.J.; Vogel, E.; Freund, M.; Beyerle, U.; Gessner, C.; Nauels, A.; Bauer, N.; et al. The shared socio-economic pathway (SSP) greenhouse gas concentrations and their extensions to 2500. Geosci. Model Dev. 2020, 13, 3571–3605. [Google Scholar] [CrossRef]
- GB 50176-2016; Code for thermal design of civil building. Ministry of Housing and Urban-Rural Development of the People’s Republic of China: Beijing, China, 2016.
- GB 55015-2021; General code for energy efficiency and renewable energy application in buildings. Ministry of Housing and Urban-Rural Development of the People’s Republic of China: Beijing, China, 2021.
- ANSI/ASHRAE55-2023; Thermal Environmental Conditions for Human Occupancy. American Society of Heating, Refrigerating and Air Conditioning Engineers, Inc.: Atlanta, GA, USA, 2023.
- Milne, M.; Liggett, R.; Alshaali, R. A New Design Tool for Visualizing the Energy Implications of California’s Climates; UC Berkeley, University of California Energy Institute: Berkeley, CA, USA, 2007; Available online: https://escholarship.org/uc/item/37z0q55p (accessed on 9 April 2007).
- Li, C.; Li, S.; Shi, L.; Zhao, Y.; Zhang, S.; Wang, S. A compass-based hyper-heuristic for multi-objective optimization problems. Swarm Evol. Comput. 2024, 87, 101530. [Google Scholar] [CrossRef]
- Si, B.; Wang, J.; Yao, X.; Shi, X.; Jin, X.; Zhou, X. Multi-objective optimization design of a complex building based on an artificial neural network and performance evaluation of algorithms. Adv. Eng. Inform. 2019, 40, 93–109. [Google Scholar] [CrossRef]
- Hamdy, M.; Nguyen, A.-T.; Hensen, J.L.M. A performance comparison of multi-objective optimization algorithms for solving nearly-zero-energy-building design problems. Energy Build. 2016, 121, 57–71. [Google Scholar] [CrossRef]
- Deb, K.; Agrawal, S.; Pratap, A.; Meyarivan, T. A Fast Elitist Non-dominated Sorting Genetic Algorithm for Multi-objective Optimization: NSGA-II. In Proceedings of the Parallel Problem Solving from Nature PPSN VI, Paris, France, 18–20 September 2000. [Google Scholar]
- Yao, G.; Li, R.; Yang, Y. An Improved Multi-Objective Optimization and Decision-Making Method on Construction Sites Layout of Prefabricated Buildings. Sustainability 2023, 15, 6279. [Google Scholar] [CrossRef]
- Chaturvedi, S.; Rajasekar, E.; Natarajan, S. Multi-objective Building Design Optimization under Operational Uncertainties Using the NSGA II Algorithm. Buildings 2020, 10, 88. [Google Scholar] [CrossRef]
- Si, B.; Liu, F.; Li, Y. Metamodel-Based Hyperparameter Optimization of Optimization Algorithms in Building Energy Optimization. Buildings 2023, 13, 167. [Google Scholar] [CrossRef]
- Harkouss, F.; Fardoun, F.; Biwole, P.H. Multi-objective optimization methodology for net zero energy buildings. J. Build. Eng. 2018, 16, 57–71. [Google Scholar] [CrossRef]
- Ghaderian, M.; Veysi, F. Multi-objective optimization of energy efficiency and thermal comfort in an existing office building using NSGA-II with fitness approximation: A case study. J. Build. Eng. 2021, 41, 102440. [Google Scholar] [CrossRef]
- Abdou, N.; El Mghouchi, Y.; Hamdaoui, S.; El Asri, N.; Mouqallid, M. Multi-objective optimization of passive energy efficiency measures for net-zero energy building in Morocco. Build. Environ. 2021, 204, 108141. [Google Scholar] [CrossRef]
- Gupta, S.K.; Chanda, P.R.; Biswas, A. A 2E, energy and environment performance of an optimized vernacular house for passive cooling—Case of North-East India. Build. Environ. 2023, 229, 109909. [Google Scholar] [CrossRef]
- Benincá, L.; Crespo Sánchez, E.; Passuello, A.; Karini Leitzke, R.; Grala da Cunha, E.; Maria González Barroso, J. Multi-objective optimization of the solar orientation of two residential multifamily buildings in south Brazil. Energy Build. 2023, 285, 112838. [Google Scholar] [CrossRef]
- Terés-Zubiaga, J.; Campos-Celador, A.; González-Pino, I.; Escudero-Revilla, C. Energy and economic assessment of the envelope retrofitting in residential buildings in Northern Spain. Energy Build. 2015, 86, 194–202. [Google Scholar] [CrossRef]
- Li, Z.; Shi, X.; Tian, M. Research on Climate Responsive Optimisation Design of Residential Buildings. South Archit. 2022, 4, 8–16. [Google Scholar]
- Breesch, H.; Janssens, A. Performance evaluation of passive cooling in office buildings based on uncertainty and sensitivity analysis. Sol. Energy 2010, 84, 1453–1467. [Google Scholar] [CrossRef]
- Tian, W. A review of sensitivity analysis methods in building energy analysis. Renew. Sustain. Energy Rev. 2013, 20, 411–419. [Google Scholar] [CrossRef]
- Pang, Z.; O’Neill, Z.; Li, Y.; Niu, F. The role of sensitivity analysis in the building performance analysis: A critical review. Energy Build. 2020, 209, 109659. [Google Scholar] [CrossRef]
- Borgonovo, E.; Plischke, E. Sensitivity analysis: A review of recent advances. Eur. J. Oper. Res. 2016, 248, 869–887. [Google Scholar] [CrossRef]
- Domínguez-Muñoz, F.; Cejudo-López, J.M.; Carrillo-Andrés, A. Uncertainty in peak cooling load calculations. Energy Build. 2010, 42, 1010–1018. [Google Scholar] [CrossRef]
- Ding, S.; Li, R.; Guo, J. An entropy-based TOPSIS and optimized grey prediction model for spatiotemporal analysis in strategic emerging industry. Expert Syst. Appl. 2023, 213, 119169. [Google Scholar] [CrossRef]
- Güzelci, O.Z.; Şener, S.M. An Entropy-Based Design Evaluation Model for Architectural Competitions through Multiple Factors. Entropy 2019, 213, 119169. [Google Scholar] [CrossRef]
- Nayak, P.P.; Datta, A.K. An entropy-based TOPSIS approach for selecting best suitable rice husk for potential energy applications: Pyrolysis kinetics and characterization of rice husk and rice husk ash. Biomass Convers. Biorefinery 2022, 2022, 25. [Google Scholar] [CrossRef]
- Sun, J.; Miao, J.; Mu, H.; Xu, J.; Zhai, N. Sustainable development in marine economy: Assessing carrying capacity of Shandong province in China. Ocean Coast. Manag. 2022, 216, 105981. [Google Scholar] [CrossRef]
- Xu, X.; Zhang, Z.; Long, T.; Sun, S.; Gao, J. Mega-city region sustainability assessment and obstacles identification with GIS–entropy–TOPSIS model: A case in Yangtze River Delta urban agglomeration, China. J. Clean. Prod. 2021, 294, 126147. [Google Scholar] [CrossRef]
- Yuan, X.; Song, W. Evaluating technology innovation capabilities of companies based on entropy- TOPSIS: The case of solar cell companies. Inf. Technol. Manag. 2022, 23, 65–76. [Google Scholar] [CrossRef]
- Schünemann, C.; Schiela, D.; Ortlepp, R. How window ventilation behaviour affects the heat resilience in multi-residential buildings. Build. Environ. 2021, 202, 107987. [Google Scholar] [CrossRef]
- XJJ 001-2021; Design standard for energy efficiency of residential buildings in severe cold and cold zones. Department of Housing and Urban-Rural Development of the Xinjiang Uygur Autonomous Region: Urumqi, China, 2021.
- Song, B.; Yang, L. Analysis of Influence Factors and Economic Efficiency of Energy Consumption of Rural Dwellings in Cold Regions. Build. Sci. 2020, 36, 33–38. [Google Scholar]
- Liu, Z.-J.; Xu, W.; Sun, D.-Y.; Wang, B.-L. Study on Building Energy Efficiency Target Based on SIR Method. Build. Sci. 2013, 29, 70–76. [Google Scholar] [CrossRef]


| Research Subject | Climate Data Types | Study Areas (Region: Country-City) |
|---|---|---|
| Traditional folk houses | TMY climate data | West Asia: Turkey—Şanlıurfa [15] |
| China—Turpan [24,25] | ||
| Observed climate data | North Africa: Algeria—Ghardaïa [26] | |
| West Asia: Iran—multiple cities [9], Iran—multiple cities [10], Iran—Shiraz [12], Turkey—Şanlıurfa [14] | ||
| China-Turpan [20,21,22] | ||
| Modern folk houses | TMY climate data | North Africa: Algeria—Ouargla [17], Egypt—Cairo [18] |
| West Asia: Oman—multiple cities [13], Iran—Bushehr [16], Oman—multiple cities [27], Iran—multiple cities [28] | ||
| China—Turpan [23] | ||
| Traditional folk houses vs. modern folk houses | Observed climate data | North Africa: Algeria—Ouargla [19] |
| West Asia: Iran—multiple cities [11] |
| Architectural Typology | Typical Plan Layout | Building Envelope Components | Construction Component Name |
|---|---|---|---|
| Pixiayiwan-style | 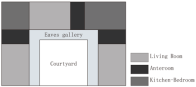 | Roof | Wooden truss with dense beam flat roof |
| Reinforced concrete roof | |||
| High trellis-style |  | Wall | Rammed earth wall |
| Solid clay brick wall | |||
| Perforated clay brick wall | |||
| Ayiwan-style | 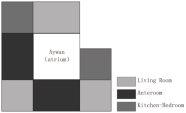 | Window | Wooden-framed glass window |
| Aluminum–plastic composite window | |||
| Hybrid-style | - | Ground | Clay brick ground |
| Cement ground |
| Type | Envelope Components | Construction Component Name | Construction Details (from Exterior to Interior) | U-Values (W/m2·K) |
|---|---|---|---|---|
| Type A (rammed earth folk houses) | Roof | Wooden truss with dense beam flat roof | 200 mm wheat straw–clay plaster + 100 mm reed–straw layer + Φ80 mm semicircular log battens | 0.352 |
| Wall | Rammed earth wall | 20 mm wheat straw–clay plaster + 500 mm adobe brick wall + 20 mm wheat straw–clay plaster | 1.14 | |
| Window | Wooden-framed glass window | Single-pane glass | 4.53 | |
| Door | Wooden door | - | 2.15 | |
| Ground | Clay brick ground | compacted plain soil layer + 60 mm solid bricks | 1.44 | |
| Type B (brick–wood folk houses) | Roof | Wooden truss with Dense beam flat roof | 200 mm wheat straw-clay plaster + 100 mm reed-straw layer + Φ80 mm semicircular log battens | 0.352 |
| Wall | Solid clay brick wall | 20 mm cement mortar + 370 mm solid bricks + 20 mm cement plaster | 1.54 | |
| Window | Wooden-framed glass window | Single-pane glass | 4.53 | |
| Door | Wooden door | - | 2.15 | |
| Ground | Clay brick ground | compacted plain soil layer + 60 mm solid bricks | 1.44 | |
| Type C (brick–concrete folk houses) | Roof | Reinforced concrete roof | 30 mm wheat straw–clay plaster + 2.5 mm polymer-modified waterproofing membrane + 30 mm C20 fine aggregate concrete + 30 mm crushed aerated concrete + 110 mm EPS insulation board + 100 mm reinforced concrete | 0.326 |
| Wall | Perforated clay brick wall | 20 mm cement mortar + 240 mm/370 mm perforated bricks + 20 mm cement plaster | 1.203 | |
| Window | Aluminum–plastic composite window | Single-pane glass | 4.4 | |
| Door | Wooden door | - | 2.15 | |
| Ground | Cement ground | compacted plain soil + 60 mm concrete leveling course + 20 mm cement mortar | 1.45 |
| Input Parameters | Type | Value | Period |
|---|---|---|---|
| Heating | Heating temperature | 18 °C | Heating season (1:00~24:00) |
| Ventilation | Ventilation air changes per hour during heating season | 0.5 ac/h | Heating season (1:00~24:00) |
| Natural ventilation in non-heating seasons | 3 ac/h | Transitional seasons (10:00~22:00) Summer (1:00~24:00) | |
| Internal gains | People | 25 m2/people | Year-round (1:00~24:00) |
| Lighting | 5 W/m2 | Year-round (1:00~24:00) | |
| Equipment | 3.8 W/m2 | Year-round (1:00~24:00) |
| Envelope Components | Sensitivity Analysis Variables | Range of Values |
|---|---|---|
| Roof | U-value (UR) | 0.2–4 W/m2·K |
| Outer surface solar radiation absorption coefficient (SRA_R) | 0–0.95 | |
| Wall | U-value of the north-facing wall (UW_N) | 0.25–2.1 W/m2·K |
| U-value of the south-facing wall (UW_S) | ||
| U-value of the east-facing wall (UW_W) | ||
| U-value of the west-facing wall (UW_E) | ||
| Outer surface solar radiation absorption coefficient of the north-facing wall (SRA_W_N) | 0–0.95 | |
| Outer surface solar radiation absorption coefficient of the south-facing wall (SRA_W_S) | ||
| Outer surface solar radiation absorption coefficient of the east-facing wall (SRA_W_E) | ||
| Outer surface solar radiation absorption coefficient of the west-facing wall (SRA_W_W) | ||
| Window | U-value of the north-facing window (UWin_N) | 1.2–4.6 W/m2·K |
| U-value of the south-facing window (UWin_S) | ||
| North-facing window-to-wall ratio (WWR_N) | 0.1–0.5 | |
| South-facing window-to-wall ratio (WWR_S) | 0.1–0.3 | |
| SHGC of north-facing window (SHGC_N) | 0.3–0.7 | |
| SHGC of south-facing window (SHGC_S) | ||
| Door | U-value (W/m2·K) | 1.5–2.5 W/m2·K |
| Ground | U-value (W/m2·K) | 0.4–2 W/m2·K |
| Optimization Variable | Optimization Strategy | The Range for Type A | The Range for Type B | The Range for Type C | Optimization Cost |
|---|---|---|---|---|---|
| SRA_R | (a) High reflectance coating. (b) Reflective coating. (c) Conventional coating. | (a) 0.1–0.25 (b) 0.25–0.65 (c) 0.65–0.95 | (a) 100 CNY/m2 (b) 50 CNY/m2 (c) 20 CNY/m2 | ||
| Thickness of roof insulation layer (TR) | (a) Wheat straw insulation layer. (b) EPS insulation layer. | 25/55–105 mm | 25/55–105 mm | 15–80 mm | (a) 380 CNY/m2 (b) 450 CNY/m2 |
| Thickness of north-facing wall insulation layer (TW_N) | 95–150 mm | 105–160 mm | 95–150 mm | ||
| Thickness of south-facing wall insulation layer (TW_S) | |||||
| Thickness of east-facing wall insulation layer (TW_E) | |||||
| Thickness of west-facing wall insulation layer (TW_W) | |||||
| Thickness of ground insulation layer (TG) | 75–105 mm | ||||
| UWin_N | New energy-saving window | 1.2–1.8 W/m2·K | For window cost, see Table A2 | ||
| UWin_S | |||||
| SHGC_S | 0.3–0.7 | ||||
| WWR_N | - | 0.1–0.3 | |||
| WWR_S | 0.1–0.5 | ||||
| Region | Year | Type-Indv | TDH/h | Type-Indv | TDH/h | Type-Indv | TDH/h |
|---|---|---|---|---|---|---|---|
| Kashgar | 2007–2021 | A-2 | 1167 | B-1 | 1211 | C-1 | 1185 |
| 2024 | A-2 | 1046 | B-1 | 1077 | C-2 | 1031 | |
| 2050 | A-4 | 1233 | B-2 | 1205 | C-4 | 1162 | |
| 2080 | A-2 | 1371 | B-4 | 1328 | C-3 | 1294 | |
| Turpan | 2007–2021 | A-3 | 2288 | B-4 | 2280 | C-1 | 2215 |
| 2024 | A-2 | 2771 | B-2 | 2751 | C-4 | 2745 | |
| 2050 | A-1 | 3259 | B-2 | 3248 | C-4 | 3234 | |
| 2080 | A-1 | 3548 | B-2 | 3522 | C-3 | 3505 | |
| Kuqa | 2007–2021 | A-4 | 1157 | B-3 | 1236 | C-1 | 1210 |
| 2024 | A-2 | 1143 | B-1 | 1155 | C-5 | 1323 | |
| 2050 | A-1 | 1389 | B-3 | 1377 | C-3 | 1328 | |
| 2080 | A-2 | 1397 | B-2 | 1428 | C-2 | 1401 | |
| Hotan | 2007–2021 | A-2 | 1214 | B-1 | 1191 | C-5 | 1147 |
| 2024 | A-2 | 1135 | B-4 | 1156 | C-5 | 1125 | |
| 2050 | A-2 | 1410 | B-1 | 1384 | C-5 | 1291 | |
| 2080 | A-4 | 1701 | B-5 | 1655 | C-2 | 1634 |
| Region | Year | Type-Indv | HEC/kW·h/(m2·a) | Type-Indv | HEC/kW·h/(m2·a) | Type-Indv | HEC/kW·h/(m2·a) |
|---|---|---|---|---|---|---|---|
| Kashgar | 2007–2021 | A-4 | 23.321 | B-3 | 25.395 | C-3 | 26.916 |
| 2024 | A-1 | 19.91 | B-2 | 22.261 | C-3 | 22.307 | |
| 2050 | A-2 | 13.781 | B-1 | 16.638 | C-5 | 15.532 | |
| 2080 | A-3 | 10.877 | B-3 | 12.582 | C-5 | 11.522 | |
| Turpan | 2007–2021 | A-2 | 27.607 | B-2 | 29.266 | C-2 | 32.539 |
| 2024 | A-1 | 23.551 | B-1 | 25.672 | C-1 | 28.345 | |
| 2050 | A-4 | 19.035 | B-1 | 21.155 | C-2 | 20.694 | |
| 2080 | A-2 | 15.486 | B-4 | 16.039 | C-4 | 16.638 | |
| Kuqa | 2007–2021 | A-2 | 30.972 | B-2 | 32.032 | C-2 | 34.198 |
| 2024 | A-3 | 27.976 | B-3 | 32.17 | C-4 | 20.924 | |
| 2050 | A-6 | 22.445 | B-1 | 24.934 | C-1 | 26.593 | |
| 2080 | A-3 | 18.389 | B-3 | 19.772 | C-3 | 20.878 | |
| Hotan | 2007–2021 | A-4 | 16.592 | B-4 | 18.389 | C-3 | 19.496 |
| 2024 | A-3 | 15.947 | B-1 | 18.205 | C-4 | 19.403 | |
| 2050 | A-1 | 11.522 | B-4 | 13.596 | C-1 | 13.642 | |
| 2080 | A-1 | 9.033 | B-3 | 9.955 | C-4 | 10.14 |
| Region | Year | Type-Indv | NPV/CNY | Type-Indv | NPV/CNY | Type-Indv | NPV/CNY |
|---|---|---|---|---|---|---|---|
| Kashgar | 2007–2021 | A-1 | 50,950 | B-2 | 78,641 | C-2 | 62,141 |
| 2024 | A-3 | 53,664 | B-3 | 81,798 | C-5 | 65,669 | |
| 2050 | A-3 | 57,909 | B-3 | 85,871 | C-26 | 70,485 | |
| 2080 | A-1 | 62,287 | B-5 | 88,979 | C-1 | 74,022 | |
| Turpan | 2007–2021 | A-1 | 59,541 | B-3 | 74,751 | C-3 | 60,343 |
| 2024 | A-3 | 61,321 | B-5 | 84,110 | C-3 | 64,656 | |
| 2050 | A-3 | 66,485 | B-5 | 88,952 | C-1 | 69,061 | |
| 2080 | A-4 | 68,721 | B-1 | 91,347 | C-5 | 72,998 | |
| Kuqa | 2007–2021 | A-3 | 59,783 | B-1 | 87,144 | C-3 | 66,536 |
| 2024 | A-1 | 58,949 | B-23 | 86,373 | C-3 | 75,624 | |
| 2050 | A-2 | 64,379 | B-2 | 91,690 | C-2 | 71,787 | |
| 2080 | A-1 | 67,179 | B-4 | 96,445 | C-4 | 76,641 | |
| Hotan | 2007–2021 | A-1 | 40,779 | B-3 | 62,966 | C-1 | 46,491 |
| 2024 | A-4 | 41,552 | B-3 | 64,176 | C-2 | 47,418 | |
| 2050 | A-5 | 45,725 | B-2 | 67,097 | C-3 | 51,978 | |
| 2080 | A-3 | 49,363 | B-40 | 70,662 | C-3 | 55,951 |
| Region | Year | Type-Indv | TDH/ h | HEC/kW·h/(m2·a) | NPV/ CNY | Type-Indv | TDH/ h | HEC/kW·h/(m2·a) | NPV/CNY | Type-Indv | TDH/ h | HEC/kW·h/(m2·a) | NPV/CNY |
|---|---|---|---|---|---|---|---|---|---|---|---|---|---|
| Kashgar | 2007–2021 2024 2050 2080 | A-4 | 1447 | 23.321 | 46,560 | B-3 | 1430 | 25.395 | 74,709 | C-5 | 1289 | 33.092 | 54,626 |
| A-2 | 1046 | 65.631 | 31,488 | B-6 | 1088 | 43.6 | 74,481 | C-37 | 1440 | 22.399 | 60,830 | ||
| A-33 | 1235 | 45.536 | 43,927 | B-2 | 1205 | 44.937 | 72,658 | C-3 | 1694 | 16.5 | 66,160 | ||
| A-3 | 1741 | 10.877 | 56,862 | B-2 | 1329 | 48.854 | 72,667 | C-7 | 1300 | 34.981 | 63,764 | ||
| Turpan | 2007–2021 2024 2050 2080 | A-2 | 2553 | 27.607 | 56,765 | B-4 | 2280 | 64.248 | 57,844 | C-1 | 2215 | 64.11 | 46,179 |
| A-1 | 2934 | 23.551 | 56,779 | B-1 | 2909 | 25.672 | 79,237 | C-1 | 2853 | 28.345 | 59,229 | ||
| A-1 | 3259 | 43.416 | 51,518 | B-27 | 3317 | 23.966 | 80,637 | C-10 | 3318 | 21.155 | 62,801 | ||
| A-3 | 3549 | 39.314 | 59,142 | B-4 | 3585 | 16.039 | 85,596 | C-30 | 3507 | 45.536 | 60,530 | ||
| Kuqa | 2007–2021 2024 2050 2080 | A-4 | 1157 | 65.631 | 37,359 | B-2 | 1697 | 32.032 | 83,597 | C-1 | 1210 | 59.27 | 55,980 |
| A-3 | 1794 | 27.976 | 55,849 | B-4 | 1155 | 69.456 | 68,823 | C-4 | 1792 | 20.924 | 70,338 | ||
| A-17 | 1397 | 57.888 | 51,080 | B-3 | 1377 | 60.837 | 77,091 | C-1 | 1810 | 26.593 | 67,761 | ||
| A-19 | 1415 | 49.776 | 56,868 | B-7 | 1443 | 55.491 | 80,006 | C-2 | 1401 | 51.988 | 64,061 | ||
| Hotan | 2007–2021 2024 2050 2080 | A-3 | 1524 | 17.929 | 36,344 | B-4 | 1484 | 18.389 | 59,748 | C-8 | 1428 | 19.726 | 41,110 |
| A-6 | 1447 | 16.177 | 36,187 | B-1 | 1439 | 18.205 | 57,217 | C-18 | 1375 | 19.634 | 41,264 | ||
| A-3 | 1500 | 16.17 | 52,655 | B-3 | 1388 | 40.973 | 54,776 | C-4 | 1296 | 35.535 | 42,691 | ||
| A-2 | 1705 | 29.589 | 36,582 | B-5 | 1655 | 42.494 | 52,083 | C-10 | 1638 | 26.593 | 45,038 |
| Standards | Codes | Content | Recommendations |
|---|---|---|---|
| Code for thermal design of civil buildings (GB 50176-2016) [40] | 4.1.2 | “Cold Zone A—Should meet the thermal insulation design requirements, heat protection design need not be considered”. | Cold Zone A: Add “Should meet thermal insulation design requirements, with consideration for natural ventilation and shading design”. |
| “Cold Zone B—Should meet the thermal insulation design requirements, it is advisable to meet the heat insulation design requirements, with consideration for natural ventilation and shading design”. | Cold Zone B: “Enhance thermal insulation design requirements, prioritize natural ventilation and shading design”. | ||
| 4.3.2 | The architectural design in regions with hot summers and warm winters, as well as hot summers and cold winters, must meet the summer heat protection requirements. The architectural design in Cold Zone B should consider the summer heat protection requirements. | Cold Zone B: Revise to “Must comply with summer heat protection requirements.” Cold Zone A: Revise to “Should consider summer heat protection requirements”. | |
| 6.3.1 | The product of the solar heat gain coefficient of the transparent envelope and the summer building shading coefficient should be less than the limit values specified in the table. | Add “Limit values for the product of Solar Heat Gain Coefficient (SHGC) and Summer Shading Coefficient (SC) of transparent building envelopes in cold regions”. | |
| Xinjiang Local Standards—Design standard for energy efficiency of residential buildings in severe cold and cold zones (XJJ001-2021) [70] | 3.03 | The selection of indoor thermal environment calculation parameters should comply with the following regulations: 1. The calculated indoor heating temperature in winter should be set to 20 °C; 2. The calculated air change rate for heating in winter should be set to 0.5 h−1. | Add “Defined indoor cooling temperature calculation methods and maximum allowable summer ventilation rates (air changes per hour) for cold regions”. |
| 4.2.2 | In Cold Zone B (Zone 2B), the solar heat gain coefficient for exterior windows in summer should not exceed the limit values specified in 4.2.2 of the standard, and the solar heat gain coefficient for summer skylights should not be greater than 0.45. (No requirements for Cold Zone 2A.) | Add “Specific Solar Heat Gain Coefficient (SHGC) limits for windows in Cold Subzone 2A”. | |
| 4.2.4 | Buildings in Cold Zone B should preferably have horizontal shading installed on the south-facing windows (including the transparent parts of balconies). | Revise “Cold Zone B” to “Cold Region”. | |
| When there is building shading, the exterior windows and skylights in Cold Zone B should consider the effect of shading. | Revise “Cold Zone B” to “Cold Region”. |
| Region | Year | Type-Indv | TR /m | SRA_R | TG /m | WWR_N | UWin_N / W/m2·K | TW_N /m | WWR_S | UWin_S /W/m2·K | SHGC_S | TW_S /m | TW_E /m | TW_W /m |
|---|---|---|---|---|---|---|---|---|---|---|---|---|---|---|
| Kashgar | 2050 | A-33 | 0.099 | 0.88 | 0.077 | 0.1 | 1.32 | 0.143 | 0.11 | 1.21 | 0.52 | 0.13 | 0.109 | 0.125 |
| 2050 | B-2 | 0.104 | 0.94 | 0.096 | 0.1 | 1.23 | 0.106 | 0.12 | 1.27 | 0.69 | 0.111 | 0.141 | 0.144 | |
| 2080 | C-7 | 0.077 | 0.88 | 0.082 | 0.1 | 1.25 | 0.127 | 0.14 | 1.34 | 0.46 | 0.113 | 0.11 | 0.128 | |
| Turpan | 2080 | A-3 | 0.071 | 0.9 | 0.083 | 0.1 | 1.56 | 0.116 | 0.22 | 1.61 | 0.7 | 0.113 | 0.146 | 0.13 |
| 2080 | B-4 | 0.095 | 0.8 | 0.076 | 0.1 | 1.47 | 0.106 | 0.5 | 1.2 | 0.69 | 0.133 | 0.133 | 0.139 | |
| 2050 | C-10 | 0.076 | 0.91 | 0.082 | 0.1 | 1.24 | 0.131 | 0.5 | 1.2 | 0.7 | 0.128 | 0.144 | 0.13 | |
| Kuqa | 2050 | A-17 | 0.086 | 0.93 | 0.086 | 0.1 | 1.67 | 0.142 | 0.1 | 1.45 | 0.69 | 0.113 | 0.12 | 0.097 |
| 2050 | B-3 | 0.061 | 0.95 | 0.091 | 0.1 | 1.21 | 0.153 | 0.11 | 1.25 | 0.63 | 0.114 | 0.109 | 0.129 | |
| 2080 | C-2 | 0.073 | 0.92 | 0.09 | 0.1 | 1.24 | 0.135 | 0.1 | 1.23 | 0.69 | 0.097 | 0.137 | 0.122 | |
| Hotan | 2080 | A-2 | 0.103 | 0.62 | 0.103 | 0.1 | 1.28 | 0.121 | 0.11 | 1.44 | 0.44 | 0.144 | 0.108 | 0.137 |
| 2080 | B-5 | 0.069 | 0.49 | 0.086 | 0.1 | 1.28 | 0.149 | 0.13 | 1.33 | 0.31 | 0.109 | 0.109 | 0.143 | |
| 2080 | C-10 | 0.076 | 0.52 | 0.075 | 0.1 | 1.26 | 0.114 | 0.2 | 1.37 | 0.69 | 0.128 | 0.126 | 0.132 |
Disclaimer/Publisher’s Note: The statements, opinions and data contained in all publications are solely those of the individual author(s) and contributor(s) and not of MDPI and/or the editor(s). MDPI and/or the editor(s) disclaim responsibility for any injury to people or property resulting from any ideas, methods, instructions or products referred to in the content. |
© 2025 by the authors. Licensee MDPI, Basel, Switzerland. This article is an open access article distributed under the terms and conditions of the Creative Commons Attribution (CC BY) license (https://creativecommons.org/licenses/by/4.0/).
Share and Cite
Tuluxun, N.; Halike, S.; Liu, H.; Yelaixi, B.; Ailaitijiang, K. Climate Adaptation of Folk House Envelopes in Xinjiang Arid Region: Evaluation and Multi-Objective Optimization from Historical to Future Climates. Buildings 2025, 15, 1240. https://doi.org/10.3390/buildings15081240
Tuluxun N, Halike S, Liu H, Yelaixi B, Ailaitijiang K. Climate Adaptation of Folk House Envelopes in Xinjiang Arid Region: Evaluation and Multi-Objective Optimization from Historical to Future Climates. Buildings. 2025; 15(8):1240. https://doi.org/10.3390/buildings15081240
Chicago/Turabian StyleTuluxun, Nurimaimaiti, Saierjiang Halike, Hao Liu, Buerlan Yelaixi, and Kapulanbayi Ailaitijiang. 2025. "Climate Adaptation of Folk House Envelopes in Xinjiang Arid Region: Evaluation and Multi-Objective Optimization from Historical to Future Climates" Buildings 15, no. 8: 1240. https://doi.org/10.3390/buildings15081240
APA StyleTuluxun, N., Halike, S., Liu, H., Yelaixi, B., & Ailaitijiang, K. (2025). Climate Adaptation of Folk House Envelopes in Xinjiang Arid Region: Evaluation and Multi-Objective Optimization from Historical to Future Climates. Buildings, 15(8), 1240. https://doi.org/10.3390/buildings15081240