Article

Impact of Business Diversification on the Business Performance of Construction Firms in the Republic of Korea

1
Department of Architectural Engineering, Hanyang University, 222, Wangsipri-ro, Sungdong-gu, Seoul 04763, Republic of Korea
2
Department of Smart Convergence Engineering, Hanyang University ERICA, Ansan 15588, Republic of Korea
3
Post-Construction Evaluation and Management Center, Department of Construction Policy Research, Korea Institute of Civil Engineering and Building Technology, Goyang 10223, Republic of Korea
*
Authors to whom correspondence should be addressed.
Buildings 2025, 15(8), 1238; https://doi.org/10.3390/buildings15081238
Submission received: 5 March 2025 / Revised: 1 April 2025 / Accepted: 7 April 2025 / Published: 9 April 2025
(This article belongs to the Section Construction Management, and Computers & Digitization)

Abstract

This study examines the dynamic relationship between changes in construction contract amounts across the diversified business areas within the portfolios of Korean construction firms and their overall business performance using a vector error correction model. It aims to provide a detailed evaluation of the effectiveness and characteristics of diversification strategies in the construction industry. This analysis employs key variables, including the debt ratio, return on total assets, diversification index, and construction contract amounts in domestic and overseas building, civil engineering, and plant construction projects. Two distinct models are used: Model A investigates the relationship between the debt ratio and diversification while Model B explores the relationship between the return on total assets and diversification. The time series data for the analysis spans from Q1 2002 to Q4 2021 on a quarterly basis. The results indicate that Korean construction firms have actively expanded into overseas markets to enhance their financial soundness. However, while such diversification efforts facilitate short-term capital acquisition, they have a negative impact on long-term business performance. When technological capabilities remain constant, lowering prices to increase contract volume may ultimately erode long-term profitability. Therefore, rather than focusing solely on expanding contract volumes through diversification, it is essential to first objectively assess the strengths of each business sector and focus on strengthening core competencies and expertise before pursuing further diversification.

1. Introduction

Companies often pursue diversification to build a stable business portfolio and secure sustainable growth in today’s uncertain industrial environment. Because industries experience cycles of expansion and contraction, relying solely on a single line of business can expose companies to significant risks. Meanwhile, diversifying too broadly in a highly competitive market may weaken specialized capabilities. Thus, diversification strategies must be designed flexibly to suit specific industry conditions [1,2,3]. In particular, the construction industry is shaped by both internal factors, such as its project-based nature and extended project durations, and external influences, including macroeconomic fluctuations, policy changes, and evolving consumer perceptions. These factors distinguish it from conventional manufacturing sectors. Consequently, construction firms require diversification strategies that enable them to operate steadily despite these varying challenges [4].
Effective diversification strategies involve efficiently using a company’s resources and deploying its core competencies across different business areas to enhance overall performance [5]. This approach is reflected in the composition of a firm’s business portfolio and the distribution of its various sectors. In construction, the types of projects pursued and their regional allocation are outcomes of strategic resource allocation, which in turn influences business performance [6,7,8]. Therefore, understanding the relationship between portfolio diversification and business performance is critical for implementing successful strategies.
While numerous studies have investigated the impact of diversification levels on the financial performance of construction firms [9,10,11,12,13,14], most have focused on whether greater or lesser levels of diversification correlate with performance outcomes at a given point in time. This static perspective, although valuable, provides only a partial view of how diversification strategies function in dynamic and rapidly changing environments. Also, prior research generally overlooks how temporal changes in specific business areas—such as project types and regional markets—within a firm’s portfolio influence business performance over time. This gap is especially important in the construction industry, where project lifecycles are long, risk profiles differ significantly across sectors and regions, and resource reallocation occurs continuously.
Considering the aforementioned aspects, this present study examines the dynamic relationship between shifts in construction contract amounts across diversified business areas and the corresponding business performance of Korean construction firms, using a vector error correction model. To this end, the business portfolio is segmented by project type and geographic region, allowing for a detailed analysis of how changes in each segment affect construction firms’ business performance. Through this approach, this study aims to provide a comprehensive evaluation of the effectiveness and unique characteristics of diversification strategies in the construction industry while offering insights into how construction firms can respond to financial pressures, manage risks, and ensure long-term stability from a diversification perspective.

2. Background

2.1. Trends in Market Fluctuations by Business Area in Korean Construction Firms

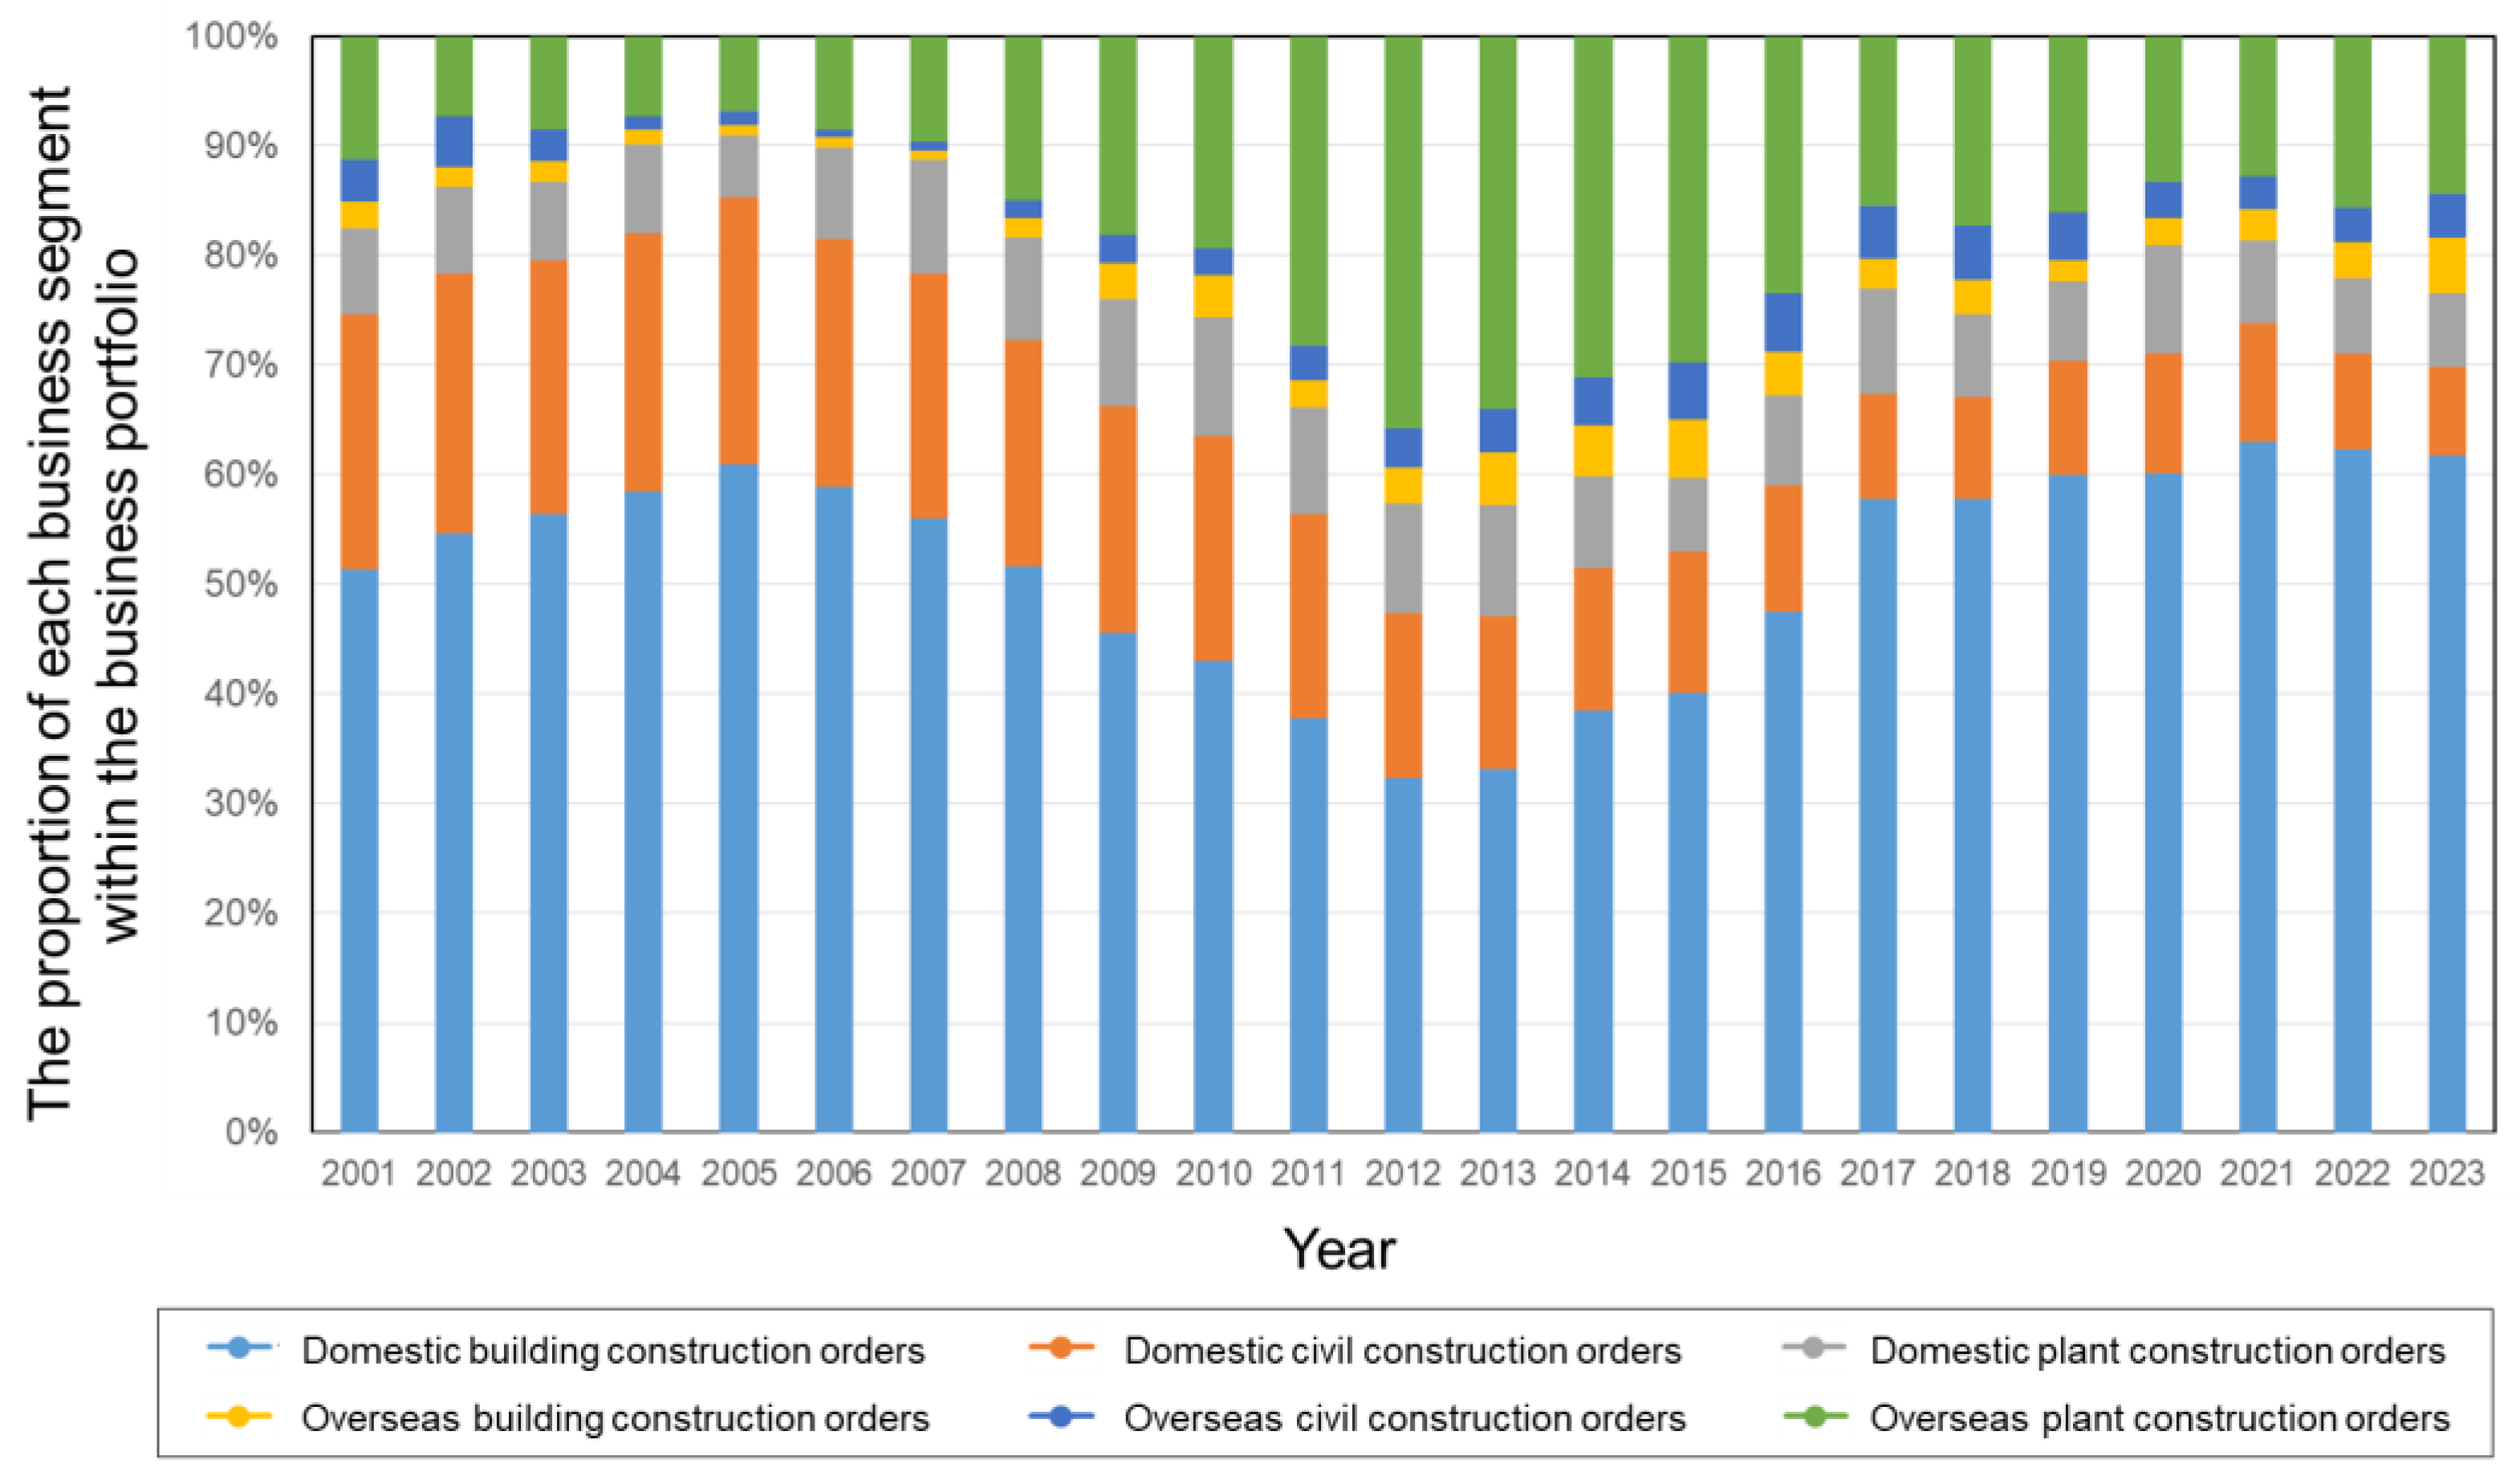
Figure 1 and Figure 2 illustrate key trends in construction contract amounts across the major business areas within the portfolios of Korean construction firms. Figure 1 shows the absolute trends, while Figure 2 reorganizes the data to emphasize the proportional contributions of each business area. The Korean construction market has been considerably influenced by three major macroeconomic events: the 1998 Asian financial crisis, the 2008 global financial crisis, and the 2020 pandemic crisis. Examining the changes in various business sectors based on these events, as shown in Figure 1 and Figure 2, provides indirect insight into both the characteristics of the Korean construction market and the strategic responses of its firms.
First, Korean construction firms have primarily grown by focusing on the domestic market. They have particularly excelled in the domestic building market, which is largely driven by private real estate projects. However, because this market is highly sensitive to fluctuations, firms that concentrate here are particularly vulnerable to macroeconomic shocks from a diversification standpoint.
Second, when the domestic construction market declines, firms tend to actively expand into overseas markets. This trend is especially evident when comparing the periods before and after the 2008 global financial crisis. While domestic building contract amounts increased steadily until 2008 and then began to decline, overseas plant market contracts surged, even surpassing domestic figures by 2012. This pattern suggests that Korean construction firms turned to overseas markets to mitigate domestic downturns. Yet, during the 2020 pandemic crisis, firms with a strong domestic focus experienced a decline in their overseas expansion, indicating that these firms view the overseas market as a substitute for the domestic one rather than as an independent domain.
Third, Korean construction firms maintain a relatively small presence in both domestic and overseas civil engineering markets. Because the civil engineering sector is largely dominated by public projects, it tends to be less affected by market fluctuations and can, therefore, contribute to stabilizing the overall business portfolio.
Although these firms have adjusted their diversification levels in response to changing business conditions, it remains unclear whether these efforts have positively impacted their business performance. Instead of assuming a one-way causal relationship between diversification and performance, it is essential to examine their dynamic interactions, as both factors continuously influence one another.
Given these observations, this study aims to conduct an in-depth analysis of the dynamic relationship between the diversification strategies of Korean construction firms and their business performance by segmenting the different business areas within their portfolios.

2.2. Literature Review

Unlike general manufacturing firms, construction companies tend to diversify their portfolios based on project type and geographic location to secure stable revenue streams [15,16]. Although such diversification strategies are common across industries, the literature reveals conflicting evidence regarding their impact on firm performance.
Some research indicates that business diversification enhances performance by improving resource utilization efficiency, strengthening financing capabilities, and reducing financial risks. For instance, studies have shown that related diversification—where firms leverage their technology and resources across similar markets—has a more positive effect on firm value [1,17,18,19,20]. These findings, validated across multiple countries, highlight the broad benefits of effective diversification strategies. In addition, Melicher et al. [21] demonstrated that mergers expanding a firm’s business areas can increase flexibility in debt capacity and lower capital costs, thereby enhancing financing capabilities. Khanna et al. [22] further found that in emerging markets, the positive effects of diversification on financial performance outweigh its negative aspects.
Meanwhile, other studies suggest that diversification may negatively affect performance owing to overinvestment, cross-subsidization, and information asymmetry costs. Lang et al. [23] found that while enhanced financing capabilities might improve investment potential, they can also lead to overinvestment, reducing the marginal return on capital. Similarly, Berger et al. [24] highlighted the detrimental effects of cross-subsidization, where profitable units end up supporting underperforming ones. Moreover, Comment et al. [25] reported that firms concentrating on a few core competencies achieved higher stock returns than those pursuing broad diversification, suggesting that specialization can sometimes yield better performance.
The construction industry differs from the manufacturing and service sectors in terms of business structure, supply chain dynamics, and other factors. Recognizing these differences, some studies have specifically examined the diversification strategies of construction firms. Cheah [26] introduced the market segmentation matrix to identify distinct diversification patterns in construction, categorizing them into project-type diversification (e.g., building, civil engineering, and plants) and regional diversification (domestic and overseas). Further, Yee et al. [11,12] evaluated the stability and profitability of diversified construction firms. In one study, Yee et al. [11] used corporate stability indicators, such as the current ratio, to assess internationalization and diversification strategies, finding that internationally diversified firms maintained high current ratios and low leverage, while domestically diversified firms exhibited lower current ratios and higher leverage. In a subsequent study, Yee et al. [12] observed that smaller firms tended to concentrate on specific business areas, whereas larger firms with more resources were more likely to diversify, although they found no clear evidence that diversification directly enhances profitability. Han et al. [14] further segmented firms based on their diversification levels and found that different performance outcomes were associated with distinct diversification strategies.
Given that the primary goal of business diversification is to ensure stable operations, numerous studies have focused on whether diversification in construction firms positively affects business performance. For example, Choi et al. [10] compared specialized and diversified firms and observed no significant difference in profitability between the two groups. Kim et al. [13] found that larger firms tend to be more diversified than smaller ones, yet diversification was not directly linked to corporate growth rates. Their findings suggest that construction firms often begin with specialization and later diversify to enhance stability and survival, though the causal relationship between growth and diversification remains unclear. Kim et al. [27] examined the diversification patterns of the largest U.S. contractors and found that business portfolio changes, particularly in project types and geographic markets, were closely tied to firm-level risk management and growth strategies. However, their study relied on static measures of diversification and focused primarily on descriptive analysis, offering limited insight into the temporal dynamics between diversification and performance. Han et al. [28] investigated strategic approaches for sustaining growth in the global construction market and emphasized the importance of regional and project-type diversification in achieving long-term stability. While insightful, their study did not employ formal quantitative modeling to evaluate the causal effects or long-term relationships between diversification and firm performance, limiting its applicability for empirical validation. Similarly, Cheah et al. [29] conducted a strategic analysis of large local construction firms in China and showed how diversification decisions—especially across project categories—contributed to differences in corporate competitiveness. Although their research highlighted important strategic patterns, it lacked a dynamic econometric framework, thereby failing to capture how performance metrics evolve over time in response to portfolio shifts.
Overall, the literature confirms that diversification is widely employed as a strategy to stabilize operations in the construction industry, especially given its sensitivity to macroeconomic and policy factors. However, most studies have focused solely on the relationship between diversification indices and business performance. A more nuanced analysis requires examining how shifts in different business areas within a firm’s portfolio affect overall performance. Taking these factors into account, this study segments business areas by project type and region to analyze the dynamic relationship between changes in construction contract amounts and business performance.

3. Research Methodology

This study conducts an empirical analysis using the vector error correction (VEC) model. The VEC model is derived from the vector autoregression (VAR) model—a multivariate time series model that, unlike conventional structural models, is constructed based on the correlations and lag relationships among variables without relying on a priori economic theories [30]. The VAR model allows researchers to utilize practically useful information without imposing theoretical constraints on the structural relationships among variables. Thus, it is a dynamic model that captures the mutual influences among multiple time series variables [31]. Accordingly, in the VAR model, all variables are treated as endogenous, and strong correlations among variables are considered an inherent characteristic of the VAR model. Therefore, unlike in ordinary least squares (OLS) regression, multicollinearity does not pose a problem in VAR models [32,33].
The VAR model consists of n linear regression equations, where each equation treats the current observation of a variable as the dependent variable and uses past observations of that variable and others as explanatory variables. Typically, a VAR model with lag p for macroeconomic variables Yt, an N × 1 vector, is expressed by the following regression equation [34]:
Y t = α 0 + i = 1 n α t Y t 1 + e t = A L Y t + e t = i = 1 p A i Y t 1 + e t
Here, Yt represents a vector of macroeconomic variables of size N × 1, αt is the coefficient matrix, et is the stochastic error term, and L is the lag operator—defined as L1Yt = Yt−1, L2Yt = Yt−2, and so on—with A(L) expressed as A1L1 + A2L2 + A3L3 + … [34].
The results of the VAR model analysis are influenced by both the ordering and the lag length of the variables [35]. Therefore, this study conducted a unit root test to verify the stability of the analytical variables. Additionally, a Granger causality test was used to determine the appropriate ordering of variables and a time lag test was performed to estimate the optimal lag length based on the Schwarz information criterion (SIC).
When the time series data used in the VAR model are unstable, differencing the level variables is required, though this process may result in the loss of valuable information. However, if a long-term linear relationship (i.e., cointegration) exists among these unstable level variables, the VEC model can be employed for analysis [36]. The VEC model is a restricted form of the VAR model that incorporates the cointegration relationship alongside other short-term dynamic interactions. It is expressed as follows [34]:
Δ X t = i = 1 p 1 Γ i Δ X t i + α β X t p + u i .
Here, β represents the cointegration relationship matrix of size (n × r). The term β’Xt−p comprises r linear combinations and represents the disequilibrium error at time t−p, which influences Xt at time t through the coefficient α. For this reason, the (n × r) coefficient matrix α is referred to as the error correction coefficient [34].
An actual cointegration test was conducted in this study, and the results confirmed the presence of cointegration, which justified the application of the VEC model. Many previous studies have used the VEC model to analyze dynamic relationships among various variables in the construction sector [37,38,39]. In this present study, the VEC model is applied to analyze the dynamic relationship between business performance and business diversification in Korean construction firms.

4. Empirical Analysis

4.1. Variables and Data Collection

In today’s ever-changing business environment, firms must effectively manage various risks to avoid financial distress and ensure business continuity. Maintaining financial stability and profitability is, therefore, essential. In this study, business performance is conceptualized primarily in terms of financial outcomes, reflecting the core indicators of a firm’s ability to maintain profitability and financial stability in the context of strategic diversification. Specifically, the analysis employs two representative metrics: the debt ratio and return on assets (ROA). The debt ratio serves as a proxy for financial soundness, indicating the extent to which firms rely on external financing, while ROA captures profitability, reflecting how efficiently firms generate income from their total assets. These two indicators are widely used in corporate finance and construction management research as they collectively provide insight into the fiscal health and operational efficiency of firms. Given the project-based nature of the construction industry—where financial leverage and return variability are high—these metrics are especially relevant. By focusing on these dimensions, this study offers a clear and measurable approach to evaluating the impact of portfolio diversification strategies on construction firms’ business performance. The formulas for these indicators are as follows:
D e b t   r a t i o = D e b t E q u i t y × 100   ( % ) ,
R e t u r n   o n   A s s e t s = R e t u r n A s s e t s × 100   ( % ) .
The debt ratio and ROA were derived from the financial statements of the top 30 Korean construction firms ranked within the top 100 in the 2023 construction capability evaluation, ensuring that reliable financial data were available for the analysis period. For each company, the total liabilities, total equity, total assets, and net income were averaged to calculate these indicators. All financial data were obtained from the Financial Supervisory Service’s electronic disclosure system.
Methods for quantifying diversification include the Berry–Herfindahl index (BHI) and the entropy index. While both indices take into account the proportion of each business segment, the entropy index differs from the BHI in that it applies the natural logarithm of the inverse of each segment’s share as a weighting factor. In addition, the entropy index is able to distinguish between related and unrelated diversification when measuring the degree of diversification [1]. Jacquemin et al. [40] further emphasized the differences between the two indices: the BHI is more sensitive to changes in business segments with larger shares, whereas the entropy index is more responsive to changes in segments with relatively smaller shares.
In the case of the construction firms analyzed in this study, most business segments included in their portfolios exhibit characteristics of related diversification, with certain segments accounting for a relatively large share of the overall portfolio. Given these characteristics, the BHI is considered an appropriate index to effectively capture the nature of changes in the construction firms’ business portfolio.
Accordingly, this study adopts the Berry–Herfindahl index as an analytical variable. This index relies on a classification system to assess the extent of a firm’s operations across different groups. The modified Berry–Herfindahl index is defined as follows:
B e r r y H e r f i n d a h l   d i v e r s i f i c a t i o n = 1 j m i j 2 / j m i j 2 j = 1 , K , M .
Here, mij represents the proportion of the jth classified group relative to the ith firm’s total sales, and M is the number of classified groups in which a firm operates. If a firm operates in a single classified group, its Berry–Herfindahl index of diversification is 0; the index approaches 1 when the firm’s total sales are equally divided among several classified groups [41].
To further analyze diversification patterns, this study examined construction contract amounts in domestic and overseas sectors, specifically in building, civil engineering, and plant projects, which are key components of construction firms’ business portfolios. The construction contract amount data were calculated as the sum of the performance of the 30 sample construction firms. Although many construction firms operate in Korea, the top 30 firms dominate the overall contract volume in the country’s project bidding system, making their data representative of the diversification characteristics of Korean construction firms. The time series data for this analysis spans from 2002 to 2021 on a quarterly basis.
Although the dataset originally comprises firm-level panel data, this study aggregates the data to construct representative time series reflecting overall industry-level behavior. This aggregation was conducted to highlight macro-level structural patterns across the construction industry and to reduce firm-specific volatility that might obscure systemic relationships.
This study distinguishes between two models: Model A, which analyzes the relationship between the debt ratio and diversification, and Model B, which examines the relationship between the return on total assets and diversification. A preliminary diagnostic check of the variables was conducted to ensure the validity of the VEC model. Based on these test results, the VEC model was constructed for each model, and an empirical analysis was subsequently performed. The analytical variables used in this study are presented in Table 1.

4.2. Empirical Procedure

When conducting a time series analysis, it is essential to ensure that the data are stationary. Using nonstationary data can lead to spurious regression, where variables appear highly correlated even when no true relationship exists [42]. To test for stationarity, we check for the presence of unit roots. If a unit root is detected, the data are considered nonstationary. In this study, we employed the augmented Dickey–Fuller (ADF) test, a widely used method for detecting unit roots, to assess the stationarity of our time series data. As shown in Table 2, the ADF test results for the level variables in both Model A and Model B indicate that most Dickey–Fuller t-statistics exceed the 1%, 5%, and 10% significance levels; hence, we could not reject the null hypothesis of a unit root at levels. However, after first-differencing the variables and reapplying the ADF test, the null hypothesis was rejected at all significance levels, confirming that the first-differenced variables are stationary.
If conventional regression methods were applied to nonstationary variables, spurious regression issues could arise, rendering any correlation analysis statistically meaningless. However, if a cointegration relationship exists among these nonstationary time series, the results of regression analysis can still be valid. In such cases, the VEC model is appropriate for analysis [43].
To perform the cointegration test, we first determined the appropriate lag length. Arbitrarily setting the lag length in a VAR model can lead to errors; therefore, it is necessary to identify the optimal lag using information criteria. Typically, the lag length (p) in a VAR(p) model is determined by minimizing values from criteria such as the Akaike information criterion and SIC. Although a longer lag length can enhance the explanatory power when additional variables are introduced, it also increases model complexity and reduces degrees of freedom. Therefore, to maintain model simplicity, a smaller lag length is preferred [44]. As shown in Table 3, the optimal lag length was determined to be 1 (*) for both Model A and Model B.
Following this, as shown in Table 4, we conducted Johansen’s cointegration test, a widely used method for testing cointegration. The test rejected the null hypothesis that “the number of cointegration vectors is less than or equal to r” at the 5% significance level, confirming a cointegration relationship among the level variables. With cointegration established, we proceeded with the VEC model for our analysis.
The results of the VAR model are highly sensitive to the ordering of endogenous variables, which can lead to varying analytical outcomes. Therefore, before constructing the vector autoregression model, it is necessary to determine the ordering of variables based on causality relationships. To address this, we conducted a Granger causality test, which identifies cause-and-effect relationships using a lag-distributed model without relying on prior economic theory [45]. As shown in Table 5, the Granger causality test results for Model A confirm the following causality sequence: DCO_B ▷ DR ▷ ICO_P ▷ DIV ▷ ICO_C ▷ ICO_B ▷ DCO_C ▷ DCO_P. Similarly, for Model B, the causality sequence is DCO_B ▷ PR ▷ ICO_P ▷ DIV ▷ ICO_C ▷ ICO_B ▷ DCO_C ▷ DCO_P.
Based on these tests, the final VEC model for Model A is specified as Equation (6), and the VEC model for Model B is specified as Equation (7).
D R t = δ + α β y t 1 + ρ 0 + i = 1 p γ 1 , i D R t i + i = 1 p γ 2 , i D I V t i + i = 1 p γ 3 , i D C O _ B t i + i = 1 p γ 4 , i D C O _ C t i + i = 1 p γ 5 , i D C O _ P t i + i = 1 p γ 6 , i I C O _ B t i + i = 1 p γ 7 , i I C O _ C t i + i = 1 p γ 8 , i I C O _ P t i + u t
P R t = δ + α β y t 1 + ρ 0 + i = 1 p γ 1 , i P R t i + i = 1 p γ 2 , i D I V t i + i = 1 p γ 3 , i D C O _ B t i + i = 1 p γ 4 , i D C O _ C t i + i = 1 p γ 5 , i D C O _ P t i + i = 1 p γ 6 , i I C O _ B t i + i = 1 p γ 7 , i I C O _ C t i + i = 1 p γ 8 , i Δ I C O _ P t i + u t
In these equations, α is the adjustment coefficient, β represents the long-run parameters of the VEC function, and γj,i captures the short-run dynamics between the independent variables and the target variable. Using these VEC models, an impulse response analysis was subsequently conducted.

4.3. Results

Impulse response analysis examines the dynamic interactions and transmission effects among variables by assessing how a one-standard-deviation shock to a variable influences both itself and other variables over time [46].
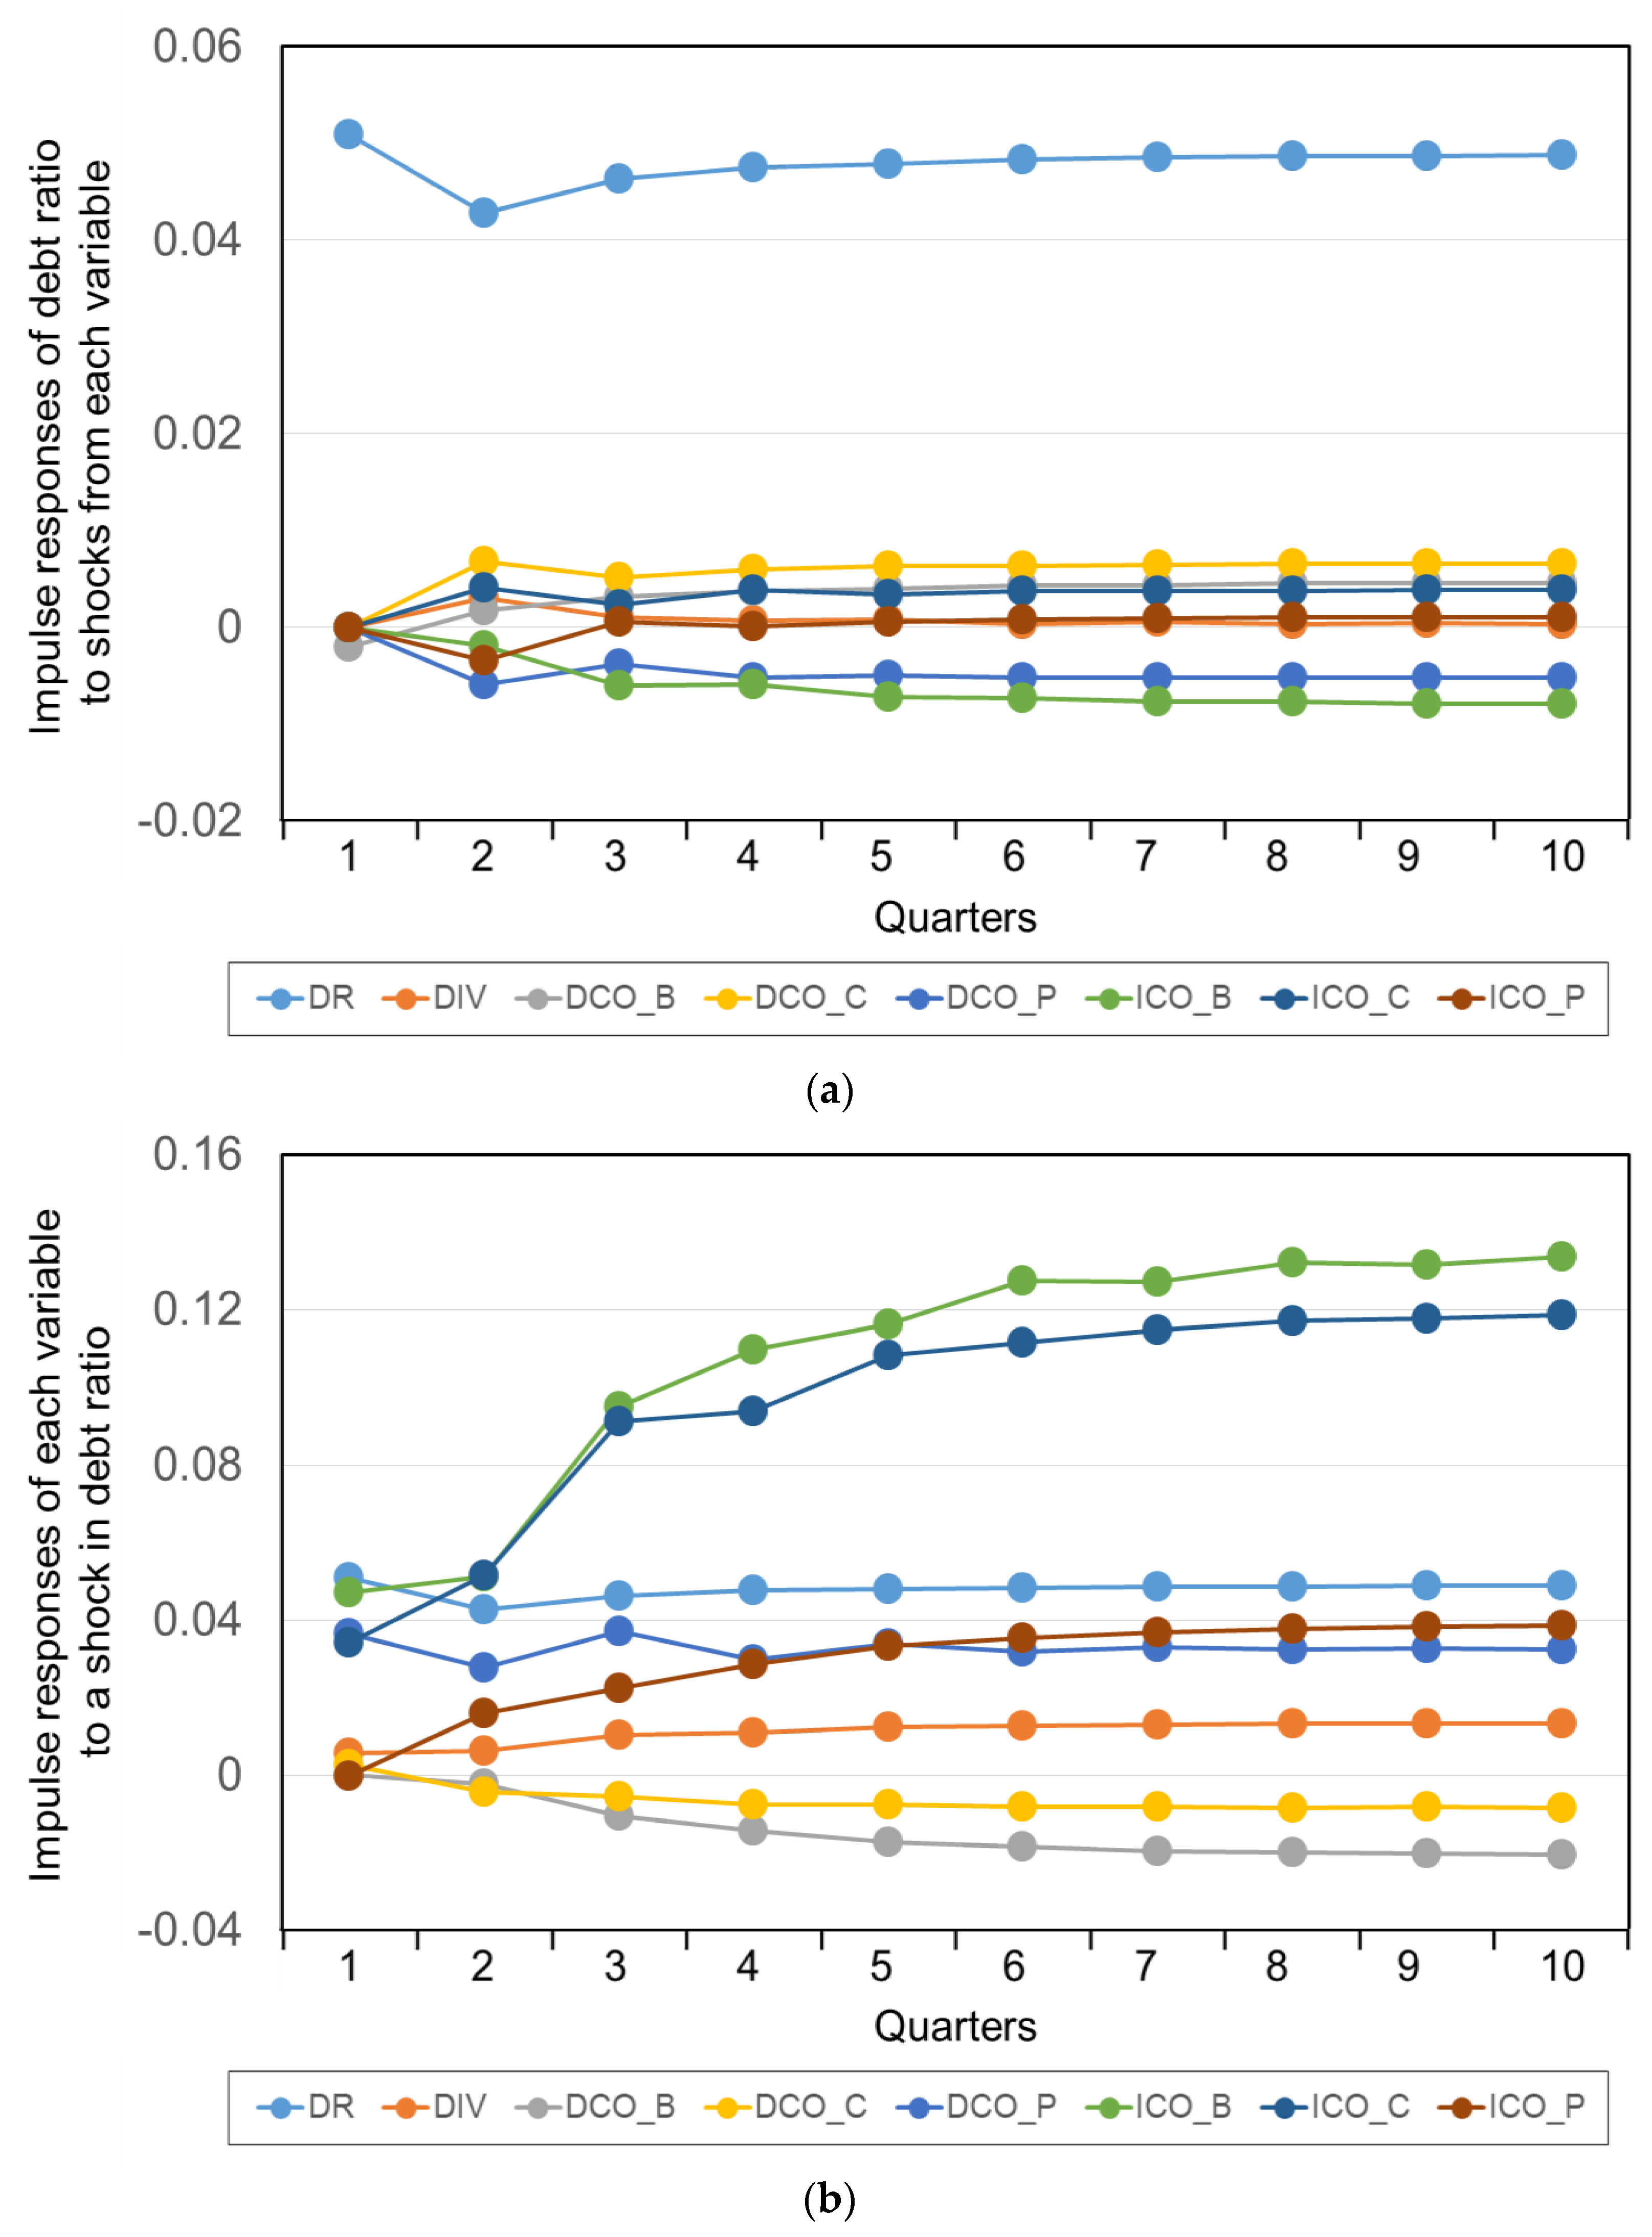
Figure 3a and Table 6 present the response of the debt ratio (DR) to shocks from various variables. This allows for an examination of how increases or decreases in construction contract amounts across each business segment affect construction firms’ financial stability in the long term. When DR experiences a shock, it initially increases by approximately 0.051, then declines in magnitude during the second quarter, and then rises again to approximately 0.049 by the tenth quarter. In response to a shock in the diversification index (DIV), DR shows significant positive fluctuations until the second quarter, with the magnitude of these fluctuations gradually diminishing over time.
When examining the effect of domestic construction order shocks on DR, a shock in domestic building construction orders (DCO_B) initially causes a negative response of approximately −0.002 in the first quarter. However, from the second quarter onward, the response becomes positive, reaching approximately 0.005 by the tenth quarter. In contrast, a shock in domestic civil construction orders (DCO_C) produces an initial positive response, with DR increasing by approximately 0.007 by the tenth quarter. Meanwhile, a shock in domestic plant construction orders (DCO_P) leads to a negative response, with DR fluctuating by approximately −0.005 by the tenth quarter.
For overseas construction order shocks, a shock in overseas building construction orders (ICO_B) initially induces a negative response, reaching approximately −0.008 by the tenth quarter. A shock in overseas civil construction orders (ICO_C) results in a positive response. Additionally, a shock in overseas plant construction orders (ICO_P) initially produces a negative response of approximately −0.003 in the second quarter, but from the third quarter onward, the response shifts to positive, reaching approximately 0.001 by the tenth quarter.
Figure 3b and Table 7 show the response of various variables to a shock in DR. Through this, it becomes possible to analyze how construction firms adjust their business expansion patterns when experiencing changes in financial stability. In this case, the diversification index consistently responds positively, increasing by approximately 0.013 by the tenth quarter. Regarding the impact on domestic construction orders, building construction orders (DCO_B) exhibit increasingly negative fluctuations over time. Domestic civil construction orders (DCO_C) initially respond positively but then shift to a negative response from the second quarter onward, ultimately reaching approximately −0.008 by the tenth quarter. Domestic plant construction orders (DCO_P) initially responded positively, reaching approximately 0.032 by the tenth quarter. For overseas construction orders, both building (ICO_B) and civil (ICO_C) construction orders exhibit progressively increasing positive fluctuations over time, while overseas plant construction orders (ICO_P) initially respond negatively but shift to a positive response from the second quarter onward, with fluctuations increasing over time.
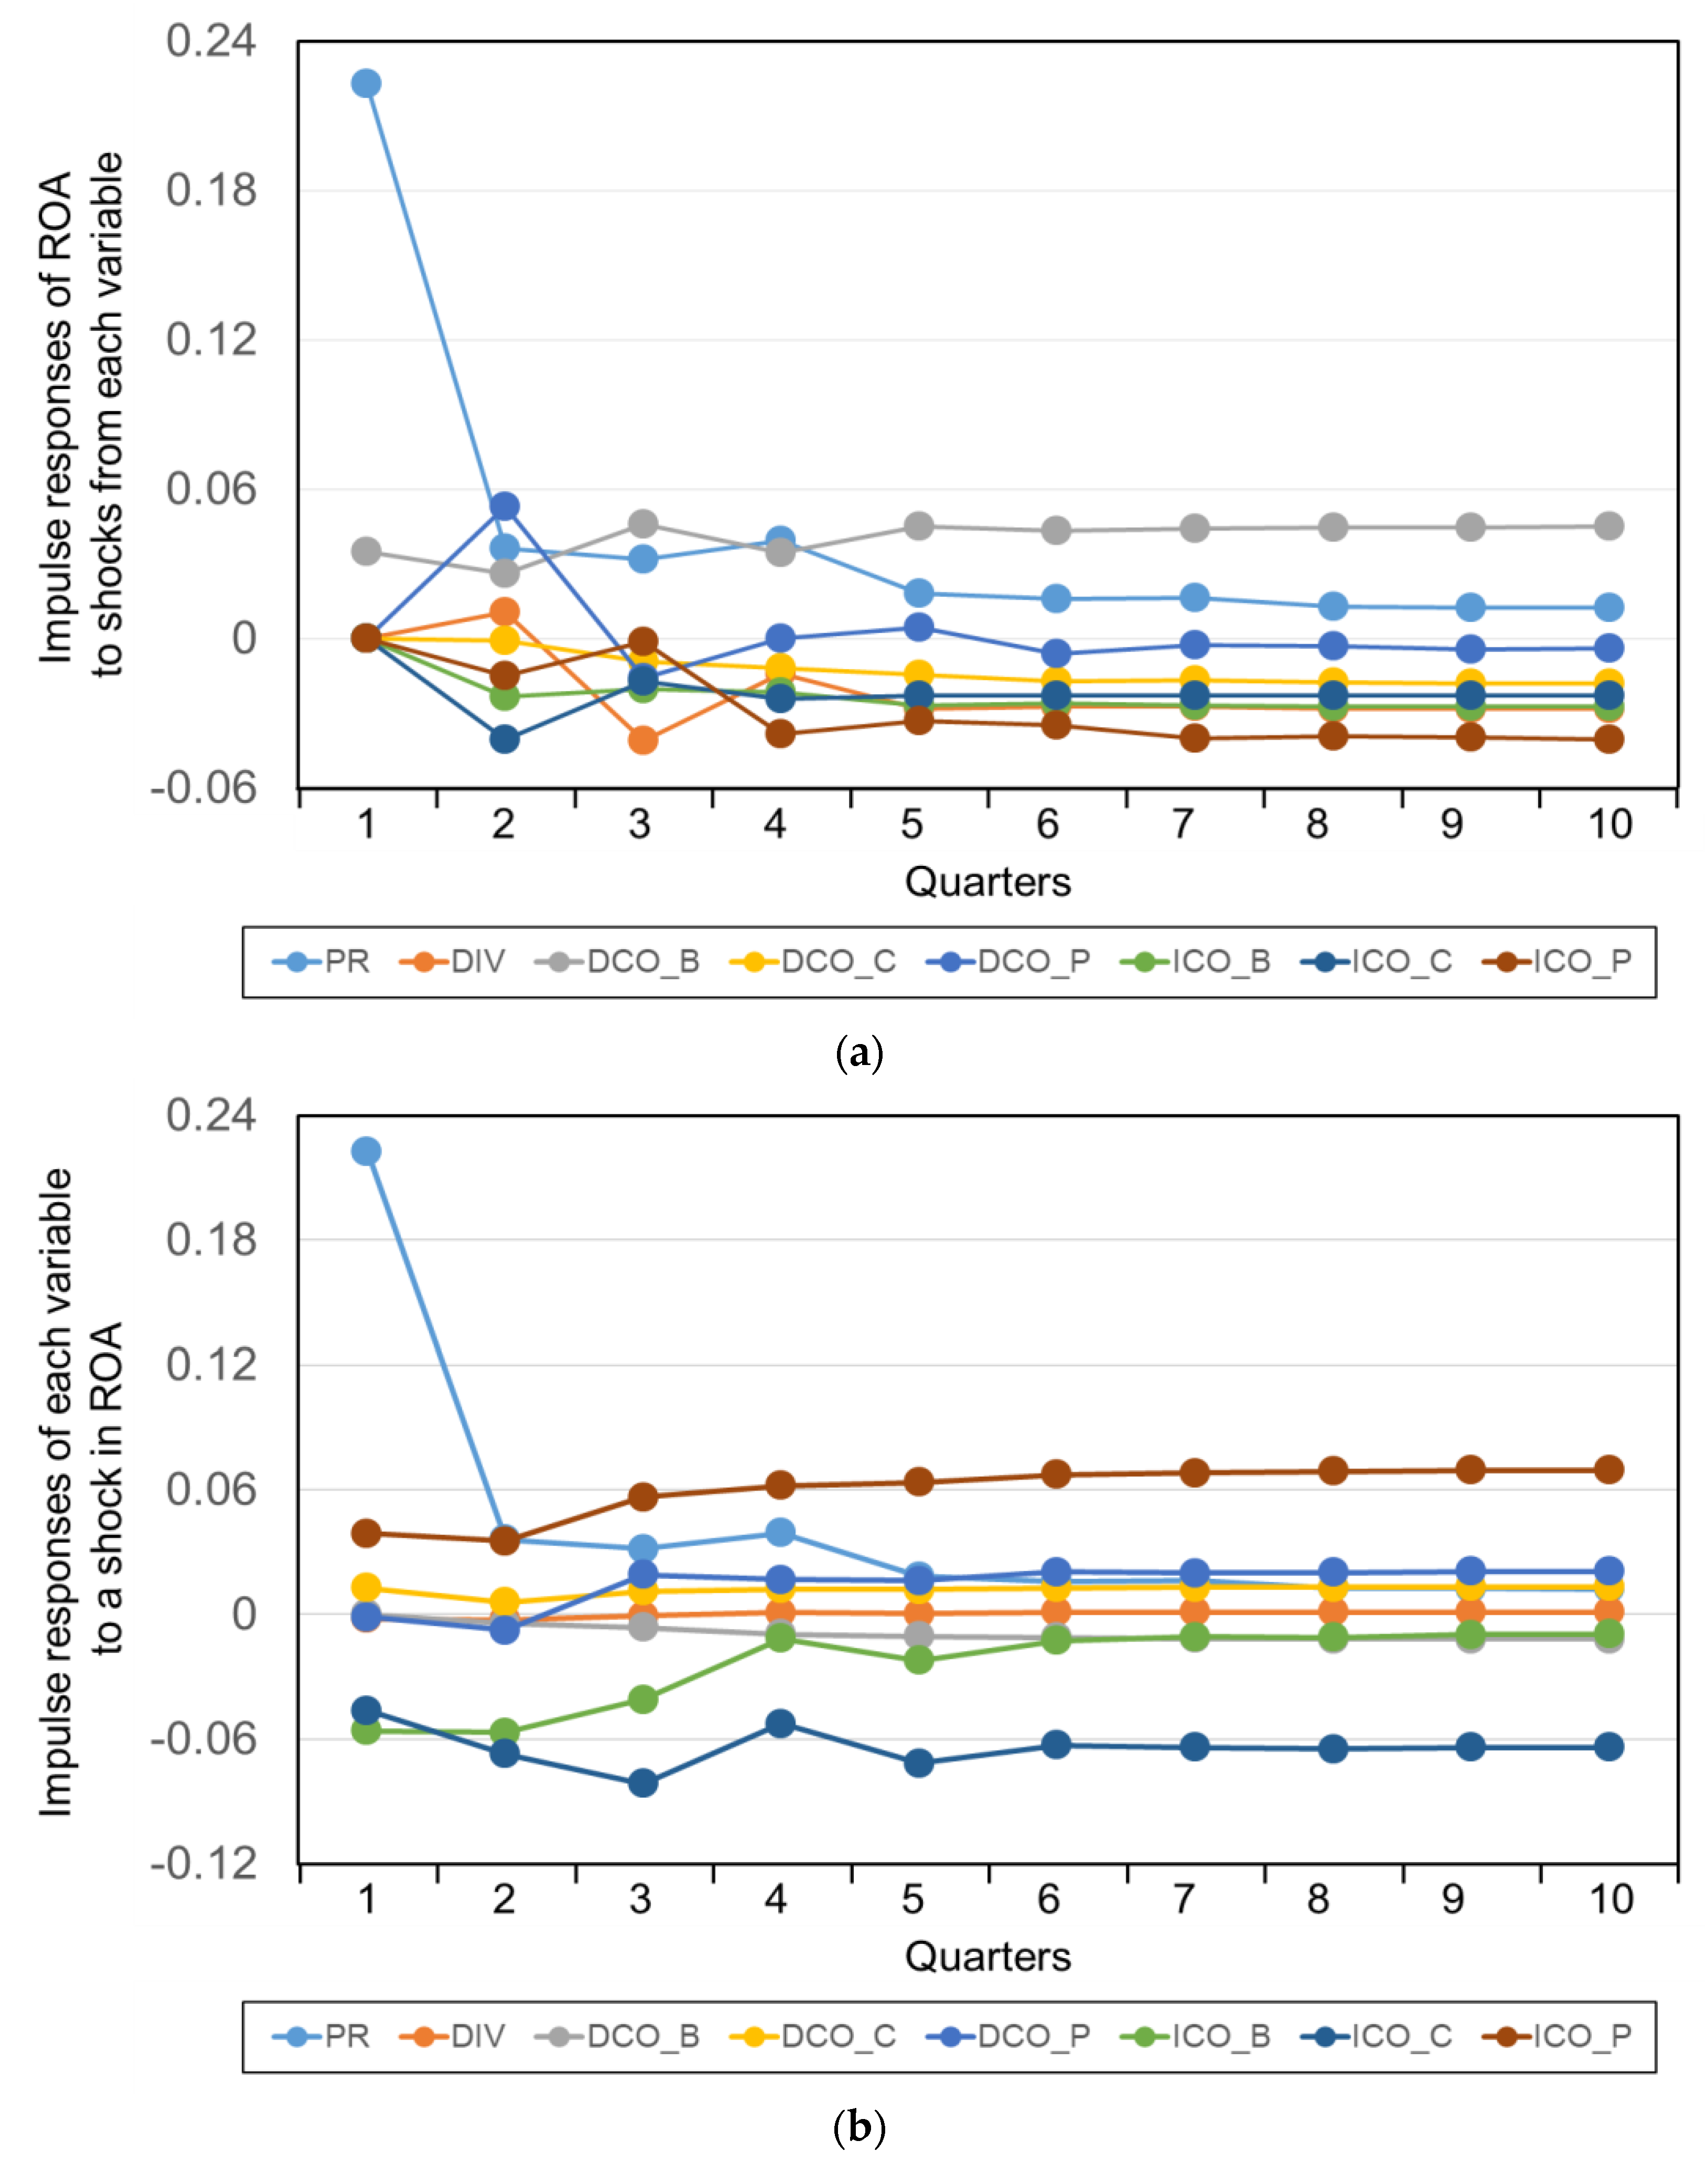
Figure 4a and Table 8 present the impulse response of ROA to various shocks. This allows for an examination of how increases or decreases in construction contract amounts across each business segment affect construction firms’ profitability in the long term. When ROA experiences a shock in its own variable, it fluctuates in magnitude but generally maintains an overall positive response. In contrast, when shocked by the diversification index (DIV), ROA initially responded positively until the second quarter; however, starting in the third quarter, the response turned negative, reaching approximately −0.028 by the tenth quarter. Analyzing the effect of domestic construction order shocks on ROA reveals distinct patterns. A shock in domestic building construction orders (DCO_B) elicits an initial positive response, with ROA increasing to approximately 0.045 by the tenth quarter. A shock in domestic civil construction orders (DCO_C) produces an overall negative response, with ROA declining by approximately −0.018 by the tenth quarter. For domestic plant construction orders (DCO_P), an initial large positive response is observed, but from the third quarter onward, the response reverses to negative, reaching approximately −0.004 by the tenth quarter. When examining overseas construction order shocks, all shocks—in building, civil, and plant orders—result in an initial negative response for ROA.
Figure 4b and Table 9 show the response of other variables to a shock in ROA. This makes it possible to analyze the business expansion patterns of construction firms in response to changes in their profitability.
In this case, the diversification index initially reacts negatively until the third quarter, then shifts to a positive response starting in the fourth quarter, reaching approximately 0.001 by the tenth quarter. Regarding domestic construction orders, a shock in ROA leads to a negative response in building construction orders (DCO_B), while domestic civil construction orders (DCO_C) respond positively. For domestic plant construction orders (DCO_P), the initial response is negative until the second quarter; from the third quarter onward, the response turns positive, reaching approximately 0.021 by the tenth quarter. In the overseas market, building and civil construction orders exhibit fluctuations in magnitude but generally show an overall negative response to an ROA shock. In contrast, overseas plant construction orders (ICO_P) responded positively, reaching approximately 0.070 by the tenth quarter.
Summarizing the impulse response analysis, several insights emerge regarding the diversification characteristics of Korean construction firms. An increase in the debt ratio is associated with a rise in the diversification index, suggesting that these firms enhance their diversification levels to ensure business stability. However, the reverse is also true: when the diversification index increases, the debt ratio tends to rise as well. This indicates that, despite their active pursuit of diversification, Korean construction firms encounter limitations in reducing their debt ratio.
A detailed examination of the relationship between diversification changes and the debt ratio—using construction contract amounts in each business area—reveals that when the debt ratio increases, overseas construction contract amounts tend to rise, whereas domestic building and civil engineering contract amounts, which make up a significant portion of the business portfolio, decline. Notably, the most effective factors in lowering the debt ratio are domestic plant construction contracts, which have the smallest share in the portfolio, and overseas building construction contracts. This pattern suggests that although Korean construction firms have primarily grown by focusing on the domestic building market, they turn to overseas markets when financial stability issues arise.
However, such overseas expansion appears to have limited effectiveness in reducing the debt ratio. In particular, while an increase in overseas plant construction contracts—the second-largest business portfolio segment—may lower the debt ratio in the short term, it ultimately contributes to a higher debt ratio in the long run. This indicates that expanding into a different market to mitigate downturns has inherent limitations. Thus, even with comparable levels of technological competitiveness, construction firms must enhance their price competitiveness to expand their market presence abroad. Although this strategy can generate short-term revenue inflows and temporarily lower the debt ratio, the high risks associated with overseas projects can lead to declining profitability, thereby worsening overall financial stability.
These findings are further supported by the analysis of the relationship between ROA and business portfolio diversification.
The analysis shows that increases in domestic building construction orders are associated with long-term improvements in ROA, whereas increases in overseas construction orders are consistently associated with a decline in ROA. This discrepancy can be attributed to the relatively stable and predictable nature of the domestic market, where Korean construction firms possess extensive experience, technical expertise, and familiarity with regulatory and institutional environments. These advantages allow firms to manage costs effectively and secure profitability. In contrast, overseas markets—especially the plant sector—expose firms to a range of external risks, including political instability, exchange rate volatility, legal and regulatory uncertainty, and project delays or claims. Moreover, overseas plant projects typically require significant upfront investment and long project durations, increasing the financial burden and diminishing profitability. Due to intense competition in overseas markets, contracts are often awarded at low margins, further increasing the likelihood of profit erosion during the project execution phase.
Moreover, when ROA decreases, domestic construction contract amounts increase, whereas overseas plant construction contract amounts—the second-largest segment in the business portfolio—decline. This suggests that Korean construction firms focus on the domestic building market to enhance profitability while treating the overseas plant market as a complementary market to counterbalance domestic market fluctuations.
In summary, the findings suggest that diversification strategies can have both positive and negative effects on firm performance. Merely expanding into new markets or business areas does not guarantee improved outcomes. Therefore, before implementing diversification strategies, construction firms should carefully assess the characteristics of each business sector and objectively evaluate their internal capabilities. Strengthening specialized competencies and securing technical expertise should precede the diversification efforts. Moreover, rather than indiscriminate expansion, firms should adopt a selective and strategic approach to diversification, particularly when entering overseas markets. Strategic decisions must take into account not only revenue potential but also long-term profitability and risk exposure.

5. Discussion and Conclusions

The construction industry inherently operates on a contract-based system with long project durations and is highly sensitive to macroeconomic and policy changes, making effective risk management essential. To ensure business stability, construction firms often diversify their projects across different types and regions. However, as previously noted in the literature, such diversification strategies can sometimes have adverse effects on business performance. This study provides meaningful insights for construction firms by analyzing the dynamic relationship between various business segments in their portfolios and overall business performance.
In this study, the debt ratio and ROA are used as proxies for business performance, while the Berry–Herfindahl index serves as the measure of diversification in Korean construction firms. To further explore diversification patterns, we examined construction contract amounts in key sectors—including domestic and overseas building, civil engineering, and plant projects—that comprise the firms’ portfolios. The empirical analysis was conducted using the VEC model over the period from Q1 2002 to Q4 2021.
The results indicate that although Korean construction firms pursue diversification to enhance financial stability, the actual effectiveness of this strategy is limited. A detailed examination of the relationship between construction contract amounts in different project types and the debt ratio reveals that as the debt ratio increases, firms tend to expand aggressively into overseas markets. Thus, while these firms have primarily focused on the domestic building market, they resort to overseas expansion when faced with financial stability concerns. However, overseas plant market expansion, despite representing a significant share of the business portfolio, has a negative long-term impact on business performance. This outcome reflects the limited effectiveness of short-term diversification strategies; when technological capabilities remain constant, lowering prices to increase contract volume may improve short-term revenue but ultimately erode profitability over the long run. This finding is further supported by the analysis of the relationship between ROA and business portfolio diversification.
These findings suggest that diversification strategies in the construction industry may not always contribute positively to firm performance. In fact, expanding into overseas markets without sufficient technological competitiveness can lead to increased financial burdens and deteriorated profitability over the long term. This implies that indiscriminate diversification, driven primarily by the need to secure short-term cash flow or market expansion, is not a sustainable solution for improving corporate financial health.
From a policy perspective, it is crucial for governments to support construction firms in strengthening their technological capabilities rather than encouraging diversification merely as a response to market uncertainty. Policies that expand investment in construction-related R&D, promote high-value-added technologies, and nurture skilled professionals are essential. In addition, establishing a centralized risk management platform for overseas construction projects can help construction firms systematically assess and mitigate potential political, financial, and legal risks involved in foreign markets.
At the firm level, construction companies should avoid relying solely on revenue expansion through low-cost bidding in overseas projects, which may increase short-term liquidity but pose significant long-term risks. Instead, construction firms need to analyze the profitability of each business segment independently and allocate resources based on strategic value rather than on portfolio balance alone. Developing mid- to long-term strategies that consider both market dynamics and internal capabilities is essential. Selective diversification, grounded in core competencies, offers a more sustainable approach than broad, undifferentiated market expansion.
Furthermore, the structural limitations of the Korean construction industry—including its heavy reliance on the domestic market and its vulnerability when entering large-scale overseas projects—underscore the need for broader industrial transformation. This includes fostering smaller-scale, stable overseas project models, revitalizing the domestic private construction market, and accelerating digital innovation within the industry.
In this context, diversification should not be regarded as a one-size-fits-all strategy for enhancing firm performance. Rather, it should be executed based on a careful evaluation of internal capabilities and external market conditions. This study offers meaningful insights not only for Korean construction firms but also for those in emerging economies, where rapid diversification without foundational competitiveness may lead to adverse outcomes. Ultimately, building long-term resilience through technological innovation and strategic capability development should precede any aggressive diversification efforts.
This study distinguishes itself from previous research that simply employed diversification indices by analyzing the effects of diversification with consideration of the various business segments constituting corporate portfolios. While the findings offer meaningful insights, several limitations must be acknowledged. First, although data on key variables reflecting the characteristics of Korean construction firms were collected based on a sample of the top 30 companies, the analysis falls short in fully accounting for firm-specific characteristics, such as differences in firm size, and market strategies. Second, the time series data used in the analysis are limited to the year 2021. Extending the dataset to include more recent years would allow for a more in-depth and updated examination of diversification patterns. Third, as the geographic scope of this study is confined to South Korea, there remains a possibility that the results reflect country-specific industrial and institutional characteristics, thereby limiting their generalizability to other contexts.
In view of these limitations, several directions for future research are proposed. Beyond quantitative measures such as contract volume and financial performance, future studies should aim to incorporate qualitative firm-specific factors—including variations in firm size and strategic orientation—by classifying companies accordingly. Collecting a broader dataset that includes a wider range of construction firms would enable comparative analysis across firm groups, potentially yielding more detailed insights into group-specific business strategies. Moreover, expanding the temporal and geographic scope of the dataset could facilitate the analysis of strategic business responses to major macroeconomic shifts or uncover regional differences in diversification approaches. Lastly, while this study limits the evaluation of business performance to debt ratio and ROA from the perspective of business risk management, it is important to recognize that a wide range of financial indicators can be used to assess construction firms’ business performance, each offering distinct insights. Therefore, future research should incorporate a more diverse set of business performance metrics to conduct a more in-depth analysis of the effectiveness of business strategies and to identify potential practical challenges associated with their implementation.

Author Contributions

S.K. developed the concept and drafted the manuscript. K.K. revised the manuscript. J.K. supervised the overall work. S.L. reviewed the manuscript. All authors have read and agreed to the published version of the manuscript.

Funding

This work was supported by the Korea Institute of Energy Technology Evaluation and Planning (KETEP) grant funded by the Korean government (MOTIE) (20202020800030, Development of Smart Hybrid Envelope Systems for Zero-Energy Buildings through Holistic Performance Tests, Evaluation Methods, and Field Verifications).

Data Availability Statement

The original contributions presented in the study are included in the article, further inquiries can be directed to the corresponding authors.

Acknowledgments

The authors would like to thank the Ministry of Trade Industry and Energy of the Korean government for funding this research project.

Conflicts of Interest

The authors declare no conflicts of interest.

References

  1. Palepu, K. Diversification strategy, profit performance, and the entropy measure. Strateg. Manag. J. 1985, 6, 239–255. [Google Scholar] [CrossRef]
  2. Chang, Y.; Thomas, H. The impact of diversification strategy on risk-return performance. Strateg. Manag. J. 1989, 10, 271–284. [Google Scholar] [CrossRef]
  3. Kim, H.J.; Reinschmidt, K.F. Association of risk attitude with market diversification in the construction business. J. Manag. Eng. 2011, 27, 66–74. [Google Scholar] [CrossRef]
  4. Oyewobi, L.O.; Windapo, A.O.; Cattell, K.S. Impact of business diversification on South African construction companies’ corporate performance. J. Financ. Manag. Prop. Constr. 2013, 18, 110–127. [Google Scholar] [CrossRef]
  5. Ibrahim, Y.M.; Ibrahim, A.M.; Kabir, B. Geographic diversification, performance, and the risk profile of UK construction firms. J. Eng. Des. Technol. 2009, 7, 171–185. [Google Scholar] [CrossRef]
  6. Amit, R.; Livnat, J. Diversification strategies, business cycles and economic performance. Strateg. Manag. J. 1988, 9, 99–110. [Google Scholar] [CrossRef]
  7. Mathur, I.; Singh, M.; Gleason, K.C. Multinational diversification and corporate performance: Evidence from European firms. Eur. Financ. Manag. 2004, 10, 439–464. [Google Scholar] [CrossRef]
  8. Chakrabarti, A.; Singh, K.; Mahmood, I. Diversification and performance: Evidence from East Asian firms. Strateg. Manag. J. 2007, 28, 101–120. [Google Scholar] [CrossRef]
  9. Cheah, C.Y.J.; Garvin, M.J.; Miller, J.B. Empirical study of strategic performance of global construction firms. J. Constr. Eng. Manag. 2004, 130, 808–817. [Google Scholar] [CrossRef]
  10. Choi, J.; Russell, J.S. Long-term entropy and profitability change of United States public construction firms. J. Manag. Eng. 2005, 21, 17–26. [Google Scholar] [CrossRef]
  11. Yee, C.Y.; Cheah, C.Y.J. Fundamental analysis of profitability of large engineering and construction firms. J. Manag. Eng. 2006, 22, 203–210. [Google Scholar] [CrossRef]
  12. Yee, C.Y.; Cheah, C.Y. Interactions between business and financial strategies of large engineering and construction firms. J. Manag. Eng. 2006, 22, 148–155. [Google Scholar] [CrossRef]
  13. Kim, H.; Reinschmidt, K.F. Market structure and organizational performance of construction organizations. J. Manag. Eng. 2012, 28, 212–220. [Google Scholar] [CrossRef]
  14. Han, M.; Lee, S.; Kim, J. Effectiveness of diversification strategies for ensuring financial sustainability of construction companies in the Republic of Korea. Sustainability 2019, 11, 3076. [Google Scholar] [CrossRef]
  15. Han, S.H.; Diekmann, J.E.; Lee, Y.; Ock, J.H. Multicriteria financial portfolio risk management for international projects. J. Constr. Eng. Manag. 2004, 130, 346–356. [Google Scholar] [CrossRef]
  16. Gunhan, S.; Arditi, D. International expansion decision for construction companies. J. Constr. Eng. Manag. 2005, 131, 928–937. [Google Scholar] [CrossRef]
  17. Rumelt, R.O. Strategy, Structure and Economic Performance; Harvard University Press: Cambridge, MA, USA, 1974. [Google Scholar]
  18. Itami, H.; Kagono, T.; Yoshihara, H.; Sakuma, A. Diversification strategies and economic performance. Jpn. Econ. Stud. 1982, 11, 78–106. [Google Scholar] [CrossRef]
  19. Lecaw, D.J. Bargaining power, ownership, and profitability of transnational corporations in developing countries. J. Int. Bus. Stud. 1984, 15, 27–43. [Google Scholar] [CrossRef]
  20. Buhner, R. Assessing international diversification of West German corporations. Strateg. Manag. J. 1986, 8, 25–37. [Google Scholar] [CrossRef]
  21. Melicher, R.W.; Rush, D.F. Evidence on the acquisition-related performance of conglomerate firms. J. Financ. 1974, 29, 141–149. [Google Scholar] [CrossRef]
  22. Khanna, T.; Palepu, K. Is corporate affiliation profitable in emerging markets? An analysis of diversified Indian business groups. J. Financ. 2000, 55, 867–891. [Google Scholar] [CrossRef]
  23. Lang, L.H.P.; Stulz, R.M. Tobin’s q, corporate diversification, and firm performance. J. Polit. Econ. 1994, 102, 1248–1280. [Google Scholar] [CrossRef]
  24. Berger, P.G.; Ofek, E. Diversification’s effect on firm value. J. Financ. Econ. 1995, 37, 39–65. [Google Scholar] [CrossRef]
  25. Comment, R.; Jarrell, G.A. Corporate focus and stock returns. J. Financ. Econ. 1995, 37, 67–87. [Google Scholar] [CrossRef]
  26. Cheah, Y.J. Fundamental Analysis and Conceptual Model for Corporate Strategy in Global Engineering and Construction Markets. Ph.D. Thesis, Massachusetts Institute of Technology, Cambridge, MA, USA, 2002. [Google Scholar]
  27. Kim, H.; Reinschmidt, K.F. Diversification by the largest US contractors. Can. J. Civ. Eng. 2011, 38, 800–810. Available online: https://cdnsciencepub.com/doi/full/10.1139/l11-056 (accessed on 4 March 2025).
  28. Han, S.H.; Kim, D.Y.; Jang, H.S.; Choi, S. Strategies for contractors to sustain growth in the global construction market. Habitat Int. 2010, 34, 1–10. [Google Scholar] [CrossRef]
  29. Cheah, C.Y.J.; Kang, J.; Chew, D.A.S. Strategic analysis of large local construction firms in China. Constr. Manag. Econ. 2007, 25, 25–38. [Google Scholar] [CrossRef]
  30. Baffoe-Bonnie, J. The dynamic impact of macroeconomic aggregates on housing prices and stock of houses: A national and regional analysis. J. Real Financ. Econ. 1998, 17, 179–197. [Google Scholar] [CrossRef]
  31. Cooley, T.F.; Leroy, S.F. Atheoretical macroeconometrics: A critique. J. Monet. Econ. 1985, 16, 283–308. [Google Scholar] [CrossRef]
  32. Sims, C.A. Macroeconomics and Reality. Econometrica 1980, 48, 1–48. [Google Scholar] [CrossRef]
  33. Enders, W. Applied Econometric Time Series, 4th ed.; John Wiley & Sons: New York, NY, USA, 2015. [Google Scholar]
  34. Xu, J.; Moon, S. Stochastic forecast of construction cost index using a cointegrated vector autoregression model. J. Manag. Eng. 2013, 29, 10–18. [Google Scholar] [CrossRef]
  35. Wong, J.M.W.; Ng, S.T. Forecasting construction tender price index in Hong Kong using vector error correction model. Constr. Manag. Econ. 2010, 28, 1255–1268. [Google Scholar] [CrossRef]
  36. DeJong, D.N.; Whiteman, C.H. Reconsidering ‘trends and random walks in macroeconomic time series’. J. Monet. Econ. 1991, 28, 221–254. [Google Scholar] [CrossRef]
  37. Lean, C.S. Empirical tests to discern linkages between construction and other economic sectors in Singapore. Constr. Manag. Econ. 2001, 19, 355–363. [Google Scholar] [CrossRef]
  38. Chan, S. Responses of selected economic indicators to construction output shocks: The case of Singapore. Constr. Manag. Econ. 2002, 20, 523–533. [Google Scholar] [CrossRef]
  39. Shahandashti, S.M.; Ashuri, B. Forecasting engineering news-record construction cost index using multivariate time series models. J. Constr. Eng. Manag. 2013, 139, 1237–1243. [Google Scholar] [CrossRef]
  40. Jacquemin, A.P.; Berry, C.H. Entropy measure of diversification and corporate growth. J. Indust. Econ. 1979, 27, 359–369. [Google Scholar] [CrossRef]
  41. Van Kranenburg, H.; Hagedoorn, J.; Pennings, J. Measurement of international and product diversification in the publishing industry. J. Media Econ. 2004, 17, 87–104. [Google Scholar] [CrossRef]
  42. Granger, C.W.J.; Newbold, P. Spurious regressions in econometrics. J. Econom. 1974, 2, 111–120. [Google Scholar] [CrossRef]
  43. Engle, R.F.; Granger, C.W.J. Cointegration and error correction: Representation, estimation and testing. Econometrica 1987, 55, 251–276. [Google Scholar] [CrossRef]
  44. Boswijk, H.P. Efficient inference on cointegration parameters in structural error correction models. J. Econom. 1995, 69, 133–158. [Google Scholar] [CrossRef]
  45. Granger, C.W.J. Investigating causal relations by econometric models and cross-spectral methods. Econometrica 1969, 37, 424–438. [Google Scholar] [CrossRef]
  46. Sims, C.A. Are forecasting models usable for policy analysis? Fed. Res. Bank Minneap. Q. Rev. 1986, 10, 2–16. [Google Scholar] [CrossRef]
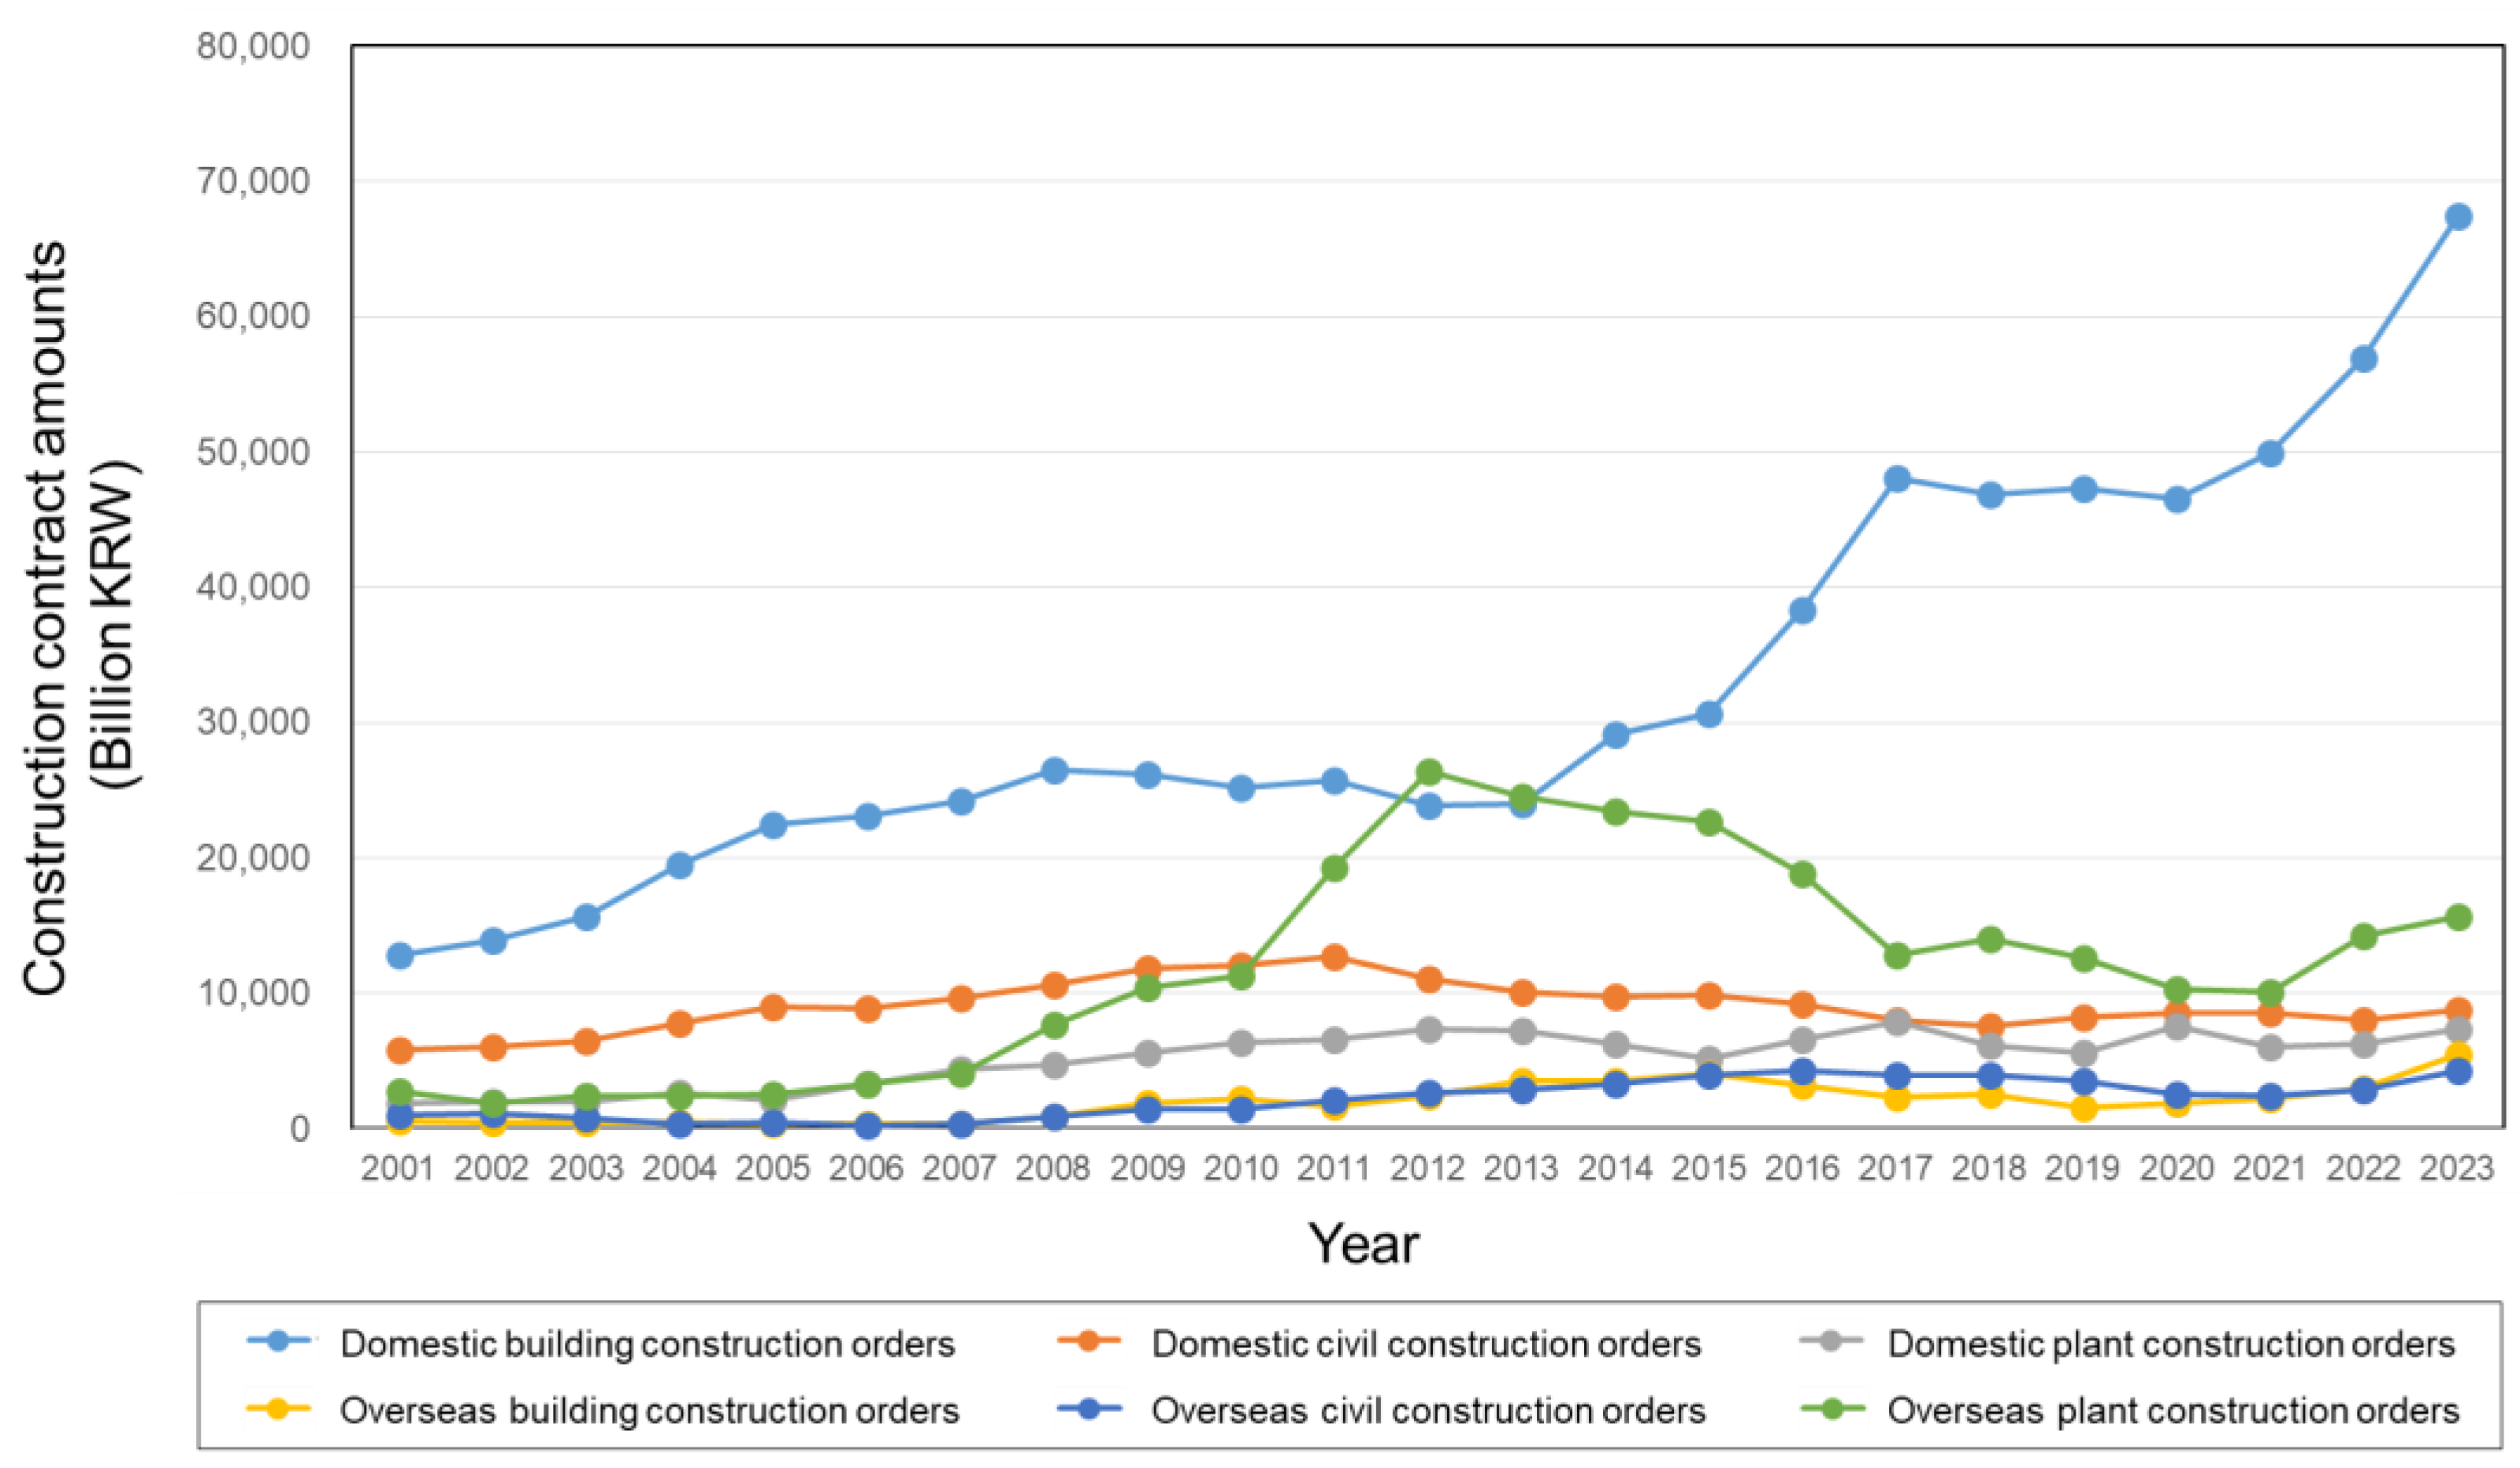
Figure 1. Trends in construction contract amounts in domestic and overseas business areas of Korean construction firms.
Buildings 15 01238 g001
Figure 2. Trends in diversification composition in domestic and overseas business areas of Korean construction firms.
Buildings 15 01238 g002
Figure 3. Impulse response graph (Model A). (a) Impulse responses of debt ratio to shocks from each variable. (b) Impulse responses of each variable to a shock in debt ratio.
Buildings 15 01238 g003
Figure 4. Impulse response graph (Model B). (a) Impulse responses of ROA to shocks from each variable. (b) Impulse responses of each variable to a shock in ROA.
Buildings 15 01238 g004
Table 1. Variables and descriptions.
VariablesDescriptionsPeriodFrequency
DRDebt ratio2002:01–2021:04Quarterly
PRReturn on assets2002:01–2021:04Quarterly
DIVDiversification index2002:01–2021:04Quarterly
DCO_BDomestic building construction orders2002:01–2021:04Quarterly
DCO_CDomestic civil construction orders2002:01–2021:04Quarterly
DCO_PDomestic plant construction orders2002:01–2021:04Quarterly
ICO_BOverseas building construction orders2002:01–2021:04Quarterly
ICO_COverseas civil construction orders2002:01–2021:04Quarterly
ICO_POverseas plant construction orders2002:01–2021:04Quarterly
Table 2. Tests for unit roots (augmented Dickey–Fuller tests).
ModelVariablesLevel1st Differencing
t-Statisticp-Valuet-Statisticp-Value
Model ADR−1.8785550.6562−10.332230.0000
DIV0.1031090.9968−10.977270.0000
DCO_B−2.2099930.4773−9.7967580.0000
DCO_C−2.3463060.4044−11.268300.0001
DCO_P−0.8941800.9510−14.047140.0001
ICO_B−2.7459490.2217−16.236120.0001
ICO_C−1.9817070.6019−15.223860.0001
ICO_P−0.1877190.9923−9.7436570.0000
Model BPR−2.0118480.5855−10.191770.0000
DIV0.1031090.9968−10.977270.0000
DCO_B−2.2099930.4773−9.7967580.0000
DCO_C−2.3463060.4044−11.268300.0001
DCO_P−0.8941800.9510−14.047140.0001
ICO_B−2.7459490.2217−16.236120.0001
ICO_C−1.9817070.6019−15.223860.0001
ICO_P−0.1877190.9923−9.7436570.0000
Note: the number of lags is selected using the Schwarz information criterion with pmax = 10.
Table 3. Lag specification results.
LagModel AModel B
0−5.9460371.505765
1−15.44402 *−6.772626 *
2−13.13306−5.149130
3−10.95312−3.501270
4−8.808585−1.465867
5−7.2234260.453622
6−6.3601152.045458
7−7.7853063.037413
Table 4. Cointegration test results.
PeriodNull HypothesisTest Statistic0.05 Critical Valuep-Value
Model Ar = 0 *161.3306134.67800.0005
r ≤ 1 *110.1466103.84730.0179
r ≤ 267.3663576.972770.2154
r ≤ 345.9789454.079040.2156
r ≤ 430.4213535.192750.1494
r ≤ 516.9276520.261840.1352
r ≤ 67.0776159.1645460.1224
Model Br = 0 *147.7874125.61540.0011
r ≤ 1 *100.039295.753660.0245
r ≤ 256.3618569.818890.3636
r ≤ 336.1887547.856130.3869
r ≤ 422.9234029.797070.2499
r ≤ 511.7937415.494710.1671
r ≤ 63.1039413.8414660.0781
* Significant at the 5% level; r is the cointegration rank.
Table 5. Results of Granger causality test.
Model AModel B
CausalityLagF-Statisticp-ValueCausalityLagF-Statisticp-Value
DIVICO_B110.15580.0021PRICO_P13.471990.0663
DIVICO_C16.040620.0163DIVICO_B110.15580.0021
ICO_PDIV17.360940.0083DIVICO_C16.040620.0163
DCO_BICO_P13.155060.0797ICO_PDIV17.360940.0083
DCO_PDCO_C14.464590.0379DCO_BICO_P13.155060.0797
DCO_CICO_B18.728970.0042DCO_PDCO_C14.464590.0379
ICO_PDCO_C15.395750.0229DCO_CICO_B18.728970.0042
DCO_PICO_B110.15290.0021ICO_PDCO_C15.395750.0229
ICO_PDCO_P14.273740.0422DCO_PICO_B110.15290.0021
ICO_PICO_C115.54220.0002ICO_PDCO_P14.273740.0422
ICO_CICO_P13.455330.0670ICO_PICO_C115.54220.0002
DRICO_C24.430510.0153ICO_CICO_P13.455330.0670
DIVICO_B25.242140.0075DCO_PPR23.093890.0514
DIVICO_C23.018080.0551DIVICO_B25.242140.0075
DCO_BDCO_C23.187120.0472DIVICO_C23.018080.0551
DCO_PDCO_C23.030690.0545DCO_BDCO_C23.187120.0472
DCO_CICO_B24.513970.0142DCO_PDCO_C23.030690.0545
DCO_PICO_B27.107350.0015DCO_CICO_B24.513970.0142
ICO_CICO_B23.861010.0255DCO_PICO_B27.107350.0015
ICO_PICO_B210.00540.0001ICO_CICO_B23.861010.0255
ICO_PICO_C29.119220.0003ICO_PICO_B210.00540.0001
ICO_CICO_P23.316510.0419ICO_PICO_C29.119220.0003
DRICO_C32.850980.0436ICO_CICO_P23.316510.0419
DIVICO_B32.766520.0483DIVICO_B32.766520.0483
ICO_BDCO_C32.261560.0890ICO_BDCO_C32.261560.0890
DCO_CICO_B32.931810.0395DCO_CICO_B32.931810.0395
DCO_PICO_B33.604470.0176DCO_PICO_B33.604470.0176
ICO_CICO_B32.833210.0445ICO_CICO_B32.833210.0445
ICO_PICO_B36.379810.0007ICO_PICO_B36.379810.0007
ICO_PICO_C37.861230.0001ICO_PICO_C37.861230.0001
Table 6. Impulse response results—Model A (→ DR).
Period
(Month)
DR
DRDIVDCO_BDCO_CDCO_PICO_BICO_CICO_P
10.0508920.000000−0.0020160.0000000.0000000.0000000.0000000.000000
20.0427550.0030380.0016680.006737−0.005882−0.0019630.004032−0.003402
30.0463040.0009620.0031230.005110−0.003791−0.0060370.0022760.000526
40.0475300.0006620.0036760.005993−0.005202−0.0058910.0037960.000135
50.0478320.0008380.0039450.006305−0.004938−0.0071590.0033750.000528
60.0483020.0003440.0043670.006319−0.005173−0.0072980.0037510.000828
70.0485020.0005150.0043700.006488−0.005169−0.0076670.0037030.000847
80.0486110.0003310.0045360.006490−0.005244−0.0077330.0037760.000979
90.0487050.0003780.0045430.006553−0.005230−0.0078670.0037930.000976
100.0487370.0003240.0045960.006547−0.005267−0.0078860.0038020.001032
Table 7. Impulse response results—Model A (DR →).
Period
(Month)
DR
DRDIVDCO_BDCO_CDCO_PICO_BICO_CICO_P
10.0508920.0055800.0000000.0027630.0363380.0471970.034140−0.000296
20.0427550.006071−0.002237−0.0045210.0276680.0511440.0515860.015930
30.0463040.010246−0.010698−0.0055110.0371890.0950630.0913100.022307
40.0475300.010762−0.014480−0.0076770.0298280.1095950.0938080.028653
50.0478320.012241−0.017287−0.0075100.0339280.1162970.1083800.033315
60.0483020.012516−0.018424−0.0081760.0318880.1272400.1115090.035219
70.0485020.012973−0.019628−0.0081450.0328600.1271880.1146440.036789
80.0486110.013125−0.019962−0.0083910.0323440.1320670.1170050.037662
90.0487050.013255−0.020393−0.0083480.0326420.1316360.1175890.038105
100.0487370.013325−0.020524−0.0084630.0324530.1335790.1185630.038460
Table 8. Impulse response results—Model B (→ PR).
Period
(Month)
PR
PRDIVDCO_BDCO_CDCO_PICO_BICO_CICO_P
10.2227580.0000000.0350120.0000000.0000000.0000000.0000000.000000
20.0361330.0106440.025964−0.0007680.053076−0.023279−0.040405−0.015088
30.031585−0.0412200.045891−0.009096−0.015942−0.020071−0.017068−0.001430
40.039321−0.0142200.034549−0.011945−0.000192−0.021616−0.024343−0.038518
50.018267−0.0280190.045099−0.0146860.004508−0.026766−0.022881−0.033166
60.016062−0.0274290.043094−0.017035−0.006083−0.026115−0.023120−0.034691
70.016301−0.0272420.043924−0.016761−0.002763−0.026752−0.022967−0.039935
80.012856−0.0281090.044696−0.017838−0.003127−0.027428−0.023002−0.039195
90.012578−0.0283990.044673−0.017951−0.004290−0.027449−0.023074−0.039813
100.012315−0.0283470.044805−0.018077−0.003932−0.027530−0.022968−0.040535
Table 9. Impulse response results—Model B (PR →).
Period
(Month)
PR
PRDIVDCO_BDCO_CDCO_PICO_BICO_CICO_P
10.222758−0.0020710.0000000.012782−0.001137−0.056046−0.0463580.038986
20.036133−0.002657−0.0045230.005952−0.007682−0.056753−0.0671850.035159
30.031585−0.000840−0.0062560.0112100.019165−0.040903−0.0815030.056425
40.0393210.000907−0.0094980.0121540.016843−0.011493−0.0524830.061903
50.0182670.000248−0.0105210.0120800.016115−0.022211−0.0717690.063549
60.0160620.001096−0.0110450.0128770.020568−0.012658−0.0630580.067397
70.0163010.001081−0.0115110.0130380.019863−0.010784−0.0639970.068161
80.0128560.001156−0.0117820.0130930.020291−0.011166−0.0647060.068776
90.0125780.001231−0.0118450.0132060.020747−0.009658−0.0640010.069375
100.0123150.001256−0.0119620.0132510.020782−0.009514−0.0640620.069543
Disclaimer/Publisher’s Note: The statements, opinions and data contained in all publications are solely those of the individual author(s) and contributor(s) and not of MDPI and/or the editor(s). MDPI and/or the editor(s) disclaim responsibility for any injury to people or property resulting from any ideas, methods, instructions or products referred to in the content.