Abstract
The integration of photovoltaic (PV) systems in buildings is crucial for reducing reliance on conventional energy sources while promoting sustainability. This study evaluates and compares three energy generation systems: rooftop PV, building-integrated photovoltaics (BIPV), and a hybrid combination of both. The analysis covers energy production, economic feasibility through the levelized cost of electricity (LCOE), and environmental impact by assessing unreleased carbon dioxide (UCD). A residential building in Kerman, Iran, serves as the case study. The results indicate that rooftop PV exhibits the lowest LCOE at USD 0.023/kWh, while BIPV has a higher LCOE of USD 0.077/kWh due to installation complexities. The hybrid system, combining both technologies, achieves a balance with an LCOE of USD 0.05/kWh while maximizing energy generation at 16.2 MWh annually. Additionally, the hybrid system reduces CO2 emissions by 9.7 tons per year, surpassing the standalone rooftop PV (5.0 tons) and BIPV (4.7 tons). The findings highlight the synergistic benefits of integrating both PV systems, ensuring higher self-sufficiency and enhanced environmental impact. This research underscores the necessity of comprehensive urban energy planning to optimize renewable energy utilization and accelerate the transition toward zero-energy buildings.
1. Introduction
The demand for electrical energy in buildings has surged in recent decades due to rapid urbanization, population growth, and the increasing reliance on electrical appliances [1,2]. Modern buildings require continuous and reliable power to support daily operations, from lighting and climate control to communication and security systems [3,4]. With rising electricity consumption, conventional energy sources, primarily fossil fuels, struggle to meet demand while contributing to environmental issues, such as air pollution and greenhouse gas emissions [5,6]. The urgent need for sustainable, cost-effective, and resilient energy solutions has driven the transition towards renewable energy technologies, particularly for on-site power generation in residential, commercial, and industrial buildings [7,8,9].
Among the various renewable energy solutions, photovoltaic (PV) systems have emerged as a leading contender due to their scalability, reliability, and decreasing costs. Rooftop PV systems are widely deployed on buildings to harness solar energy without requiring additional land, making them an efficient solution for urban energy needs [10,11]. Building-integrated photovoltaics (BIPV), an advanced form of PV application, seamlessly integrates solar panels into building facades, roofs, windows, and shading devices, serving a dual function as both an architectural element and an energy source [12]. Compared to conventional rooftop PV, BIPV enhances the aesthetic, thermal performance, and structural performance of buildings while generating clean electricity [13,14,15].
This study aims to bridge the gap between economic feasibility and energy efficiency by comparing rooftop PV, BIPV, and their combination from a technical, economic, and environmental perspective [16]. While rooftop PV has proven to be a viable solution for decentralized power generation, BIPV offers additional benefits that extend beyond electricity production [17]. The studies conducted on these issues are given below.
The studies conducted fall into two categories. In the first category, rooftop photovoltaic systems were investigated. Antoniolli et al. [18] applied business intelligence techniques to assess the energy performance of 1250 rooftop PV systems in Santa Catarina, Brazil. Daily energy yield ranged from 3.35 kWh·(kWp)−1 to 3.90 kWh·(kWp)−1 based on solar irradiation. The average annual PV generation per system was 3353 kWh, reducing CO2 emissions by 268.25 kg annually per unit, totaling 335.3 tons avoiding CO2 emissions. The study demonstrates that combining data analytics with technical modeling can optimize PV performance and inform future distributed generation planning. Zublie et al. [19] examined the economic and environmental advantages of a 688 kW rooftop solar PV system at Politeknik Sultan Azlan Shah, Malaysia, under the NEM 3.0 program. Over 20 years, the system is expected to generate up to 990.7 MWh annually, resulting in reducing carbon emissions by 14,559.76 tons of CO2, equivalent to saving 363,994 trees. The research highlighted solar PV’s potential to cut energy costs and support sustainability in educational institutions. Alnaser [20] evaluated the performance of a 7.8 kW rooftop PV system in Bahrain over two years. The highest monthly electricity generation was 1228.9 kWh (August 2018), and the lowest was 728.16 kWh (December 2019). The system’s annual average daily specific yield was 4.13 kWh·(kWp)−1, with a peak of 6.12 kWh·(kWp)−1 in April 2019. The performance ratio averaged 73.0% in 2019, showing high efficiency. Self-sufficiency ranged from 15.3% to 50.7%, averaging 28.6% in 2019. The PV system reduced CO2 emissions by 39.0% (4.637 tons annually) and saved 38,567 ft3 of natural gas yearly. Muttaqi et al. [21] examined the use of ripple injection load control signals to manage EV charging loads within PV distribution grids. Findings showed that audio frequency injection control (AFIC) signals effectively handled load fluctuations, maintaining grid stability with high solar PV and EV charging station penetration. The multimode energy management algorithm optimally adjusted EV charging rates, reducing grid congestion and overloading risks. Power flow simulations confirmed enhanced voltage stability, transformer protection, and support for peak shaving strategies. This approach used existing infrastructure, making it a cost-effective alternative for areas without smart grid technologies.
Zhu et al. [22] assessed the feasibility of rooftop PV installations at three Chinese universities, focusing on technical capacity, economic viability, and energy output. Tibet University has the highest PV potential at 11,291 kW, followed by Qinghai University (9102 kW), and Qilu University of Technology (3821 kW), with annual electricity productions of 28.19 GWh, 18.03 GWh, and 5.36 GWh, respectively. Tibet University achieved a 208% return on investment with a one-year payback period. The study confirmed that university rooftops are valuable for renewable energy deployment, offering cost savings and emission reductions. Khan et al. [23] assessed the performance of an 81.9 kWp grid-connected PV system on an academic building over 12 months. The highest yield of 4.5 kWh·(kW)−1 per day occurred in April, while November had the lowest at 2.4 kWh/kW/day. The annual average efficiency was 12.8%, peaking at 13.1% in July. Temperature and solar irradiance significantly affected performance, with a drop to 12.6% in May due to overheating. PVsyst simulations confirmed these trends, highlighting the need to consider seasonal variations in energy planning. Abdullah et al. [24] compared the performance of three PV technologies—monocrystalline, polycrystalline, and HIT (Heterojunction with Intrinsic Thin-layer) modules—installed in Selangor, Malaysia. HIT modules showed the highest performance ratio at 81%, surpassing monocrystalline and polycrystalline modules. Yearly energy generation, efficiency losses, and payback periods were assessed using PVsyst simulations. HIT modules had the lowest energy losses and highest electricity output, proving their superior efficiency in tropical climates. Economic analysis indicated that HIT modules reduced the system’s payback period, making them a cost-effective long-term investment. The research underscored the importance of choosing high-efficiency panels for improved financial returns and stable power generation.
Kabalci et al. [25] designed a dual buck converter system to regulate PV string inputs, enhancing the dc–bus interface for a grid-tie inverter powered by four PV arrays. Improved MPPT controllers with PI control managed dual arrays, adhering to standards (1.2 kWp per array, 4.8 kWp total). The system ensured stable operation under varying levels of irradiation.
In the other category, BIPV systems were investigated. Lin et al. [26] aimed to optimize BIPV, Trombe walls, and phase change materials (PCM) to improve building performance regarding life cycle cost (LCC) and thermal comfort. Using 34 design parameters, Monte Carlo simulations, artificial neural networks, and stepwise linear regression, the study identified the Strength Pareto Evolutionary Algorithm II as the most effective optimization method. The optimal design reduced LCC by 45.51% and enhanced comfort by 43.81% compared to a reference building. BioPCM M182/Q21 was highlighted as the best PCM, with ideal temperature setpoints at 18 °C and 24 °C for heating and cooling, respectively. Gholami et al. [27] assessed the economic potential of BIPV by determining the levelized cost of electricity (LCOE) in European countries. The results showed that BIPV’s LCOE is competitive as a power generator and also when serving as building material. With the European electricity average at a higher rate, BIPV proved to be cost-competitive, achieving grid parity without subsidies. The study suggested that feed-in tariffs are redundant if electricity can be sold at grid prices and explored incentive structures to boost BIPV’s economic appeal. Unlike rooftop PV, BIPV maximizes energy in urban areas and enhances both building design and renewable energy.
Bhattacharya et al. [28] evaluated four array configurations—Series-Parallel, Total-Cross-Tied, Triple-Tied, and Quarter-Tied—used to reduce shading effects and maximize the energy output of BIPV. A BIPV array was analyzed under four shading scenarios using a sophisticated BIPV array design algorithm. The Quarter-Tied configuration outperformed the traditional SP arrangement, boosting maximum power output by 8.43% and reducing wiring complexity by 10.45% compared to Total-Cross-Tied. Mismatch losses were reduced to 34.10%, and the fill factor improved to 48.49%, highlighting the significance of interconnecting strategies in optimizing BIPV performance. This study showed that the right BIPV array configuration can significantly enhance energy yield in urban environments where shading is prevalent. Integrating adaptive power electronics and optimizing BIPV interconnections can result in more reliable and efficient urban solar energy solutions. Skandalos and Karamanis [29] analyzed semi-transparent photovoltaics (STPV) and PV shading devices (PVSD) as window-integrated BIPV solutions, examining their effect on electricity production, energy efficiency, and indoor comfort in three climate zones. They introduced a BIPV-flexibility index to evaluate energy performance. The results showed that opaque PV modules are ideal for cold climates, PVSDs excel in moderate regions, and semi-transparent PV windows perform best in hot climates. BIPV windows can save up to 43% in total energy, enhance thermal and visual comfort, and support zero-energy buildings. The study emphasized BIPV windows’ role in passive and active strategies and calls for further research on innovative materials and shading technologies. Samarasinghalage et al. [30] used multi-objective optimization (MOO) to enhance BIPV envelope design by reducing life cycle energy (LCE) and LCC across various BIPV product applications. The MOO framework generates multiple optimal design alternatives, aiding early-stage decision-making. It highlights that different BIPV configurations, like canopy, roof sheet, and cladding, offer unique energy and cost benefits. However, MOO’s effectiveness in mid-stage design is limited by client preferences, architectural constraints, and subjective choices. The study concluded that a flexible BIPV optimization approach is crucial to balance technical feasibility with client-driven requirements, considering aesthetic, financial, and structural factors. Li et al. [31] assessed a grid-connected system with BIPV, battery storage, and electric vehicles (EVs) for gymnasium buildings. The findings showed that a properly sized PV-battery system can supply 95% of the gym’s energy needs, with battery capacity being 2.7-times the daily average energy demand. By analyzing different EV charging strategies, the study found that optimized charging reduced peak grid power by 51.7% compared to constant power charging. When PV generation was 1.4-times the building’s demand and battery storage was 66% of daily energy needs, grid dependence was minimized. Gonçalves et al. [32] evaluated various numerical models used for predicting BIPV energy generation, from detailed physics-based simulations to simplified empirical methods. The multi-physics BIPV model showed an average daily energy yield prediction error of 6.2%, which decreased to 2.0% on clear sky days. Switching to a linear power model increased the error to 8.7%, while empirical temperature models raised it above 10%. For module temperature prediction, the physics-based model had a margin of 1.74 °C, while empirical methods deviated by over 4 °C. Ko et al. [33] explored the integration of thermoelectric generators (TEGs) and PCMs with BIPV systems to enhance thermal management and energy generation. The simulations showed that the hybrid system increased annual energy production by 1.09% compared to conventional BIPV systems. Seasonally, it improved output by 0.91% in spring, −1.32% in summer, 2.25% in autumn, and 3.16% in winter. The lower summer efficiency was due to heat accumulation affecting thermoelectric performance. The study predicted up to 4.47% more energy with optimal thermal configuration, emphasizing the potential of hybrid BIPV systems, especially in moderate and cold climates. However, summer overheating needs better heat dissipation strategies.
In previous studies, research on photovoltaic (PV) systems has primarily been divided into two categories: rooftop PV and building-integrated photovoltaic (BIPV) systems. These studies have examined each system separately, analyzing them from various perspectives. However, a critical gap remains in the literature, as these systems have not been comprehensively compared, and the feasibility of simultaneous energy production from multiple systems has not been thoroughly investigated. Therefore, this study addresses this gap by introducing the following innovative contributions:
- We investigate simultaneous energy production from both rooftop PV and BIPV systems, evaluating the feasibility and benefits of integrating these systems for enhanced energy generation.
- We compare three energy generation systems (standalone rooftop PV, standalone BIPV, and a hybrid system combining both) from energy, economic, and environmental perspectives. The evaluation criteria include the amount of electrical energy production, levelized cost of energy (LCOE), and the reduction of carbon dioxide emissions.
Furthermore, this study applies this comparative framework to a residential building in Kerman, Iran—a region with high solar energy potential but one that is underexplored in the literature. By addressing the unique climatic, economic, and technical conditions of this location, this study provides actionable insights for promoting sustainability in similar regions. This work is particularly relevant, as Iran is increasingly turning to solar energy to address energy imbalances and achieve sustainable development goals. Identifying the best energy, economic, and environmental (3E) alternative for regions like Kerman is crucial for advancing renewable energy adoption and meeting future energy demands.
2. Methods
This section of the study discusses the case study, along with the energy, economic, and environmental modeling of the building.
2.1. Case Study
To clarify the modeling approach, it is necessary to introduce the city under study and the building under study. The building under investigation in this study is a residential building with four floors with two units on each floor. Additionally, the data of the deuterium can be seen in Table 1.

Table 1.
Overall heat transfer coefficient values [34].
The city under study is Kerman, Iran. This city is located in the solar belt of Iran and has high potential in the field of solar energy. To ensure a robust analysis reflecting long-term climatic conditions, Typical Meteorological Year 3 (TMY3) data were used. The TMY3 dataset is constructed by selecting the most representative months from multiple years of historical weather data, combining them to form a single “typical” year that reflects the statistical characteristics of the local climate over a period of typically 20–30 years [35,36,37].
By using TMY3 data, the variability and trends of weather conditions over an extended period are captured, ensuring that the results are representative of long-term performance. Kerman’s climate information, derived from the TMY3 dataset, is presented in Table 2.
Table 2.
Weather specification of Kerman.
Figure 1 shows the monthly radiation throughout the year. The radiation is higher in the warmer months of the year. June shows the highest GHI of the year, with a value of 320 W·m−2, and May shows the highest DHI of 101 W·m−2. The lowest radiation is in December, with GHI and DHI values of 141 and 46 W·m−2, respectively.
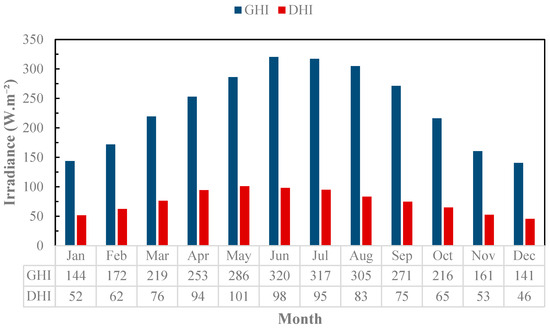
Figure 1.
Monthly GHI and DHI.
2.2. Energy Model
To model the energy part of a solar system, it is first necessary to determine the radiation received on the front side. A rooftop photovoltaic system is installed at an optimal angle, which is considered equal to the latitude. However, BIPV is installed at a 90-degree angle, which requires the radiation received on the side to be determined. Equation (1) is used to calculate the radiation [38]:
where and DHI are global and diffuse horizontal irradiance. is tilt angle, and is ground albedo. is calculated through Equation (2) [39]:
where , , and are incident, zenith, and hour angle. Equations (3)–(5) are used to calculate these three solar angles [40,41]:
where and are latitude and apparent solar time. is the declination angle, which is calculated by Equation (6) [42]:
Once the method of calculating the received radiation is determined, the next step is to calculate the temperature of the two systems under study. The two systems under study consist of five layers, and the equations governing each of the five layers are given below. The equation governing the energy of the glass layer as the first layer of a solar system is given in Equation (7):
where , , , and T are thickness, area, density, and temperature. Additionally, is absorptivity. Similar to the glass layer, energy equations are written for the other three layers, as shown in Equations (8)–(10) [43]:
where is transmittivity. The governing equation in the last layer, the Tedlar, in the photovoltaic system is calculated according to Equation (11):
Given that, in the BIPV system, there is a building behind the Tedlar layer, the equation changes, which is given in Equation (12) [44]:
To calculate the temperature of different layers, it is necessary to determine the different heat transfer rates in the layers, which are calculated using Equations (13)–(15) [45]:
where R is thermal resistance. These resistances are calculated for each type of heat transfer according to Equations (16)–(18) [46]:
where is thermal conductivity. is wind velocity. and are the Stefan–Boltzmann constant and emissivity value, respectively. Once the method of calculating the temperature of the different layers is determined, the next step is to calculate the power output of the solar system. Equation (19) is used to calculate the power output [47]:
where is efficiency, and is temperature coefficient of power. Additionally, is reference condition. The thickness of the layers used in this modeling is given in Table 3.
Table 3.
Thickness of the layers (mm) [48].
2.3. Economic Model
To compare the two systems under study, rooftop PV and BIPV, they are compared from an economic perspective. The economic analysis considered is the levelized cost of electricity (LCOE) that was examined. The calculation of the LCOE is given in Equation (20) [49,50]:
where is present worth, PC is purchase cost, and O&M is operating and maintenance. Additionally, PE is produced Electricity during a year. The method of calculating the present worth related to the purchase cost is calculated according to Equation (21):
Additionally, the method of calculating the present worth related to the operating and maintenance cost is calculated according to Equation (21):
where is the cost of operating and maintenance, which is equal to a percentage of purchase costs, which in this study is considered to be 2%. N and are life of the system and discount rate, respectively.
2.4. Environmental Model
The environmental analysis studied is the unreleased carbon dioxide (UCD) due to the use of renewable energy. When power is produced from thermal power plants, some carbon dioxide is released, but when renewable energy is used, this amount of carbon dioxide is not released [51]. The calculation of unreleased carbon dioxide is given in Equation (23) [52,53]:
where RCD is released carbon dioxide in thermal power plants, which is equal to 0.58 kg·kWh−1.
3. Results
The results extracted by the modeling mentioned in the validation sections and the results obtained from photovoltaic, BIPV, and the simultaneous use of both systems are stated.
3.1. Validation
The results extracted by the two rooftop PV and BIPV power generation systems were compared using two sets of experimental data in the studies. The PV system was compared to the study of Shahvardian et al. [54]. The experimental data of this study were used for validation, and the validation results are given in Figure 2a. The photovoltaic system considered for validation is a 320 W monocrystalline panel with dimensions of 1956 × 992 mm. Additionally, the reference efficiency of this panel is 19.2%. The experimental work was carried out in July. The difference between the reference experimental data and the modeling data is 4%, which is acceptable.
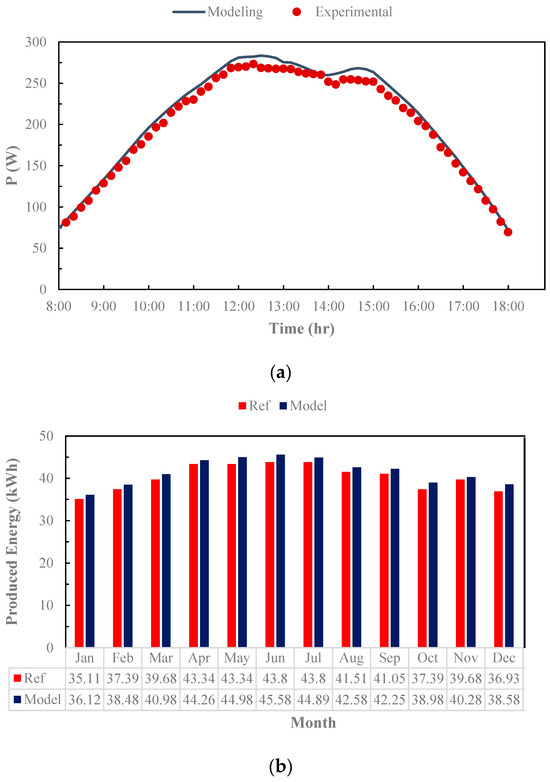
Figure 2.
Validation of the systems under study: (a) PV; (b) BIPV.
The study of Hosseinzadeh et al. [55] was also used for validation of the BIPV system. The results obtained from the validation are given in Figure 2b. The BIPV system considered for validation is located in Mashhad, Iran. In this study, a 5.2 kW system was tested, which consists of a 1 kW system and 16 polycrystalline modules. The difference between the modeling and the experimental data was 2.36%, which is acceptable. Consequently, the validation results show the correctness of the modeling.
3.2. Model Results
This section presents the findings from the mathematical modeling. The results are categorized into rooftop PV, BIPV, and both systems, each discussed separately.
3.2.1. Rooftop PV
Figure 3 illustrates the hourly variation in electrical energy generation from the rooftop PV system over a typical day. The energy output follows a characteristic bell-shaped curve, peaking at midday when the solar irradiance is at its highest and tapering off in the early morning and late afternoon. The maximum recorded power output is 4.92 kWh at peak sunlight hours, while the minimum energy generation is 0 kWh during nighttime. This pattern is consistent with solar PV behavior, as energy production is directly influenced by the sun’s position and atmospheric conditions. Notably, deviations from the ideal smooth curve can be attributed to transient weather conditions, such as cloud cover, which temporarily reduce solar irradiance and, consequently, PV output. Additionally, the amount of electrical energy in summer is greater than the energy produced in winter because the amount of radiation received is higher due to installation at an optimal angle. Additionally, as is clear, the amount of energy produced in the warm months of the year is greater than the amount of energy produced in the cold months of the year, which is due to the higher amount of radiation received by the solar system in the warm months of the year compared to the cold months of the year. For example, on January 15th at 1:00 PM, the amount of energy produced was 0.85 kWh, but on August 15th at 1:00 PM, the amount of energy produced was 3.03 kWh.
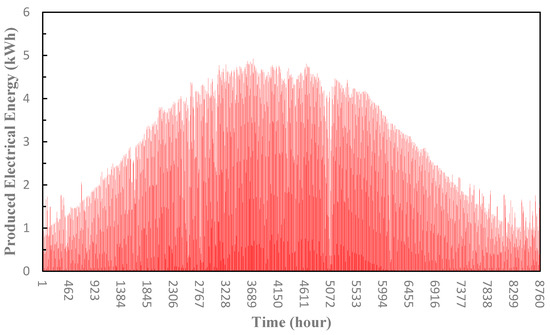
Figure 3.
Hourly energy produced by the rooftop PV.
Figure 4 presents the monthly cumulative energy generation of the rooftop PV system over a year. The data indicate that the highest energy production occurs in June, reaching approximately 1157.5 kWh, while the lowest production is observed in December at 216.2 kWh. Seasonal variations in solar radiation and day length significantly influence PV output. Longer summer days and higher solar irradiance contribute to increased power generation, while winter months exhibit reduced output due to shorter days and lower irradiance angles. This information is critical for designing energy storage solutions and grid integration strategies for rooftop PV systems. Understanding these patterns helps in optimizing panel orientation and tilt, improving overall efficiency. Additionally, it aids in planning and implementing effective energy storage and distribution systems to ensure a consistent energy supply year-round. As a result, in the warm months of the year, such as June, May, and July, the amount of energy produced is the highest, but in the cold months of the year, such as December, January, and November, the amount of energy produced is the lowest.
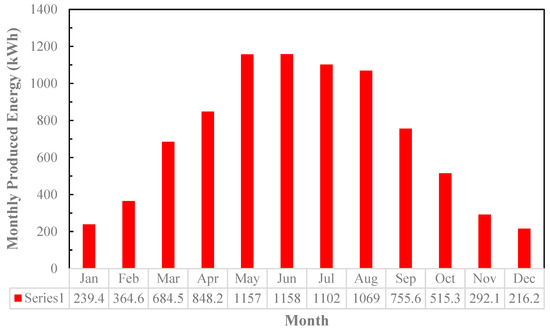
Figure 4.
Monthly energy produced by the rooftop PV.
Figure 5 illustrates the monthly reduction in CO2 emissions achieved through the utilization of a rooftop PV system. The maximum reduction occurs in June, reaching 692.2 kg of CO2, whereas the lowest recorded value is approximately 129.3 kg in December. This reduction was calculated based on the avoided emissions from conventional thermal power plants, typically producing 0.58 kg of CO2 per kWh. The UCD values directly correspond to PV energy generation trends, reaffirming the environmental benefits of solar power in mitigating greenhouse gas emissions. As a result, in the warm months of the year when energy production is higher, such as June, May, and July, the reduction in carbon dioxide emissions is also the greatest, but in the cold months of the year, such as December, January, and November, when energy production is low, the reduction in carbon dioxide is also the least. For this reason, the carbon dioxide reduction in June was 5.35-times greater than in December.
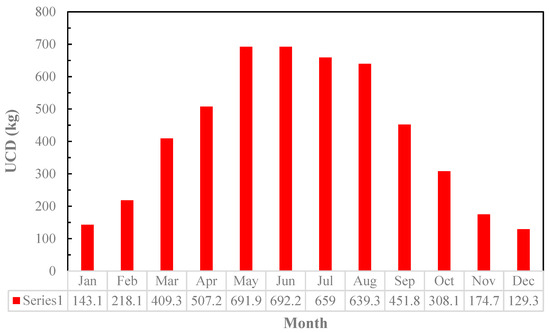
Figure 5.
Monthly UCD by the rooftop PV.
3.2.2. BIPV System
Figure 6 presents the hourly energy generation profile of the BIPV system over a typical day. The energy output follows a gradual increase in the morning, peaks around midday, and decreases toward the evening, aligning with solar irradiance patterns. Unlike the rooftop system, the BIPV system produces higher electrical energy in the morning and afternoon because the radiation is inclined and the BIPV system is installed vertically. In the maximum state, the electrical energy produced was 7.65 kWh. Even though the power output was higher than the rooftop system at certain times, the rooftop system produced more energy overall. Additionally, the energy production of this system is different in summer and winter compared to the rooftop system. In summer, the rooftop system produces more power, while in the BIPV system, the energy production is higher in winter due to oblique radiation. The photovoltaic system had a large difference in the amount of electrical energy produced in the summer months compared to the cold months of the year, but in the BIPV system, this difference was reduced; however, the energy produced was still higher in the warmer months of the year, which is explained below. For example, on 15 January at 1:00 PM the amount of energy produced was 1.47 kWh, but on 15 August at 1:00 PM, the amount of energy produced was 4.00 kWh.
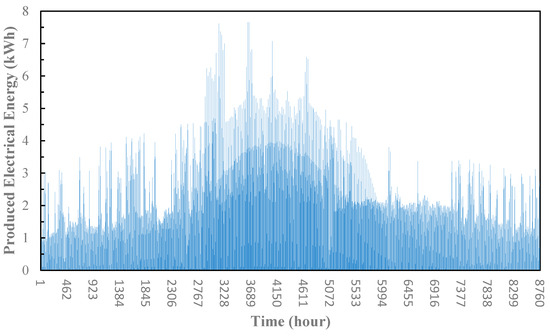
Figure 6.
Hourly energy produced by the BIPV system.
Figure 7 shows the monthly energy production of the BIPV system across an entire year. The highest energy production occurred in June, reaching approximately 1090.6 kWh, while the lowest production was recorded in January, with only 347.4 kWh. The variation in output followed the expected seasonal changes in solar irradiance, with longer summer days contributing to greater BIPV output and shorter winter days leading to decreased energy generation. Unlike rooftop PV, BIPV panels are more susceptible to variations in orientation and shading, leading to a less significant seasonal fluctuation. While rooftop PV systems typically demonstrate a sharp drop in efficiency during winter months, BIPV systems, particularly vertically integrated panels, can still capture a reasonable amount of diffuse sunlight, making them relatively more stable in terms of production. However, their overall efficiency remains lower than optimally tilted rooftop PV panels. As a result, these systems produce more energy in winter compared to PV systems, but in summer, these systems produce less power due to more vertical solar radiation.
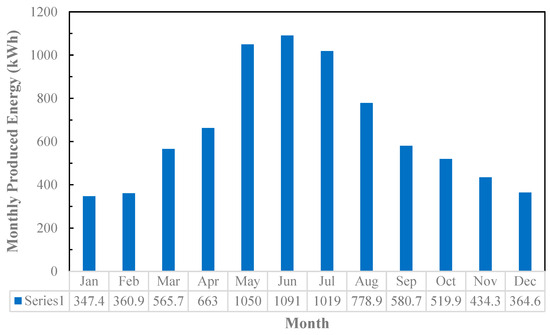
Figure 7.
Monthly energy produced by the BIPV.
Figure 8 quantifies the monthly reduction in CO2 emissions achieved through the BIPV system. The maximum recorded UCD occurred in June, reaching 652.2 kg of CO2, while the lowest reduction was observed in January at 207.8 kg of CO2. The overall trend closely mirrors the monthly energy generation pattern of Figure 7, indicating a direct relationship between solar energy production and carbon emission reduction. However, while the BIPV system significantly reduced CO2 emissions, its overall impact was still less than rooftop PV, as observed in previous figures. This is due to lower energy production efficiency. To maximize CO2 savings, a hybrid system combining BIPV with rooftop PV and energy storage would be a more effective approach. As a result, in the warm months of the year when energy production is higher, such as June, May, and July, the reduction in carbon dioxide emissions was also the greatest, but in the cold months of the year, such as January, February, and December when energy production is low, the reduction in carbon dioxide was also the least. For this reason, the carbon dioxide reduction in June was 3.14-times greater than in January.
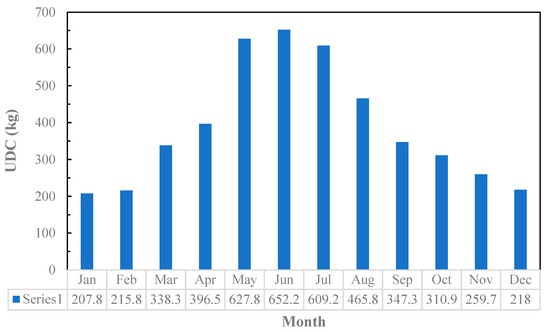
Figure 8.
Monthly UCD by the BIPV.
3.2.3. Rooftop PV and BIPV System
Figure 9 represents the total hourly energy production when rooftop PV and BIPV systems were combined. The combined system achieved a peak power generation of 9.61 kWh, which was significantly higher than either system operating independently. The integration of both technologies helped mitigate power fluctuations, ensuring more stable and reliable solar generation. A key observation from Figure 9 is the smoother and more extended peak generation period compared to standalone PV systems. This is due to the complementary nature of the BIPV and rooftop PV systems. While rooftop PV peaks sharply at noon, BIPV extends the power generation toward morning and evening hours due to vertical orientation and diffuse sunlight collection. This results in a more uniform energy distribution, improving self-consumption rates and reducing dependence on battery storage or grid imports. Another important trend is the increased reliability in cloudy conditions. Since BIPV captures diffuse radiation more effectively than rooftop PV, a combined system can still maintain reasonable energy production levels even under partially shaded or overcast conditions. This is crucial for improving energy resilience in urban environments with variable weather patterns. In this combined system, the energy produced in the warm months is greater than in the cold months of the year. For example, on 15 January at 1:00 PM the amount of energy produced was 2.32 kWh, but on 15 August at 1:00 PM the amount of energy produced was 7.03 kWh.
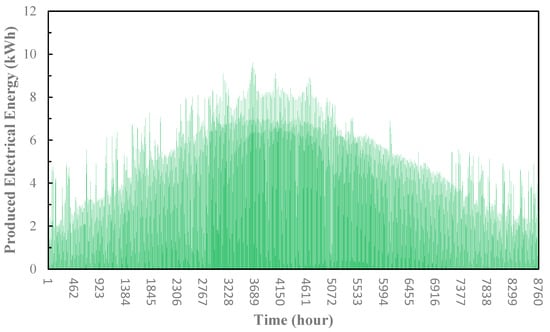
Figure 9.
Hourly energy produced by both systems.
Figure 10 highlights the cumulative monthly energy production of both rooftop PV and BIPV systems. The maximum combined energy production was observed in June, reaching 2248.1 kWh, while the lowest generation occurred in December, with 580.8 kWh. This substantial increase compared to standalone systems demonstrates the synergistic effect of combining rooftop PV and BIPV technologies. By utilizing both rooftop and BIPV system, solar capture was maximized throughout the year, leading to higher overall energy yield and greater building energy self-sufficiency. It is also worth noting that the combined system achieved a more balanced seasonal energy profile compared to a single PV installation. This is particularly beneficial in grid-connected applications, as it allows for more predictable energy exports and better grid stability. The three months with the highest energy production were June, May, and July, and the three months with the lowest energy production were December, January, and February.
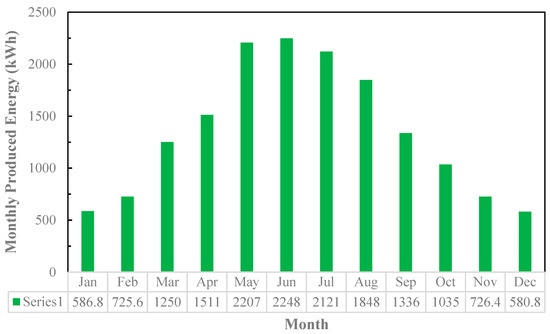
Figure 10.
Monthly energy amounts produced by both systems.
Figure 11 presents the total CO2 emission reduction achieved by the hybrid PV system. The maximum UCD value was recorded in June at 1344.4 kg of CO2, while the minimum value was observed in December at 347.3 kg. The combined reduction in CO2 emissions aligns with the enhanced energy generation observed in Figure 8. This highlights the importance of integrating multiple renewable energy sources to maximize sustainability benefits and reduce dependence on fossil fuel-based electricity generation. As a result, in the warm months of the year when energy production was higher, such as June, May, and July, the reduction in carbon dioxide emissions was also the greatest, but in the cold months of the year, such as January, February, and December when energy production was low, the reduction in carbon dioxide was also the lowest. For this reason, the carbon dioxide reduction in June was 3.87-times greater than that in December.
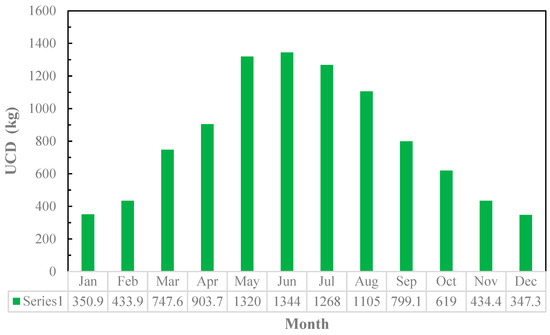
Figure 11.
Monthly UCD by both systems.
3.2.4. Comparison of the Systems
The following is a comparison of the three scenarios studied. Figure 12 provides a comparative analysis of the total energy output from rooftop PV, BIPV, and the combination of both systems over a year, revealing that the hybrid system generated the most electricity with an annual total of 16.2 MWh, compared to 8.4 MWh for standalone rooftop PV and 7.8 MWh for standalone BIPV. This superior performance is due to the complementary nature of the two systems; rooftop PV panels, typically installed at an optimal tilt angle, maximize energy capture during peak sunlight hours when the sun is directly overhead, while BIPV systems, integrated into building facades or windows, utilize vertical surfaces to capture diffuse and reflected sunlight during early morning, late afternoon, and even on cloudy days, when rooftop panels are less effective. Additionally, the hybrid system addresses space constraints in urban environments by making use of both horizontal (rooftop) and vertical (BIPV) surfaces, allowing for greater flexibility in energy planning without requiring additional land. The findings emphasize the importance of holistic urban energy planning, where integrated solutions like the hybrid system can maximize renewable energy generation while overcoming architectural and spatial limitations, ultimately contributing to more sustainable and efficient energy systems in cities.
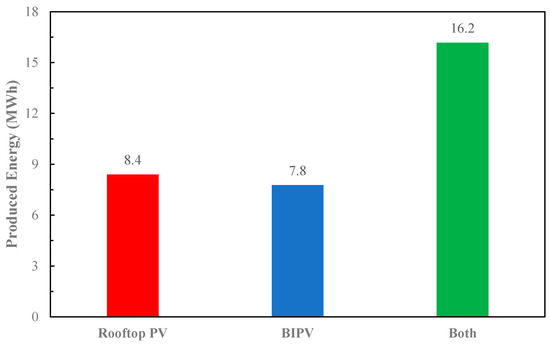
Figure 12.
Annual generated energy.
Figure 13 illustrates the percentage of a building’s energy demand met by the different systems, showing that, while rooftop PV and BIPV independently contribute to meeting building loads (22.7% and 21%, respectively), the combination of both provides the highest coverage at 43.7%. This enhanced self-sufficiency is achieved by leveraging the complementary energy generation patterns of rooftop PV, which excels during peak sunlight hours, and BIPV, which captures energy from vertical surfaces during non-peak periods. Furthermore, integrating energy storage solutions with these PV systems can significantly increase resilience by storing excess energy for use during low-generation periods, thereby reducing dependency on the grid and advancing toward a more sustainable and reliable energy supply.
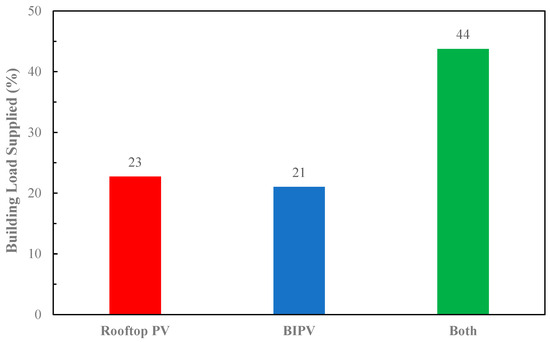
Figure 13.
Building load supplied.
Figure 14 compares the LCOE for rooftop PV, BIPV, and the combined system, revealing that the rooftop PV system achieved the lowest LCOE at USD 0.023/kWh, while BIPV had a higher LCOE of USD 0.077/kWh due to installation complexities and lower energy production caused by less optimal sunlight exposure on vertical surfaces. The hybrid system, with an LCOE of USD 0.05/kWh, struck a balance between cost and energy output, making it an attractive option despite its higher cost compared to standalone rooftop PV. This is because the hybrid system maximizes energy production by combining the strengths of both rooftop and BIPV systems, offering a more efficient use of available space. Lower LCOE values improve the financial feasibility of PV adoption in residential and commercial buildings, and with incentives, subsidies, and technological advancements, these costs can be further reduced, driving higher adoption rates and accelerating the transition to renewable energy.
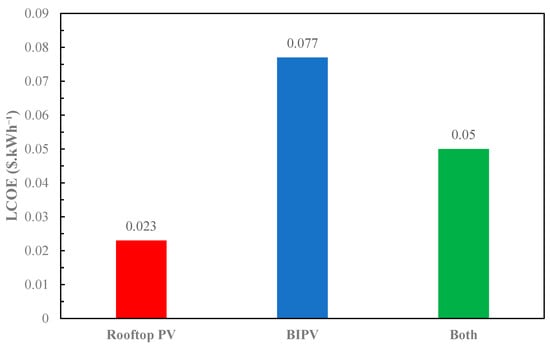
Figure 14.
LCOE of the systems.
Figure 15 displays the cumulative annual CO2 emission reduction, highlighting that the hybrid system, which combined rooftop PV and BIPV, achieved the most significant impact by reducing emissions by 9.7 tons annually, compared to 5.0 tons for rooftop PV and 4.7 tons for BIPV alone. This synergistic effect is due to the hybrid system’s ability to maximize energy generation by utilizing both horizontal and vertical surfaces, thereby displacing more fossil fuel-based electricity and reinforcing the environmental benefits of integrating multiple PV technologies. This analysis underscores the critical role of renewable energy in mitigating climate change impacts and emphasizes the importance of expanding PV integration in urban environments to achieve long-term sustainability goals.
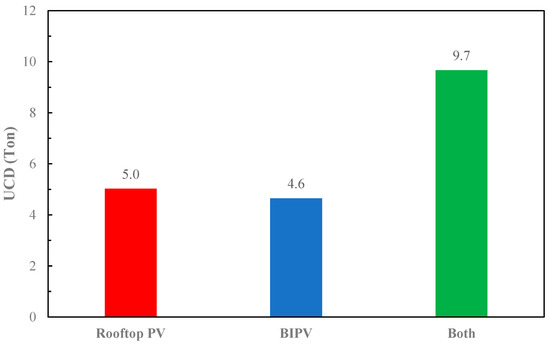
Figure 15.
UCD of the systems.
4. Conclusions
This study thoroughly examines the feasibility, economic viability, and environmental benefits of three PV configurations for urban buildings: rooftop PV, BIPV, and a hybrid combination of both. The findings highlight the strengths and limitations of each system, demonstrating the necessity of an integrated approach to renewable energy deployment in the built environment.
The results indicate that rooftop PV is the most cost-effective solution, with the lowest LCOE at USD 0.023/kWh. This is primarily due to its relatively simple installation process and lower associated costs. However, rooftop PV alone may not fully optimize a building’s available surface area for energy production, particularly in high-density urban settings where roof space is limited. On the other hand, BIPV offers a more innovative approach by replacing conventional building materials with energy-generating surfaces. While it enhances architectural aesthetics and contributes to energy self-sufficiency, BIPV comes with a higher LCOE of USD 0.077/kWh due to additional installation complexity and material costs. Despite its financial limitations, BIPV provides valuable benefits in terms of thermal insulation, shading, and improved urban energy efficiency.
The hybrid PV system integrated both rooftop PV and BIPV, balancing energy efficiency and economic feasibility. With an LCOE of USD 0.05/kWh, the hybrid system leveraged the advantages of both technologies, increasing total energy generation to 16.2 MWh annually. This significantly improved energy reliability and self-sufficiency, making buildings less dependent on grid electricity. Furthermore, the hybrid system achieved the highest environmental benefit, reducing carbon dioxide emissions by 9.7 tons per year, compared to 5.0 tons from standalone rooftop PV and 4.7 tons from BIPV alone.
In conclusion, this study provides a comprehensive evaluation of rooftop PV, BIPV, and hybrid PV systems, demonstrating that a hybrid approach offers the most balanced benefits in terms of cost, energy production, and environmental impact. By leveraging the strengths of both rooftop and integrated PV technologies, buildings can achieve greater energy independence and sustainability. The insights from this research can guide policymakers, architects, and engineers in designing future-proof buildings that maximize renewable energy utilization while ensuring economic feasibility and environmental responsibility.
There are some limitations to this study: (1) Findings are specific to Kerman, Iran, and the values are different for other climatic and economic conditions; (2) LCOE was the sole economic metric, which means that additional factors like subsidies or NPV were not considered; (3) the environmental analysis focused on CO2 as the most important indicator and other emissions were excluded.
In addition, the following items could be indicated as the extent of application: (1) The methodology and findings can serve as benchmarks for future comparative studies evaluating photovoltaic integration strategies. (2) The results provide practical insights for investors and stakeholders in deciding between rooftop PV, BIPV, or hybrid configurations based on regional characteristics and economic priorities. (3) This study supports urban developers and local authorities aiming to enhance sustainability and achieve zero-energy targets in residential areas through informed PV integration. (4) The presented approach and outcomes could serve as an educational baseline resource for training professionals in renewable energy and sustainable building practices.
Author Contributions
Conceptualization, M.H.S., M.N., A.S., R.J. and H.S.; Methodology, M.H.S., M.N., A.F.C. and A.S.; Software, M.H.S. and N.Y.; Validation, M.H.S., M.N., A.F.C. and R.J.; Formal analysis, M.H.S., M.N. and N.Y.; Investigation, M.H.S., M.N. and A.F.C.; Resources, A.S.; Data curation, A.F.C. and N.Y.; Writing—original draft, M.H.S., A.F.C., N.Y. and R.J.; Writing—review & editing, A.S. and H.S.; Visualization, R.J.; Supervision, A.S.; Project administration, A.S.; Funding acquisition, A.S. All authors have read and agreed to the published version of the manuscript.
Funding
This research received no external funding.
Data Availability Statement
Data are available upon request from the corresponding author.
Acknowledgments
The authors sincerely acknowledge the assistance of ChatGPT and DeepSeek in refining the English language of this manuscript, ensuring clarity and coherence in its presentation. The final version of the manuscript was carefully reviewed by the authors to ensure that it adheres to the journal’s guidelines and maintains the intended scientific accuracy and originality.
Conflicts of Interest
The authors declare no conflict of interest.
Nomenclature
| Area () | |
| Heat transfer () | |
| Specific heat capacity () | |
| Discount rate () | |
| Hour angle () | |
| Thermal conductivity () | |
| Radiation () | |
| Latitude () | |
| Power () | |
| Velocity () | |
| Thermal resistance () | |
| Life of the system (year) | |
| Temperature () | |
| Time () | |
| Azimuth () | |
| Greek symbols | |
| Absorptivity | |
| Transmissivity | |
| Emissivity | |
| Efficiency () | |
| Albedo or Density () | |
| Tilt (); Temperature coefficient of power (%·°C−1) | |
| Declination (); Thickness () | |
| Stefan Boltzmann () | |
| Incident () | |
| Zenith () | |
| Scripts | |
| Ambient | |
| Conduction | |
| Convection | |
| db | Dry bulb |
| EVA1 | Top EVA |
| EVA2 | Bottom EVA |
| Glass | |
| Ground | |
| Operating and maintenance | |
| Radiation | |
| Reference | |
| si | Silicon |
| sky | Sky |
| Tedlar | |
| w | Wind |
| wb | Wet bulb |
| Abbreviation | |
| Audio frequency injection control | |
| Apparent solar time | |
| Building integrated photovoltaic | |
| Diffiuse horizontal irradiance | |
| Ethylene vinyl acetate | |
| Global horizontal irradiance | |
| Heterojunction with Intrinsic Thin-layer | |
| Life cycle cost | |
| Levelized cost of electricity | |
| Purchase cost | |
| Phase change material | |
| Produced energy | |
| Photovoltaic | |
| Peresent worth | |
| Released carbon dioxide | |
| Semi-transparent photovoltaics | |
| Unreleased carbon dioxide |
References
- Zarei, A.; Mousavi, Y.; Mosalanezhad, R.; Atazadegan, M.H. Robust voltage control in inverter-interfaced microgrids under plug-and-play functionalities. IEEE Syst. J. 2019, 14, 2813–2824. [Google Scholar]
- Benchenina, Y.; Zemmit, A.; Bouzaki, M.M.; Loukriz, A.; Elsayed, S.K.; Alzaed, A.; Ali, G.; Ghoneim, S.S.M. Advancing green hydrogen production in Algeria with opportunities and challenges for future directions. Sci. Rep. 2025, 15, 5559. [Google Scholar] [CrossRef] [PubMed]
- Ghanaee, E.; Rahimiyan, M. Strategic offering of a virtual power plant in energy markets under contingency conditions: A hybrid stochastic robust optimization approach. In Proceedings of the 2022 30th International Conference on Electrical Engineering (ICEE), Tehran, Iran, 17–19 May 2022; pp. 242–248. [Google Scholar]
- Sheikh, M.; Fassadi Chimeh, A.; Zokaee Ashtiani, F.; Fouladitajar, A.; Yavarzadeh, N. Mathematical Modeling of Direct Contact Membrane Distillation (DCMD) using Knudsen-Diffusion Model for PVDF Membranes. J. Membr. Sci. Res. 2025, in press. [CrossRef]
- Mousavi, Y.; Bevan, G.; Kucukdemiral, I.B.; Fekih, A. Observer-based high-order sliding mode control of DFIG-based wind energy conversion systems subjected to sensor faults. IEEE Trans. Ind. Appl. 2023, 60, 1750–1759. [Google Scholar]
- Mousavi, Y.; Alfi, A.; Kucukdemiral, I.B. Enhanced fractional chaotic whale optimization algorithm for parameter identification of isolated wind-diesel power systems. IEEE Access 2020, 8, 140862–140875. [Google Scholar]
- Kolahi, M.; Abdollahzadeh, A.H.; Noori, R. Holistic management approach for social-ecological systems in Iran. Environ. Rev. 2024, 33, 1–15. [Google Scholar]
- Nazaralizadeh, S.; Banerjee, P.; Srivastava, A.K.; Famouri, P. Battery Energy Storage Systems: A Review of Energy Management Systems and Health Metrics. Energies 2024, 17, 1250. [Google Scholar] [CrossRef]
- Pirali zefrehei, A.R.; Kolahi, M.; Fisher, J. Ecological-environmental challenges and restoration of aquatic ecosystems of the Middle-Eastern. Sci. Rep. 2022, 12, 17229. [Google Scholar]
- Khodayar Sahebi, H.; Hoseinzadeh, S.; Ghadamian, H.; Ghasemi, M.H.; Esmaeilion, F.; Garcia, D.A. Techno-Economic Analysis and New Design of a Photovoltaic Power Plant by a Direct Radiation Amplification System. Sustainability 2021, 13, 11493. [Google Scholar] [CrossRef]
- Mohammadagha, M.; Najafi, M.; Kaushal, V.; Jibreen, A.M.A. Machine Learning Models for Reinforced Concrete Pipes Condition Prediction: The State-of-the-Art Using Artificial Neural Networks and Multiple Linear Regression in a Wisconsin Case Study. arXiv 2025, arXiv:2502.00363. [Google Scholar]
- Aguacil, S.; Duque, S.; Lufkin, S.; Rey, E. Designing with building-integrated photovoltaics (BIPV): A pathway to decarbonize residential buildings. J. Build. Eng. 2024, 96, 110486. [Google Scholar] [CrossRef]
- Nasution, A.D.; Larasati, D.; Nadia, S.; Ferels, A.; Indartono, Y.S.; Kurniawan, H. Optimization of BIPV utilization with parametric approach: Case study on Nearly Zero Carbon Building Studio Design in Medan, Indonesia. Int. J. Adv. Sci. Eng. Inf. Technol. 2024, 14, 1383–1394. [Google Scholar] [CrossRef]
- Mianabadi, A.; Davary, K.; Kolahi, M.; Fisher, J. Water/climate nexus environmental rural-urban migration and coping strategies. J. Environ. Plan. Manag. 2022, 65, 852–876. [Google Scholar] [CrossRef]
- Karimi, S.; Nazaralizadeh, S.; Srivastava, A.; Salem, A.; Famouri, P. Real Time Modeling and Control Algorithm of a Grid-Connected Battery Energy Storage System. TechRxiv 2025. [Google Scholar] [CrossRef]
- Nazaralizadeh, S.; Banerjee, P.; Karimi, S.; Srivastava, A.K.; Famouri, P. Very-Short-Term Solar Power Prediction Using a Suboptimal Multiple Fading Kalman Filter. TechRxiv 2025. [Google Scholar] [CrossRef]
- Amini, A.; Abedi, M.; Nesari, E.; Daryadel, E.; Kolahi, M.; Mianabadi, H.; Fisher, J. The Paris Agreement’s approach toward climate change loss and damage. World Aff. 2023, 186, 46–80. [Google Scholar] [CrossRef]
- Antoniolli, A.F.; Naspolini, H.F.; de Abreu, J.F.; Rüther, R. Development of technical and statistical algorithm using Business Intelligence tools for energy yield assessment of large rooftop photovoltaic system ensembles. Sustain. Energy Technol. Assess. 2022, 49, 101686. [Google Scholar] [CrossRef]
- Zublie, M.F.M.; Hasanuzzaman, M.; Rahim, N.A. Modeling, Energy Performance and Economic Analysis of Rooftop Solar Photovoltaic System for Net Energy Metering Scheme in Malaysia. Energies 2023, 16, 723. [Google Scholar] [CrossRef]
- Alnaser, N.W. A domestic rooftop PV system: A step towards retrofitting the built environment to combat climate change in Bahrain. Front. Built Environ. 2023, 9, 1178512. [Google Scholar] [CrossRef]
- Muttaqi, K.M.; Rahman, O.; Sutanto, D.; Lipu, M.S.H.; Abdolrasol, M.G.M.; Hannan, M.A. High-Frequency Ripple Injection Signals for the Effective Utilization of Residential EV Storage in Future Power Grids With Rooftop PV System. IEEE Trans. Ind. Appl. 2022, 58, 6655–6665. [Google Scholar] [CrossRef]
- Zhu, X.; Lv, Y.; Bi, J.; Jiang, M.; Su, Y.; Du, T. Techno-Economic Analysis of Rooftop Photovoltaic System under Different Scenarios in China University Campuses. Energies 2023, 16, 3123. [Google Scholar] [CrossRef]
- Khan, M.A.; Islam, N.; Abdul Mateen Khan, M.; Irshad, K.; Hanzala, M.; Ali Pasha, A.; Mursaleen, M. Experimental and simulation analysis of grid-connected rooftop photovoltaic system for a large-scale facility. Sustain. Energy Technol. Assess. 2022, 53, 102773. [Google Scholar] [CrossRef]
- Abdullah, A.; Amlus, M.; Azizan, N.; Sali, I.; Rahim, M. Performance Analysis of Different Type PV Module for 3kW Residential Roof Top PV System using PVSyst Simulation tool. J. Phys. Conf. Ser. 2022, 2312, 012042. [Google Scholar]
- Kabalci, E.; Kabalci, Y.; Gokkus, G. Dual DC-DC converter design for string inverters used in solar plants. In Proceedings of the 2015 International Conference on Renewable Energy Research and Applications (ICRERA), Palermo, Italy, 22–25 November 2015; pp. 115–119. [Google Scholar]
- Lin, Y.; Zhong, S.; Yang, W.; Hao, X.; Li, C.-Q. Multi-objective design optimization on building integrated photovoltaic with Trombe wall and phase change material based on life cycle cost and thermal comfort. Sustain. Energy Technol. Assess. 2021, 46, 101277. [Google Scholar] [CrossRef]
- Gholami, H.; Nils Røstvik, H. Levelised Cost of Electricity (LCOE) of Building Integrated Photovoltaics (BIPV) in Europe, Rational Feed-In Tariffs and Subsidies. Energies 2021, 14, 2531. [Google Scholar] [CrossRef]
- Bhattacharya, S.; Sadhu, P.K.; Sarkar, D. Performance evaluation of building integrated photovoltaic system arrays (SP, TT, QT, and TCT) to improve maximum power with low mismatch loss under partial shading. Microsyst. Technol. 2024, 30, 583–597. [Google Scholar] [CrossRef]
- Skandalos, N.; Karamanis, D. An optimization approach to photovoltaic building integration towards low energy buildings in different climate zones. Appl. Energy 2021, 295, 117017. [Google Scholar] [CrossRef]
- Samarasinghalage, T.I.; Wijeratne, W.M.P.U.; Yang, R.J.; Wakefield, R. A multi-objective optimization framework for building-integrated PV envelope design balancing energy and cost. J. Clean. Prod. 2022, 342, 130930. [Google Scholar] [CrossRef]
- Li, S.; Zhang, T.; Liu, X.; Xue, Z.; Liu, X. Performance investigation of a grid-connected system integrated photovoltaic, battery storage and electric vehicles: A case study for gymnasium building. Energy Build. 2022, 270, 112255. [Google Scholar] [CrossRef]
- Gonçalves, J.E.; van Hooff, T.; Saelens, D. Simulating building integrated photovoltaic facades: Comparison to experimental data and evaluation of modelling complexity. Appl. Energy 2021, 281, 116032. [Google Scholar] [CrossRef]
- Ko, J.; Jeong, J.-W. Annual performance evaluation of thermoelectric generator-assisted building-integrated photovoltaic system with phase change material. Renew. Sustain. Energy Rev. 2021, 145, 111085. [Google Scholar] [CrossRef] [PubMed]
- Javadijam, R.; Shahverdian, M.H.; Sohani, A.; Sayyaadi, H. A 4E Comparative Study between BIPV and BIPVT Systems in Order to Achieve Zero-Energy Building in Cold Climate. Buildings 2023, 13, 3028. [Google Scholar] [CrossRef]
- Wilcox, S.; Marion, W. Users Manual for TMY3 Data Sets; NREL: Golden, CO, USA, 2008. [Google Scholar]
- Kalogirou, S.A. Solar Energy Engineering: Processes and Systems; Academic Press: Cambridge, MA, USA, 2013. [Google Scholar]
- Habte, A.; Sengupta, M.; Lopez, A. Evaluation of the National Solar Radiation Database (NSRDB): 1998–2011. Renew. Energy 2014, 71, 497–507. [Google Scholar] [CrossRef]
- Shahverdian, M.H.; Sayyaadi, H.; Sohani, A. Multi-layer Modeling of Bifacial Photovoltaic Panels: Evaluating the Accuracy of One-, Three-, and Five-layer Models. Energy Convers. Manag. X 2025, 25, 100879. [Google Scholar] [CrossRef]
- Gu, W.; Ma, T.; Ahmed, S.; Zhang, Y.; Peng, J. A comprehensive review and outlook of bifacial photovoltaic (bPV) technology. Energy Convers. Manag. 2020, 223, 113283. [Google Scholar]
- Kalogirou, S.A. Solar Energy Engineering: Processes and Systems; Elsevier: Amsterdam, The Netherlands, 2023. [Google Scholar]
- Mousavi, R.; Mousavi, A.; Mousavi, Y.; Tavasoli, M.; Arab, A.; Kucukdemiral, I.B.; Alfi, A.; Fekih, A. Revolutionizing solar energy resources: The central role of generative AI in elevating system sustainability and efficiency. Appl. Energy 2025, 382, 125296. [Google Scholar] [CrossRef]
- Duffie, J.A.; Beckman, W.A.; Blair, N. Solar Engineering of Thermal Processes, Photovoltaics and Wind; John Wiley & Sons: Hoboken, NJ, USA, 2020. [Google Scholar]
- Shahverdian, M.H.; Sayyaadi, H.; Sohani, A. A detailed optical thermo-electrical model for better thermal analysis of bifacial PV systems. Energy Convers. Manag. X 2024, 24, 100817. [Google Scholar] [CrossRef]
- Shahsavar, A.; Rajabi, Y. Exergoeconomic and enviroeconomic study of an air based building integrated photovoltaic/thermal (BIPV/T) system. Energy 2018, 144, 877–886. [Google Scholar] [CrossRef]
- Kaplani, E.; Kaplanis, S. Thermal modelling and experimental assessment of the dependence of PV module temperature on wind velocity and direction, module orientation and inclination. Sol. Energy 2014, 107, 443–460. [Google Scholar]
- Gu, W.; Ma, T.; Li, M.; Shen, L.; Zhang, Y. A coupled optical-electrical-thermal model of the bifacial photovoltaic module. Appl. Energy 2020, 258, 114075. [Google Scholar]
- Notton, G.; Cristofari, C.; Mattei, M.; Poggi, P. Modelling of a double-glass photovoltaic module using finite differences. Appl. Therm. Eng. 2005, 25, 2854–2877. [Google Scholar] [CrossRef]
- Gu, W.; Ma, T.; Shen, L.; Li, M.; Zhang, Y.; Zhang, W. Coupled electrical-thermal modelling of photovoltaic modules under dynamic conditions. Energy 2019, 188, 116043. [Google Scholar] [CrossRef]
- De Bastiani, M.; Larini, V.; Montecucco, R.; Grancini, G. The levelized cost of electricity from perovskite photovoltaics. Energy Environ. Sci. 2023, 16, 421–429. [Google Scholar] [CrossRef] [PubMed]
- Ghanaee, E.; Pérez-Díaz, J.I.; Fernández-Muñoz, D.; Nájera, J.; Chazarra, M.; Castaño-Solis, S. Optimal Scheduling of a Hybrid Wind–Battery Power Plant in the Day-Ahead and Reserve Markets Considering Battery Degradation Cost. In Proceedings of the 2024 International Conference on Smart Energy Systems and Technologies (SEST), Torino, Italy, 10–12 September 2024; pp. 1–6. [Google Scholar]
- Chimeh, A.F.; Kocaefe, D.; Kocaefe, Y.; Robert, Y.; Bernier, J. Mathematical modelling of a semi-dry SO2 scrubber based on a Lagrangian-Eulerian approach. J. Hazard. Mater. 2024, 469, 134065. [Google Scholar] [CrossRef]
- Soltanifar, F.; Bahrami, A.; Sohani, A. A green energy-economic optimized solar driven solution for power, methanol, and hydrogen production together. Fuel 2025, 386, 134147. [Google Scholar] [CrossRef]
- Sohani, A. Time-dependent energy, economic, and environmental assessment of a PV-hydrogen integrated power system. Int. J. Hydrogen Energy, 2025, in press. [CrossRef]
- Shahverdian, M.H.; Sohani, A.; Sayyaadi, H. Water-energy nexus performance investigation of water flow cooling as a clean way to enhance the productivity of solar photovoltaic modules. J. Clean. Prod. 2021, 312, 127641. [Google Scholar] [CrossRef]
- Hoseinzadeh, P.; Assadi, M.K.; Heidari, S.; Khalatbari, M.; Saidur, R.; Sangin, H. Energy performance of building integrated photovoltaic high-rise building: Case study, Tehran, Iran. Energy Build. 2021, 235, 110707. [Google Scholar] [CrossRef]
Disclaimer/Publisher’s Note: The statements, opinions and data contained in all publications are solely those of the individual author(s) and contributor(s) and not of MDPI and/or the editor(s). MDPI and/or the editor(s) disclaim responsibility for any injury to people or property resulting from any ideas, methods, instructions or products referred to in the content. |
© 2025 by the authors. Licensee MDPI, Basel, Switzerland. This article is an open access article distributed under the terms and conditions of the Creative Commons Attribution (CC BY) license (https://creativecommons.org/licenses/by/4.0/).