Article

Modification of Equation for Calculating the Bond Stress Between Steel Bars and Concrete

1
School of Intelligent Construction and Civil Engineering, Zhongyuan University of Technology, Zhengzhou 451191, China
2
Henan Mechanics and Structures Engineering Research Centre, Zhengzhou 451191, China
3
School of Civil and Transportation Engineering, Henan University of Urban Construction, Pingdingshan 467036, China
*
Author to whom correspondence should be addressed.
Buildings 2025, 15(7), 1174; https://doi.org/10.3390/buildings15071174
Submission received: 14 March 2025 / Revised: 31 March 2025 / Accepted: 2 April 2025 / Published: 3 April 2025
(This article belongs to the Section Building Structures)

Abstract

The bond between steel bars and concrete is a fundamental aspect of reinforced concrete, ensuring the efficient transfer of forces between the two materials and guaranteeing their compatibility and composite action. The conventional equation for calculating bond stress does not account for slip effects. However, significant slip can lead to considerable errors, which are disadvantageous when analyzing bond performance using finite element methods. To address this issue, this study proposed a modified bond stress calculation model, whose reliability was systematically validated through pull-out tests and comparative analysis with a CEB-FIP model. The experimental program employed a universal testing machine for load application, with a static strain measurement system continuously monitoring stress–strain data throughout the loading process. The experimental results indicated that the failure process of the specimens could be categorized into the following, four distinct stages: micro-slip stage, slip stage, descent stage, and residual stage. The discrepancy between bond stresses calculated by the modified and conventional equations increased with the increasing relative slip, reaching its maximum value in the residual stage. A comparative analysis of 23 groups of experimental data from the literature was performed, revealing that the difference in bonding stress reached a maximum of 20.45% in the residual stage, with a standard deviation (S) of 0.006 and a coefficient of variation (Cv) of 0.321, reflecting small fluctuations but large dispersion. In contrast, the S of the residual bonding stress was 0.016, and the Cv was 0.080, showing lower dispersion but greater volatility. Further comparison with the CEB-FIP model confirmed the superior applicability and computational accuracy of the proposed modified model. Therefore, the modified equation should be utilized for calculating bond stress when significant slip occurs, particularly during the residual stage.

1. Introduction

The use of reinforced concrete structures is widespread globally, primarily due to their exceptional durability, superior plasticity, and cost-effectiveness. These structures are fundamentally composite systems that consist of steel bars embedded in concrete, and their structural behavior depends significantly on the bond between the steel bars and the concrete. This bond is crucial for the performance of reinforced concrete, ensuring the transfer of forces between the two materials and guaranteeing their compatibility and composite action [1]. An effective bond enhances the overall performance of the composite materials under various loading conditions, including load-carrying capacity and deformation [2]. However, an insufficient bond can result in a number of undesirable outcomes, including bond slip between the steel bar and concrete, an increase in crack width in the concrete, corrosion of the steel bar, a significant reduction in the load-carrying capacity, and potential structural failure [3]. Therefore, it is imperative to ensure that adequate bond is achieved in order to guarantee the satisfactory performance of reinforced concrete structures.
Researchers have extensively studied the bond behavior between steel bars and concrete over the past few decades. These studies have employed a range of techniques, including theoretical analysis, numerical simulation, and experimental studies.
In the theoretical analysis of bond behavior, several methods were employed, including elasticity theory, fictitious crack theory, and the post-cracking softening model. These approaches were utilized to develop calculation methods for the bond between steel bars and steel fiber-reinforced concrete [4]. Furthermore, fracture mechanics theory was applied to analyze the initiation and propagation of interface cracks between FRP steel bars and concrete, addressing the limitations of traditional strength theory in accurately describing fracture behavior following interface cracking [5]. Additionally, mesoscale mechanics was employed to investigate the nonlinear bond behavior between the steel bar and concrete. Based on random cracking theory, a damage analysis model incorporating random concrete cracking and inter-facial debonding was developed [6,7]. Moreover, a novel bond prediction model utilizing artificial neural networks was created to provide deeper insights into the underlying mechanisms of the bond between steel bar and concrete [8,9].
The finite element method was a widely employed technique for the numerical simulation of bond behavior. Currently, three principal finite element methods are utilized for simulating bond behavior: discrete, distributed, and embedded models. Among these methods, the discrete model directly accounts for the bond slip mechanism and was particularly well-suited for simulating irregular steel bars [10]. The calibrated results of the finite element model enhance comprehension and visualize stress distribution in each component of the model, explicitly elucidating stress evolution and crack propagation within the concrete while analyzing the influence of various parameters on the bond [11,12]. Tian Su et al. [13] investigated the bond behavior of steel bars in salt frost-damaged recycled coarse aggregate concrete using finite element analysis. The finite element model incorporates spring constraints with appropriate stiffness to account for the non-linearity of the bond slip between the steel bar and concrete. Furthermore, the steel bar node is connected to nine surrounding concrete nodes through the use of spring constraints [14]. The selection of an appropriate bond-slip relationship is of paramount importance when employing a finite element method to simulate bond behavior, as this ensures the accurate interpretation and conclusions regarding the structural behavior of reinforced concrete [15].
In the experimental analysis of bond behavior, three primary test methods were employed: the beam specimen test, the push-out test, and the pull-out test. The beam specimen test involved subjecting a full-scale or small-scale reinforced concrete beam to four-point positive bending, with a specified steel bar positioned at either the center or the end of the beam. This test method offered two significant advantages: first, it subjected both the steel bar and the surrounding concrete to tension, thereby simulating the behavior of real flexural members; second, it incorporated realistic cover and the confinement configurations that influence the failure mode [16]. Biscaia H C [14] conducted three full-scale beam specimen tests to highlight the potential impact of different types of bond-slip relationships on the load-displacement response of full-scale reinforced concrete beams. Meanwhile, Mohebi Z H [17] conducted 20 beam specimen tests to investigate the effect of polypropylene fibers on the bond performance of steel bars in high-strength concrete.
The push-out test was commonly used to evaluate the compressive bond behavior of bars embedded in concrete due to its simplicity and applicability to smooth bars that tend to slip during pullout [18]. Li et al. conducted 99 push-out tests to investigate the compressive bond performance of 500 MPa steel bars in concrete and proposed a new equation for calculating the compressive bond strength of these bars [19]. Similarly, Billah and Alam investigated the bond behavior of shape memory alloy bars in concrete by utilizing 56 push-out specimens to evaluate the influence of concrete strength, alloy bar diameter, embedment length, and surface condition. They also developed an equation to calculate the average maximum bond strength of alloy bars [20]. The pull-out test was primarily used to understand bond performance due to its ease of fabrication and testing procedures. In this test, an axial pull-out load was applied to extract the steel bar embedded in the concrete, and the resulting bond stress between the steel bar and the concrete was calculated based on the pull-out load measured during the test [21]. Currently, the research into the bond behavior between steel bars and concrete focuses on two main aspects: the influence of the material properties of the steel bars and concrete, and the influence of environmental factors. The materials of the steel bars mainly include ribbed steel bars, round stainless steel bars and FRP bars, among others [5,6,14,18,19,21]. Meanwhile, concrete materials mainly include fiber concrete, recycled concrete, lightweight aggregate concrete, and others [1,3,10,12,15,16,17,22]. In addition, environmental factors mainly include elevated temperature and freeze–thaw cycles [13,23,24].
In these studies, the pull-out test was predominantly used as the primary research method to analyze bond stresses and understand the bond behavior between the steel bar and concrete. According to standard pull-out test approaches, the conventional bond stress was defined as the ratio of the pull-out load F to the nominal area of the anchorage.
τ n o m = F π d n o m l a d h
where d n o m is the nominal diameter of the bar and l a d h is the initial anchorage length.
The pull-out test consisted of pulling a piece of steel bar out of the concrete mass and dividing the steel bar into a bond zone, a load end non-bond zone, and a free-end bond zone. Under the pull-out load, the nominal anchorage length of the bonded zone was pulled out and constantly decreased with the increase in the slip value s. Meanwhile, the steel bar in the free-end bonded zone entered the original bonded zone, and the longer steel bar in the free end zone entered the original bonded zone with the increase in the slip value s, and the entry value is equaled to the slip value s.
Chiriatti et al. [25] investigated the effect of the slip value (s) on the initial anchorage length and proposed modifications to Equation (1). However, their study did not account for the effect on bond stress calculation when the bar in the free end non-bonded zone transitions into the original bonded zone.
In this study, we conducted a series of pull-out tests to evaluate both the slip value effect and the influence of bar presence in the free end non-bonding zone on bond stress calculation, using specimens with fully extracted original anchorage lengths. The experimental results enabled us to propose a modified bond stress calculation equation and perform a comprehensive comparison with the conventional Equation (1) from the existing literature.

2. Experimental Program
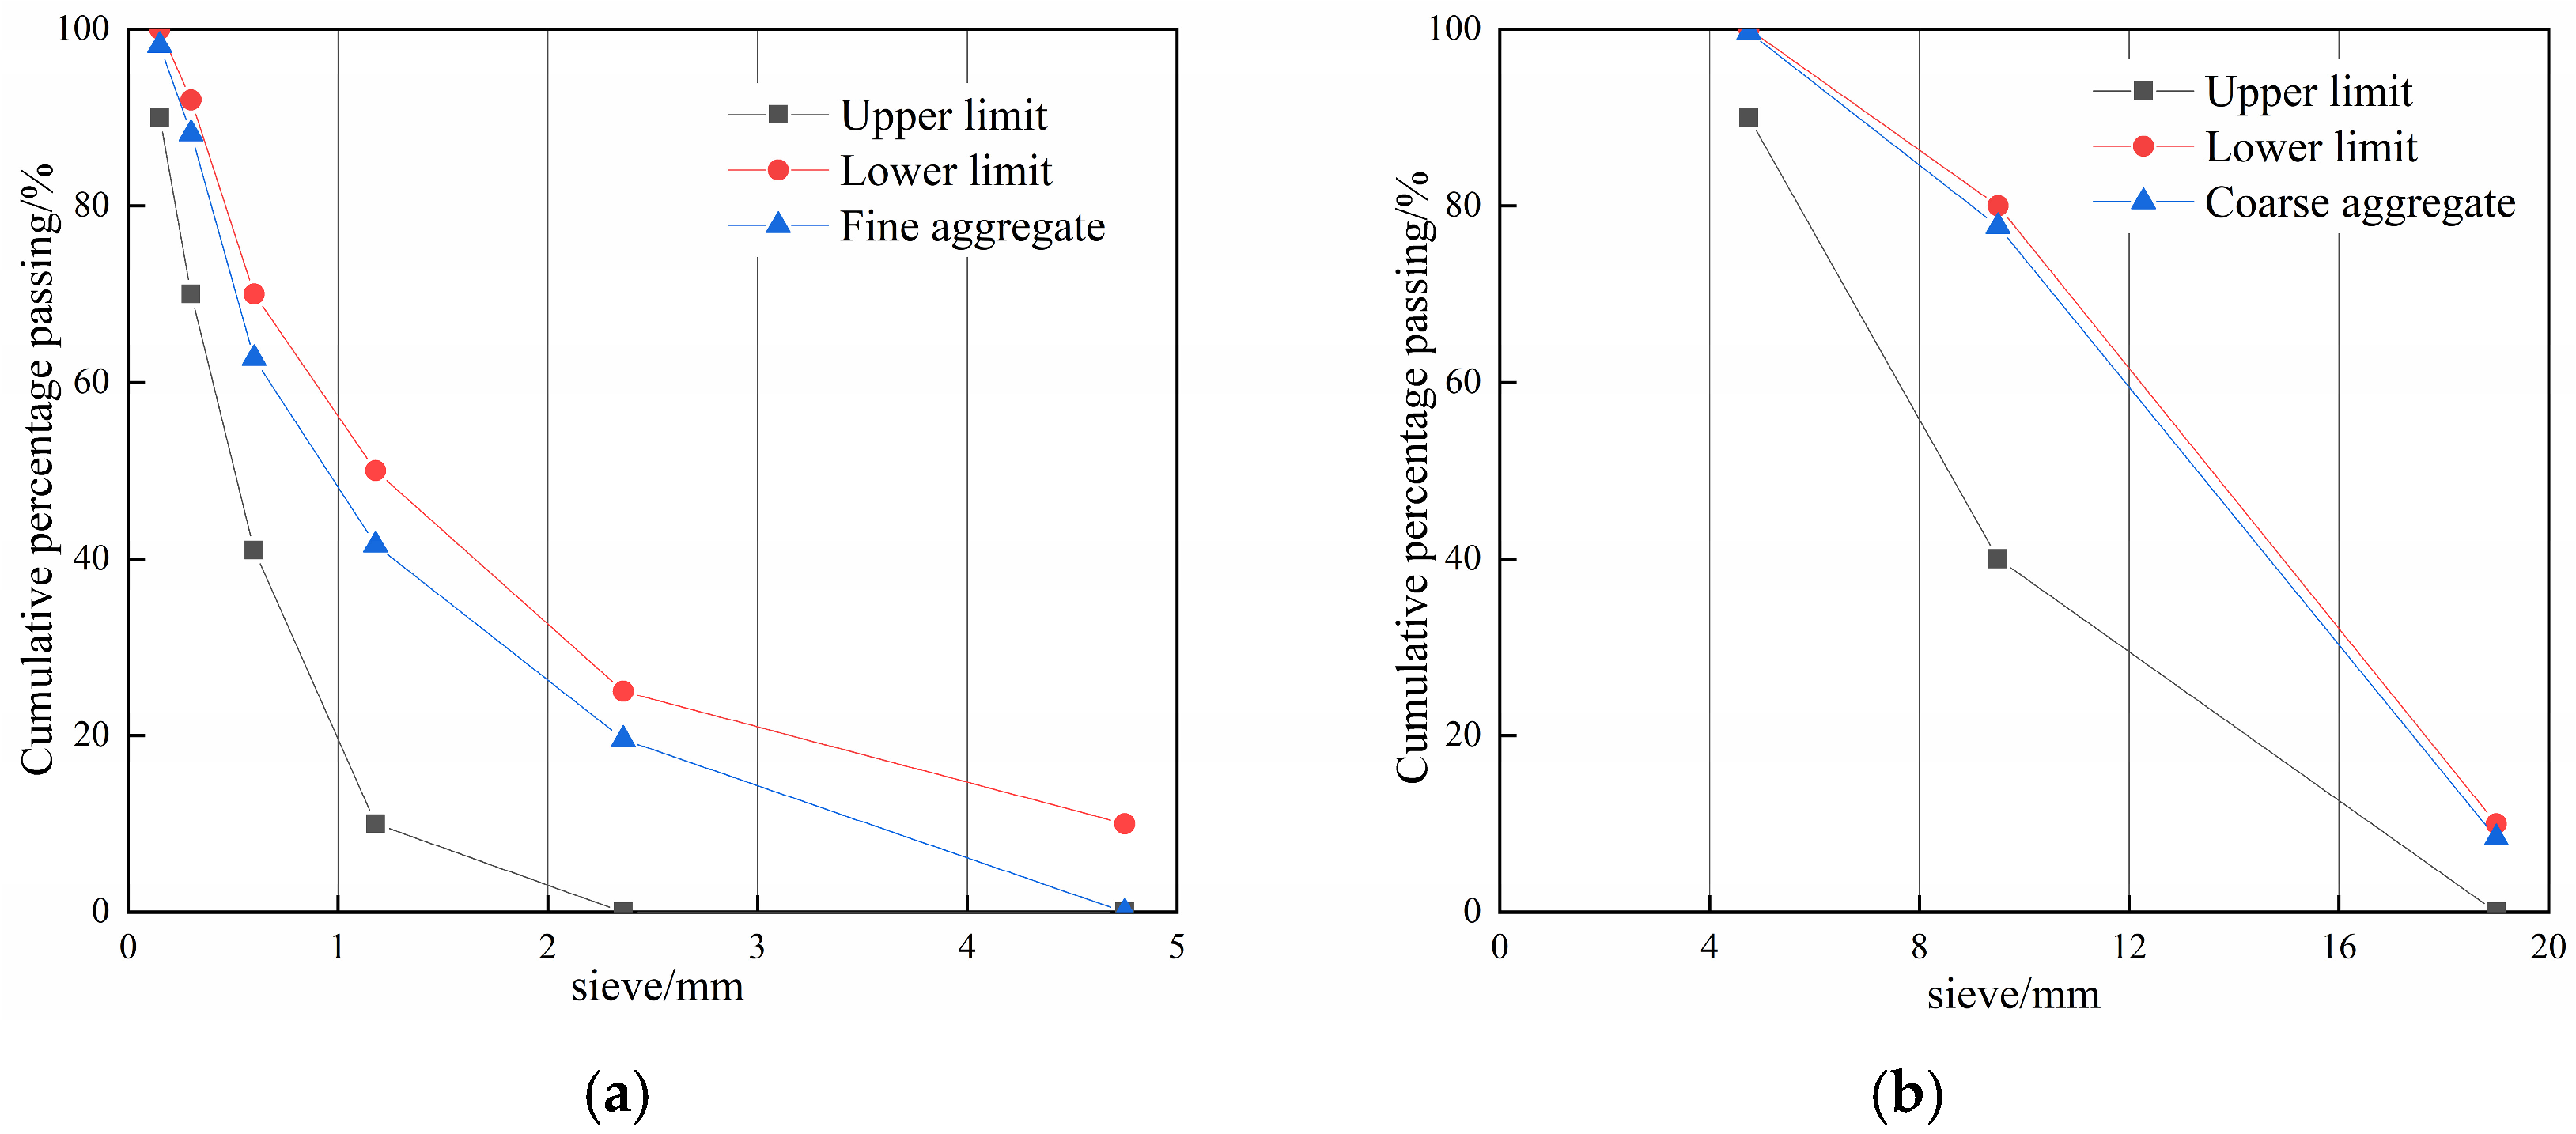
2.1. Materials

For this study, ordinary Portland cement of grade 42.5 according to the Chinese standard GB 175-2023 [26] was used as the gelling material. The properties of the cement are listed in Table 1. Natural river sand, conforming to the Chinese standard GB/T 14684-2022 [27], was used as the fine aggregate. Its fineness modulus was measured to be 2.8. Crushed limestone with a maximum size of 20 mm, complying with the Chinese standard GB/T 14685-2022 [28], was used as the coarse aggregate. In accordance with the principle of local material procurement, all experimental materials were sourced from Zhengzhou, China, which aligns with the concept of efficient resource utilization. In terms of aggregates, the fine aggregate was tested to have a moisture content of 0.23%, a water absorption of 1.20%, and a relative density of 2.65, while the coarse aggregate was tested to have a moisture content of 0.32%, a water absorption of 0.82%, and a relative density of 2.70. The variation in water content influences the mechanical properties of concrete by prompting adjustments in its mix proportions, which in turn affects bond strength. Water absorption rate, serving as a key indicator for evaluating material’s water absorption characteristics, has a significant impact on the interfacial interactions and the formation and development of microcracks. Furthermore, variations in the relative density of aggregates lead to differences in their porosity, which subsequently influences bond strength. The aggregate grading profile is shown in Figure 1.
To achieve optimal performance of the fresh concrete, polycarboxylate super plasticizer was incorporated into the mix.
For the pull-out test, hot-rolled 400 grade ribbed steel bars with nominal diameters of 16 mm, 18 mm, and 20 mm, each measuring 350 mm in length, were embedded in each concrete specimen. The steel bar specimens were tested in accordance with Chinese standard GB/T 28900-2022 [29] to obtain the mechanical properties listed in Table 2.

2.2. Mix Proportion

A normal concrete mix proportion was developed to produce specimens with a target compressive strength of 30 MPa, which is given in Table 3.

2.3. Designation of Specimens

The specimens consisted of concrete cubes, each containing a single steel bar embedded vertically along the central axis. The dimensions and arrangement of the bonded segments are shown in Figure 2. The steel bar protruded 150 mm downward from the bottom of the concrete cube to facilitate the measurement of slip and to ensure that the length of the free end bar into the original bond zone was sufficient. Additionally, the steel bar protruded approximately 200 mm upward to allow for gripping the specimen in the testing machine.
Steel molds were used to cast 150 mm concrete cubes which were used for bonding with steel bars of all diameters. A circular hole was drilled in the center of the bottom of the steel mold to accommodate the embedding of the steel bar. The steel mold was mounted on a stand and a polyvinyl chloride (PVC) pipe with an inside diameter larger than the diameter of the steel bar was installed vertically above the circular hole in the center of the steel mold base. Prior to pouring concrete, the steel bar was inserted through the PVC tube to the underside of the steel mold, leaving a length of 80 mm above the PVC tube for bonding to the concrete cube.
The steel mold with the steel bar was placed on the vibrating table and the concrete was poured into the steel mold in three layers. Each layer was vibrated for approximately 20 s to ensure proper compaction. During the pouring and vibrating process, the steel bar was securely clamped under the steel mold to prevent movement. After vibrating the concrete, the top surface was leveled to achieve a smooth finish. After one hour, the specimens were covered with a thin polymer film to prevent moisture loss from the concrete. After 24 h, the specimens were removed from the steel mold and placed in the standard curing room for a duration of 28 days.

3. Testing Methods

3.1. Slump Cone Test and Mechanics Performance Test
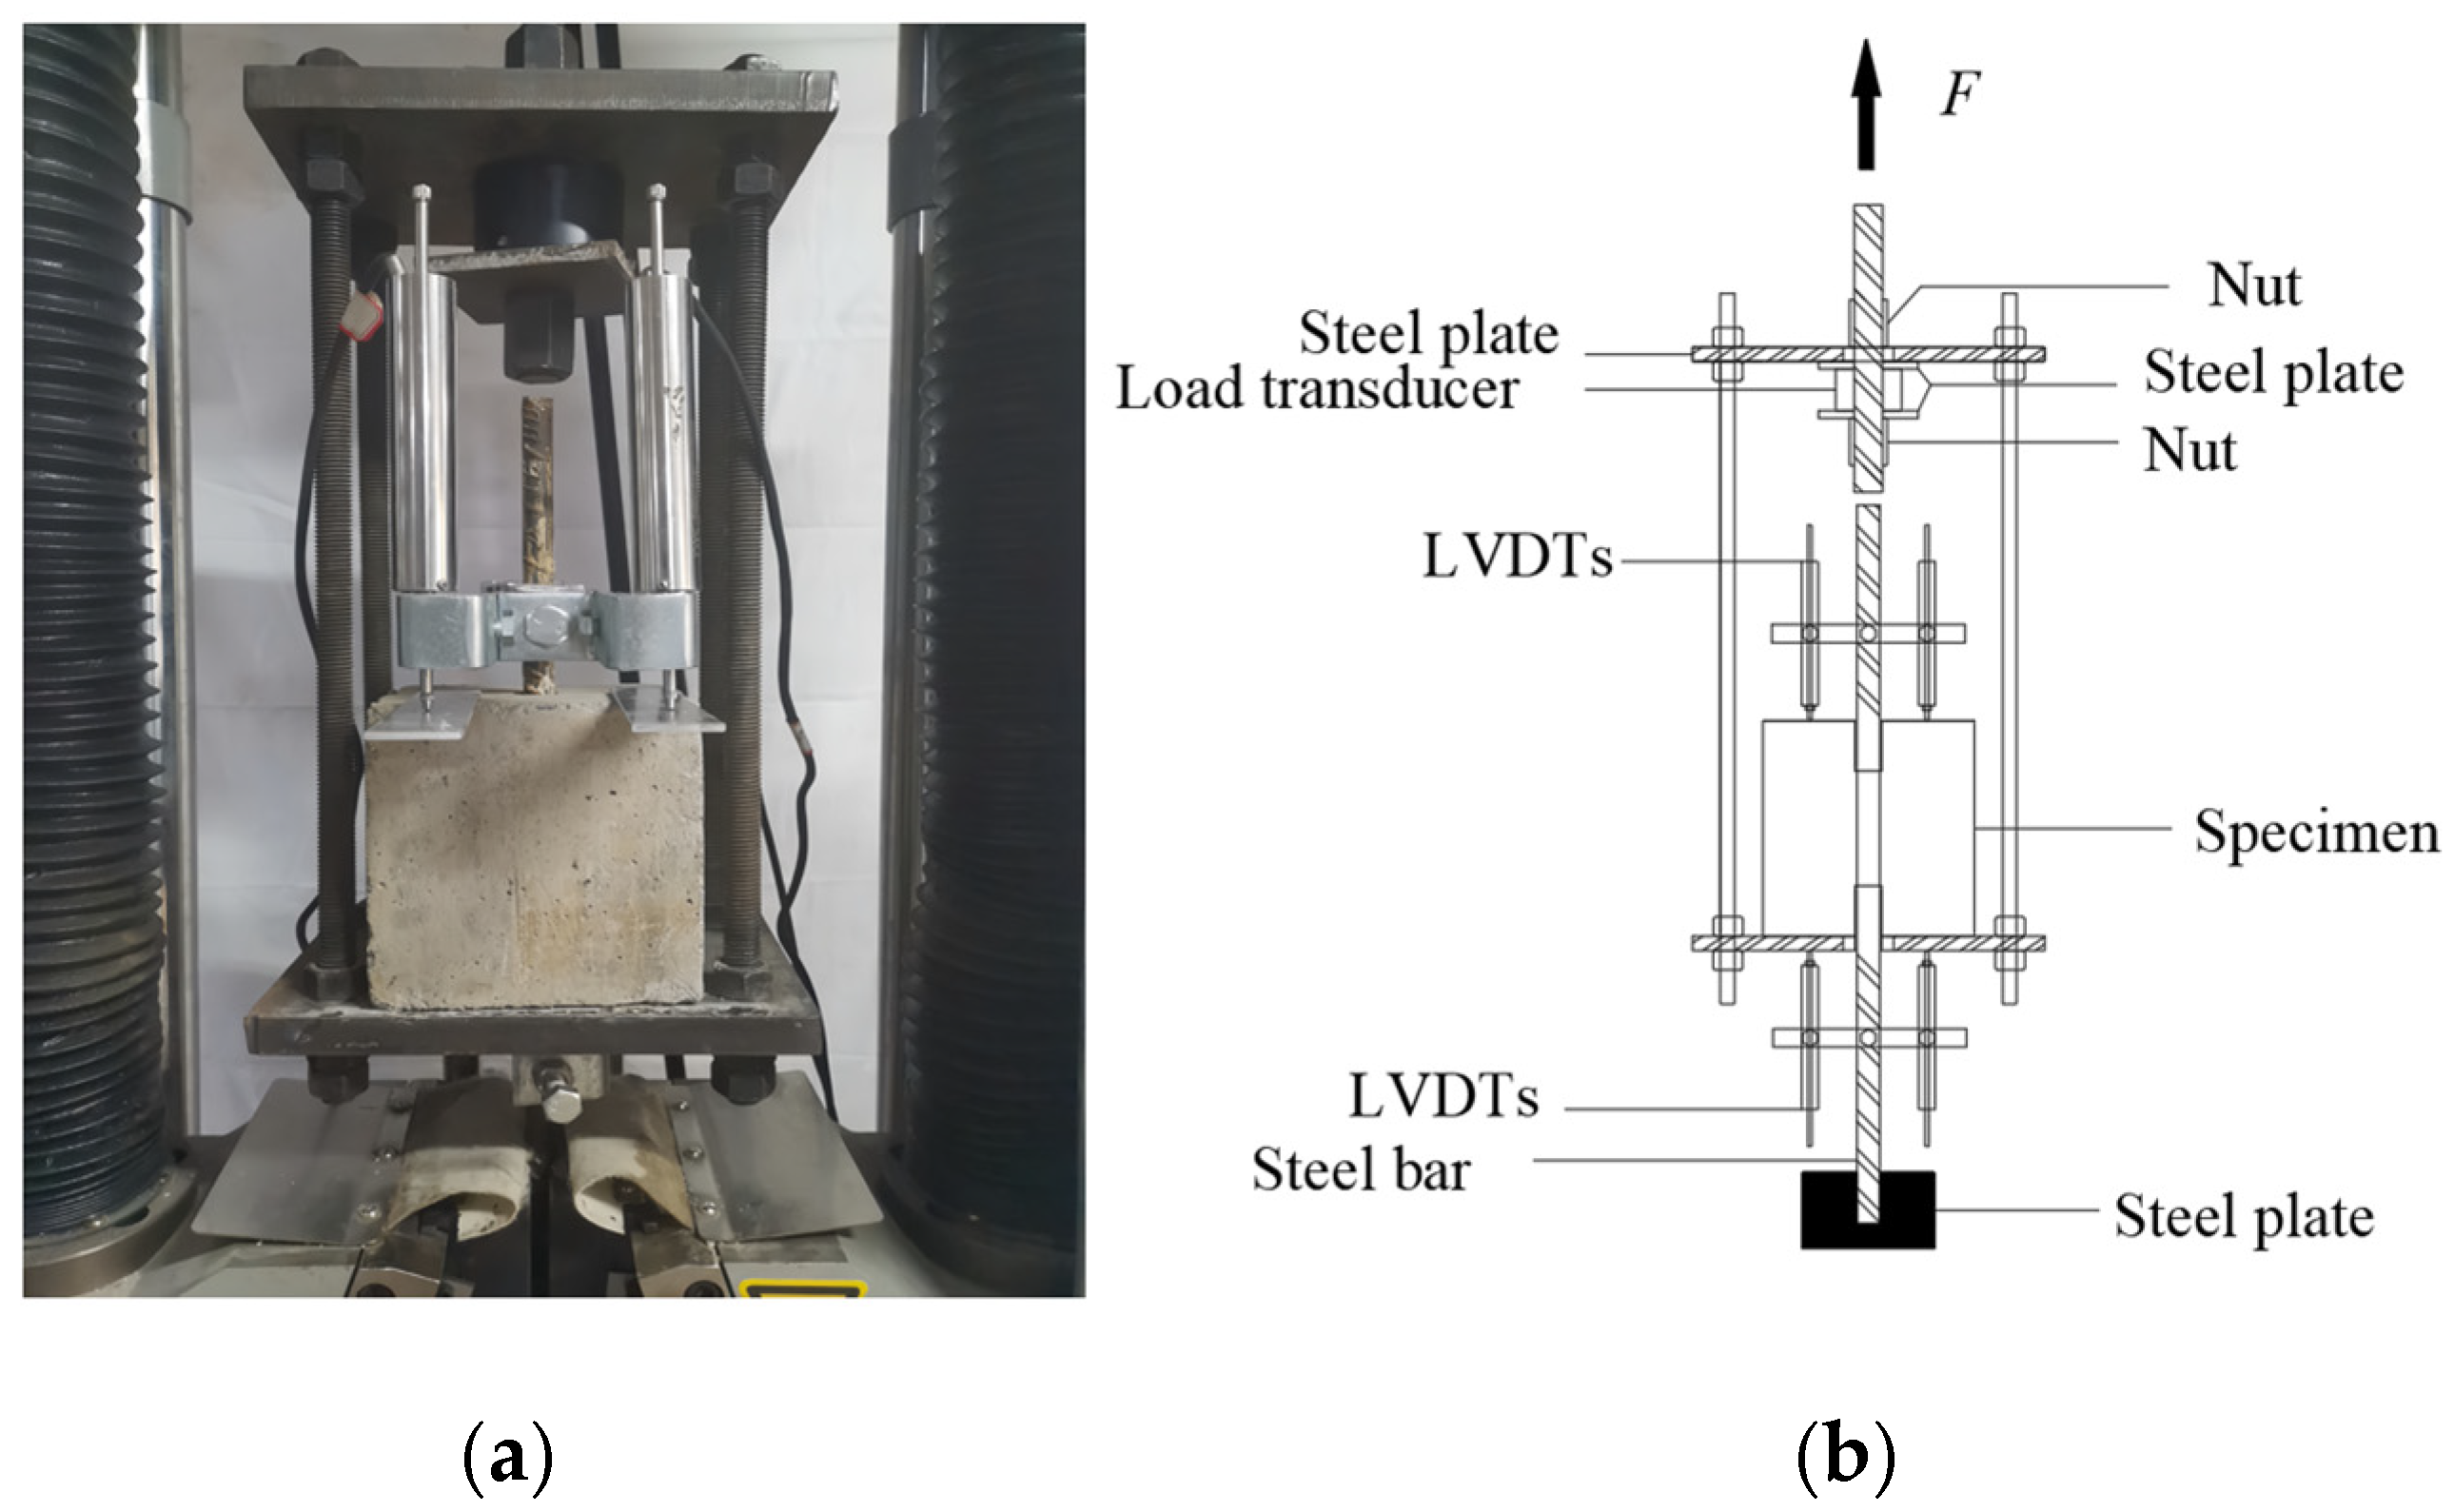
To assess the performance of the fresh concrete, the slump cone test was conducted in accordance with Chinese standard GB/T50080-2016 [30]. The test recorded an 80 mm slump value, representing the vertical settlement of fresh concrete after cone removal. After a 28-day curing period, the compressive strength of the concrete was tested in accordance with Chinese Standard GB/T 50081-2019 [31], yielding a compressive strength of 31.5 MPa.

3.2. Pull-Out Test

In the pull-out test, the steel bar was pulled out of the concrete cube in a downward direction, as shown in Figure 3. A downward force was applied to the steel bar via a gripping mechanism, while the concrete cube experienced reaction forces from the steel plates supporting its base.
This test employed a specially designed test frame consisting of two 10 mm thick steel plates with circular holes in the corners, joined together by four threaded bolts. The specimen was positioned on the lower steel plate within the test frame, while the upper plate and load cell were secured to the upper fixture of the tester using a fine-rolled bar and nut. A preload of approximately 2 kN was applied prior to the formal test, which continued until the initial bond length was fully extracted.
The monotonic loading was applied to the steel bar using a 500 kN-capacity electronic universal testing machine from Jinan Sida Testing Technology Co., Ltd. (Jinan, China), with displacement control at a rate of 0.3 mm/min. Two pairs of linear variable displacement transducers were positioned at the top and bottom of the concrete cube to measure the displacement at the loaded and free ends of the steel bar, respectively. The relative slip of the steel bar with respect to the concrete cube was calculated as the difference between the slip at the loaded end and the slip at the free end of the steel bar. Since no yielding damage occurs to the steel bar during the drawing process, only elastic deformation of the steel bar was considered to occur. Both the pull-out load measured by the load cell and the displacements at both ends of the embedded steel bar were recorded by a data acquisition system. The relationship between pull-out load and end slip was subsequently analyzed and visualized using data files.

4. Test Results and Discussion

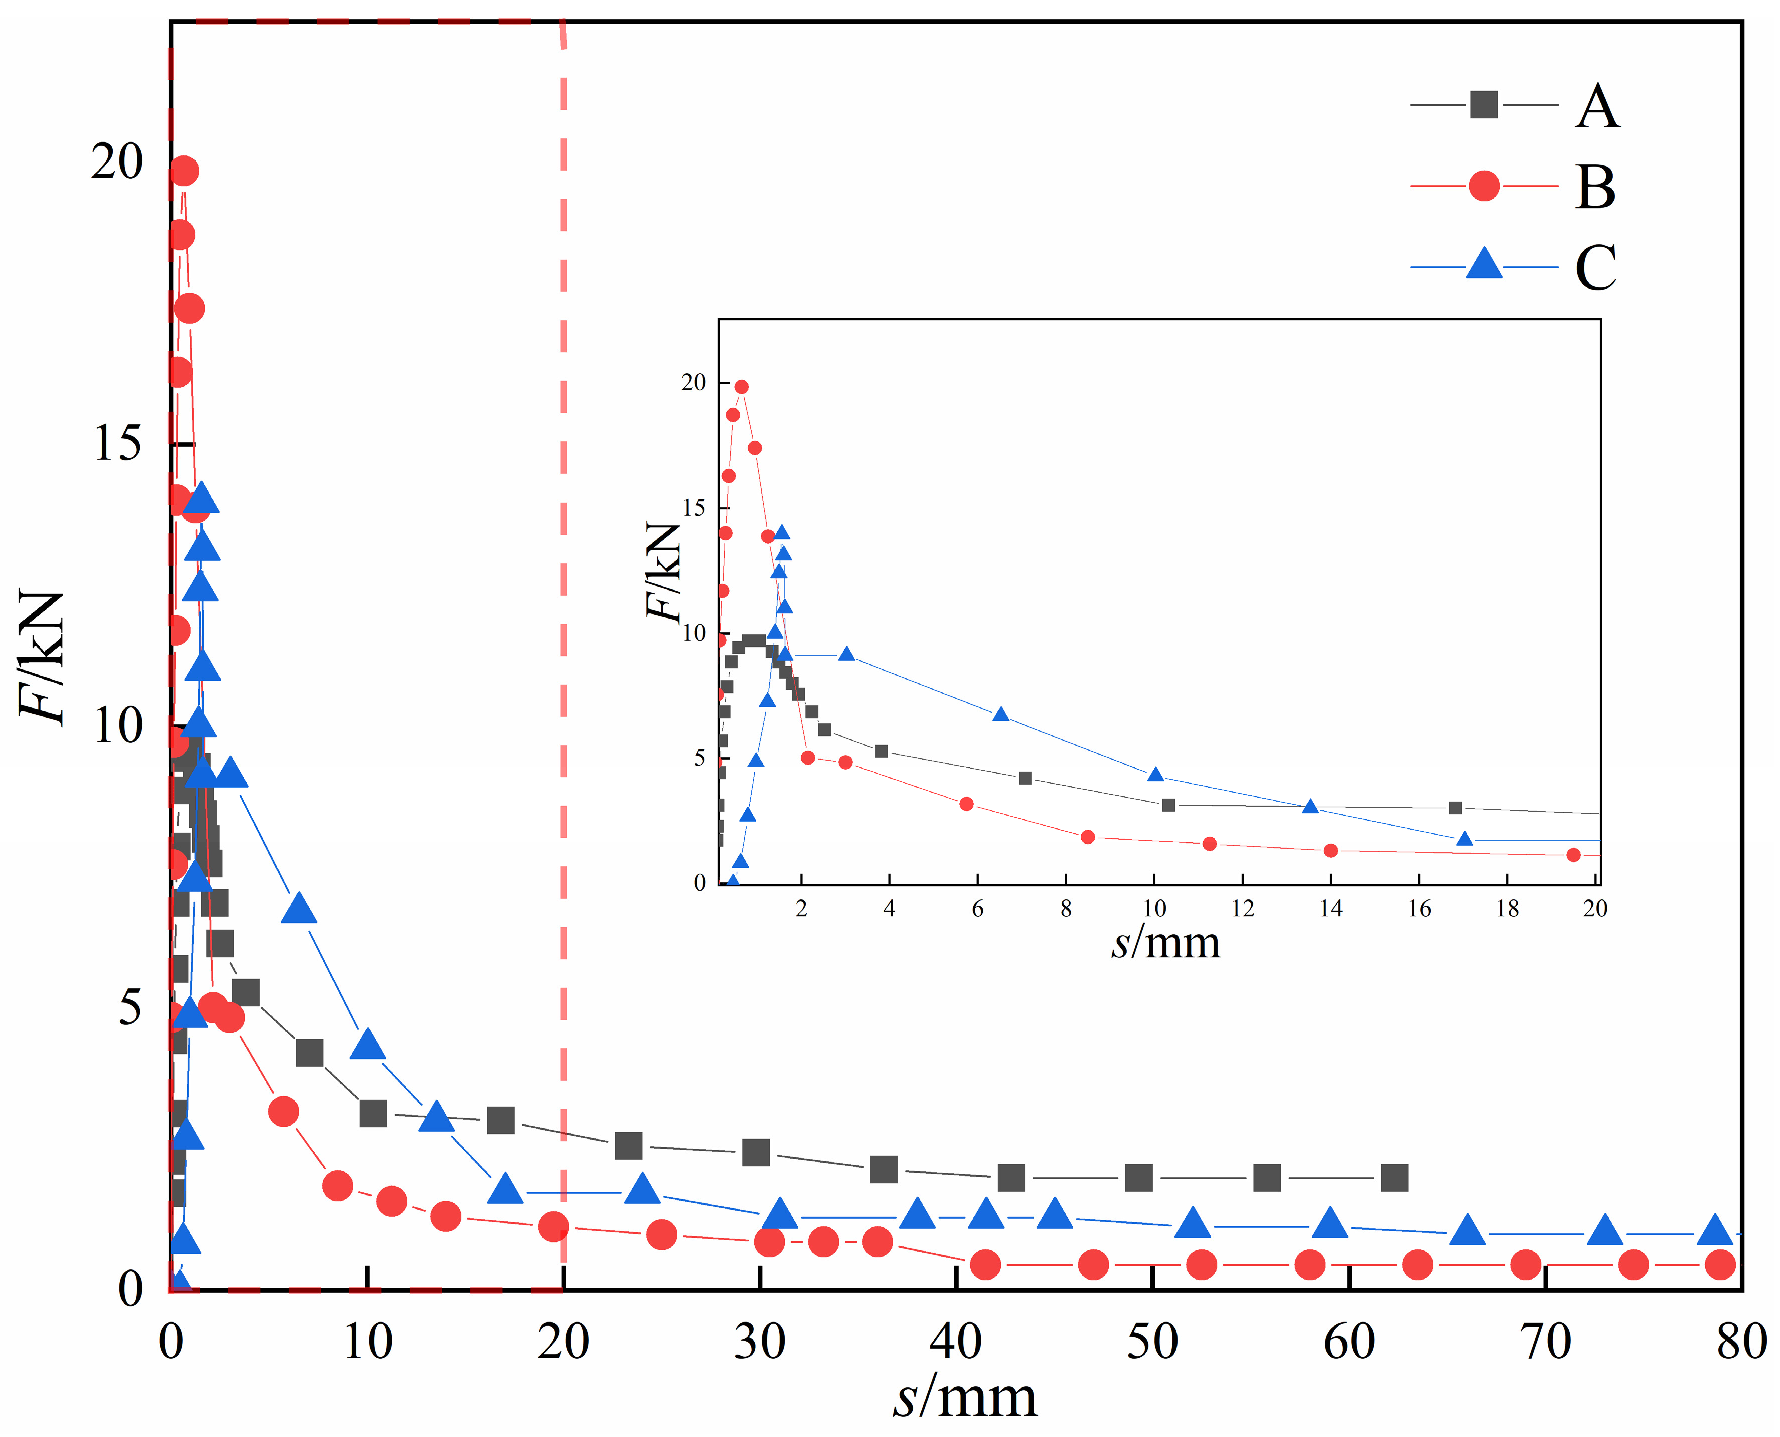
4.1. Load–Displacement Curve Analysis

The specimen predominantly exhibited pull-out failure, with its failure process demonstrating fundamental characteristics typical of this type of failure, as illustrated in Figure 4. Additionally, the load (F)-slip (s) curves for concrete specimens with varying steel bar diameters, as presented in Figure 5, could be categorized into four distinct stages.
(1)
Micro-slip stage. At the start of loading, the curve showed a linear upward trend. During this phase, the slope was greater, resulting in slight slip, and the load–slip curve was in the elastic stage. The gel formed by the hydration of the cement in the concrete and the bonding of the steel bar surface had not been broken, and the bond stresses consisted mainly of chemical bonding forces. The relative slip increased progressively as the load increased.
(2)
Slip stage. As the pull-out load increased, the loaded end of the steel bar started to slip, leading to a non-linear evolution of the load–slip curve. This behavior indicated that the bond at the surface of the steel bar was failing, with the bond stress consisting mainly of the mechanical interlock between the steel bar and the concrete. As a result, the pull-out load reached its peak value, which corresponded to the ultimate bond stress.
(3)
Descending stage. As the ultimate load was reached, the load dropped rapidly to a significantly lower level, accompanied by a slight increase in slip. Gradual crushing of the concrete at the edges of the steel bar ribs occurred, leading to a reduction in the mechanical interlock between the steel bar and the concrete. Internal cracks in the concrete continued to develop, but did not manifest as a significant surface crack, thus maintaining the integrity of the concrete. Consequently, the surface of the specimen remained intact with no apparent cracking.
(4)
Residual stage. During this stage, the relative displacement of the extracted specimen experienced a significant increase, while the load gradually decreased and stabilized until the steel bar was completely pulled out. In this residual stage, the bond stress between the steel bar and the concrete was mainly due to friction between the two contact surfaces.
The pull-out failure stage was not only a direct manifestation of the bond performance at the interface between reinforcing steel and concrete, but also a crucial indicator for assessing the overall structural safety and durability. During this stage, the bond stress gradually increased to a peak before commencing a decline, accompanied by shifting compositions within the bond stress. A thorough analysis of this process was instrumental in revealing the laws governing the variation in bond force with load, as well as the mechanism underlying bond failure.

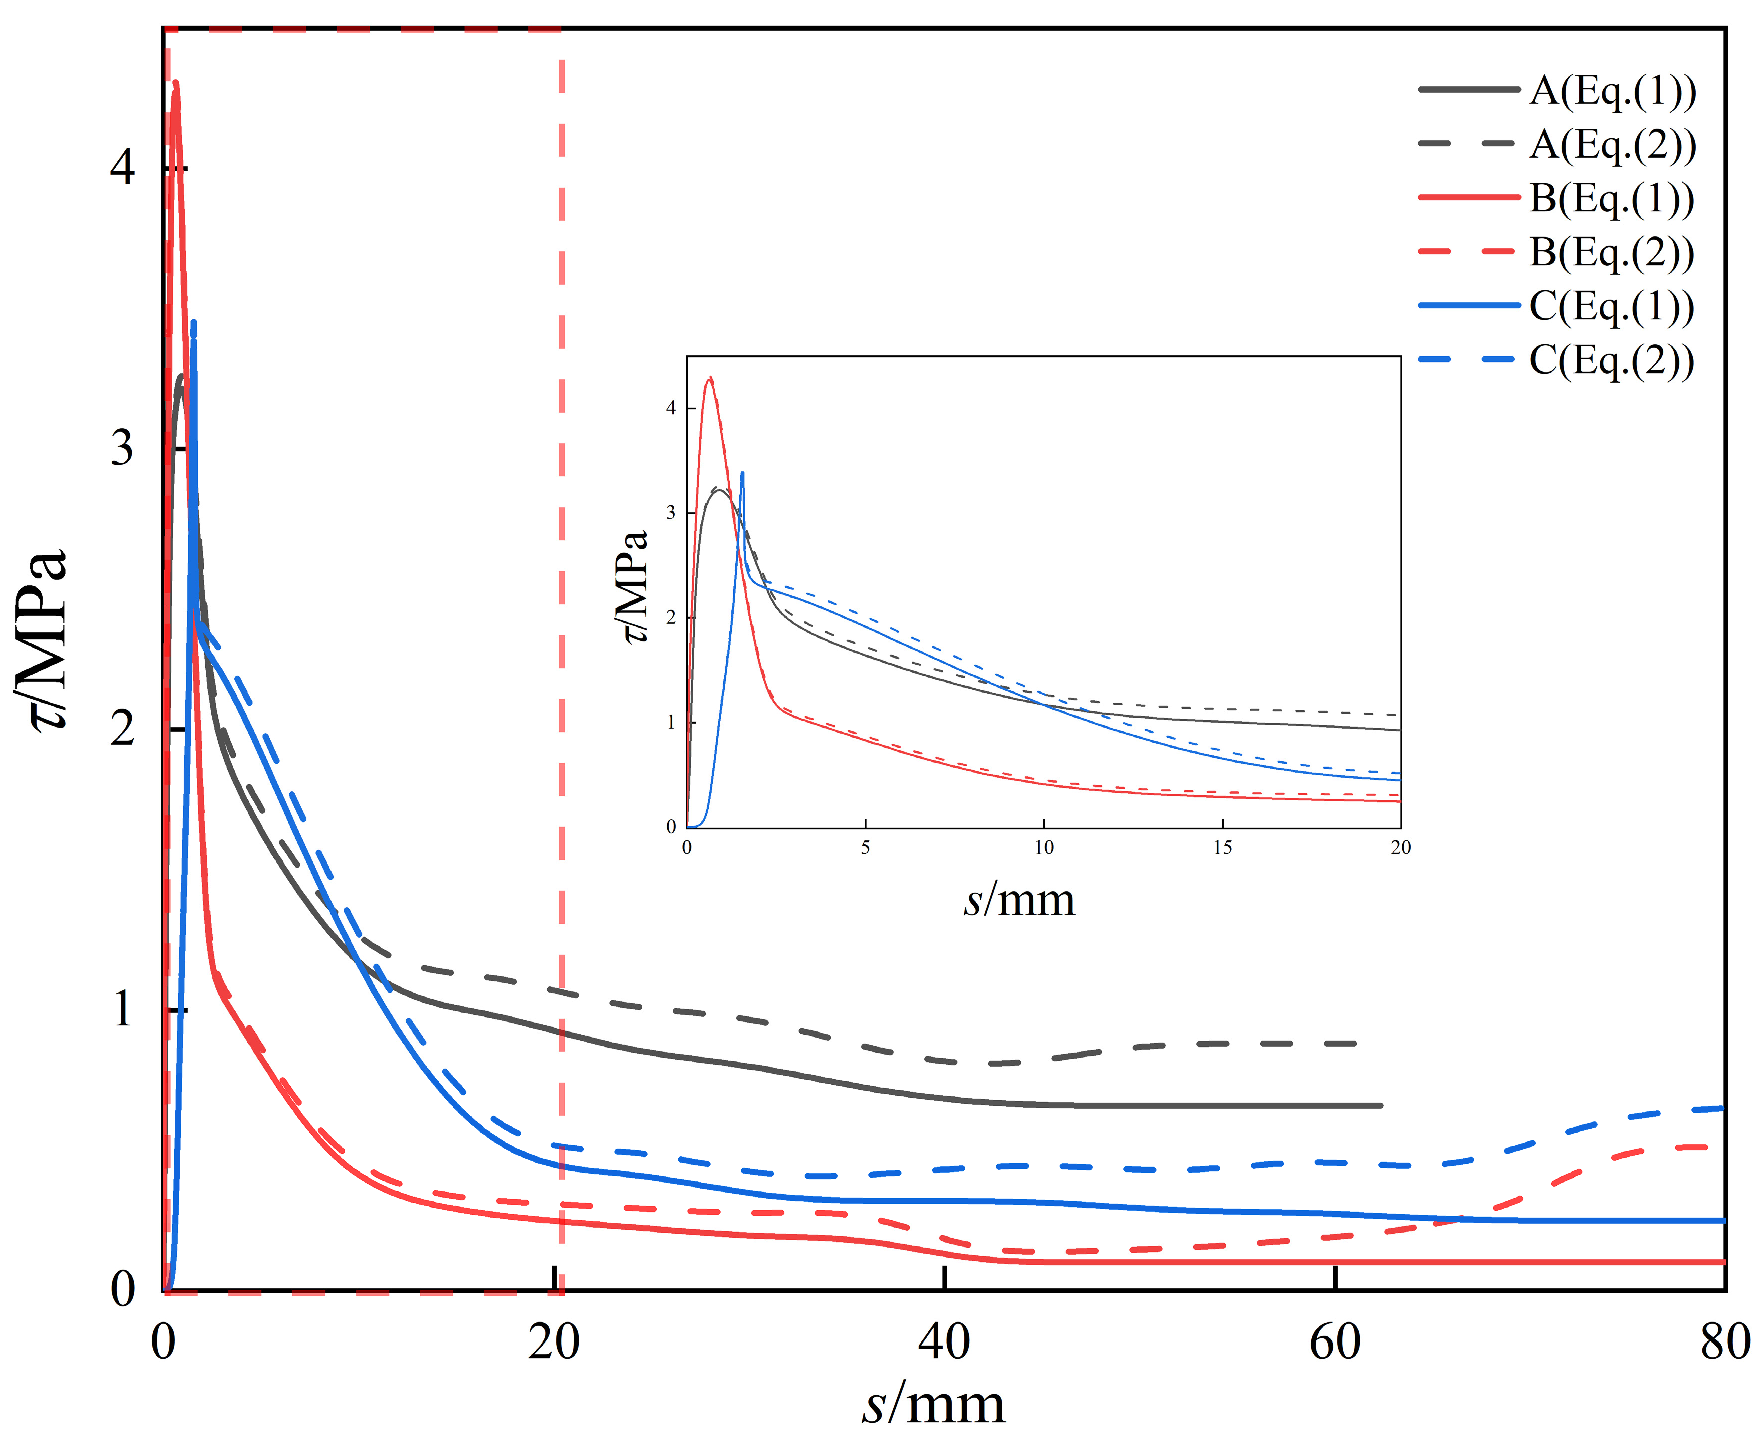
4.2. Influence of the Equation for Calculating Bonded Stresses

During the test, it was observed that the contact area between the steel bar and the concrete changed due to relative slip. When the steel bar was in complete contact with the concrete (see Figure 6a), the bond stress between the steel bar and the concrete was primarily supported by chemical bonding before bond slip occurred. After the initiation of slip, the bond stress was predominantly sustained by mechanical interlocking and frictional forces, with distinct distribution patterns emerging post-slip. Additionally, the segment of steel bar entering the bonded region due to relative slip experienced only frictional forces. These frictional forces arose in the bonded area between the steel bar and concrete due to relative slip, while bond stresses in other parts of the bonded area were supported by mechanical interlock and friction. When the steel bar is in partial contact with the concrete (see Figure 6b), the bond stress was confined to the bonded region of contact and consisted solely of friction. This situation diverged from phenomena described by existing Equation (1), necessitating modifications to derive Equation (2) that accounted for both complete and partial contacts, as follows:
F = π d ( l s ) τ m + τ s s ( 0 s < l ) τ s l ( l s )
where τm is the bond stress in the bond region, MPa; τs is the bond stress in the non-bond region, MPa; and s is the relative slip, mm.
The relationship curves of bond stress (τm) and relative slip (s) derived from Equations (1) and (2) are shown in Figure 7, which presents the results of the pull-out tests. The relative slip values in the figure are all greater than or equal to the anchorage length of each group of specimens, indicating complete separation of the steel bar from the bonded region. The pull-out failure process of the specimens is complete and the variation in bond stress with relative slip is clearly visible.
The relative slip values of the three groups of specimens at ultimate bond stress were less than 5 mm, accompanied by lower ultimate bond stress values. This was attributed to the lower concrete strength resulting in reduced chemical adhesion between the steel bar and the concrete and earlier failure.
The bond stress peaked and then decreased rapidly until it stabilized at a very small value in the residual stage and remained constant as the relative slip increased.
Analysis of the relationship curves between bond stress and relative slip showed that the trend of the bond-slip curves for each group of specimens remained largely consistent across the different calculation methods. However, the difference between the two calculations gradually increased as the relative slip increased, particularly in the residual stage, as shown in Figure 7. Furthermore, this discrepancy became more pronounced as the diameter of the steel bars increased. This was because as the diameter of steel bars increased, the distribution of bond stress became increasingly complex and heterogeneous. Equation (1) adopted a simplified assumption of uniform bond stress distribution within the bond zone during its derivation. However, for steel bars with larger diameters, this assumption significantly diverged from reality. In contrast, Equation (2) abandoned this simplified approach and provided a more realistic representation of the bond stress distribution between steel bars and concrete.
In addition, when the bar diameters were 18 mm and 20 mm, the anchorage length was 80 mm. This value remained within the range of 5d; however, the difference was significantly greater than that observed for a bar diameter of 16 mm. This suggested that even within this assumed range, discrepancies exist between the results calculated using Equation (1) and the actual outcomes, resulting in errors between the calculated results and the actual conditions. This discrepancy affected the comparability of bond stress data, which in turn affected the conclusions drawn from the tests and reduced their reliability.
In summary, compared to Equation (1), Equation (2) proposed in this paper for the calculation of bond stress overcame the limitation of assuming a uniform bond stress distribution in the bonded section. This adjustment brought Equation (2) closer to accurately representing the distribution of bond stress between the steel bar and the concrete during the pull-out test, resulting in more realistic results. Furthermore, Equation (2) is not limited to the destructive stage of the specimen test; it could accurately calculate bond stresses throughout the pullout process. Therefore, in numerical simulations or practical engineering applications, it was recommended that Equation (2) be used to analyze bond stress, as it increased the reliability of the research conclusions.

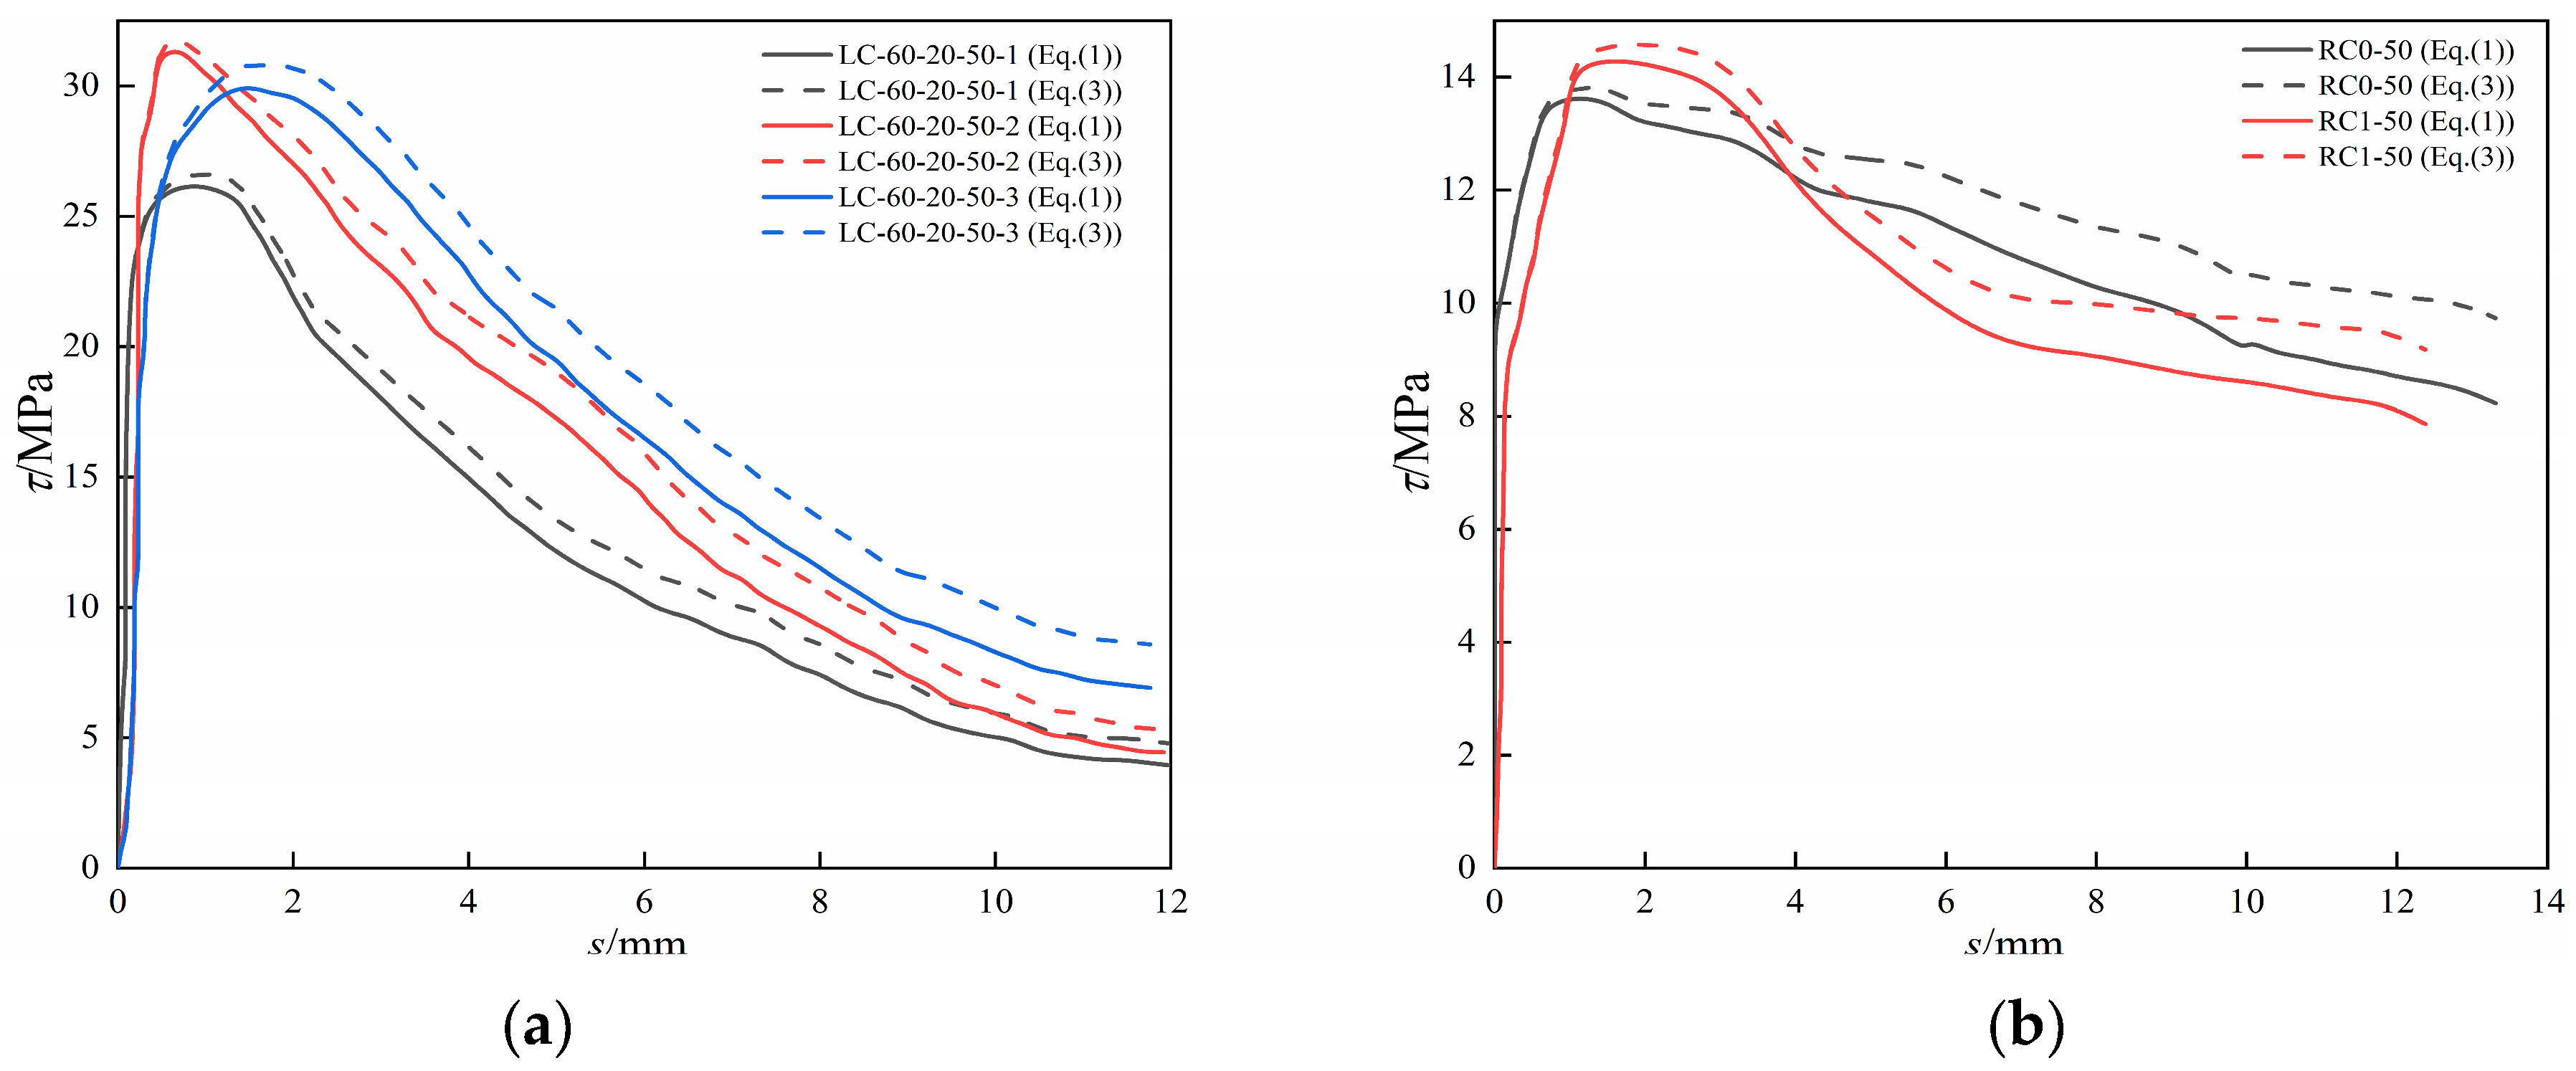
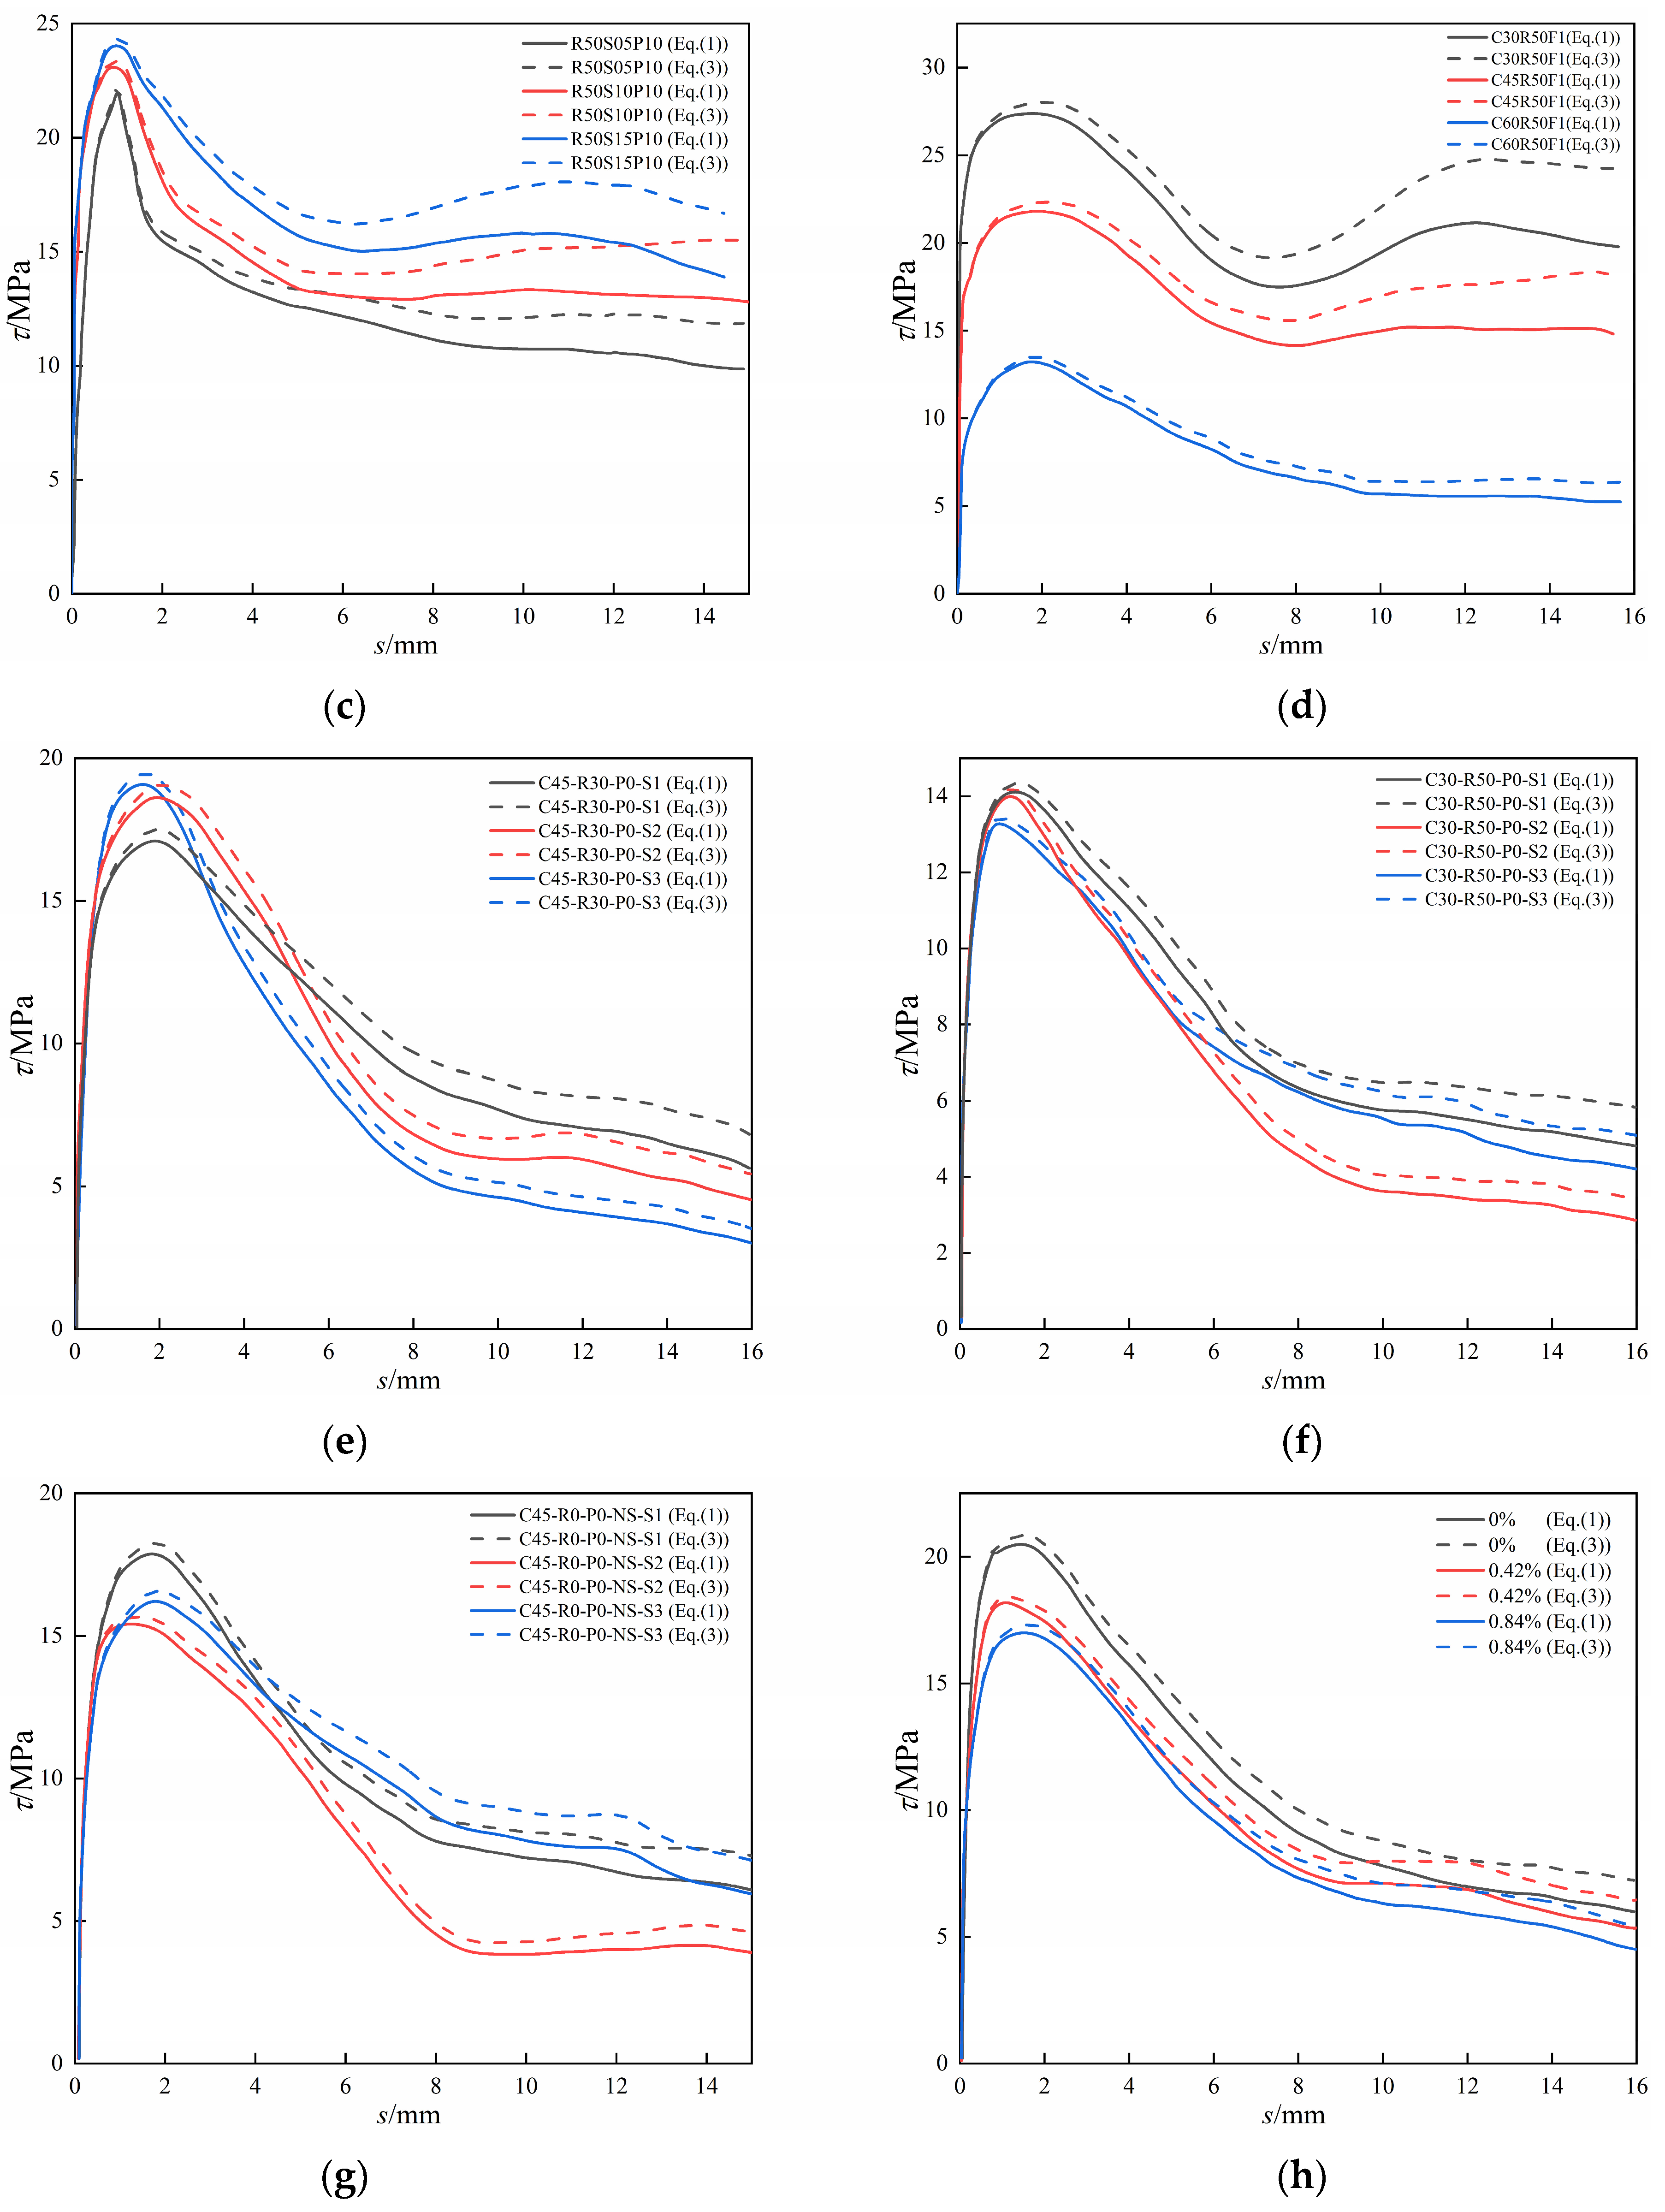
4.3. Comparative Analysis of Different References

In order to further quantify the differences between the two equations, 23 sets of experimental data from different references were cited and calculated separately using the two equations [32,33,34,35]. The results of the calculations were counted for differences and analyzed comparatively. It was important to note that the tests referenced did not involve the complete pull-out of the steel bar; instead, they only recorded the failure process of the specimen. Consequently, the steel bar remained in full contact with the concrete, and the bond stress was calculated by the following equation:
τ m = F τ s s π d l s ( 0 s < l )
Calculations were performed according to Equations (1) and (3) and the results are shown in Figure 8.
From the results in Figure 8, it can be observed that there was the same pattern in the different curves as in the experimental results. The calculated results of the two equations had the same trend and were basically in agreement in the whole, but the difference between Equations (1) and (3) gradually increased with the increase in the relative slip and reached the maximum value in the residual stage. Therefore, the difference between Equations (1) and (3) was further quantified through a difference analysis using ultimate bond stress and residual bond stress as examples, as shown in Table 4.
From the variance analysis presented in Table 4, it is evident that the differences in ultimate bond stress were less than 3%, while the residual bond stress was approximately 20%, revealing a significant disparity between the two mean values. The variance and standard deviation of the residual bond stress were several times greater than those of the ultimate bond stress, indicating that the volatility of the former was considerably larger than that of the latter. In contrast to the mean value, variance, and standard deviation, the coefficient of variation in residual cohesive stress was significantly smaller than that of ultimate cohesive stress, indicating a limited degree of variation and dispersion. Furthermore, it was evident that the discrepancies between the results of various equations for calculating residual cohesive stress were greater than those for ultimate cohesive stress, and this fluctuation was obvious, which cannot be ignored. This was attributed to the fact that the slip corresponding to residual bond stress significantly exceeded that associated with ultimate bond stress, causing reinforcement initially in a non-bonded state to gradually transition into a bonded zone, thereby exacerbating the uneven distribution of bond stress. As this transition occurred, the calculation accuracy of Equation (1) gradually diminished, leading to a notable increase in the deviation between its results and those obtained from Equation (3).
In conjunction with Figure 8, it was apparent that the differences in plots (a), (c), and (d) were the most pronounced, whereas (b) and (e) exhibited the least distinction. Numerically, the difference in ultimate bond stress among the nine curves in plots (a), (c), and (d) remained below 3%, whereas the residual bond stress exceeded 20% in all cases. The ultimate bonding stresses of the five curves in plots (b) and (e) ranged from 2% to 3%, except for RC0-50, which was below 1%. The residual bonding stresses were all below 20%, except for C45-R30-P0-S1, which exceeded 20%.
In order to improve the clarity and comprehensibility of the comparative analysis of ultimate bond stress and residual bond stress calculated using different equations, Figure 9 was generated using the data from Table 4. Figure 9 reflects the distribution of the difference values between the two calculation methods in the histogram. The majority of differences in ultimate bond stress ranged from 1.0% to 2.5%, with small fluctuations, while the differences in residual bond stress spanned from 20% to 22%, demonstrating significant fluctuations. These findings are consistent with the results of the analysis in Table 4.
In summary, the difference between Equations (1) and (3) increased as the relative slip increased. The ultimate bond stress showed a small fluctuation with a high degree of dispersion, whereas the residual bond stress exhibited considerable fluctuation but a lower degree of dispersion. Therefore, Equation (3), which better reflected the actual scenario, should be used to calculate both ultimate bond stress and residual bond stress.
To ascertain the broad applicability of Equation (3), a comparative analysis was conducted with Equation (4) presented in the CEB-FIP Model Code 2010 [36]. Due to the fundamental differences in the methodologies employed by the two models for addressing residual bond stresses, the comparison was focused solely on the ultimate bond strength as an illustrative case study, and the results are presented in Table 5.
τ max = 2.5 f ck c d 0.25 ( 1 + 0.4 A tr S h d )
f ck 0.83 f cu
where fck is the cylindrical compressive strength of concrete, MPa; c is the concrete cover thickness, mm; Atr is the cross-sectional area of transverse reinforcement, mm2; and Sh is the spacing of transverse reinforcement, mm.
As indicated in Table 5, the average difference between Formulas (3) and (4) was 4.41%, which was significantly smaller than the range of 26% to 42% reported in references [36,37,38,39,40,41,42]. This demonstrated that Formula (3) effectively enhanced the accuracy of Formula (1) and possessed a broader applicability.

5. Conclusions

A series of pull-out tests were conducted and data from various references were utilized to systematically quantify the differences between the two calculation methods. As a result, the following conclusions were drawn:
(1)
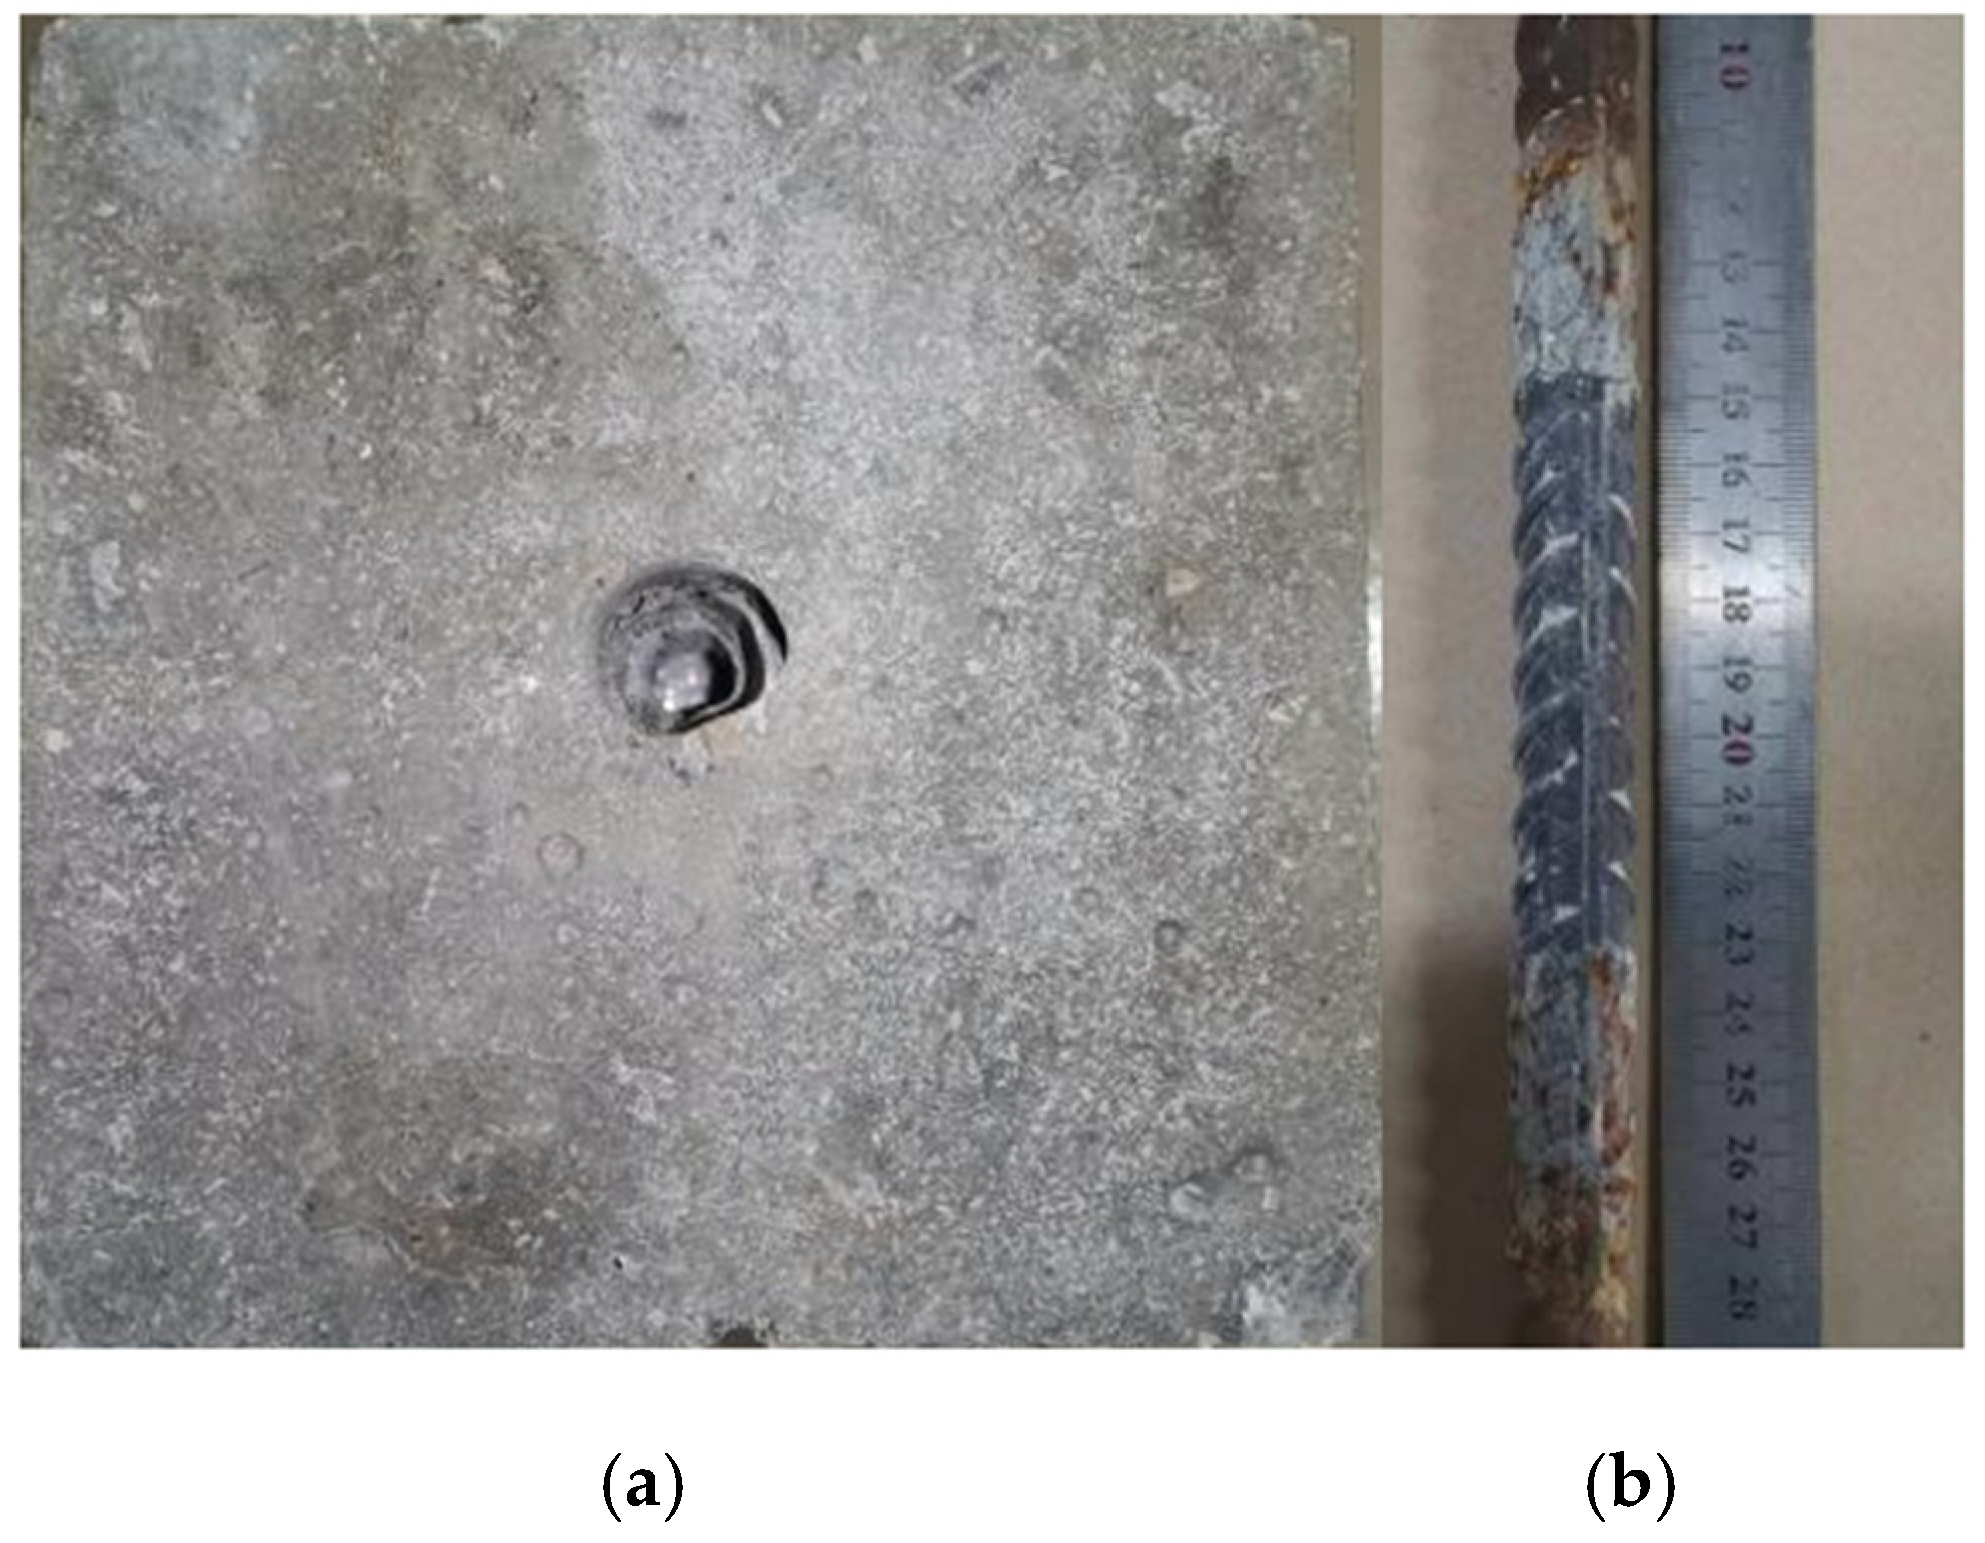
The main damage mode of the specimen was a pull-out failure. According to the load (F)–slip (s) curve, the damage process could be approximately divided into four stages: micro-slip stage, slip stage, descent stage, and residual stage.
(2)
Further analysis using difference equations for calculating bond stress, together with reference to various references, aimed to quantify the differences between the equations. The results indicate a linear or near linear increase in numerical disparity with increasing relative slip, with the greatest disparity observed in the residual stage, where the maximum disparity in residual bond stress reached 23.99%. This was due to the highly non-uniform distribution of bond stress between the steel rebar and concrete during the residual stage. Equation (1), which was based on the assumption of uniform distribution, struggled to accurately capture this non-uniformity. In contrast, Equation (2) was more aligned with reality, capable of precisely reflecting the local variations in bond stress at the interface and providing more accurate predictions of residual bond stress.
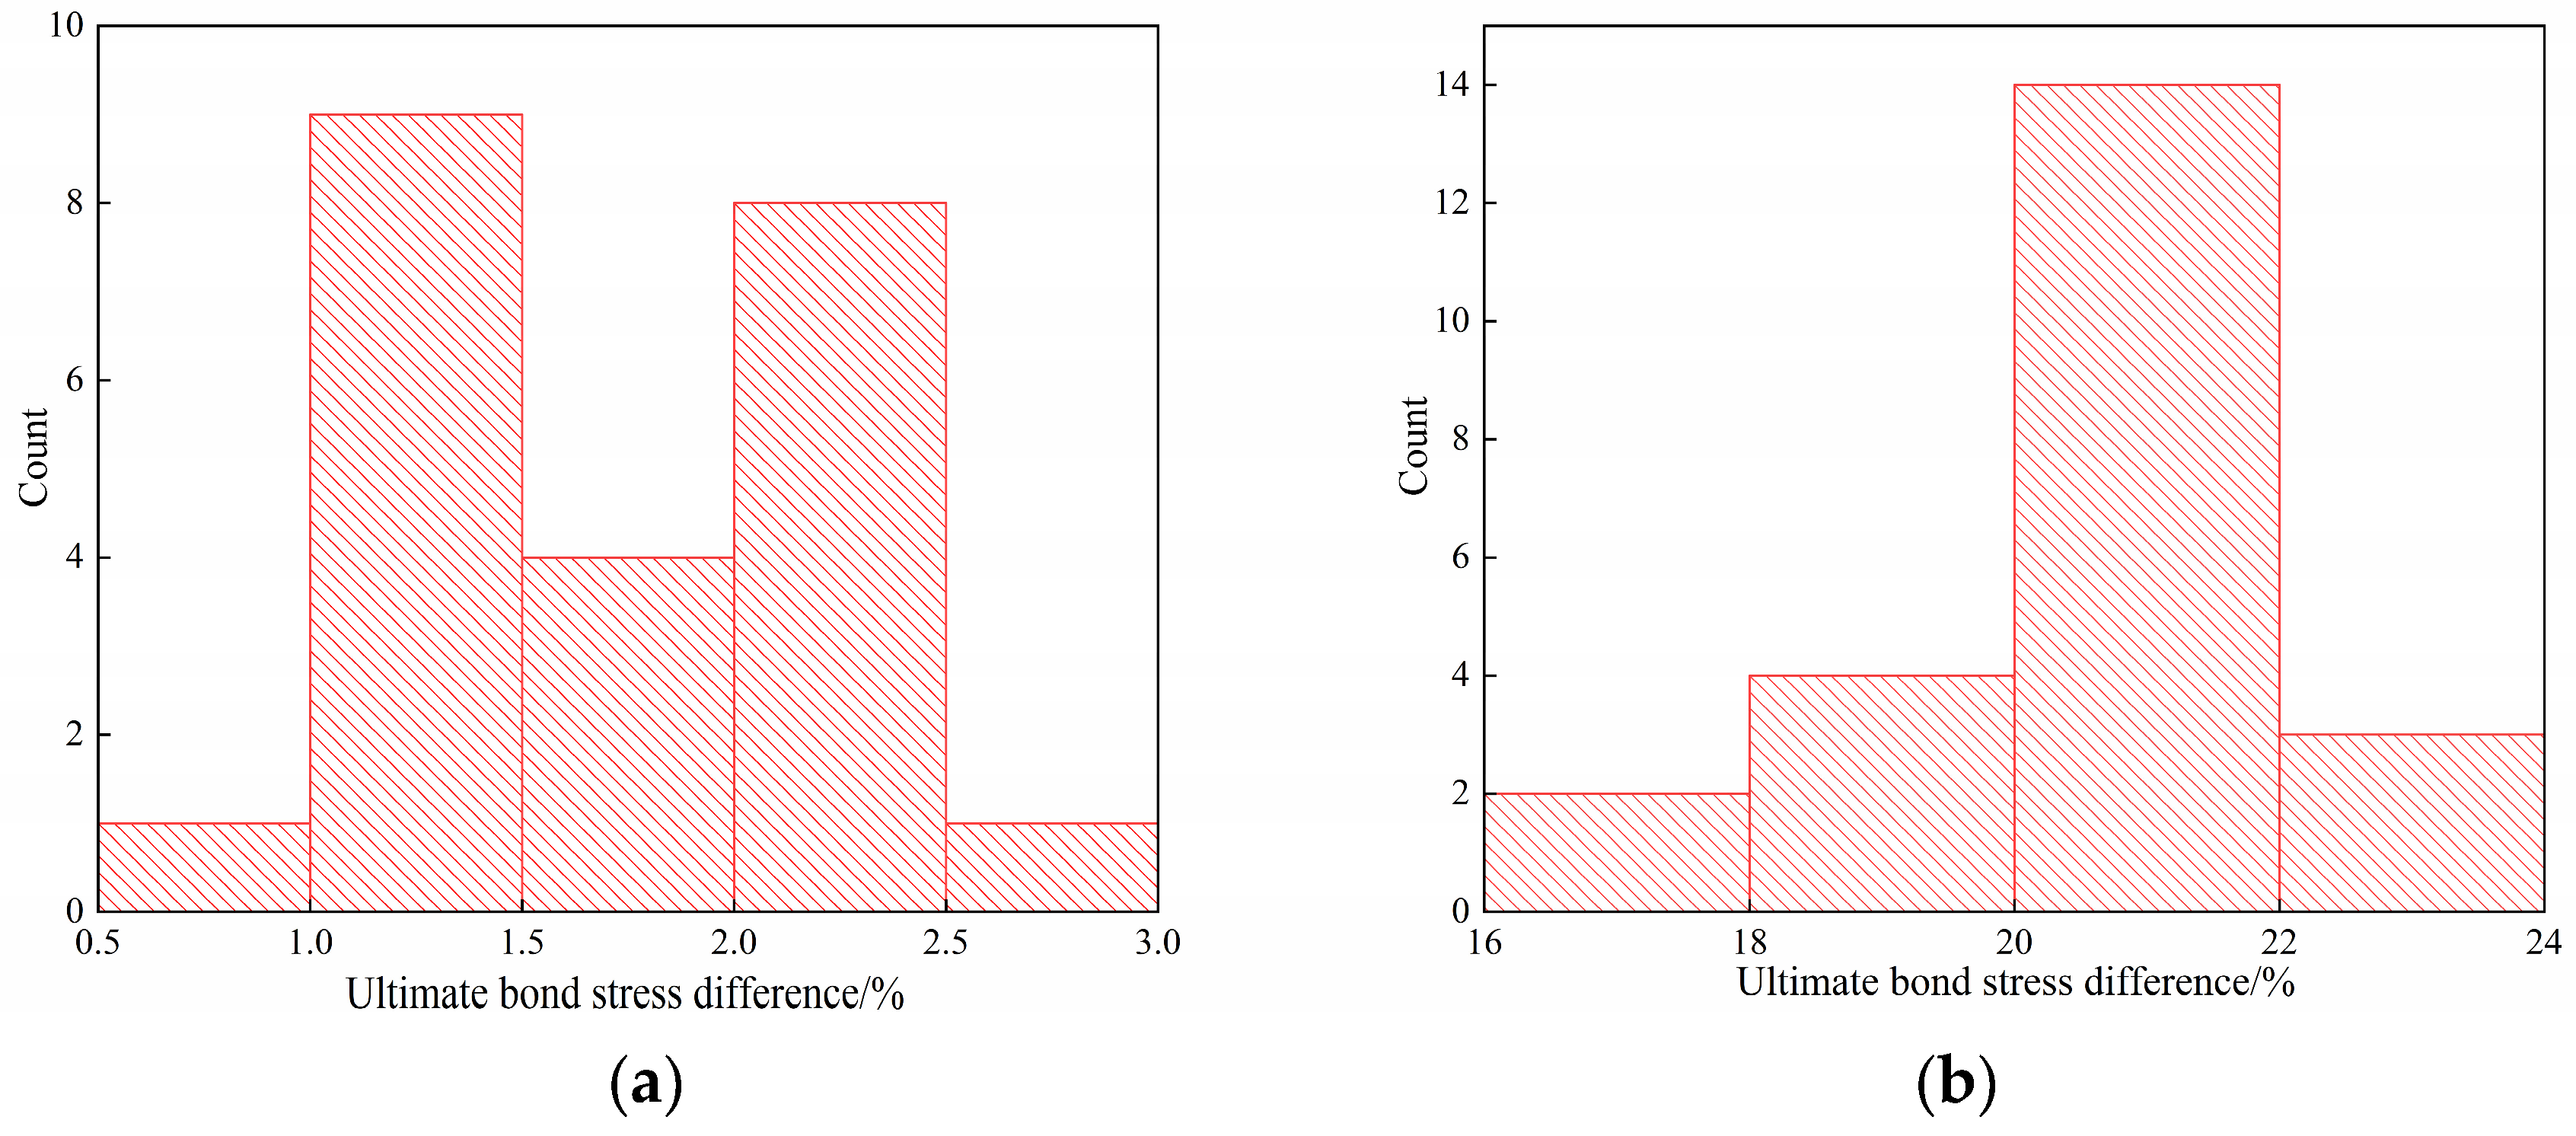
(3)
Differential analysis of the ultimate bond stress and the residual bond stress revealed that most of the calculated differences in ultimate bond stress fall within the range of 1.0% to 2.5%, exhibiting small fluctuations but large dispersion. Conversely, the majority of the calculated differences in residual bond stress fall in the range of 20% to 22%, showing large fluctuations with a small degree of dispersion.
(4)
When calculating the bond stress between steel reinforcement and concrete, the revised Equation (2) demonstrated enhanced precision. Compared to the existing Equation (1), which was based on the assumption of uniform bond stress distribution, the revised Equation (2) exhibited significantly reduced differences when compared to other international models and possessed a broader range of applicability. Consequently, the proposal of the revised Equation (2) was highly necessary.

Author Contributions

Conceptualization, X.Y. and Y.S.; methodology, S.T. and J.L.; investigation, M.M.R.; data curation, J.L. and M.M.R.; writing—review and editing, X.Y. and J.L.; supervision, Y.S. and X.Y.; project administration, S.T.; funding acquisition, S.T. All authors have read and agreed to the published version of the manuscript.

Funding

This research was funded by the Science and Technology Tackling Projects in Henan Province (252102321089), the Natural Science Foundation of Henan Province (242300420063), and the International Science and Technology Cooperation Projects in Henan Province (241111521200).

Data Availability Statement

The data that support the findings of this study are available from the corresponding author upon reasonable request.

Conflicts of Interest

The authors declare no conflicts of interest, and the manuscript is approved by all authors for publication.

References

  1. Ganesan, N.; Indira, P.V.; Sabeena, M.V. Bond stress slip response of bars embedded in hybrid fiber reinforced high performance concrete. Constr. Build. Mater. 2014, 50, 108–115. [Google Scholar] [CrossRef]
  2. Alharbi, Y.R.; Galal, M.; Abadel, A.A.; Kohail, M. Bond behavior between concrete and steel rebars for stressed elements. Ain Shams Eng. J. 2021, 12, 1231–1239. [Google Scholar] [CrossRef]
  3. Li, L.G.; Chen, Z.P.; Ouyang, Y.; Zhu, J.; Chu, S.H.; Kwan AK, H. Synergistic effects of steel fibers and expansive agent on steel bar-concrete bond. Cem. Concr. Compos. 2019, 104, 103380. [Google Scholar] [CrossRef]
  4. Gao, D.Y.; Chen, G.; Tang, J.Y.; Hadi, M.; Najib, S.; Zhao, L.P. Calculation method of bond strength between rebar and steel fiber reinforced concrete. J. Build. Struct. 2018, 39, 149–157. [Google Scholar] [CrossRef]
  5. Li, W. Fracture Mechanics Analysis of the Failure Behavior of FRP-Concrete Interface. Ph.D. Thesis, South China University of Technology, Guangzhou, China, 2021. [Google Scholar]
  6. Liu, M.; Zhang, R.; Jin, L.; Du, X. Mesoscale modelling of bond failure behavior of ribbed steel bar and concrete interface. E3S Web Conf. 2021, 272, 02003. [Google Scholar] [CrossRef]
  7. Oreta, A.W.C. Bond strength prediction model of corroded reinforcement in concrete using neural network. GEOMATE J. 2019, 16, 55–61. [Google Scholar] [CrossRef]
  8. Mo, D.; Wan, L.; Peng, C.; Zhang, J.; Chang, Y. Tensile elastic properties of reinforced concrete bond damage based on stochastic cracking theory. J. Guangxi Univ. Nat. Sci. Ed. 2021, 46, 538–544. [Google Scholar]
  9. Wang, Y.; Geem, Z.W.; Nagai, K. Bond strength assessment of concrete-corroded rebar interface using artificial neutral network. Appl. Sci. 2020, 10, 4724. [Google Scholar] [CrossRef]
  10. Liu, X.; Liu, Y.; Wu, T.; Wei, H. Bond-slip properties between lightweight aggregate concrete and rebar. Constr. Build. Mater. 2020, 255, 119355. [Google Scholar] [CrossRef]
  11. Issa, C.A.; Masri, O. Numerical simulation of the bond behavior between concrete and steel reinforcing bars in specialty concrete. Int. J. Civ. Environ. Eng. 2015, 9, 767–774. [Google Scholar]
  12. Mao, W.H.; Liu, J.P.; Ding, Y.; Chen, Y.F. Bond-slip constitutive model and numerical analysis for rebar embedded in steel-polyethylene hybrid fiber-reinforced cementitious composites. Constr. Build. Mater. 2021, 308, 125092. [Google Scholar] [CrossRef]
  13. Su, T.; Wang, T.; Yi, H.; Zheng, R.; Liu, Y.; Zhai, H.; Huang, Z. Finite element analysis on the bond behavior of steel bar in salt–frost-damaged recycled coarse aggregate concrete. Rev. Adv. Mater. Sci. 2021, 60, 853–861. [Google Scholar] [CrossRef]
  14. Biscaia, H.C. Experimental and numerical evaluations of the bond behaviour between ribbed steel rebar and concrete. Arch. Civ. Mech. Eng. 2023, 23, 159. [Google Scholar] [CrossRef]
  15. Huang, Y.; Liu, Y. Review of Bond-Slip Behavior between Rebar and UHPC: Analysis of the Proposed Models. Buildings 2023, 13, 1270. [Google Scholar] [CrossRef]
  16. Bahmani, H.; Mostofinejad, D. A review of engineering properties of ultra-high-performance geopolymer concrete. Dev. Built Environ. 2023, 14, 100126. [Google Scholar] [CrossRef]
  17. Mohebi, Z.H.; Bahnamiri, A.B.; Dehestani, M. Effect of polypropylene fibers on bond performance of reinforcing bars in high strength concrete. Constr. Build. Mater. 2019, 215, 401–409. [Google Scholar] [CrossRef]
  18. Islam, K.; Billah, A.M.; Chowdhury MM, I.; Ahmed, K.S. Exploratory study on bond behavior of plain and sand coated stainless steel rebars in concrete. Structures 2020, 27, 2365–2378. [Google Scholar] [CrossRef]
  19. Li, H.; Deeks, A.J.; Su, X. Experimental study on compressive bond anchorage properties of 500 MPa steel bars in concrete. J. Struct. Eng. 2013, 139, 04013005. [Google Scholar] [CrossRef]
  20. Billah, A.H.M.M.; Alam, M.S. Bond behavior of smooth and sand-coated shape memory alloy (SMA) rebar in concrete. Structures 2016, 5, 186–195. [Google Scholar] [CrossRef]
  21. Yazıcı, Ş.; Arel, H.Ş. The effect of steel fiber on the bond between concrete and deformed steel bar in SFRCs. Constr. Build. Mater. 2013, 40, 299–305. [Google Scholar] [CrossRef]
  22. Liang, M.; Yu, Y.; Xu, G.; Li, Q.; Pan, Y. Experimental study on bond performance between carbon/glass-hybrid-fiber-reinforced polymer bars and concrete. Adv. Struct. Eng. 2023, 27, 13694332231224126. [Google Scholar] [CrossRef]
  23. Su, T.; Wang, T.; Wang, C.; Yi, H. The influence of salt-frost cycles on the bond behavior distribution between rebar and recycled coarse aggregate concrete. J. Build. Eng. 2022, 45, 103568. [Google Scholar] [CrossRef]
  24. Varona, F.B.; Baeza, F.J.; Bru, D.; Ivorra, S. Evolution of the bond strength between reinforcing steel and fiber reinforced concrete after high temperature exposure. Constr. Build. Mater. 2018, 176, 359–370. [Google Scholar] [CrossRef]
  25. Chiriatti, L.; Mercado-Mendoza, H.; Apedo, K.L.; Fond, C.; Feugeas, F. A study of bond between steel rebar and concrete under a friction-based approach. Cem. Concr. Res. 2019, 120, 132–141. [Google Scholar] [CrossRef]
  26. GB175-2023; Common Portland Cement. Standards Press of China: Beijing, China, 2023.
  27. GB/T14684-2022; Sand for Construction. Standards Press of China: Beijing, China, 2022.
  28. GB/T14685-2022; Pebble and Crushed Stone for Construction. Standards Press of China: Beijing, China, 2022.
  29. GB/T 28900-2022; Test Methods of Steel for Reinforcement of Concrete. Standards Press of China: Beijing, China, 2022.
  30. GB/T50080-2016; Standard for Test Method of Performance on Ordinary Fresh Concrete. China Architecture & Building Press: Beijing, China, 2016.
  31. GB/T 50081-2019; Standard for Test Methods of Concrete Physical and Mechanical Properties. China Architecture & Building Press: Beijing, China, 2019.
  32. Wang, C.; Wu, Y.; Cao, F. Experimental study on bond behavior under coupling effect of freezing-thawing between corroded steel bar and recycled concrete. J. Build. Struct. 2022, 43, 382–393. [Google Scholar] [CrossRef]
  33. Gao, D.; Yan, H.; Fang, D.; Yang, L. Bond strength and prediction model for deformed bar embedded in hybrid fiber reinforced recycled aggregate concrete. Constr. Build. Mater. 2020, 265, 120337–120349. [Google Scholar] [CrossRef]
  34. Gao, D.; Zhu, Q. Bond slip performance and model of steel reinforcement and steel fiber reinforced recycled concrete. China J. Highw. Transp. 2018, 31, 172–180. [Google Scholar]
  35. Zhu, Q.; Chen, J.; He, Y.; Sun, X. Bond stress distribution and bond–slip model of deformed steel bars in iron tailing sand recycled aggregate concrete. Buildings 2023, 13, 1176. [Google Scholar] [CrossRef]
  36. Fib. Fib Bulletin 72: Bond Models for Structural Concrete; International Federation for Structural Concrete: Lausanne, Switzerland, 2014; pp. 102–115. [Google Scholar] [CrossRef]
  37. Eligehausen, R.; Popov, E.P.; Bertero, V.V. Local bond stress-slip relationships of deformed bars under generalized excitations. ACI Struct. J. 1983, 80, 333–351. [Google Scholar] [CrossRef]
  38. Wang, T.M.; Li, J.; Zhang, W.P. Experimental and comparative study on bond behavior of short anchorage rebars. J. Build. Struct. 2020, 41, 45–53. [Google Scholar]
  39. National Institute of Standards and Technology. Database and Analysis of Bond-Slip Tests: NIST IR 8215; NIST: Gaithersburg, MD, USA, 2021. [Google Scholar]
  40. ACI Committee 408. ACI 408.3R-15: Report on Bond of Steel Reinforcing Bars Under Cyclic Loads; American Concrete Institute: Farmington Hills, MI, USA, 2015. [Google Scholar]
  41. Ministry of Housing and Urban-Rural Development of the People’s Republic of China. GB 50010-2010: Code for Design of Concrete Structures; China Architecture & Building Press: Beijing, China, 2010. [Google Scholar]
  42. Chen, Z.Y.; Qian, J.R. Bond stress distribution in short anchorage based on distributed optical fiber sensing. Eng. Mech. 2023, 40, 78–89. [Google Scholar]
Figure 1. Grading curve: (a) fine aggregate; (b) coarse aggregate.
Buildings 15 01174 g001
Figure 2. Pull-out specimen (mm): (a) top view; (b) section view.
Buildings 15 01174 g002
Figure 3. Test set-up: (a) photo; (b) sketch.
Buildings 15 01174 g003
Figure 4. Characteristics of the specimen: (a) concrete; (b) steel.
Buildings 15 01174 g004
Figure 5. Load–slip curves. Note: The region enclosed by the red dashed box in the figure is magnified and displayed in the central inset.
Buildings 15 01174 g005
Figure 6. Steel bar–concrete contact surface: (a) full contact; (b) partial contact.
Buildings 15 01174 g006
Figure 7. The influence of bonding stress calculation equation on the bonding slip curve. Note: The region enclosed by the red dashed box in the figure is magnified and displayed in the central inset.
Buildings 15 01174 g007
Figure 8. The comparison results of Equations (1) and (3) from different references: (a) reference [10]; (b) reference [32]; (c) reference [33]; (d) reference [34]; (eh) reference [35].
Buildings 15 01174 g008aBuildings 15 01174 g008b
Figure 9. The dispersion of differences between Equations (1) and (3): (a) ultimate bond stress; (b) residual bond stress.
Buildings 15 01174 g009
Table 1. Properties of cement.
Specific Surface Area/(m2/kg)Initial Setting Times/minFinal Setting Times/minCompressive Strength/MPaFlexural Strength
/MPa
33621826248.88.6
Table 2. Mechanical properties of steel bar.
Sampleds/mmfy/MPaft/MPaE/GPa
A16430600200
B18455605200
C20450610200
Note: ds is nominal diameter of steel bar; fy is yield strength of steel bar; ft is tensile strength of steel bar; and E is Young’s modulus of steel bar.
Table 3. Mix proportion of concrete (kg/m3).
CementFine AggregateCoarse AggregateWater
3251222658195
Table 4. Difference analysis of ultimate bond stress and residual bond stress.
NumberSpecimensUltimate Bond Stress/MPaVariance/%Residual Bond Stress/MPaVariance/%Reference
Equation (1)Equation (3)Equation (1)Equation (3)
1LC-60-20-50-126.1426.651.95%3.964.8021.21%[10]
2LC-60-20-50-231.3631.801.40%4.455.3520.22%[10]
3LC-60-20-50-329.9930.872.93%6.928.5823.99%[10]
4RC0-5013.6513.821.25%8.239.7318.23%[32]
5RC1-5014.3114.602.03%7.869.1716.67%[32]
6R50S05P1022.2422.511.21%9.8611.8620.28%[33]
7R50S10P1023.1723.411.04%12.8015.4921.02%[33]
8R50S15P1024.1224.361.00%13.8916.6820.09%[33]
9C30R50F127.4328.092.41%19.7824.2522.60%[34]
10C45R50F121.8722.402.42%14.8118.1022.21%[34]
11C60R50F113.2913.551.96%5.256.3721.33%[34]
12C45-R30-P0-S117.1917.582.26%5.646.8321.10%[35]
13C45-R30-P0-S218.6719.082.18%4.545.4419.82%[35]
14C45-R30-P0-S319.1419.562.16%3.013.5217.04%[35]
15C30-R50-P0-S114.1414.341.39%4.815.8421.28%[35]
16C30-R50-P0-S214.0214.191.22%2.863.4018.84%[35]
17C30-R50-P0-S313.3513.490.98%4.215.0921.02%[35]
18C45-R0-NS-S117.9718.352.14%5.706.8920.99%[35]
19C45-R0-NS-S215.4915.651.09%3.634.3519.71%[35]
20C45-R0-NS-S316.3316.682.14%5.646.8221.10%[35]
210%20.5420.901.73%6.007.2420.62%[35]
220.42%18.2818.511.25%5.356.4620.75%[35]
230.84%17.0617.351.68%4.515.4220.26%[35]
X ¯ 1.73% 20.45%
S2 0.00003 0.00027
S 0.006 0.016
Cv 0.321 0.080
Note: X ¯ is average values; S2 is variance; S is standard deviation; Cv is coefficient of variation.
Table 5. Comparative analysis of ultimate bond strength.
NumberUltimate Bond Stress/MPaVariance/%Reference
Equation (3)Equation (4)
130.8729.873.35%[10]
222.5124.086.97%[27]
323.4124.785.85%[27]
424.3624.811.85%[27]
521.9521.860.41%[28]
627.3925.247.85%[28]
720.921.864.59%[29]
X ¯ 4.41%
Disclaimer/Publisher’s Note: The statements, opinions and data contained in all publications are solely those of the individual author(s) and contributor(s) and not of MDPI and/or the editor(s). MDPI and/or the editor(s) disclaim responsibility for any injury to people or property resulting from any ideas, methods, instructions or products referred to in the content.

