Article

Investigating Reinforcement Shadow Visibility on Formed Concrete Surfaces Using Visual Inspection and Colour Variation Analysis

by
Ignas Šliogeris
1,
Donatas Rekus
1,
Svajūnas Juočiūnas
1,
Ruben Paul Borg
2 and
Mindaugas Daukšys
1,*
1
Faculty of Civil Engineering and Architecture, Kaunas University of Technology, Studentų St. 48, 51367 Kaunas, Lithuania
2
Faculty for the Built Environment, University of Malta, MSD 2080 Msida, Malta
*
Author to whom correspondence should be addressed.
Buildings 2025, 15(7), 1140; https://doi.org/10.3390/buildings15071140
Submission received: 17 February 2025 / Revised: 27 March 2025 / Accepted: 28 March 2025 / Published: 31 March 2025
(This article belongs to the Section Building Structures)

Abstract

The research presented in this article seeks to identify the possible causes of reinforcement shadows (RS) on the surface of concrete test specimen produced under laboratory conditions. Different hypotheses about RS were selected based on factory practices and simulated in the study. The test specimens were cast horizontally in contact with steel form-facing surfaces coated with a water-soluble release agent. In addition, two scenarios were analysed during specimen production: reinforcing mesh was fixed using plastic spacers or tie wire. The analysis of the reinforcement shadows was based on visual inspection, taking photos, surface moisture content measurements, and colour variation analysis using the Natural Colour System. It was concluded that RS, which are typically characterized by darker lines, can be defined by the percentage of black colour present in the shadowed area compared to the percentage of black colour in the surrounding area. This percentage can be quickly assessed on a factory scale using digital colour readers that provide timely information. The reduced concrete cover thickness from 35 mm to 10 mm revealed light horizontal dark lines on the exposed surface. It was hypothesised that the gap of less than 10 mm between the reinforcing bars and the steel form-facing plate, along with the sieving effect of the fresh concrete, can retard the cement paste hydration process, resulting in unhydrated ferrite phases that contribute to the dark colour of the unhydrated cement. The release agent sprayed on the steel form-facing surface straight through the reinforcing mesh created a RS effect of the reinforcement on the exposed concrete surface. The absence of a release agent under steel rebars decreased the wettability at the interface between the formwork and fresh concrete, resulting in dark lines during the curing process. It is important to avoid such cases when manufacturing precast reinforced concrete elements. Quantitatively assessing RS and proposing a standardized method for calculation and categorization could be a new research direction in the future.

1. Introduction

The quality and appearance of the visible surface of precast concrete products and monolithic concrete structures mainly depend on high-quality materials and appropriate product manufacturing or construction technology. Every manufacturer or builder attempts to achieve the highest possible surface quality required by the customer at a reasonable cost. Even with the improvements in concrete technology in the last decade, some concrete products fail to meet the requirements applicable to the visible surface of concrete products. Repairing or correcting surface defects to reinstate the required concrete quality involves high costs related to the use of repair mixtures, daubs, and additional labour and does not contribute to sustainability. It contributes to environmental pollution by accumulating waste from precast elements that are rejected for quality issues. Surface defects may occur on the visible surface of a precast product and in situ cast concrete structure that comes into contact with the horizontal and vertical surfaces of the mould during manufacture or casting on the construction site. One of the exposed concrete surface defects can be attributed to the reinforcement shadows. Once these surface defects occur, they cannot be removed. This means prevention is the only way to ensure such defects don’t occur. Yet, while reinforcement shadows can present challenges for civil engineers, they can also create a unique and stylish look from an architect’s perspective. In addition, whether concrete surfaces with reinforcement shadows are aesthetically pleasing for users depends on their attitude.
Reinforcement shadows (RS) are a property in which the apparent position of the reinforcing bars and mesh is visible on the formed concrete surface, typically as darker lines. This visible defect can also be called a reinforcement pattern, reinforcement showing, rebar shadowing, steel shadowing, reinforcing bar shadowing, shadow marks, ghosting, dark lines, etc. Such RS can appear on all reinforced surfaces, whether precast or in situ-formed elements (Figure 1).
Based on the analysis of the literature sources, Table 1 summarises the principal reasons for RS occurrence or colour variation that strengthen the effect of RS on formed concrete surfaces.
The literature analysis shows that only a few scientific studies provide some information about the influence of different factors on the presence of reinforcement shadows. In addition, no clearly identified research methods can be used to measure the RS effect or quantitatively determine the dark lines. The assessment of RS is mainly based on visual inspection or complex research methods, such as optical microscopy, scanning electron microscopy (SEM), and energy-dispersive X-ray analysis (EDX). In contrast, colour variation analysis is based on visual inspection, grayscale analysis, colorimetry, and the CIELAB and HIS colour space systems.
Table 2 summarises the description of RS, colour variation, and inspection methods based on technical documents or standards analysis.
This table shows that some documents and standards [24,25,26,27] that define quality levels of formed concrete surfaces and provide methods to achieve and evaluate them do not provide information about the RS effect. This means that, at that time, this phenomenon was not very important from a visual perspective. Later, it became an important factor in defining the quality levels of formed concrete surfaces. The standard [28] already provides information about the RS effect, but it is reported that RSs are attributed to formed concrete surface characteristics that cannot be measured. This means those characteristics cannot be measured according to the requirements set for the surface category or deviations given in the mentioned standard; therefore, the surface is described by visual assessment of structure, texture, and colour variation. In the document [29,30,31], the shading effect of reinforcement is attributed to colour consistency, while the discolouration is understandable as a deviation from the expected or desired colour. In addition, it states that calcium chloride can cause darker colours that depend on the properties of fresh concrete. The technical documents and standards show that more practical and suitable methods are needed to determine the RS effect, which can be understood as colour variation or colour uniformity at a factory scale. Based on the literature analysis, not only are quantitative studies required to understand the potential cause of the reinforcement shadow effect and prevent this concrete surface defect from forming, but they are also required to offer better solutions on how to check the dark lines. Visual inspection based on photo taking can capture the appearance of surfaces, and portable digital colour readers that do not depend on the evaluator’s opinion can be a solution on a factory scale.
The objective of the research presented in this article is to analyse the possible causes of reinforcement shadows on the formed concrete surface of test specimens produced under laboratory conditions when assessment is based on visual inspection, surface moisture content measurements, and colour variation analysis. The colour variation analysis was based on the recognition of colour, where the evaluator can visualise colour through its attributes such as blackness, hue, and brightness. A camera was used to capture the appearance of the concrete surface, the surface moisture content was determined using a portable device, and a portable colour reader was used to analyse the concrete surface’s colour variation using blackness, hue, and brightness. It was executed with the aim of maintaining laboratory conditions similar to realistic factory conditions that are important for industrial applications defined with a precast concrete production company. A vibrational table, with a length of 2.0 m and a width of 1.2 m, was made for this research, and the concrete test specimens were produced and cured in the controlled environment at a temperature of 20 ± 2 °C and a relative humidity of 40 ± 5%. During the interview with the precast concrete element production manager, the main factors that can cause a reinforcement shadow visibility on the formed concrete surface were identified based on production experience. The impact of these factors on RS under laboratory conditions was investigated according to the research flow chart shown in Figure 2. In some cases, a relationship was found between the factors selected in the interview with the production manager and factors those found in the literature analysis.

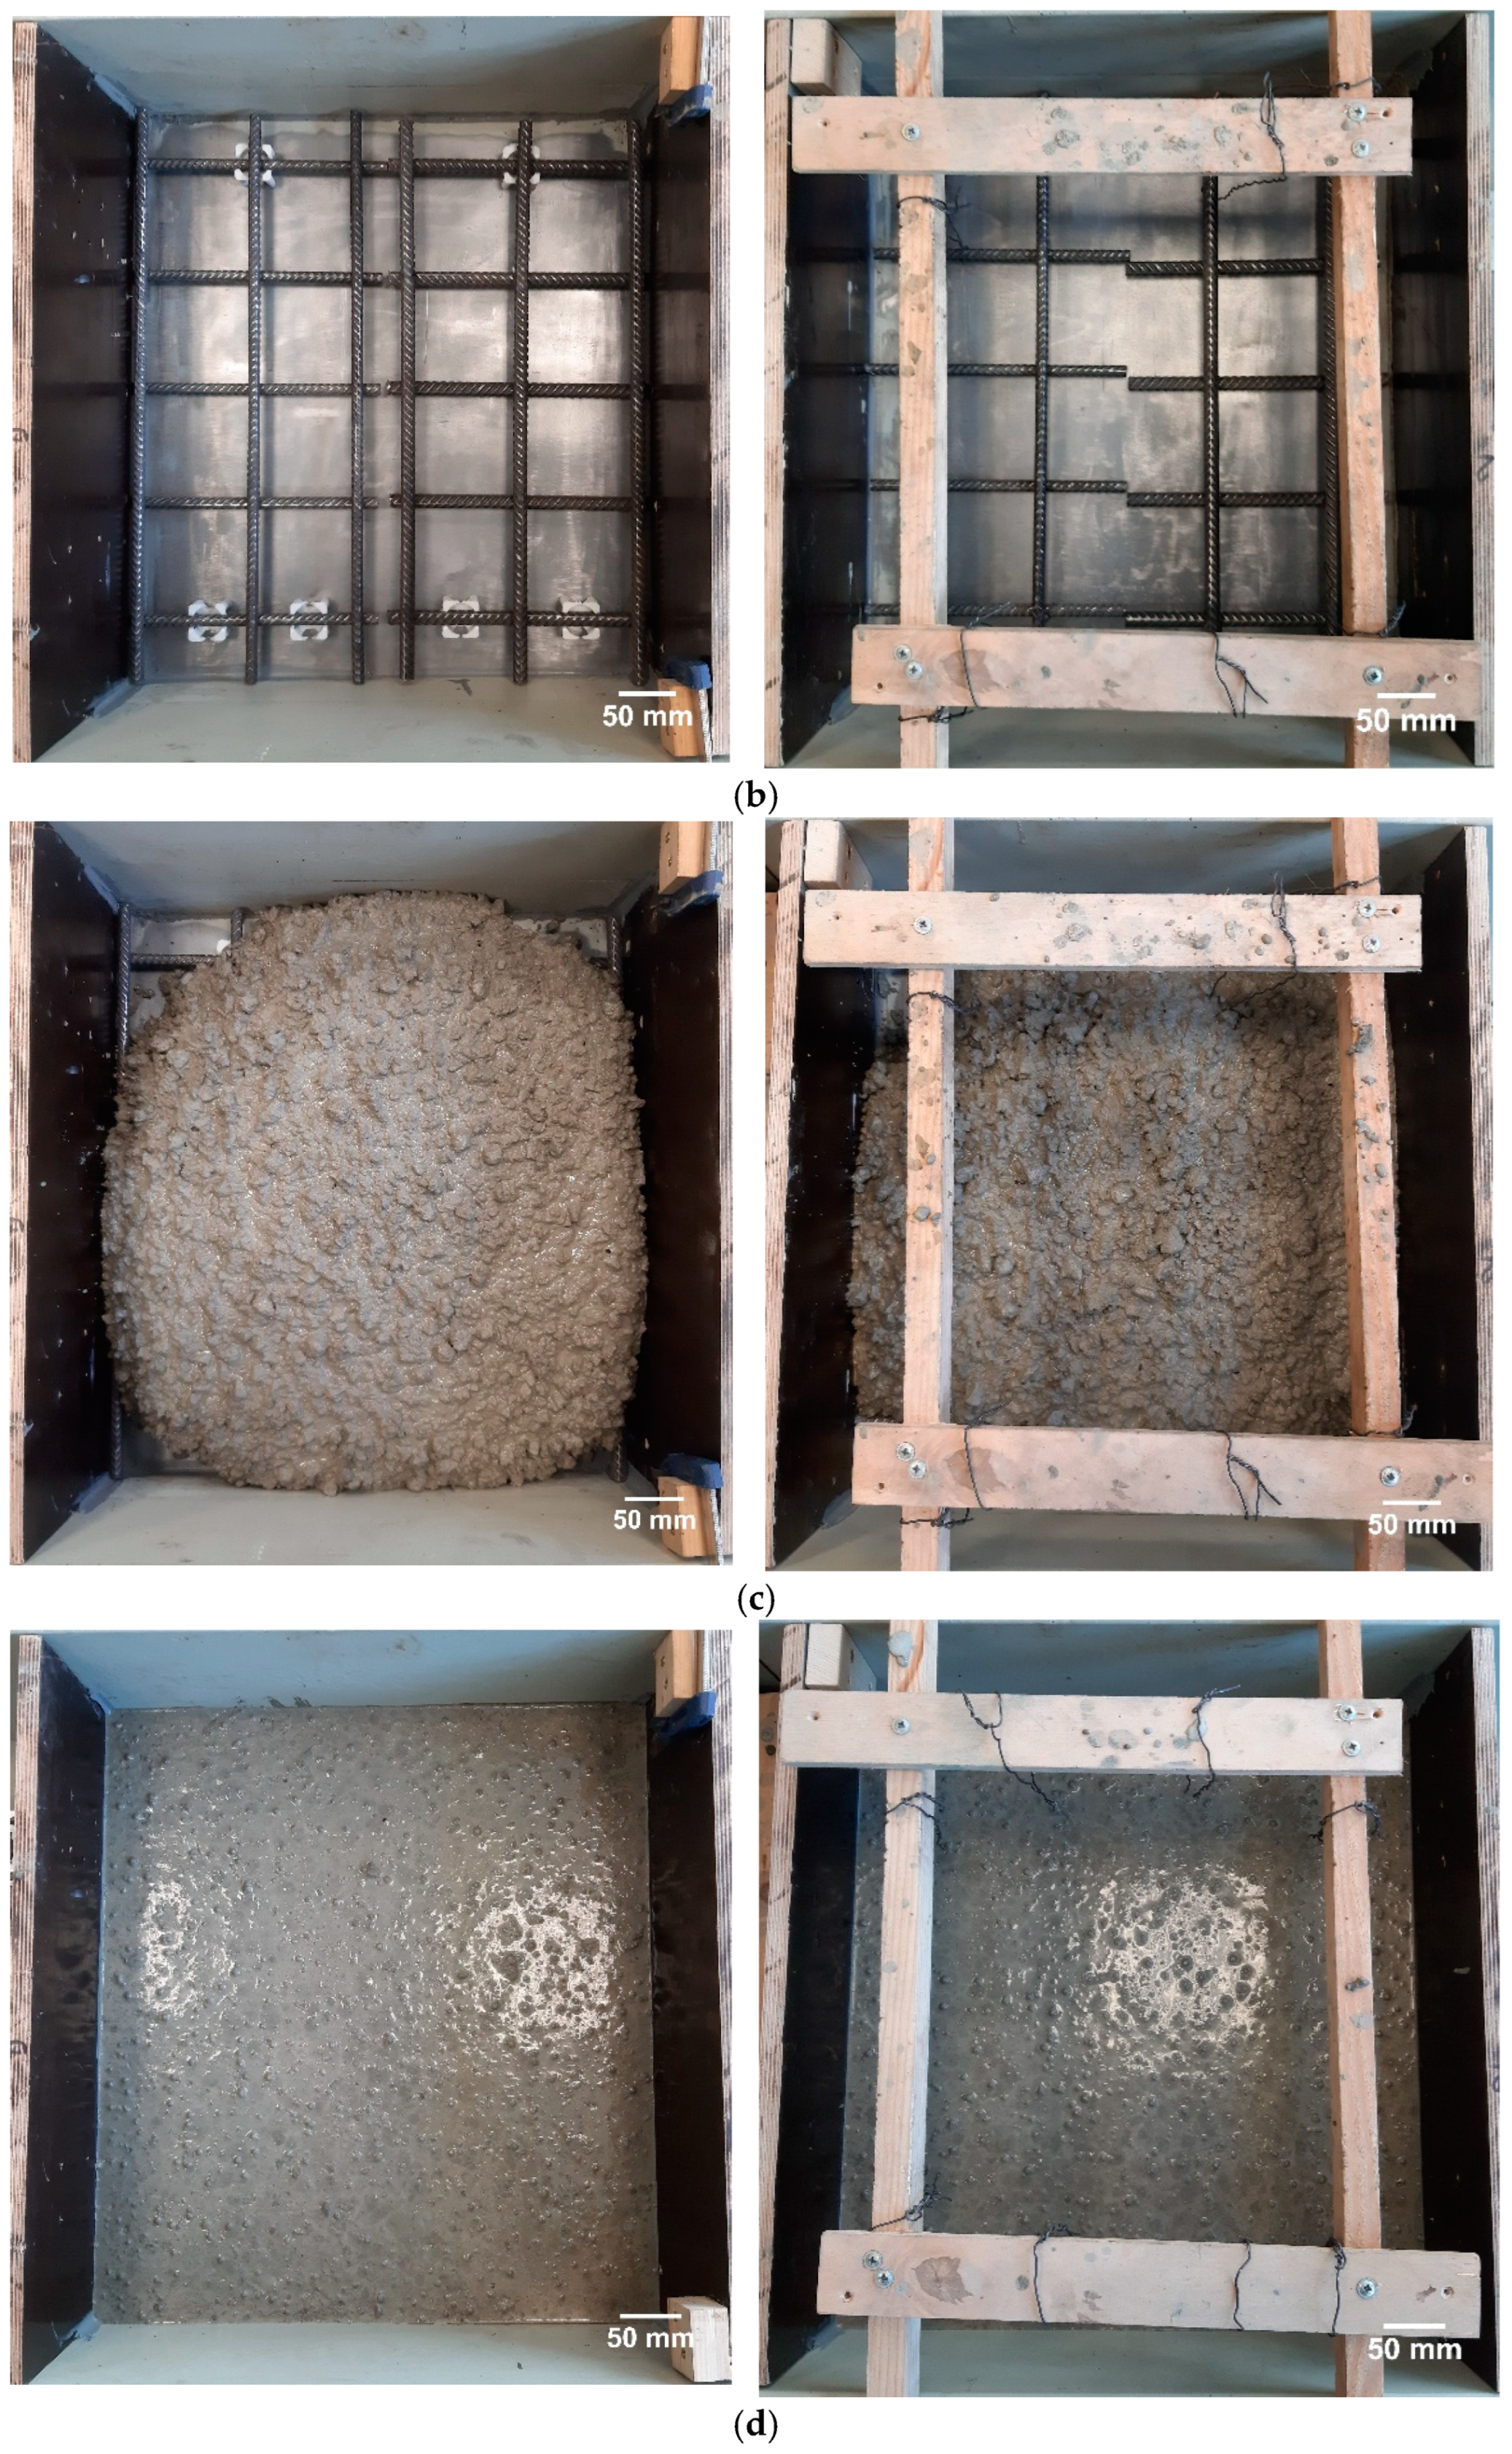
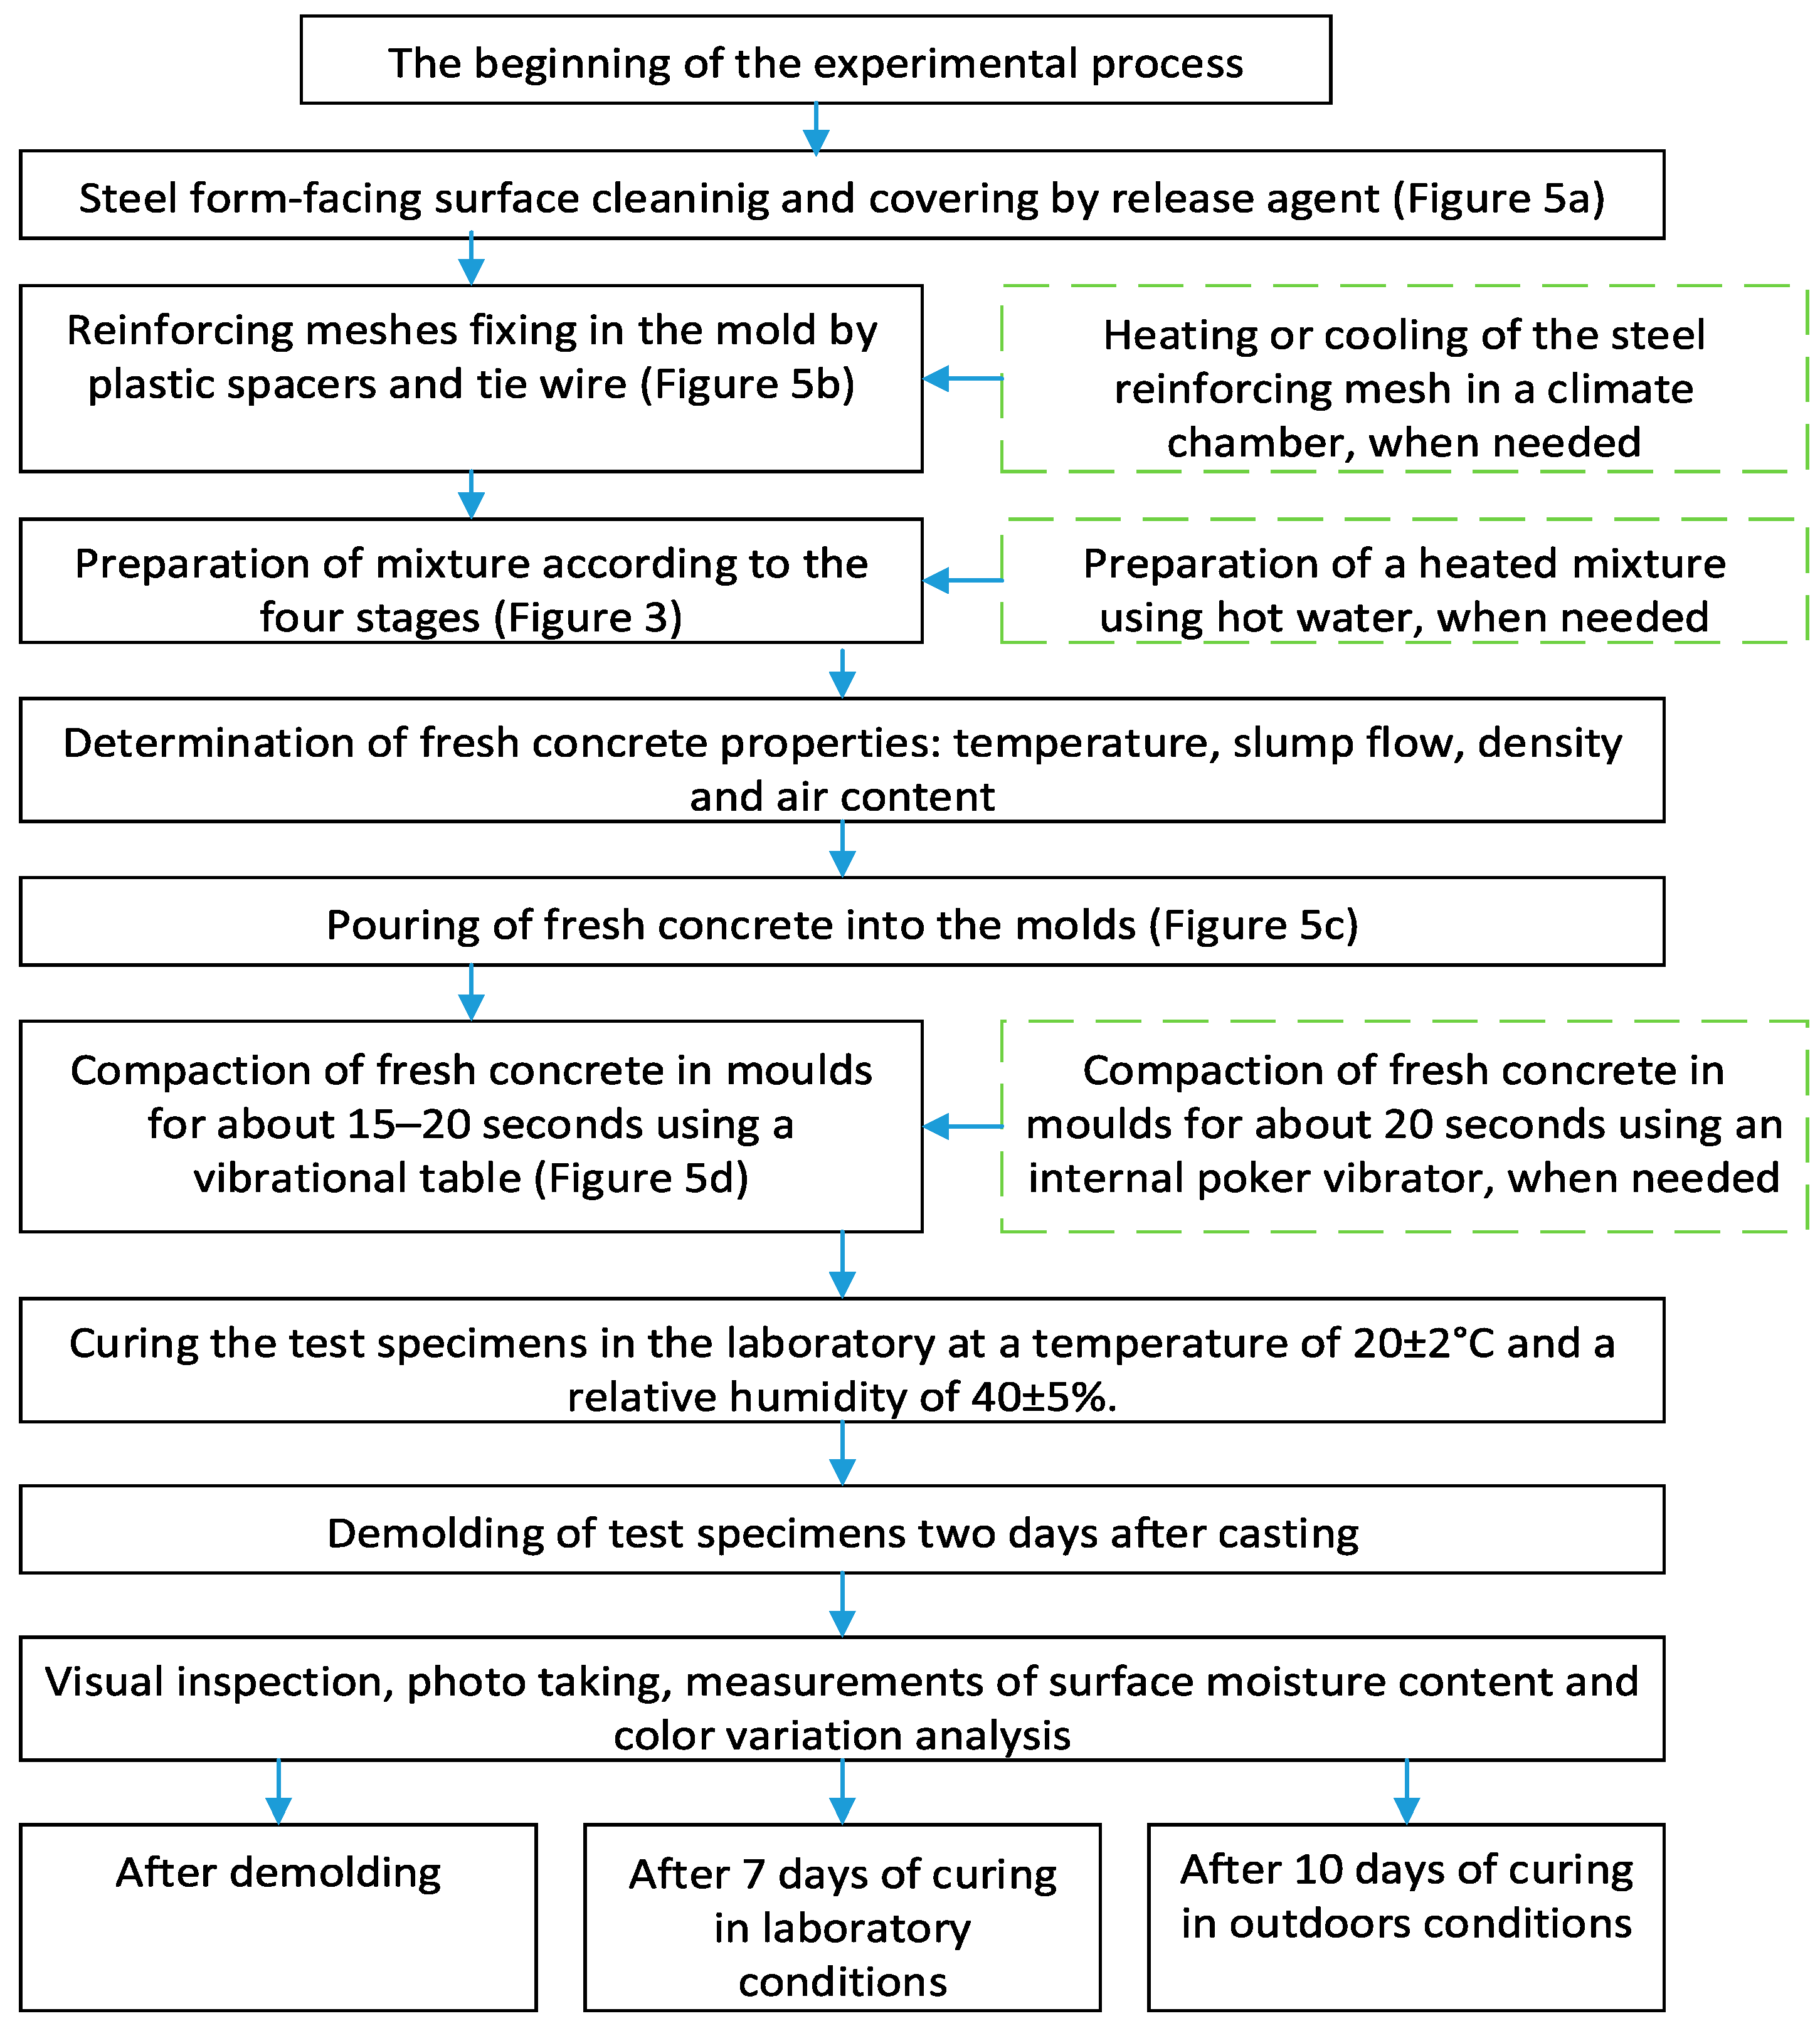
2. Materials and Methods

All the materials necessary to conduct this research, such as components of the concrete mix, the release agent, reinforcing meshes, and the plastic reinforcing mesh spacers, were delivered to the KTU laboratory from the precast concrete products factory. The flowable concrete (FC) mix composition developed for a specific application, such as ‘exposed concrete walls’, chosen for this research, was similar to the factory composition. According to current production technology, mixtures with moderately high slump flow values require less work in place.
As a binder for FC, Portland slag cement CEM II/A-S 42.5 N, satisfying the requirements of EN 197-1:2011 [32], was used. Table 3 presents the cement’s physical and mechanical properties.
As a fine aggregate, sand of fraction 0/4 was used, having the following characteristics: dry bulk density 1635 kg/m3 and specific gravity of approx. 2.65. As a coarse aggregate crushed granite fractions 2/8, 5/11 and 11/16 were used. The physical properties of the crushed granite fractions 2/8, 5/11, and 11/16 were as follows: dry bulk density of 1582 kg/m3, 1582 kg/m3, and 1460 kg/m3, respectively; and specific gravity of approximately 2.79, 2.79, and 2.82, respectively. To increase the amount of fine particles in the aggregate mixture, ground limestone was used with the following characteristics: dry bulk density of 1582 kg/m3 and specific gravity of approximately 2.80. The particle size distribution of the aggregates used was determined with reference to the standard EN 12620:2002+A1:2008 [33]. A high-range water-reducing/superplasticising admixture based on modified polymers was used as a plasticising admixture with the following specifications: brownish liquid, density of about 1.05 kg/L, pH value of 4.3, and low-viscosity liquid. The superplasticiser dosage for fresh concrete production was constant, i.e., 1.6%, according to the weight of cement. The chosen concrete mix composition for the research was similar to the one used in a Lithuanian precast concrete element production factory. Table 4 presents the amounts of materials (kg) per m3 of the concrete mixture.
The fresh concrete was prepared in the laboratory according to standard LST EN 206:2013+A2:2021 [34]. The concrete mixtures were mixed using dry materials and a Zyklos rotating pan mixer ZZ 50 HE from Pemat (Freisbach, Germany). The mixing was performed according to the following stages (Figure 3):
After the concrete was prepared, the following fresh concrete properties were determined for each batch: the temperature of the fresh concrete, measured according to standard EN 12350-1:2019 [35]; the slump flow test, conducted according to EN 12350-8:2019 [36]; the density, measured according to EN 12350-6:2019 [37]; and the air content of compacted fresh concrete, determined according to EN 12350-7:2019 [38].
The vibrational table, which had a length of 2.0 m and a width of 1.2 m, was made by KTU engineers for the purpose of this research (Figure 4). The frame was connected to a vibration part of the table via four convolution air actuators (Continental (Hanover, Germany) FS 50-5 Cl). Two external electric vibrators, Mooser vs. 12/2, transmitted the vibration to the vibrating part of the table. The technical performance data were as follows: rotational speed 3000 rpm, centrifugal force 6000 N, and voltage 230 V (50 Hz). After the vibrational table was built, the vibration amplitudes and frequencies in nine places of the table were determined using the VIBROTEST 60 device (Brüel & Kjær Vibro GmbH, Darmstadt, Germany). It was determined that the vibration amplitude varied from about 45 mm/s to 70 mm/s, and that the frequency was about 49 Hz when the vibrational table was not loaded. While the vibrational table was loaded (the weight corresponded to the weight of the two concrete test specimens), the vibration amplitude varied from about 49 mm/s to 72 mm/s, and the frequency was about 49 Hz.
The mould’s steel form-facing plate was fixed to the vibrational table frame, while the vertical parts were fixed to the vibrational table’s steel form-facing plate. A water-soluble emulsion was used to reduce the contact between the concrete and steel form-facing surfaces (Figure 5a). A release agent was applied to the mould’s surface using a sprayer. The excessive amount of emulsion was cleaned using a dry absorbent cloth to establish a continuous and uniform film of release agent on the surface analysed. The moulds were coated using emulsion about 60 min before the casting in each test.
This study used reinforcing mesh with longitudinal and cross rebar diameters of 10 mm to 12 mm and a grid of 100 × 100 mm. To prepare more test specimens with less concreting, it was decided to use reinforcing meshes of different diameters for each specimen; half of the specimen was concreted with a 10 mm diameter reinforcing mesh, and the other half with a 12 mm diameter reinforcing mesh (Figure 5b). The concrete cover of test specimens varied from 35 to 10 mm during the research. To maintain the concrete cover thickness, the reinforcing mesh was fixed in the mould using plastic reinforcing mesh spacers (Figure 5b on the left) and tie wire, which was fixed to the wooden frame (Figure 6 on the right).
The fresh concrete prepared was placed into the forms manually (Figure 5c). Each batch of concrete consisted of 32 L, with 16 L required for a single specimen to cater for a layer about 7 cm thick. Each test specimen was cast per two layers, consuming an 8 L load bucket for each layer. The concrete mixture pouring speed was eight litres per 25–30 s for each layer. After the first layer was poured, the second layer was poured immediately. This was performed with the help of two laboratory assistants.
Each time, the vibration time for mixture compaction using the vibrational table was the same; the optimal vibration time was close to 15–20 s (Figure 5d). After the fresh concrete was poured into the moulds, the compaction was started, and the vibration time was measured using a digital stopwatch. During the compaction process, the trapped air was forced to the surface after about 7 s, allowing the fresh concrete to flow into corners, around rebar, and flush against the form face. When the vibration time reached about 15 s, the vibration was stopped.
An alternative method to compact fresh concrete was also used during the research. For that reason, a portable electric concrete vibrator, ENAR Dingo (ENAR Group, Zaragoza, Spain), was used with the following technical specifications: a frequency of 13.750 vibrations per minute, a voltage of 230 V (50 Hz), and a flexible shaft. The poker head, with a diameter of 36 mm, was chosen to increase the effect of the vibration. The optimal vibration time was close to 20 s. The vibration started when the poker head touched the reinforcing mesh. The vibration time was measured using a digital stopwatch. It was seen that the trapped air was forced to the surface after about 10 s; the fresh concrete came into corners and around rebar and was flushed against the steel form-facing plate. When the vibration time reached about 20 s, the vibration was stopped.
The forms were set up one day before concrete casting and stripped two days after the casting. The concrete specimens produced were left in the laboratory at 20 ± 2 °C and a relative humidity of 40 ± 5%, and after two days, they were removed from the moulds.
The flowchart illustrating the summarised experimental process conducted in the study is represented in Figure 6.
The surface temperatures of the test specimens, which were formed using a cooled/heated reinforcing bar mesh or a heated concrete mixture, were assessed with a thermal imager FLIR E5 PRO (Teledyne FLIR LLC, Thousand Oaks, CA, USA). The technical specifications were IR resolution 160 × 120 (19.200 pixels), image modes Thermal MSX, minimum focus distance 0.36 m, and object temperature range from −20 °C to +400 °C. The imager provided information on the real reinforcing rebar mesh or fresh concrete temperature during the casting of test specimens. While taking pictures, the imager was about 0.6 m from the analysed surface.
The surface moisture of the test specimens was determined using a portable Laserliner MoistureMaster (UMAREX GmbH & Co., Arnsberg, Germany) device. The technical specifications were as follows: the measurement principle and capacitive measuring principle using integrated rubber electrodes; 56 types of materials including concrete; and a measurement range/accuracy for concrete of 0 ÷ 5%/± 0.5%.
For the visual inspections of the concrete surface, photos were taken with a Nikon (Tokyo, Japan) D3200 camera, with 24 megapixels, a Nikon DX AF-S Nikkor 18–55 mm lens, and a Quantum flashlight. The camera was about 0.6 m from the analysed surface when taking pictures. Photos were taken two days after the concrete specimens were removed from the moulds, after seven days of curing under laboratory conditions, and after ten days of storage outside. The research used the free-code image processing technique ImageJ (Version 1.54p) to set the pictures’ scale, rotate them, and increase their contrast where needed.
A portable colour reader NCS Colour Scan 2.0 (NCS Colour AB, Stockholm, Sweden), which presents analysed colour notation, was used to assess the concrete surface’s colour variation. The NCS notation describes the colour by its percentage of visual blackness, chromaticity, and hue [39].

3. Results and Discussion

3.1. The Properties of Fresh Concrete

The concrete mix composition remained constant during the research. Figure 5 presents the determination of fresh properties. Table 5 presents the properties of fresh concrete determined for each batch, while the given data are presented as averages of each conducted test.
The average values of the fresh concrete mixture properties were as follows: the mixture temperature was about 22.4 °C (except for the heated mixture C-RS-7), the slump flow value of the flowable concrete mixture was about 630 mm, the air content in fresh concrete was about 1.9%, and the density of fresh concrete was about 2490 kg/m3. In addition, the average ambient temperature was about 21.5 °C, and humidity was about 37.6% during the research.
Despite using flowable concrete, a vibrational table was used not only to compact fresh concrete and achieve the required appearance of test specimens for visual concrete, but also to simulate factory conditions. As mentioned before, the subject of this investigation is precast reinforced concrete wall elements produced in the factory in the horizontal position, in contact with a steel form-facing surface. The test specimens were also cast horizontally in contact with steel from-facing surfaces coated with a water-soluble release agent. The 35 mm concrete cover of test specimens was chosen to achieve the required durability for precast concrete elements, such as walls, simulated in this research. In addition, during research, the cover thickness was decreased from 35 mm to 15 mm to determine its impact on the RS effect. To maintain the specified cover in precast concrete elements (exposed concrete walls), the factory uses different methods to fix the reinforcing mesh in a mould, such as plastic reinforcing mesh spacers and tie wire. This means that the mesh could freely move during the mixture compaction and impact the RS effect in the latter.
After the fresh concrete was poured into the moulds, it was compacted during the research using the vibrational table and, as an alternative, a portable electric concrete vibrator when the poker head had prolonged contact with the reinforcing mesh to enhance the visibility of the RS effect on the formed concrete surface after the mixture was poured.
Two test specimens were cast at the same time. The concrete test specimens, 0.50 m long, 0.45 m wide, and 0.07 m high, were cast using the vibrational table under laboratory conditions. The total area of the formed concrete surface for one test specimen was about 0.23 m2. After pouring and compacting the mixture, the test specimens and mould were covered with polyethylene film to minimize moisture loss and impact on discolouration.
The surface moisture was measured twice—the first measurements were taken once the specimen was removed from the formwork, and the second measurements were made after seven days of curing under laboratory conditions and after the test specimens’ storage outside. Measurements were made at 12 randomly selected concrete specimen points, and the total moisture average was derived. After surface moisture measurements, the photos of concrete specimens for the visual inspection were taken, and colour variation analysis was performed. Colour variation is a change in colour or shade on the surface of the concrete test specimens under examination. Colour notation detections were made at randomly selected specimen points to determine different colour notations. The measurements of colour variation on test specimens’ surfaces were performed after the specimens were removed from moulds, after seven days of curing under laboratory conditions, and after test specimens’ storage outside. Colour variation was analysed by detected colour notation, i.e., percentage similarity to black and white, intensity, and using hue, which includes yellow, green, and red. In addition, the concrete surface colour was analysed in both shadowed and surrounding areas where possible.

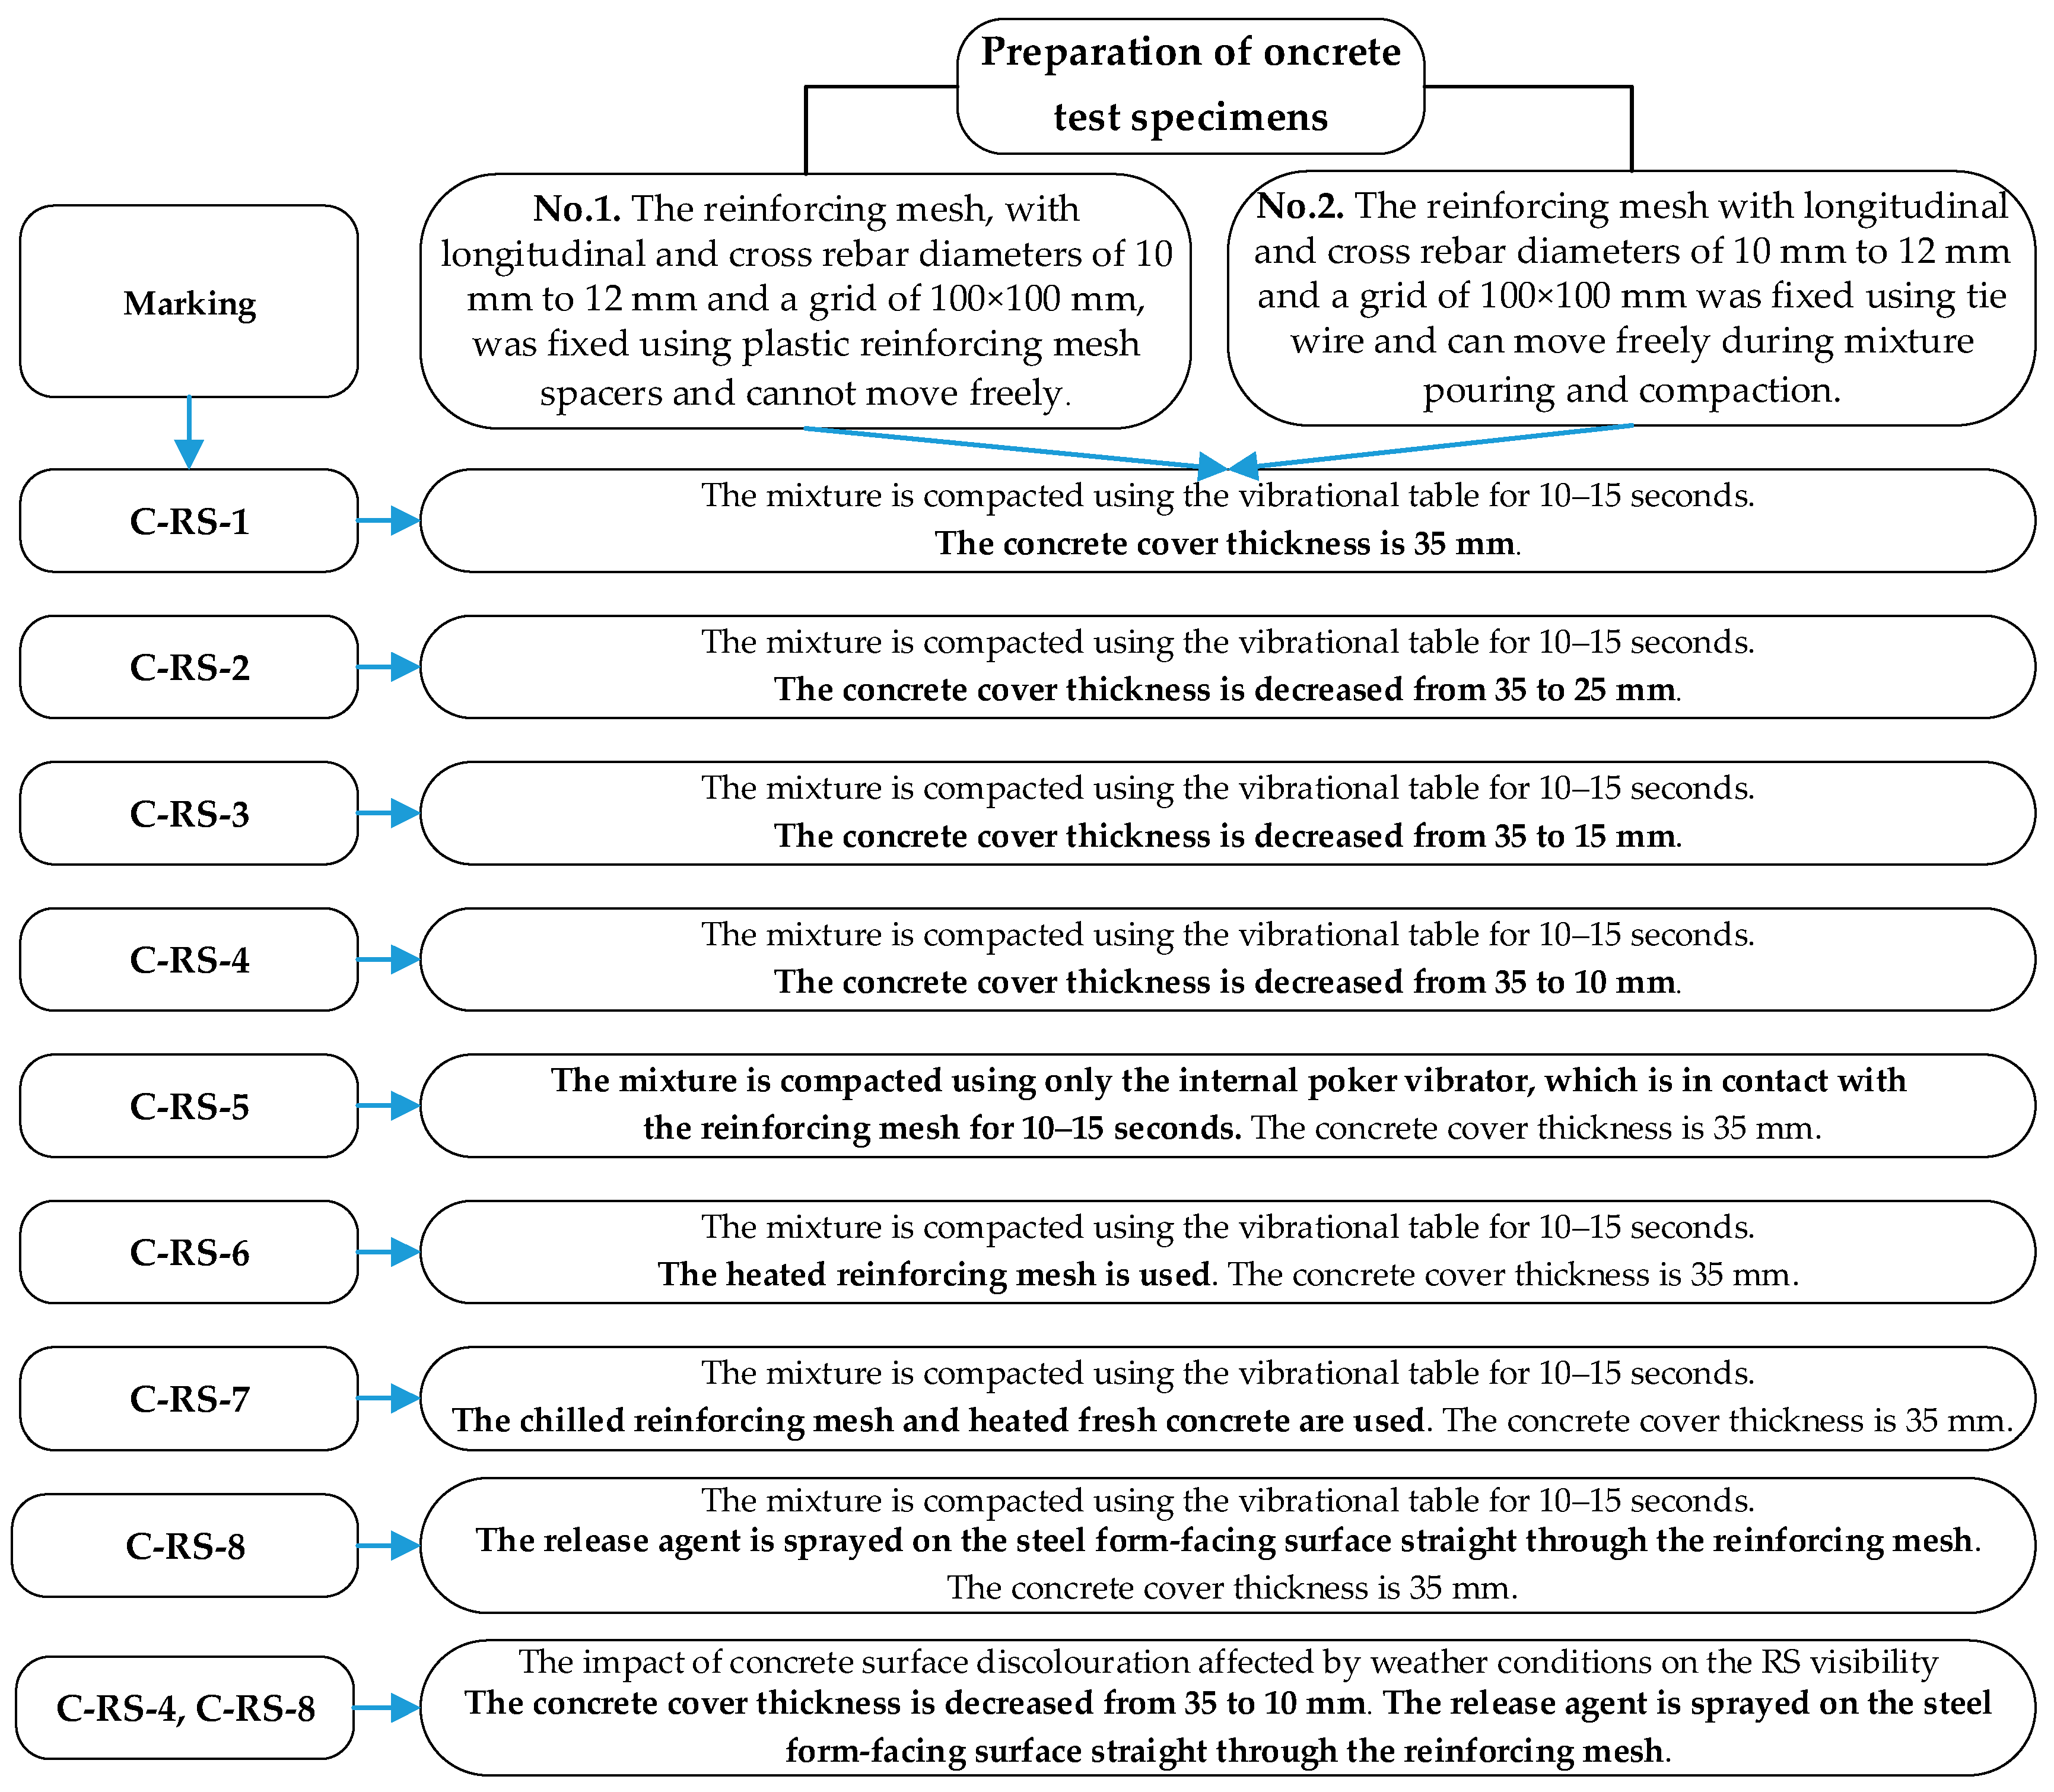
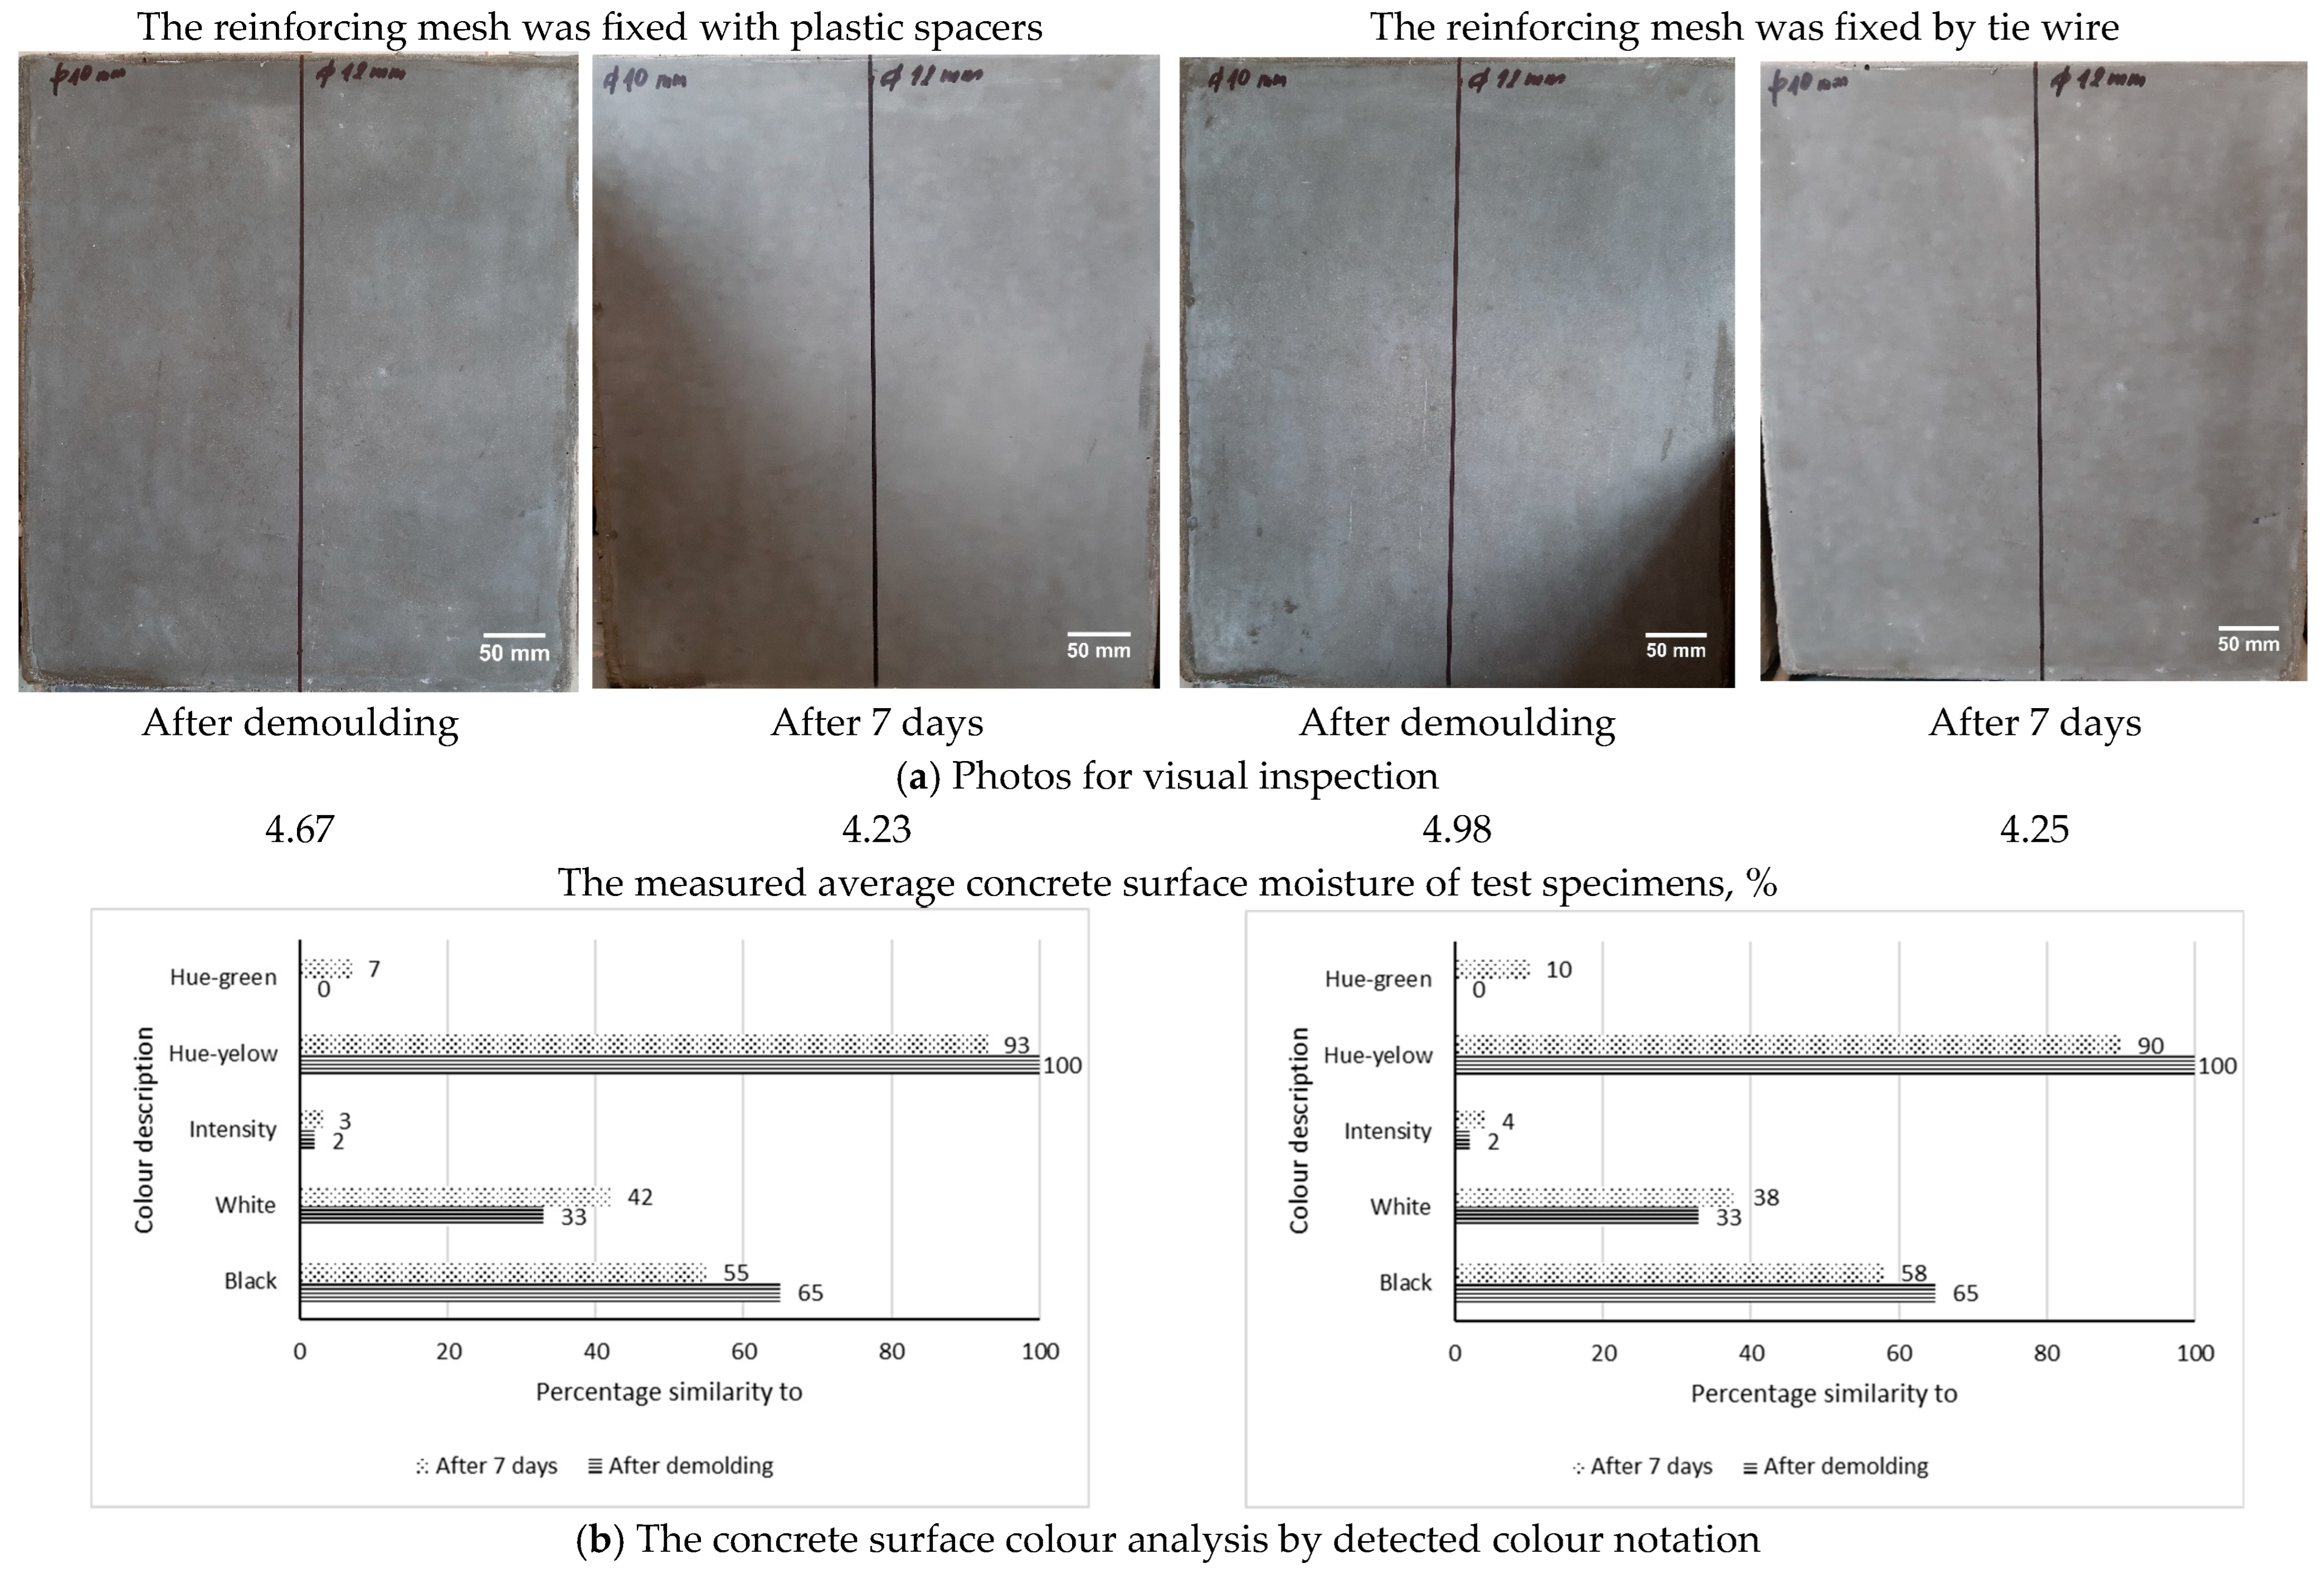
3.2. The Impact of Concrete Cover Thickness on the RS Effect

This section analyses the hypothesis about the effect of the concrete cover thickness on the RS visibility on the formed concrete surface. This case study involves changes in the concrete cover thickness of test specimens. The literature review reveals conflicting viewpoints: one suggests that reinforcement shadow does not result from reinforcing bars being positioned too near the visible surface, while the other argues the opposite. To clarify the conflicting viewpoints, the gap between the reinforcing mesh and mould horizontal surface during the research was lowered from 35 mm to 10 mm. The gap was reduced by changing the height of the plastic spacers and the tie wire length, which were used to fix the reinforcing meshes in the moulds. Four test specimen series were produced (C-RS-1, C-RS-2, C-RS-3, and C-RS-4). Figure 7a, Figure 8a, Figure 9a and Figure 10a present photos taken for the visual inspections intended to assess the RS effect on the formed concrete surface, while colour variation analysis using colour notation is presented in Figure 7b, Figure 8b, Figure 9b and Figure 10b. The pictures on the left refer to concrete specimens produced while the reinforcing mesh was fixed with plastic reinforcing mesh spacers after demoulding and seven days of curing under laboratory conditions. The pictures on the right refer to concrete specimens produced while the reinforcing mesh was fixed by tie wire after demoulding and seven days of curing under laboratory conditions.
The photos in Figure 7a, Figure 8a and Figure 9a taken for the visual inspection reveal no visible signs of reinforcement shadows on the formed concrete surface after demoulding and after 7 days of storage in the laboratory when the concrete cover thickness was reduced from 35 mm to 15 mm. The measured concrete specimens’ surface moisture was higher after demoulding than after seven days of curing. The average surface moisture decreased from about 4.80% and 4.90% to 4.20% and 4.30%, respectively, due to water evaporation. After the specimens were removed from the moulds, a grey colour with a yellow hue on the concrete surface was detected. The inherent grey colour of hardened cement paste depends on iron oxide and manganese oxide content [13,14,15]. It can vary from darker to lighter shades and presents a yellow hue.
In this research, the same type of Portland slag cement was used. When the reinforcing mesh was fixed with plastic spacers, the percentage similarity to the black colour decreased from 60% to 55% (Figure 8b) and from 65% to 55% (Figure 9b and Figure 10b). The similarity percentage to the white colour increased from 38% to 43% (Figure 8b) and from 33% to 43% (Figure 9b and Figure 10b), respectively. In addition, the grey colour tended to a yellow (100%) hue in all cases. It shows that the concrete colour became lighter after seven days of curing under laboratory conditions. The lightening of the ferrite phase due to its hydration is the major cause of concretes becoming lighter in hue as they hydrate [17,18]. In addition, it was noticed that the percentage similarity to the black colour decreased slightly, and the percentage similarity to the white colour increased slightly when the reinforcing mesh in the mould was fixed with tie wire rather than plastic spacers. The freely moving mesh during the mixture pouring and compaction moment can likely affect the lighter concrete colour of the whole surface of test specimens but not in localised areas around the rebars. Based on the authors’ [17] findings, the free movements of reinforcing mesh can decrease the water–cement ratio of the top surface of the test specimens to the point where water and space necessary for the hydration of ferrite phases are not available. This case may cause indefinite delays in hydrating and lightening this surface of the concrete.
Only the concrete specimens with a cover thickness of 35 mm had the same black and white colour similarity percentage after being removed from the moulds and after curing for seven days. The percentage similarity to black was 45%, to white 53%, and hue was 100% yellow (Figure 7b). Table 5 shows that on the casting day of those specimens, the ambient temperature was 22.1 °C, and the humidity was 24.6%. It was noticed that the ambient temperature was slightly higher and ambient humidity somewhat lower than on the days when the concrete specimens with a cover thickness of 25 mm, 15 mm, and 10 mm were being cast. Concrete cures faster in hot weather, and if the air is very dry, the water in concrete can evaporate quickly, causing it to become lighter in colour [9].
However, light RS visibility as horizontal dark lines was noticed on the exposed surface when the concrete cover thickness was reduced from 35 mm to 10 mm (Figure 10a). These defects were seen in concrete specimens prepared when the reinforcing mesh was fixed with plastic spacers and was not allowed to move during fresh mixture pouring and compaction (Figure 10a on the left side). Conversely, reinforcement shadows were not detected when the reinforcing mesh was fixed by tie wire and could move during the concrete casting (Figure 10a on the right side).
This fact suggests that the reinforcing mesh has sieved the fresh concrete, and cement paste flows around the rebar by separating coarse aggregate. Crushed granite of fractions 2/8, 5/11, and 11/16 was used as a coarse aggregate for the mix production. Likely, the 10 mm gap between the reinforcing bars and the mould’s horizontal surface was too narrow for a coarse aggregate of 16 mm to flow under the rebar. Due to coarse aggregate separation, the changes in the cement paste at each horizontal rebar caused concrete colour discolouration, which remained visible as dark lines. When the reinforcing mesh was fixed by tie wire and could move during the concrete casting, the separation effect was lowered and did not have a noticeable impact on the RS visibility. Based on the authors’ [17] findings, a too narrow gap between the reinforcing bars and the steel form-facing plate, combined with the sieving effect of the fresh concrete, led to changes in the cement paste. Localised areas were formed around steel rebars, where cement’s ferrite phases (iron compounds) could not correctly hydrate form. Unhydrated ferrite phases are responsible for the dark colour of unhydrated cement, which is blackish-brown.
Authors [40] used EDS analysis with SEM in their research and concluded that the darkest shade observed in the concrete specimen indicates the probable presence of tetra calcium aluminoferrite (C4FH), when the concrete test specimens were cast within steel formwork. According to the authors [41], the C4FH phase is a solid solution forming a continuous series from C2F to C6A2F. A comparison of reinforcing mesh position in the mould to dark lines on the concrete surface is presented in Figure 11a. The apparent position of the reinforcing bars is visible on the formed concrete surface as darker lines. The graphs presented in Figure 10b show that the percentage similarity to black colour in a shadowed area was 75%, compared to 65% in the surrounding area. A 10% difference is not clearly visible to the naked eye, but a digital colour reader can identify it. This simulation supports the statements of other authors [1,2] that the reinforcement shadow effect occurs when fresh concrete is sieved by the reinforcing bars during concrete casting. The increased vibration time, the fresh concrete consistency, and the rigidity of the steel form-facing plate may also impact the RS effect and colour variation differently.

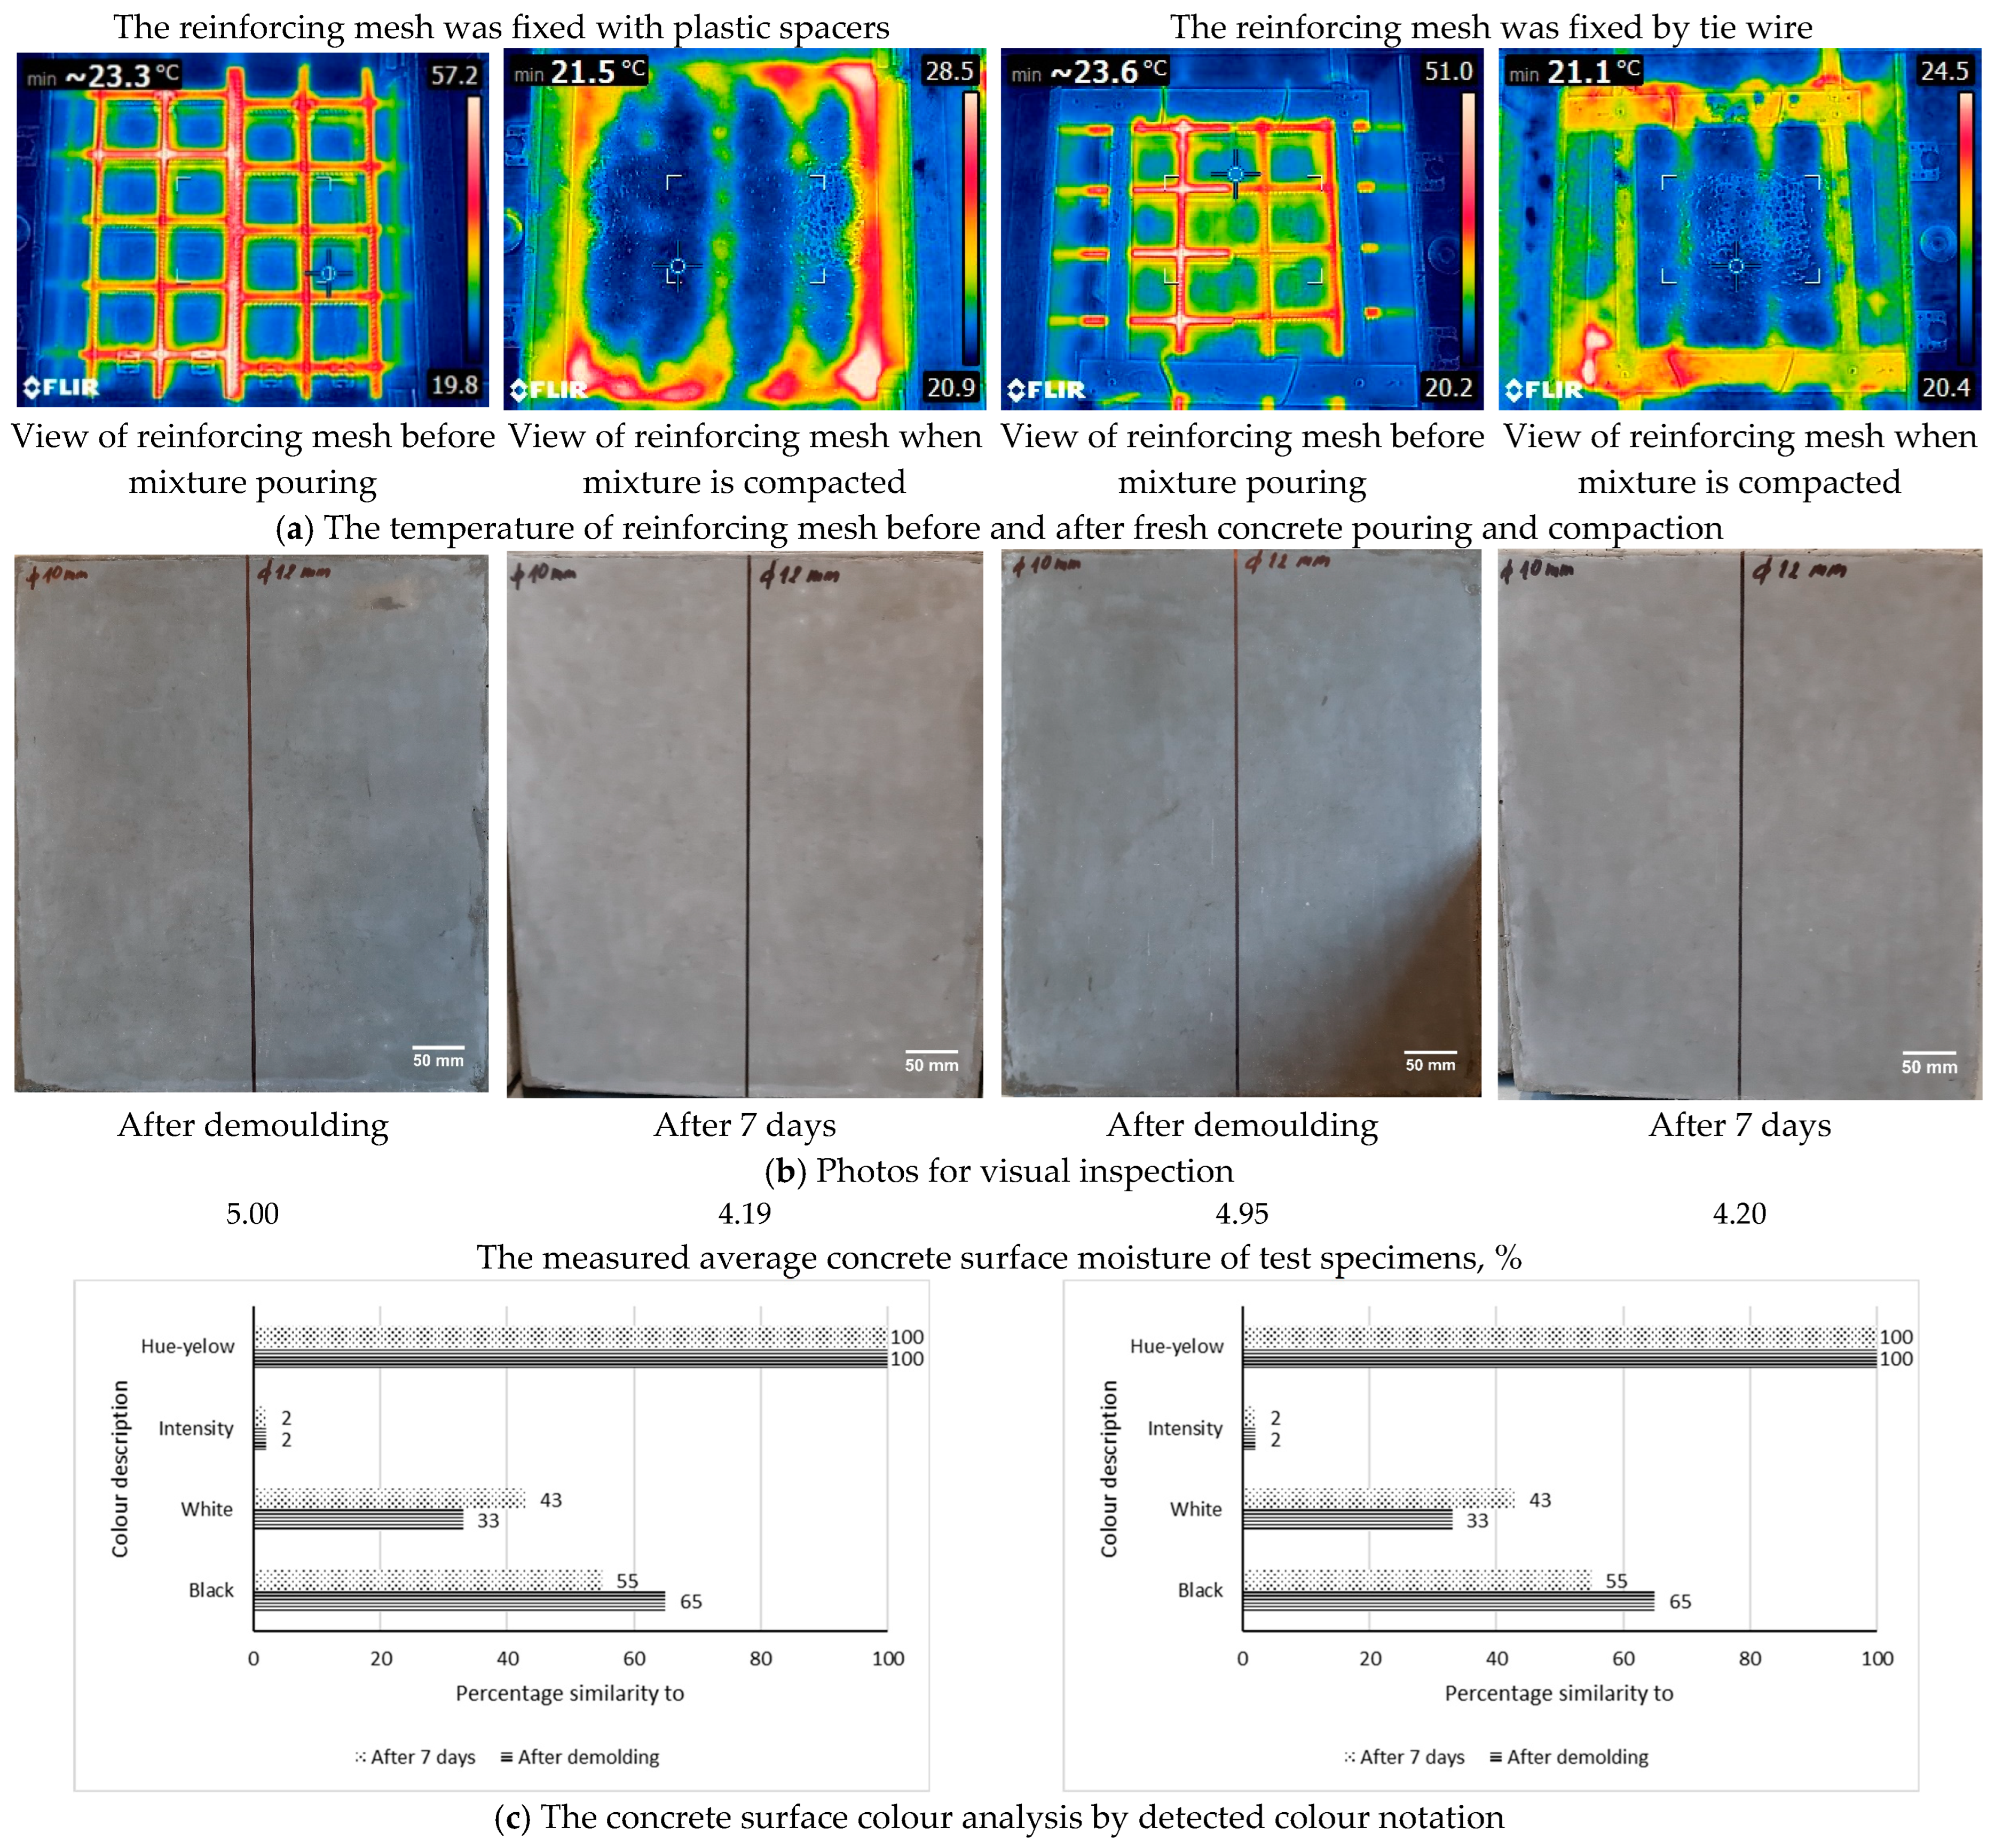
3.3. The Impact of Reinforcing Mesh Vibration Using an Internal Poker Vibrator on the RS Effect

This section describes the hypothesis regarding the effect that the vibration of reinforcing mesh, when an internal poker head is in contact with it, has on RS visibility. The review of the literature reveals that the RS effect on the formed concrete surface might be caused by the vibration of reinforcing mesh when using a poker vibrator. To clarify this viewpoint, the reinforcing meshes (fixed using plastic spacers and tie wire) were vibrated using the internal poker vibrator and the 36 mm diameter poker head was in contact with the reinforcing mesh for about 20 s. After the fresh concrete was poured, it was compacted using the internal poker vibrator. Figure 12a presents photos taken for the visual inspections regarding the RS effect on the formed concrete surface. Figure 12a shows that no dark lines of reinforcement shadows on the concrete surface were detected. Thus, when fresh concrete is vibrated by a 36 mm poker head in contact with the reinforcing mesh and the concrete cover thickness is 35 mm, there is no sufficient condition for the RS to appear on the formed concrete surface.
It can be assumed that the localised areas in the concrete around steel rebars near the steel from-facing surface were not densified too much using the poker vibrator to retard the hydration of dark ferrite phases and to appear as dark lines on the exposed concrete surface. The vibration, using the internal poker vibrator in contact with the reinforcing mesh for about 20 s, was optimal to avoid mixture segregation. The increased vibration time, the diameter of the poker head, and the vibration amplitude may also impact the RS effect and colour variation differently.
Figure 12b shows that just after demoulding and after 7 days of curing under the laboratory conditions, the same percentages of similarity to the black (65%) and white colour (33%) were determined on the formed concrete surface, regardless of whether the reinforcing mesh was fixed with plastic spacers or tied by wire. In addition, the grey colour tended to a yellow (100%) hue after demoulding. After 7 days, the grey colour became lighter due to the continuing cement hydration. In addition, the intensity of the grey colour increased from 2% to 3% (when the reinforcing mesh was fixed with plastic spacers) and from 2% to 4% (when the reinforcing mesh was tied by wire) after 7 days of storage in the laboratory. It was expected that higher colour non-uniformity might be detected when the poker head was in contact with reinforcing mesh fixed by tie wire and able to move freely.

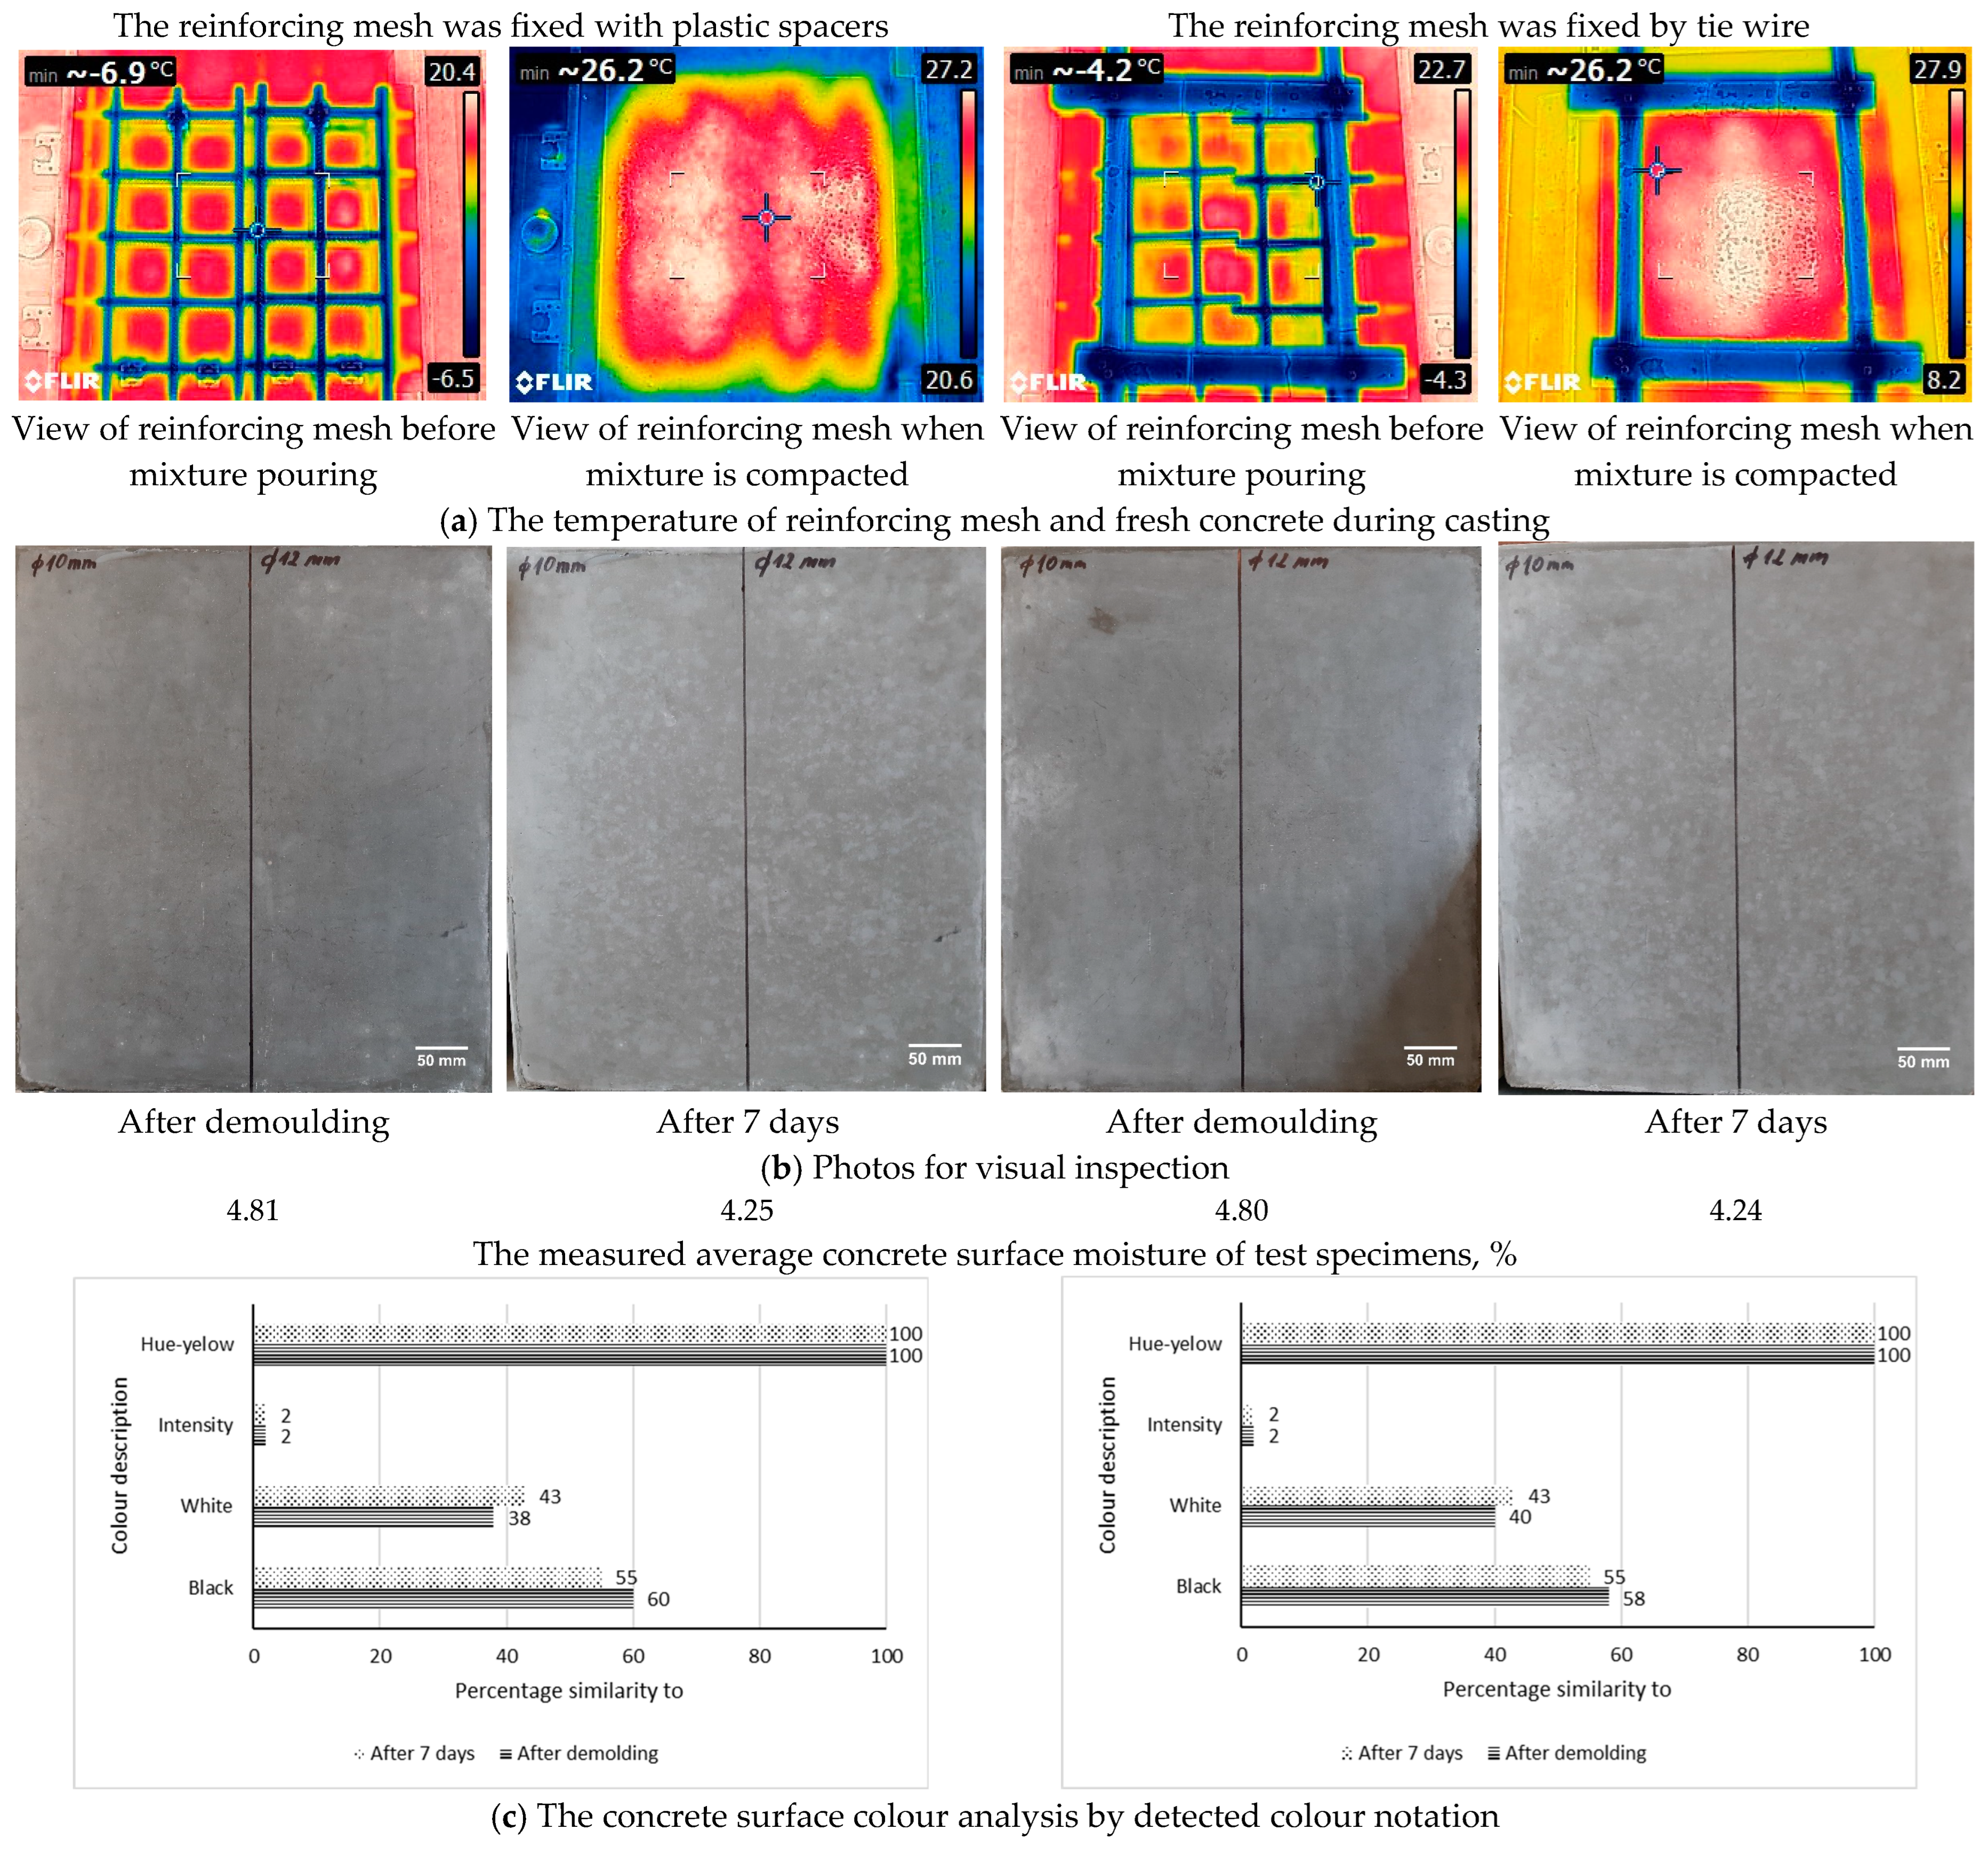
3.4. The Impact of Heated Reinforcing Mesh on the RS Effect

This section analyses the hypothesis that heated reinforcing mesh impacts the RS visibility on the formed concrete surface. This reflects the case study of hot weather when the sun can heat the reinforcing mesh in the formwork. Of course, this situation is more relevant for casting monolithic slabs than for vertical elements like walls or columns. It can also reveal the situation when reinforcing mesh, after being stored outside in hot weather, is placed in the moulds at the factory. Heated rebars should cause the concrete to hydrate more rapidly around the rebar, impacting colour variation on the formed concrete surface and resulting in the RS effect. The simulation of this research is presented in Figure 13.
For this purpose, the reinforcing meshes were heated at 70 °C in the laboratory using a climate chamber. Immediately, the reinforcing meshes were placed into moulds and fixed using plastic spacers or tie wire to maintain the concrete cover thickness of 35 mm (C-RS-6). The fresh concrete was prepared before the reinforcing meshes were removed from the climate chamber. After the fresh concrete was poured, it was compacted using the vibrational table for 10–15 s. Figure 13a shows that the temperature of the reinforcing meshes before pouring fresh concrete in moulds was about 57 °C and 51 °C, while the fresh concrete temperature was about 23 °C and 21 °C, respectively. After the fresh concrete was cast, the reinforcing mesh temperature decreased from about 57 °C to 28 °C (when the reinforcing mesh was fixed with plastic spacers) and from about 51 °C to 24 °C (when the reinforcing mesh was fixed by tie wire).
Figure 13b reveals no visible reinforcement shadows detected on the formed concrete surface when the heated reinforcing mesh was used. It can be assumed that the changes in the Portland slag cement hydration around the heated reinforcement are likely overshadowed by the thickness of the concrete cover, which in this case was 35 mm. The change in the colour of the hardened cement paste around the reinforcement did not affect the colour change on the concrete surface 35 mm away. It can be hypothesised that when the temperature difference between steel reinforcing mesh and fresh concrete is about 25 °C, and the concrete cover thickness is 35 mm, there is no sufficient condition for the RS to appear on the formed concrete surface.
The graphs presented in Figure 13c show that regardless of whether the reinforcing mesh was fixed with plastic spacers or tied by wire on the formed concrete surface, the percentage of similarity to the black colour was 65% and to the white colour was 33%. The average surface moisture after demoulding was about 5.00% and 4.95%, respectively. After seven days of curing, the concrete colour became lighter in both cases due to the continuing cement hydration process, and the similarity percentage to the black colour decreased to 55%, while the similarity percentage to white increased to 43%.
In addition, the average surface moisture from water evaporation decreased to 4.19% and 4.20%, respectively. Portland slag cement gives concrete surfaces an inherent grey colour, and the blackness decreased from 65% to 55% after 7 days of storage under laboratory conditions at 20 ± 2 °C and a relative humidity of 40 ± 5%.

3.5. The Impact of Chilled Reinforcing Mesh and Heated Fresh Concrete on the RS Effect

The hypothesis about the influence of chilled reinforcing mesh and heated fresh concrete on the RS visibility on the formed concrete surface is described in this section. This case reflects cold weather conditions when the temperature of the steel reinforcing mesh in the formwork can decrease, for example, to minus 5 °C, and heated fresh concrete with a temperature of, for instance, about 25 °C, is used to cast concrete structures. For example, this case may reflect a scenario where a factory-made precast concrete element is cast using reinforcing mesh stored outdoors (winter). It can be assumed that a low temperature around the chilled steel rebars should retard the hydration process of cement, resulting in a colour variation on the formed concrete surface and the RS effect. The simulation of this research is presented in Figure 14. For this purpose, the reinforcing meshes were chilled in a climate chamber in the laboratory at minus 20 °C for about three hours. Immediately, the reinforcing meshes were placed into moulds and fixed using plastic spacers or tie wire to maintain the concrete cover thickness of 35 mm (C-RS-7). The heated fresh concrete was prepared using hot water at 40 °C before removing the reinforcing meshes from the climate chamber. After the fresh concrete was poured, it was compacted using the vibrational table for 10–15 s.
Figure 14a shows that though the reinforcing meshes were chilled in a climate chamber in the laboratory at minus 20 °C for about three hours, the temperature of the reinforcing meshes before pouring fresh concrete in moulds increased to about minus 7 °C (the reinforcing mesh was fixed with plastic spacers) and 4 °C (the reinforcing mesh was fixed with plastic spacers), respectively.
Meanwhile, the heated fresh concrete temperatures were about 27 °C and 26 °C, respectively. The pictures presented in Figure 14b show no reinforcement shadows on the formed concrete surface when chilled reinforcing mesh and heated fresh concrete were used. The research used Portland slag cement, which was made from Portland cement clinker, granulated slag, and a setting regulator. Slag hydrates are known to engage in a pozzolanic reaction with portlandite, a primary hydration product of cement clinker [42]. This process generates an additional calcium silicate hydrates gel phase and a hydrotalcite-like phase, contributing to long-term enhancement of mechanical properties and improved durability for such cement paste. Elevating the temperature during the curing process enhances the speed of initial hydration and pozzolanic activity [43]. Based on authors [17], hydration’s lightening of the ferrite phase is the primary cause of cements and concretes becoming lighter in hue as they hydrate. A faster process of cement hydration should result in a lighter concrete colour. On the other hand, a low temperature around the chilled steel rebars should retard the hydration process of cement. When temperatures fall below 20 °C, the reaction rate of cement clinker slows down [44]. In the initial stages, belite is most significantly impacted by this decrease, with alite and tricalcium aluminate experiencing less severe effects. Sixteen litres of concrete mix heated to 25 °C overshadowed the effect of steel mesh cooling to minus 5 °C on cement hydration around the reinforcing bars. The change in the colour of the hardened cement paste around the chilled reinforcement did not affect the colour change on the concrete surface 35 mm away. It can be assumed that the changes in the Portland slag cement hydration around the chilled reinforcement when heated fresh concrete was used are likely overshadowed by the thickness of the concrete cover, which in this case was 35 mm. Therefore, it can be concluded that when the temperature of chilled steel reinforcing mesh is about minus 5 °C, the temperature of heated fresh concrete is about 25 °C, and the concrete cover thickness is 35 mm, there is no sufficient condition for the RS to appear on the formed concrete surface.
When the reinforcing mesh was tied by wire, the similarity percentage to the black colour decreased to 58%, and similarity percentage to the white colour increased to 40%. The average surface moisture after demoulding was about 4.8% in both cases. After seven days of curing due to water evaporation, the average surface moisture decreased to 4.24%, and the concrete colour became lighter in both cases; the percentage of similarity to the black colour decreased to 55%, and the percentage of similarity to the white colour increased to 43%.

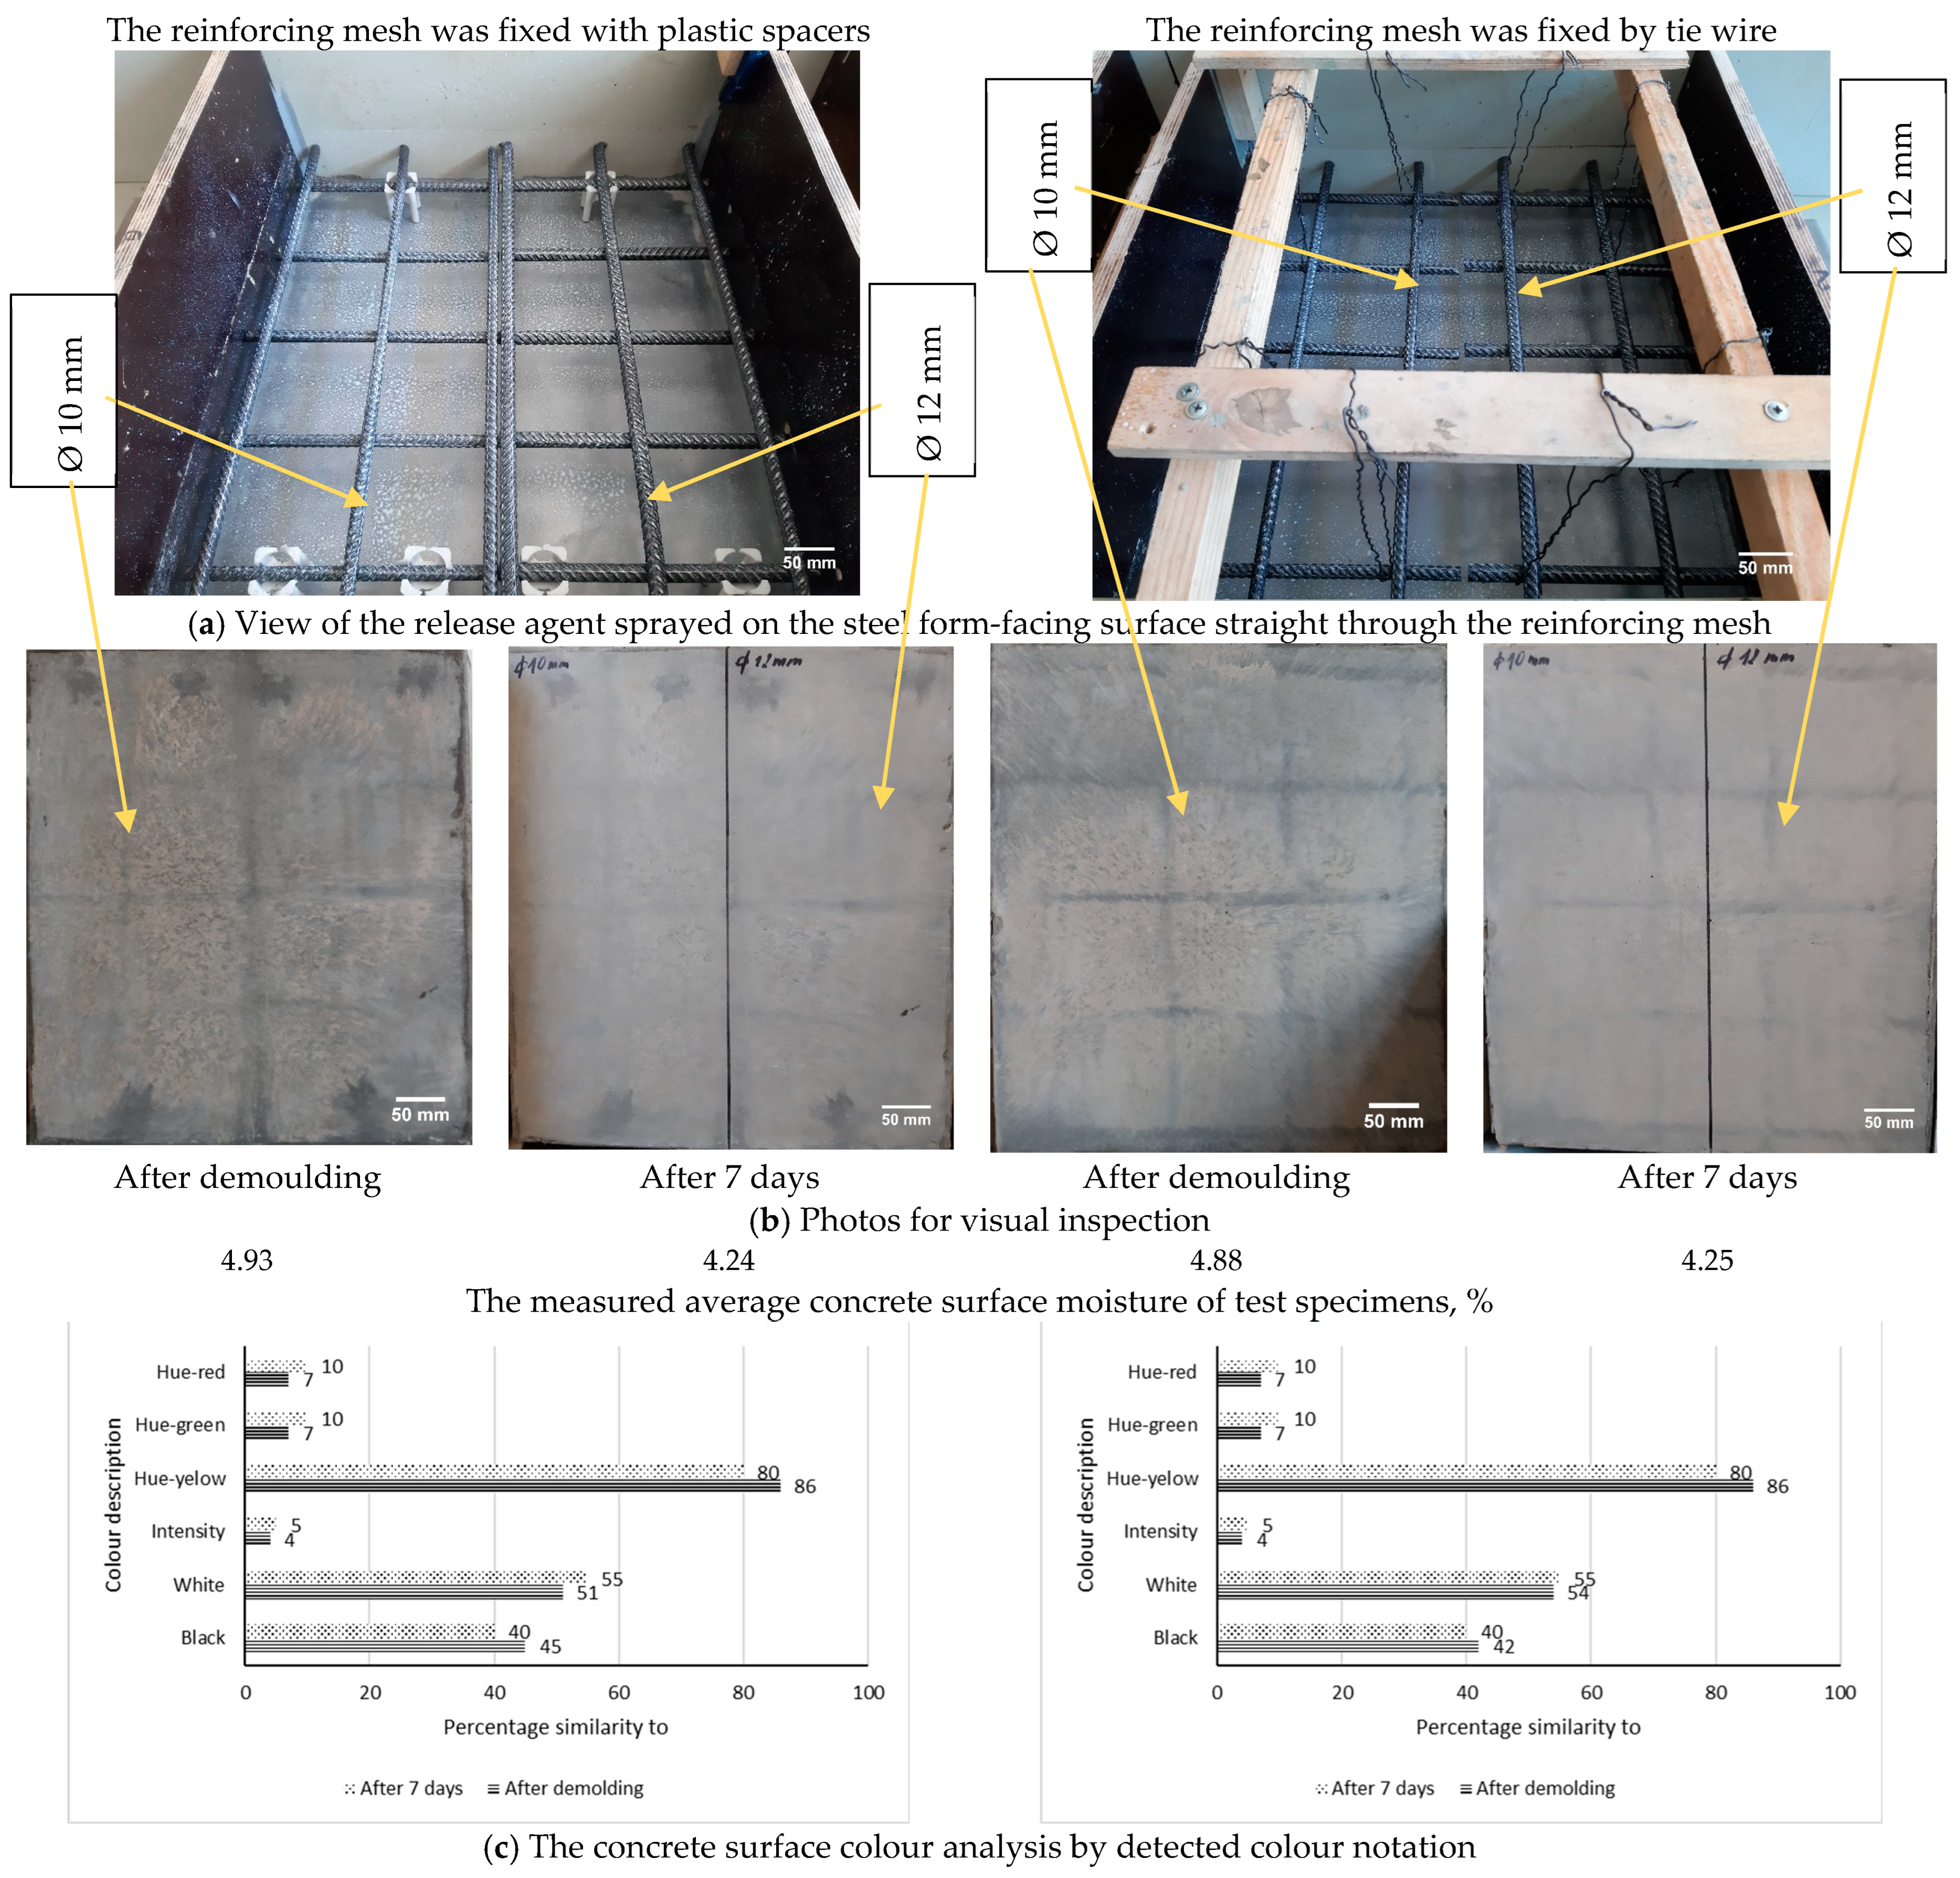
3.6. The Impact of the Release Agent Sprayed on the Steel Form-Facing Surface Straight Through the Reinforcing Mesh on the RS Effect

This section analyses the hypothesis that the release agent sprayed on the steel form-facing surface straight through the reinforcing mesh creates the RS visibility on the formed concrete surface. Operators must comply with on-site monolithic concrete structure construction technology requirements or the factory’s precast concrete element production technology. However, sometimes it happens that release oil is sprayed by the operator after the reinforcing mesh is placed, in which case the longitudinal and cross reinforcing bars partially block the spray of the release agent on the steel form-facing surface. The simulation of this case study is presented in Figure 15. The release agent, a water-soluble emulsion, was sprayed on the steel form-facing surface throughout the reinforcing mesh, which had a grid size of 100 × 100 mm and reinforcing bar diameters ranging from 10 mm to 12 mm (Figure 15a). The concrete cover thickness was 35 mm (C-RS-8). After that, the fresh mixture was poured into the moulds and compacted using the vibrational table for 10–15 s. Figure 15b presents pictures of concrete specimens removed from the moulds after two days and cured under laboratory conditions for seven days. It is seen that after the test specimens were removed from the moulds, the visibility of the shadowed area and surrounding area on the exposed concrete surface was brighter compared to the same specimens after seven days of curing. In addition, the reinforcing mesh tied by tie wire was able to move during mixture pouring and compaction and has a little bit brighter RS visibility, compared to the concrete specimens where the reinforcing mesh was fixed with plastic spacers and was not able to move. The shadows formed on the concrete surface show that the diameter of the reinforcement did not affect the width of the shadow zones.
The graphs presented in Figure 15c show that on the formed concrete surface (the reinforcing mesh was fixed with plastic spacers), the percentage of similarity to the black colour was 45% and to the white colour was 51%, while the average surface moisture after demoulding was about 4.93%.
Conversely, when the reinforcing mesh was fixed by tie wire, the percentage of similarity to the black colour was 42% and to the white colour 54%, while the average surface moisture was about 4.88%. After seven days of curing, the concrete colour became lighter in both cases due to the continuing cement hydration process, and the percentage of visual blackness decreased to 40%. The average surface moisture from water evaporation during storage under the laboratory conditions decreased to 4.24% and 4.25%, respectively. Figure 15c shows that the yellow hue of the inherent grey colour decreased to 80%, and new hue colours, such as red and green, were detected when the reinforcing meshes were fixed in the mould using two methods. Thus, it affects the mottling concrete surface appearance. In addition, the intensity percentage of the colour increased from 4% to 5% after 7 days of storage in the laboratory. This means that the different amounts of release agent sprayed on the steel form-facing surface impacted the concrete colour differences: an excessive amount of release agent was sprayed throughout the reinforcing mesh, with a grid size of 100 × 100 mm. At the same time, there was no release agent below the reinforcing mesh (whose diameters were 10 mm and 12 mm) on the steel form-facing surface (Figure 15a). The research used the water-soluble emulsion to reduce the adhesion between concrete and steel form-facing surfaces. An emulsion consists of one liquid dispersed as tiny droplets within another liquid that does not mix with it [45]. Emulsions consist of approximately 70% water, allowing a reduced quantity of oil on the formwork surface [46]. After the water evaporates, the film is created on formwork surfaces. The cement skin is formed in the exterior layer, which creates contact with fresh concrete and with the formwork covered by a release agent [47]. Release agents on the formwork surfaces must be applied in a thin and continuous film, without excess, to reach air-pore-free and colour-uniform concrete surfaces [48]. According to the authors [49], the subsurface layer of cementitious composites can be categorised into three parts: a cement skin measuring 0.1 mm, a mortar skin of 5 mm, and a concrete skin of 30 mm.
The types of release agents and the materials used for form-facing play a crucial role in affecting the wettability at the interface between formwork and concrete [50]. In addition, all the formwork surfaces, with or without release agents, belong to the hydrophilic category. It means that formwork material can interact with water. When the release agent is sprayed through the reinforcing mesh, the cement paste or mortar matrix cures slightly differently in areas with the release agent compared to areas without it, impacting concrete colour differences. The absence of a release agent under steel rebars decreases the wettability at the interface between the formwork and fresh concrete, resulting in dark lines on the exposed concrete surface. In contrast, the presence of the release agent increases the wettability at the interface between the formwork and concrete, resulting in a lighter colour surrounding area. Decreased wettability lowered the water-to-cement ratio at the mixture-formwork interface, resulting in a darker concrete colour and vice versa. A low water–cement ratio paste is always darker than a high water–cement ratio paste made with the same Portland cement [17]. The same result is also reported in the literature [2]. The graphs presented in Figure 16 show the similarity percentage of black colour in the shadowed and a surrounding area. Figure 16a,b show that the percentage similarity to the black colour in the shadowed area was 55%, compared to 45% in the surrounding area after demoulding and 45% in the shadowed area compared to 40% in the surrounding area after 7 days of storage, when the reinforcing mesh was fixed with plastic spacers. Conversely, when the reinforcing mesh was fixed by tie wire, the percentage similarity to black colour in the shadowed area was 50% compared to 42% in the surrounding area after demoulding and 45% in the shadowed area compared to 40% in the surrounding area after 7 days of storage, as presented in Figure 16c,d. Due to the continuing hydration process, the percentage similarity to the black colour decreased in the shadowed and surrounding areas when the reinforcing mesh was fixed in the mould using two methods.

3.7. The Impact of Concrete Surface Discolouration Affected by Weather Conditions on the RS Visibility

This section analyses the hypothesis that concrete colour discolouration affected by weather conditions might strengthen the effect of RS visibility. In this case, the research investigated the impact of weather conditions on concrete surface colour discolouration during the concrete specimen’s storage in an external environment. After 8 months of storage under laboratory conditions, the concrete specimens were stored outside, where they were kept in the vertical position for 10 days during November, in Kaunas, Lithuania. The weather conditions were as follows: daytime temperature 7.7 °C, nighttime temperature 2.8 °C, and relative humidity approximately 87%.
Figure 17a compares pictures of the produced concrete specimens (the cover thickness decreased from 35 to 10 mm) when stored for 7 days in the laboratory and 10 days outside. After conducting a visual inspection with the naked eye, it was seen that the grey colour of exposed concrete surfaces, after storage outside, when daytime temperature was 7.7 °C, nighttime temperature was 2.8 °C, and relative humidity was approximately 87%, became more intensive. An analysis of detected colour notation showed that the similarity percentage of the exposed concrete surface to the black colour increased from 55% to 58% (Figure 17b). The similarity percentage to the white colour decreased from 43% to 38% when plastic spacers or tie wire fixed the reinforcing mesh in the mould. In addition, the concrete surface moisture increased by a small percentage, from 4.34% (after storage in the laboratory) to 4.35% (after storage outside), when plastic spacers fixed the reinforcing mesh in the mould. In comparison, when the reinforcing mesh was fixed by tie wire, the concrete surface moisture increased from 4.25% (after storage in the laboratory) to 4.36% (after storage outside). As mentioned in Section 3.6, the cement skin is formed in the exterior layer, which creates contact with fresh concrete and the formwork covered by a release agent [47]. The pore structure in cement-based materials primarily arises from the water-filled spaces between the irregularly shaped grains of anhydrous clinker. A water content exceeding what can be entirely consumed through hydration is typically necessary to facilitate concrete formation [51]. This causes the formation of micron to sub-micron capillary pathways oriented to the cement skin in the hardened cement paste. Capillary absorption primarily drives moisture ingress in unsaturated hardened cement pastes and concretes. Water entering the pore structure can change the exposed concrete to a darker grey colour. By examining the relationship between the grayscale step wedge intensity and the resolved moisture content, the authors of [51] determined that increased moisture content in hardened cement paste increases the greyscale intensity based on a black-to-white gradient. The grey colour intensity percentage of exposed concrete surface increased from 2% to 4% (Figure 17b).
After storage outside for 10 days under the conditions mentioned above, the visibility of reinforcement shadows in concrete specimens (the reinforcing mesh was fixed with plastic spacers) became less bright compared to the specimens stored under laboratory conditions for 7 days (Figure 17a on the left side). Due to the continuing cement hydration process, the percentage similarity to the black colour in the shadowed area decreased from 65% after 7 days of storage (Figure 11b on the right side) to 60% after 10 days of storage outside (Figure 17c). In comparison, the percentage similarity to the black colour in the surrounding area increased from 55% after 7 days of storage (Figure 11b on the right side) to 58% after 10 days of storage outside (Figure 17c). This could indicate that the pore structure of hardened cement paste in the surrounding areas is more developed and can absorb higher moisture content. A darker surface in the surrounding area likely affected the dark lines on the specimen surface, making them less visible. Also, the grey colour intensity percentage increased from 2% (Figure 11b on the right side) to 4% in the surrounding area of the test specimens.
Figure 18a compares pictures of the produced concrete test specimens stored for 7 days in the laboratory and 10 days outdoors when the release agent was sprayed on the steel form-facing surface directly through the reinforcing mesh. During visual inspection with the naked eye, the grey colour of exposed concrete surfaces became more intense in the shadowed and surrounding areas after storage outside. The concrete surface colour analysis showed (Figure 18b) that on the formed concrete surface (the reinforcing mesh was fixed with plastic spacers), the percentage of similarity to the black colour increased from 40% after storage in the laboratory to 47% after storage outside, while average surface moisture increased from 4.24% to 4.28%, respectively. Conversely, when the reinforcing mesh was fixed by tie wire, the similarity percentage to the black colour increased from 42% to 47%, while the average surface moisture increased from 4.88% to 4.88%. It can be assumed that when the test specimens were stored outdoors, they absorbed more moisture, resulting in a more intensive grey colour of the exposed concrete surface. This effect was also noticed in the shadowed and surrounding areas (Figure 18c). The percentage of similarity to the black colour in the shadowed area increased from 45% after 7 days of storage in the laboratory to 60% after storage outside using two methods of reinforcing mesh fixing, as presented in Figure 16b,d and Figure 18c, respectively. In comparison, the percentage of black colour in the surrounding area increased from 40% after 7 days of storage in the laboratory to 47% after storage outside using two methods of reinforcing mesh fixing. Thus, after being stored outside, the visibility of the reinforcement shadows became brighter and with higher contrast compared to the specimens stored under laboratory conditions. This indicates that weather conditions during production, storage, or use can enhance the visibility of reinforcement shadows on the exposed concrete surface when the RS effect was formed by a release agent sprayed on the steel form-facing surface straight through the reinforcing mesh.
Additional investigation was also carried out to check the impact of weather conditions on a real object: a precast concrete element. For this study, a precast reinforced concrete wall element that was produced horizontally in a factory, in contact with a steel form-facing surface, was selected. The exposed concrete wall was already installed in a multistorey building. The precast concrete element that has been analysed can be seen in Figure 19a. The photo shows that the reinforcement shadows are more visible in the middle part of the wall. This may indicate that the occurrence of the reinforcement shadow on the formed concrete surface was likely due to a lack of the rigidity of the mould [1,7,8]. Fresh concrete receives more vibration in the middle part of the mould than at the edges, which results in different curing conditions in the concrete matrix below the steel rebar and the surrounding area. It can be hypothesised that different curing conditions result in colour variation with the appearance of dark lines with greater contrast.
The precast reinforced concrete wall element was investigated in November with a daytime temperature of 6.2 °C and a relative humidity of around 88%. The precast concrete element was installed on the construction site for approximately two months before the tests. First of all, the concrete cover thickness of the precast concrete product was determined. The Hilti PS 50 portable wall scanner was used to measure the thickness of the concrete cover or the distance from the concrete surface to the steel rebar, by keeping the device on the dark lines on the product surface. The average thickness of the concrete cover was determined to be 40 mm. The colour variations were also determined using the NCS Colour Scan 2.0 portable colour reader, while the Laserliner MoistureMaster device was used to measure moisture content on the concrete surface. The graphs in Figure 19b present the colour variation analysis of the precast concrete element surface, shadow, and surrounding areas. It can be seen (Figure 19b on the left side) that the percentage of similarity to the black colour was 28% and to the white colour 68% when the average detected surface moisture was about 3.97%. In addition, the detected colour hue combined yellow, green, and red colours. The percentage similarity to the black colour in the shadowed area was 30% compared to 28% in the surrounding area (Figure 19b on the right side). An investigation of the real-scale precast concrete element showed that the dark line of reinforcement shadow can be characterised by the percentage similarity to the black and white colours in the shadowed area compared to the percentage similarity to the black and white colours in the surrounding area.
The key to preventing defects in monolithic concrete structures or precast concrete elements lies in strict compliance with construction and production technology specifications. The factors preventing defects can include the following: design stage—the minimum wall thicknesses have to be as designed to avoid scoring the form surface during compaction and to space the reinforcing bars to facilitate fresh concrete placement; concrete supply stage—special mix requirements, such as colour control, low bleed rates, and more stringent tolerances on slump and colour pigments, must be known and controlled; formwork stage—formwork must be made from the appropriate materials to maintain the specified quality of finish; release agents must be selected to allow easy stripping and the required colour and texture to be achieved; placing stage—fresh concrete must be placed, compacted, and finished to achieve a uniform finish; curing stage—concrete must be cured uniformly and adequately; if colour control is critical, different measures are suggested to facilitate the required curing conditions; assessment stage—the surface quality of exposed concrete surfaces should be assessed appropriately with acceptable and clearly understood criteria; the standardized method is advised. It is the responsibility of contractors and operators to adhere to these specifications, as doing so is integral to the process. By eliminating problems, we can deliver the high-quality structures that customers demand.

4. Conclusions

The potential causes of reinforcement shadows on the surface of formed concrete were examined in this study, drawing on hypotheses from the literature and experiences from the precast concrete production factory. The possible reasons for the appearance of these reinforcement shadows on the test specimens were analysed under laboratory conditions. Reinforcement shadows were evaluated through visual inspection, surface moisture content measurements, and analysis of colour variation. Based on the findings of this study, the following conclusions can be drawn:
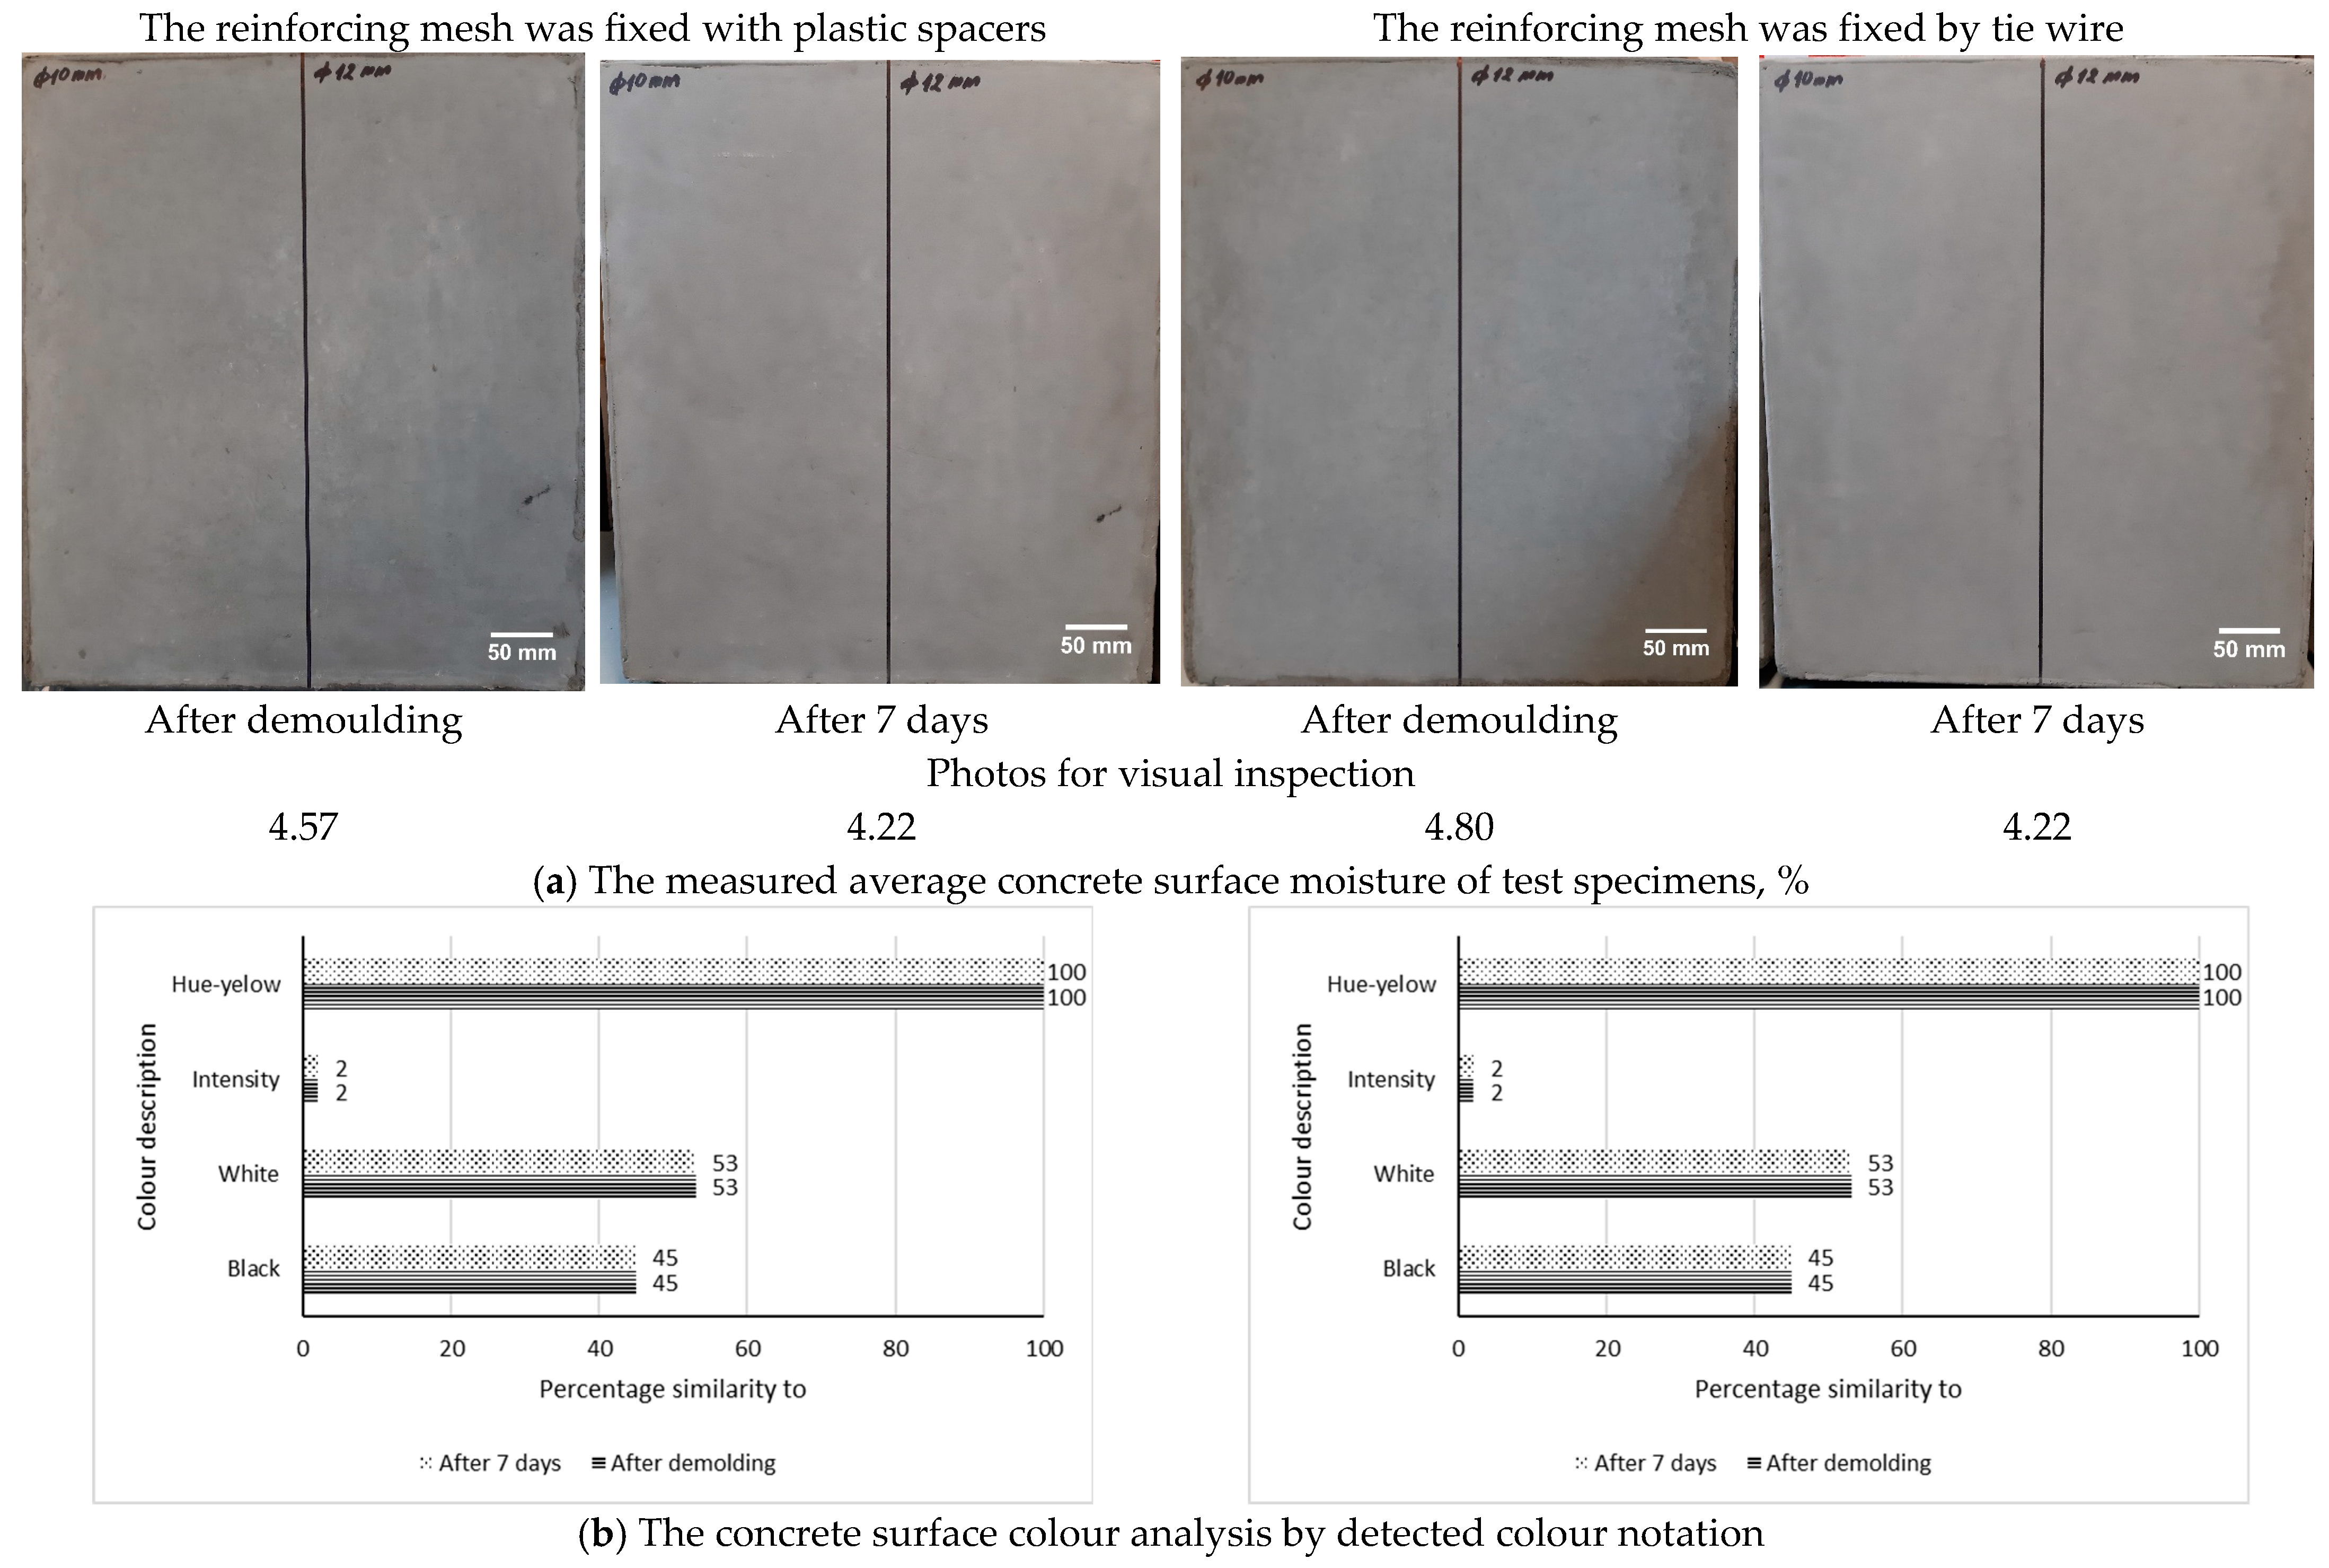
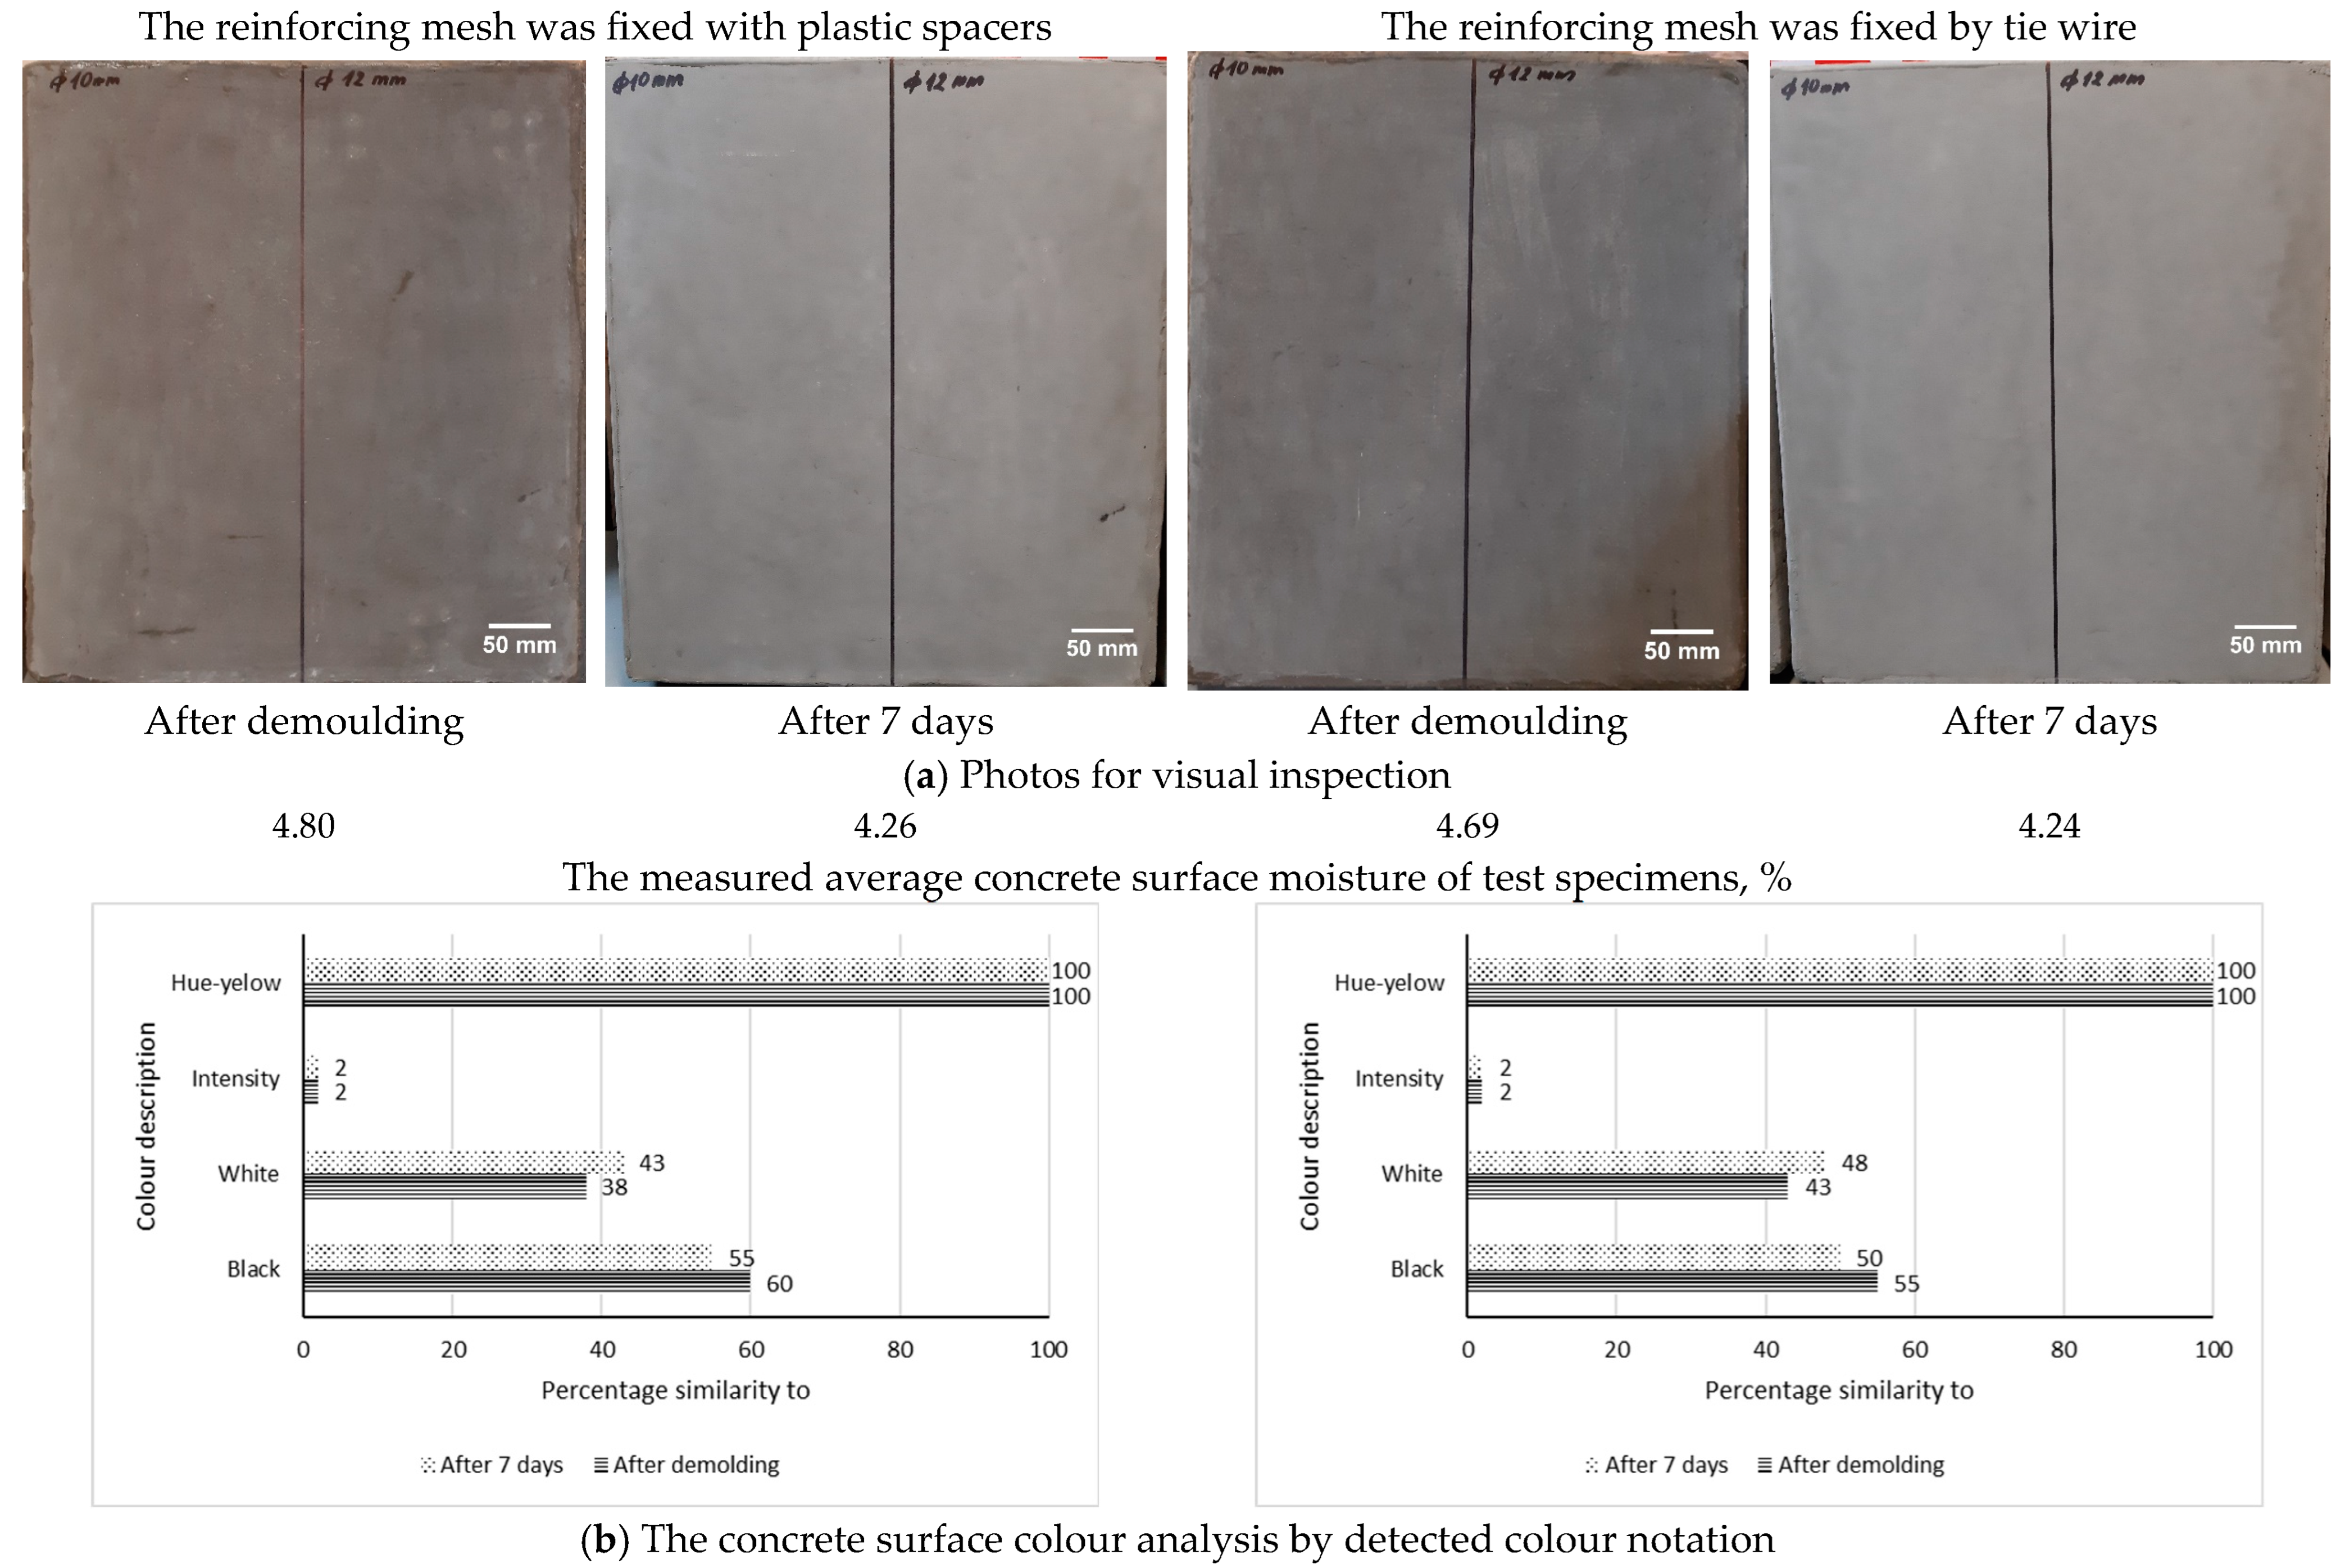
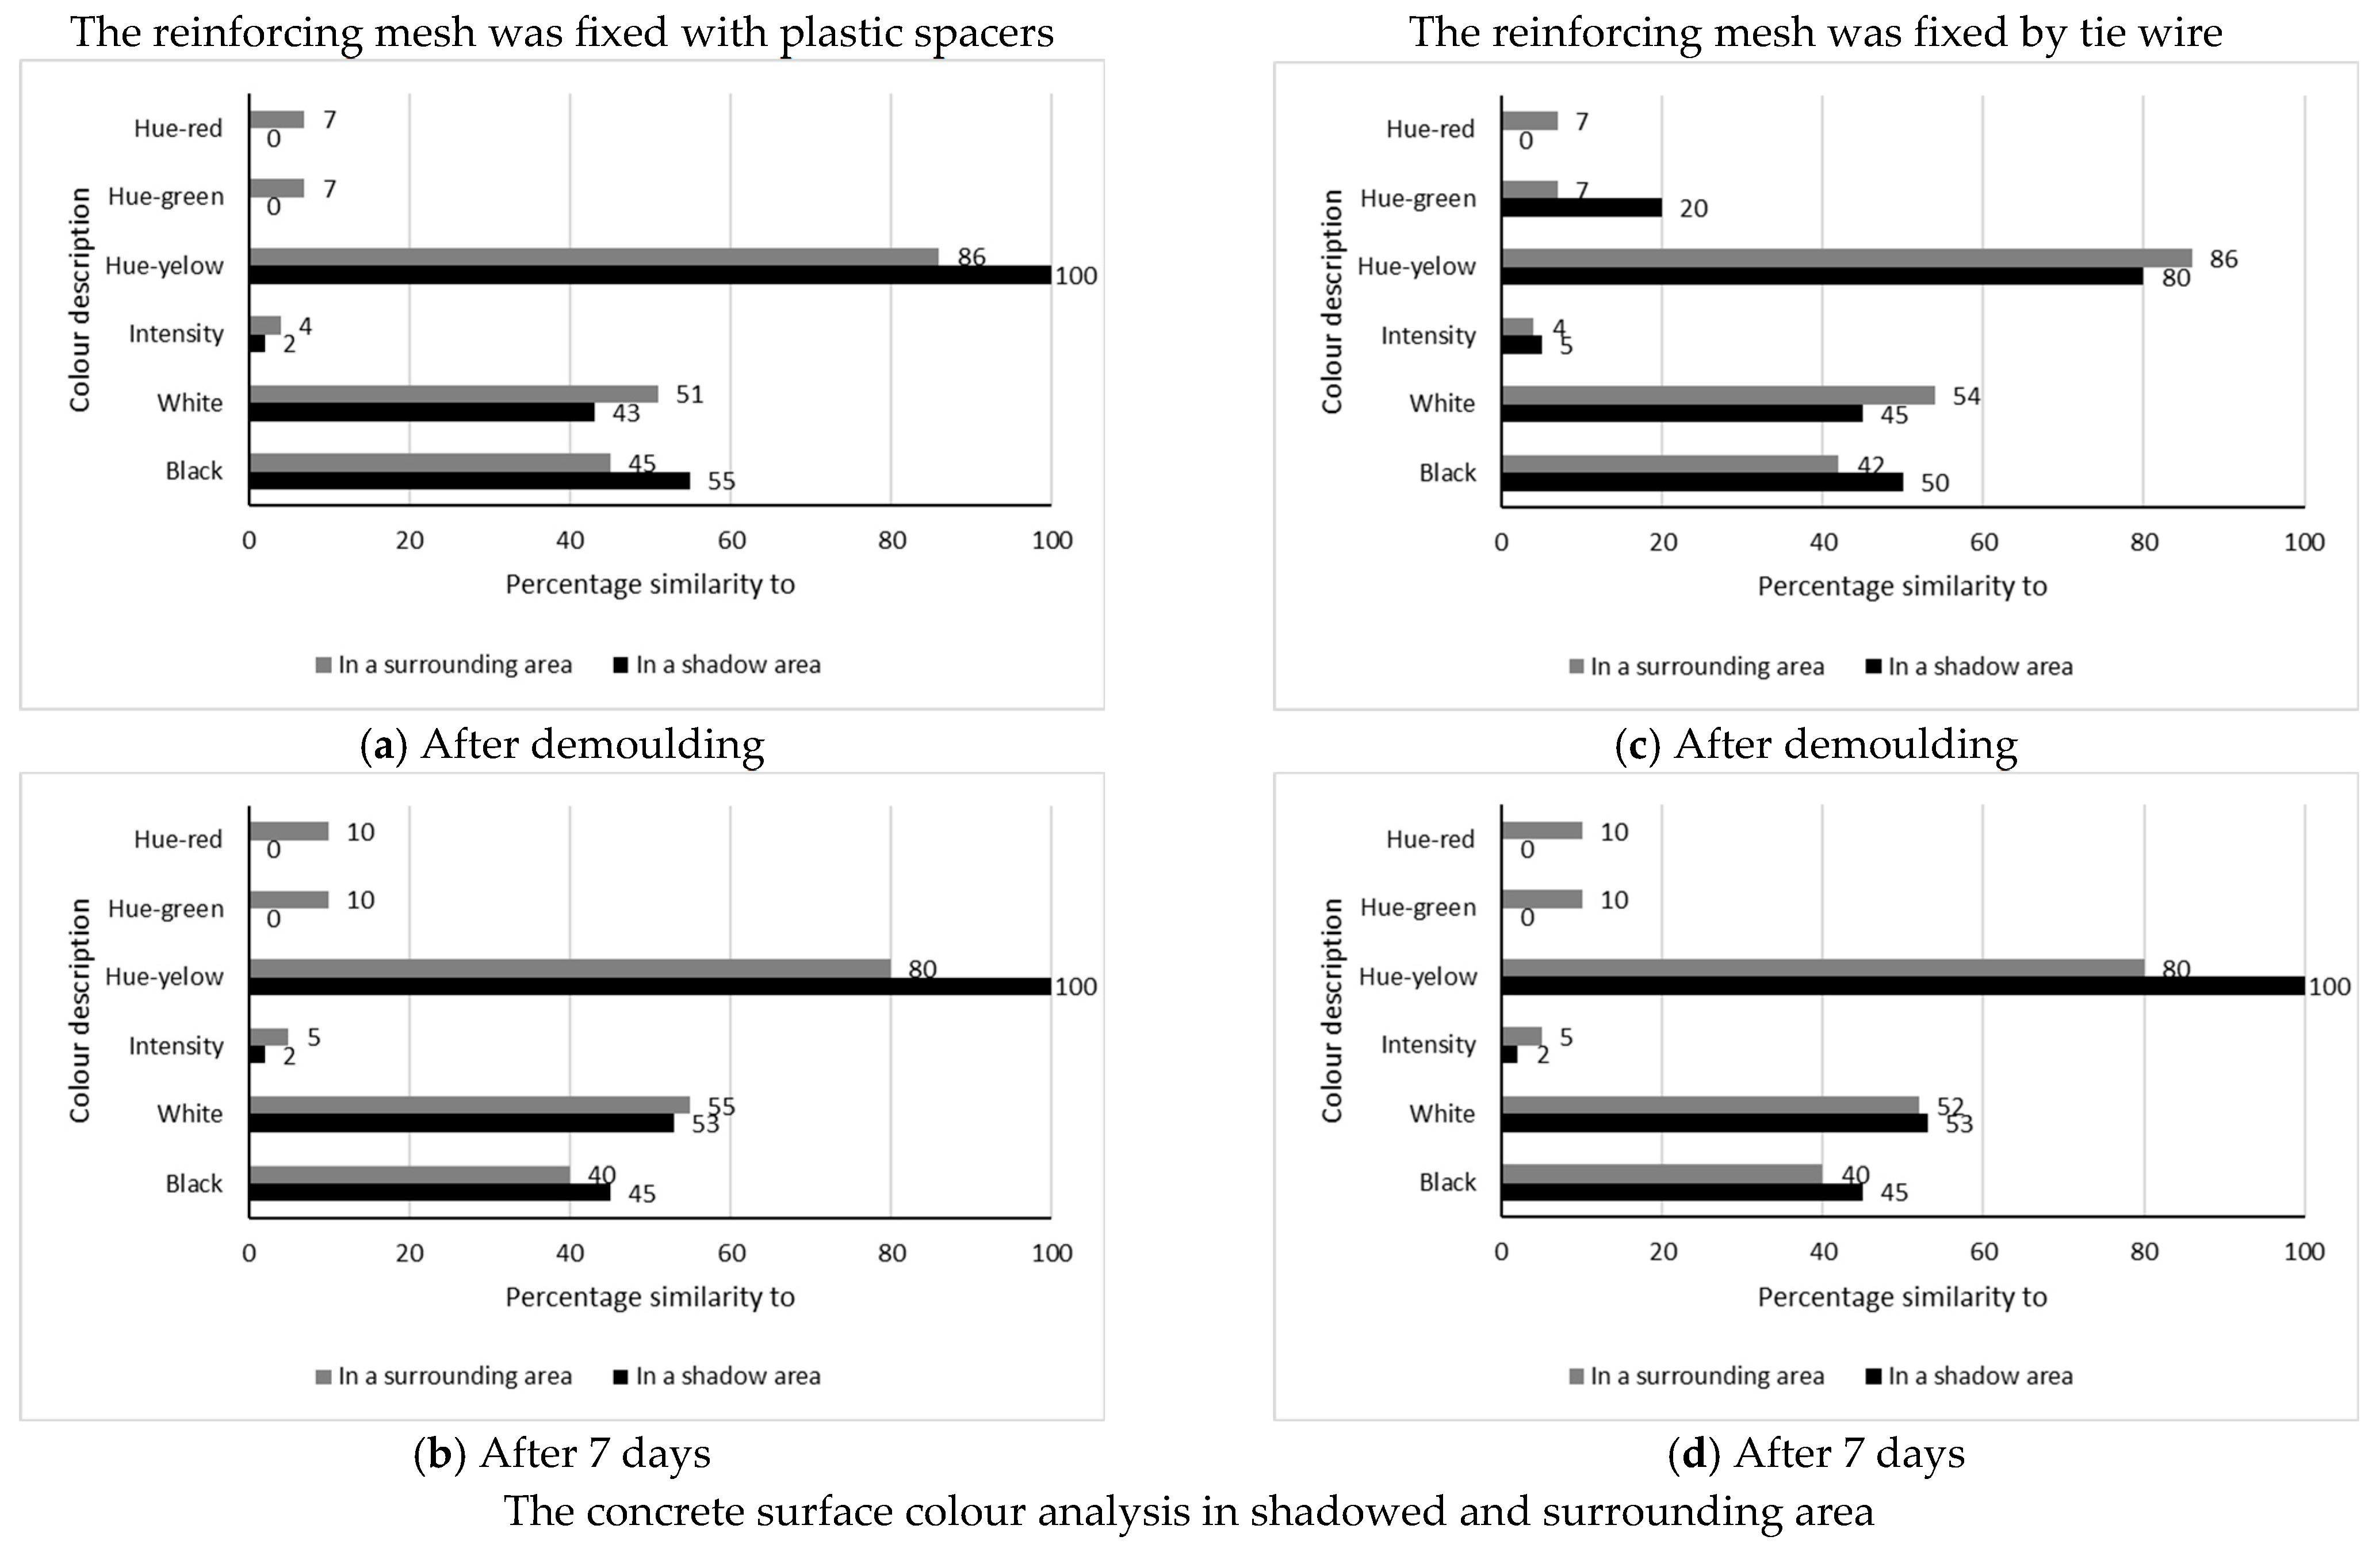
  • The cement skin colour formed at the interface zone of fresh concrete made using Portland slag cement and steel form-facing material applied by a water-soluble release agent can be described as an inherent grey colour with a yellow hue. After seven days of storage under laboratory conditions, this colour exhibits 55–45% similarity to black, 43–37% to white, an intensity of 2%, and 100% of the yellow hue. Colour analysis used the Natural Colour System for precise colour definition.
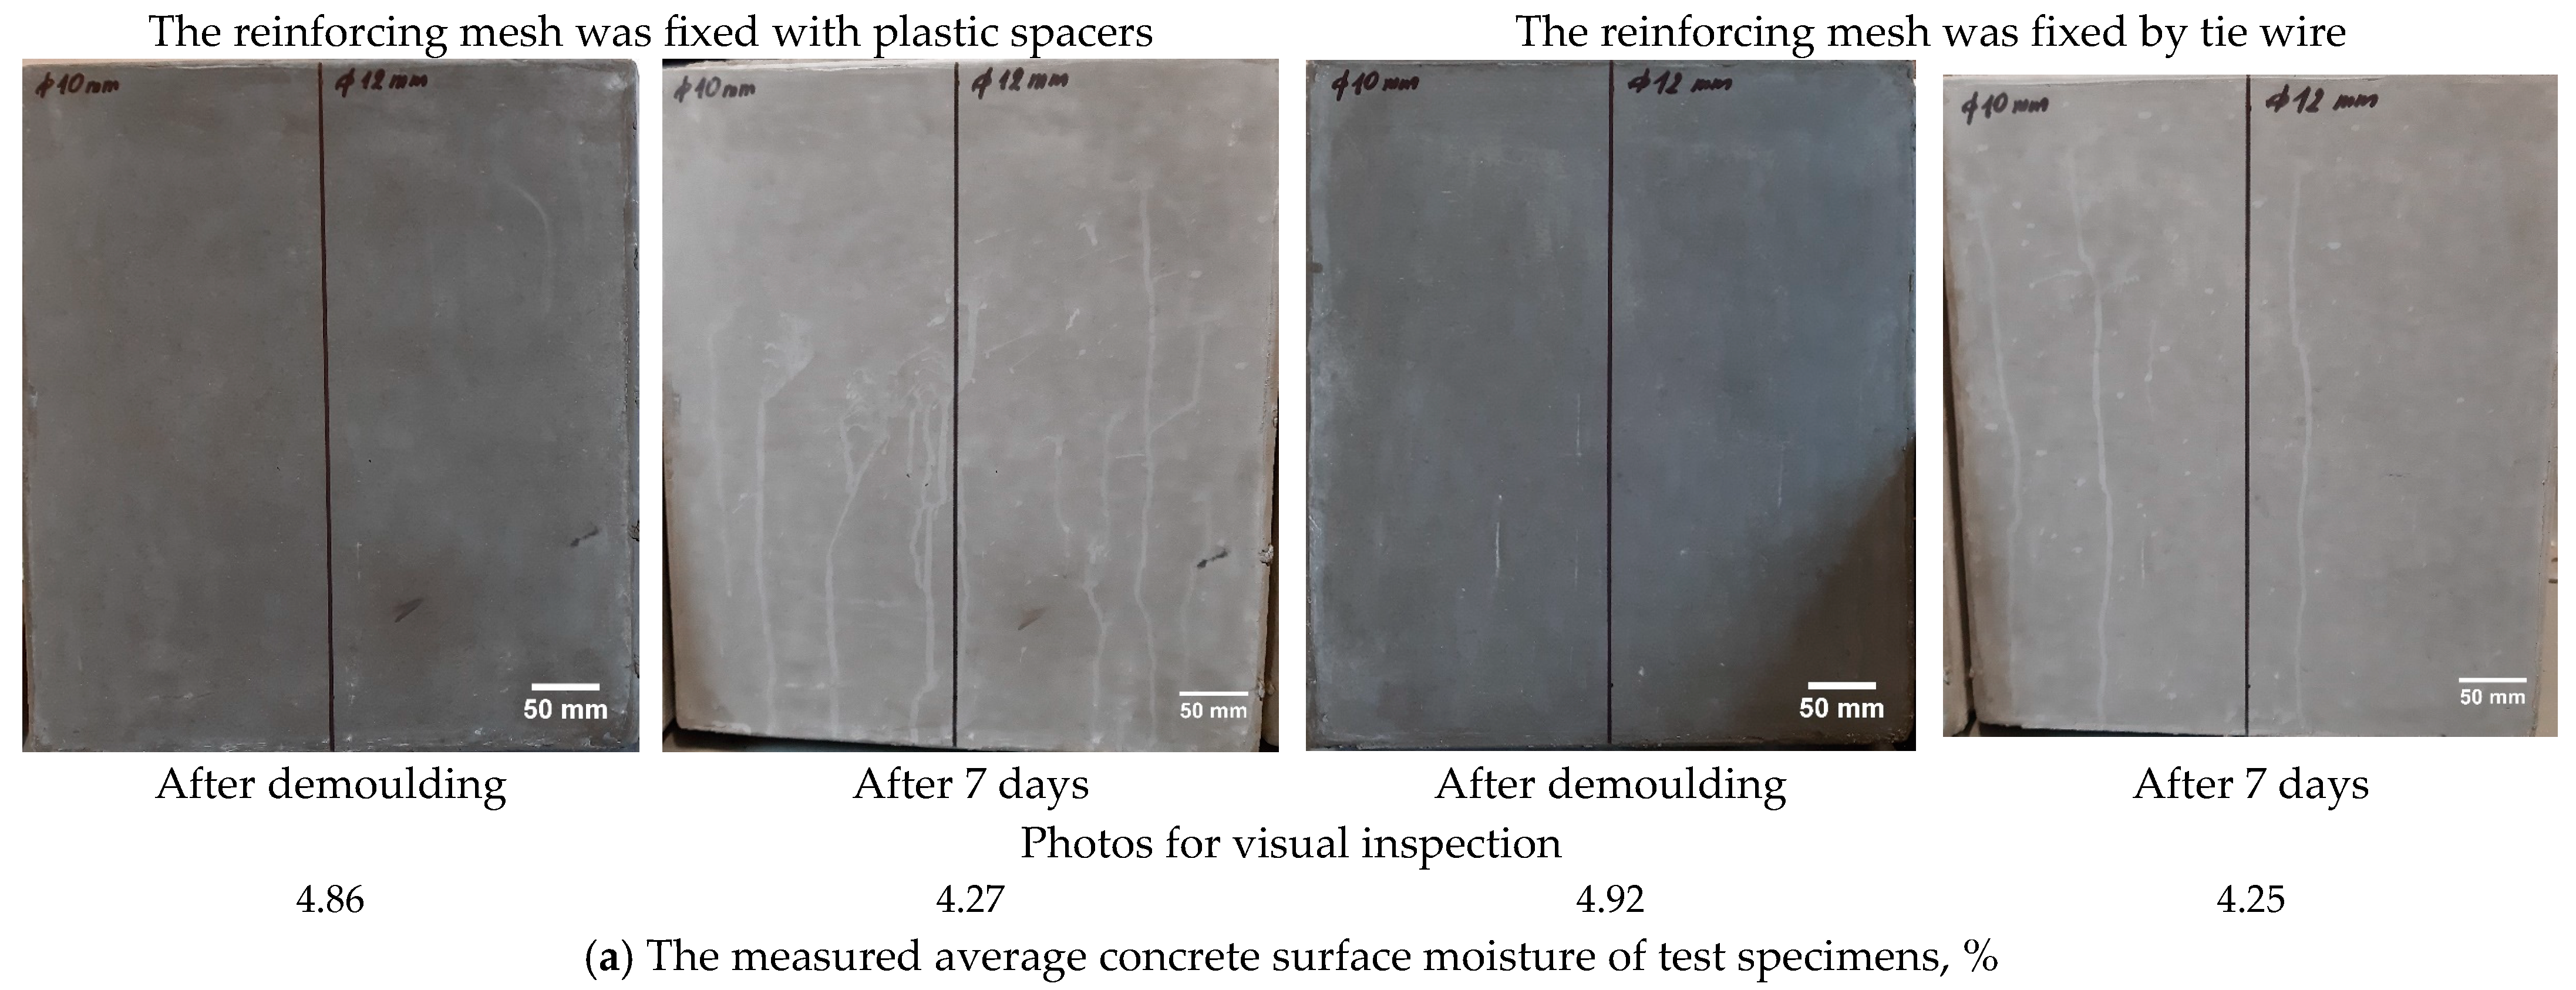
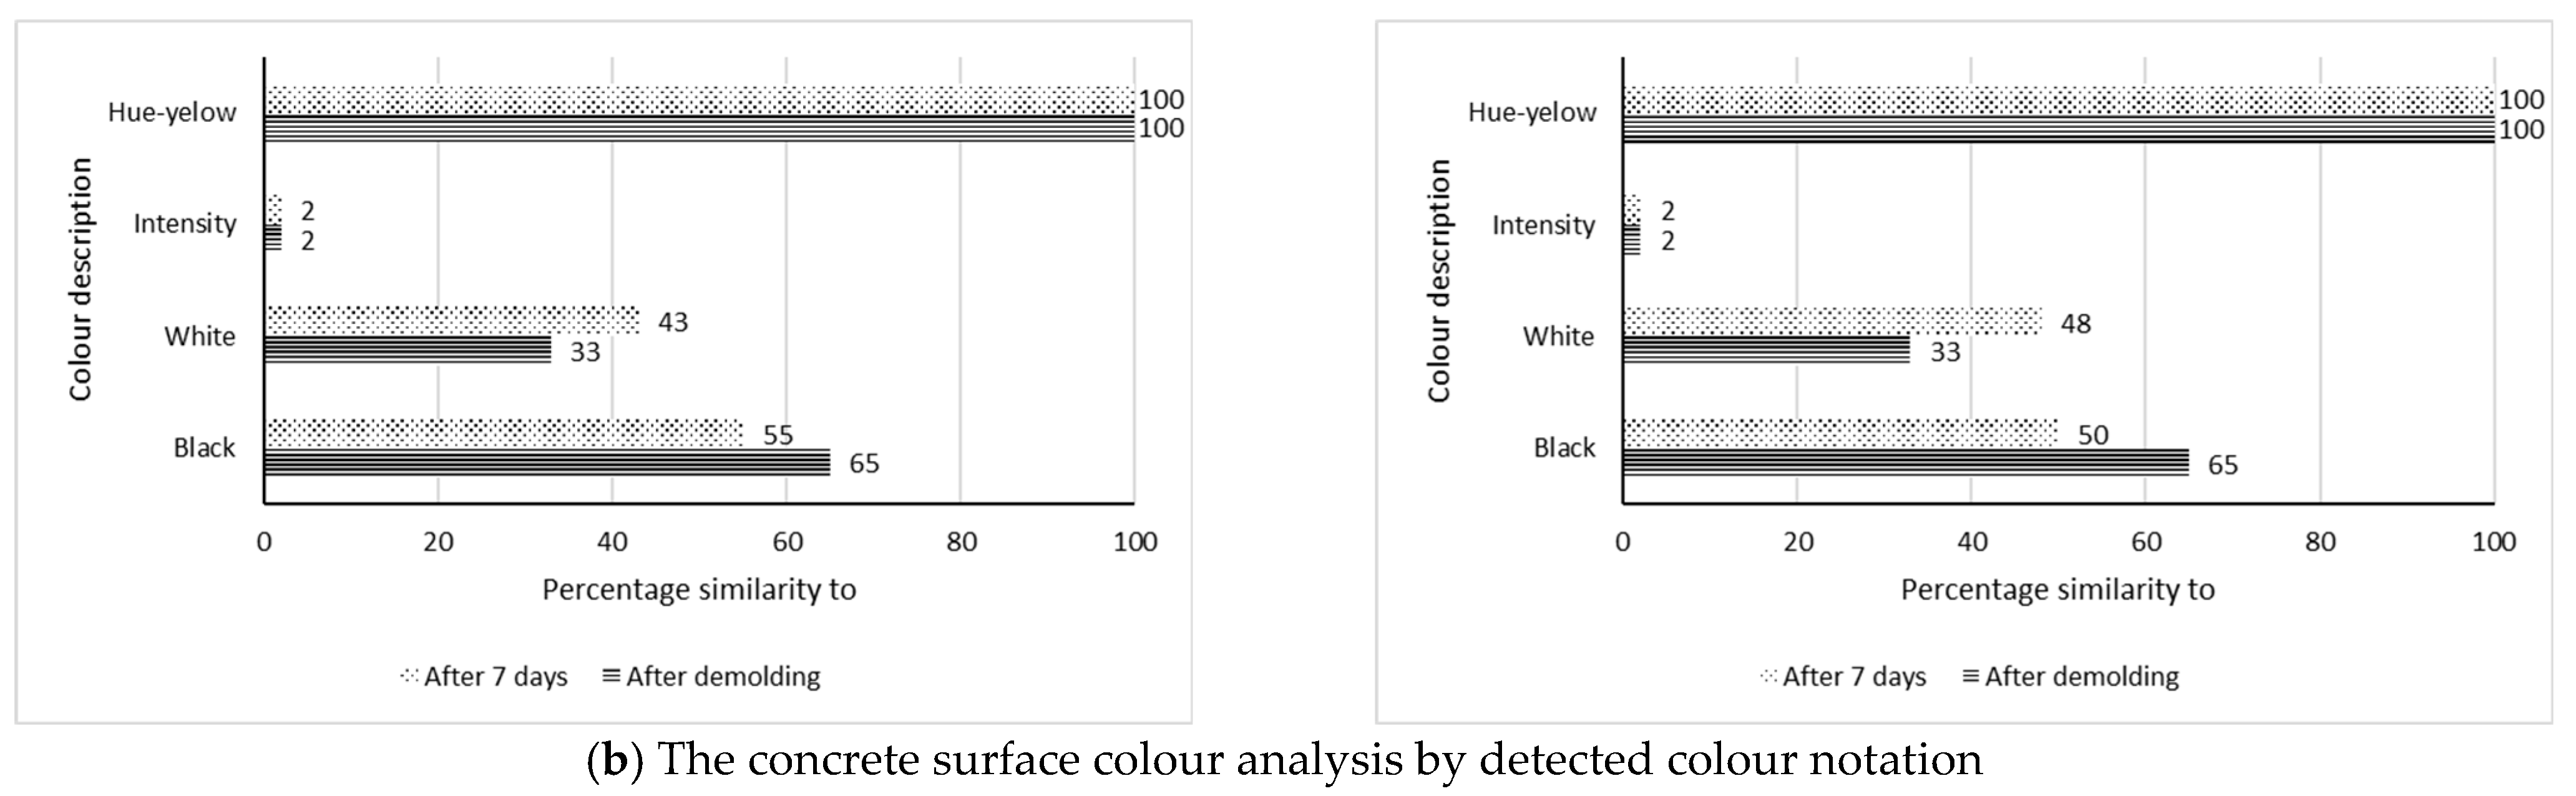
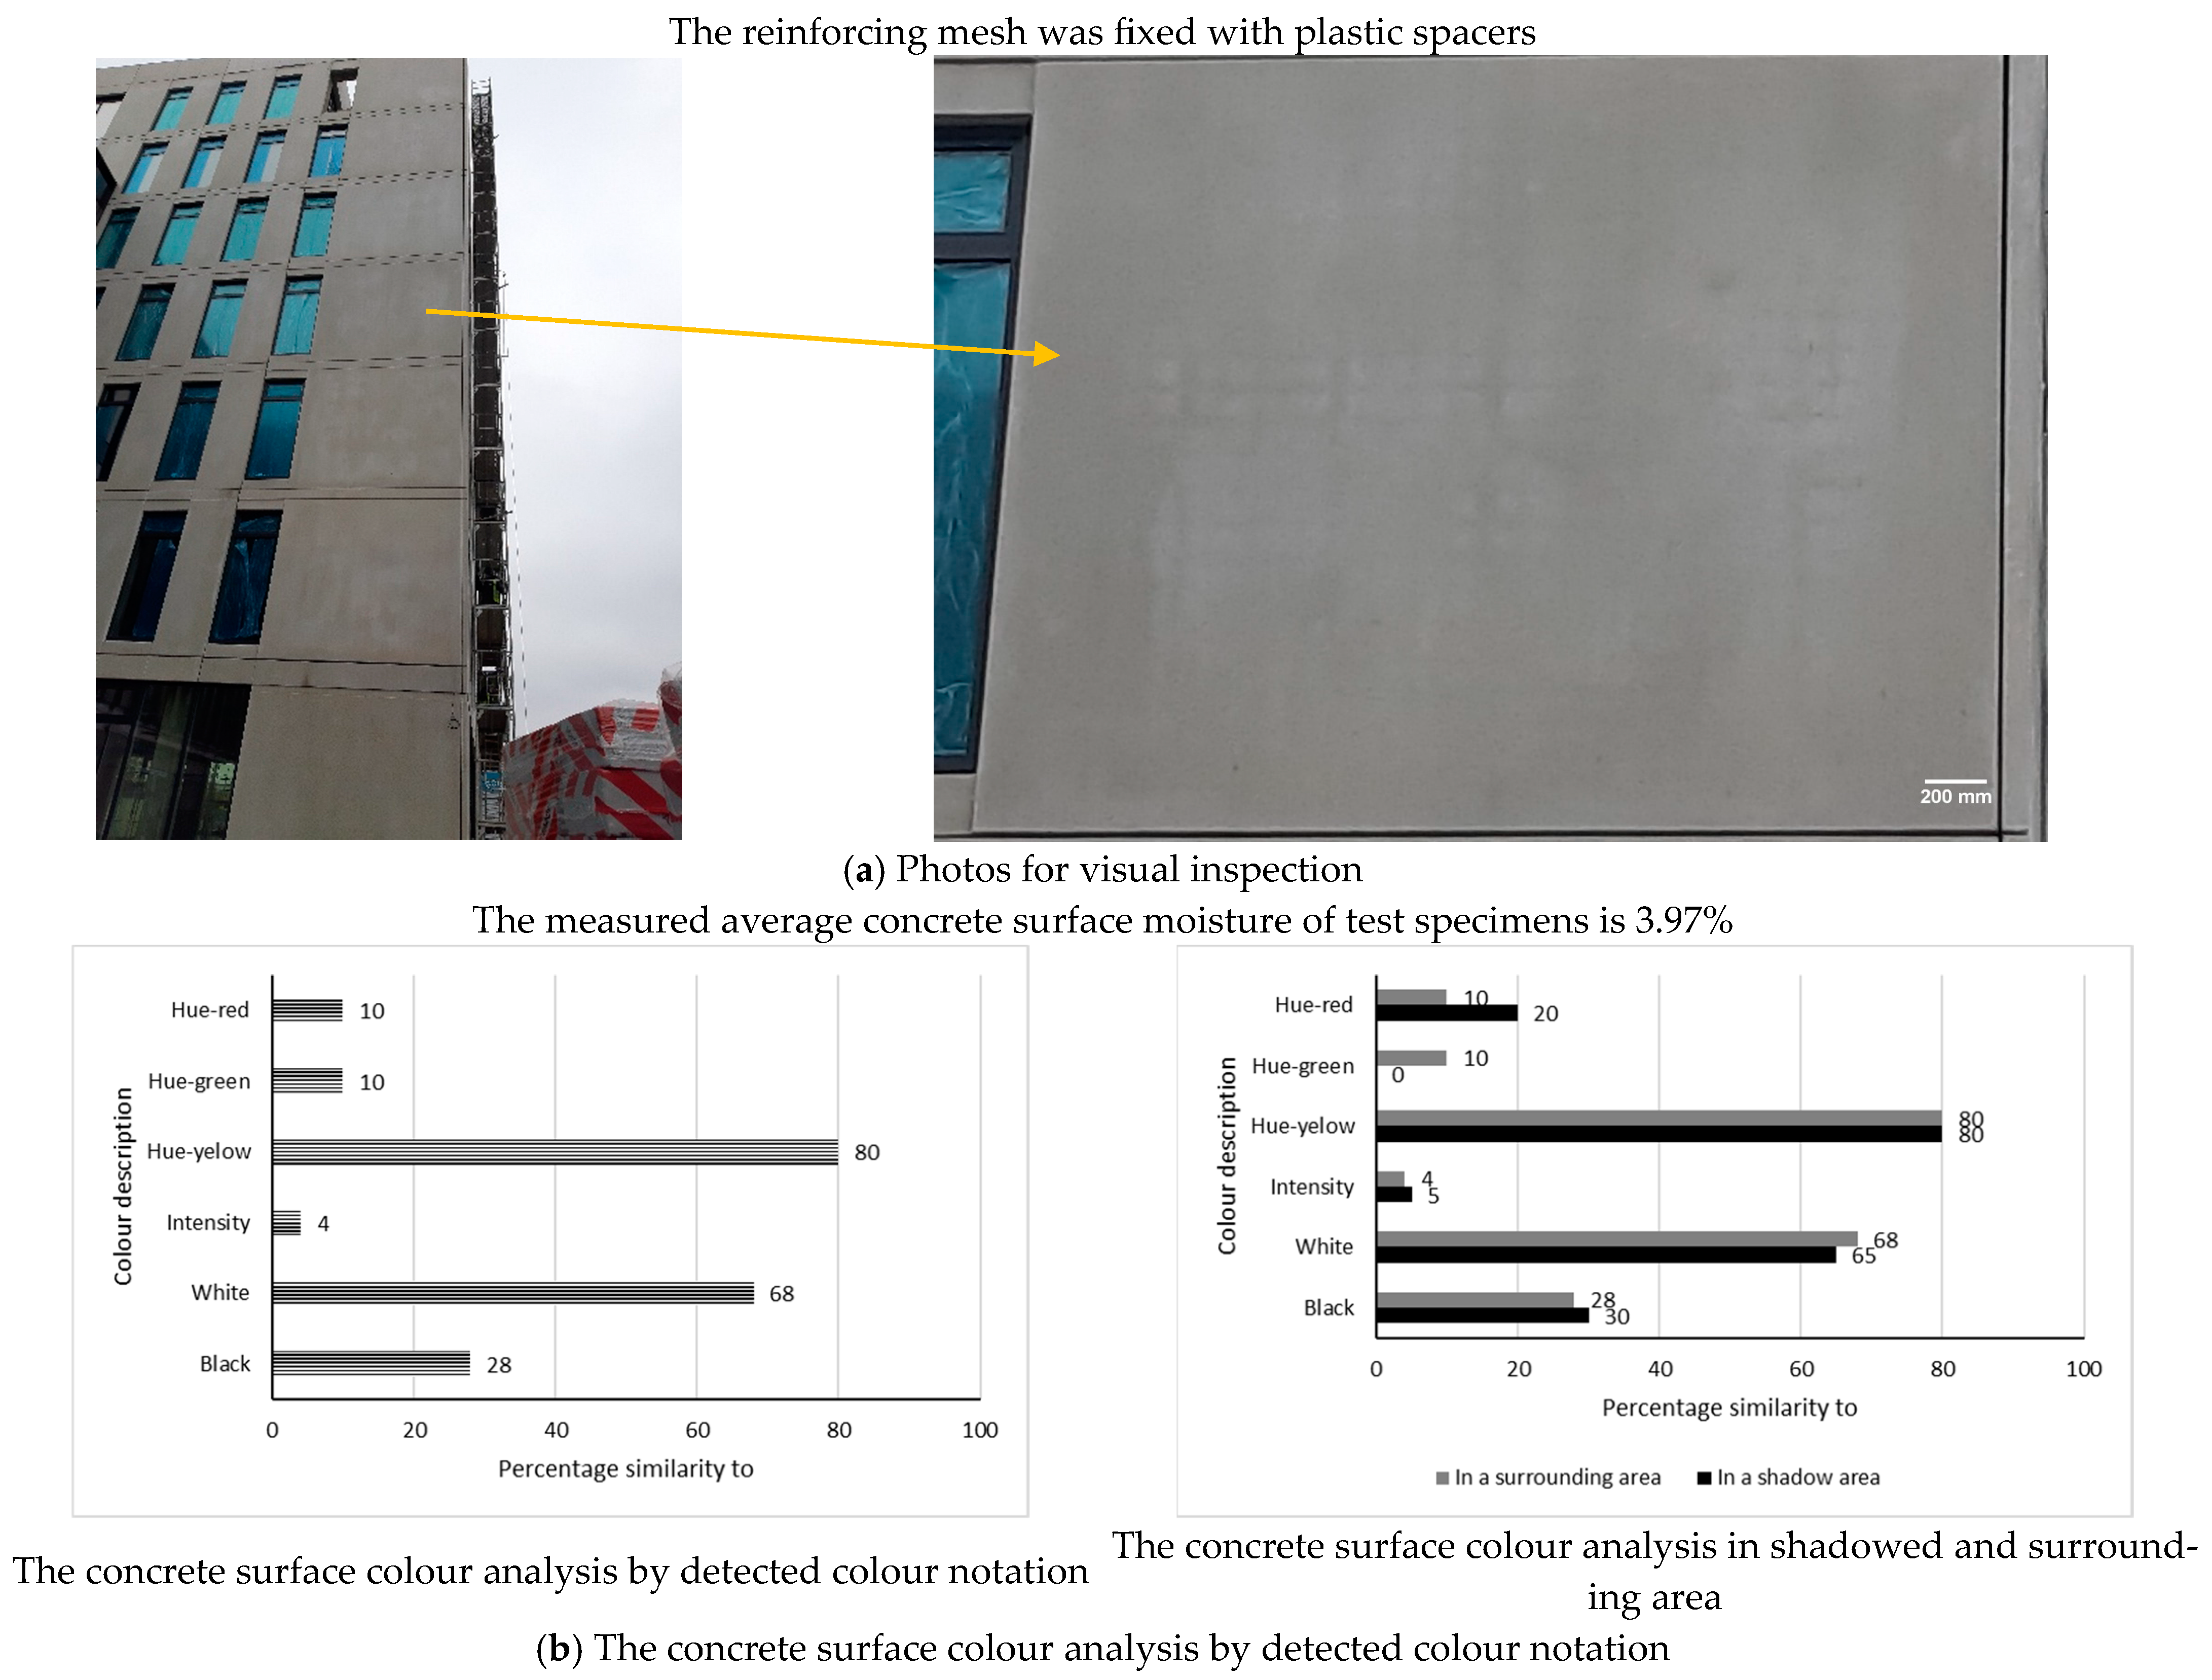
  • It was noticed that the percentage similarity to the black colour decreased slightly, and the percentage similarity to the white colour increased somewhat when the reinforcing mesh in the mould was fixed with tie wire rather than plastic spacers. This should be considered because different methods of fixing the reinforcing mesh in the mould during the production of concrete elements can affect the colour discolouration on the latter’s surface.
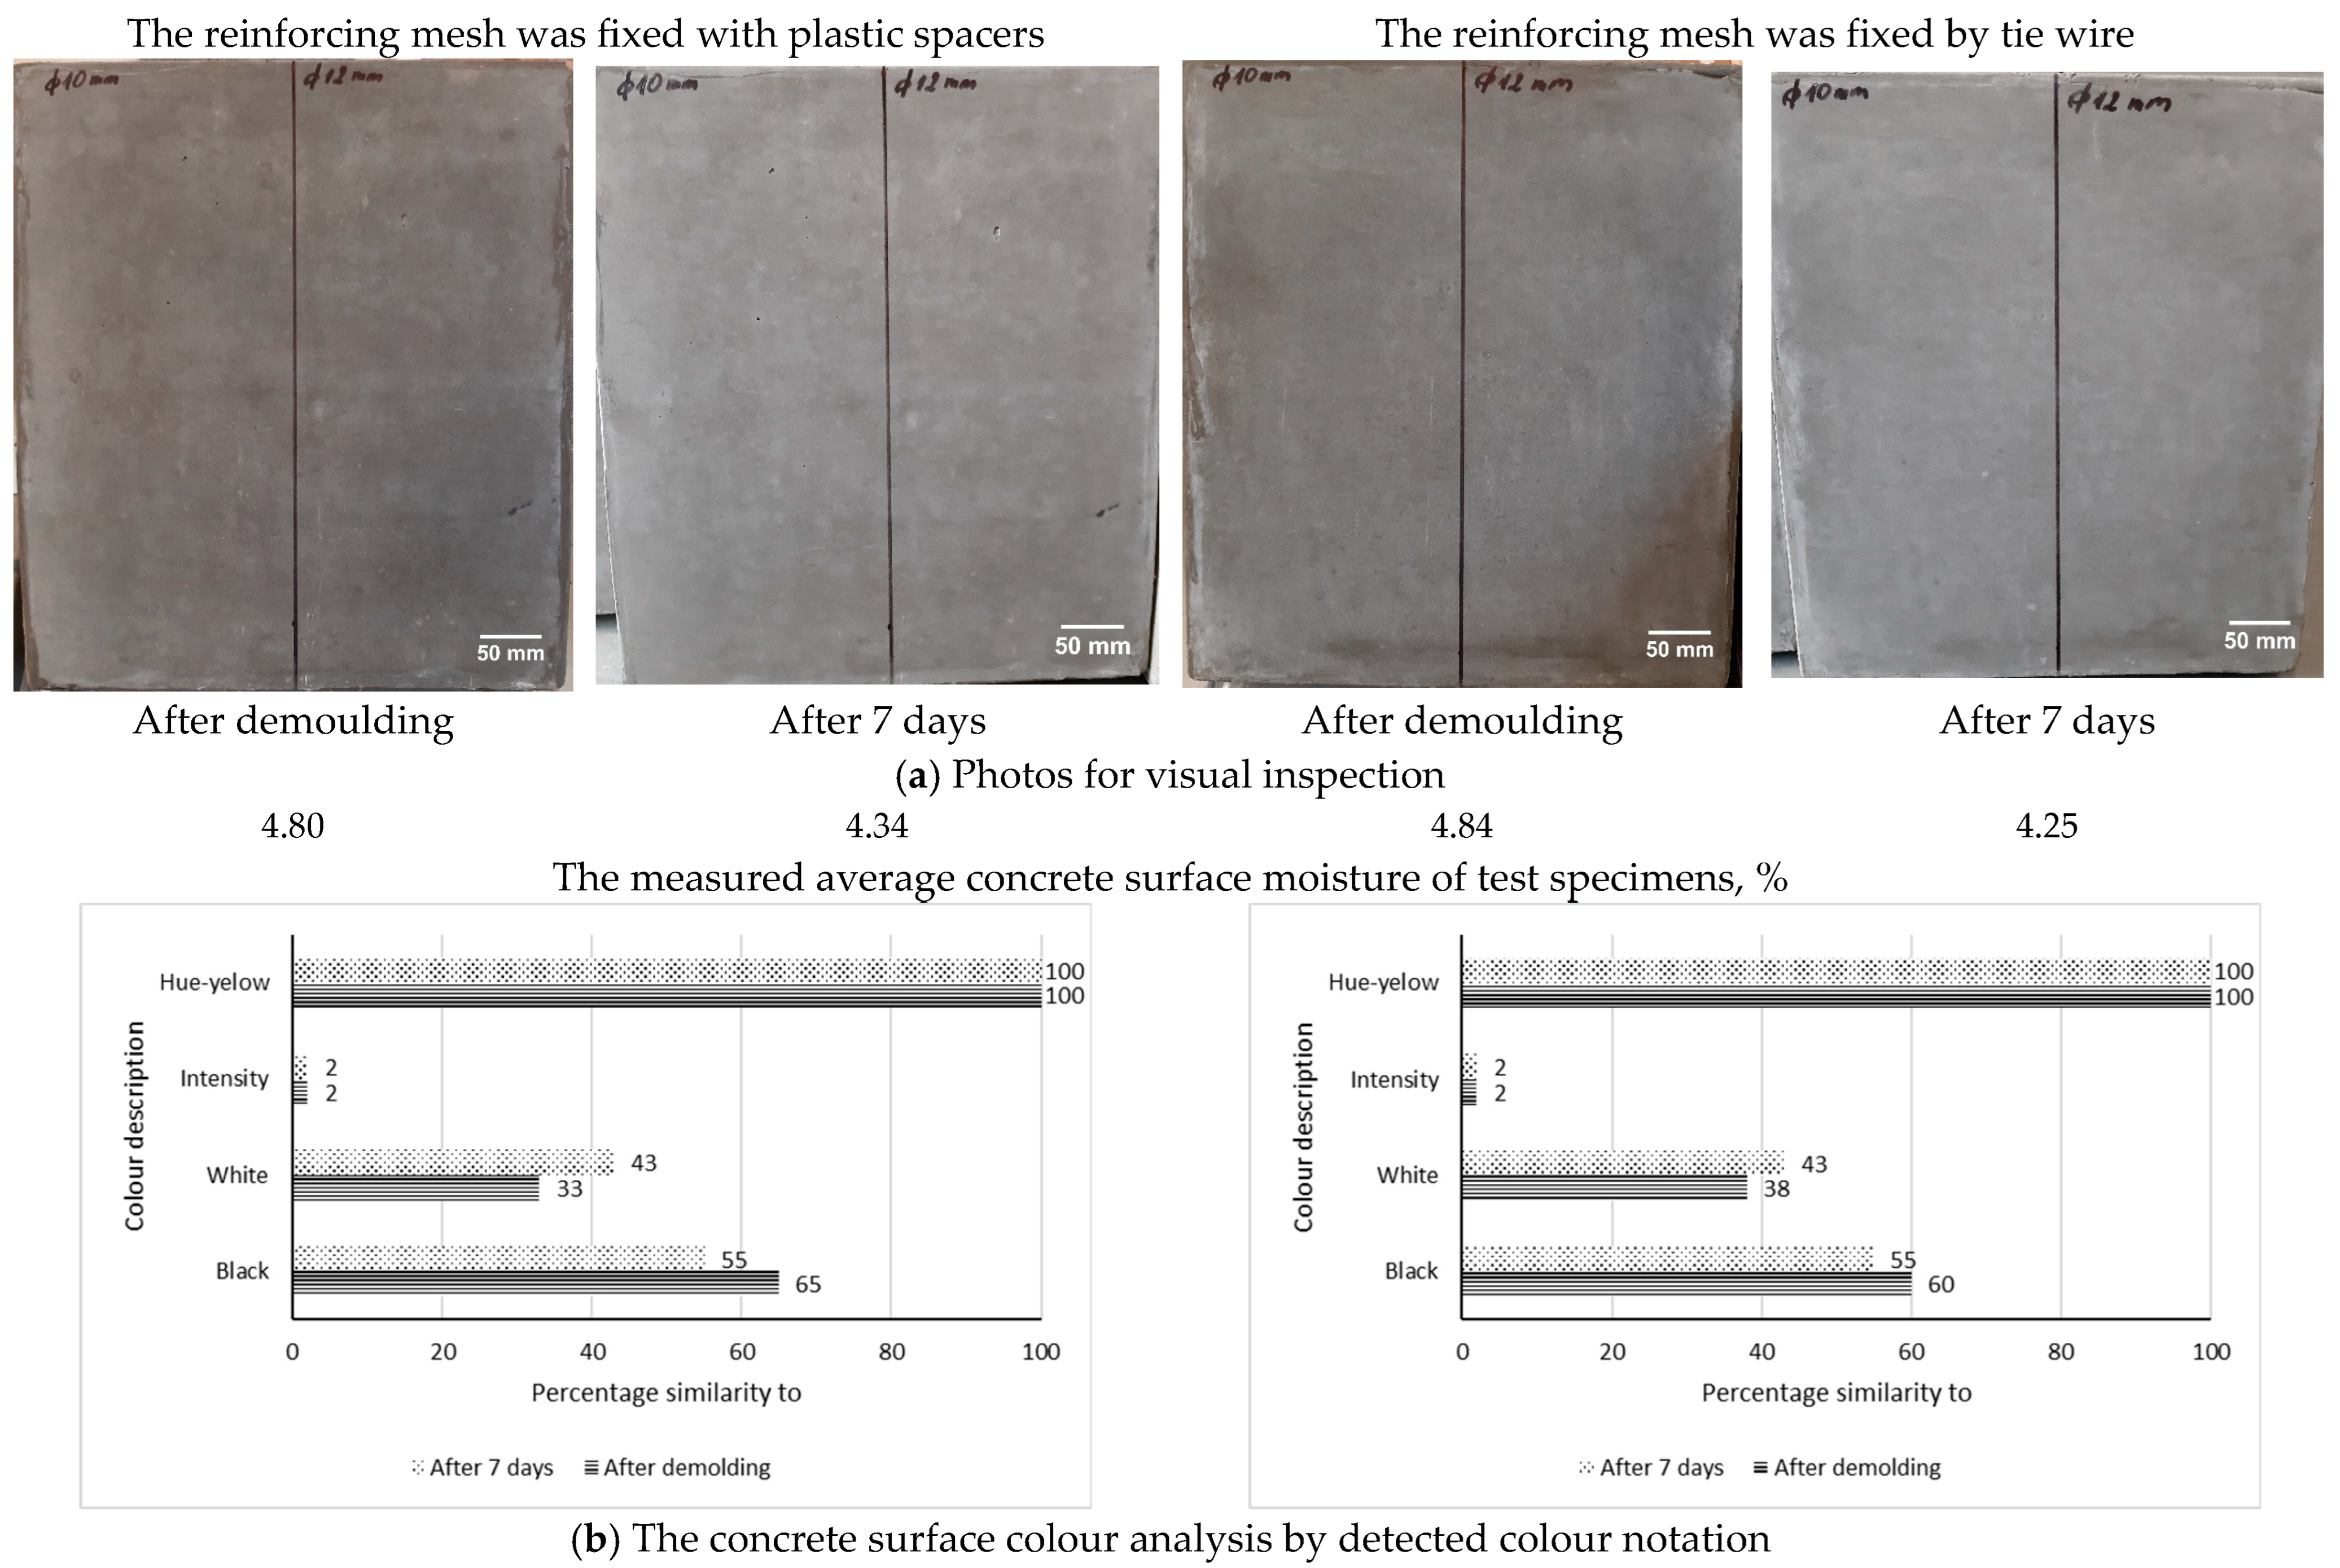
  • Reinforcement shadows, which are typically characterised by darker lines, can be defined by the percentage of black colour present in the shadowed area compared to the percentage of black colour in the surrounding area. This percentage can be quickly assessed on a factory scale using digital colour readers that provide timely information. If there is a difference of 10% in the black colour between the shadowed and surrounding areas that are not visible to the naked eye, a digital colour reader can still detect it. The quality of exposed concrete surfaces should be assessed at an agreed-upon time and after the agreed-upon curing time.
  • When the thickness of the concrete cover was reduced from 35 mm to 10 mm, the exposed surface revealed faint shadows of the reinforcement, appearing as horizontal dark lines. The reinforcing mesh was secured with plastic spacers to prevent movement during the fresh mixture’s pouring and compaction. In contrast, no reinforcement shadows were observed when the mesh was secured with tie wire, allowing it to move during the concrete pouring and compaction. According to the authors’ [17] findings, a gap of less than 10 mm between the reinforcing bars and the steel form-facing plate, along with the sieving effect of the fresh concrete, can retard the cement paste hydration process. Around the steel rebars, the ferrite phases of the cement (iron compounds) could not hydrate properly, resulting in unhydrated ferrite phases that contributed to the dark colour of the unhydrated cement.
  • The release agent sprayed on the steel form-facing surface straight through the reinforcing mesh creates a shadow effect of the reinforcement on the exposed concrete surface. The presence or absence of release agents on formwork-facing material affects its wettability and impacts the curing of cement paste, resulting in colour variations of the exposed concrete surface. The absence of a release agent under steel rebars decreases the wettability at the interface between the formwork and fresh concrete, resulting in dark lines during the curing process. In contrast, the presence of the release agent increases the wettability at the interface between the formwork and concrete, resulting in a lighter colour surrounding area.
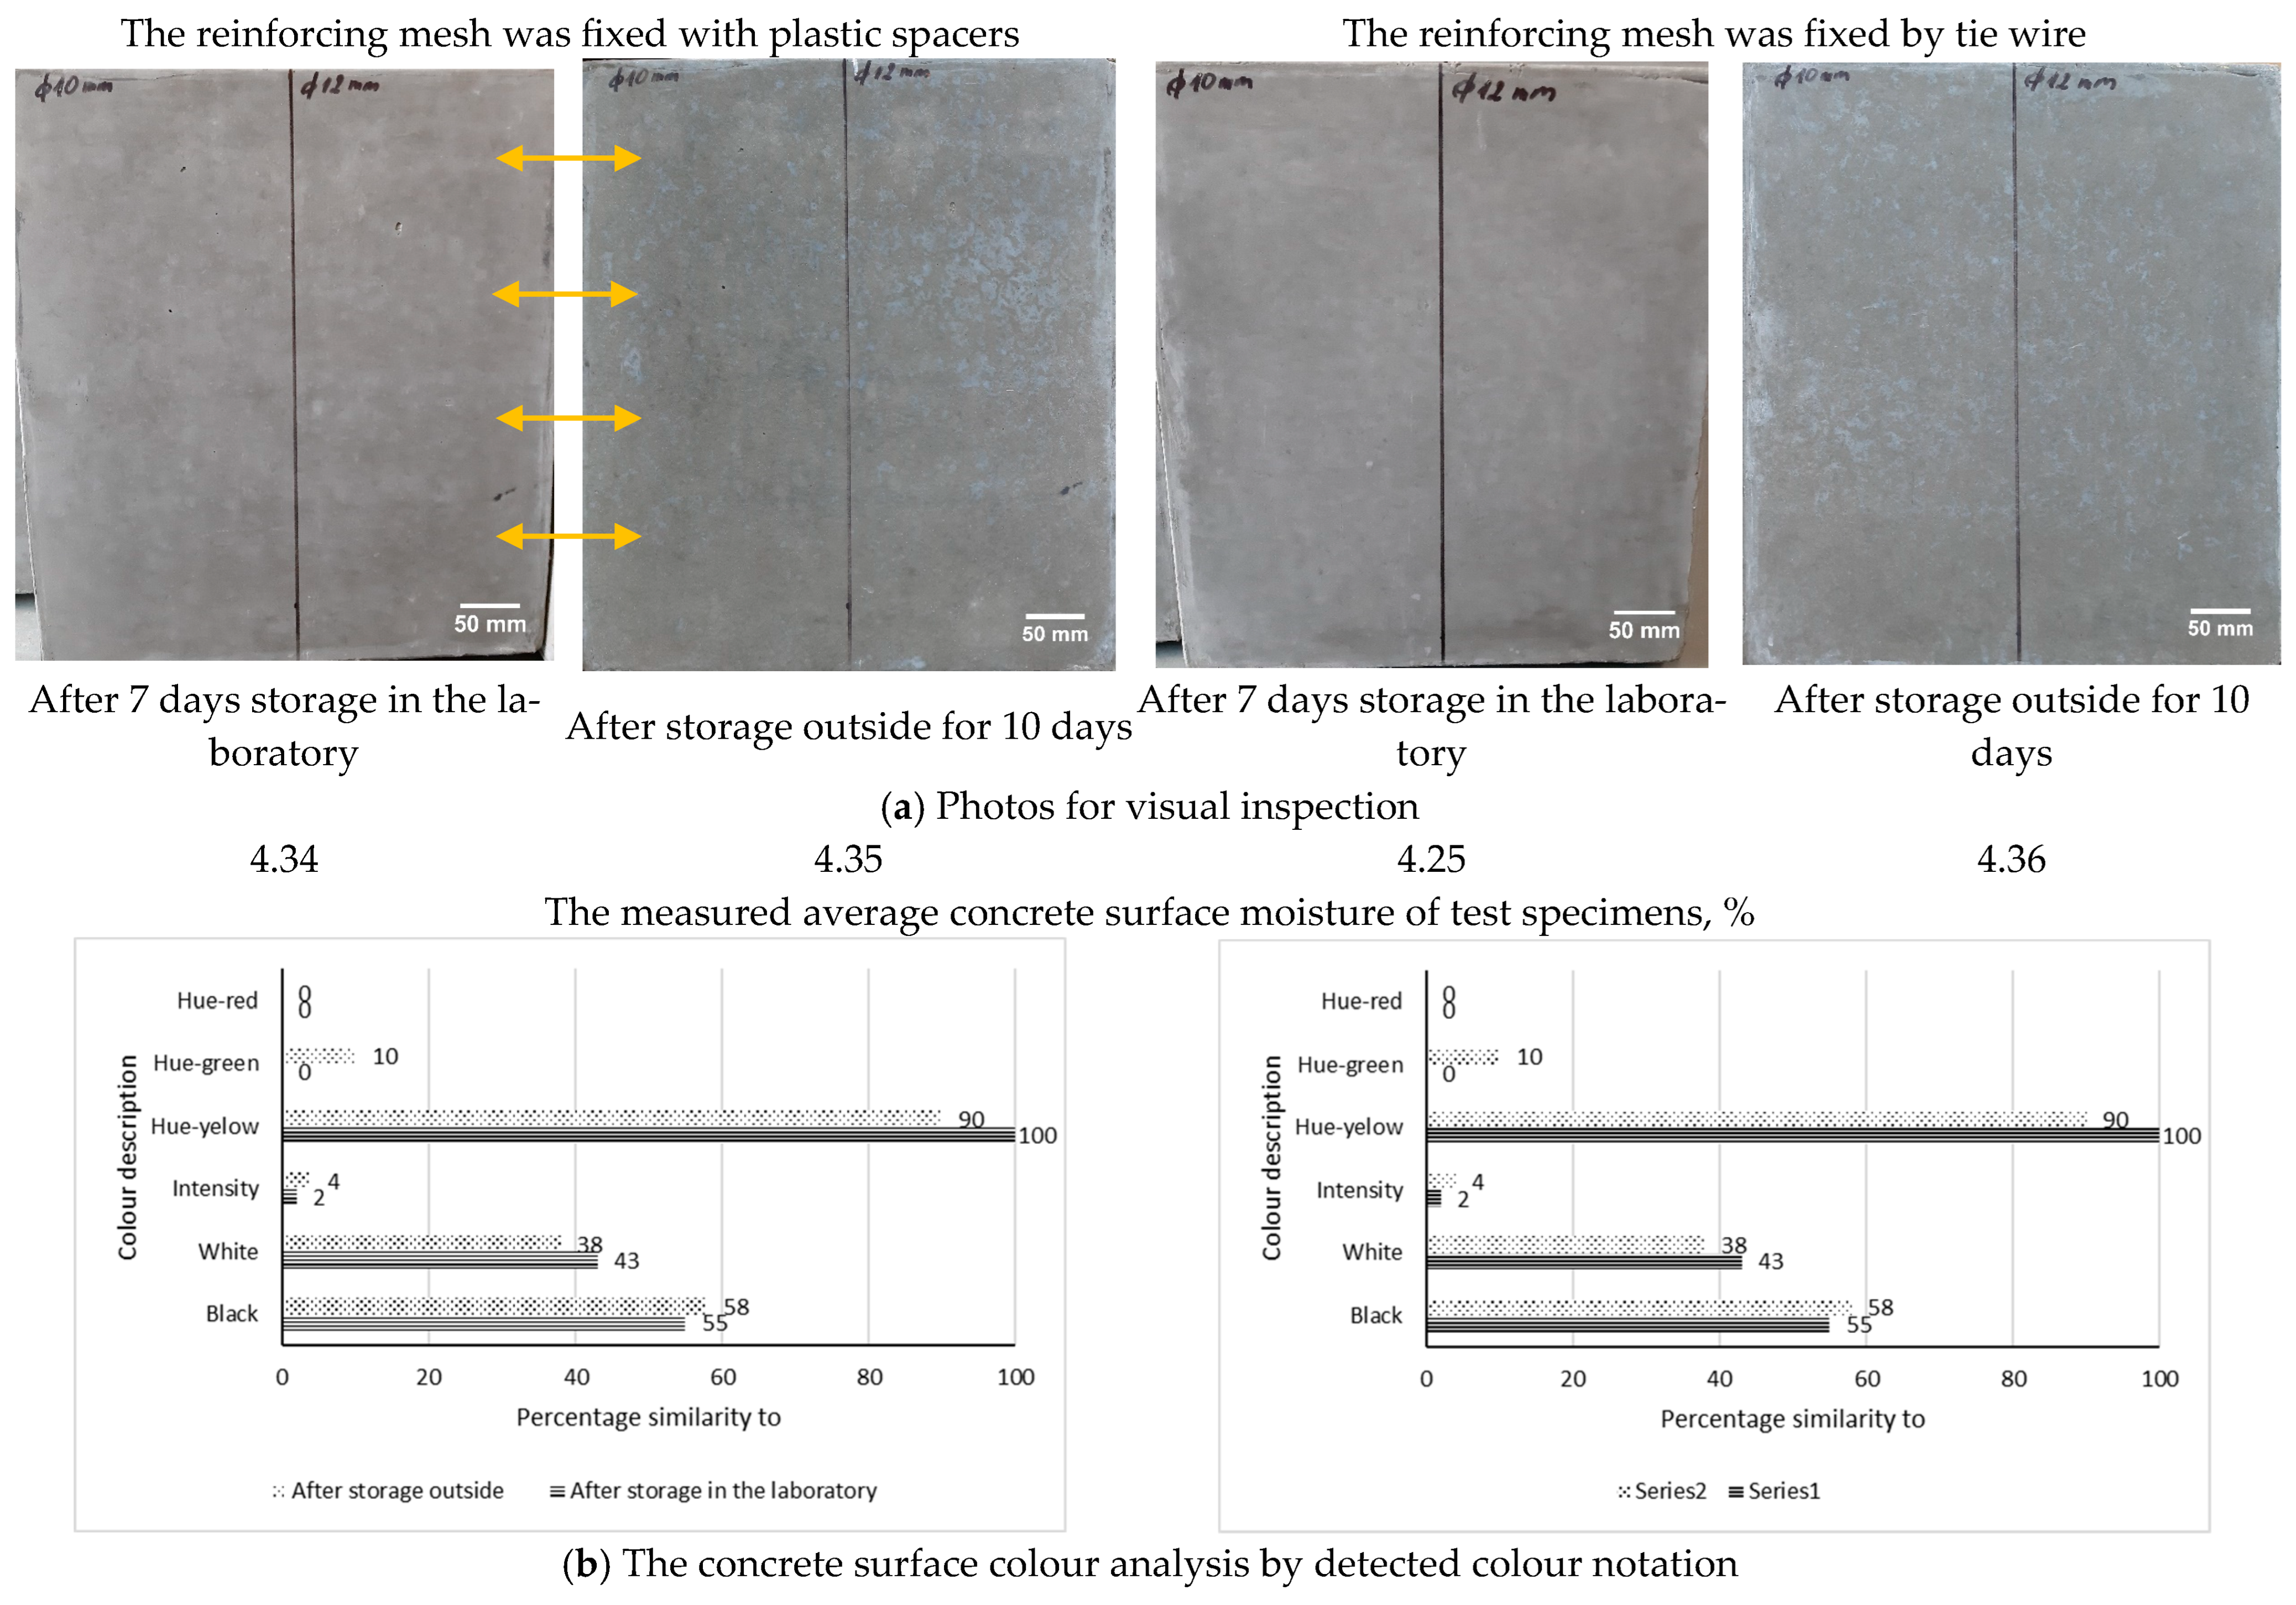
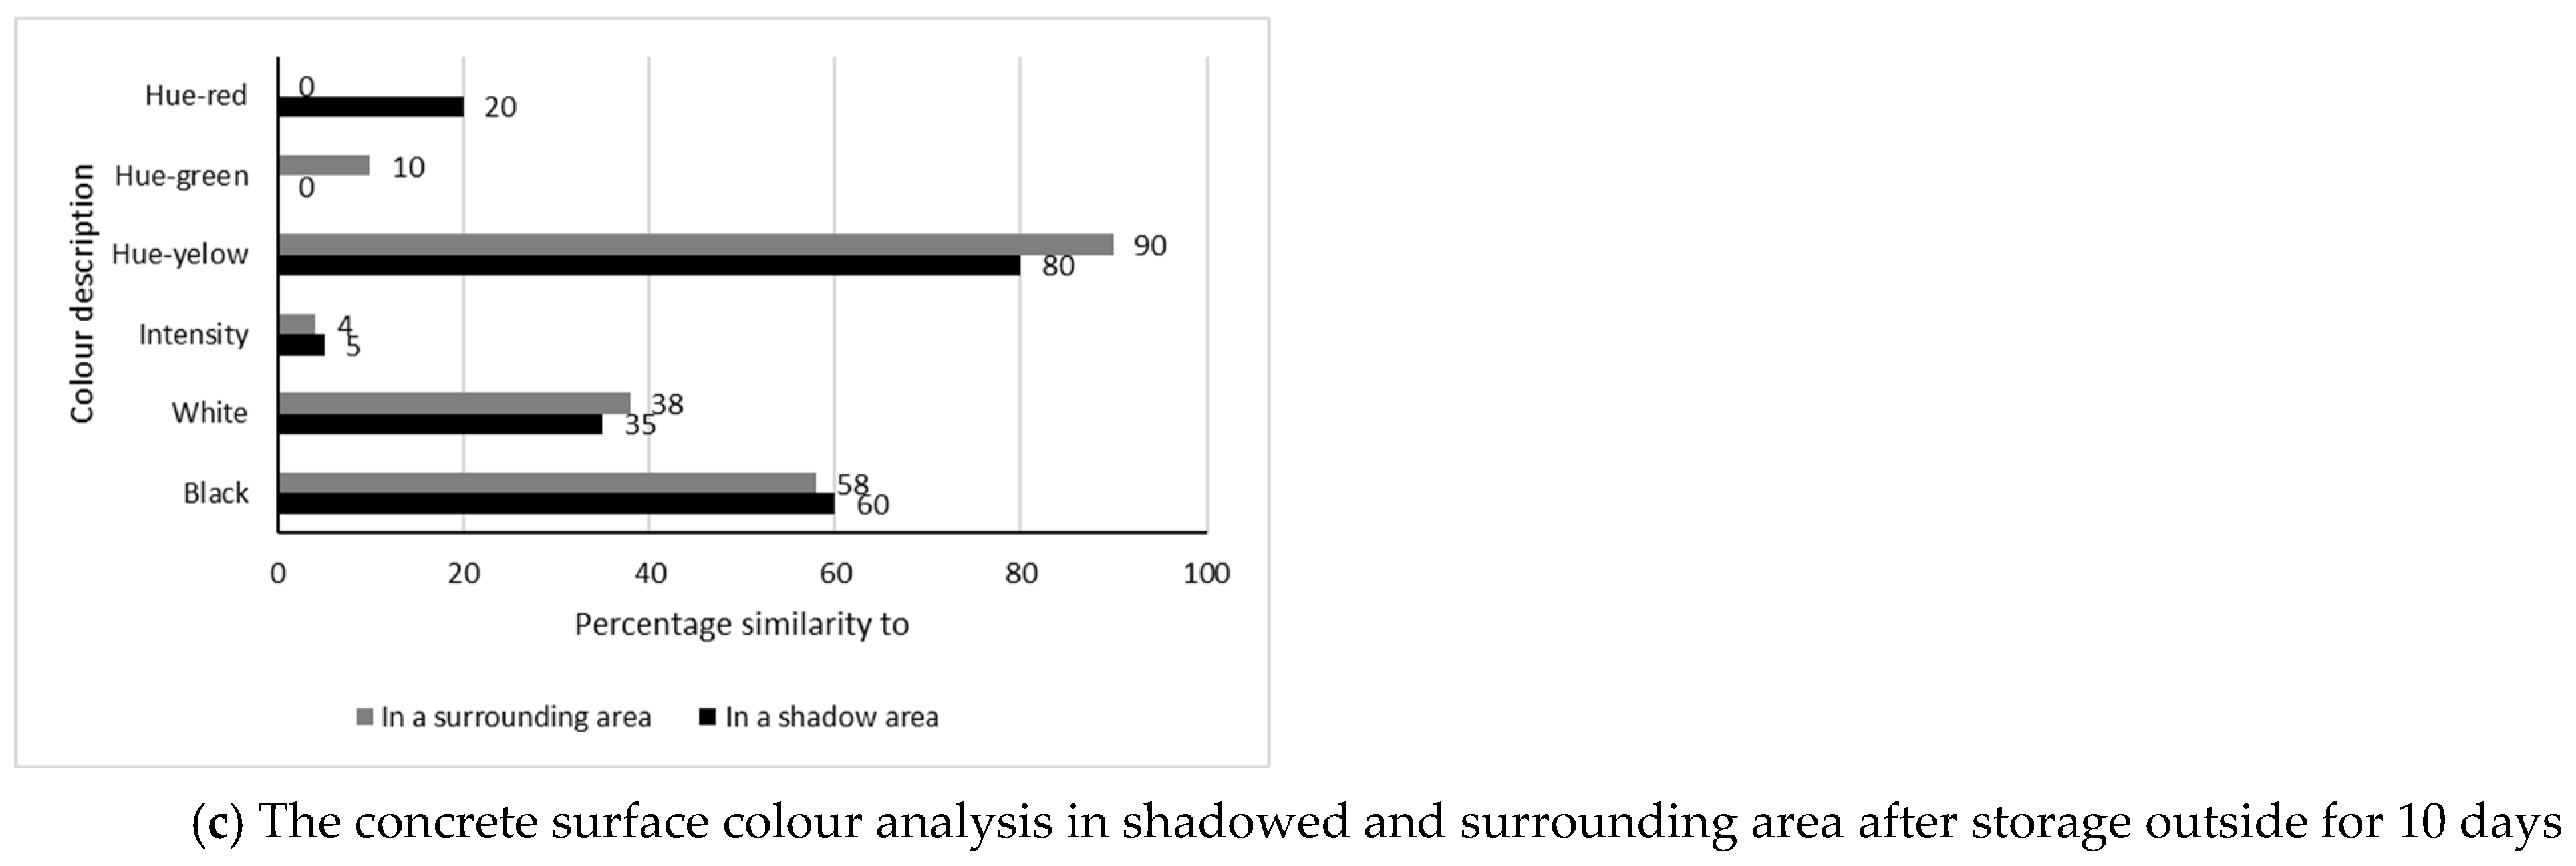
  • After storage outside at a daytime temperature of 7.7 °C and relative humidity of approximately 87%, the grey colour of exposed concrete surfaces became more intense in the shadowed and surrounding areas. The concrete surface moisture increased after storage outdoors compared to storage in laboratory conditions due to hardened cement paste capillary absorption. According to the authors’ [51] findings, increased moisture content in hardened cement paste increases the greyscale intensity based on a black to white gradient.
The results of this experimental investigation allow for various key observations regarding the visibility of reinforcement shadows on the formed concrete surface. Additional testing with a larger number of test specimens is required to confirm the study’s findings. Further testing should include investigating hydration products of cement paste in shadowed and surrounding areas using EDS, EDX analysis, optical microscopy, and scanning electron microscopy. Evaluating concrete surface quality uses standardised methods, such as the surface void ratio (SVR). The SVR (%) is calculated as the total voids area ratio to the total area of the analysed concrete. The same method could be used to calculate the total shadowed area (SA) ratio to the total area of the surroundings in percentage. This would help classify concrete surfaces into categories according to the computed reinforcement shadow index SA. In this case, corresponding image processing techniques are needed to quantify the total area of shadowed and surrounding regions on the analysed concrete surface. Image processing techniques could also be used to perform statistical analyses of the reinforcement shadow’s intensity or contrast under various experimental conditions, allowing for a quantitative evaluation of each factor’s impact. Since the shadowed and surrounding zones do not have clearly defined boundaries on the analysed concrete surface, accurately identifying and calculating their areas is complex. This could be a new research direction: assessing shadow reinforcements quantitatively and proposing a standardised method for calculating and categorising them.
In the future, additional testing is required to check the rigidity of the mould; the vibration amplitude, frequency, and timing; the degree of reinforcement in the structure; the fresh concrete placing speed; and the impact of the temperature and relative humidity of production and storage in outdoor conditions on the reinforcement shadow phenomena.

Author Contributions

Conceptualization, I.Š. and M.D.; methodology, M.D., S.J. and D.R.; software, D.R.; validation, M.D., S.J. and D.R.; formal analysis, R.P.B.; investigation, I.Š., M.D. and S.J.; resources, D.R.; data curation, M.D. and R.P.B.; writing—original draft preparation, I.Š. and M.D.; writing—review and editing, M.D. and R.P.B.; visualization, I.Š., S.J. and D.R.; supervision, M.D. All authors have read and agreed to the published version of the manuscript.

Funding

This research received no external funding.

Institutional Review Board Statement

Not applicable.

Informed Consent Statement

Not applicable.

Data Availability Statement

The data presented in this study are available on request from the corresponding author.

Acknowledgments

The authors gratefully acknowledge UAB INHUS for the materials used to conduct research and for providing technical support during the experiment.

Conflicts of Interest

The authors declare no conflicts of interest.

References

  1. Reinforcement Shadow. Available online: https://www.concrete.org.uk/fingertips-nuggets.asp?cmd=display&id=1022 (accessed on 22 September 2022).
  2. How to Avoid Ghostly Mistakes in Your Concrete Countertops. Available online: https://concretecountertopinstitute.com/free-training/how-to-avoid-ghostly-mistakes-in-your-concrete-countertops/?srsltid=AfmBOoofmAGtip5IKwMUXWUypMjeBCgL5pi1csbv0llTQ_5VikOiW1C2 (accessed on 22 September 2022).
  3. Rebar Near Surface Causes Marks in Slab. Available online: https://www.concreteconstruction.net/how-to/rebar-near-surface-causes-marks-in-slab_o (accessed on 22 September 2022).
  4. Leitfaden für Sichtbeton. Tipps aus der Praxis für Planung und Herstellung. Available online: https://www.holcim.de/sites/germany/files/documents/hol_leitfaden_sichtbeton-fertigteilwerk_03_web.pdf (accessed on 22 September 2022).
  5. Best Practice for Architectural Concrete. Available online: https://www.peri.com/en/architects/download-form-best-practice-for-architectural-concrete.pdf (accessed on 22 September 2022).
  6. Don’t Let Ghosting Haunt Your Concrete Work. Available online: https://www.concretedecor.net/departments/concrete-coatings/dont-let-ghosting-haunt-your-work/ (accessed on 23 September 2022).
  7. Guide to Off-Form Concrete Finishes. Available online: https://www.ccaa.com.au/CCAA/CCAA/Docs/Technical/Guides/Guide_to_Off-Form_Concrete_Finishes.aspx (accessed on 23 September 2022).
  8. Formwork and Finishes for Cast in Situ Concrete. Available online: https://www.concretecentre.com/TCC/media/TCCMediaLibrary/Presentations/Formwork-and-finishes-final.pdf (accessed on 23 September 2022).
  9. Strehlein, D.; Schießl, P. Dark Discoloration of Fair-face Concrete Surfaces—Transport and Crystallization in Hardening Concrete. J. Adv. Concr. Technol. 2008, 6, 409–418. [Google Scholar]
  10. Architectural Precast Concrete Finishes Guide. Available online: https://www.archprecast.org/assets/GuidesSpecs/Color%20and%20Finish%20Guide.pdf (accessed on 23 September 2022).
  11. What Is Concrete Ghosting? Available online: https://www.vertexconcrete.com/blogs/news/what-is-concrete-ghosting?srsltid=AfmBOor3SajtyigrSLT6etCgEaUzS87BfV0g5WaOcqJ3EHpwnMUOCvPZ (accessed on 23 September 2022).
  12. Coloring of Fair-Faced Concrete—Influence of Raw Materials, Concrete Technology and Compaction. Available online: https://www.bft-international.com/en/artikel/coloring-of-fair-faced-concrete-influence-of-raw-materials-concrete-technology-and-compaction-3961642.html (accessed on 14 March 2025).
  13. Taylor, H.F. Cement Chemistry; Thomas Telford Ltd.: London, UK, 1997. [Google Scholar]
  14. Püttbach, E. Pigments for the colouring of concrete. Betonw. Fert. 1987, 53, 1–9. [Google Scholar]
  15. Zhang, K.; Wang, C.; Huang, X. Insight into discrepancies in hydration reactivity of ferrite phase in Portland cement clinker and synthetics. Constr. Build. Mater. 2024, 412, 134674. [Google Scholar]
  16. Lamb Woods, A.; Lee, J.-Y.; Struble, L.J. Effect of Material Parameters on Color of Cementitious Pastes. J. ASTM Int. 2007, 4, JAI100783. [Google Scholar]
  17. Greening, N.R.; Landgren, R. Surface discoloration of concrete flatwork. In Research Department Bulletin 203; Portland Cement Association Research and Development Laboratories: Washington, DC, USA, 1966; pp. 34–50. Available online: https://www.somero.cn/wp-content/uploads/2017/11/surface-discoloration-of-concrete-flatwork.compressed.pdf (accessed on 14 March 2025).
  18. Specifying Sustainable Concrete. Available online: https://www.concretecentre.com/Resources/Publications/Specifying-Sustainable-Concrete.aspx (accessed on 27 February 2025).
  19. Huang, H.; Long, R.; Tong, S.H.; Cao, Y.Z.; Yuan, L.L.; Zhou, H. Cement pastes in tertiary colours: A digital approach for colouration of cement-based materials. Constr. Build. Mater. 2023, 382, 1313. [Google Scholar]
  20. Noor, A.I.; Mokhtar, M.H.; Rafiqul, Z.k.; Pramod, K.M. Understanding Color Models: A Review. ARPN J. Sci. Technol. 2012, 2, 265–275. [Google Scholar]
  21. Pusheng, L.; Shengyue, W. Color and reflective properties of magnesium phosphate cement grouting material for cooling pavement. Sol. Energy Mater. Sol. Cells 2024, 275, 113008. [Google Scholar]
  22. Lopez, A.; Pittori, A.; Di Sarli, A.R. Architectural self-compacting concretes and their color stability for 10 years. Constr. Build. Mater. 2024, 451, 138650. [Google Scholar]
  23. Guru, P.R.V.; Tadepalli, T.; Pancharathi, R.K. Surface imaging based non-destructive assessment of concrete deterioration using hue-saturation-intensity colour space. Measurement 2022, 197, 111311. [Google Scholar]
  24. Tolerances on Blemishes of Concrete; CIB Report No. 24; CIB (International Council for Building Documentation) Working Commission W29 “Concrete Surface Finishings”; CIB: Geneva, Switzerland, 1966; Available online: https://www.irbnet.de/daten/iconda/06059000983.pdf (accessed on 23 September 2022).
  25. Guide to Formed Concrete Surfaces; ACI 347.3R-13; ACI (American Concrete Institute) Committee 347; ACI: Farmington Hills, MI, USA, 2014.
  26. CEN/TR 15739:2008; Precast Concrete Products—Concrete Finishes—Identification. CEN (European Committee for Standardization): Brussels, Belgium, 2008.
  27. ΓOCT 13015-2012; Concrete and Reinforced Concrete Products for Construction. General Technical Requirements. Rules for Acceptance, Marking, Transportation and Storage. ICS (Interstate Council for Standardization, Metrology and Certification): Moscow, Russia, 2012. (In Russian)
  28. LST 2015:2020; Precast Concrete Products—Surface Appearance Characteristics and the Methods for Inspecting. LSB (Lithuanian Standards Board) Technical Committee 19 Concrete and Precast Concrete: Vilnius, Lithuanian, 2020. (In Lithuania)
  29. ÖNORM B 2211; Exposed Concrete Austria. AACCT (Austrian Association for Concrete and Construction Technology): Vienna, Austria, 2011. (In Germany)
  30. ACI 201.1R-08; Guide for Conducting a Visual Inspection of Concrete in Service. ACI (American Concrete Institute) Committee: Farmington Hills, MI, USA, 2008.
  31. ACI 309.2R-98; Identification and Control of Visible Effects of Consolidation on Formed Concrete Surfaces. ACI (American Concrete Institute) Committee: Farmington Hills, MI, USA, 1998.
  32. EN 197-1:2011; Cement—Part 1: Composition, Specifications and Conformity Criteria for Common Cements. CEN (European Committee for Standardization): Brussels, Belgium, 2011.
  33. EN 12620:2003+A1:2008; Aggregates for Concrete. CEN (European Committee for Standardization): Brussels, Belgium, 2008.
  34. EN 206:2013+A2:2021; Concrete—Specification, Performance, Production and Conformity. CEN (European Committee for Standardization): Brussels, Belgium, 2021.
  35. EN 12350-1:2019; Testing Fresh Concrete—Part 1: Sampling and Common Apparatus. CEN (European Committee for Standardization): Brussels, Belgium, 2019.
  36. EN 12350-8:2019; Testing Fresh Concrete—Part 8: Self-Compacting Concrete—Slump-Flow Test. CEN (European Committee for Standardization): Brussels, Belgium, 2019.
  37. EN 12350-6:2019; Testing Fresh Concrete—Part 6: Density. CEN (European Committee for Standardization): Brussels, Belgium, 2019.
  38. EN 12350-7:2019; Testing Fresh Concrete—Part 7: Air Content—Pressure Methods. CEN (European Committee for Standardization): Brussels, Belgium, 2019.
  39. NCS DIGITAL ATLAS 1950. Available online: https://issuu.com/carlosmancera1/docs/carta_ncs_atlas_als_pdf (accessed on 26 September 2024).
  40. Dapper, S.T.H.; Bersch, J.D.; Masuero, A.B. Impact of Formwork Materials on Concrete Surface Quality. Buildings 2024, 14, 3450. [Google Scholar] [CrossRef]
  41. Marinho, M.B.; Glasser, F.P. Polymorphism and phase changes in the ferrite phase of cements induced by titanium substitution. Cem. Concr. Res. 1984, 14, 349–359. [Google Scholar] [CrossRef]
  42. Özbay, E.; Erdemir, M.; Durmuş, H.İ. Utilization and efficiency of ground granulated blast furnace slag on concrete properties–a review. Constr. Build. Mater. 2016, 105, 423–434. [Google Scholar] [CrossRef]
  43. Castellano, C.; Bonavetti, V.; Donza, H.; Irassar, E. The effect of w/b and temperature on the hydration and strength of blastfurnace slag cements. Constr. Build. Mater. 2016, 111, 679–688. [Google Scholar] [CrossRef]
  44. Escalante-Garcia, J.I.; Sharp, J.H. Effect of temperature on the hydration of the main clinker phases in Portland cements: Part I, neat cements. Cem. Concr. Res. 1998, 28, 1245–1257. [Google Scholar] [CrossRef]
  45. Ushikubo, F.Y.; Cunha, R.L. Stability mechanisms of liquid water-in-oil emulsions. Food Hydrocoll. 2014, 3, 145–153. [Google Scholar] [CrossRef]
  46. Libessart, L.; Djelal, C.; De Caro, P.; Laiymani, I. Comparative study of the tribological behaviour of emulsions and demoulding oils at the concrete/formwork interface. Constr. Build. Mater. 2020, 239, 117826. [Google Scholar] [CrossRef]
  47. Czarnecki, S.; Sadowski, Ł. Morphological properties of the cement skin: Understanding the effect of contact with formwork. Case Stud. Constr. Mater. 2022, 16, e01007. [Google Scholar] [CrossRef]
  48. Djelal, C.; De Caro, P.; Libessart, L.; Dubois, I.; Pébère, N. Comprehension of demoulding mechanisms at the formwork/oil/concrete interface. Mater. Struct. 2008, 41, 571–581. [Google Scholar] [CrossRef]
  49. Zheng, J.J.; Li, C.Q.; Jones, M.R. Aggregate distribution in concrete with wall effect. Mag. Concr. Res. 2015, 55, 257–265. [Google Scholar] [CrossRef]
  50. Jiang, Q.; Yu, C.; Zhou, M. Effect of typical formworks and release agents on aesthetical surface quality of concrete. Mag. Concr. Res. 2023, 75, 1285–1296. [Google Scholar] [CrossRef]
  51. Vigor, J.E.; Prentice, D.P.; Xiao, X.; Bernal, S.A.; Provis, J.L. The pore structure and water absorption in Portland/slag blended hardened cement paste determined by synchrotron X-ray microtomography and neutron radiography. RSC Adv. 2024, 14, 4389–4405. [Google Scholar] [PubMed]
Figure 1. Examples of precast or in situ formed concrete structures showing reinforcement shadows visibility (photos taken by author).
Buildings 15 01140 g001
Figure 2. Different scenarios were analysed to investigate the potential causes of the reinforcement shadow effect.
Buildings 15 01140 g002
Figure 3. The stages of mixture preparation.
Buildings 15 01140 g003
Figure 4. The vibrational table to cast test specimens in the horizontal position, in contact with a steel form-facing surface.
Buildings 15 01140 g004
Figure 5. (a) The view of the steel form-facing surface covered by the release agent based on water-soluble emulsion. (b) The view of reinforcing mesh fixed using reinforcing mesh spacers (left) and free-hanging reinforcing mesh fixed using tie wire. (c) The view of 16 L of fresh concrete poured into the moulds before compaction procedure. (d) Compaction of fresh concrete in moulds for about 15–20 s using the vibrational table.
Buildings 15 01140 g005aBuildings 15 01140 g005b
Figure 6. Compaction of fresh concrete in moulds.
Buildings 15 01140 g006
Figure 7. The concrete cover thickness is 35 mm (C-RS-1).
Buildings 15 01140 g007
Figure 8. The concrete cover thickness is 25 mm (C-RS-2).
Buildings 15 01140 g008
Figure 9. The concrete cover thickness is 15 mm (C-RS-3).
Buildings 15 01140 g009aBuildings 15 01140 g009b
Figure 10. The concrete surface colour analysis. The concrete cover thickness is 10 mm (C-RS-4).
Buildings 15 01140 g010
Figure 11. The concrete surface colour analysis in shadowed and surrounding area. The concrete cover thickness is 10 mm (C-RS-4).
Buildings 15 01140 g011
Figure 12. The mixture is compacted using only the internal poker vibrator, which is in contact with the reinforcing mesh for 15–20 s. The concrete cover thickness is 35 mm (C-RS-5).
Buildings 15 01140 g012
Figure 13. The heated reinforcing mesh is used. The concrete cover thickness is 35 mm (C-RS-6).
Buildings 15 01140 g013
Figure 14. The chilled reinforcing mesh and heated fresh concrete are used. The concrete cover thickness is 35 mm (C-RS-7).
Buildings 15 01140 g014
Figure 15. The concrete surface colour analysis after demoulding and 7 days storage in the laboratory conditions. The release agent is sprayed on the steel form-facing surface straight through the reinforcing mesh. The concrete cover thickness is 35 mm (C-RS-8).
Buildings 15 01140 g015
Figure 16. The concrete surface colour analysis in shadowed and surrounding area. The release agent is sprayed on the steel form-facing surface straight through the reinforcing mesh. The concrete cover thickness is 35 mm (C-RS-8).
Buildings 15 01140 g016
Figure 17. The concrete surface colour analysis after storage outside for 10 days. The concrete cover thickness was decreased from 35 to 10 mm.
Buildings 15 01140 g017aBuildings 15 01140 g017b
Figure 18. The concrete surface colour analysis after storage outside for 10 days. The release agent is sprayed on the steel form-facing surface straight through the reinforcing mesh. The concrete cover thickness is 35 mm (C-RS-8).
Buildings 15 01140 g018
Figure 19. The view of analysed precast reinforced concrete wall element installed in a multistorey building. The concrete cover thickness is 40 mm.
Buildings 15 01140 g019
Table 1. The potential causes of RS occurrence or colour variation that strengthen the effect of RS based on the literature references.
Ref.Reason for RS OccurrenceFindings and RecommendationsResearch Methods
[1,2]When the reinforcing mesh is inserted into fresh concrete after filling the moulds.This action creates a pumping effect directly beneath the reinforcing bar and disturbs and modifies the cement paste. Any changes in the composition of the cement paste influence its curing process, which impacts the final product’s visual characteristics. Changes in the concrete matrix are most often caused by aggregate segregation, changes in the water–cement (W/C) ratio, and other changes in the cement paste. Not specified.
[2]When the reinforcing mesh is located too close to the visible surface.It is argued that if the reinforcing mesh is located too close to the visible surface, it cannot cause the RS effect because it does not affect cement paste changes. Not specified.
[3]When the reinforcing rebar is positioned too near the surface.Yet there is also an alternative opinion that when the reinforcing rebar is positioned too near the surface, and the newly poured concrete is not adequately vibrated, the concrete fails to integrate fully over the reinforcing bars, which results in a concrete colour discolouration or a visible line on the concrete surface.Not specified.
[1,2]When the reinforcing mesh is suspended in the moulds, and fresh concrete is poured through it.If the reinforcing mesh sieves the fresh concrete stream without remixing below, the aggregate is pushed aside and segregated while the cement paste flows separately. This changes the cement paste/mortar matrix directly beneath the reinforcing bar, which cures slightly differently [1,2]. To reduce shadowing effects, it is crucial to ensure proper rebar alignment and carefully consider the concrete cover thickness and maximum size of coarse aggregate. Not specified.
[1,2,4,5]When the reinforcing mesh is already buried in the freshly poured mixture and moved or vibrated by an internal vibrator.If the reinforcing mesh is already buried in the freshly poured mixture and moved or vibrated, this movement leads to localised segregation of the mix. The internal vibrator must not contact the reinforcing mesh or formwork during mixture compaction. Avoid the prolonged contact of the internal vibrator with the reinforcement. Avoid intensive vibration of the mixture.Visual inspection of RS.
[5]Increased calcium deposition on the concrete surface resulting in a darker appearance.After removing the formwork, it can be seen that the lower half of the wall is darker than the upper half. Below, increased calcium deposition on the concrete surface results in a thicker joint and, thus, a darker appearance.Not specified.
[4]A temperature difference between the reinforcing mesh and the fresh concrete. A temperature difference between the reinforcing mesh and the fresh concrete of more than 12 °C at a cold ambient temperature of around 5 °C can also trigger this effect. However, this depends on the thickness of the concrete cover. Visual inspection of RS.
[2,5]When the plywood sheet/panel joint is not sealed.Marks on the surface resembling RS can also be attributed to leaking moulds. Differences under the curing conditions cause discolouration.Not specified.
Visual inspection of dark lines.
[2,6]An overabundance of form-release agents. Marks on the surface resembling RS can also be attributed to an overabundance of form-release agents that have collected or formed puddles in the mould and items placed on the concrete surface during the curing process. During the curing process, a differential in moisture under the items left compared to exposed concrete causes these marks. Not specified.
Visual inspection of marks.
[2]Various techniques that prevent water evaporating from concrete. Various techniques that prevent water from evaporating from concrete in certain regions, while leaving other areas exposed and able to dry, will result in uneven curing, leading to colour variation. The concrete region that remains moist for a longer time will cure more thoroughly, leading to a more vibrant colour in those areas.Not specified.
[1,7,8]Insufficient rigidity in moulds or formwork may affect concrete discolouration. Insufficient rigidity in moulds or formwork can result in various imperfections, including colour variation or a mottled appearance. These defects may occur due to mould flexing and shifting during concrete pouring and consolidation. Form lining material steel can create dark mottling, especially if the concrete is over-compacted.Not specified.
[9] Variations in production and storage conditions (relative humidity (RH) and daily temperature) may affect concrete discolouration, strengthening the impression of RS.Authors [9] revealed that low temperatures and high relative humidities (e.g., 2 °C and 95% RH) are the reason for the increased occurrence of mottled dark discolouration in winter. High temperatures and low relative humidity (e.g., 20 °C and 85% RH) favour producing uniform, non-discoloured fairface concrete surfaces in summer. It was concluded that the darkening of the exposed concrete surface is attributed to calcium hydroxide accumulating in the pores near the surface. In hot weather, concrete can cure too quickly, causing it to become lighter in colour, while in cold weather, the concrete may not cure properly, causing it to become darker in colour. If the air is very dry, the water in the concrete can evaporate too quickly, causing it to become lighter in colour. On the other hand, if the air is too humid, the concrete may not dry properly, causing it to become darker in colour. Additionally, if the concrete is exposed to sunlight for an extended period, it can cause the surface to become discoloured or develop a mottled appearance.Optical microscopy, scanning electron microscopy (SEM), and energy-dispersive X-ray analysis (EDX).
[10]Production variations can create surface irregularities and influence the concrete’s colour. Factors such as slump, mixing duration, and weather conditions can potentially create surface irregularities and influence the concrete’s colour. The cement itself may exhibit colour inconsistencies. Even when using grey cement on smooth surfaces, some degree of colour variation is to be expected.Not specified.
[11]A phenomenon caused by variations in material thickness.This issue can lead to an uneven appearance, where certain surface areas may seem lighter or darker than others. Employing high-quality materials and appropriate mixing methods can help avoid variations in the material’s thickness, which might result in ghosting effects. To ensure consistency, the mixture should be correctly proportioned and thoroughly mixed.Not specified.
[12]The vibration intensity (amplitude, frequency, timing).The authors indicate that dark discolouration depends on the vibration intensity (amplitude, frequency, timing), the formwork’s stiffness, and the concrete’s setting behaviour in multi-layered structural elements.Not specified.
[13,14,15]The content of iron oxide and manganese oxide. The clinker’s main constituents are alite, belite, aluminate, and ferrite. The ferrite phase is known as C4AF and is conventionally ascribed a subdued hydration reactivity within the Portland cement clinker system. The content of iron oxide and manganese oxide influences the inherent grey colour of hardened Portland cement paste. Concrete’s grey colour varies from darker to lighter shades and occasionally presents a yellow tint.Visual inspection and assessment of colour variation are based on the grayscale.
[16]The water–cement ratio, mineral admixtures, and hydration ageCement powder colour had the most significant effect on cement paste colour. Additional factors that substantially impacted paste colour included the ratio of water to cement, the presence of mineral additives, and the duration of hydration for young pastes (under 14 days). In contrast, chemical additives and air entrainment had a minimal effect on the paste’s colour.Colorimetry, L*a*b* colour space values.
[17,18]Cement’s origin, the water–cement ratio, and the extent and rate of hydration of the ferrite phase in cement.Different types of cement, such as ground granulated blast-furnace slag, powdered limestone, fly ash, and others, may differ in colour when using cement replacements. More replacement leads to more significant colour change. A low water–cement ratio paste is always darker than a high water–cement ratio paste made with the same Portland cement. Construction practices show that producing localised areas of variable water–cement ratio within a concrete slab potentially causes discolouration. Unhydrated ferrite phases (iron compounds) in cement are blackish-brown and are primarily responsible for the dark colour of unhydrated cement. Hydration lightens their colour; fully hydrated ferrites, when prepared as slurries of the pure phases, range in colour from white to dark red-brown. Thus, the lightening of the ferrite phase during hydration is the major cause of cements and concretes becoming lighter in hue as they hydrate.Visual inspection, colorimetry.
[19,20,21,22,23]Evaluation method for colourColour models are systems for measuring colours that humans can perceive. They combine different values into a set of primary colours. The paste’s colour is evaluated using the L*a*b* colour space, which officially refers to the CIELAB colour space. Three values in three dimensions are used: L* for perceptual lightness and a* and b* for the four unique colours of human vision—red, green, blue, and yellow.CIELAB colour space, HIS colour space
Table 2. The description of RS, colour variation, and inspection method based on technical documents or standards analysis.
Ref.Technical Document/StandardDescription of RS or Colour VariationInspection Method
[24]Technical document CIB Report No. 24 (1966) Does not provide any information regarding RS. Not specified on RS. Assessment of colour variation is based on the grayscale, which is based on seven reference cards.
[25]Technical document ACI 347.3R-13 (2014) Does not provide any information regarding RS. There are distinguished classes CU1, CU2, and CU3. It is reported that light and dark colour variations are acceptable for UC1, gradual light and dark discolouration is acceptable for CU2, and discolouration caused by concrete source material of different types and origins, different types or treatments of facing materials, or inconsistent treatment of concrete surfaces is unacceptable for CU2.Not specified on RS. The inspection method of colour variation is based on visual assessment. The main evaluation method is the overall impression viewed from an appropriate viewing distance.
[26]Standard CEN/TR 15739:2008 It does not provide any information regarding RS. Differences in colour are reported in the same section of the works.Not specified on RS. The inspection method of colour variation is based on a reference to a colour chart identifying the main colour of the reference sample (CIB scale).
[27]Standard ΓOCT 13015-2012 Does not provide any information regarding RS. Unacceptable oil and rust stains are on the precast concrete elements’ visible surfaces, which may affect colour variation.The inspection method of colour variation is based on visual assessment. It does not provide information on how to measure different colours.
[28]Standard LST 2015:2020 It defines surface appearance characteristics and the methods for inspecting precast concrete products and provides information about the RS. It is reported that changes in the concrete matrix can cause reinforcement shadows on the product’s surface, which manifest in the appearance of lighter and darker tones.RSs are attributed to formed concrete surface characteristics that cannot be measured. The inspection method is based on visual assessment.
[29]Technical document ÖNORM B 2211 (2011)The shading effect of reinforcement is attributed to colour consistency. There are distinguished classes, F1 and F2, where linear discolourations (reinforcement shadows) are not permitted. It is reported that surface discolouration can be caused by rust or by cement, concrete additives, aggregates of different origins, delivery by different concrete suppliers, improper pre-treatment of the formwork, and improper concrete curing.The inspection method of colour variation is based on visual assessment. It does not provide information on how to measure different colours.
[30]Technical document
ACI 201.1R-08 (2008)
The discolouration is understandable as a deviation from the expected or desired colour. Not specified on RS. The inspection method of colour variation is based on visual assessment. It does not provide information on how to measure different colours.
[31]Technical document
ACI 309.2R-98 (1998)
It states that changes in surface colouration become noticeable within several hours of formwork removal. In addition, calcium chloride can cause darker colours that depend on the properties of fresh concrete. Vibrators inserted too close to the form can cause colour variation by marring the form surface, and external vibration used haphazardly may also cause colour variation.Not specified on RS. The inspection method of colour variation is based on visual assessment. It does not provide information on how to measure different colours.
Table 3. Physical and mechanical properties of Portland slag cement.
Specific surface area (Blaine method), m2/kg 397
Particle density, kg/m33045
Dry bulk density, kg/m3 1210
Residue on a standard 90 µm sieve, %0.5
Water demand for standard consistency (Vicat method), % 27.5
Soundness (expansion), mm1.0
Initial setting time, min125
Final setting time, min165
Compressive strength after 2 days/after 28 days, MPa24.8/56.6
Loss on ignition, %-
Insoluble materials, %-
SO3, %2.46
Cl, %0.016
Alkalis, calculated by Na2O equivalent, %0.80
Table 4. The amounts of materials (kg) per m3 of the concrete mixture.
Portland Slag Cement, kgWater, kgSand of 0/4 Fraction, kgCrushed GraniteGround Limestone, kgPlasticising Admixture, kgW/C
2/8 Fraction, kg5/11 Fraction, kg11/16 Fraction, kg
3301428273022674131205.40.43
Table 5. The properties of fresh concrete.
MarkingTemperature, °CSlump Flow, mmDensity, kg/m3Air Content, %Ambient Temperature, °CAmbient Relative Humidity, %
C-RS-123.062024802.622.124.6
C-RS-223.666024901.821.932.4
C-RS-321.963025001.620.834.5
C-RS-422.462025101.821.844.7
C-RS-521.863025001.720.034.0
C-RS-621.664025001.821.647.0
C-RS-731.464024901.622.635.9
C-RS-822.363024802.121.635.0
Disclaimer/Publisher’s Note: The statements, opinions and data contained in all publications are solely those of the individual author(s) and contributor(s) and not of MDPI and/or the editor(s). MDPI and/or the editor(s) disclaim responsibility for any injury to people or property resulting from any ideas, methods, instructions or products referred to in the content.

