Systematic Review

Lack of Thermal Comfort Is a Matter of Life and Death: A Systematic Review for Older People

1
School of Civil Engineering, University of Leeds, Leeds LS2 9LG, UK
2
Independent Researcher, Liverpool L19 2NA, UK
3
Faculty of Environmental Studies, Tokyo City University, Yokohama 224-8551, Japan
4
School of Art, Architecture and Design, London Metropolitan University, London E1 7NT, UK
*
Author to whom correspondence should be addressed.
Buildings 2025, 15(7), 1141; https://doi.org/10.3390/buildings15071141
Submission received: 16 December 2024 / Revised: 14 March 2025 / Accepted: 24 March 2025 / Published: 31 March 2025

Abstract

:
Thermal comfort is not a luxury; rather, a lack of it is a matter of life and death, particularly for vulnerable people, such as older people. This work systematically reviews and analyses the thermal comfort of older people and their health and mortality as it relates to exposure to extreme temperatures, and suggests acceptable thermal conditions and the related energy use of buildings. A total of 69 out of 198 papers were found on older people and these were analysed in detail. This was followed by an analysis of the UN and UK governments’ open access data. This work highlights the disparity regarding the definition of age for older people and encourages the use of the term ”older people”, rather than ”elderly”, which can be an offensive piece of terminology. The UK findings suggest a significant relationship between cold (below 5 °C) outdoor air temperatures and mortality in older people, particularly for those who are over 85 years old. In the UK, thermal conditions can lead to up to 175 deaths per degree temperature change up to two weeks after a cold spell or an overly hot period. The indoor comfort temperature of older people varies between 22.5 and 27 °C in natural ventilation mode. However, some studies found 18 °C to be comfortable in winter time, a finding which could lead to a significant energy saving in relation to space heating. Current gaps in and the recommended future direction of research include topics such as gender differences in terms of thermal comfort and during menopause; thermal comfort conditions, adaptive behaviours and naturally ventilated buildings; thermal conditions when sleeping and energy use as it relates to space heating or cooling for older people.

1. Introduction

Thermal comfort plays a critical role in maintaining health and well-being across all age groups, yet it is especially vital for vulnerable populations, such as older people. Humans are homeothermic, which means that they can maintain a consistent body core temperature when the surrounding thermal conditions change over a relatively wide range [1]. However, vulnerable groups often face difficulties in regulating their body temperature. For these populations, the combination of physiological limitations and reduced capacity for behavioural adaptation poses significant health risks when they are exposed to extreme temperatures. The body’s thermoregulatory system relies on both involuntary mechanisms, such as cutaneous circulation, sweating and brown fat [2], and conscious behaviours like adjusting clothing layers or altering the indoor environment. The thermoregulation of older adults deteriorates over time, leading to increased susceptibility to both heat- and cold-related illnesses. Also, vulnerable groups may not be able to sense or express their thermal discomfort or take action to maintain homeostasis. This inability to adapt, combined with a declining thermoregulatory system, means that older people are particularly vulnerable to extreme temperatures. This can rapidly lead to dangerous health outcomes, such as heat stroke and hypothermia, and can potentially leading to death.
The importance of the indoor thermal environment is heightened for older adults, as they spend the majority of their time indoors, particularly within their homes. The COVID-19 pandemic has reinforced this trend. Also, older people are likely to be at increased risk from potential future pandemics and the ongoing impacts of climate change. Rising global temperatures and increasingly frequent storms and heatwaves pose new challenges in terms of maintaining comfortable indoor environments. Furthermore, the recent economic and energy crises have exacerbated fuel poverty, particularly in the UK, where many homes are poorly insulated and not designed to cope with extreme heat or cold.
This review paper systematically examines the thermal comfort requirements of older people, focusing on the physiological differences that make them more sensitive to environmental extremes. It explores the health implications of thermal discomfort, including morbidity and mortality risks, and outlines acceptable thermal conditions. In doing so, it highlights gaps in the current body of research and calls for further investigations into their specific thermal needs. Through this review, the goal is to shed light on the critical role that the thermal environment plays in safeguarding the health of these vulnerable people and to provide a foundation for future research and policy development in this area. Ultimately, the paper underscores the necessity of developing tailored thermal comfort standards and strategies that account for age-specific vulnerabilities, especially in the face of evolving environmental and societal challenges.

2. Materials and Methods

A systematic review was conducted to investigate the vulnerability of older people to extreme temperatures. A total of 198 documents were found concerning the thermal comfort of older people in the initial Scopus and Google Scholar searches. Keywords, such as elderly, older people, thermal comfort, overheating, cold and other relevant words and combinations were used for the search. The relevance and quality of the research were assessed, which reduced the number to 69 documents, including mainly review, journal and conference papers. These papers are the basis of the key sections, while other research, relevant to the key argument in each section, is also included. Although a worldwide search was conducted, the majority of the published research is concentrated in Europe and Asia, as shown in Table 1. This underscores the lack of research on this critical topic in different climatic conditions and cultural contexts. The authors undertook further analysis of the data provided by 30 high-quality journal papers that discussed indoor temperature, as presented in Table 1. In case the outdoor thermal conditions were missing in the paper, the authors calculated the mean average monthly temperature based on the location, time and duration of the study using Weatherbase.com (accessed on 24 January 2024). This analysis is mainly presented in Section 6, which covers thermal comfort and temperature limits. Death rate analysis was based on the open access data from the Office for National Statistics (ONS) in the UK from 2013 to 2023, and is demonstrated in Section 3, Section 4 and Section 5. In some sections, ONS data for the period after 2019 were eliminated from the analysis due to the impact of COVID-19. To compare the ONS data with outdoor air temperature, the open access Met Office Mean Central England Temperature (CET) data were used. The availability of the above mentioned comprehensive and reliable open access UK governmental data is invaluable and encouraged us in other contexts and regions to enhance and diversify further research on the topic.
Only nine documents were found on the thermal comfort conditions for the sleeping environment of older people, as demonstrated in Table 2. Considering the importance of sleep and its restorative and regenerative qualities and limited research on related thermal comfort conditions [33], this is an important and recommended research area, particularly in relation to older people.

3. Terminology and Categories

This section covers the correct use of terminology for older people, age categories and age range of vulnerability.

3.1. Terminology

The recommended terminologies to be used are “older people”, “older persons” or “older person”. Due to anti-ageism reasons and to avoid inappropriate suggestions of being frail, immobile and burdensome, the use of words such as “elderly”, “aged” and “senior” are not recommended. “Elderly”, in particular, was rejected in 1995 by the UN Committee on Economic, Social, and Cultural Rights of Older Persons [42]. This is echoed by organisations dealing with older people’s health and welfare, such as the WHO [43], Age UK [42], the UK’s Centre for Ageing Better [44] and the US National Institute of Ageing [45], suggesting that “elderly” is related to ageism and should be avoided. However, “elderly” is the main terminology currently used in the literature on thermal comfort concerning older people, such as the works of Jiao et al. [29], Larriva et al. [22], Yao et al. [23] and Yuan et al. [24], and in review papers such as the works of Chen et al. [46], Zhou et al. [47] and Guergova and Dufour [48]. It is important to use the correct terminology and mindset when researching matters related to older people. According to Butler [49], “ageism allows the younger generations to see older people as different from themselves, thus, they subtly cease to identify with their elders as human beings”. Johnson and Bytheway [50] define ageism as “the view that people cease to be people, cease to be the same people or become people of a distinct and inferior kind, by virtue of having lived a specified number of years”.

3.2. Age Categories

Categorising age is complicated and many variations are found in the literature, particularly in thermal comfort studies, as demonstrated in Table 1. Appearance and date of birth are two measures of age, the latter, also known as chronological age, is more precise [51] and objective. To add to the complication, the health and well-being of older people can be significantly different, thus, in some cases, health and well-being conditions of an 85-year-old can be similar to that of a 75-year-old. There is an argument that asking people how old they are can be associated with their feelings of age and their appearance, and, thus, it may be a less accurate measure for scientific research. To ask “the year of birth” is more objective and precise. In much research and organising data, the “60+” category is used for older people, which is an open-ended age category and too broad. Bytheway [51] uses “young-old” (age 65 to 74), “middle-old” (age 75 to 84) and “old-old” (age 85 or over). In cases where the objective of the study can be affected by the age of older people (e.g., 70- or 90-year-olds), narrower bands of categories may be more appropriate.
Age is associated with the loss of thermal sensitivity and the physiological processes related to thermoregulation [51]. Thermoregulation is the ability of the body to maintain body temperature [52]. For example, significant differences may be found between a 90-year-old person’s body and that of a 60-year-old person. A different strategy is to use other criteria relevant to the study [51]. Overall, it is recommended to use “older people” as the recommended terminology, to record the year of birth as a determination of age, and to use different categories for older people, such as young-old (65–74), middle-old (75–84) and old-old (85+).

3.3. Age Range of Vulnerability

Life expectancy has improved significantly in recent decades. As demonstrated in Figure 1, life expectancy in Europe is above 70 years old and in many cases above 80 years old. However, the life expectancy in some African and Asian countries can be as low as 50 years old. The life expectancy at birth in recent years has improved significantly. For example, in Africa, the life expectancy at birth was 37 years old in 1950, while it rose to 63 years old in 2024. A similar trend is visible in Asia, increasing from 42 years old in 1950 to 75 years old in 2025. In Europe, life expectancy at birth was much higher in 1950 (i.e., 62), while it has improved to reach 79 years old in 2024. A similar trend is visible in North America, with it being 75 years old in 1950 and 80 years old in 2024. Figure 1 also shows a relationship between income and life expectancy, which is also reflected in the poor living and indoor thermal conditions for disadvantaged people. Life expectancy at birth in the UK has significantly increased since 1850, from the 40s years old in 1850 to the 80s years old in 2020 [53].
Different areas of research and government have different variations in age ranges for older people, such as the state pension retirement considerations, healthcare systems and thermal comfort research. Also, there are different variations according to cultures and different governments around the world. Another challenge is that, as the lifespan of the population changes, so do the age range considerations for older people from these organisations. For example, in the UK, the state pension age had been through four changes from 1995 to 2014 [55]. These changes are made based on three factors: the considered time for the beginning of adult life, the measurement used for life expectancy at the national level and the measurement of an individual’s life expectancy [56]. A simplification of the formula used to determine the state pension age in the UK is explained, as “people should spend, on average, up to one third of their adult life drawing a State Pension”. Therefore, the state pension age has gradually increased in the UK starting from 65 years old in 2018 to 66 years old starting in 2020 and is predicted to reach 67 years old in 2026–2028 and 68 years old in 2044–2046 [55]. The inclination of pension age in most of the EU member states demonstrates a similar pattern in order to utilise a later retirement age for sustainability and longer working lives [57].
Figure 2 demonstrates the different age categories, outdoor temperature and weekly death rates from January 2013 to December 2019, before the impact of COVID-19 in the UK. The outdoor mean monthly CET is calculated based on the daily outdoor air temperature readings provided by the open access Met Office data. The graph shows a significant difference between the death rate for the following three categories:
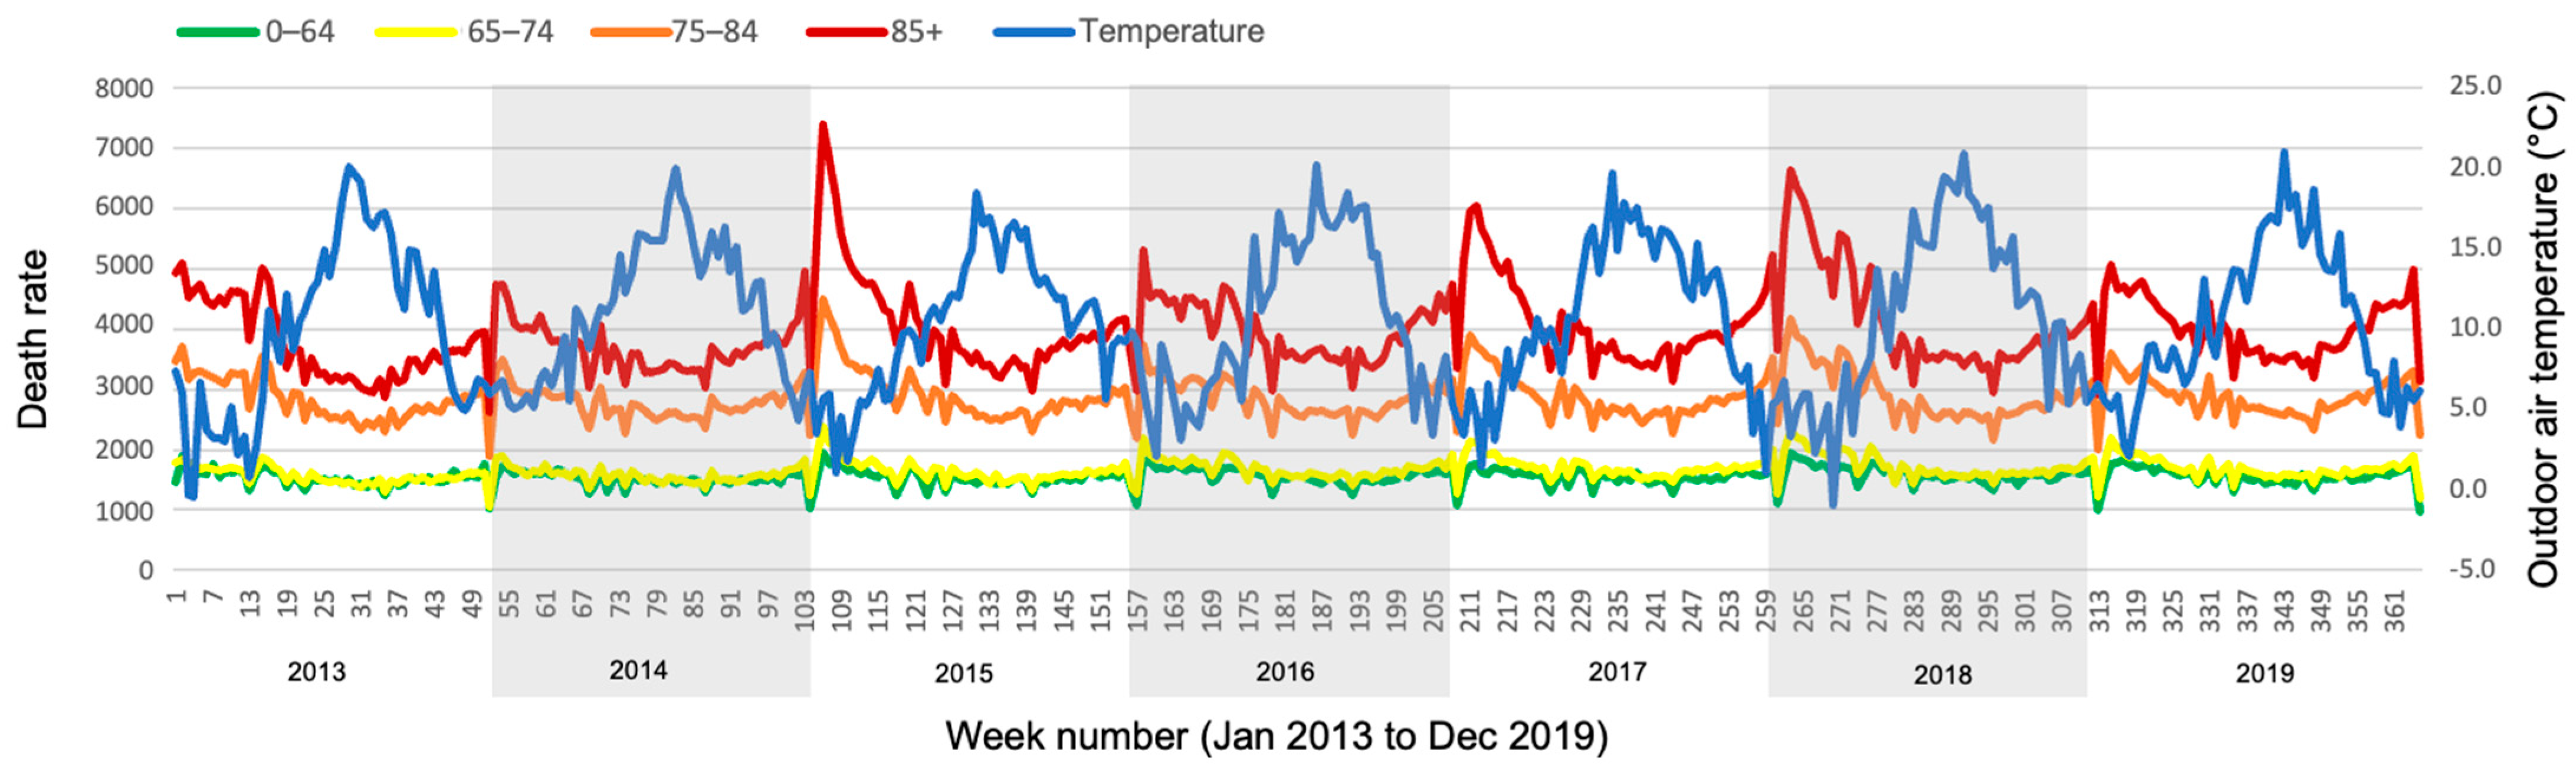
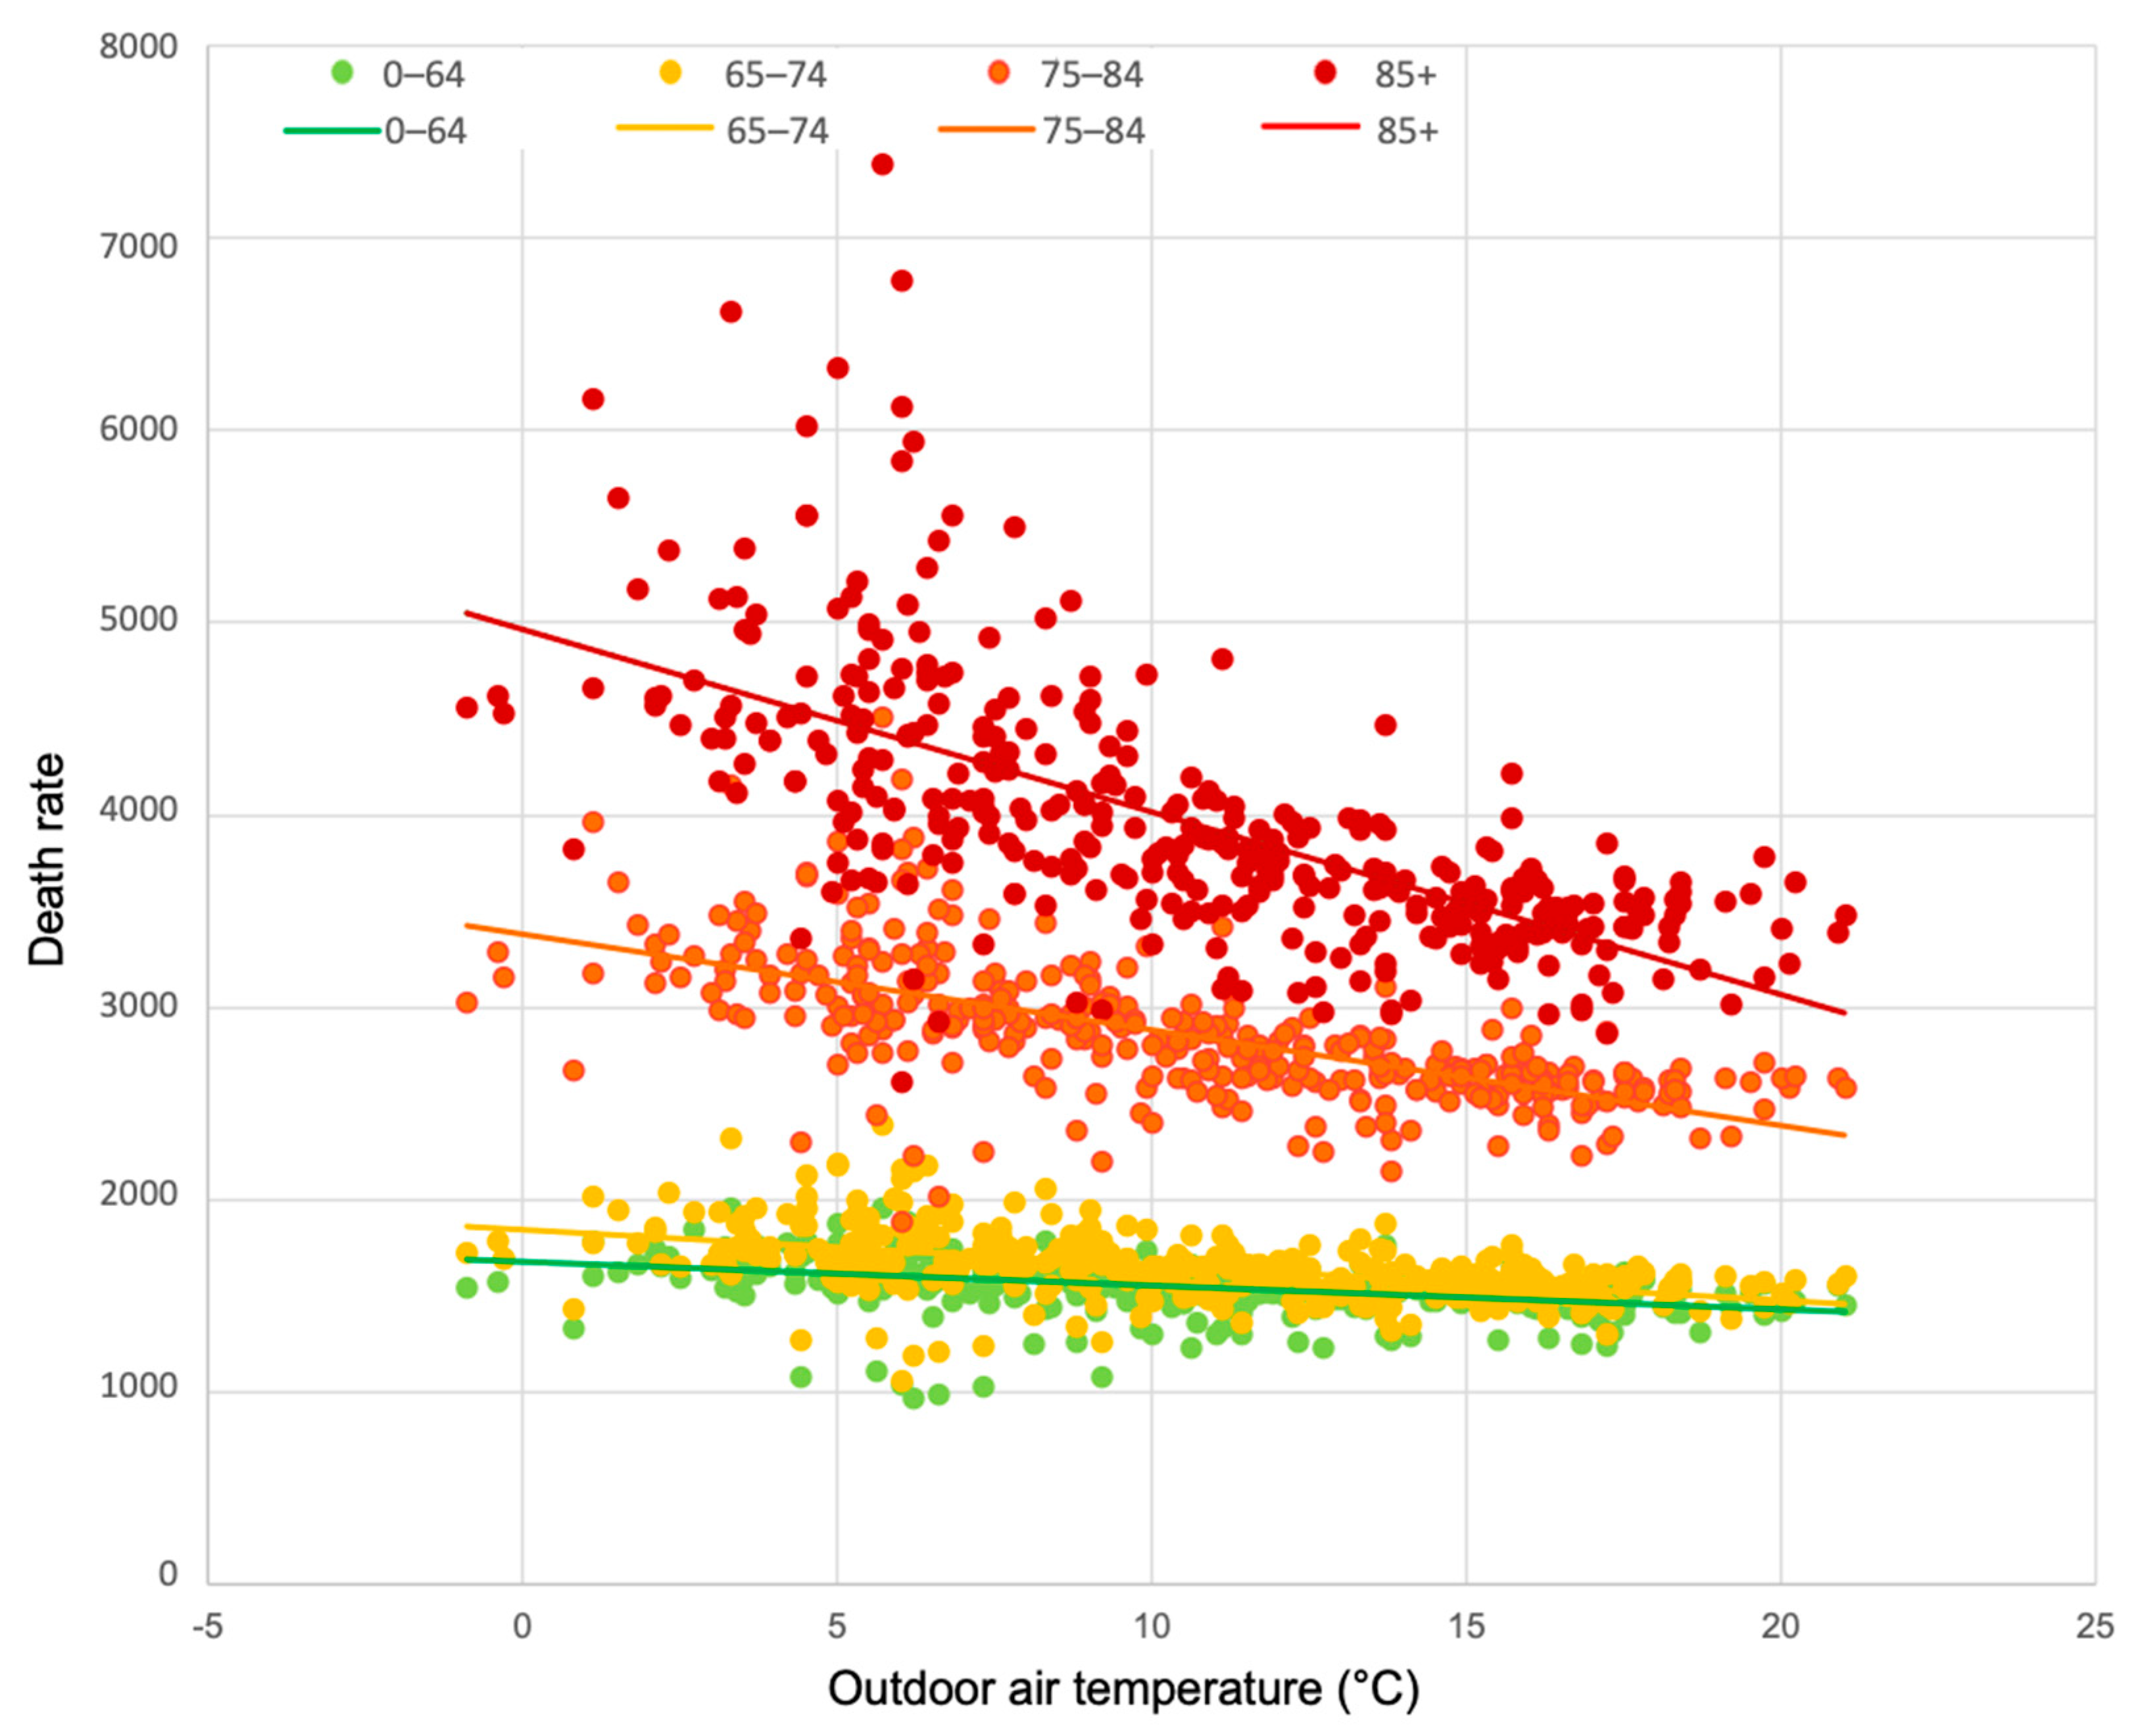
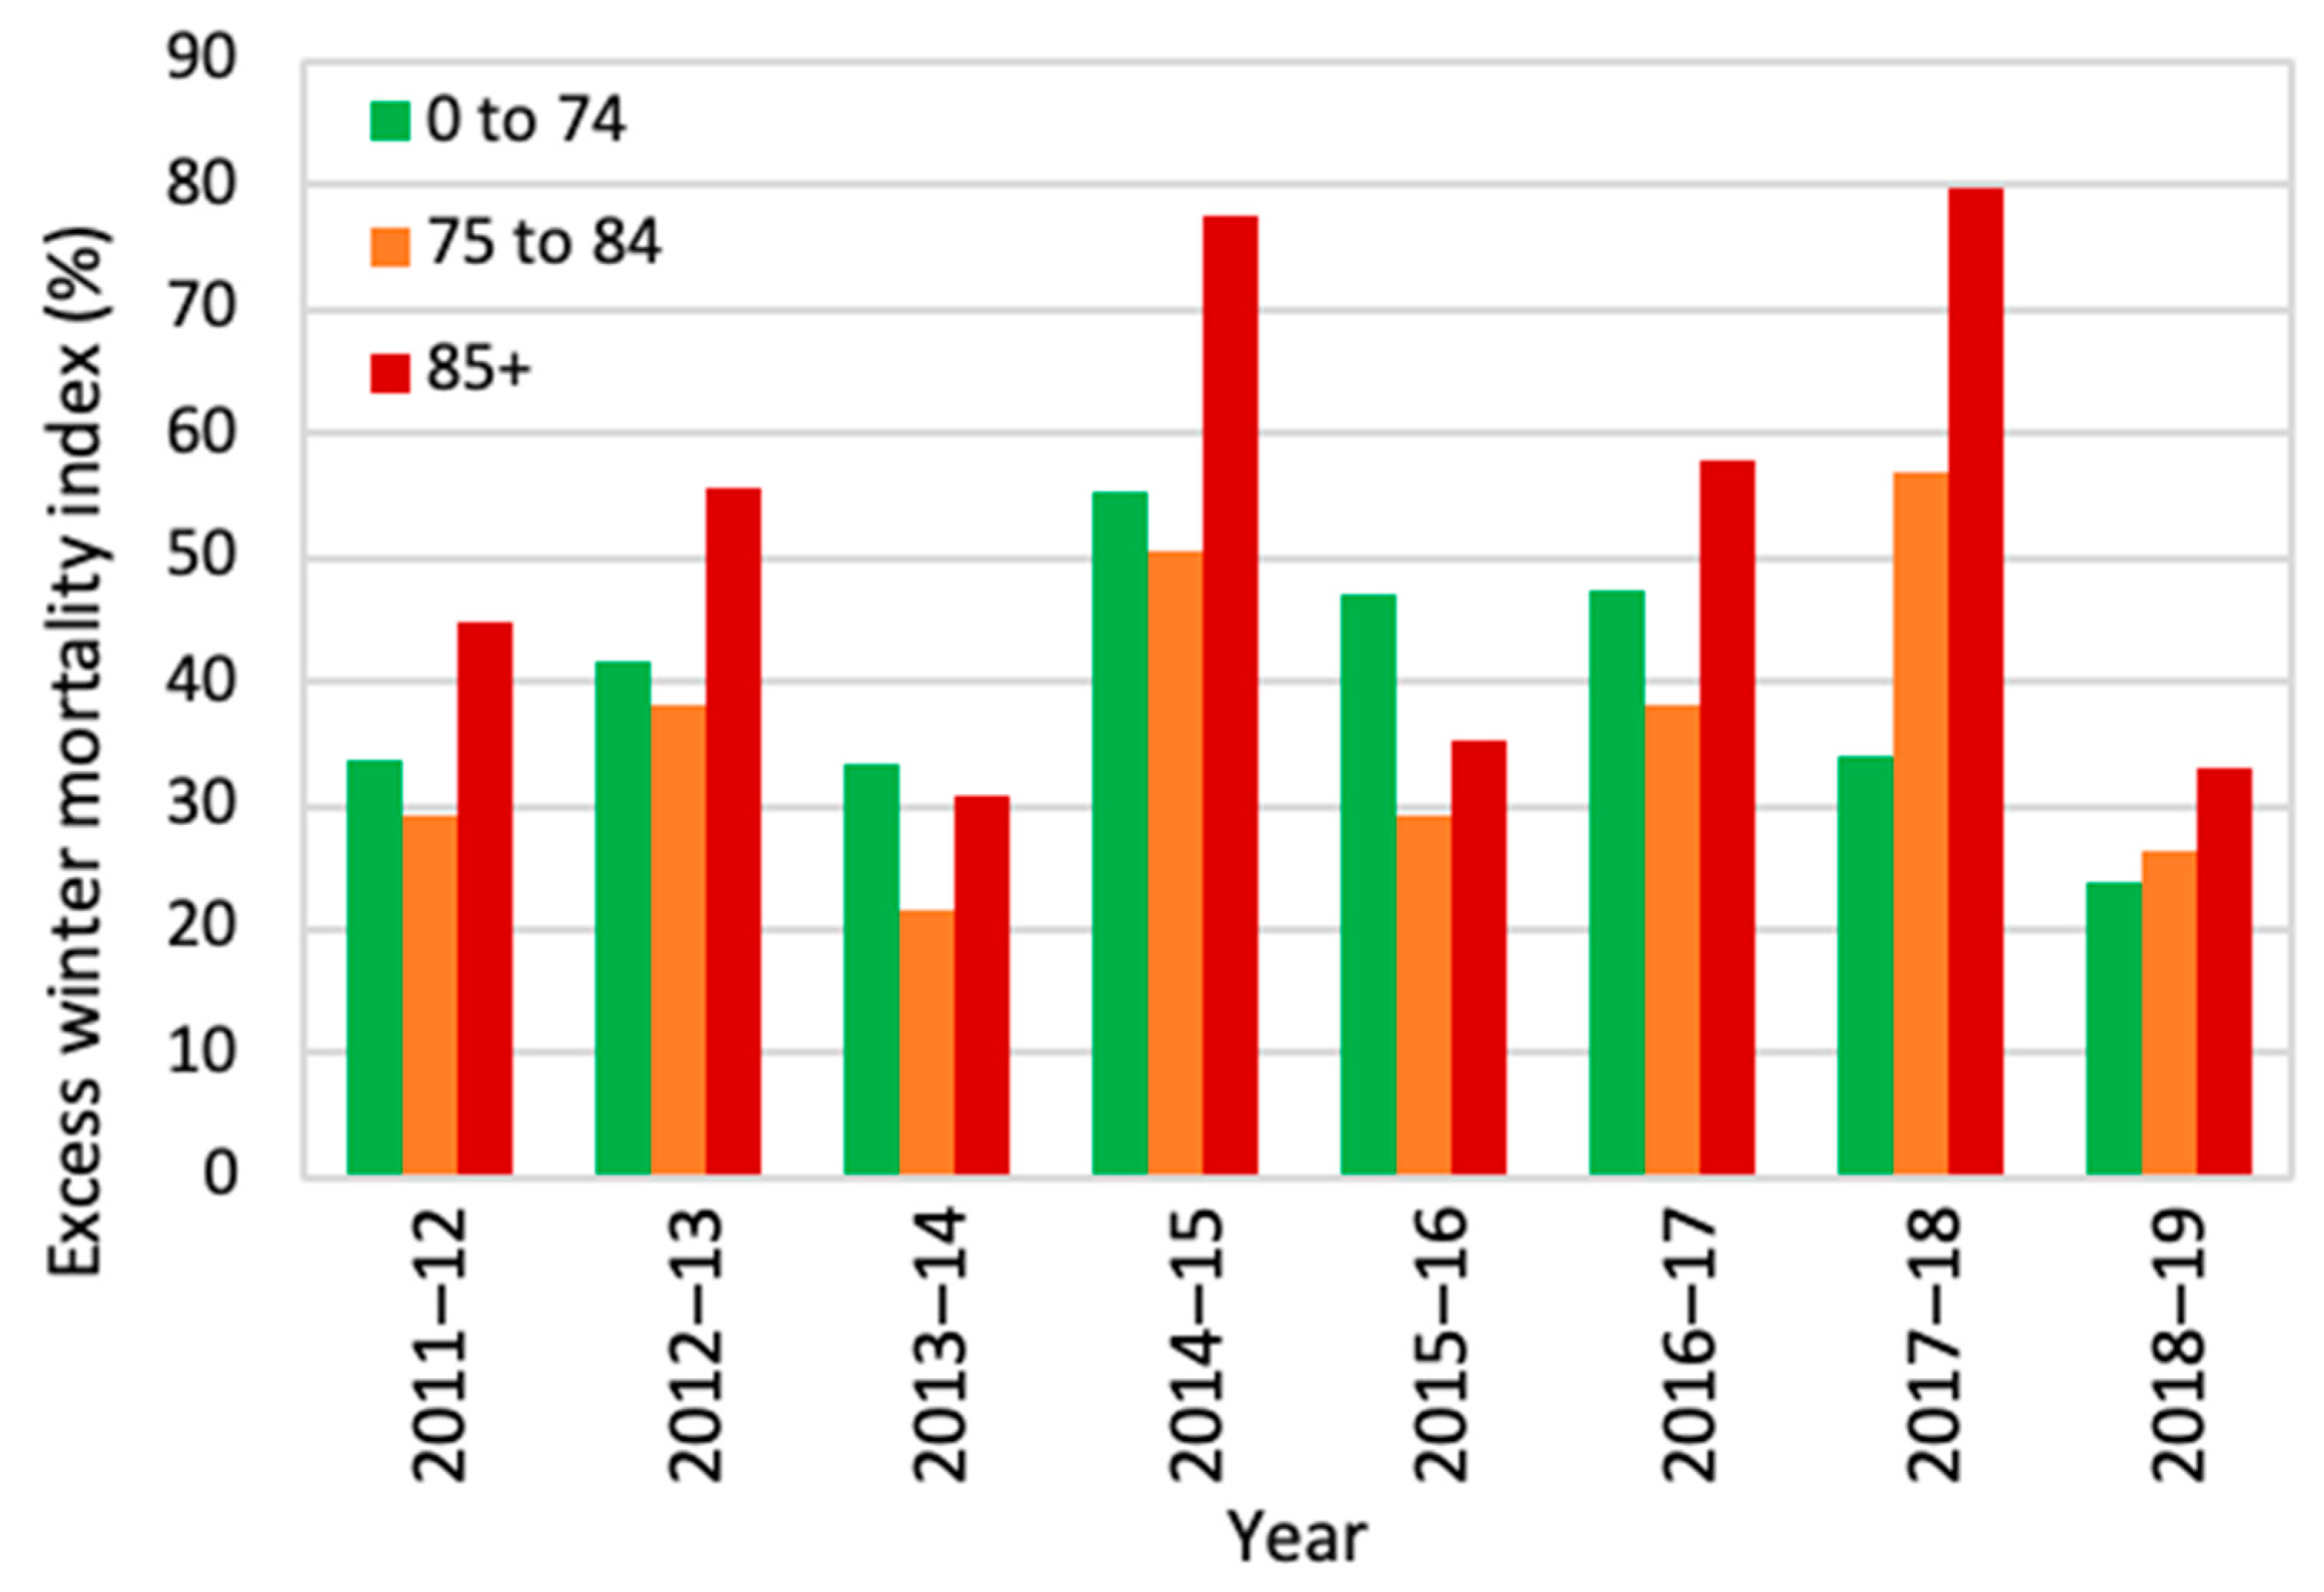
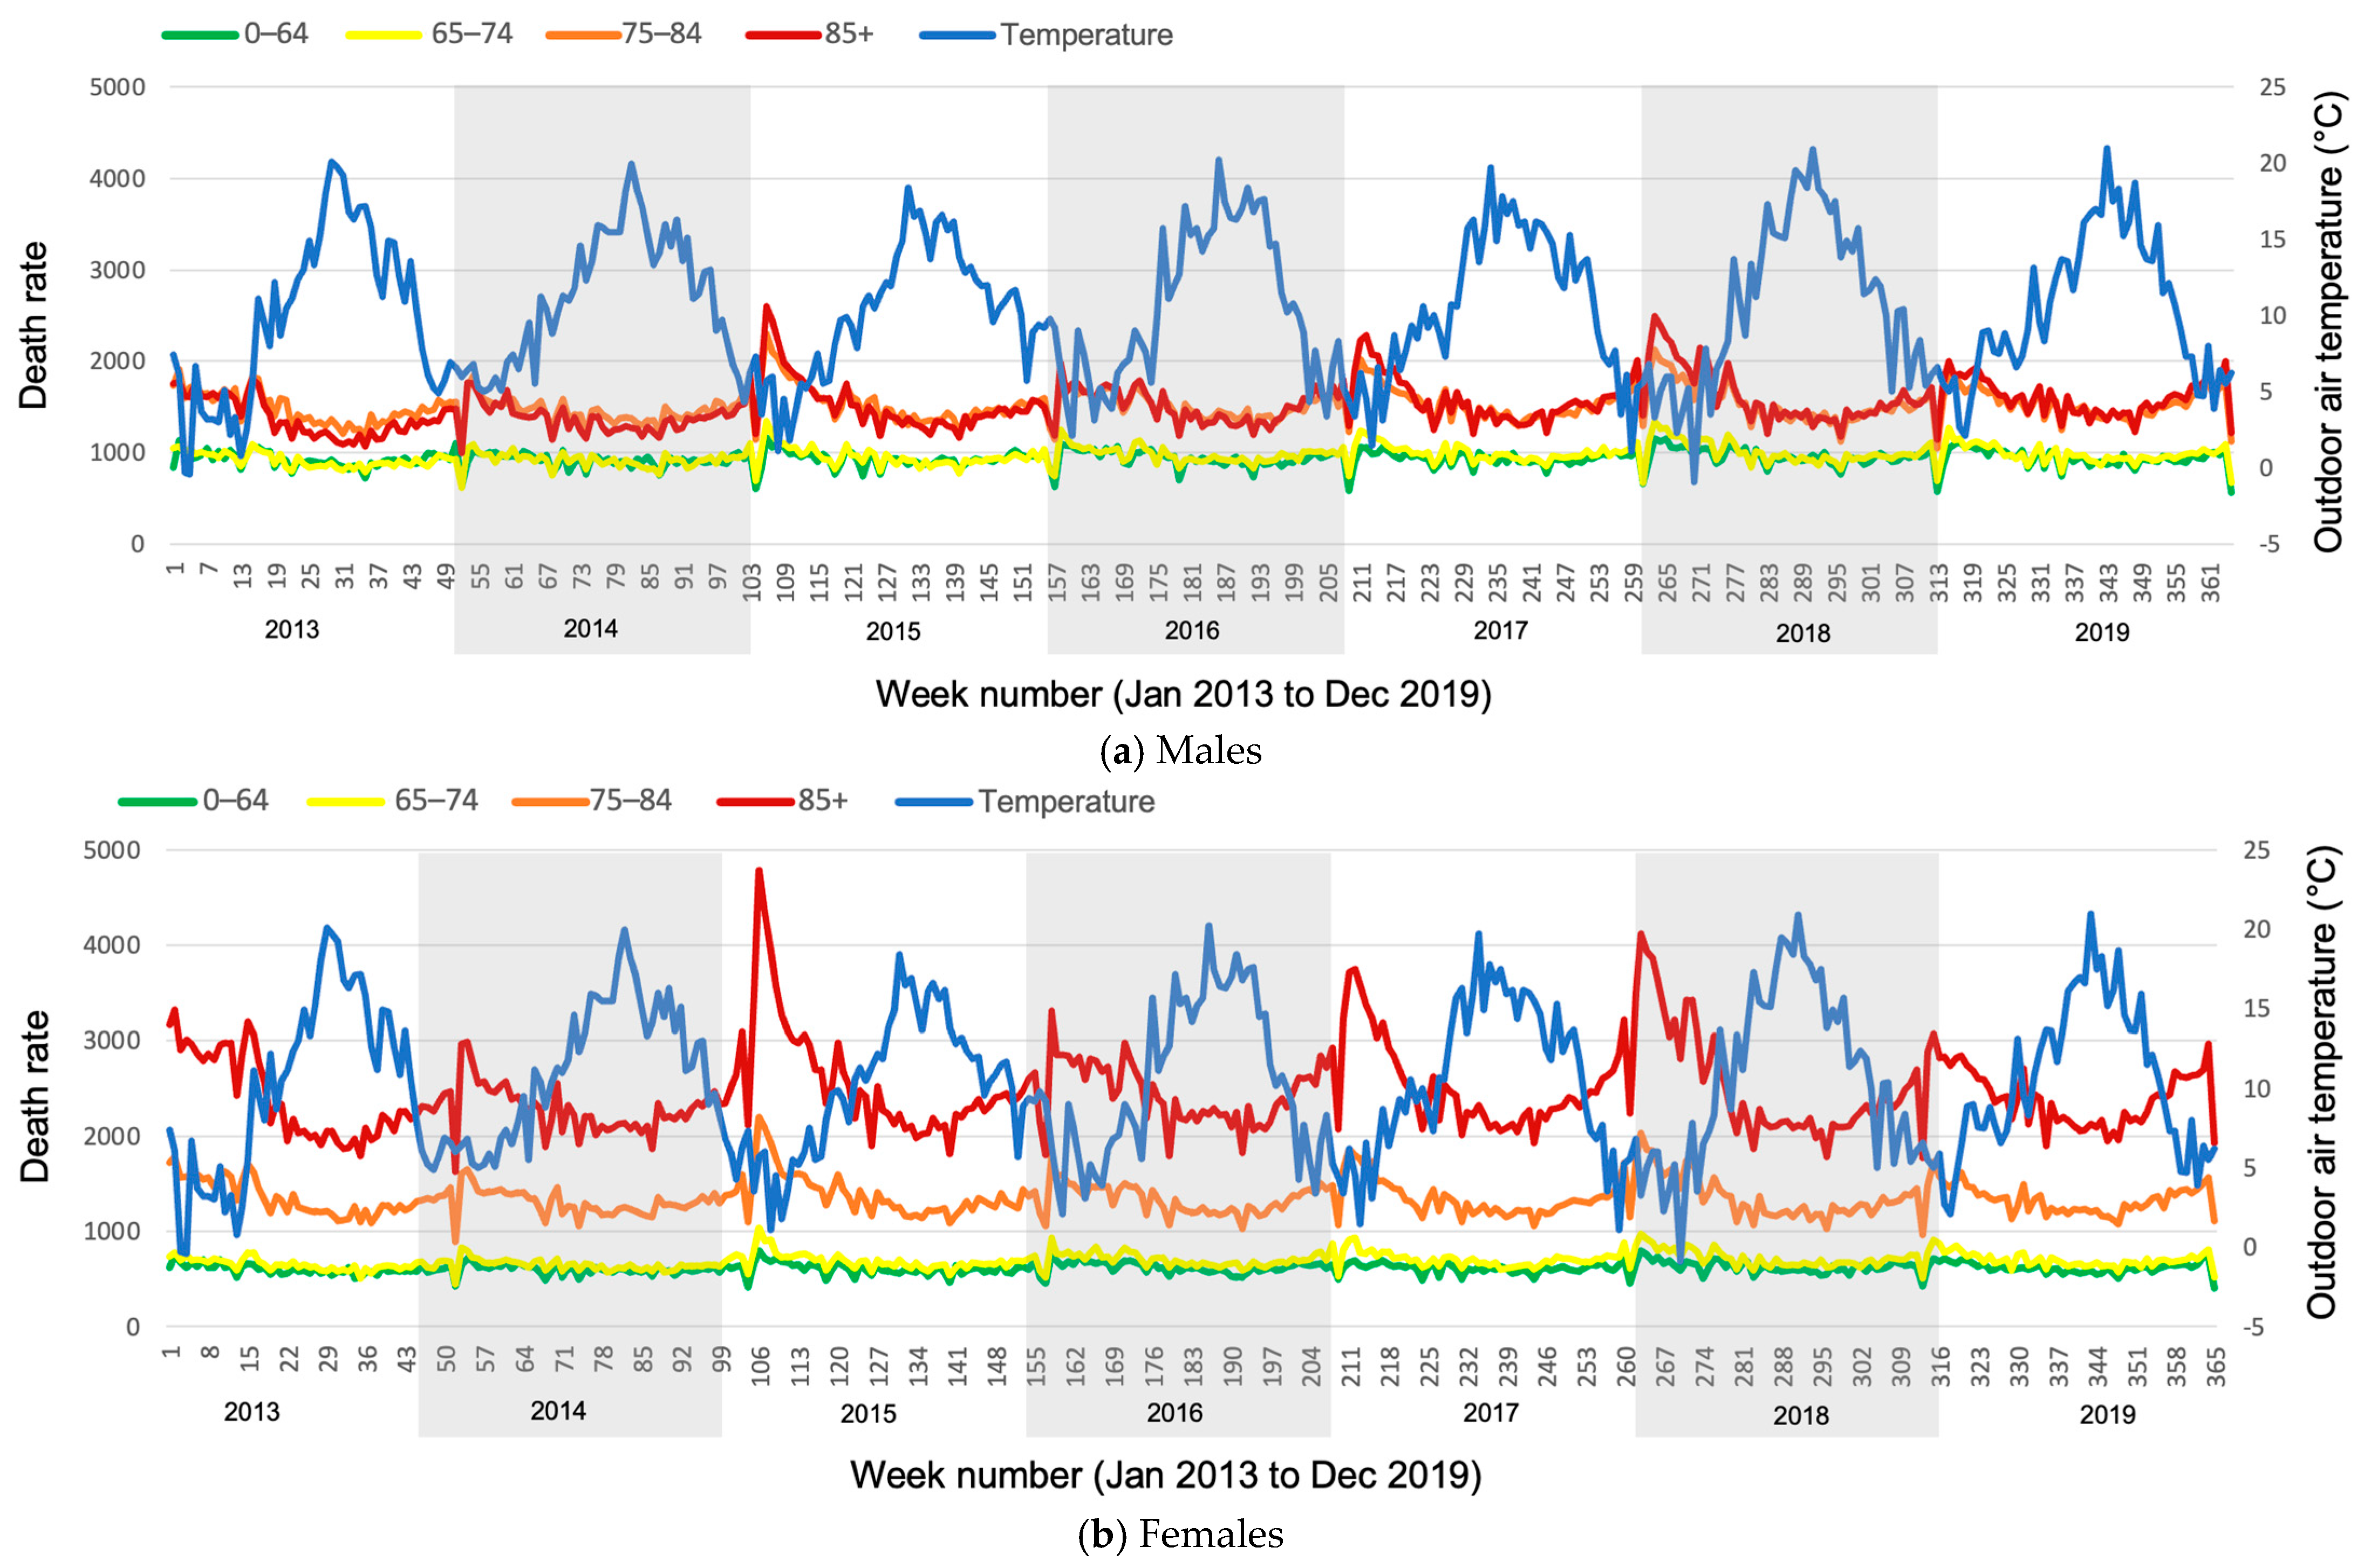
  • 85+ years old: high (red line)
  • 75–84 years old: medium (orange line)
  • 0–74 years old: low (overlapping yellow and green lines)
The death rates of the age categories 0–64 years old and 65–74 years old are very similar and quite low. The death rate in people over the age of 75 years old is much higher and this is particularly the case for those over the age of 85 years old. The change in the outdoor temperature has a reverse impact on the death rate. As the temperature decreases, the death rate increases, and vice versa. This is particularly significant in people aged 85 years old and over, as their death rate is significantly higher during periods of low outdoor temperature. This finding is in line with the age categories suggested by Bytheway [51]: young-old (65–74 years old), middle-old (75–84 years old) and old-old (85+ years old).
Figure 3 presents the regression analysis of the same data. No significant relationship is observed between the death rate and outdoor temperature for people aged under 74 years old. The death rate of people aged 65–84 years old is higher during the periods of low outdoor temperatures. There is a significant relationship between the death rate of people aged 85 years old and over with the outdoor temperature, and their death rate increases significantly during the low outdoor temperatures.
The following equations are associated with the regression lines for each age category presented in Figure 3. DR represents death rate, To represents outdoor temperature and R2 represents coefficient of determination.
85+: DR = −95.0To + 4964 (R2 = 0.44)
75–84: DR = −49.8To + 3382.9 (R2 = 0.44)
65–74: DR = −18.7To + 1846.3 (R2 = 0.26)
0–64: DR = −12.3To + 1677.8 (R2 = 0.18)
In thermal comfort research related to older people, the selection of age categories is inconsistent and the reason for this selection is unclear. In some cases, the age range is not specified at all. This is demonstrated in Table 3.

4. Health and Mortality

4.1. Health and Extreme Temperatures

Temperature is the key climatic factor affecting poor health and mortality rates [58]. Climate change has intensified the extremes of the climate, resulting in more extreme winter cold spells and summer heatwaves, which also last longer [59]. Between 2030 and 2050, an increase of 1.5 °C is expected and it is highly likely to surpass 1.5 °C if no actions are taken to significantly reduce greenhouse gas emissions [60]. The built environment requires a balance to become more sustainable and resilient to climate change and to limit its negative impacts, while providing a comfortable and healthy environment for people. The gradual increase in ambient temperature is associated with death and illness [61]. Bunker et al. [62] found that climate change and ageing may increase the risk of various diseases, such as diabetes, infectious disease and heat-related morbidity. The UK Climate Change Committee [63] predicted heat-related fatalities may result in significant economic costs of between £323 million and £9.9 billion per year by the 2050s in England. Occupants have become used to continuous and comfortable thermal environments to the point that they may no longer have the knowledge or experience to cope with natural thermal fluctuations [64]. Studies have found that regular exposure to thermal conditions outside the comfort zone can improve human capacity for thermoregulation, metabolic processes and cardiovascular conditions [65,66,67]. However, extra care is needed regarding vulnerable groups, such as older adults.
Older people are vulnerable to extreme temperatures [68]. They do not cope well with extremes of weather, resulting in higher death rates and more health issues, as compared to the past [69]. This is due to the impaired functioning of their thermoregulatory processes, cardiovascular, respiratory, neuromuscular and gastrointestinal functions as well as to malnutrition [68]. The sweating capacity and the ability to transport heat from the core of the body to the skin are reduced by age [70]. Bunker et al. [62] stated that the vulnerability of older people is, in part, attributable to “physiological and social factors, including living alone, multiple co-morbidities and high medication use, slow physiological adaptation and behavioural response to thermal stress, limited access to medical care and housing with heating or cooling”. They also found that heat and cold exposure increases the risk of cardiovascular, cerebrovascular and respiratory deaths and morbidity. Healthy older people have relatively low heat production [71], thermal perception [49] and behavioural thermoregulatory responses [72], such as drinking fluids [73,74]. The impairment of the behavioural response may be partly due to reduced awareness of thermal changes but could also be affected by reduced ability to make adaptive changes such as opening windows or changing the setting of the heating system. This makes them more vulnerable to extremes of temperature.

4.1.1. Hot

When the whole body is exposed to heat, two main mechanisms are followed to avoid the increase in body core temperature: (1) sweating and (2) enlargement of the blood vessels (vasodilation) to increase the blood flow and to redirect it to the skin [75]. This will result in increased dissipation of the heat to the environment, while also reducing the heat gain from the environment [52]. The sweat rate response is reduced by ageing, as the number of sweat glands that can be activated by heat is reduced. Therefore, the ability of the body to cool through sweating is reduced by ageing. In older people, the body’s speed of response to heat exposure is reduced, and blood vessels lack the ability to enlarge sufficiently. As a consequence, older people do not lose heat, and their body core temperature rises; this predisposes them to hyperthermia [75]. Table 4 demonstrates the direct and indirect impacts of heat exposure [76].

4.1.2. Cold

The human body has a mechanism (vasoconstriction) to cope with low temperatures, and the blood vessels become narrower to limit blood flow to the skin. This, in turn, cools the skin and brings it closer to the temperature of the immediate environment, thus reducing the body heat loss. However, this function is reduced in older people, resulting in a decreased ability to retain heat in the cold, which causes older people’s body core temperature to drop and to put them at risk of hypothermia [75]. Hypothermia occurs when the body core temperature drops below 35 °C to the extent that body heat loss becomes greater than its heat production [77,78]. Krzyżewska et al. [79] reported the highest numbers of hypothermic cases are towards the beginning of the cold season, occurring between October and December. They recognised a lag in adaptation of both the human body and the behavioural adjustments. Clothing layers are effective when the metabolic heat production is high, but older people have lower heat production. Therefore, clothing is not sufficient for hypothermic older people, particularly when it restricts mobility during the daytime [80]. Fox et al. [81] reported that older people living in cold houses with poor heating amenities were less aware of feeling cold in winter. They did not wear excessive clothing and they were not consciously dissatisfied with the heating system. Thus, they were at risk of hypothermia.
Environmental temperatures below 15 °C are reported to have a negative impact on older people’s health due to an increased strain on their circulatory system [80]. They may not feel cold despite living in cold conditions [81] and, thus, may not be taking the appropriate measures to keep warm. When the body’s heat loss exceeds the heat production, the body responds by producing more heat through shivering of the skeletal muscle mass and metabolic activity of Brown Adipose Tissue (BAT). Both the capacity to increase heat production and the thermosensitivity to guide clothing changes are reduced in older people [75], making older people vulnerable in low temperatures. In particular, they are vulnerable to long periods of exposure to uncomfortably cold environments, as it has a negative impact on the immune system [82]. For example, older people sleep in semi-open spaces on balconies in the hilly areas in Nepal, where the outdoor air temperature drops below 10 °C at night in winter. In this case, the heat loss from the body through exhalation is significant, which potentially puts older people’s health at risk, possibly leading to death [83]. Low indoor temperatures at home are also associated with an increase in blood pressure in older people [84]. However, improving the thermal quality in cold houses significantly reduces blood pressure [85] and improves general health and well-being [86].

4.2. Thermal Sensitivity and Mobility

Thermosensitivity declines with age, meaning that the body’s sensors to sense heat or cold do not respond as efficiently to alert the brain to put appropriate defences in place. Although both cold and warm sensitivity are reduced, warm sensitivity is more pronounced [75]. Older people are reported to be less sensitive to ambient conditions [87] and the changes in the thermal environment [68]. This affects their subjective perception of the thermal environment. Jiao et al. [12] recommended the need to consider addressing both the physical health and thermal comfort requirements of older people. Also, muscle strength and work capacity are reduced by age [70] as older adults are less active in low temperatures [88]. Lindemann et al. [89] found that exposure to cool environments affects the mobility of healthy older women, which is essential for living independently. Older people are likely to suffer from physical impairments, such as arthritis and limited mobility. Thus, they may find it difficult to access and operate thermal control systems, such as openable windows, and to regulate the thermal environment, as well as to move to other refuge spaces with better thermal conditions. To make matters worse, in cases where they suffer from cognitive impairment, their capacity for decision making and learning new skills to deal with the technological advancements related to thermal control systems can be affected [87].

4.3. COVID-19 and Energy Crisis

There is a significant increase in influenza and respiratory syncytial virus infections during the winter in temperate climatic conditions as the virus is more adapted to the cooler conditions [90]. The COVID-19 pandemic impacted older adults more severely than the rest of the population. A total of 25% of COVID-19-related deaths happened in people aged 70–79 years old and about 60% in people aged over 80 years old, and this was consistent across most countries [91]. In the UK, about a third of COVID-19-related deaths involved older people living in care homes [92,93]. The life expectancy period at birth dropped by 1.2 years for men and 0.9 years for women during and due to the impact of the COVID-19 pandemic [53]. All this suggests that older people were more vulnerable to the COVID-19 pandemic, as compared to the rest of the population. Thus, careful consideration is needed for this age group to protect them from potential future pandemics. Also, older people spend 95% of their time indoors [94]. During the COVID-19 situation, older people were recommended to constantly stay at home and to self-isolate in order to keep safe [95]. Therefore, the impact of the quality of the thermal environment on older people became ever more significant.
Previously in the UK, 4.5 million older people suffered from fuel poverty and cold homes [96]. Due to the energy crisis in 2022, this number reached 5.6 million, and a record high of 7.8 million older people (i.e., 62%) reported that they were concerned about the cost of heating their homes. This is a significant increase from 43% in 2015 [97]. The choice between “heating or eating” has become a desperate challenge for 24% of the older population [98]. In 2024, the prices were expected to come down and yet 16% of older households (1.9 million) suffered from fuel poverty and 36% of them were considered to be receiving the lowest income in the UK [99], which means that they cannot afford to heat their homes. To make matters worse, the cost of cold homes to the National Health Service (NHS) in the UK was already estimated at £1.4 bn per year in 2016 [100] and the increased fuel poverty and fuel stress is, ultimately, going to increase this cost. While fixing and warming the housing is the most effective approach, it is expensive. The average cost per dwelling is £3710 [101], and running energy costs will be added. Considering that 2.1 million pensioners already live in poverty in the UK, and over 74% of them live in the privately rented or social rented sector [102], it is highly unlikely that they are able or can afford to fix the house they live in.

4.4. Mortality

Heat-related mortality has been increasing recently. In the UK, temperatures below −5 °C and above 25 °C are associated with greatest risk [103]. Cold-related mortality is still greater than heat-related mortality [104], as demonstrated in Figure 4. In the UK, more people die in winter (about 30.3% in 2017–2018), as compared to summer. Also, the death rate in winter is increasingly higher than before [105]. Some studies predict that by 2050, due to the impact of climate change, winter mortality is likely to drop slightly [106] or significantly (i.e., 25%) [107], while heatwave mortality is likely to increase significantly [106].
Figure 5 demonstrates the significant relationship between temperature and mortality. As the outdoor temperature drops, the mortality rate increases. This is particularly significant for outdoor temperatures below 5 °C.
The equations for the graphs presented in Figure 5 are presented below. DR represents the death rate and To represents the outdoor temperature, which for Figure 5a is the monthly mean outdoor air temperature, while the To in Figure 5b is the five-year-average outdoor air temperature. n represents the number of samples, S.E. represents the standard error of regression coefficient, S.E.1 represents the standard error of first term regression coefficient, S.E.2 represents the standard error of second term regression coefficient and p represents significant level of regression coefficient.
Mean daily deaths:
Linear: DR = −31.6To + 1737.7 (n = 72, R2 = 0.67, S.E. = 2.62, p < 0.001)
Quadratic: DR = 3.2To2 − 99.0To + 2031.8 (n = 72, R2 = 0.76, S.E.1 = 0.62, S.E.2 = 13.33, p < 0.001)
Five-year-average daily deaths:
Linear: DR = −27.7To + 1648.2 (n = 72, R2 = 0.85, S.E. = 1.40, p < 0.001)
Quadratic: DR = 1.7To2 − 62.0To + 1788.5 (n = 72, R2 = 0.88, S.E.1 = 0.37, S.E.2 = 7.66, p < 0.001)

4.4.1. Hot Spells

People aged 65 years old and over are considered as vulnerable and are at risk of heat-related illness [108]. Deaths in care homes were reported to be 11.9% above average on heat-period days [109]. The frequency, intensity and duration of heatwaves are on the rise [110], and the number of deaths during heatwaves is also increasing [111]. The mortality rate may increase just before the heat period [112], as the temperature starts to soar. Also, according to the World Health Organisation (WHO) [76], deaths and hospitalisation due to heat exposure may happen on the same day or several days later. This can accelerate illness or death in vulnerable people, particularly in the first few days during and after a heatwave. Vulnerable people with respiratory or cerebrovascular conditions are more susceptible to death during heatwaves [110]. Older people are vulnerable to the increased temperature rise, particularly during summer heatwaves. Heatwaves affect health and can cause cardiovascular mortality, emergency hospitalisation, respiratory failure, renal failure [107,108], congestive heart failure (CHF), fluid and electrolyte disorders, urinary tract infections and septicaemia [113]. Heatwaves, heat stroke and sunstroke are identified as high risk for several diagnoses [114]. Hajat et al. [115] found a mean relative risk of mortality of 1.03 per temperature degree increase above the heat threshold of 17 °C to 18 °C for the outdoor temperature. According to the Climate Change Committee [63], by the 2050s in England, heat-related fatalities may result in significant economic costs between £323 million and £9.9 billion per year.
The summer of 2022 observed the highest recorded temperature of up to 40.3 °C in England [116]. The following five heat periods were recorded as resulting in 2803 deaths for those aged 65 years old and over in England, excluding the COVID-19 impact [104]:
H1. 
The heat period lasted 4 days (16 to 19 June) and the related deaths were recorded 4 days before, during and 4 days after the heat period.
H2. 
The heat period lasted 16 days (10 to 25 July) and the related deaths were recorded 16 days before, during and 16 days after the heat period.
H3. 
The heat period lasted 7 days (30 July to 5 August) and the related deaths were recorded 7 days before, during and 7 days after the heat period.
H4. 
The heat period lasted 10 days (8 to 17 August) and the related deaths were recorded 10 days before, during and 10 days after the heat period.
H5. 
The heat period lasted 3 days (23 to 25 August) and the related deaths were recorded 3 days before, during and 3 days after the heat period.
This suggests that the period of mortality can be three times the period of the heatwave, covering before, during and after the heatwave period. Figure 6 demonstrates death rate, mean outdoor temperature and heatwave periods in summer 2022. The heatwave periods are highlighted in grey. Clear spikes in both outdoor temperature and death rate are observed during all five heatwaves.
Further regression analysis in Figure 7 reveals a significant relationship between the death rate and mean daily outdoor temperature during this period. It demonstrates that 15.5 °C outdoor air temperature is the turning point, as below and above this temperature, the death rate increases. As the outdoor air temperature mainly ranges between 12 °C and 19 °C, the majority of the deaths seem to take place around this temperature range. However, as the outdoor air temperature increases above 19 °C, there is a significant increase in the death rate of about an extra 200 people per day. Although there is not that much data regarding temperatures above 28 °C, as it is not a common occurrence in the UK, the increase in death rate becomes an alarming extra 400 people per day, reaching to 1735 people per day.
Figure 8 demonstrates that people aged 70 years old and over are more at risk when the temperature spikes in summer. Their excess death rate spikes much higher than that for all people under 70 years old.
Further regression analysis in Figure 9 reveals a more significant relationship between the excess death rate and outdoor air temperature in summer for older people over 70 years old, as compared to people under 70 years old.

4.4.2. Cold Spells

There is a lack of research on the impact of a cold spell on the mortality rate in temperate climatic regions [117]. A cold spell is defined as an unusually low temperature of three degrees below the daily average temperature over at least three consecutive days. There is a lag between the occurrence of a cold spell and the actual death of a person as a direct or indirect result of it. This lag was found to be between four to six and up to fourteen days [117]. Wang et al. [118] found a 28.2% increase in mortality rate during a cold spell. They also found mortality rates were related to the duration and intensity of the cold spell as well as its occurrence earlier in the cold season. Low temperatures put a strain on different critical bodily functions, pushing those with health conditions into the danger zone. Indoor temperatures below 16 °C increase the risk of impaired respiratory functioning, leading to higher death rates twelve days after a cold spell. Temperatures below 12 °C increase the strain placed on the cardiovascular system, increasing the death rate only three days after a cold spell [119]. Respiratory diseases were responsible for 84.9% of the excess winter deaths in 2017–2018 [120] and they are significantly related to cold conditions in residential buildings [121]. Hajat et al. [115] found that every drop in the outdoor temperature below 5 °C, increases General Practitioner (GP) visits regarding respiratory tract infections by 19%. Respiratory disease was responsible for 84.9% of the excess winter deaths in 2017–2018. Circulatory diseases were responsible for 28% of the excess winter deaths in 2017–2018 [105]. Also, coronary heart disease and cerebrovascular disease have higher mortality rates during the cold months [121].
Older people have a much higher mortality rate due to hypothermia (i.e., 80%) when compared to younger people (i.e., 10%) [122]. Age UK [123] calculated that over 2.5 million deaths of older people in England and Wales in the past sixty years were due to low temperatures. Analysis in Figure 10 demonstrates a much higher excess winter mortality rate for people aged 85 years old and over. As explained in the “cold” Section 4.1.2, the body mechanisms to cope with the cold may not function properly and lack sensitivity in older people, leading to health risk conditions such as increased respiratory diseases, high blood pressure and potentially hypothermia.
Figure 11 reveals that indirect cold-related diseases, including circulatory and respiratory diseases, are the key concerns for the cause of death. Although dementia and Alzheimer’s rates are quite high, it may not be directly related to the indoor conditions. Respiratory diseases have increased in recent years (data are from a period prior to the COVID-19 situation).
Figure 12 demonstrates a relationship between weekly outdoor air temperature and the total numbers of weekly deaths. The two variables are correlated (r = 0.64). The lower the outdoor temperature, the higher the number of weekly deaths. It suggests that every degree temperature drop can be related to an increased mean of 175 deaths. The weekly death rate is higher for outdoor temperatures below 6 °C.

5. Gender Differences

There is a disagreement between researchers regarding gender differences related to thermal comfort. In a review study, Karjalainen [124] found no significant gender differences regarding the overall capacity for thermoregulation and neutral temperatures, particularly among younger participants during most conditions and activities. Women were reported as more sensitive and dissatisfied in cases of deviation from the comfort temperature. In contrast, Barnes and Charkoudian [52] also found young female subjects at a much lower risk of systemic hypertension, which is related to high blood pressure in the arteries, as compared to male subjects of the same age and with the same health conditions. This can affect thermoregulation as the blood pressure and blood flow are essential drivers of thermoregulation. Kaciuba-Uscilko and Grucza [125] reported that “women differ from men in thermal responses to exogenous heat load and heat loss as well as to endogenous heat load during exercise, because they usually have a larger ratio of body surface to body mass, a greater subcutaneous fat content, and lower exercise capacity”. They also found that, in the absence of the above-mentioned differences, females’ sweat rates related to heat load were still lower than that of males. However, they had a more efficient evaporative impact, which resulted in the female body maintaining a core temperature similar to that of the male body. In a limited study, Tejedor et al. [126] found that older women were more sensitive to low air temperatures in winter in Mediterranean climatic conditions, as compared to older men.
Gender differences are reported during exposure to extreme air temperatures. Meng et al. [117] found that women are significantly more susceptible to cold spells, as compared to men. Kaciuba-Uscilko and Grucza [125] found that women have less tolerance when exposed to extreme temperatures and have a lower capacity to control their body temperature. Also, older women are reported as being more susceptible during heatwaves [127,128,129], and they have a higher rate of self-reported morbidity and heat-related symptoms [130]. Shahzad et al. [131] found that older women adopted more adaptive behaviours during a heatwave, as compared to men. More frequent changes of clothing layers were particularly noted.

5.1. Menopause

Menopausal thermal requirements lead to gender differences during this period. Changes in cerebral blood flow and cerebrovascular reactivity are age related and, in women, they happen around the menopause age [132,133]. The usual starting age of menopause varies between 40 and 60 years old, with a mean average of 51 years [134]. The duration of Vasomotor Menopause Symptoms (VMS) is reported to be likely to occur over a period of seven years [135]. This means that some women may experience the symptoms well into their old age. Older women, during their menopause, face a higher risk of systemic hypertension (high blood pressure) due to a decrease in their oestrogen levels [52]. This affects the blood flow in the skin’s circulation (i.e., thermoregulatory vasodilation), which ultimately affects their thermoregulation and skin temperature. “Hot flush” is the most distinct symptom of menopause, and is associated with a feeling of warmth in the head, chest and arms [136]. Changes in the thermoregulation, heart rate, sweating, skin, and body core temperatures are associated with hot flushes [137]. Tataryn et al. [138] explain that a “hot flush” is the body’s response to lowering the thermoregulatory set point. This may affect daily activities and sleeping [136]. Molnar [139] found that the skin temperature falls during the hot flush and rises after it, while the body core temperature falls after each hot flush (down to 35.6 °C rectal temperature). The temperatures of the fingers and toes undergoes a sharp increase during the hot flush and slowly drop afterwards. Tankersley et al. [140] found that Hormone Replacement Therapy (HRT) for menopause, particularly the oestrogen-only addition, is effective. HRT increases blood pressure, which increases the blood flow to the skin. It also increases the sweating to a lower body temperature to allow the dissipation of the heat to take place earlier [140]. Putnam and Bochantin [141] found that poor ventilation in the room increases the symptoms of menopause. Some studies suggest the silence of women regarding their menopausal needs is due to the fear of embarrassment or ridicule [142,143]. This may affect appropriate actions being taken by them and their employers. There is a lack of research regarding the relationship between menopause and thermal comfort [144].

5.2. Mortality and Gender

Life expectancy at birth pre-COVID-19 was higher for women (i.e., 83.5 years old) than men (i.e., 79.8 years old) in the UK [53]. The ONS and Met Office analysis in Figure 13 reveals that female mortality over the age of 85 years old is significantly higher than that of males, with significant peaks in death rate during periods of low outdoor air temperature below 5 °C. The male mortality rate is similar for age categories of 75–84 and 85+ years old, while the female mortality rates of those two categories are significantly different. This may be inevitable because of the larger population (i.e., 63.9%) of women over 85 years old [105]. The weekly death rate for age categories of 0–64 and 65–74 years old is similar for males; also, these two categories are similar for females. However, the female weekly death rate (approx. 800) for age 0–74 years old is much lower than that of males (approx. 1000).
Figure 14 demonstrates higher excess winter mortality for women, as compared to men. The difference seems consistent in different age categories. The excess winter mortality rate for the 85+ years old age group is higher than that for the other two age groups. The excess winter mortality rate appears similar for the 0–74 and 75–84 years old age categories. This is not overall deaths, rather, the winter deaths in excess of what would have been expected. The overall deaths were analysed in Figure 13.
The further detailed yearly analysis in Figure 15 demonstrates a gradual increase in excess winter mortality for people aged 74 years old and over. The gradual increase in female excess mortality rate is more significant than that of males, particularly those over the age of 85 years old, and when the excess mortality has peaked in a particular year.
Overall, there is a lack of research regarding gender differences in thermal comfort; adaptive behaviours; thermal control requirements and development and testing of Personal Comfort Systems for older people. Also, there is a lack of research regarding the impacts of menopause on the thermal comfort, behaviour and requirements of women, and this can last into older age. This is an important area of research as it directly impacts their health, well-being, mental health, social relationships and their quality of life.

6. Thermal Comfort and Temperature Limit

6.1. Standards and Guidelines

In summer, the WHO [77] recommends temperatures lower than 32 °C during the day and lower than 24 °C during the night for older people. CIBSE TM59 [145] has guidelines for the upper limit of temperature for different spaces in houses in the UK, but there is no mention of the age group or of older people. It considers temperatures above 24 °C in bedrooms at night to disrupt the sleep pattern. A temperature of 26 °C is considered as the absolute upper limit of night time indoor temperature for residential bedrooms [145]. A temperature of 28 °C is considered as the upper limit of the temperature in communal corridors and 26 °C for mechanically ventilated spaces. The ASHRAE Standard 55 [146] considers 28.2 °C as the upper limit of comfortable temperature in summer. However, there are no specific criteria for older people.
In winter, thermal-related discomfort is reported to be more significant for older people [147]. The acceptable indoor temperature provided by the WHO [148] is 18 °C and, in the case of older people, 20 to 21 °C. This recommendation is quite old [16], and applies worldwide, without any consideration of climatic conditions. Studies suggest there is a lack of research on indoor thermal conditions suited for older people [16,149]. Also, the current thermal comfort standards do not consider older people’s requirements in terms of producing the thermal comfort zone. They present no specific guidelines and do not even make a mention of vulnerable age groups. Hughes et al. [16] reported the inaccuracy of thermal comfort standards in predicting comfort of older people. They reported that the ISO7730 model [150] significantly underpredicted comfort for older people in winter. They found that older people were comfortable in 18 °C indoor temperatures, which is the lower band of thermal comfort and lower than the WHO’s suggestion. Lower indoor temperature requirements in winter can save on energy bills. Jiao et al. [12] found that 16.6 °C is the thermal neutral temperature for older people. They found that older people preferred neutral thermal environments and they were not sensitive to temperature changes. Different studies reported different comfort temperatures for older people. For example, Li et al. [25] found 20.5 °C to be the comfort temperature for older people in winter in Mongolia, while they found the thermal expectation to be 21.1 °C.

6.2. Thermal Comfort

The indoor, outdoor and comfort temperature of older people were analysed using the information provided in the research documents listed in Table 1. Limited research discusses the Predicted Mean Vote (PMV) model suggesting lower PMV in winter and higher in summer. For example, Yang et al. [11] found that the PMV in the cooling season was 0.62 ± 0.92, mid-season −0.93 ± 0.70 and heating season −1.18 ± 1.14. Mendes et al. [8] found that the PMV in summer was −0.4 and in winter −1.7. Kainaga et al. [27] found that the PMV in summer was 0 (min: −1.9, max: −1.2 and median: 0.00) and in winter −0.5 (min: −2.4, max: 0.9 and median: −0.5).
A significant relationship was found between the indoor temperature of older people’s residences and the outdoor air temperature, as demonstrated in Figure 16. The low outdoor temperatures are related to much higher indoor temperatures, while the higher the outdoor temperature, the closer the value of the indoor temperature approaches to the outdoor temperature. For example, when the outdoor temperature is −2 °C, the indoor temperature is nearly 16 °C, which is 18 °C higher. When the outdoor temperature is 26 °C, the indoor temperature matches it at 26 °C. This suggests that the energy requirement to warm up the space during the cold months is much greater than that for cooling during the warmer months. The equation for this regression analysis is as follows, where Ti is the indoor air temperature and To is the outdoor air temperature:
Ti = 0.38To + 16.4 (N = 68, R2 = 0.56, S.E. = 0.042, p < 0.001)
Figure 17 demonstrates a significant relationship between the comfort temperature and indoor air temperature, as the regression line is almost at a 45-degree angle and R2 is 0.87. This equation is more relevant to the warmer months, as the data regarding cooler months are limited. The comfort temperature appears slightly lower than the indoor temperature. For example, when the indoor temperature is 26 °C, the comfort temperature appears to be 25 °C, which is slightly lower. In the following regression equation, Tc represents comfort temperature and Ti represents indoor air temperature.
Tc = 0.62Ti + 8.6 (N = 15, R2 = 0.87, S.E. = 0.068, p < 0.001)
Figure 18 demonstrates a significant relationship between the comfort temperature and the outdoor air temperature. This case also mainly represents the warmer months as there is limited data for the colder months. The comfort temperature ranges between 22.5 °C and 27 °C, which is much higher than the recommended 21 °C. CIBSE [145] considers indoor air temperatures above 26 °C as overheating. Considering that older people are more at risk regarding overheating, it is interesting that these studies found that the comfort temperature of older people is mainly above 25 °C. In the following regression equation, Tc represents comfort temperature and To represents outdoor air temperature. The slope of this line (i.e., 0.23) is lower than that in the European standard (0.33), which may suggest that older subjects are likely to be less sensitive to outdoor temperature changes than are younger subjects.
Tc = 0.23To + 19.6 (N = 15, R2 = 0.57, S.E. = 0.054, p = 0.001)
The range of comfort temperature is quite limited (5 °C), while the outdoor air temperature has a much wider range (14 °C), covering winter and summer outdoor conditions. During cooler outdoor temperatures, lower comfort temperatures (e.g., 23 °C) are reported. In contrast, during warmer outdoor temperatures, higher comfort temperatures (e.g., 26 °C) are reported. As established in Figure 16, indoor and outdoor air temperatures are significantly related, but much wider due to the limited number of studies that provided comfort temperature.

6.3. Adaptive Behaviour

Limited studies were found on the adaptive behaviour of older people and hardly any study focuses on developing or testing of Personal Comfort Systems for older people. Shahzad et al. [131] found that when a variety of thermal control systems are available, older people operate them with care and according to the severity of the thermal conditions. They were observed to be conscious of the energy demand of the system rather than using all available thermal controls at the same time. They adopt passive strategies, such as clothing adaptation and window adjustments as much as possible. When faced with higher temperatures, they used fans and, in case needed, they use mechanical ventilation systems, while closing the windows. Hwang and Chen [5] also found that, despite the availability of air-conditioning, significant adaptive comfort behaviours were adopted by older people in residential buildings, such as openable windows, fans and clothing layer adjustments. Jiao et al. [12] found significant use of similar adaptive behaviours by older people in free-running care homes.

7. Conclusions

Thermal comfort for vulnerable people is not a luxury, rather, it is a matter of life and death. Careful consideration and further research are needed on the matter, particularly considering the expected extreme weather conditions due to climate change; the increasing cost of heating and cooling, fuel poverty and fuel stress, due to energy crisis; potential future pandemics and other concerns. Through a systematic review and analysis of the open access data and extracted data from the papers published in the field, we made the following key findings:
  • Older people can be considered as vulnerable and at risk from extremes and changes in the thermal environment.
  • Thermal comfort is related to the health of older people. It is a significant risk factor in the morbidity and mortality of older people when they are exposed to extreme weather conditions.
  • Thermal comfort researchers consider different starting points for the age of older people, varying between 55 and 70+ years old, as demonstrated in Table 1. However, the thermal requirements of a 55-year-old can be considerably different from that of a 70-year-old.
  • The recommendations for the upper limit of indoor air temperature varies between the WHO, CIBSE and ASHRAE. In some cases, no age categories are provided, while the requirements of an 80-year-old person may be significantly different from that of a 20-year-old person. Also, the WHO’s recommendation for older people is quite old and applies worldwide, without taking into account regional climatic considerations. Thermal comfort standards do not suitably apply to older people.
  • Studies found that older people can be comfortable at 18 °C and slightly lower indoor air temperatures [12,16], which is less than the lower band of thermal comfort and the WHO’s recommendation.
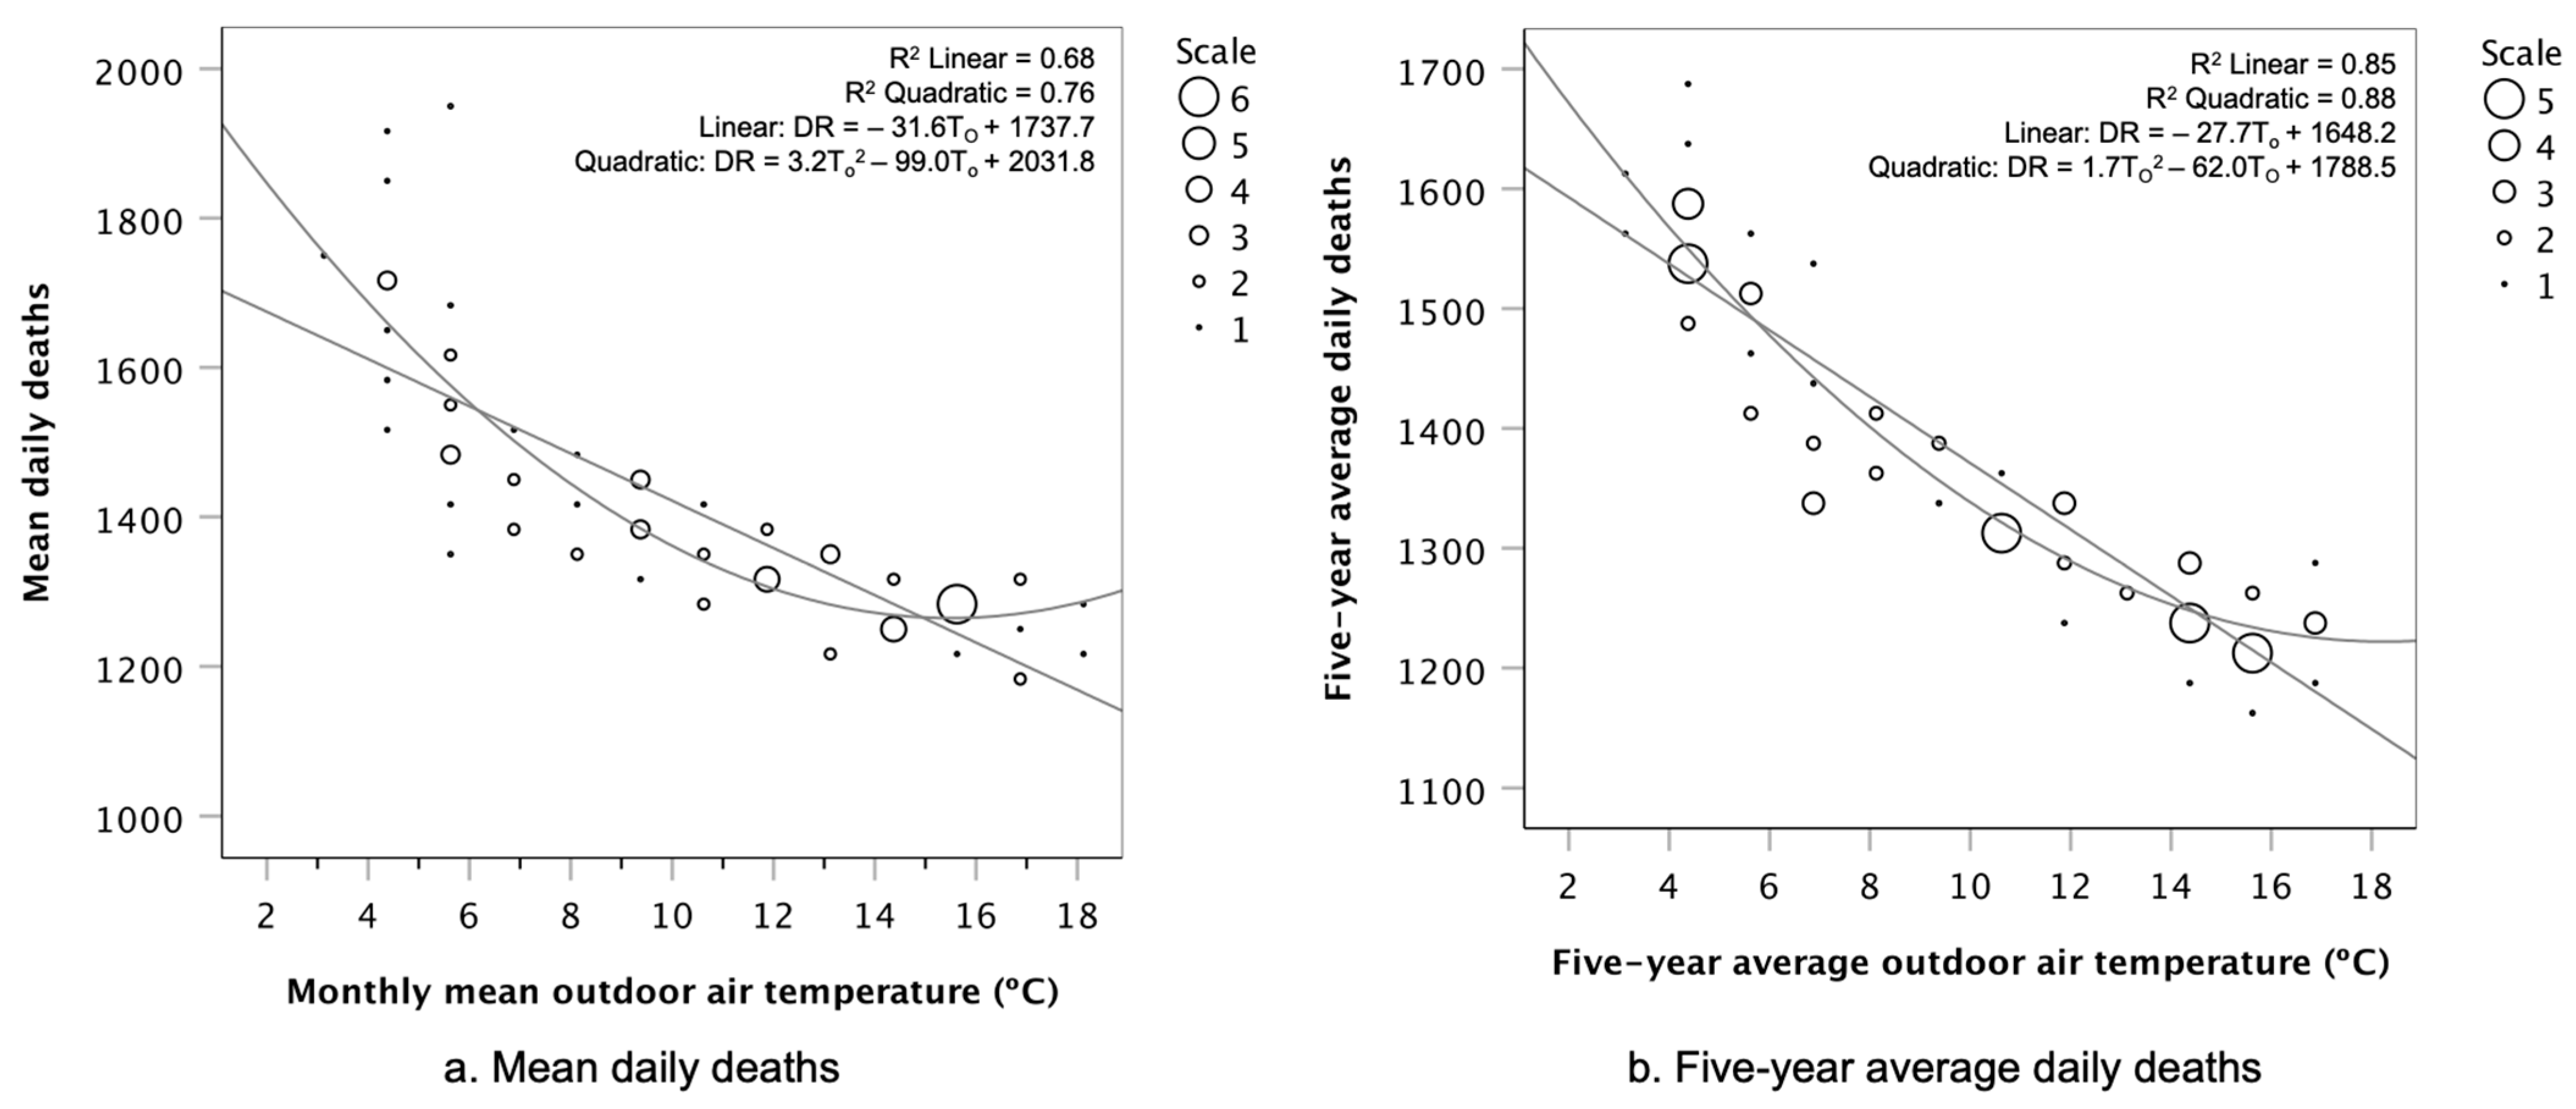
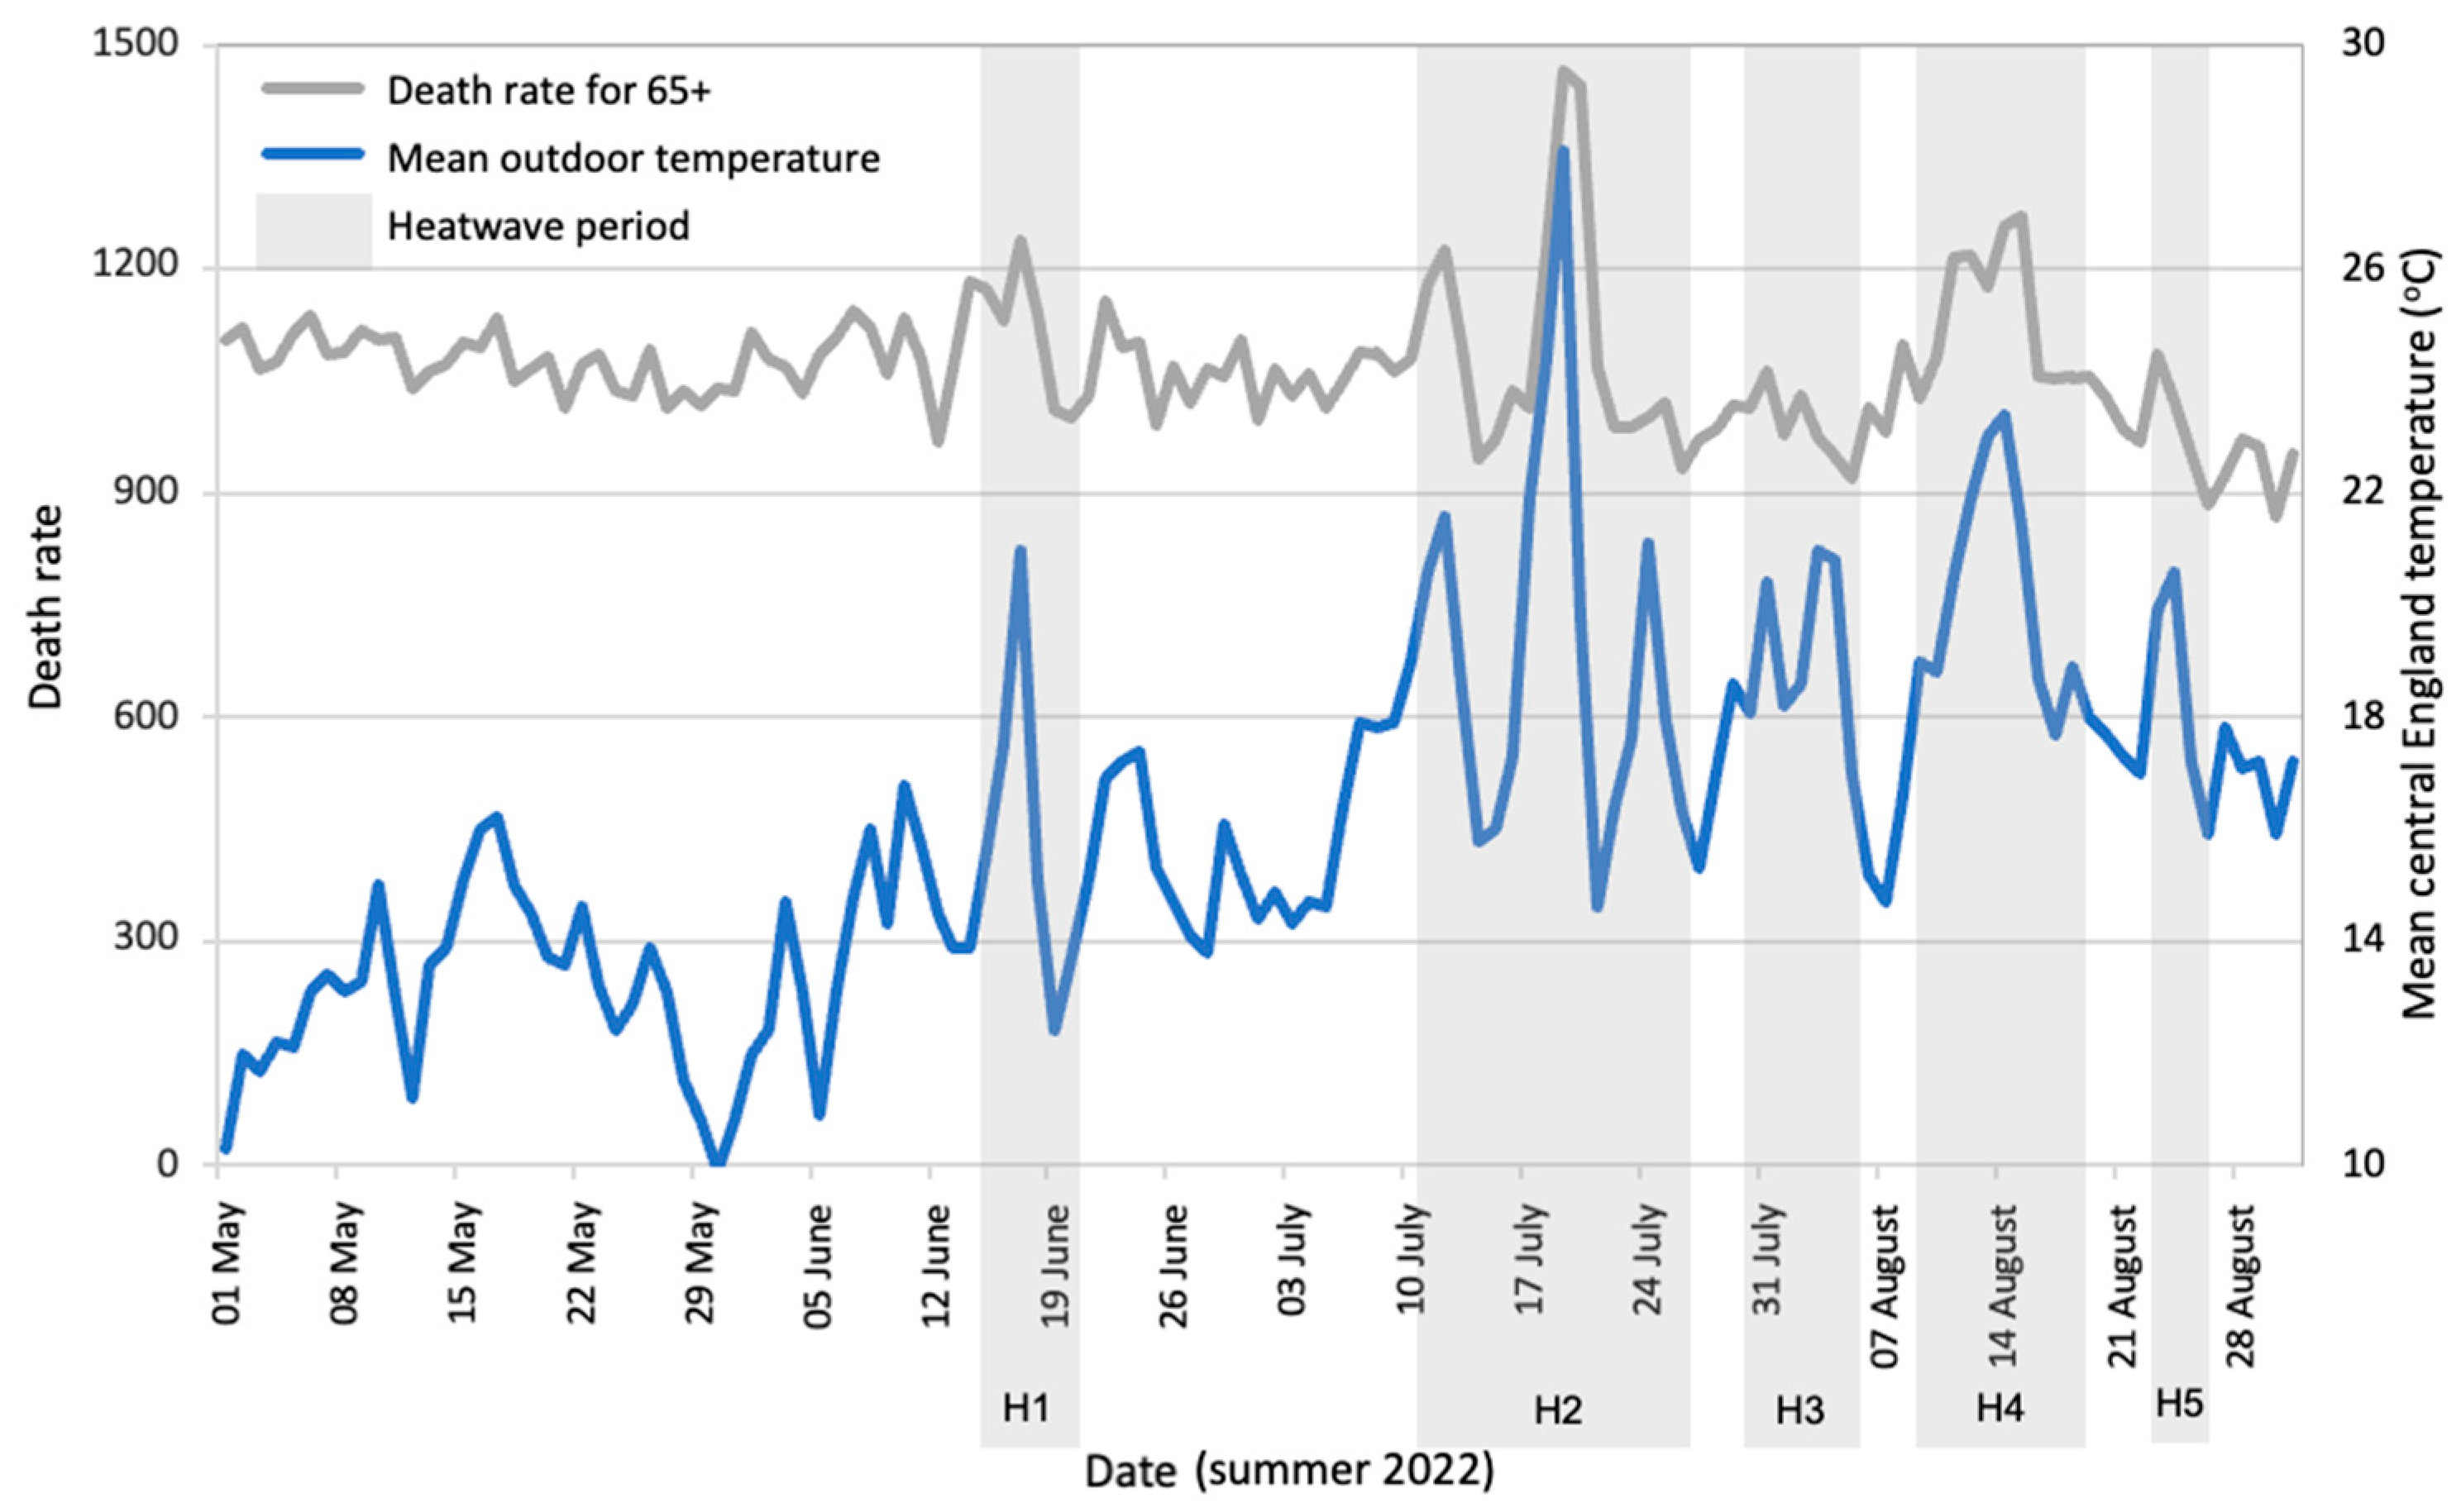
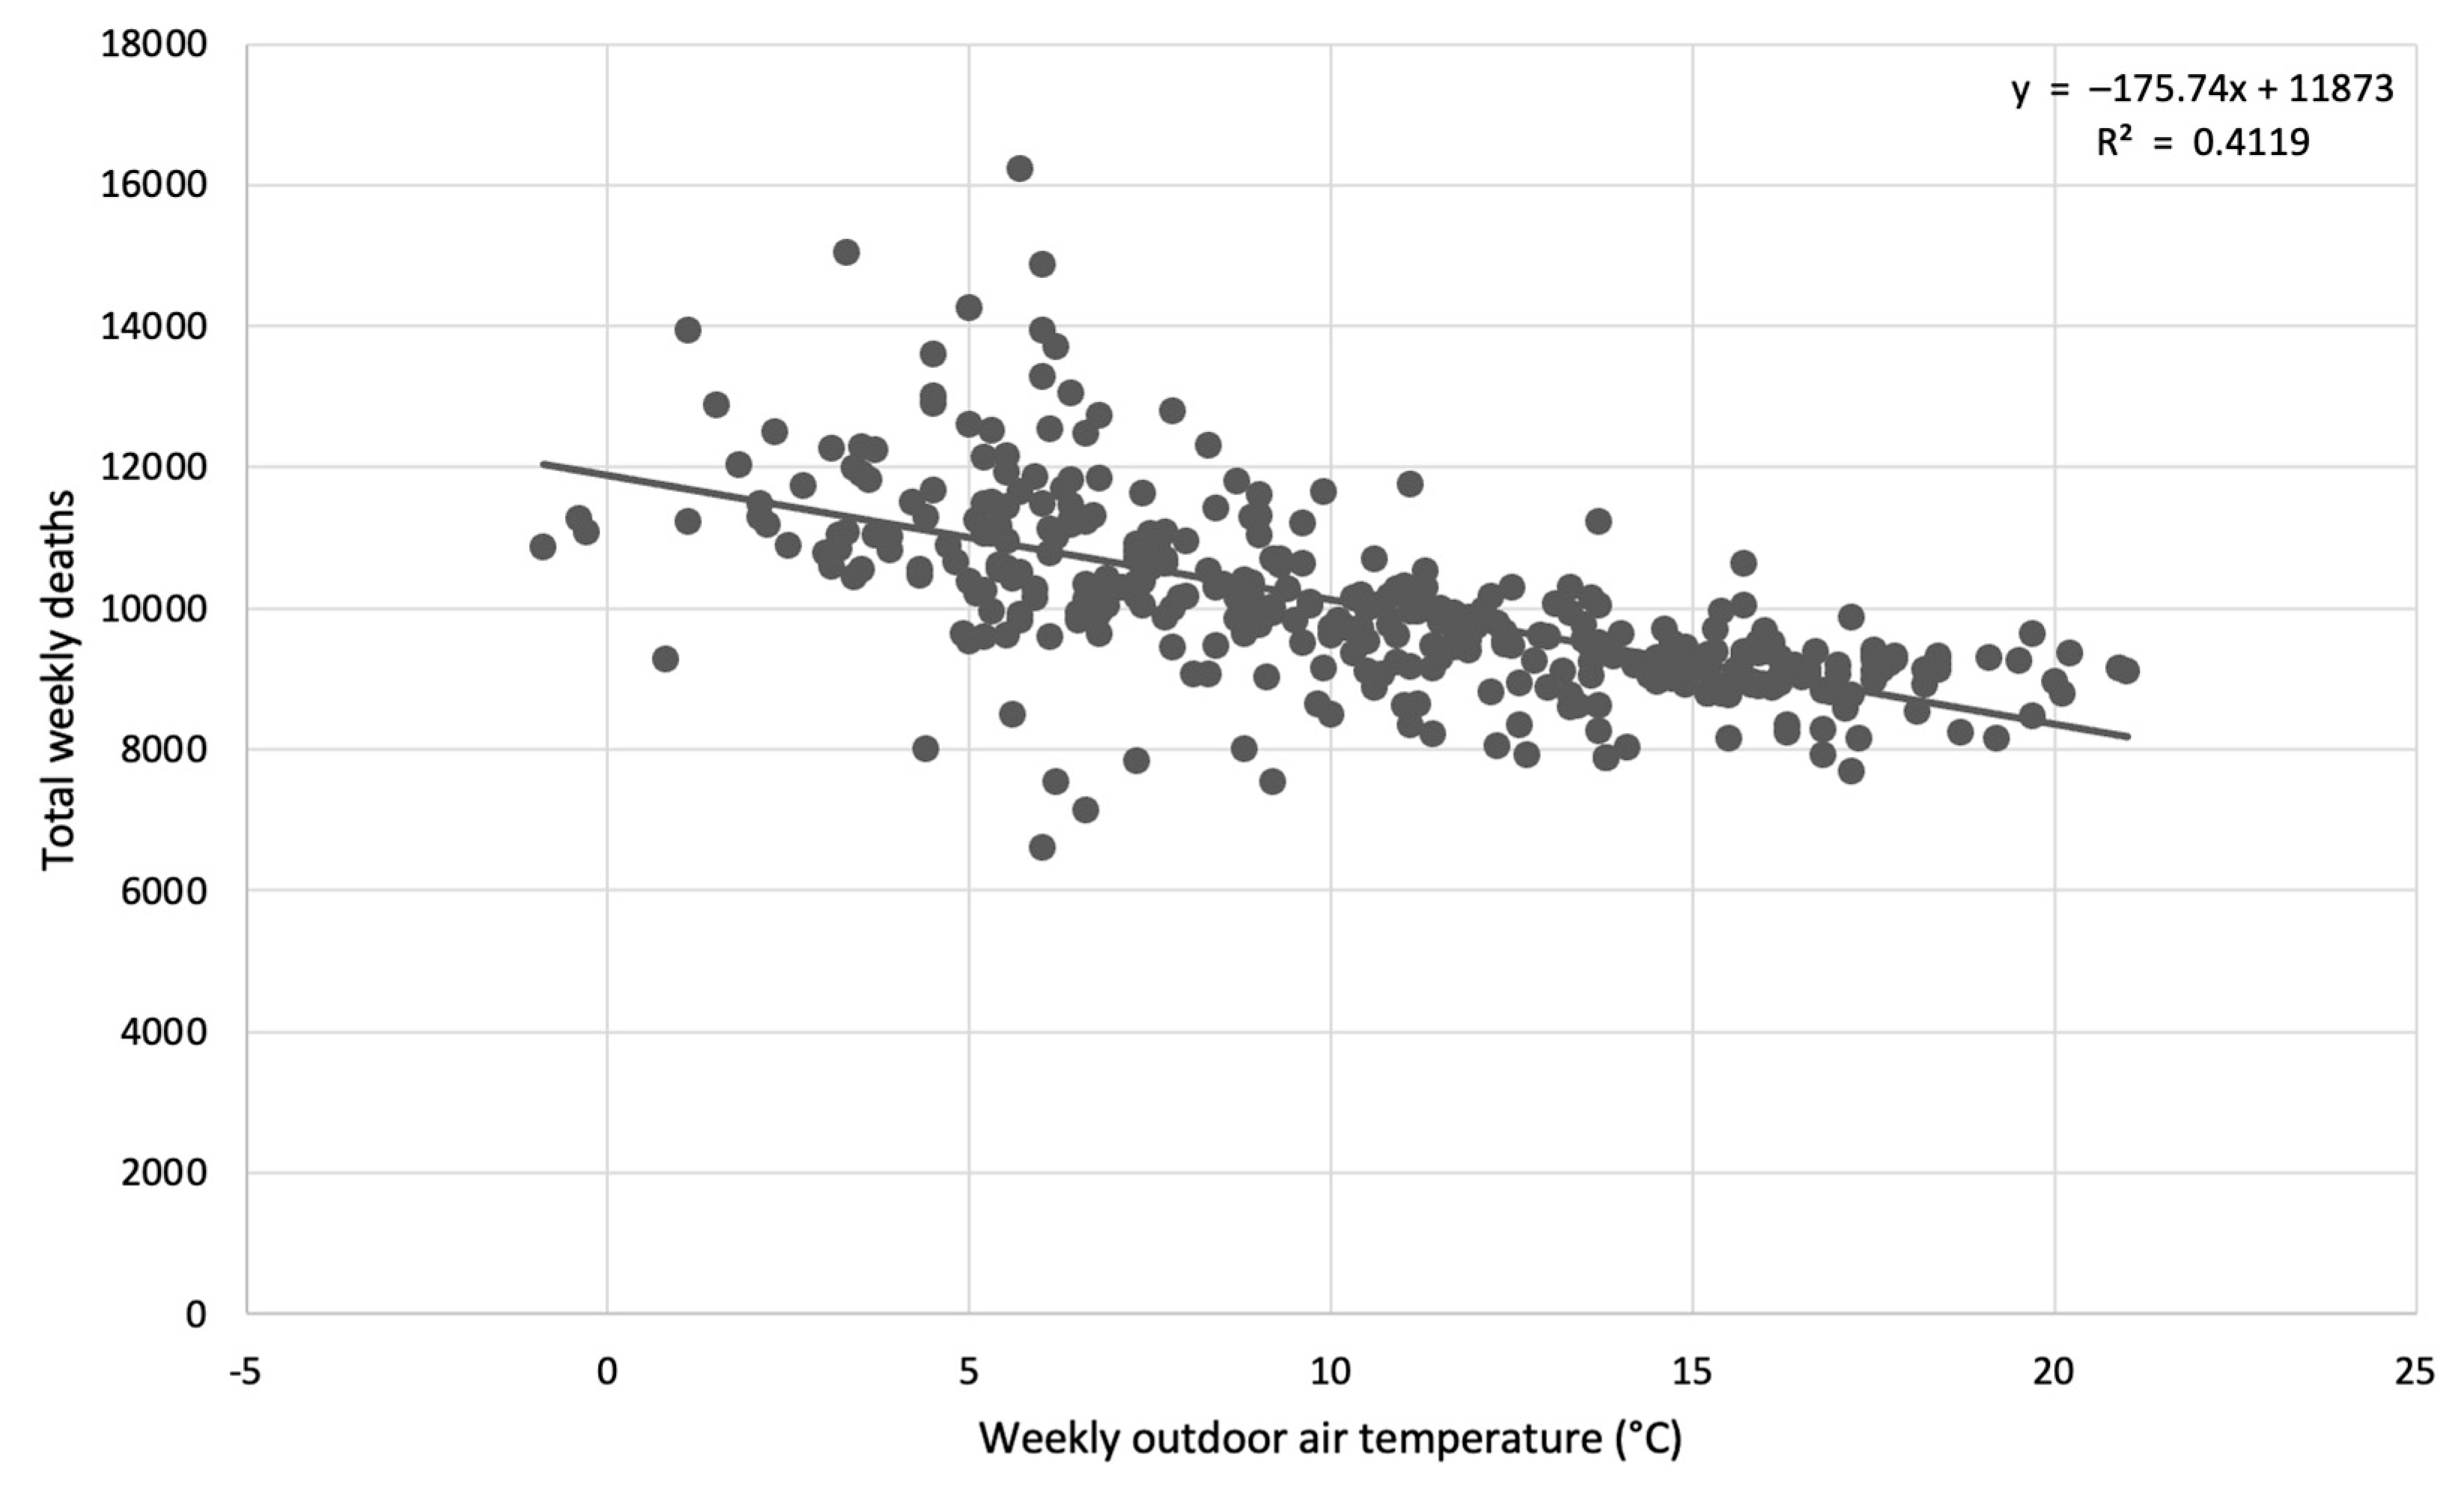
  • A significant relationship was found between cold (below 5 °C) outdoor air temperatures and mortality in older people, particularly for those over 85 years old in the UK (based on the analysis of open data). Thermal conditions can be the direct and indirect cause of death up to two weeks after a cold spell or overheating occurs, which leads to up to 175 deaths per degree temperature change.
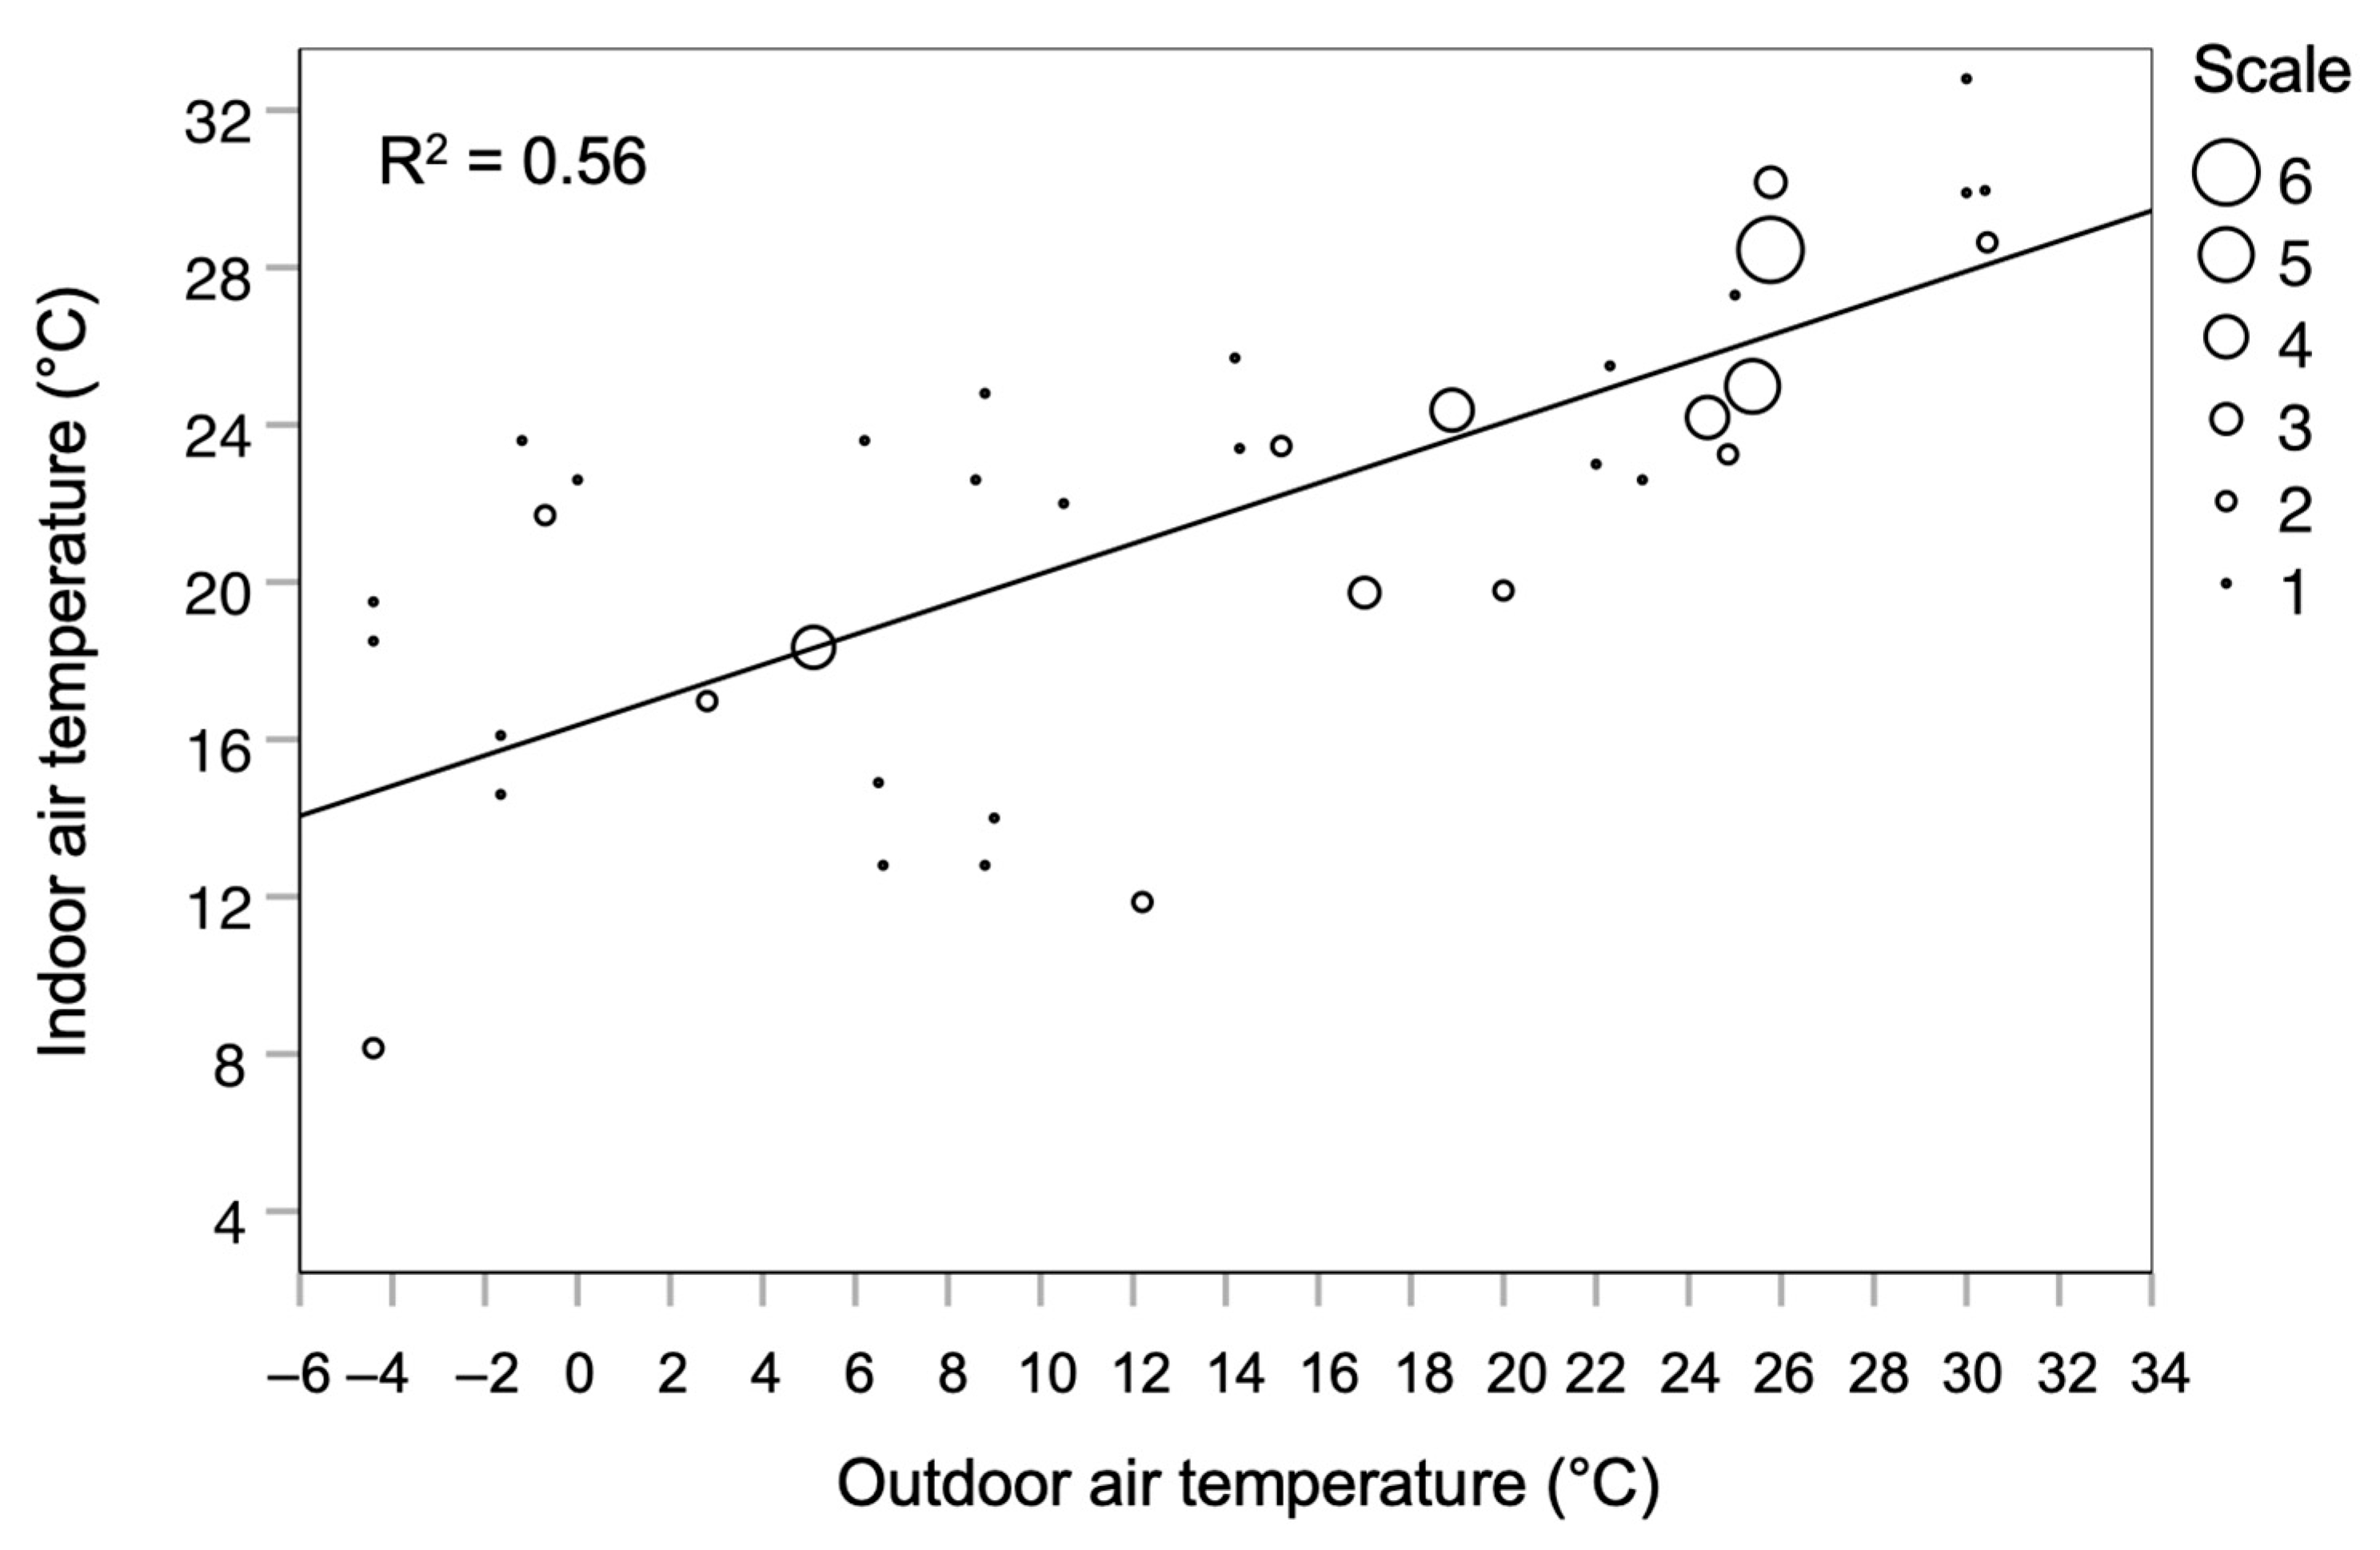
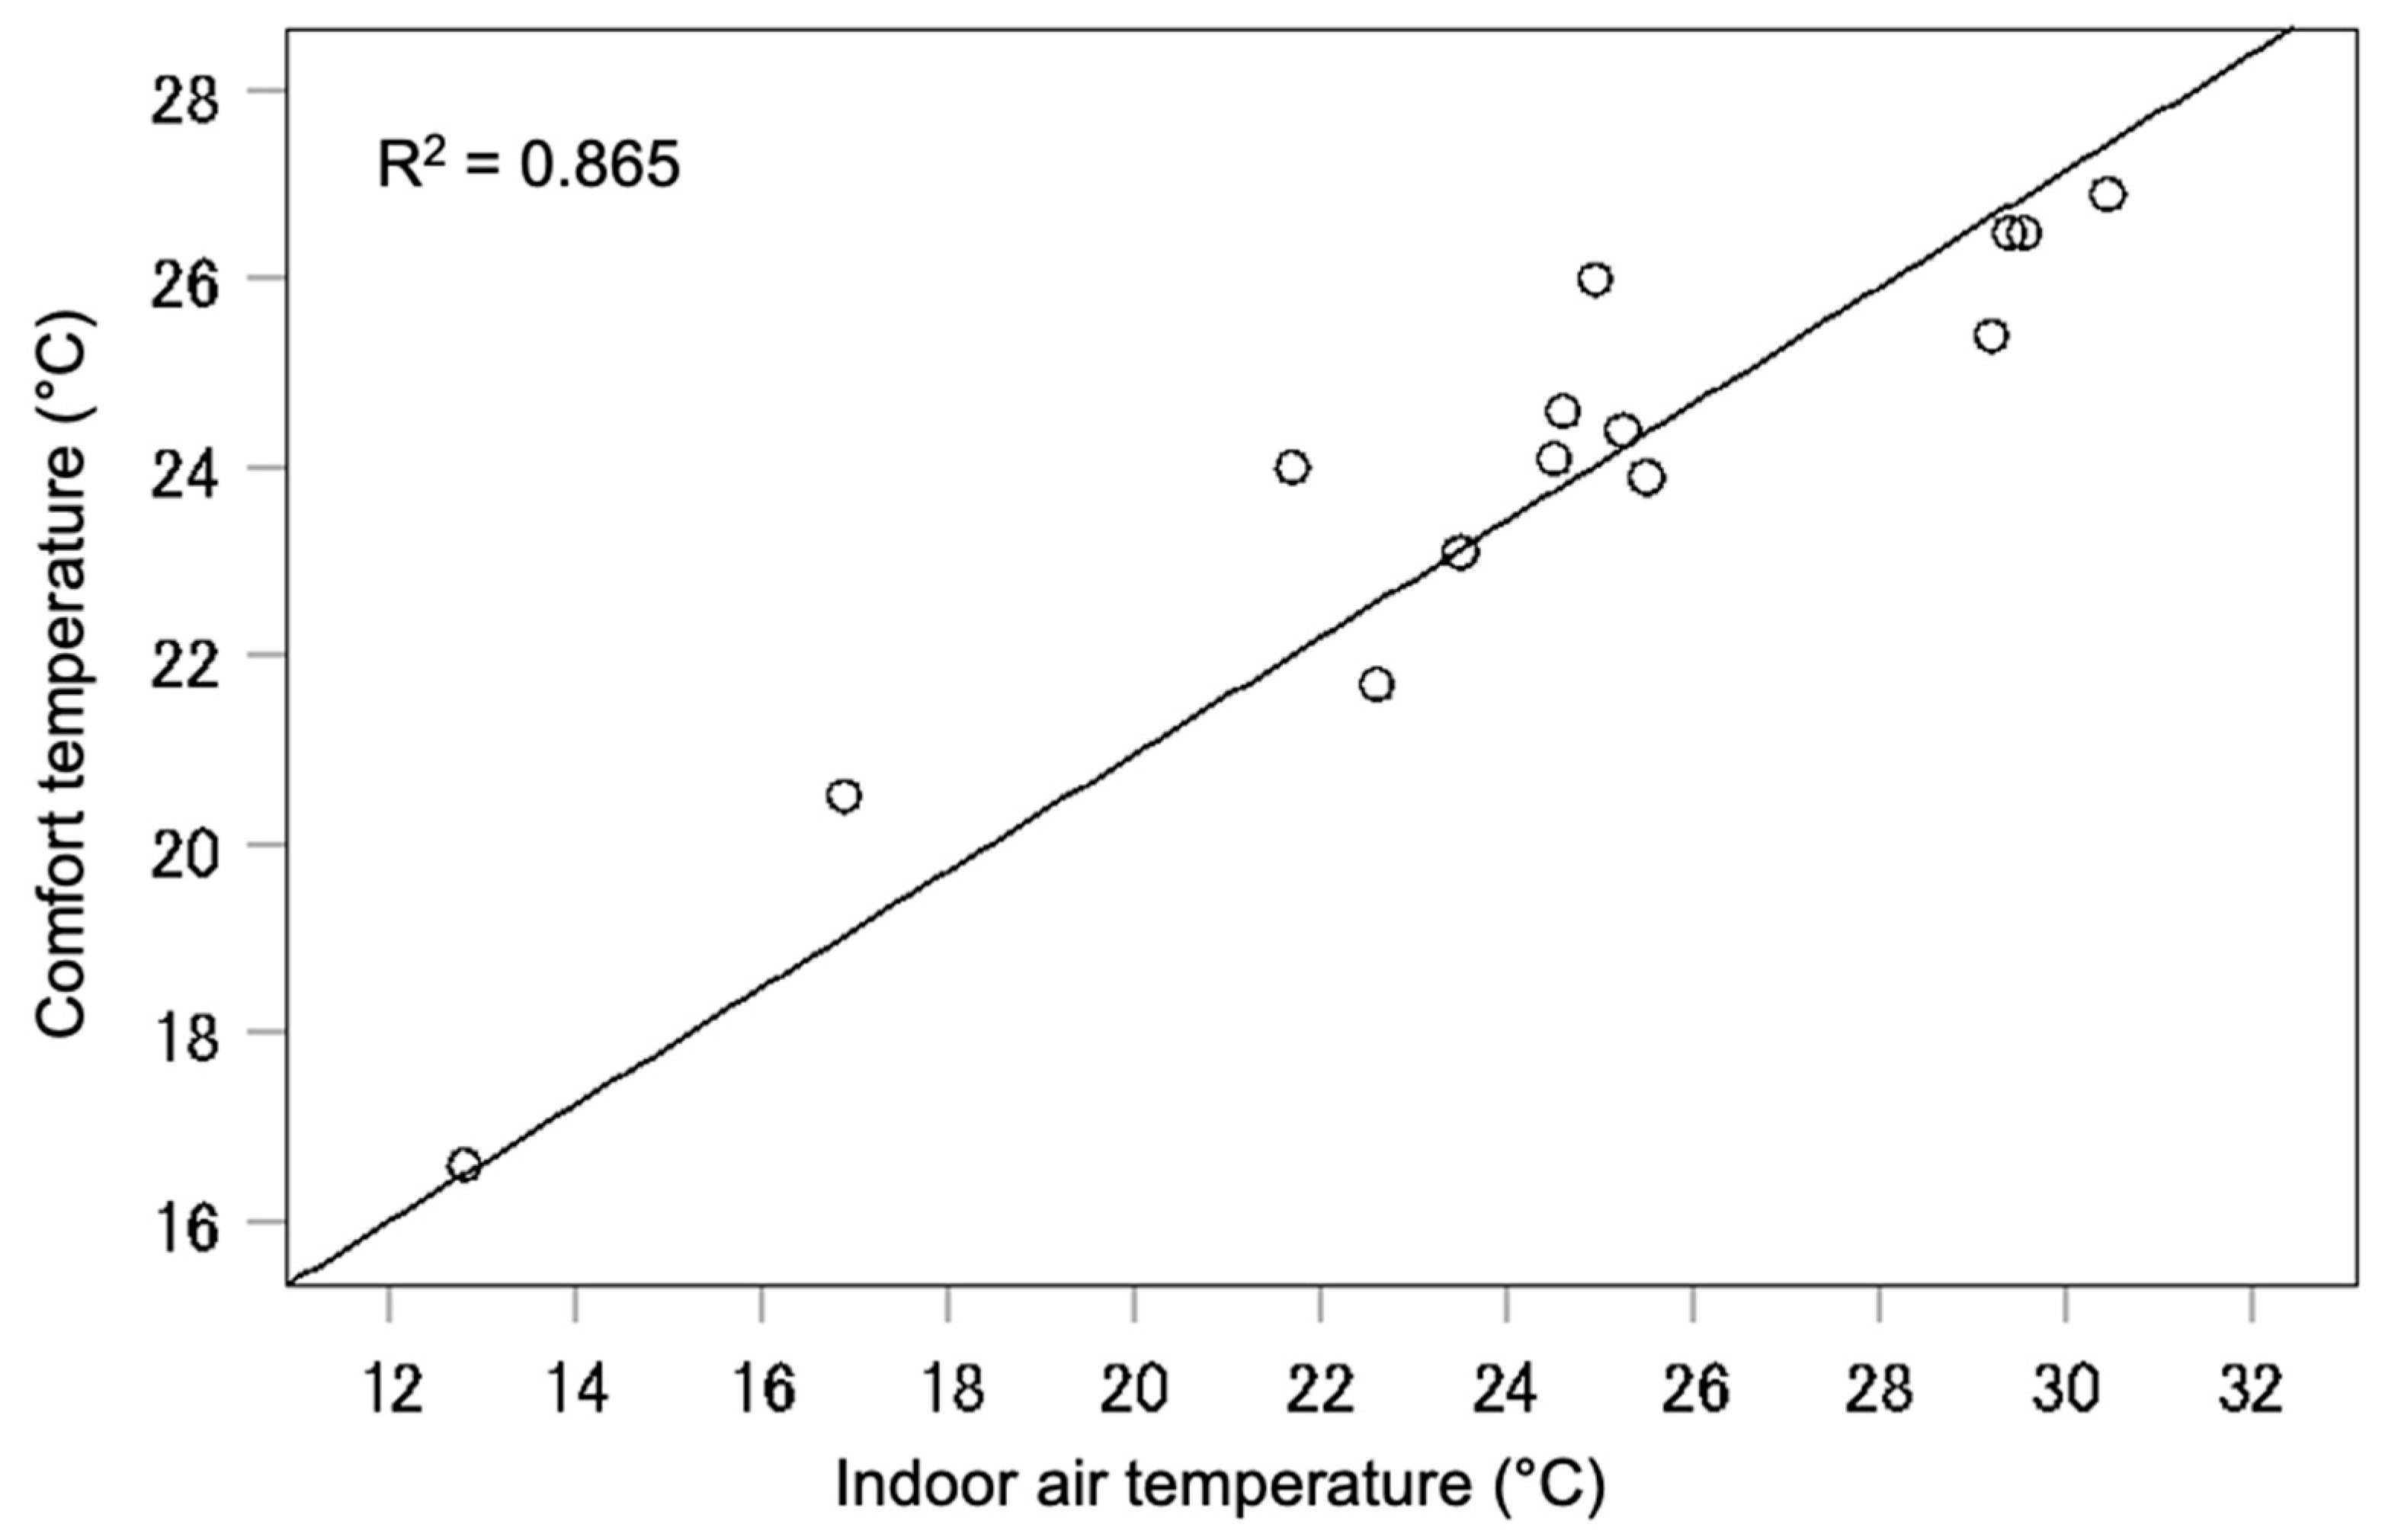
  • Indoor and outdoor air temperatures for older people’s residences are significantly related. In low outdoor temperatures, the difference between the two is significant, while at higher outdoor temperatures they match. Similar results are found between comfort temperature and indoor air temperature. Thus, the energy requirement to warm up the space during the cold months is much greater than that for cooling during the warmer months.
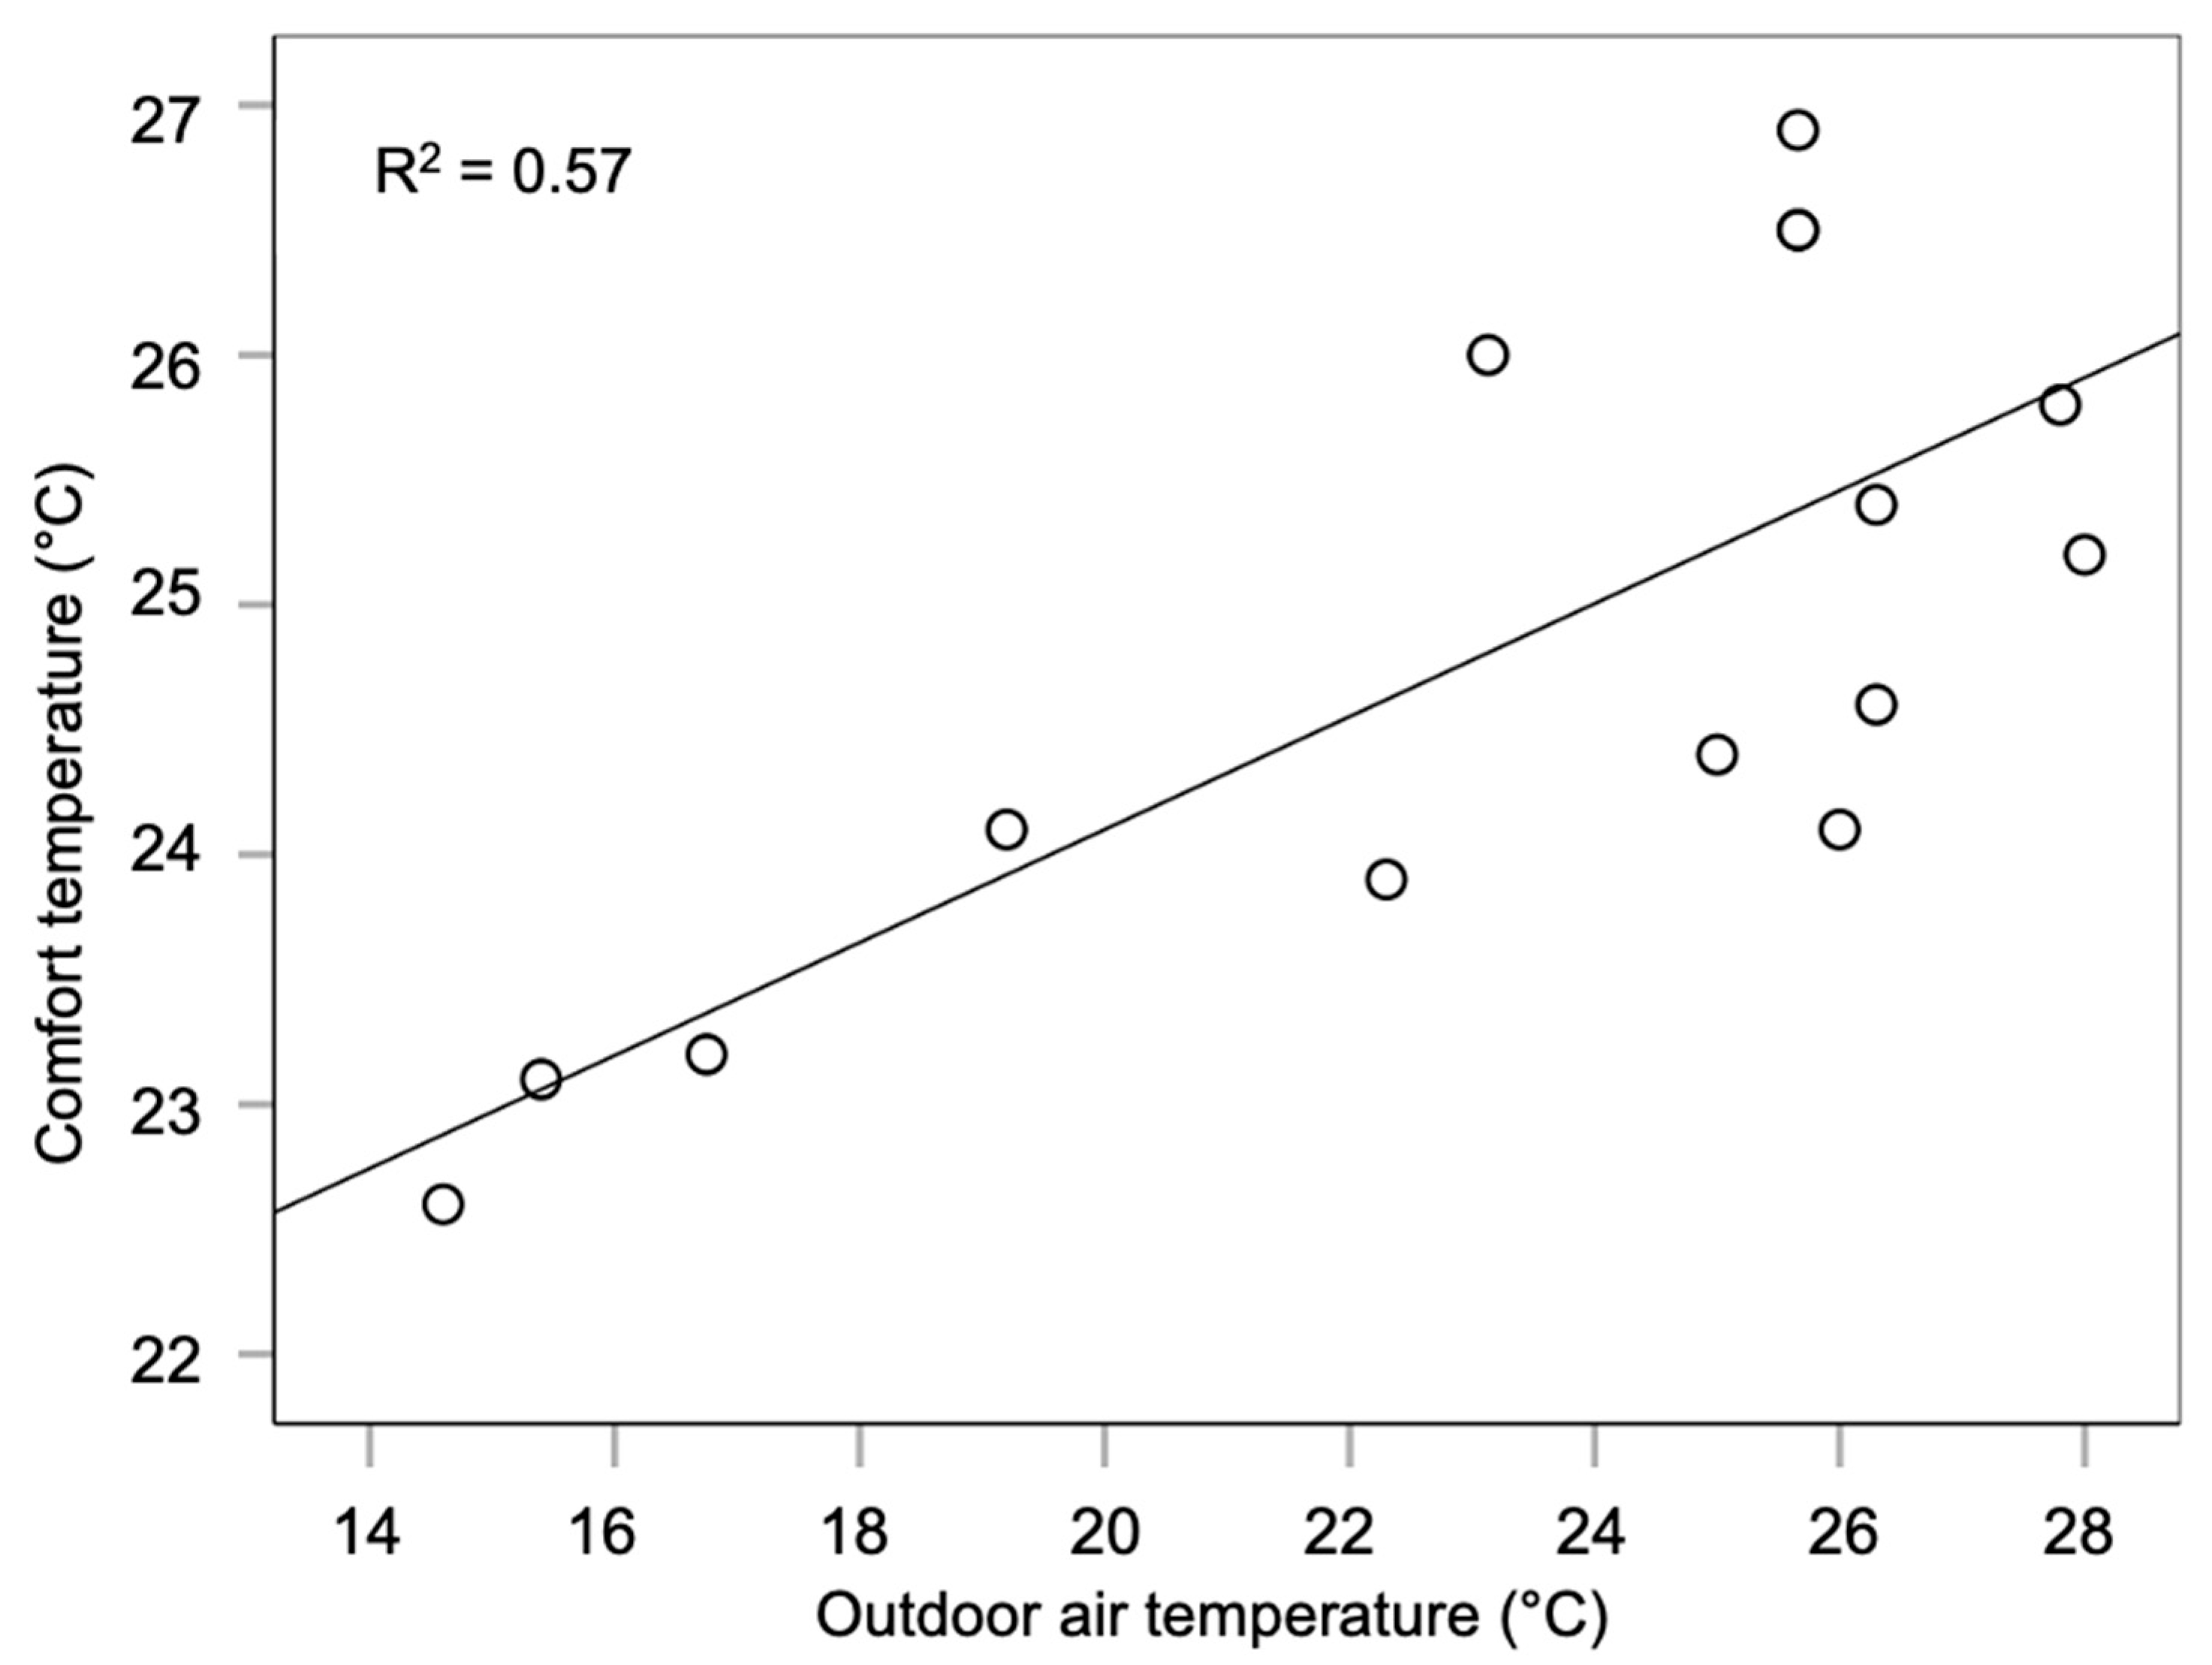
  • Analysis of the data provided by limited research suggests the indoor comfort temperature for older people ranges between 22.5 and 27 °C in natural ventilation mode, which is higher than the vague WHO acceptable temperature range of 20 to 21 °C. However, some researchers found 18 °C to be comfortable for older people during the winter, which can lead to energy saving. Every degree of lowering the set point of the indoor air temperature leads to 10% energy saving in the building [151], resulting in a significant energy saving in the building [152].

7.1. Recommendations and Future Research

  • “Older people” is the suitable terminology to be used for inclusivity reasons. “Elderly” is commonly used in thermal comfort research, but it is sometimes considered an offensive and exclusive language. Terminologies, such as “aged people” and “senior” are also inappropriate.
  • Currently, there is a disparity regarding the starting age at which people are considered to be “older people” among researchers, governmental organisations and others. Physiology, thermal sensitivity, retirement age and other factors indicate different starting ages and, often, altering ones. Thus, further research is needed to determine the starting age or period for people to be considered “older people” particularly in thermal comfort research.
  • Further research is needed to examine the thermal vulnerabilities and requirements of older people in different cultures, climatic regions and financial and fuel poverty-related areas, and differences in health, physiology and other factors. This may influence the starting point for the age of older people and age categories.
  • In the current thermal comfort research, age categories are not considered for older people, though the thermal needs of people change as they age. Research is needed to define these age categories, such as those defined by Bytheway [51] as young-old (65–74 years old), middle-old (75–84 years old) and old-old (85+ years old).
  • There is limited research on the thermal comfort requirements of older people regarding their sleep. The quality and quantity of sleep is significantly related to restoration and regeneration, which is much needed in older age.
  • There is a lack of research on gender differences in thermal comfort requirements for older people, particularly related to menopause.
  • There is limited research on acceptable, comfortable and preferred thermal ranges for older people.
  • There is a lack of research on adaptive thermal behaviours, the availability of environmental control and the development and testing of Personal Comfort Systems for older people.

7.2. Possible Other Concersns

  • This paper considers temperature to be the major dependent for thermal comfort and discomfort. Other components such as air movement and humidity can be important, and their effects should be investigated separately or together.
  • What are the implications of the findings for the design of buildings for older people?

Funding

This research received no external funding.

Data Availability Statement

The open access data from the UK Government, including Office for National Statistics (ONS) (https://www.ons.gov.uk/) and Met Office Mean Central England Temperature (CET) (https://www.metoffice.gov.uk/) from 2013 to 2023 was used.

Acknowledgments

The authors acknowledge the work of all authors mentioned in this work and their published work, as well as the UK government open access data, which enable authors to analyse the data to draw conclusions related to thermal comfort field.

Conflicts of Interest

The authors declare no conflict of interest.

References

  1. Lim, C.L.; Byrne, C.; Lee, J.K. Human thermoregulation and measurement of body temperature in exercise and clinical settings. Ann. Acad. Med. Singap. 2008, 37, 347. [Google Scholar]
  2. Morrison, S.F.; Nakamura, K. Central neural pathways for thermoregulation. Front. Biosci. A J. Virtual Libr. 2011, 16, 74. [Google Scholar] [CrossRef] [PubMed]
  3. Ohnaka, T.; Tochihara, Y.; Tsuzuki, K.; Nagai, Y.; Tokuda, T.; Kawashima, Y. Preferred temperature of the elderly after cold and heat exposures determined by individual self-selection of air temperature. J. Therm. Biol. 1993, 18, 349–353. [Google Scholar]
  4. Wong, L.T.; Fong, K.N.K.; Mui, K.W.; Wong, W.W.Y.; Lee, L.W. A field survey of the expected desirable thermal environment for older people. Indoor Built Environ. 2009, 18, 336–345. [Google Scholar]
  5. Hwang, R.L.; Chen, C.P. Field study on behaviors and adaptation of elderly people and their thermal comfort requirements in residential environments. Indoor Air 2010, 20, 235–245. [Google Scholar]
  6. Schellen, L.; van Marken Lichtenbelt, W.D.; Loomans, M.G.; Toftum, J.; De Wit, M.H. Differences between young adults and elderly in thermal comfort, productivity, and thermal physiology in response to a moderate temperature drift and a steady-state condition. Indoor Air 2010, 20, 273–283. [Google Scholar]
  7. Mendes, A.; Pereira, C.; Mendes, D.; Aguiar, L.; Neves, P.; Silva, S.; Batterman, S.; Teixeira, J.P. Indoor air quality and thermal comfort—Results of a pilot study in elderly care centers in Portugal. J. Toxicol. Environ. Health Part A 2013, 76, 333–344. [Google Scholar] [CrossRef]
  8. Mendes, A.; Bonassi, S.; Aguiar, L.; Pereira, C.; Neves, P.; Silva, S.; Mendes, D.; Guimarães, L.; Moroni, R.; Teixeira, J.P. Indoor air quality and thermal comfort in elderly care centers. Urban Clim. 2015, 14, 486–501. [Google Scholar]
  9. Bills, R. Cold comfort: Thermal sensation in people over 65 and the consequences for an ageing population. In Proceedings of the 9th International Windsor Conference 2016: Making Comfort Relevant, Windsor, UK, 7–10 April 2016; pp. 156–167. [Google Scholar]
  10. Bills, R.; Soebarto, V.; Williamson, T. Thermal experiences of older people during hot conditions in Adelaide. Revisiting the role of architectural science in design and practice. In Proceedings of the 50th International Conference of the Architectural Science Association, Adelaide, Australia, 7–9 December 2016; pp. 657–664. [Google Scholar]
  11. Yang, J.; Nam, I.; Sohn, J.R. The influence of seasonal characteristics in elderly thermal comfort in Korea. Energy Build. 2016, 128, 583–591. [Google Scholar]
  12. Jiao, Y.; Yu, H.; Wang, T.; An, Y.; Yu, Y. Thermal comfort and adaptation of the elderly in free-running environments in Shanghai, China. Build. Environ. 2017, 118, 259–272. [Google Scholar]
  13. Fan, G.; Xie, J.; Yoshino, H.; Yanagi, U.; Hasegawa, K.; Wang, C.; Zhang, X.; Liu, J. Investigation of indoor thermal environment in the homes with elderly people during heating season in Beijing, China. Build. Environ. 2017, 126, 288–303. [Google Scholar]
  14. Vellei, M.; Ramallo-González, A.P.; Coley, D.; Lee, J.; Gabe-Thomas, E.; Lovett, T.; Natarajan, S. Overheating in vulnerable and non-vulnerable households. Build. Res. Inf. 2017, 45, 102–118. [Google Scholar]
  15. Panraluk, C.; Sreshthaputra, A. Thermal comfort of the elderly in public health service buildings of Thailand. Appl. Mech. Mater. 2018, 878, 173–178. [Google Scholar]
  16. Hughes, C.; Natarajan, S.; Liu, C.; Chung, W.J.; Herrera, M. Winter thermal comfort and health in the elderly. Energy Policy 2019, 134, 110954. [Google Scholar] [CrossRef]
  17. Xiong, J.; Ma, T.; Lian, Z.; de Dear, R. Perceptual and physiological responses of elderly subjects to moderate temperatures. Build. Environ. 2019, 156, 117–122. [Google Scholar]
  18. Lan, L.; Xia, L.; Tang, J.; Zhang, X.; Lin, Y.; Wang, Z. Elevated airflow can maintain sleep quality and thermal comfort of the elderly in a hot environment. Indoor Air 2019, 29, 1040–1049. [Google Scholar]
  19. Forcada, N.; Gangolells, M.; Casals, M.; Tejedor, B.; Macarulla, M.; Gaspar, K. Summer thermal comfort in nursing homes in the Mediterranean climate. Energy Build. 2020, 229, 110442. [Google Scholar] [CrossRef]
  20. Yu, J.; Hassan, M.T.; Bai, Y.; An, N.; Tam, V. A pilot study monitoring the thermal comfort of the elderly living in nursing homes in Hefei, China, using wireless sensor networks, site measurements and a survey. Indoor Built Environ. 2020, 29, 449–464. [Google Scholar]
  21. Forcada, N.; Gangolells, M.; Casals, M.; Tejedor, B.; Macarulla, M.; Gaspar, K. Field study on adaptive thermal comfort models for nursing homes in the Mediterranean climate. Energy Build. 2021, 252, 111475. [Google Scholar]
  22. Larriva, M.T.B.; Mendes, A.S.; Forcada, N. The effect of climatic conditions on occupants’ thermal comfort in naturally ventilated nursing homes. Build. Environ. 2022, 214, 108930. [Google Scholar]
  23. Yao, F.; Fang, H.; Han, J.; Zhang, Y. Study on the outdoor thermal comfort evaluation of the elderly in the Tibetan plateau. Sustain. Cities Soc. 2022, 77, 103582. [Google Scholar]
  24. Yuan, J.; Cong, Y.; Yao, S.; Dai, C.; Li, Y. Research on the thermal comfort of the elderly in rural areas of cold climate, China. Adv. Build. Energy Res. 2022, 16, 612–642. [Google Scholar]
  25. Li, H.; Xu, G.; Chen, J.; Duan, J. Investigating the adaptive thermal comfort of the elderly in rural mutual aid homes in central Inner Mongolia. Sustainability 2022, 14, 6802. [Google Scholar] [CrossRef]
  26. Zheng, W.; Shao, T.; Lin, Y.; Wang, Y.; Dong, C.; Liu, J. A field study on seasonal adaptive thermal comfort of the elderly in nursing homes in Xi’an, China. Build. Environ. 2022, 208, 108623. [Google Scholar]
  27. Kainaga, T.; Sagisaka, K.; Yamada, R.; Nakaya, T. A case study of a nursing home in Nagano, Japan: Field survey on thermal comfort and building energy simulation for future climate change. Energies 2022, 15, 936. [Google Scholar] [CrossRef]
  28. Zheng, G.; Wei, C.; Li, K. Determining the summer indoor design parameters for pensioners’ buildings based on the thermal requirements of elderly people at different ages. Energy 2022, 258, 124854. [Google Scholar]
  29. Jiao, Y.; Yu, Y.; Yu, H.; Wang, F. The impact of thermal environment of transition spaces in elderly-care buildings on thermal adaptation and thermal behavior of the elderly. Build. Environ. 2022, 228, 109871. [Google Scholar]
  30. Zong, H.; Wang, J.; Zhou, T.; Sun, J.; Chen, X. The influence of transient changes in indoor and outdoor thermal comfort on the use of outdoor space by older adults in the nursing home. Buildings 2022, 12, 905. [Google Scholar] [CrossRef]
  31. Yoon Yi, C.; Childs, C.; Peng, C.; Robinson, D. Thermal comfort modelling of older people living in care homes: An evaluation of heat balance, adaptive comfort, and thermographic methods. Build. Environ. 2022, 207, 108550. [Google Scholar]
  32. Baquero, M.T.; Forcada, N. Thermal comfort of older people during summer in the continental Mediterranean climate. J. Build. Eng. 2022, 54, 104680. [Google Scholar]
  33. Walker, M. Why We Sleep: The New Science of Sleep and Dreams; Penguin: London, UK, 2017. [Google Scholar]
  34. Raymann, R.J.; Van Someren, E.J. Diminished capability to recognize the optimal temperature for sleep initiation may contribute to poor sleep in elderly people. Sleep 2008, 31, 1301–1309. [Google Scholar] [PubMed]
  35. Okamoto-Mizuno, K.; Tsuzuki, K. Effects of season on sleep and skin temperature in the elderly. Int. J. Biometeorol. 2010, 54, 401–409. [Google Scholar] [PubMed]
  36. Tsuzuki, K.; Mori, I.; Sakoi, T.; Kurokawa, Y. Effects of seasonal illumination and thermal environments on sleep in elderly men. Build. Environ. 2015, 88, 82–88. [Google Scholar]
  37. Xia, L.; Lan, L.; Tang, J.; Wan, Y.; Lin, Y.; Wang, Z. Bed heating improves the sleep quality and health of the elderly who adapted to no heating in a cold environment. Energy Build. 2020, 210, 109687. [Google Scholar]
  38. Tsuzuki, K.; Sakoi, T.; Sakata, Y. Effect of seasonal ambient temperature on sleep and thermal comfort in older people living in public elderly facilities. Buildings 2021, 11, 574. [Google Scholar] [CrossRef]
  39. Kido, C.; Kubo, H.; Azuma, M.; Sassa, N.; Hoshino, S.; Isoda, N. A field study on the thermal environments of bedrooms and the sleep quality of elderly people in summer in the urban and rural areas of Nara Prefecture. J. Hum. Environ. Syst. 2022, 25, 31–42. [Google Scholar]
  40. Yan, Y.; Lan, L.; Zhang, H.; Sun, Y.; Fan, X.; Wyon, D.P.; Wargocki, P. Association of bedroom environment with the sleep quality of elderly subjects in summer: A field measurement in Shanghai, China. Build. Environ. 2022, 208, 108572. [Google Scholar]
  41. Yan, Y.; Zhang, H.; Kang, M.; Lan, L.; Wang, Z.; Lin, Y. Experimental study of the negative effects of raised bedroom temperature and reduced ventilation on the sleep quality of elderly subjects. Indoor Air 2022, 32, e13159. [Google Scholar]
  42. North Tyneside Age UK. Is ‘Elderly’ Offensive? 2019. Available online: https://www.ageuk.org.uk/northtyneside/about-us/news/articles/2019/offensive-description-of-older-people/ (accessed on 2 February 2023).
  43. World Health Organization. Quick Guide to Avoid Ageism in Communication. 2021. Available online: https://www.who.int/publications/m/item/quick-guide-to-avoid-ageism-in-communication (accessed on 23 February 2025).
  44. Centre for Ageing Better. Challenging Ageism: A Guide to Talking About Ageing and Older Age. 2021. Available online: https://ageing-better.org.uk/sites/default/files/2021-12/Challenging-ageism-guide-talking-ageing-older-age.pdf (accessed on 23 February 2025).
  45. Morrison, S. Don’t Call Me “Old”: Avoiding Ageism When Writing About Aging; National Institute on Aging: Bethesda, MD, USA, 2023. [Google Scholar]
  46. Chen, M.; Kosonen, R.; Kilpeläinen, S.; Ming, R. A review of thermal comfort modeling of elderly people. In Proceedings of the CLIMA2022: The 14 REHVA World Congress, Rotterdam, The Netherlands, 22–25 May 2022. [Google Scholar]
  47. Zhou, S.; Li, B.; Du, C.; Liu, H.; Wu, Y.; Hodder, S.; Chen, M.; Kosonen, R.; Ming, R.; Ouyang, L.; et al. Opportunities and challenges of using thermal comfort models for building design and operation for the elderly: A literature review. Renew. Sustain. Energy Rev. 2023, 183, 113504. [Google Scholar]
  48. Guergova, S.; Dufour, A. Thermal sensitivity in the elderly: A review. Ageing Res. Rev. 2011, 10, 80–92. [Google Scholar] [CrossRef]
  49. Butler, R.N. Why Survive? Being Old in America; Harper & Row: New York, NY, USA, 1975. [Google Scholar]
  50. Johnson, J.; Bytheway, B. Ageism: Concept and definition. In Ageing and Later Life; Johnson, J., Slater, R., Eds.; Sage Publications: Thousand Oaks, CA, USA, 1993. [Google Scholar]
  51. Bytheway, B. Ageism and age categorization. J. Soc. Issues 2005, 61, 361–374. [Google Scholar] [CrossRef]
  52. Barnes, J.N.; Charkoudian, N. Integrative cardiovascular control in women: Regulation of blood pressure, body temperature and cerebrovascular responsiveness. FASEB J. 2020, 35, e21143. [Google Scholar] [CrossRef] [PubMed]
  53. ONS. Mortality in England and Wales: Past and Projected Trends in Average Lifespan; Office for National Statistics, UK Government: Newport, UK, 2022.
  54. UN. Life Expectancy at Birth for Both Sexes Combined (Years). World Population Prospects: The 2024 Revision. UN Data: A World of Information; United Nations Population Division: New York, NY, USA, 2024. [Google Scholar]
  55. Hobson, F. State Pension age review. In Research Briefing No. 06546; UK Parliament: London, UK, 2022. [Google Scholar]
  56. Department for Work and Pensions. Autumn Statement Announcement on a Core Principle Underpinning Future State Pension Age Rises: DWP Background Note; UK Government: London, UK, 2013.
  57. OECD. Pensions at a Glance 2021: OECD and G20 Indicators; Organisation for Economic Co-Operation and Development: Paris, France, 2021. [Google Scholar]
  58. Healy, J.D. Excess winter mortality in Europe: A cross country analysis identifying key risk factors. J. Epidemiol. Community Health 2003, 57, 784–789. [Google Scholar] [CrossRef] [PubMed]
  59. Beniston, M.; Stephenson, D.B.; Christensen, O.B.; Ferro, C.A.T.; Frei, C.; Goyette, S.; Halsnaes, K.; Holt, T.; Jylhä, K.; Koffi, B.; et al. Future extreme events in European climate: An exploration of regional climate model projections. Clim. Change 2007, 81, 71–95. [Google Scholar] [CrossRef]
  60. IPCC. Summary for Policymakers. In Global Warming of 1.5 °C. An IPCC Special Report on the Impacts of Global Warming of 1.5 °C Above Pre-Industrial Levels and Related Global Greenhouse Gas Emission Pathways, in the Context of Strengthening the Global Response to the Threat of Climate Change, Sustainable Development, and Efforts to Eradicate Poverty; Masson-Delmotte, V., Zhai, P., Pörtner, H.O., Roberts, D., Skea, J., Shukla, P.R., Pirani, A., Moufouma-Okia, W., Péan, C., Pidcock, R., et al., Eds.; Cambridge University Press: Cambridge, UK, 2018; pp. 3–24. [Google Scholar]
  61. Basu, R.; Samet, J.M. Relation between elevated ambient temperature and mortality: A review of the epidemiologic evidence. Epidemiol. Rev. 2002, 24, 190–202. [Google Scholar] [CrossRef]
  62. Bunker, A.; Wildenhain, J.; Vandenbergh, A.; Henschke, N.; Rocklöv, J.; Hajat, S.; Sauerborn, R. Effects of air temperature on climate-sensitive mortality and morbidity outcomes in the elderly; A systematic review and meta-analysis of epidemiological evidence. EBioMedicine 2016, 6, 258–268. [Google Scholar] [CrossRef]
  63. Climate Change Committee. Heat and Preventable Deaths in the Health and Social care System. 2019 UK. Available online: https://www.theccc.org.uk/wp-content/uploads/2019/07/Outcomes-Heat-preventable-deaths-case-study.pdf (accessed on 1 March 2024).
  64. Pallubinsky, H.; van Marken Lichtenbelt, W.; Kramer, R.P. Humans and buildings in times of climate change–A perspective on resilience. In Proceedings of the 3rd International Conference on Comfort at the Extremes: COVID, Climate Change and Ventilation CATE, Edinburgh, UK, 5–6 September 2022; pp. 8–10. [Google Scholar]
  65. Brunt, V.E.; Howard, M.J.; Francisco, M.A.; Ely, B.R.; Minson, C.T. Passive heat therapy improves endothelial function, arterial stiffness and blood pressure in sedentary humans. J. Physiol. 2016, 594, 5329–5342. [Google Scholar] [CrossRef]
  66. Hoekstra, S.P.; Bishop, N.C.; Faulkner, S.H.; Bailey, S.J.; Leicht, C.A. Acute and chronic effects of hot water immersion on inflammation and metabolism in sedentary, overweight adults. J. Appl. Physiol. 2018, 125, 2008–2018. [Google Scholar] [CrossRef]
  67. Pallubinsky, H.; Phielix, E.; Dautzenberg, B.; Schaart, G.; Connell, N.J.; de Wit-Verheggen, V.; Havekes, B.; van Baak, M.A.; Schrauwen, P.; Lichtenbelt, W.D.v.M. Passive exposure to heat improves glucose metabolism in overweight humans. Acta Physiol. 2020, 229, e13488. [Google Scholar] [CrossRef]
  68. Wongsurawat, N.; Davis, B.B.; Morley, J.E. Thermoregulatory failure in the elderly: St. Louis University geriatric grand rounds. J. Am. Geriatr. Soc. 1990, 38, 899–906. [Google Scholar] [CrossRef]
  69. ONS. Overview of the UK Population: An Overview of the UK Population Incorporating Data Related to 2020, How It Has Changed, Why It Has Changed and How It Is Projected to Change in the Future; Office for National Statistics, UK Government: Newport, UK, 2020.
  70. Havenith, G. Temperature regulation and technology. Gerontech J. 2001, 1, 41–49. [Google Scholar] [CrossRef]
  71. Wilson, M.M.G.; Morley, J.E. Invited review: Aging and energy balance. J. Appl. Physiol. 2003, 95, 1728–1736. [Google Scholar] [CrossRef] [PubMed]
  72. Shibasaki, M.; Okazaki, K.; Inoue, Y. Aging and thermoregulation. J. Phys. Fit. Sports Med. 2013, 2, 37–47. [Google Scholar] [CrossRef]
  73. Kenney, W.L.; Chiu, P. Influence of age on thirst and fluid intake. Med. Sci. Sports Exerc. 2001, 33, 1524–1532. [Google Scholar] [CrossRef]
  74. Ferry, M. Strategies for ensuring good hydration in the elderly. Nutr. Rev. 2005, 63, 22–29. [Google Scholar] [CrossRef]
  75. Blatteis, C.M. Age-dependent changes in temperature regulation—A mini review. Gerontology 2012, 58, 289–295. [Google Scholar] [CrossRef]
  76. WHO. Heat and Health. Newsroom Fact Sheet; World Health Organisation: Geneva, Switzerland, 2024. [Google Scholar]
  77. Turk, E.E. Hypothermia. Forensic Sci. Med. Pathol. 2010, 6, 106–115. [Google Scholar] [CrossRef]
  78. Hirvonen, J.K. Handbuch Gerichtliche Medizin; Brinkmann, B., Madea, B., Eds.; Springer: Berlin/Heidelberg, Germany, 2003. [Google Scholar]
  79. Krzyżewska, A.; Dobek, M.; Domżał-Drzewicka, R.; Rząca, M. Emergency interventions due to weather-related hypothermia. Weather 2017, 72, 8–12. [Google Scholar] [CrossRef]
  80. Collins, K.J.; Exton-Smith, A.N.; Dore, C. Urban hypothermia: Preferred temperature and thermal perception in old age. Br. Med. J. (Clin. Res. Ed.) 1981, 282, 175–177. [Google Scholar] [CrossRef]
  81. Fox, R.H.; MacGibbon, R.; Davies, L.; Woodward, P.M. Problem of the old and the cold. Br. Med. J. 1973, 1, 21–24. [Google Scholar] [CrossRef]
  82. Foxman, E.F.; Storer, J.A.; Fitzgerald, M.E.; Wasik, B.R.; Hou, L.; Zhao, H.; Turner, P.E.; Pyle, A.M.; Iwasaki, A. Temperature-dependent innate defense against the common cold virus limits viral replication at warm temperature in mouse airway cells. Proc. Natl. Acad. Sci. USA 2015, 112, 827–832. [Google Scholar] [CrossRef] [PubMed]
  83. Rijal, H.B.; Yoshida, H.; Umemiya, N. Seasonal and regional differences in neutral temperatures in Nepalese traditional vernacular houses. Build. Environ. 2010, 45, 2743–2753. [Google Scholar] [CrossRef]
  84. Woodhouse, P.R.; Khaw, K.T.; Plummer, M. Seasonal variation of blood pressure and its relationship to ambient temperature in an elderly population. J. Hypertens. 1993, 11, 1267–1274. [Google Scholar] [CrossRef]
  85. Lloyd, E.L.; McCormack, C.; McKeever, M.; Syme, M. The effect of improving the thermal quality of cold housing on blood pressure and general health: A research note. J. Epidemiol. Community Health 2008, 62, 793–797. [Google Scholar] [CrossRef] [PubMed]
  86. Shortt, N.; Rugkåsa, J. “The walls were so damp and cold” fuel poverty and ill health in Northern Ireland: Results from a housing intervention. Health Place 2007, 13, 99–110. [Google Scholar] [CrossRef]
  87. Lomas, K.J.; Porritt, S.M. Overheating in buildings: Lessons from research. Build. Res. Inf. 2017, 45, 1–18. [Google Scholar]
  88. Aspvik, N.P.; Viken, H.; Ingebrigtsen, J.E.; Zisko, N.; Mehus, I.; Wisløff, U.; Stensvold, D. Do weather changes influence physical activity level among older adults?–The Generation 100 study. PLoS ONE 2018, 13, e0199463. [Google Scholar]
  89. Lindemann, U.; Oksa, J.; Skelton, D.A.; Beyer, N.; Klenk, J.; Zscheile, J.; Becker, C. Effect of cold indoor environment on physical performance of older women living in the community. Age Ageing 2014, 43, 571–575. [Google Scholar] [CrossRef]
  90. Paynter, S. Humidity and respiratory virus transmission in tropical and temperate settings. Epidemiol. Infect. 2015, 143, 1110–1118. [Google Scholar]
  91. Calderón-Larrañaga, A.; Dekhtyar, S.; Vetrano, D.L.; Bellander, T.; Fratiglioni, L. COVID-19: Risk accumulation among biologically and socially vulnerable older populations. Ageing Res. Rev. 2020, 63, 101149. [Google Scholar]
  92. ONS. Deaths Involving COVID-19 in the Care Sector, England and Wales: Deaths Occurring up to 12 June 2020 and Registered up to 20 June 2020 (Provisional); Office for National Statistics, UK Government: Newport, UK, 2020.
  93. West, E.; Moore, K.; Kupeli, N.; Sampson, E.L.; Nair, P.; Aker, N.; Davies, N. Rapid review of decision-making for place of care and death in older people: Lessons for COVID-19. Age Ageing 2021, 50, 294–306. [Google Scholar] [CrossRef] [PubMed]
  94. Almeida-Silva, M.; Wolterbeek, H.T.; Almeida, S.M. Elderly exposure to indoor air pollutants. Atmos. Environ. 2014, 85, 54–63. [Google Scholar] [CrossRef]
  95. Abdelbasset, W.K. Stay Home: Role of physical exercise training in elderly individuals’ ability to face the COVID-19 infection. J. Immunol. Res. 2020, 1, 8375096. [Google Scholar] [CrossRef] [PubMed]
  96. Age UK. Winter Warmth Services—Impact Report 2011–2014. UK, 2014. Available online: https://www.ageuk.org.uk/siteassets/documents/reports-and-publications/evaluation-reports/winter_warmth_impact_report.pdf (accessed on 1 March 2024).
  97. Age UK. Number of Older People Worried About Heating Their Homes Jumps to Nearly Eight Million as Energy Crisis Deepens. UK. 2022. Available online: https://www.ageuk.org.uk/latest-press/articles/2022/number-of-older-people-worried-about-heating-their-homes-jumps-to-nearly-eight-million-as-energy-crisis-deepens/ (accessed on 1 March 2024).
  98. Shaw, V. Over-65s May Go Without Food or Heat to Cope with Energy Bill Rises, Says Age UK. The Independent. 2022. Available online: https://www.independent.co.uk/money/over65s-may-go-without-food-or-heat-to-cope-with-energy-bill-rises-says-age-uk-b2003268.html (accessed on 1 March 2024).
  99. Age UK. Energy Crisis Is Still Causing Misery for the Poorest Pensioners, Says Age UK. 2024. Available online: https://www.ageuk.org.uk/latest-press/articles/2024/energy-crisis-is-still-causing-misery-for-the-poorest-pensioners-says-age-uk/ (accessed on 23 February 2025).
  100. Roys, M.; Nicol, S.; Garrett, H.; Margoles, S. The Full Cost of Poor Housing; IHS BRE Press: Watford, UK, 2016. [Google Scholar]
  101. Nicol, S.; Roys, M.; Garett, H. The Cost of Poor Housing to the NHS: Briefing Paper; Building Research Establishment BRE: Garston, UK, 2011. [Google Scholar]
  102. Age UK. Poverty in Later Life; Age UK Love After Life; Age UK: London, UK, 2022. [Google Scholar]
  103. ONS. Climate-Related Mortality, England and Wales: 1988 to 2022. Relative Risk of Death Associated with Temperature for England and Wales from 1988 to 2022; Office for National Statistics, UK Government: Newport, UK, 2022.
  104. ONS. Excess Mortality During Heat-Periods: 1 June to 31 August 2022. Joint Analytical Article Between the Office for National Statistics (ONS) and UK Health Security Agency (UKHSA) on Deaths During Heat-Periods in 2022; Office for National Statistics, UK Government: Newport, UK, 2022.
  105. ONS. Excess Winter Mortality in England and Wales: 2017 to 2018 (Provisional) and 2016 to 2017 (Final). More People Die in the Winter Than the Summer. We Present Data by Sex, Age, Region and Cause of Death; Office for National Statistics, UK Government: Newport, UK, 2018.
  106. Kalkstein, L.S.; Greene, J.S. An evaluation of climate/mortality relationships in large US cities and the possible impacts of a climate change. Environ. Health Perspect. 1997, 105, 84–93. [Google Scholar] [CrossRef]
  107. Donaldson, G.C.; Kovats, R.S.; Keatinge, W.R.; McMichael, A.J. Heat-and cold-related mortality and morbidity and climate change. Health Eff. Clim. Change UK 2001, 70–80. [Google Scholar]
  108. Koppe, C.; Kovats, S.; Jendritzky, G.; Menne, B. Heat-Waves: Risks and Responses; Health and Global Environmental Change No. 2; WHO: Geneva, Switzerland, 2004. [Google Scholar]
  109. Perkins-Kirkpatrick, S.E.; Lewis, S.C. Increasing trends in regional heatwaves. Nat. Commun. 2020, 11, 3357. [Google Scholar] [CrossRef]
  110. ONS. Do Summer Heatwaves Lead to an Increase in Deaths? When the UK’s Hottest Day on Record Was Recorded This Summer, an Increase in Deaths Followed. We Look at How Hot Weather Affects the Number of Deaths That Occur; Office for National Statistics, UK Government: Newport, UK, 2019.
  111. Bobb, J.F.; Peng, R.D.; Bell, M.L.; Dominici, F. Heat-related mortality and adaptation to heat in the United States. Environ. Health Perspect. 2014, 122, 811–816. [Google Scholar] [CrossRef]
  112. Robine, J.M.; Cheung, S.L.K.; Le Roy, S.; Van Oyen, H.; Griffiths, C.; Michel, J.-P.; Herrmann, F.R. Death toll exceeded 70,000 in Europe during the summer of 2003. Comptes Rendus Biol. 2008, 331, 171–178. [Google Scholar] [CrossRef]
  113. Bobb, J.F.; Obermeyer ZWang, Y.; Dominici, F. Cause-specific risk of hospital admission related to extreme heat in older adults. JAMA 2014, 312, 2659–2667. [Google Scholar] [CrossRef]
  114. Hopp, S.; Dominici, F.; Bobb, J.F. Medical diagnoses of heat wave-related hospital admissions in older adults. Prev. Med. 2018, 110, 81–85. [Google Scholar] [CrossRef]
  115. Hajat, S.; Kovats, R.S.; Lachowycz, K. Heat-related and cold-related deaths in England and Wales: Who is at risk? Occup. Environ. Med. 2007, 64, 93–100. [Google Scholar] [PubMed]
  116. UK Health Security Agency. Research and Analysis. Heat Mortality Monitoring Report: 2022; UK Government: London, UK, 2024.
  117. Meng, C.; Ke, F.; Xiao, Y.; Huang, S.; Duan, Y.; Liu, G.; Yu, S.; Fu, Y.; Peng, J.; Cheng, J.; et al. Effect of cold spells and their different definitions on mortality in Shenzhen, China. Front. Public Health 2022, 9, 817079. [Google Scholar]
  118. Wang, L.; Liu, T.; Hu, M.; Zeng, W.; Zhang, Y.; Rutherford, S.; Lin, H.; Xiao, J.; Yin, P.; Liu, J.; et al. The impact of cold spells on mortality and effect modification by cold spell characteristics. Sci. Rep. 2016, 6, 38380. [Google Scholar] [CrossRef] [PubMed]
  119. Ruse, J.L. Fuel poverty and cold-related ill health. In Tackling Causes and Consequences of Health Inequalities: A Practical Guide; CRC Press: Florida, FL, USA, 2020; pp. 41–50. [Google Scholar]
  120. Fisk, W.; Seppanen, O. Providing better indoor environmental quality brings economic benefits. In Proceedings of the 9th REHVA World Congress Clima 2007 “WellBeing Indoors”, Helsinki, Finland, 10–14 June 2007. [Google Scholar]
  121. Wilkinson, P.; Pattenden, S.; Armstrong, B.; Fletcher, A.; Kovats, R.S.; Mangtani, P.; McMichael, A.J. Vulnerability to winter mortality in elderly people in Britain: Population based study. BMJ 2004, 329, 647. [Google Scholar]
  122. Vaisrub, S. Accidental hypothermia in the elderly. JAMA 1978, 239, 1888. [Google Scholar] [CrossRef]
  123. Age UK. Excess Winter Deaths: A Chilling Reminder of How the Cold Affects Older People; Age UK: Whitchurch, UK, 2016. [Google Scholar]
  124. Karjalainen, S. Thermal comfort and gender: A literature review. Indoor Air 2012, 22, 96–109. [Google Scholar]
  125. Kaciuba-Uscilko, H.; Grucza, R. Gender differences in thermoregulation. Curr. Opin. Clin. Nutr. Metab. Care 2001, 4, 533–536. [Google Scholar]
  126. Tejedor, B.; Casals, M.; Gangolells, M.; Macarulla, M.; Forcada, N. Human comfort modelling for elderly people by infrared thermography: Evaluating the thermoregulation system responses in an indoor environment during winter. Build. Environ. 2020, 186, 107354. [Google Scholar] [CrossRef]
  127. Díaz, J.; Garcia, R.; Velázquez de Castro, F.; Hernández, E.; López, C.; Otero, A. Effects of extremely hot days on people older than 65 years in Seville (Spain) from 1986 to 1997. Int. J. Biometeorol. 2002, 46, 145–149. [Google Scholar]
  128. Rey, G.; Jougla, E.; Fouillet, A.; Pavillon, G.; Bessemoulin, P.; Frayssinet, P.; Clavel, J.; Hémon, D. The impact of major heat waves on all—Cause and cause—Specific mortality in France from 1971 to 2003. Int. Arch. Occup. Environ. Health 2007, 80, 615–626. [Google Scholar]
  129. Åström, D.O.; Bertil, F.; Joacim, R. Heat wave impact on morbidity and mortality in the elderly population: A review of recent studies. Maturitas 2011, 69, 99–105. [Google Scholar] [PubMed]
  130. Hansen, A.; Bi, P.; Pisaniello, D.; Nitschke, M.; Tucker, G.; Newbury, J.; Kitson, A.; Grande, E.D.; Avery, J.; Zhang, Y.; et al. Heat-health behaviours of older people in two Australian states. Australas. J. Ageing 2015, 34, E19–E25. [Google Scholar] [PubMed]
  131. Shahzad, S.; Disci, Z.N.; Mody, S.; Basavapatna Kumaraswamy, S.; Calautit, J.K. Older people, thermal comfort behaviour and related energy use. In Proceedings of the International Conference on Applied Energy 2020, Bangkok, Thailand, 1–10 December 2020. [Google Scholar]
  132. Kastrup, A.; Dichgans, J.; Niemeier, M.; Schabet, M. Changes of cerebrovascular CO2 reactivity during normal aging. Stroke 1998, 29, 1311–1314. [Google Scholar]
  133. Liu, W.; Lou, X.; Ma, L. Use of 3D pseudo-continuous arterial spin labeling to characterize sex and age differences in cerebral blood flow. Neuroradiology 2016, 58, 943–948. [Google Scholar]
  134. Treloar, A.E. Menstrual cyclicity and the pre-menopause. Maturitas 1981, 3, 249–264. [Google Scholar]
  135. Avis, N.E.; Crawford, S.L.; Greendale, G.; Bromberger, J.T.; Everson-Rose, S.A.; Gold, E.B.; Hess, R.; Joffe, H.; Kravitz, H.M.; Tepper, P.G.; et al. Duration of menopausal vasomotor symptoms over the menopause transition. JAMA Intern. Med. 2015, 175, 531–539. [Google Scholar]
  136. Carter, S.K. Menopause, Hot Flushes, and Thermal Comfort in the Workplace. Ph.D. Thesis, The University of Sydney, Camperdown, Australia, 2022. [Google Scholar]
  137. Kronenberg, F.; Barnard, R.M. Modulation of menopausal hot flashes by ambient temperature. J. Therm. Biol. 1992, 17, 43–49. [Google Scholar]
  138. Tataryn, I.V.; Lomax, P.; Bajorek, J.G.; Chesarek, W.; Meldrum, D.R.; Judd, H.L. Postmenopausal hot flushes: A disorder of thermoregulation. Maturitas 1980, 2, 101–107. [Google Scholar]
  139. Molnar, G.W. Body temperatures during menopausal hot flashes. J. Appl. Physiol. 1975, 38, 499–503. [Google Scholar]
  140. Tankersley, C.G.; Nicholas, W.C.; Deaver, D.R.; Mikita, D.; Kenney, W.L. Estrogen replacement in middle-aged women: Thermoregulatory responses to exercise in the heat. J. Appl. Physiol. 1992, 73, 1238–1245. [Google Scholar]
  141. Putnam, L.L.; Bochantin, J. Gendered bodies: Negotiating normalcy and support. Negot. Confl. Manag. Res. 2009, 2, 57–73. [Google Scholar] [CrossRef]
  142. Reynolds, S.L. Protected or neglected: An examination of negative versus compassionate ageism in public conservatorship. Res. Aging 1997, 19, 3–25. [Google Scholar] [CrossRef]
  143. Bochantin, J. “Long live the mensi-mob”: Communicating support online with regards to experiencing menopause in the workplace. Commun. Stud. 2014, 65, 260–280. [Google Scholar] [CrossRef]
  144. New, K.; Gormally, A.; Friday, A.; Hazas, M. ‘We can send a man to the moon but we can’t control the temperature in our office’: A considerate approach to workplace thermal comfort by older women. In Proceedings of the 2021 CHI Conference on Human Factors in Computing Systems, Yokohama, Japan, 8–13 May 2021; pp. 1–14. [Google Scholar]
  145. CIBSE. CIBSE TM59 Design Methodology for the Assessment of Overheating Risk in Homes; Chartered Institute of Building Services Engineers: London, UK, 2017. [Google Scholar]
  146. ASHRAE. ANSI/ASHRAE Standard 55: Thermal Environmental Conditions for Human Occupancy; American Society of Heating, Refrigerating and Air-conditioning Engineers: Atlanta, GA, USA, 2013. [Google Scholar]
  147. Ma, T.; Xiong, J.; Lian, Z. A human thermoregulation model for the Chinese elderly. J. Therm. Biol. 2017, 70, 2–14. [Google Scholar] [CrossRef]
  148. WHO. Health impact of low indoor temperatures. In Health Impact of Low Indoor Temperatures; World Health Organization: Geneva, Switzerland, 1987; p. 27. [Google Scholar]
  149. Wookey, R.; Bone, A.; Carmichael, C.; Crossley, A. Minimum Home Temperature Thresholds for Health in Winter—A Systematic Iterature Review; Public Health England: London, UK, 2014.
  150. ISO7730; Ergonomics of the Thermal Environment—Analytical Determination and Interpretation of Thermal Comfort Using Calculation of the PMV and PPD Indices and Local Thermal Comfort Criteria. International Organization for Standardization: Geneva, Switzerland, 2005.
  151. Rawal, R.; Schweiker, M.; Kazanci, O.B.; Vardhan, V.; Jin, Q.; Duanmu, L. Personal comfort systems: A review on comfort, energy, and economics. Energy Build. 2020, 214, 109858. [Google Scholar] [CrossRef]
  152. Rijal, H.B.; Yoshida, K.; Humphreys, M.A.; Nicol, J.F. Development of an adaptive thermal comfort model for energy-saving building design in Japan. Archit. Sci. Rev. 2021, 64, 109–122. [Google Scholar] [CrossRef]
Figure 1. Life expectancy vs. GDP per capita growth (US Dollars, based on the UN 2022 open access data [54]).
Buildings 15 01141 g001
Figure 2. Age range and weekly death rate with the outdoor air temperature throughout the year, 2013 to 2019, (based on ONS and Met Office data).
Buildings 15 01141 g002
Figure 3. Age range in terms of relationship with weekly death rate and outdoor air temperature, 2013 to 2019 (based on ONS and Met Office data).
Buildings 15 01141 g003
Figure 4. Registered deaths with outdoor air temperature in England and Wales from 2013 to 2019: pre-COVID-19 (based on ONS data).
Buildings 15 01141 g004
Figure 5. Temperature and mortality from 2013 to 2019: pre-COVID-19. (a) Mean daily deaths and (b) five-year-average daily deaths (based on ONS data).
Buildings 15 01141 g005
Figure 6. Death rate, mean outdoor temperature and heatwave periods in summer 2022 (based on ONS and Met Office 2022 data).
Buildings 15 01141 g006
Figure 7. Relationship between death rate and mean daily outdoor air temperature in summer 2022 (based on ONS and Met Office 2022 data).
Buildings 15 01141 g007
Figure 8. Excess deaths compared to the five-year-average and outdoor air temperature for people aged above and below 70 (based on ONS and Met Office 2022 data).
Buildings 15 01141 g008
Figure 9. Relationship between excess death rate and outdoor air temperature for people aged above and below 70 years old (based on ONS and Met Office 2022 data).
Buildings 15 01141 g009
Figure 10. Excess winter mortality index for different age groups from 2011 to 2019 (based on ONS data).
Buildings 15 01141 g010
Figure 11. Excess winter mortality index and cause of death (based on ONS data).
Buildings 15 01141 g011
Figure 12. Relationship between weekly outdoor air temperature and the total numbers of weekly deaths (based on ONS and Met Office 2022 data).
Buildings 15 01141 g012
Figure 13. Age range and weekly death rate with the outdoor temperature throughout the year, 2013 to 2019 (based on ONS and Met Office data).
Buildings 15 01141 g013
Figure 14. Gender differences in excess winter mortality according to age groups (based on ONS data, 2011 to 2019).
Buildings 15 01141 g014
Figure 15. Excess winter mortality index for different age and gender groups (based on ONS data, 2011 to 2019).
Buildings 15 01141 g015
Figure 16. Relationship between indoor and outdoor air temperatures (based on the data sources in Table 1).
Buildings 15 01141 g016
Figure 17. Relationship between comfort temperature and indoor air temperature, mainly in natural ventilation mode (based on the data sources in Table 1).
Buildings 15 01141 g017
Figure 18. Relationship between comfort temperature and outdoor air temperature, mainly in natural ventilation mode (based on the data sources in Table 1).
Buildings 15 01141 g018
Table 1. Age range, methodology and sample size in research on thermal comfort of older people.
CitationPlace/
Region
Age RangeGenderSample SizeSeasonContextMethodologyIndoor Air
Temperature
Relative
Humidity
Ohnaka et al. [3]Japan63 to 738 females8 respondentsNot specifiedClimatic chamber Experiment35 °C hot; 10 °C cold; 25 °C moderate conditions60% ± 10%
Wong et al. [4]Hong Kong25 to 93 (76 years mean)108 males and 332 females80 buildings; 579 respondentsSummerCentres for older people and officesField study25.4 °C 40–80%
Hwang and Chen [5]Taiwan60+37 males and 50 females87 respondentsSummer and winterHouses; living roomField study13.3–32.5 °C 43–92%
Schellen et al. [6]Eindhoven, GermanyYoung adults (22 to 25) and older subjects (67 to 73)16 males16 respondentsNot specifiedExperimental ChamberExperiment21.5 °C; 17–25 °C; 40%
Mendes et al. [7]Porto, PortugalNot specifiedNot specified6 buildings; 425 respondentsSummer and winterElderly * Care CentresField study20 ± 1 °C50 ± 5%
Mendes et al. [8]Porto, Portugal Not specifiedNot specified22 buildingsSummer and winterElderly * Care CentresField study20 ± 1 °C50 ± 5%
Bills [9]Adelaide, Australia65+4 males and 7 females10 buildings; 11 respondentsSummer and winterResidential buildingsField study18–35 °C operative temperature25–70%
Bills et al. [10]Adelaide, AustraliaNot specified9 males and 8 females 15 buildings; 17 respondentsOctober to JanuaryHousesField study18–35 °C operative temperature25–70%
Yang et al. [11]Republic of Korea 65+64 males and 334 females26 buildings; 308 respondents1 yearElderly * Care CentresField study21.3–31.3 °C17–87.2%
Jiao et al. [12]China70+ (85.2 average)Not specified42 buildings; 672 respondentsSummer and winterNursing homesField study6.4–32.5 °C20.6–83.2%
Fan et al. [13]Beijing, China65+ (73.9 ± 5.8 for urban and 72.0 ± 6.7 for rural respondents)Not specified100 buildings and 100 responsesWinterHouses: urban and rural housesField study14.6 ± 3.3–21.9 ± 2.2 °C23–67%
Vellei et al. [14]Exeter UK65 +Not specified55 dwellings; 70 survey responses; 20 interviewsSummerDwellings: Houses and Flats Field study22.2–24.1 °C-
Panraluk and Sreshthaputra [15]Thailand55+Not specified4 buildings; 163 respondentsNovember and MarchPublic health service buildingsField study23–27.8 °C54–73%
Hughes et al. [16]UK65+Not specified43 buildings; 59 respondents; 266 responsesWinterHouses pre-1919Field study17.6–18.9 °C mean50.37–51.59% mean
Xiong et al. [17]Shanghai, China70+8 males and 8 females16 respondentsSummerClimatic chamber Experiment21–31 °C operative temperature30–70%
Lan et al. [18] Shanghai, China65+ (71 ± 5)10 males and 8 females18 respondentsSummerSleep chamberExperiment26.7 ± 0.2–29.8 ± 0.2 °C55 ± 7–61 ± 5%
Forcada et al. [19]Mediterranean climate84.4 (46 to 99)156 males and 467 females623 respondentsSummerNursing homesField study23.14–28.46 °C52.38–69.32%
Yu et al. [20]China12% 60 to 70: 33% 71 to 80; 48% 81 to 90; and 7% over 9040% males and 60% females2 buildings; 60 respondents; 720 responses1 yearNursing homesField study5.1–34.3 °C12.3–99.9%
Forcada et al. [21]SpainNot specifiedNot specified5 buildingsFeb to NovNursing homesField study19.7–28.5 °C57.1–84%
Larriva et al. [22]Mediterranean climateNot specifiedNot specified18 buildings; 2690 responsesNatural ventilation seasonNursing homesField study18.2–28.8 °C0–96%
Yao et al. [23]Lhasa, Tibet60+Males and females468 responsesSummer and winterOutdoorsField studyN/AN/A
Yuan et al. [24]China60+73 males and 79 females62 buildings; 152 respondentsWinterRural residential buildingsField study and simulation23.7–27.9 °C60–83%
Li et al. [25]Mongolia60 to 9345.45% males and 54.55% females16 buildings; 216 respondentsDecemberMutual aid homesField study7.2–19.5 °C30.10%
Zheng et al. [26]China60+Not specified2 buildings; 29 respondents1 yearNursing homesField study9.9–35.4 °C12–90%
Kainaga et al. [27]Nagano Prefecture, Japan 65+ (83.7 average)27 males and 39 females1 building; 10,017 responsesSummer and winterElderly * care facilityField study17.4–27.6 °C15–83%
Zheng et al. [28]Baoding, China60 to 74; 75 to 88; and 89+Not specified2 buildings; 29 respondentsSummerPensioners buildingsField study20.1–39.3 °C20.8–97%
Jiao et al. [29]Shanghai, China70+233 males and 439 females17 buildings; 742 respondents Summer and winterElderly * Care Institutions Field study6–32.5 °C25–80%
Zong et al. [30]China82 years average161 males and 321 females 1 building; 482 respondentsAll yearNursing HomeField study11.92 ± 1.1–28.58 ± 1.1 °C58.77 ± 10.6–74.41 ± 4.8%
Yoon et al. [31]UK60 to 101Not specified15 buildings; 69 respondentsSummerCare homesField study21.5–26.5 °C-
Baquero et al. [32]Spain, Madrid Region65+ (87.3%)22% males and 78% females5 buildings; 1232 respondents; 1412 responsesSummerNursing Homes; Common areasField study28.02–24.95 °C16.9–83.7%
* The use of the word ‘elderly’ is not suitable; however, this table reflects the terminology used by the author/s. For further information, refer to the terminology section.
Table 2. Age range, methodology and sample size in research on sleep and thermal comfort of older people.
CitationPlaceAge RangeGenderSample SizeSeasonContextMethodology
Raymann and Van Someren [34]The Netherlands65.8 ± 2.8 and 59.1 ± 1.98 males and 8 females16Not specifiedSleep chamberExperiment
Okamoto-Mizuno and Tsuzuki [35]Japan62+ (65.8 ± 2.6)13 males and 6 females19Winter, Summer and AutumnResidential
own bedroom
Field study
Tsuzuki et al. [36]Japan60+ (64 ± 1)8 males8All yearResidential
own bedroom
Field study
Lan et al. [18]China65+ (71 ± 5)10 males and 8 females18SummerSleep chamberExperiment
Xia et al. [37]China66.3 ± 3.38 males and 4 females12WinterNursing homeField experiments
Tsuzuki et al. [38]Japan70+ (80 ± 5)8 males and 8 females16All yearCare facilitiesField study
Kido et al. [39]Japan60+ (74.8 ± 10.3)37 males and 49 females97, including 86 older peopleSummerResidential
own bedroom
Field study
Yan et al. [40]China65+ (70.7.3 ± 5)19 males and 26 females45SummerOwn bedroom (not specified home vs. care home)Field study
Yan et al. [41]China65+ (72 ± 6)8 males and 8 females16SummerSleep chamberExperiment
Table 3. Age range in thermal comfort research related to older people.
Age Range (years)Research PaperAge Range (years)Research Paper
25 to 93Wong et al. [4]65+Vellei M et al. [14]
46+Forcada et al. [19]Hughes et al. [16]
55+Panraluk and Sreshthaputra [15]Lan et al. [18]
60+Hwang and Chen [5]Kainaga et al. [27]
Yu et al. [20]Baquero et al. [32]
Yao et al. [23]67+Schellen et al. [6]
Yuan et al. [24]70+Jiao et al. [12]
Li et al. [25]Xiong et al. [17]
Zheng et al. [26]
Zheng et al. [28]Not specifiedMendes et al. [7]
Yoon et al. [31]Mendes et al. [8]
63–73Ohnaka et al. [3]Bills et al. [10]
65+Bills [9]Forcada et al. [21]
Yang et al. [11]Larriva et al. [22]
Fan et al. [13]Zong et al. [30]
Table 4. Health impacts of heat exposure [76].
Health Impacts of Heat Exposure
DirectIndirect
Heat IllnessDehydrationHealth servicesIncreased ambulance call outs
Heat crampsResponse time
Heat strokeHospital admissions
Accelerated deathRespiratory diseaseStorage of medicine
Cardiovascular diseaseAccidents riskDrowning
Other chronic disease (mental health)Injuries and poisonings
HospitalisationRespiratory diseaseWork related
Diabetes mellitusTransmissionFood and waterborne diseases
Renal disease
StrokeMarine algal blooms
Mental health conditionsInfrastructure disruptionsPower
Water
Transportation
Productivity
Disclaimer/Publisher’s Note: The statements, opinions and data contained in all publications are solely those of the individual author(s) and contributor(s) and not of MDPI and/or the editor(s). MDPI and/or the editor(s) disclaim responsibility for any injury to people or property resulting from any ideas, methods, instructions or products referred to in the content.

