Article

Numerical Modeling of Reinforcement Solutions in Traditional Stone Masonry Using a Particle Model

by
Nuno Monteiro Azevedo
1,*,
Ildi Cismaşiu
2,
Fernando F. S. Pinho
2 and
Filipe Neves
3
1
Concrete Dams Department, Laboratório Nacional de Engenharia Civil (LNEC), 1700-066 Lisboa, Portugal
2
CERIS and Department of Civil Engineering, NOVA School of Science and Technology|FCT-NOVA, 2829-516 Caparica, Portugal
3
Department of Civil Engineering, NOVA School of Science and Technology|FCT-NOVA, 2829-516 Caparica, Portugal
*
Author to whom correspondence should be addressed.
Buildings 2025, 15(7), 1058; https://doi.org/10.3390/buildings15071058
Submission received: 13 February 2025 / Revised: 21 March 2025 / Accepted: 23 March 2025 / Published: 25 March 2025

Abstract

Traditional stone masonry walls are structural elements in most historic buildings. To preserve them and improve their ability to withstand extreme events, such as earthquakes, it is necessary to implement effective reinforcement solutions. This paper presents the modeling of traditional Portuguese rubble stone masonry walls, reinforced with external steel mesh, sprayed micro-concrete layers and transverse confinement by steel connectors, which were developed and tested experimentally in uniaxial compression. The modeling is carried out using micro-modeling through a 2D particle model (PM). The process of calibrating the properties of both micro-concrete and concrete is presented, the methodology for generating the numerical models is described and the numerical response is compared with the experimental results. The numerical results show that the PM can adequately reproduce the experimentally observed behavior of this type of reinforcement solution.

1. Introduction

Stone masonry walls are used as structural elements in most existing building stock in many countries [1]. In Portugal, ancient buildings built before reinforced concrete constructions represent around 50% of the built heritage, and their load-bearing walls are mostly made of stone masonry.
Rubble stone masonry typically consists of stone blocks and a binding agent (e.g., lime or cement-based mortar). By nature, this type of masonry is heterogeneous, and its constituents often exhibit irregular geometry [2] and a high variability in their mechanical properties. The performance of rubble stone masonry is strongly conditioned by the mechanical properties of mortars [3,4], which have significantly lower strength and cohesion compared, for instance, with concrete.
Past and recent earthquake events have revealed severe vulnerabilities in ancient buildings, which have been major contributors to the socioeconomic losses caused by earthquakes worldwide [5,6,7]. Masonry structures have experienced varying degrees of damage due to distinct failure mechanisms, often linked to their material properties, construction techniques, lack of maintenance and inadequate pre-earthquake interventions. The most frequent failure types recorded during post-earthquake surveys, e.g., in Gorkha, Nepal in 2015 [8,9], Central Italy in 2016 [10], and Levsos, Greece [11], Durres, Albania [12] and Turkey–Syria in 2023 [7,13] are as follows: (i) in-plane cracking (diagonal or bi-diagonal) caused by insufficient in-plane wall stiffness, (ii) out-of-plane damage and collapse that is significantly affected by the lack of connection between the floor/roof and the masonry walls and (iii) delamination of masonry wythes.
Mechanical pathologies caused by earthquake damage, such as diagonal cracks in walls and out-of-plane bending [14,15], can be worsened by the disaggregation of rubble stone masonry [4]. To protect historic buildings and to enhance their ability to withstand extreme events, it is essential to implement effective reinforcement and strengthening solutions. Seismic upgrading techniques for existing masonry structures can be categorized into three main approaches: (i) enhancing the cyclic behavior of the individual structural elements, (ii) improving the overall structural integrity and (iii) reducing the seismic forces.
The global seismic performance of ancient masonry buildings is improved by promoting box-like behavior through the stiffening of masonry walls and diaphragms. Seismic force control and dissipation can be further enhanced with the integration of specialized devices. Strengthening techniques for individual elements focus on improving their ability to withstand tensile stresses, thereby enhancing their strength, stiffness and ductility. These techniques include grout and epoxy injection, repointing, steel tying, reinforced plastering and fiber-based reinforcement, among others. A comprehensive review of existing and potential future trends in the repair and strengthening of masonry structures is provided in [16,17].
Among the seismic strengthening methods for masonry structures [18,19,20], the application of an external steel-meshed mortar layer is widely employed to reinforce and retrofit existing masonry walls, including those made of stone [4,21,22]. This solution significantly enhances both the in-plane and out-of-plane behavior of masonry walls. Its popularity stems from several advantages: the availability of aggregate materials, ease of construction, minimal need for foundation surface preparation and limited disruption to the original masonry wall structure.
Given the distinct characteristics of rubble stone masonry [23], further experimental and numerical investigations are essential to deepen the understanding of the structural behavior of historic stone masonry walls and to assess the impact of reinforcement solutions on their strength capacity [24,25]. The numerical assessment of structural vulnerability for existing buildings with resistant masonry walls relies on a sufficient knowledge level (KL) of the structure and its mechanical properties.
Two main numerical modeling strategies are adopted for masonry: macro- and micro-modeling [25,26]. The macro-modeling approach assumes masonry as a homogeneous and continuous material, typically implemented within a finite element framework. This approach provides a reasonable compromise between accuracy and computational effort, making it practical for assessing the global seismic capacity of masonry structures [26].
Micro-modeling strategies can capture the heterogeneous nature of the wall geometry and material characteristics (stones, mortar and interface) of the masonry and represent local behaviors and failure mechanisms more accurately [3,25]. They can be also used to improve the predictions of macro-models. When a micro-modeling approach is adopted, two fundamental conditions need to be met: sufficient computational resources and the availability of an adequate structural KL. Both drawbacks can benefit from emerging technical advances, by increasing computational capacity at an affordable cost and by increasing the KL. By combining new techniques, image segmentation and machine learning (ML), it is possible to provide accurate and reliable information on the geometry, block–mortar distribution and mechanical properties identification [27,28] of existing masonry. This may contribute to the improvement of geometry idealization processes [29,30].
Numerical methods that can be adopted within the micro-modeling approach, as discussed in [2,26,31], include, but are not limited to, the finite element method (FEM) [29,32], the discrete element method (DEM) [33,34,35,36] and coupled methodologies that combine FEM and DEM [37,38,39,40,41].
This study numerically examines the effectiveness of the shotcrete strengthening method on the uniaxial performance of unreinforced masonry (URM) walls using a 2D micro-modeling approach based on DEM. The strengthening solution consists of micro-concrete layers sprayed on the sides of the specimen’s reinforcement made of steel expanded mesh. Shear transfer between the shotcrete layer and masonry wall is provided by transversal ties through the thickness of the specimens (continuous steel connectors) [4]. The experimental program conducted by Pinho [24] included a series of tests aimed at obtaining the mechanical properties of the masonry constituents.
The adopted micro-modeling strategy is based on a detailed particle model (PM) that has been developed for concrete [42] and for reinforced concrete fracture studies [43]. The particle model adopted follows a discrete element method (DEM) that was initially proposed for granular materials [44]. Compared to continuum-based numerical models, PMs represent the material at the aggregate level, explicitly including the randomness and heterogeneity of the material. The PM has been applied in the modeling of traditional unreinforced [45] and transversally confined [46] stone masonry walls under uniaxial compression loading. Recent studies [47] have also proven that DEM-based PMs performed well in reproducing the response of the brick masonry under compression-loading conditions.
The numerical models were developed based on experimental studies conducted on ordinary masonry walls [4,24]. Following a brief overview of the chosen numerical model and methodology, the process of developing models that accurately represent the reinforced stone masonry structure is described. The calibration of the micro-mechanical properties of the contacts are presented, and simple compression tests are simulated on ancient stone masonry walls, with reinforcement solutions based on transverse confinement by steel connector bars and micro-concrete layers [4] to assess the performance of the PM and RPM methods. Finally, parametric studies are conducted to numerically assess the influence of the strengthening system elements, namely the external steel plates, the steel bar connector diameters and the micro-concrete strength properties.
The numerical studies presented show that the RPM’s predictions are in good agreement with the experimental tests, particularly when it comes to increasing the value of the maximum load and improving the failure conditions in ancient masonry walls. The presented results also show that the numerically evaluated strengthening solution is strongly influenced by the mechanical properties of the micro-concrete and by the shear transfer efficiency between the micro-concrete layer and the masonry wall. As shown, PMs can be adopted in the development of reinforcement solutions based on transverse confinement, namely in the definition of the characteristics of the bars and their quantification and in the definition of the micro-concrete layer thickness and strength properties. The adopted modeling approach, 2D-RPM, is shown to be a valid tool that can be adopted to study and to further understand the behavior of old masonry walls reinforced with a combination of transverse confinement and micro-concrete layers, which still needs to be better understood and characterized, both experimentally and numerically.

2. Particle Model (PM) for Ancient Masonry Analysis
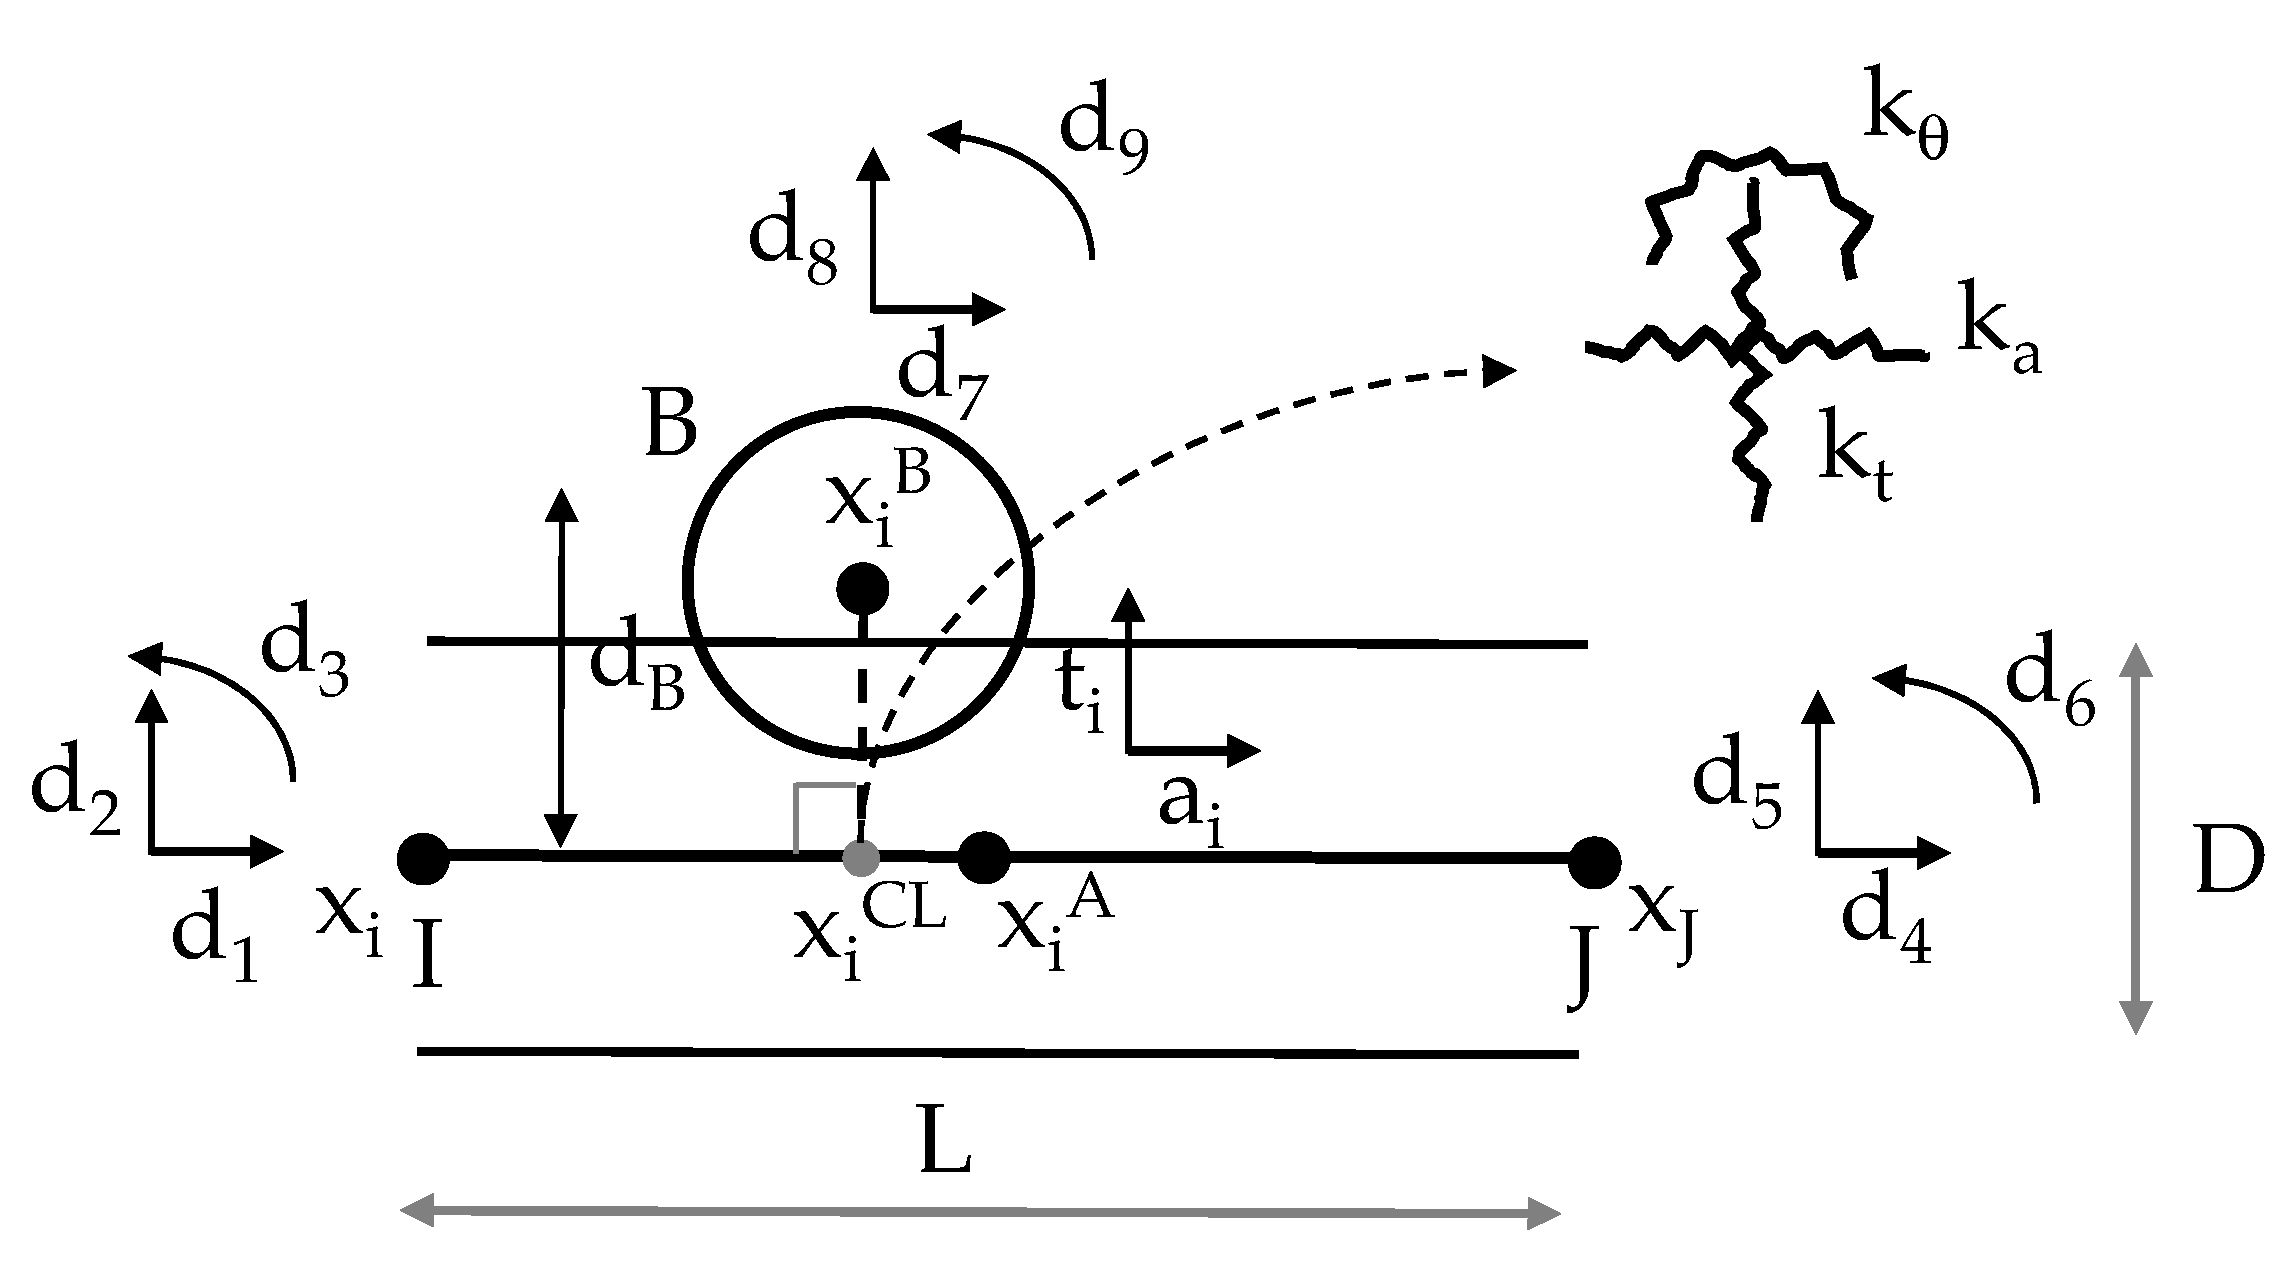
2.1. Fundamentals

In the adopted PM, based on the discrete element method, the masonry elements (stones and mortar) and their reinforcement (micro-concrete and transverse confinement) are represented by rigid circular particles with three degrees of freedom, as well as two translations and one rotation that interact at the point of contact (Figure 1). The contacts between the particles have normal and shear stiffness springs assigned to simulate macroscopic elastic deformations and simple contact softening-based laws are used, which allow the modeling of complex macroscopic nonlinear responses in tension, shear, compression and their combinations.
The calculation cycle of a discrete element algorithm is based on the sequential application of two principles: the force–displacement law and the laws of motion [42,43,44]:
-
Force–displacement law: the forces acting on each particle are related to the particle’s displacement relative to neighboring particles.
-
Laws of Motion (Newton’s Second law): given the forces applied to the centroid of the particle, the new position of the particle is determined by applying Newton’s second law.
In each calculation step, the increments of normal force ( F n t ) and shear force ( F s t ) are determined at each contact point, based on a linear force–displacement relationship, given the normal ( x n t ) and shear ( x s t ) displacement increments and the normal ( k n ) and shear ( k s ) contact stiffness:
F n t = k n x n t
F s t = k s x s t
The normal and shear contact stiffnesses are defined using the following expressions:
k n = A c E ¯ d
k s = α   k n
where E ¯ is the modulus of elasticity of the equivalent continuous material; d is the distance between the centers of gravity of the circular particles in contact; A c is the contact area and α is the shear stiffness to the normal stiffness ratio.
Based on the maximum tensile stress ( σ n . t ), the maximum cohesive stress ( τ ), the normal force acting on the contact ( F n ), the friction term ( μ c ), the maximum compressive stress, ( σ n . c ) and the contact area, it is possible to define the total tensile strength ( F n . m a x ), the maximum cohesion ( C m a x ), the maximum shear strength ( F s . m a x ) and the total compressive strength ( F n c . m a x ), as shown in Equations (5)–(8):
F n . m a x = σ n . t   A c
C m a x = τ   A c
F s . m a x = C m a x + F n   μ c
F n c . m a x = σ n . c   A c
A bilinear softening damage model is adopted for the contact point in the normal and shear directions [42,43]. In this constitutive model, the maximum values of tensile strength and cohesion are reduced according to the total damage value, which is defined by the sum of tensile and shear damage. In each direction, the damage value is defined as a function of the maximum contact displacement in that direction. As shown in [45,46], for stone masonry walls, it is necessary to adopt a yield stress in a direction that is normal to compression at the point of contact.
The numerical assessment of the transversally confined stone masonry walls requires the development of a reinforced PM (RPM). The steel connectors in the RPM are represented using plane frame finite elements, with three degrees of freedom per node (Figure 2). To define the displacement field of the plane frame, traditional shape functions (N) and their derivatives (dN) are used, considering the nodal values [46]. The numerical analysis incorporates an elastic–perfectly plastic stress–strain relationship for the plane frame elements, which represent the steel bars. The interaction between a bar, discretized using plane frame finite elements, and individual particles representing each component (mortar or stone) of the masonry wall takes place through a specified contact interface, as proposed in [46]. For contact detecting purposes, it is assumed that the geometry of the plane frame element can be approximated by a straight-line segment connecting the nodes of the plane frame, as can be seen in Figure 2. The RPM proved capable of reproducing the effect of steel-based transverse confinement in ancient stone masonry walls [46].

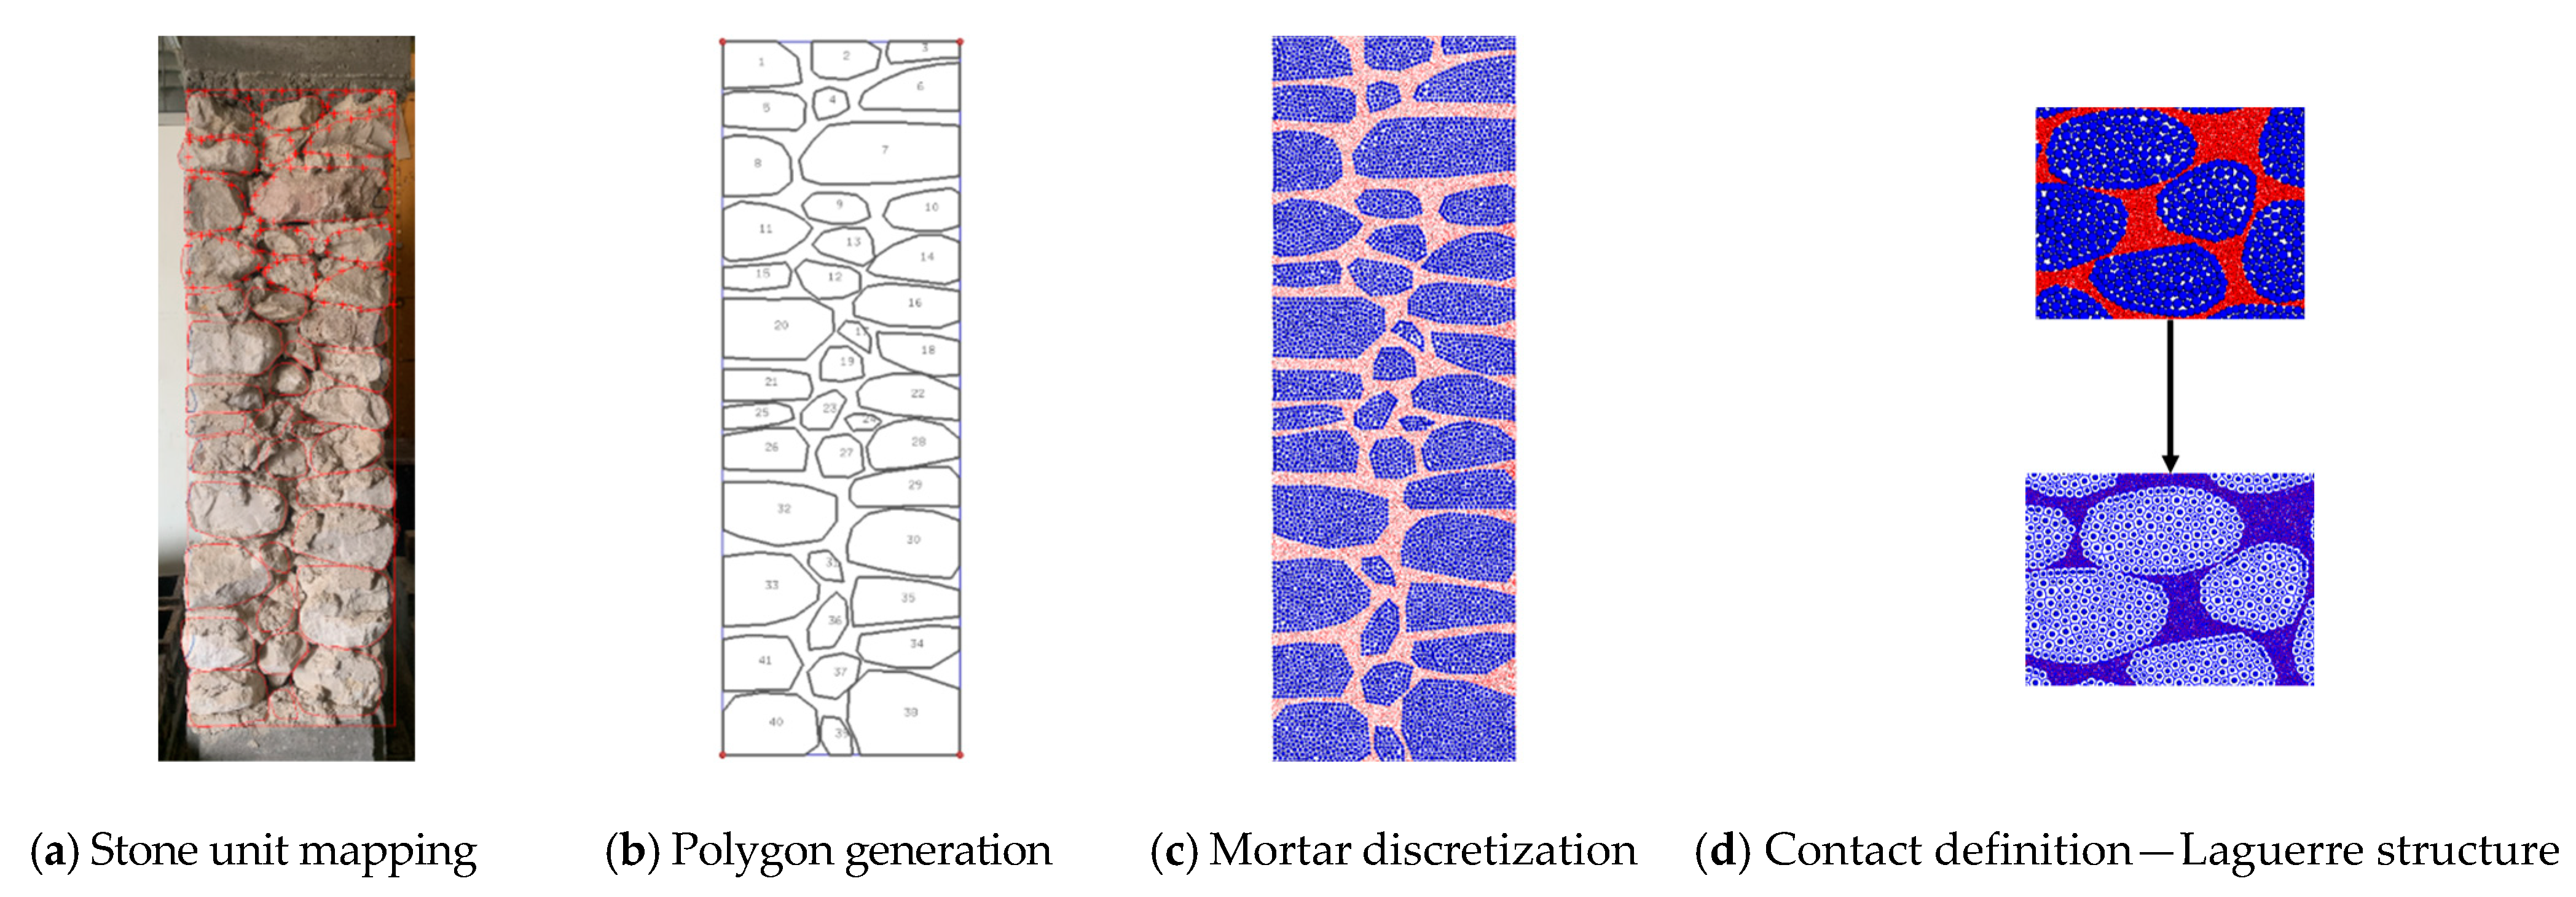
2.2. Model Generation from Images

The numerical models are generated by converting a wall image into block model by mapping the stone units. Once the layout and geometry of the stones in the masonry wall have been determined (Figure 3a), the polygons representing each stone can be defined (Figure 3b). The stone contours serve as the geometric input for the generation of the particles in the adopted PM implementation, Parmac2d. The interior space of each stone element and then the external region surrounding each stone, representing the mortar, are also discretized (Figure 3c). The contacts between the particles are established using the Voronoi–Laguerre tessellation of the centers of gravity of each particle (Figure 3d). Recent trends involving the combination of machine learning and image segmentation techniques [27,28] can ease model generation for existing masonry walls and help to conduct parametric studies.
The PMs representing the micro-concrete reinforcement and the concrete supporting beams are generated in the same way as the PMs representing stones. The particle size distribution should match the granular constitution of the material to be modeled as closely as possible, however, due to computational constraints, it is sometimes necessary to adopt larger particle size distributions. Hybrid FEM/DEM techniques can be combined to consider particle deformability through inner discretization with a finite element mesh, which, when adopted for the stones, significantly reduces the associated computational times [39].
For the stone and mortar discretization, the particle dimensions that were chosen were equal to those adopted in [45]. Namely, in the discretization of each stone element, with an average dimension of 0.167 cm, a uniform distribution of radii between 0.003 m and 0.005 m was adopted; in the discretization of the mortar, a uniform distribution of radii between 0.000714 m and 0.00119 m was adopted, with the value of the maximum radius corresponding to the maximum size of the sand used in the laying mortar [24]. For the micro-concrete reinforcement discretization, a uniform distribution of radii between 0.001 m and 0.004 m was adopted, with the micro-concrete having a maximum diameter of 0.00952 m [24]. For the concrete-supporting beam discretization, a uniform distribution of radii between 0.003 m and 0.005 m was adopted.

2.3. Contact Properties Calibration

The proposed numerical model has been validated for compression tests on URM [45], and on transversely confined reinforced rubble stone masonry walls (RM) [46]. Ongoing research is focused on compression–shear tests. In this test series, the masonry walls reinforced with micro-concrete and steel transverse connectors are subjected to uniaxial compression.
When compared with FEM-based approaches, one of the main disadvantages of particle models is that it is not possible to devise expressions for the elastic and strength contact properties given laboratory results of uniaxial tensile and compression tests and of biaxial or triaxial tests. In PMs, the elastic and strength properties of the contacts that represent a given material, such as stone, mortar, micro-concrete and concrete, need to be independently calibrated based on the experimental results presented in [21]. Additional experimental tests, namely uniaxial compression tests on stone and mortar specimens, were carried out as part of the validation of MP-type models in ancient masonry walls [45]. The contact properties of the stone and mortar were calibrated to represent the known behavior of the stone and mortar adopted in the experimental tests [21]. Other authors have also provided experimental values for the mechanical properties of the stone masonry components, which could be used for calibration purposes of the mortar and stone contacts’ properties [29,48,49,50]). It is worth mentioning that databases compiling results from experimental studies on the mechanical properties of stone masonry walls [51,52] can provide significant support for both research and practical engineering activities.
In this work, a very simple trial and error calibration procedure based on user experience is adopted. The elastic contact parameters are initially set to match the macroscopic Young modulus and Poisson Coefficient of the masonry elements, followed by setting the contact strength parameters to match the known macroscopic parameters, such as the tensile and the compression strength of the masonry element (mortar, stone) being calibrated. Research efforts on the automation of the calibration of the micro-mechanical parameters [53] make PMs more appealing, as some experimental data may not be available for existing masonry structures.
The properties of the s–s contacts, representative of stone, were calibrated on 0.20 m × 0.20 m numerical models, and the properties of the m–m contacts, representative of mortar, were calibrated on 0.04 m × 0.04 m numerical models as described in [45]. The mc–mc contacts, representative of the micro-concrete, were calibrated on numerical models measuring 0.075 m × 0.15 m and the properties of the c–c contacts, representative of concrete, were calibrated on numerical models measuring 0.085 m × 0.16 m. Note that the model size was chosen to match the size adopted in the experimental tests. The numerical models were subjected to pure compression and pure tension tests using the Parmac2d PM implementation.
Figure 4 shows the final cracking field obtained in uniaxial compression and tensile tests for the optimum parameters representative of the micro-concrete.
Table 1 shows the elastic and strength macroscopic experimental and predicted numerical values after calibration using uniaxial and tensile tests [21,24,45]. Table 2 shows the calibrated properties of each contact type obtained through a trial and error procedure. The tensile strength ( σ n . t ) and the fracture energy in mode I ( G f . n ) both contribute to the macroscopic tensile and compressive strength values, whereas the cohesion stress ( τ ), the friction term ( μ c ) and the contact fracture energy in mode II ( G f . s ) mainly influence the maximum macroscopic compression strength. The s–s and m–m contacts were calibrated as part of the work presented in [45]. A maximum compression value of 0.80 MPa was adopted in the normal direction, close to the maximum uniaxial compression value of the laying mortar [21,24]. The mc–mc and c–c contacts were calibrated within the framework of this work.
The mortar–stone interface contacts, denoted as m–s, were not explicitly calibrated due to the lack of experimental results. Instead, it was assumed that their initial values are the same as those of the mortar–mortar (m–m) contacts. However, as supported by scientific evidence [29], this assumption may result in an overestimation of up to three times the m-s strength.
As shown, within a PM modeling approach, the complex macroscopic response of micro-concrete is obtained using simple interaction laws at the grain scale and the development of cracks and rupture surfaces appears naturally as an emergent feature, allowing large displacement to occur. With an FEM approach, complex cohesive contact models have been proposed to model cyclic behavior [54], but these models may require a significant number of parameters and may encounter convergence difficulties for large displacements [55].

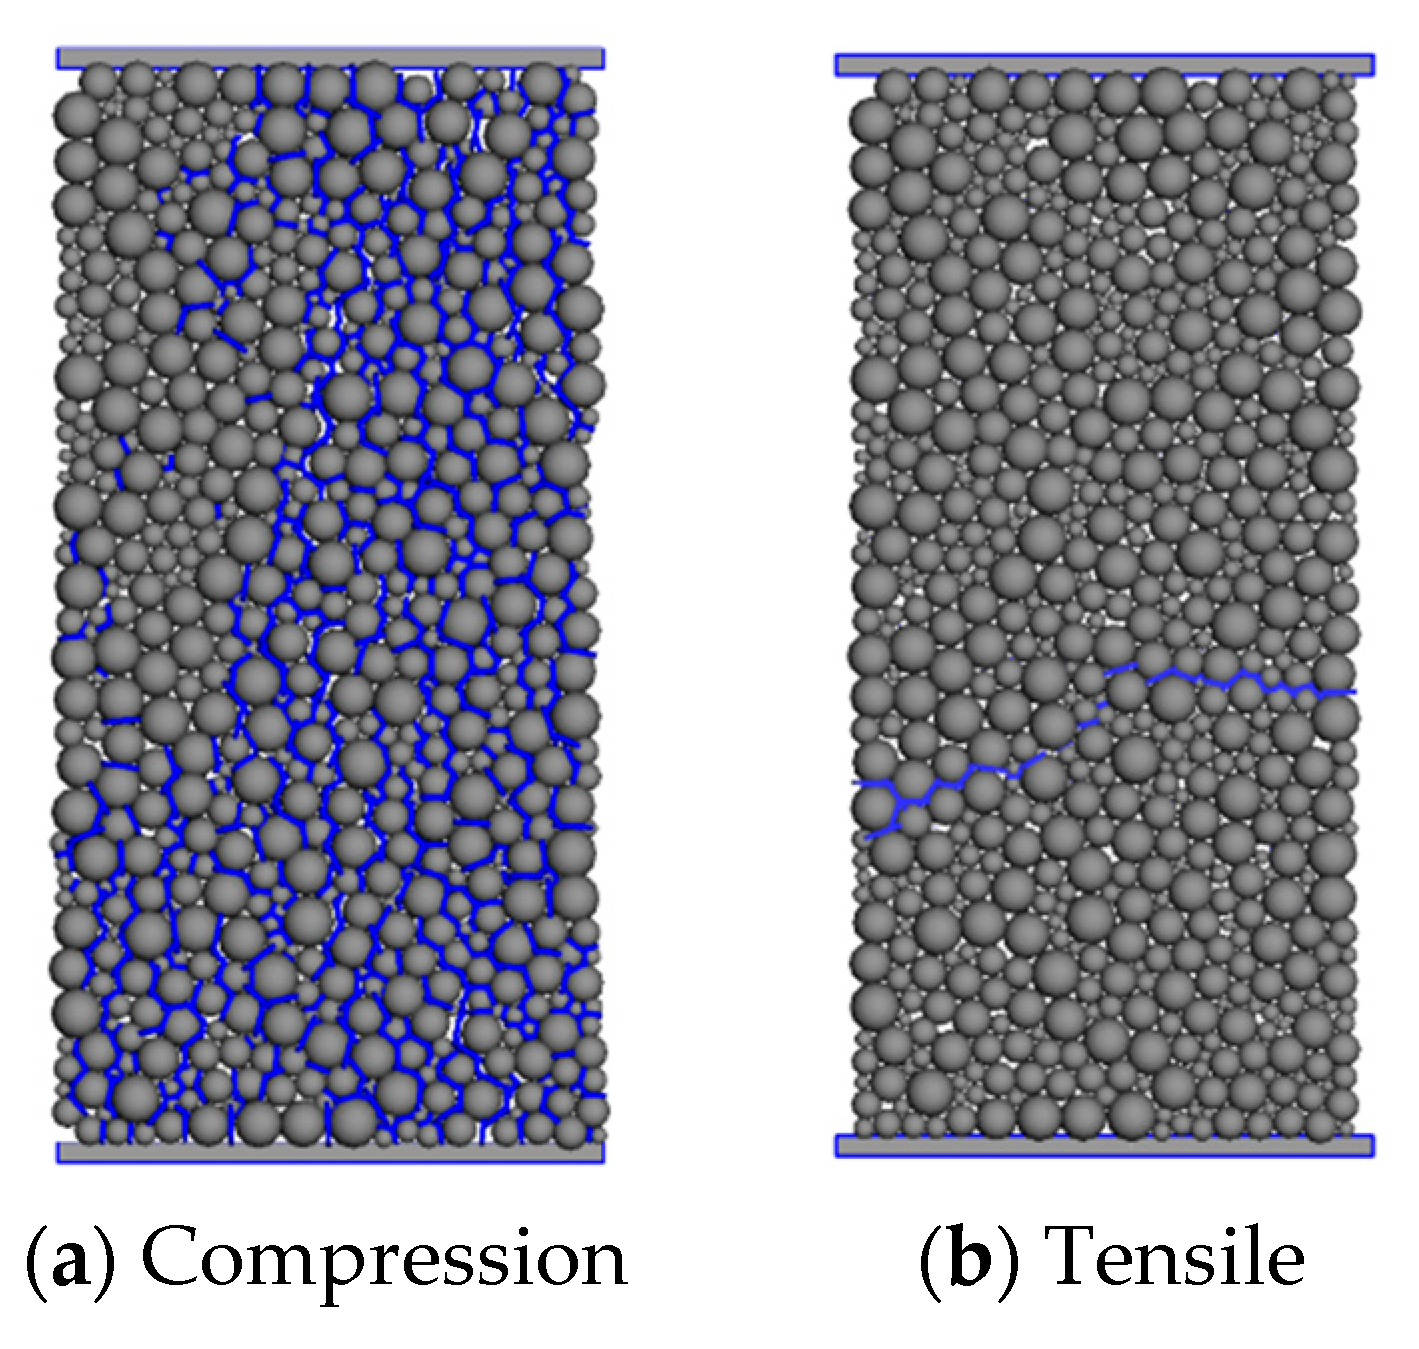
3. Uniaxial Compression Tests

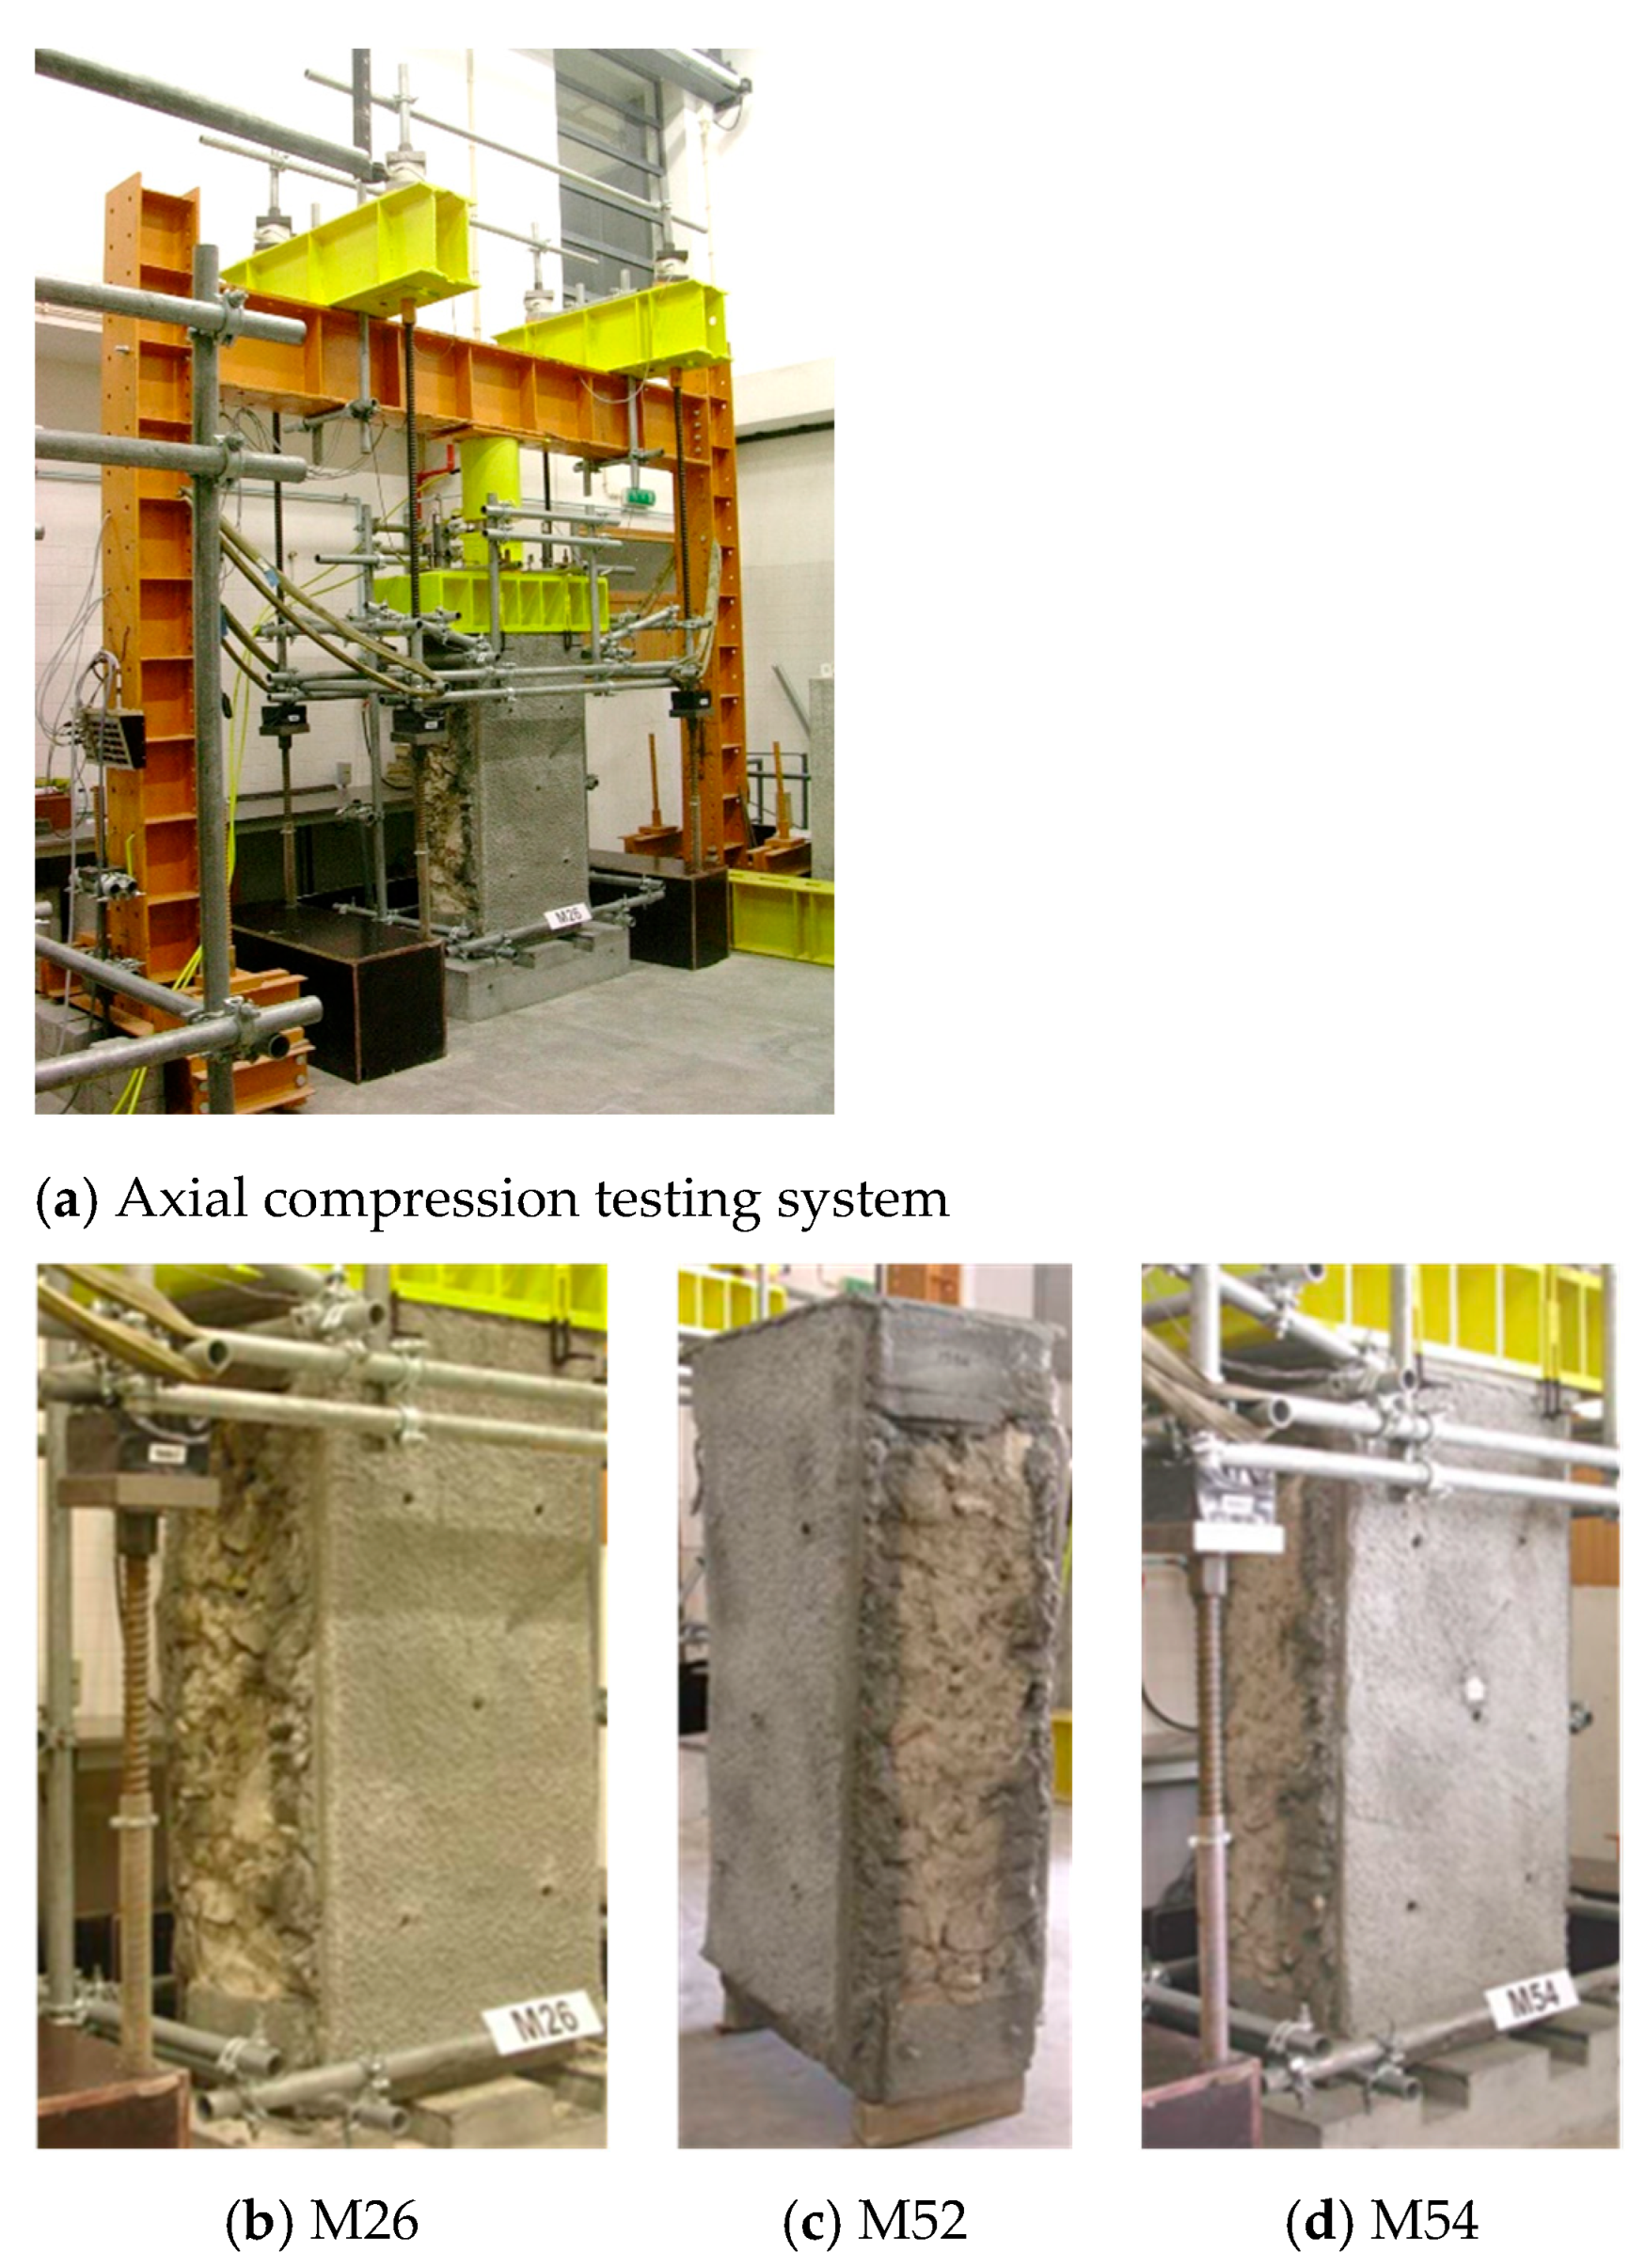
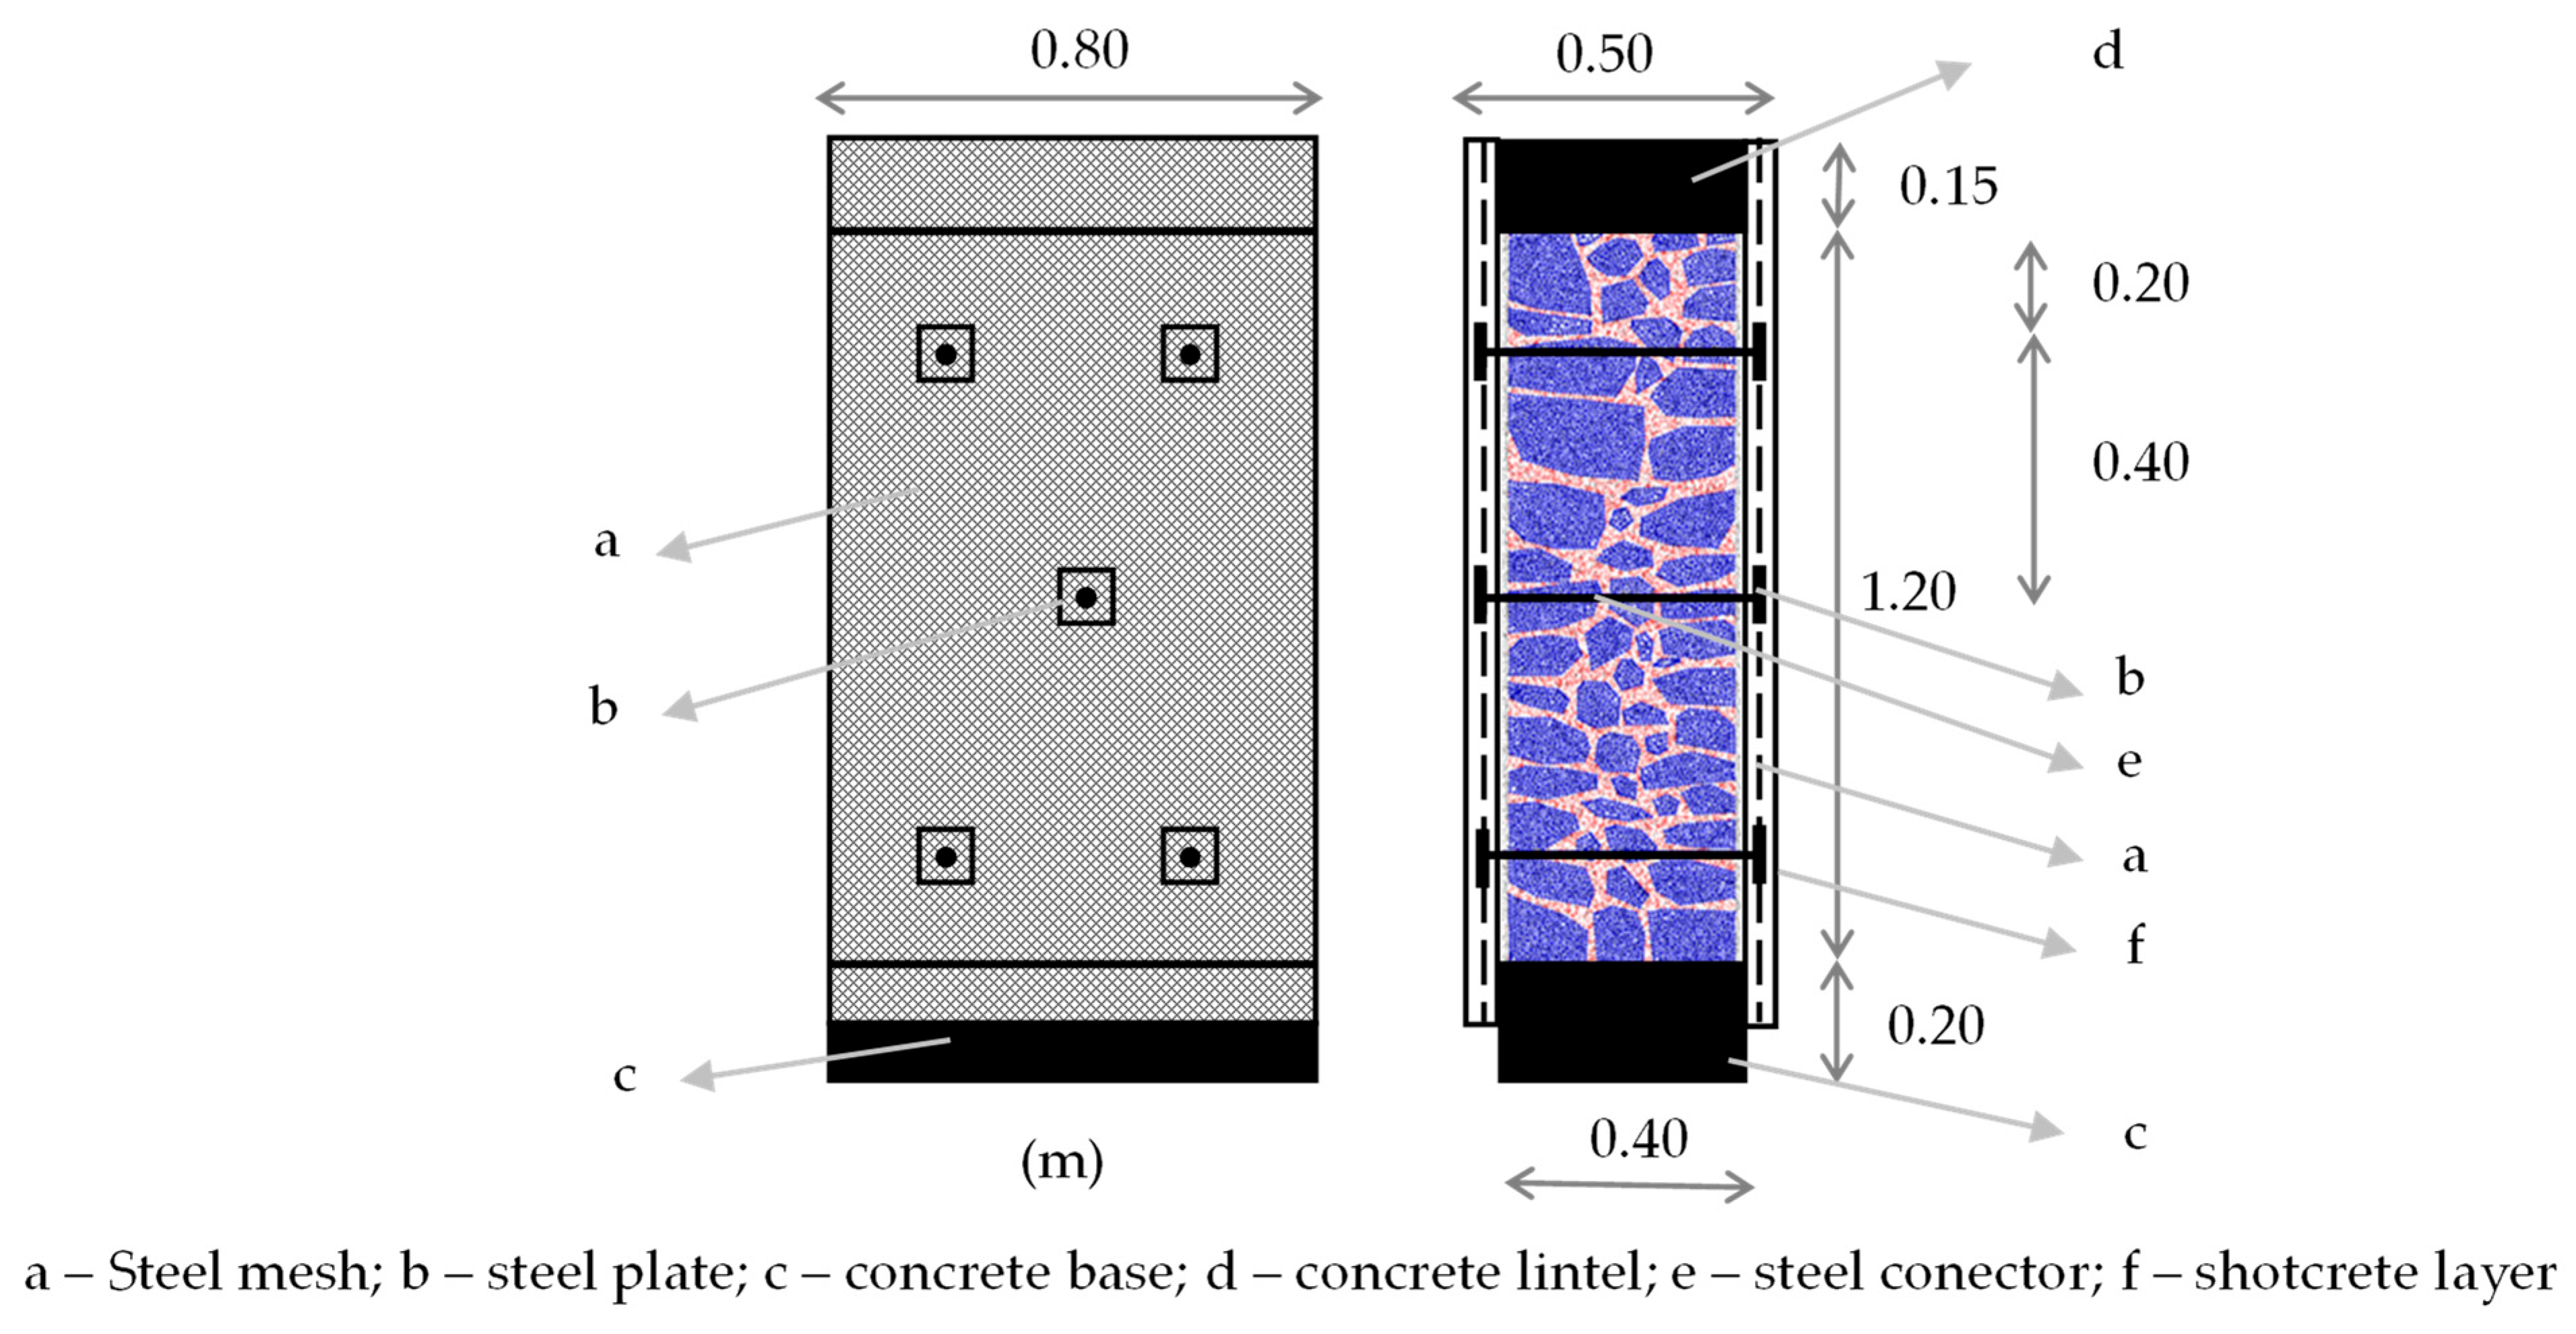
3.1. Experimental Work

The development of the numerical models presented was based on the results of the experimental program developed in [4,21]. The aim of the experimental work was to quantify the mechanical strength of experimental models (walls) made of simple irregular stone masonry and subjected to various reinforcement solutions, using test systems built for this purpose. The experimental models were subjected to axial compression tests and compression shear tests.
The masonry walls considered in this paper were built on concrete bases that are 0.20 m high and have dimensions of 0.80 m × 1.20 m × 0.40 m (length × height × thickness). On top of the concrete base, each masonry wall was built with limestone, mortared with hydrated air–lime and sand (river and sandpit), at a 1:3 ratio (hydrated air–lime/sand). Concrete lintels were built at the top of the walls to distribute the vertical load. A 3:1 ratio of stone masonry and mortar was used to build the walls, i.e., around 75% of the volume of each wall was filled with stone and the remaining 25% of the volume was filled with air-set mortar.
The reinforcement solution for the stone masonry walls selected for this study (M26, M52 and M54) [21] consists of a 0.05 m thick layer of reinforced micro-concrete, transversely confined by steel connectors (Figure 5).
The first layer of micro-concrete was mechanically sprayed with an average thickness of approximately 2.5 cm, immediately after the surface had been moistened. To place the steel connectors, horizontal holes with a diameter of 16 mm and a length of 45 cm were drilled to accommodate the 50 cm length steel rods (connectors). Each steel connector consisted of an M12 threaded steel bar connected to the two faces of the specimens by steel plates tightened with nuts at both ends of the bars. Each steel plate had square dimensions of 100 × 100 mm² and a thickness of 5 mm. The steel mesh was prefabricated from mild steel plates, obtained by cutting a steel plate with a thickness of 5 mm. The mesh was fixed to the micro-concrete surfaces according to the defined plan using nuts at both ends of the connectors. The nuts allowed controlled tightening of the mesh against the anchor plates, using a torque of 1 kg-m with a torque wrench. The second layer of micro-concrete had a similar average thickness (2.5 cm). The overall average thickness of the concrete layer is 5 cm. Figure 6 shows a schematic representation of the masonry walls reinforced with micro-concrete and steel transverse connectors.
The vertical load was applied to an area of 0.50 m × 0.80 m at the top of the masonry wall, which included the concrete lintel and micro-concrete layers. At the bottom of the wall, the load was applied to a reduced area of 0.40 m × 0.80 m, as the micro-concrete layers are not in contact with the test base. This configuration simulates the absence of foundation reinforcement, as considered in this series of strengthened specimens [21].

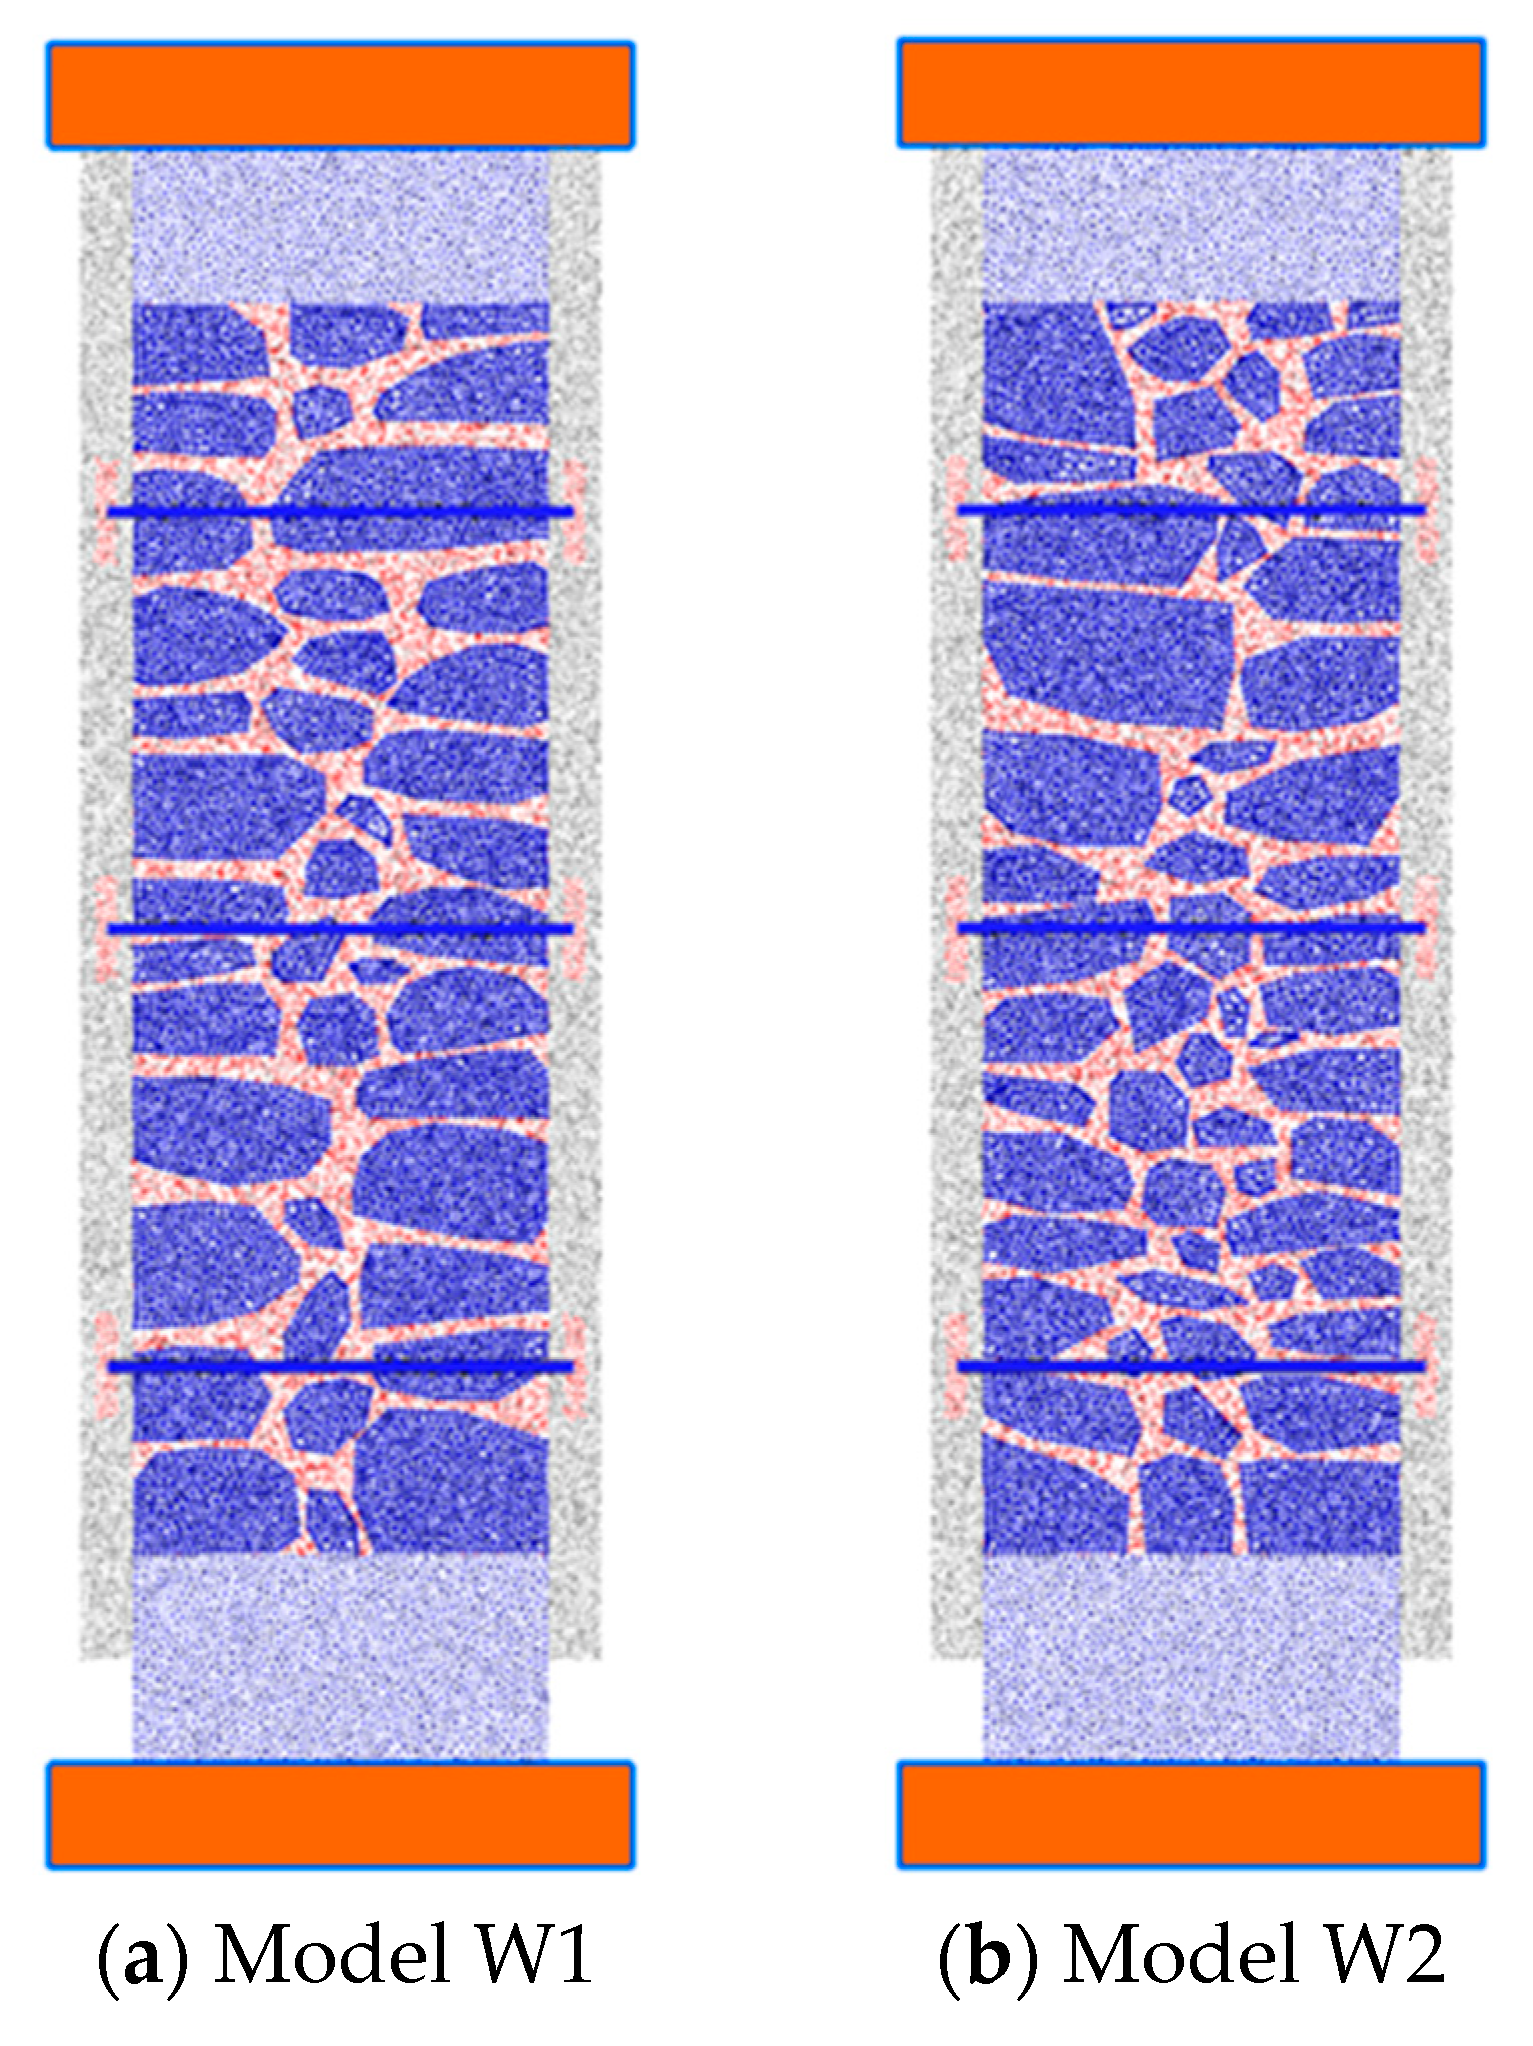
3.2. Computational Models for RPM Predictions

The numerical response of the uniaxial compression tests was conducted on 2D models, using Parmac2D. The study presented in [56] based on the FEM demonstrated that masonry walls subjected to in-plane loading, i.e., compression or compression–shear, exhibited similar distributions of horizontal in-plane and shear stress in both 2D and 3D analyses.
Two numerical PMs were developed from existing reinforced wall specimens: model W1, which used the stone and mortar layout of wall M61, and model W2, which used the stone and mortar layout of wall M57 [21,24]. Both numerical PMs incorporate the proposed reinforcement solution, namely micro-concrete layers on both sides and steel connectors. It is important to note that the models explicitly represent the concrete layers at the base and top of the masonry wall, thus improving the representation of the experimental setup.
Figure 7 shows the W1 and W2 PMs. As shown, both models consider transverse confinement and reinforcement solutions with two layers of micro-concrete, in which the steel plate is inserted into the micro-concrete layer. The steel plate was included in the particle model by considering that the inter-particle contacts in the vicinity of the anchoring steel plate behave elastically.
The representation of the numerical models by the adopted PMs required the definition of 13 “material/contact” types. These include inner material contacts of stone, mortar, micro-concrete, concrete, steel bars and plate effect, and inter-material contacts for mortar–stone, lower plate and micro-concrete, upper plate and micro-concrete, metal plate and micro-concrete, stone and micro-concrete, mortar and micro-concrete, and concrete and micro-concrete. The properties of the contacts do not vary over the wall’s domain.
It would have been possible to consider particle deformability through the inner discretization of each Voronoi cell with an inner FEM mesh either by adopting a hybrid particle/finite element model [39] or a combined finite–discrete element approach [41], but the deformable PM would be much more computationally demanding than the adopted PM. Note that, for this level of discretization, the influence of particle deformability is not as relevant when compared with coarser PMs [41].
To assess the performance of the 2D-RPM in representing the experimental uniaxial response of reinforcement masonry walls, the following methodology was followed. First, the numerical predictions using the calibrated parameters that were based on macroscopic predictions were compared with the experimental results. Subsequently, parametric studies were conducted to assess the sensitivity of the model to the most uncertain parameters. These include the placement of the steel plate (either inside or outside the micro-concrete layer), the influence of transverse confinement and the impact of the micro-concrete strength properties on the macroscopic response.

4. Results and Discussion

4.1. Calibrated Parameters Macroscopic Predictions

As the numerical PMs were created from existing wall specimens, the numerical PM predictions were compared with the experimental results of the M26 and M54 reinforced stone masonry walls [4]. In the numerical PMs, the effect of the vertical steel mesh placed between the two layers of the micro-concrete was not explicitly considered. As mentioned, in the vicinity of the steel plates that anchor the steel connectors, a linear elastic behavior was assumed for the particle–particle contacts (Figure 7).
There is significant uncertainty associated with the numerical modeling of the interface between the masonry elements and the micro-concrete in the absence of known experimental data. Therefore, in order to understand this aspect, the analysis and discussion of the numerical results are presented for three models: (i) N5e (model W1) and N6e (model W2), in which the contact between the existing masonry elements and the micro-concrete has the properties of the mortar contacts; (ii) N5f (model W1) and N6f (model W2), in which the mortar contacts have a maximum compressive stress of 2.0 MPa; and (iii) N5g (model W1) and N6g (model W2), in which the contact between the masonry elements and the micro-concrete has the stiffness and strength properties of the micro-concrete contacts.
Figure 8a shows the numerically predicted force–displacement diagrams for the numerical PMs derived from the W1 base model and Figure 8b shows the numerically predicted force–displacement diagrams for the numerical models derived from the W2 base model. Also shown are the experimental force–displacement diagrams for the M26 and M54 specimens [4,21]. As shown in Figure 8, models that adopt the contact properties of the mortar and micro-concrete contacts, with a maximum compressive stress of 2.0 MPa (N5f and N6f), yield a more accurate estimation of the experimental force–displacement curve, ductility and residual strength. The N5e and N6e models, in which the contact between the existing masonry elements and the micro-concrete has the properties of the mortar contacts, predict a peak strength that is higher than the value observed experimentally, and more brittle behavior after the peak strength is reached with a residual strength with approximately a 50% reduction. For the N5g and N6g models, in which the contact between the masonry elements and the micro-concrete has the stiffness and strength properties of the micro-concrete contacts, the strength reduction after the peak strength is reached is less evident when compared with the reduction predicted with N5e and N6e models. The residual strength is of the same order of magnitude as the peak strength observed experimentally.
Figure 9 presents the amplified failure modes for the PMs N5e, N5f and N5g (model W1) and the numerical models N6e, N6f and N6g (model W2). It is noticeable that there is an influence from the arrangement of the stones within the masonry wall. In the W2 geometry, there are more stones in the center, which hinders the development of vertical cracks in this area. In contrast, the W1 geometry is more prone to cracks, as a vertical crack path through the mortar can easily propagate. It is also interesting to note that, in the models without lateral confinement evaluated in Section 4.3, the numerical responses of W1 and W2 are much closer, which indicates that lateral confinement is relevant in the response of the masonry wall.
Figure 10 shows the force–displacement diagram of the N5f numerical model and the M54 experimental model [4,21], with specific points highlighted in the subsequent analysis. The evolution of the damage in the numerical model is also shown.
Figure 11 shows the failure mode, and the contact damage obtained during the numerical test of the N5f model. Four pairs of figures are presented, each corresponding to the points, P1 to P4, marked on the force–displacement diagram indicated in Figure 10. Although it is not noticeable in the failure mode figures, it is possible to see some damage in the initial phase (P1), occurring before the point of maximum stress is reached (P2). This damage accumulates progressively and more prominently until the failure occurs. Even for low vertical loading, contact damage develops in the PM. In the experimental results of [4,21], except for the M52 and M54 walls, cracks occurred mainly in the mortar, typically following a path around the stones. A similar behavior was observed in the PMs. Damage occurs only at the interface between the stone and the mortar or only between the mortar particles. No damage is predicted in the stone–stone contacts.

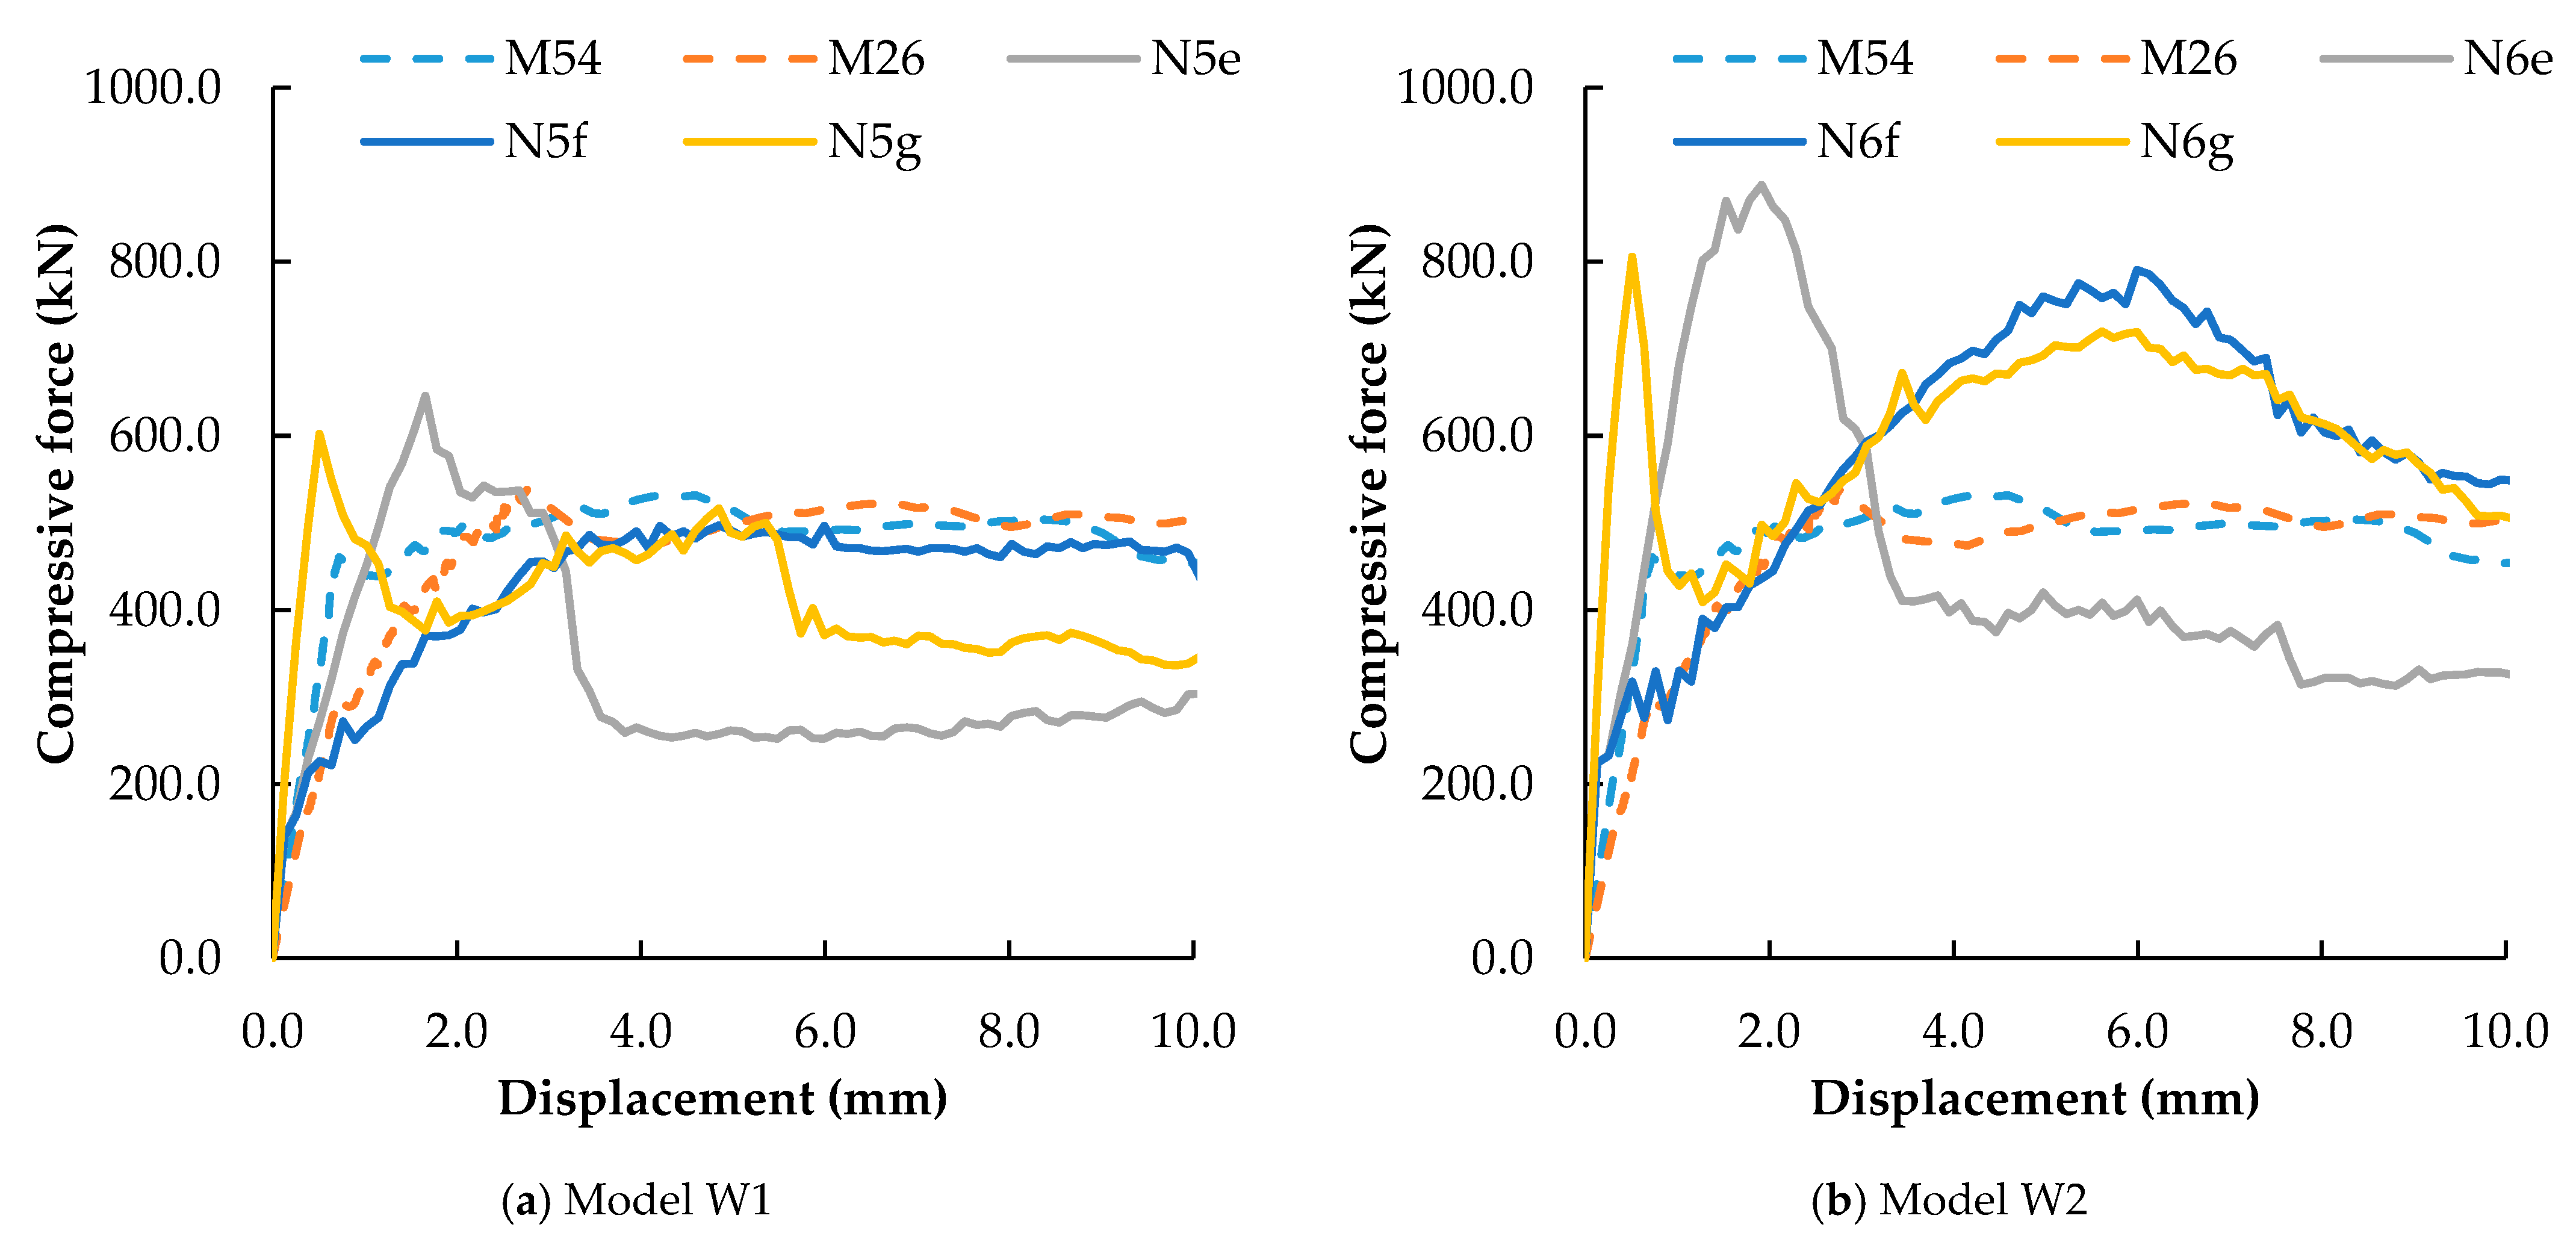
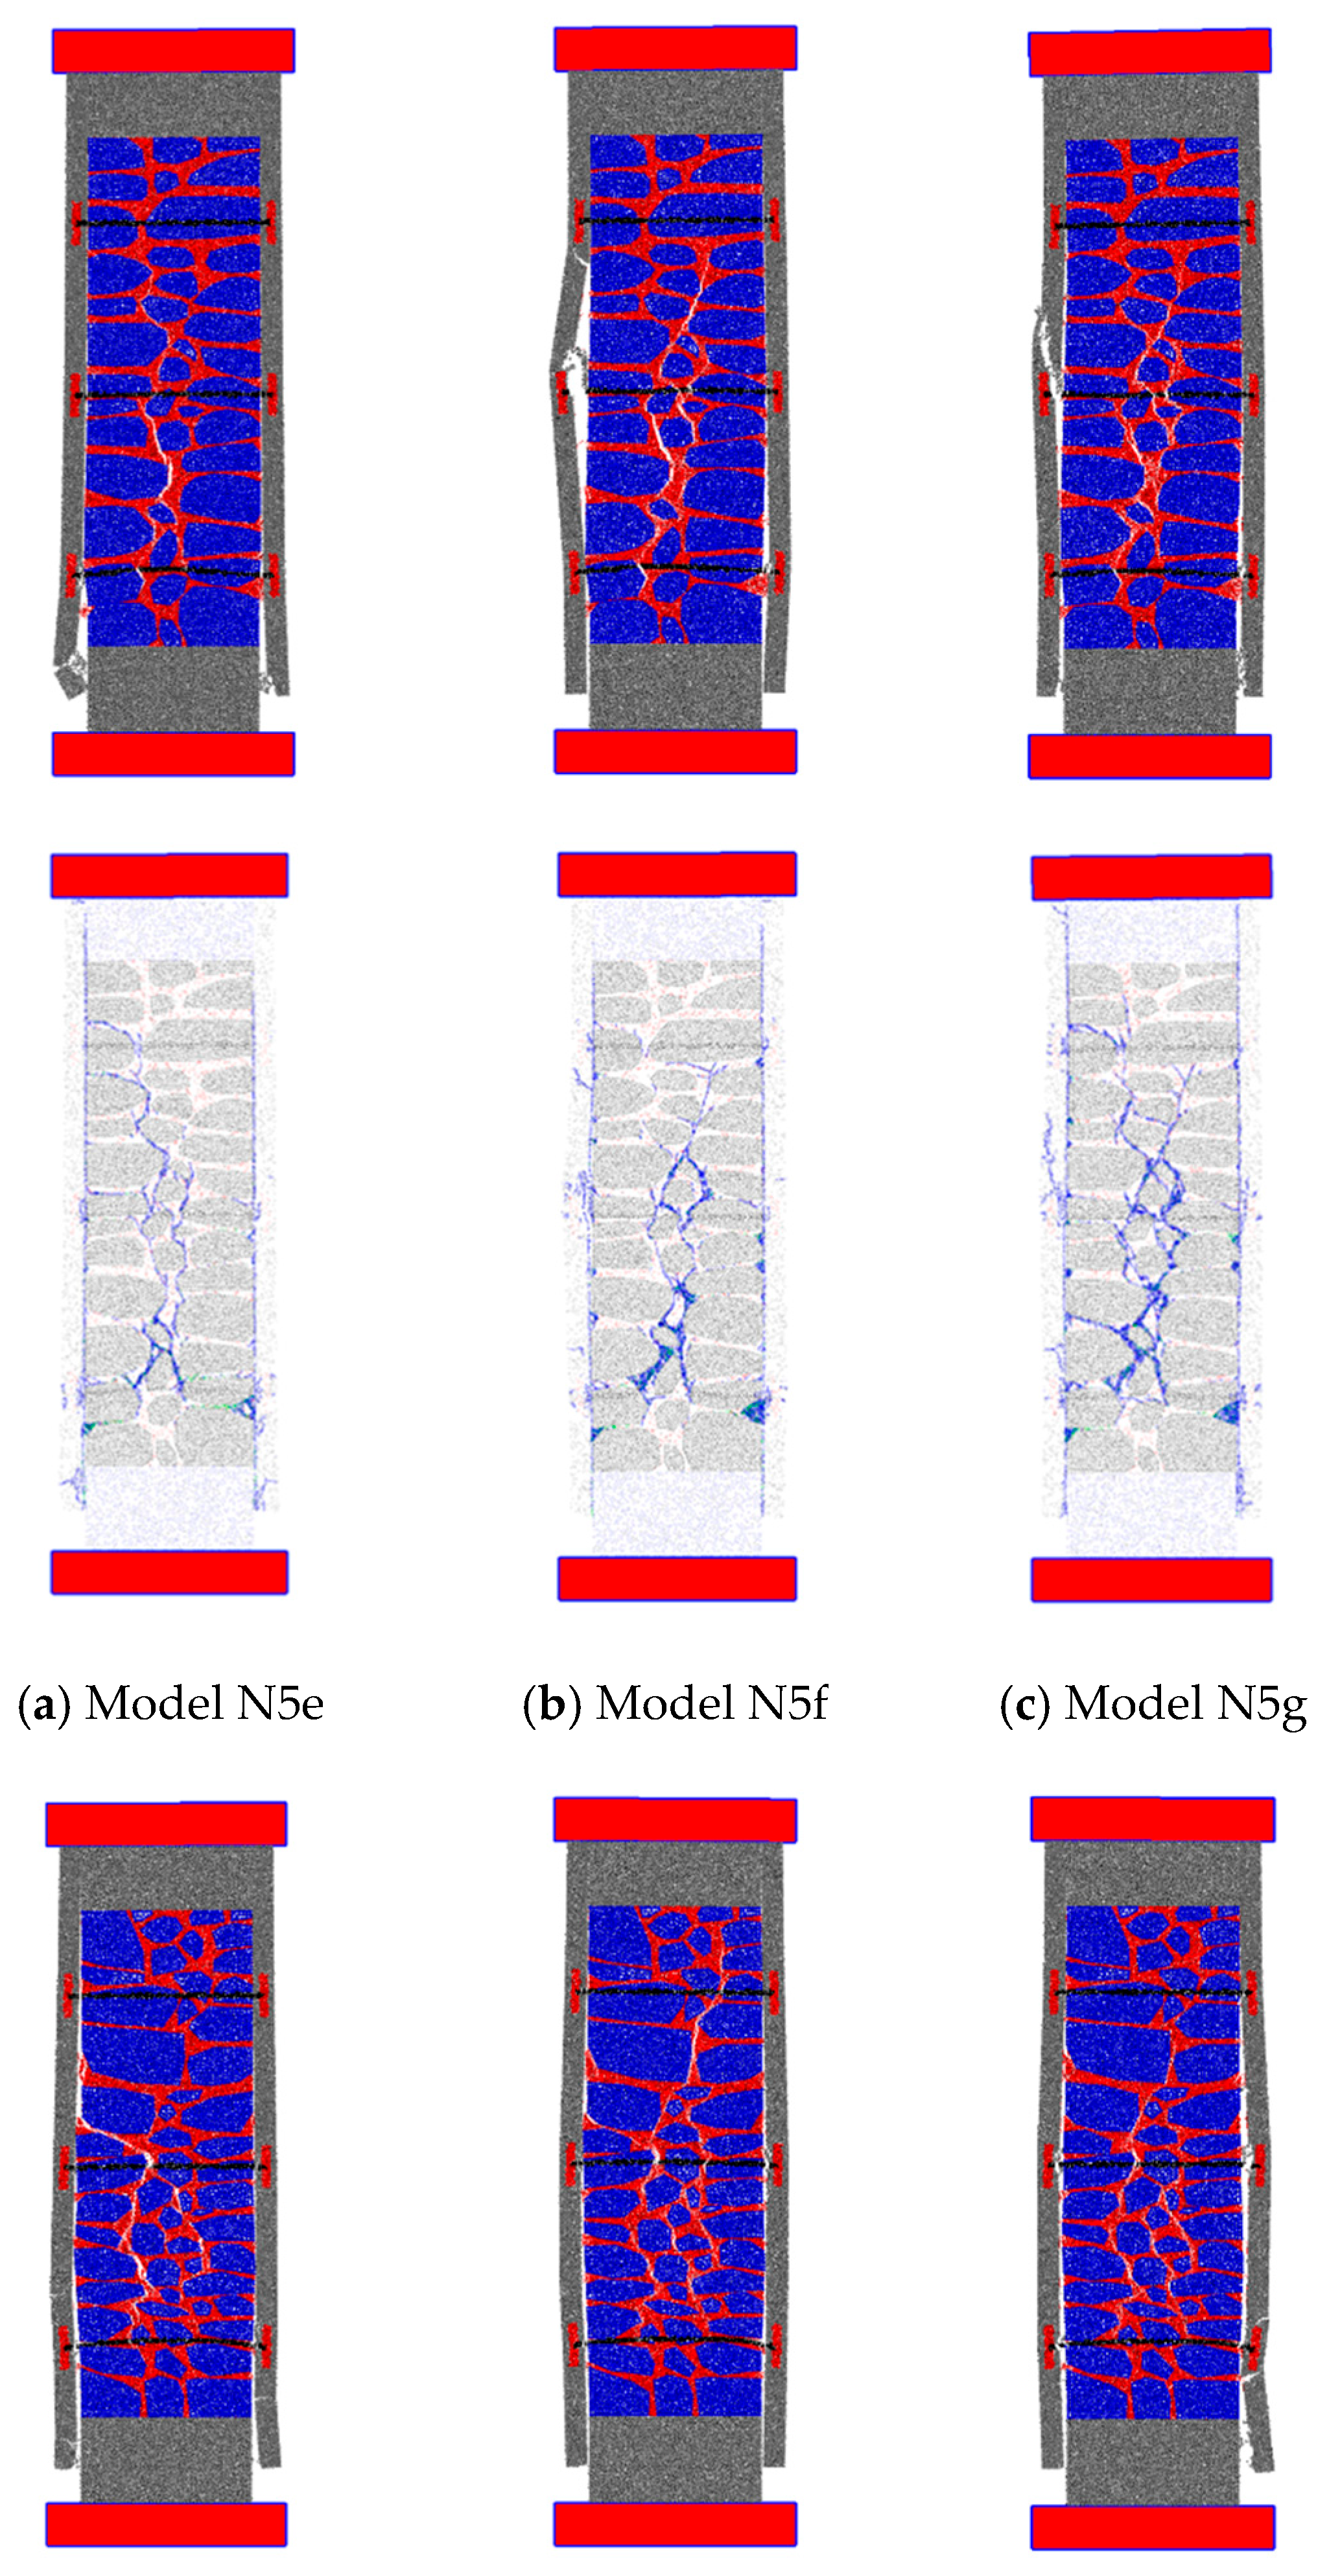
4.2. Overall Effect on the Macroscopic Response–Parametric Studies

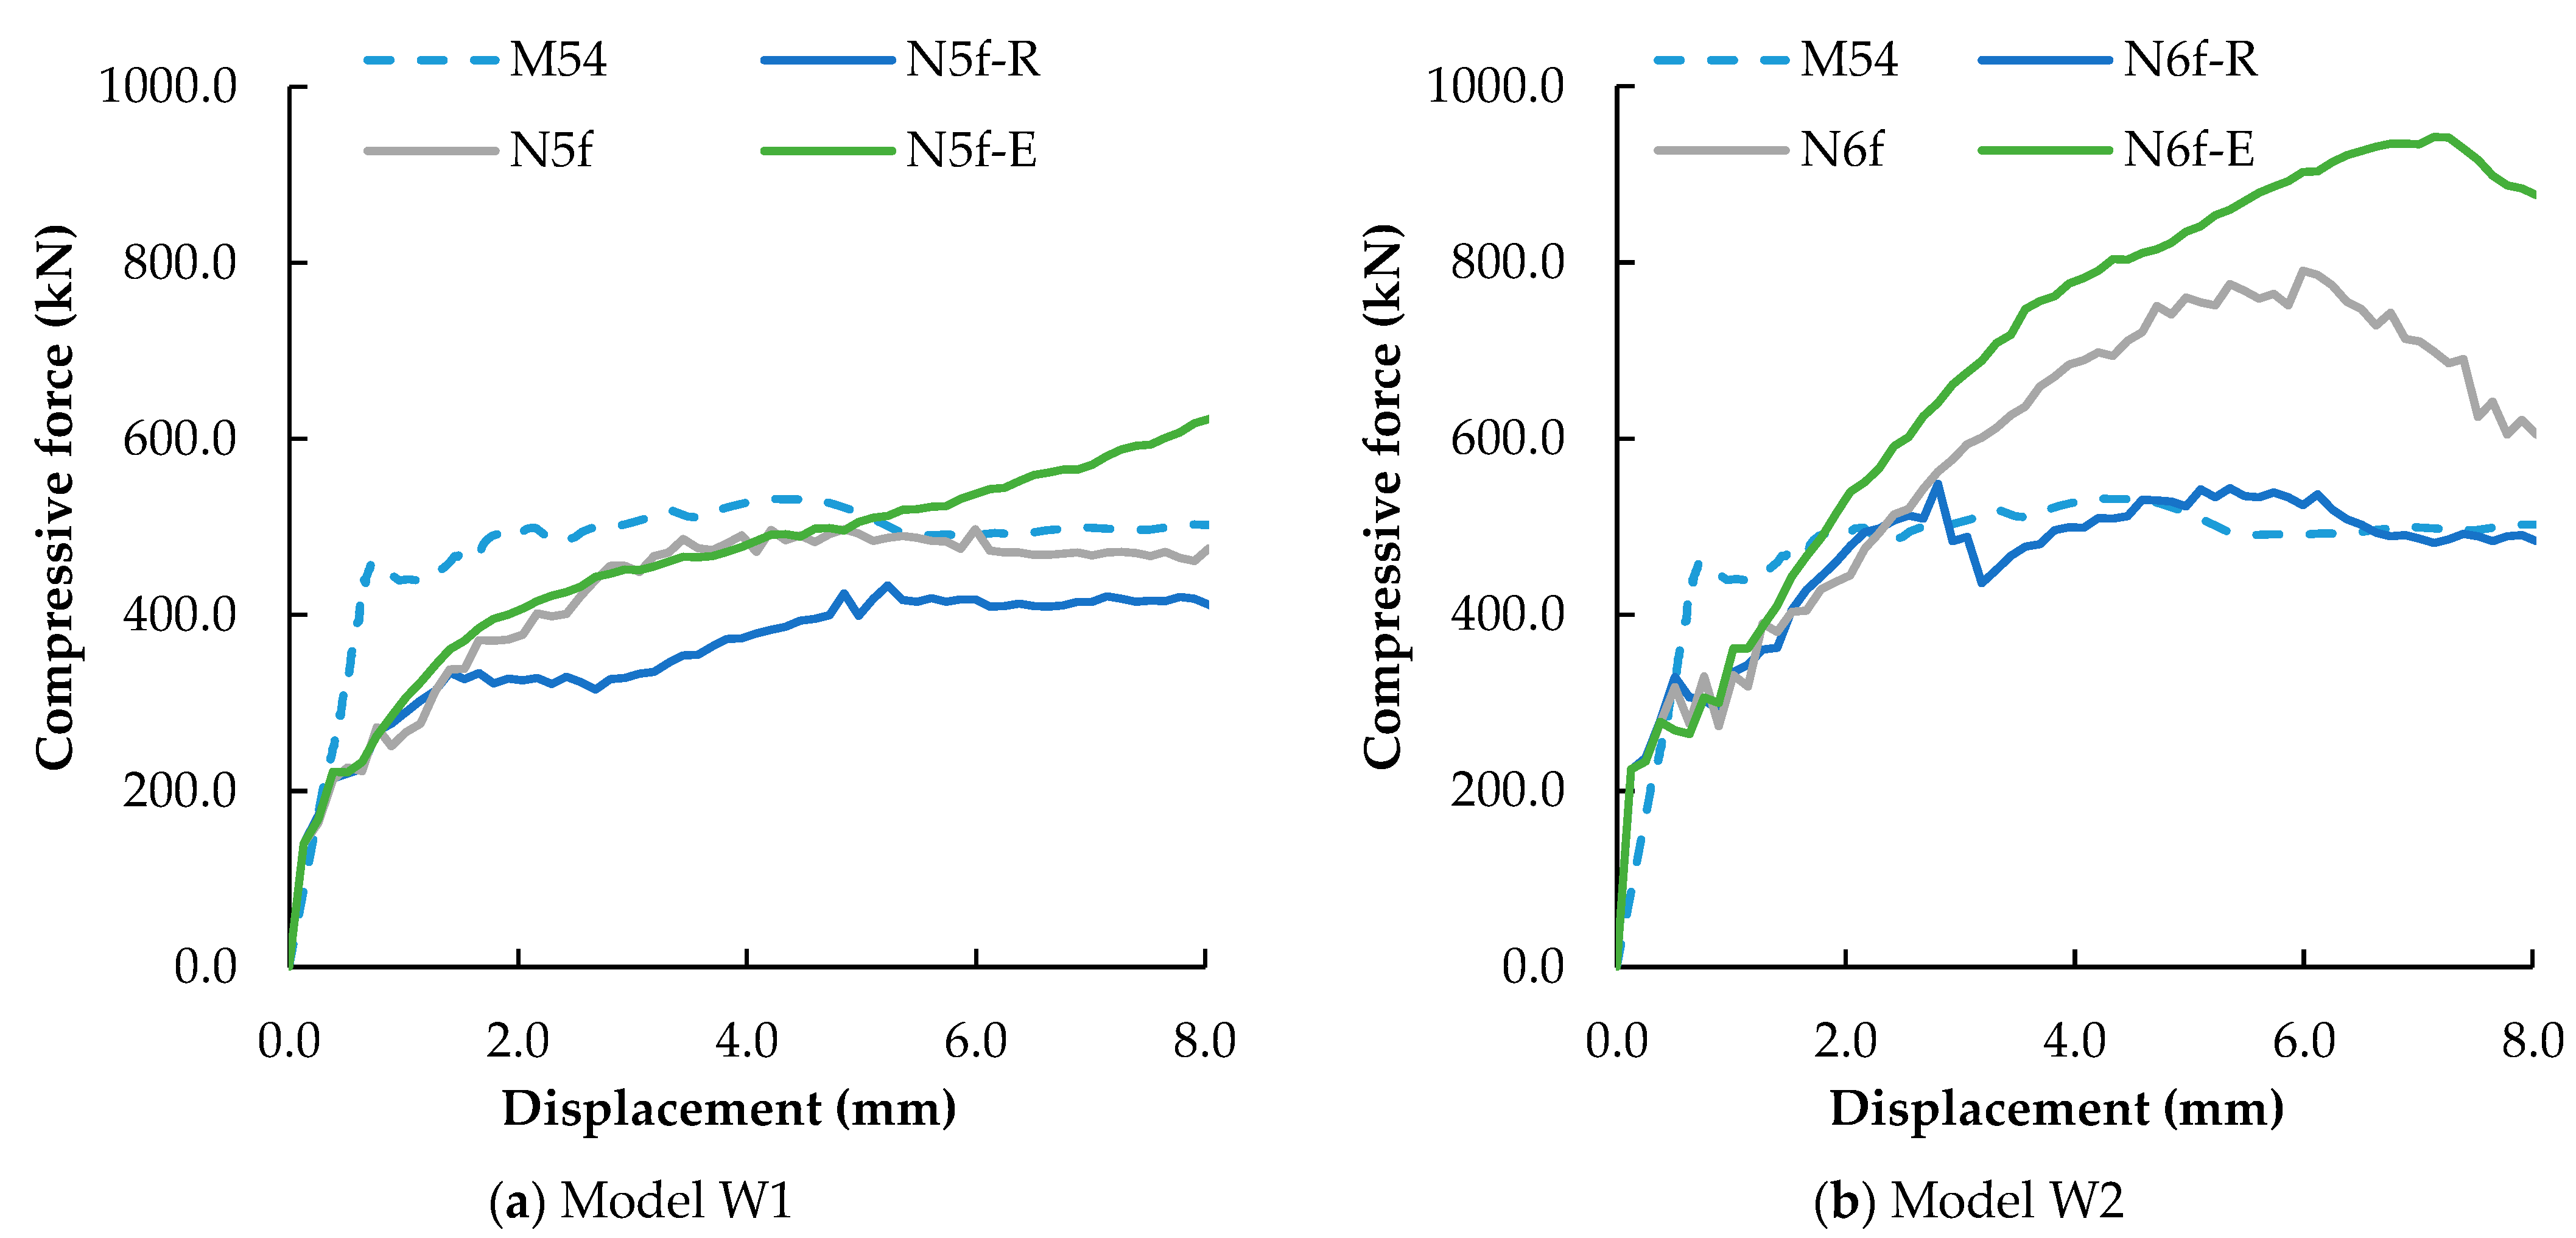
4.2.1. Steel Plate External to Micro-Concrete

The possibility of placing the anchor plate of the connectors external to the micro-concrete was numerically evaluated. The analysis and discussion of the numerical results is presented for two models: N3e (model W1) and N4e (model W2), in which the contact between the existing masonry elements and the micro-concrete has the properties of mortar, and N3f (model W1) and N4f (model W2), in which the mortar contacts have a maximum compressive stress of 2.0 MPa.
Figure 12 shows the force–displacement diagrams of the models based on W1 and W2, including the numerical response with the steel plates placed outside the micro-concrete model. As expected, placing the anchor plate outside the micro-concrete resulted in better confinement in that region. This improved confinement increased the compression at the interfaces, subsequently improving the performance of the reinforced wall. The residual value also increased, leading to higher peak force values compared to the models in which the plate was not positioned outside the micro-concrete layers.
As for the differences between the models based on the W1 geometry and those based on the W2 geometry as in the previous section, both the peak values and the residual values increased proportionally. The PM-predicted force–displacement diagrams of both models (W1, W2) have similarities (a higher peak and residual strength when the anchor plates are positioned on the outside of the micro-concrete).
Figure 13 shows the failure models for model W2 when the steel plates are placed outside the micro-concrete. Also presented are the failure modes obtained with similar PMs for the case in which the plates are internal to the micro-concrete layer. The numerical results clearly indicate that the external placement of the anchor plates increases the confinement of the micro-concrete, leading to better performance. The micro-concrete only cracked in the lower regions, since this is the area that lacks confinement. This approach offers structural advantages over placing the plates inside the micro-concrete.

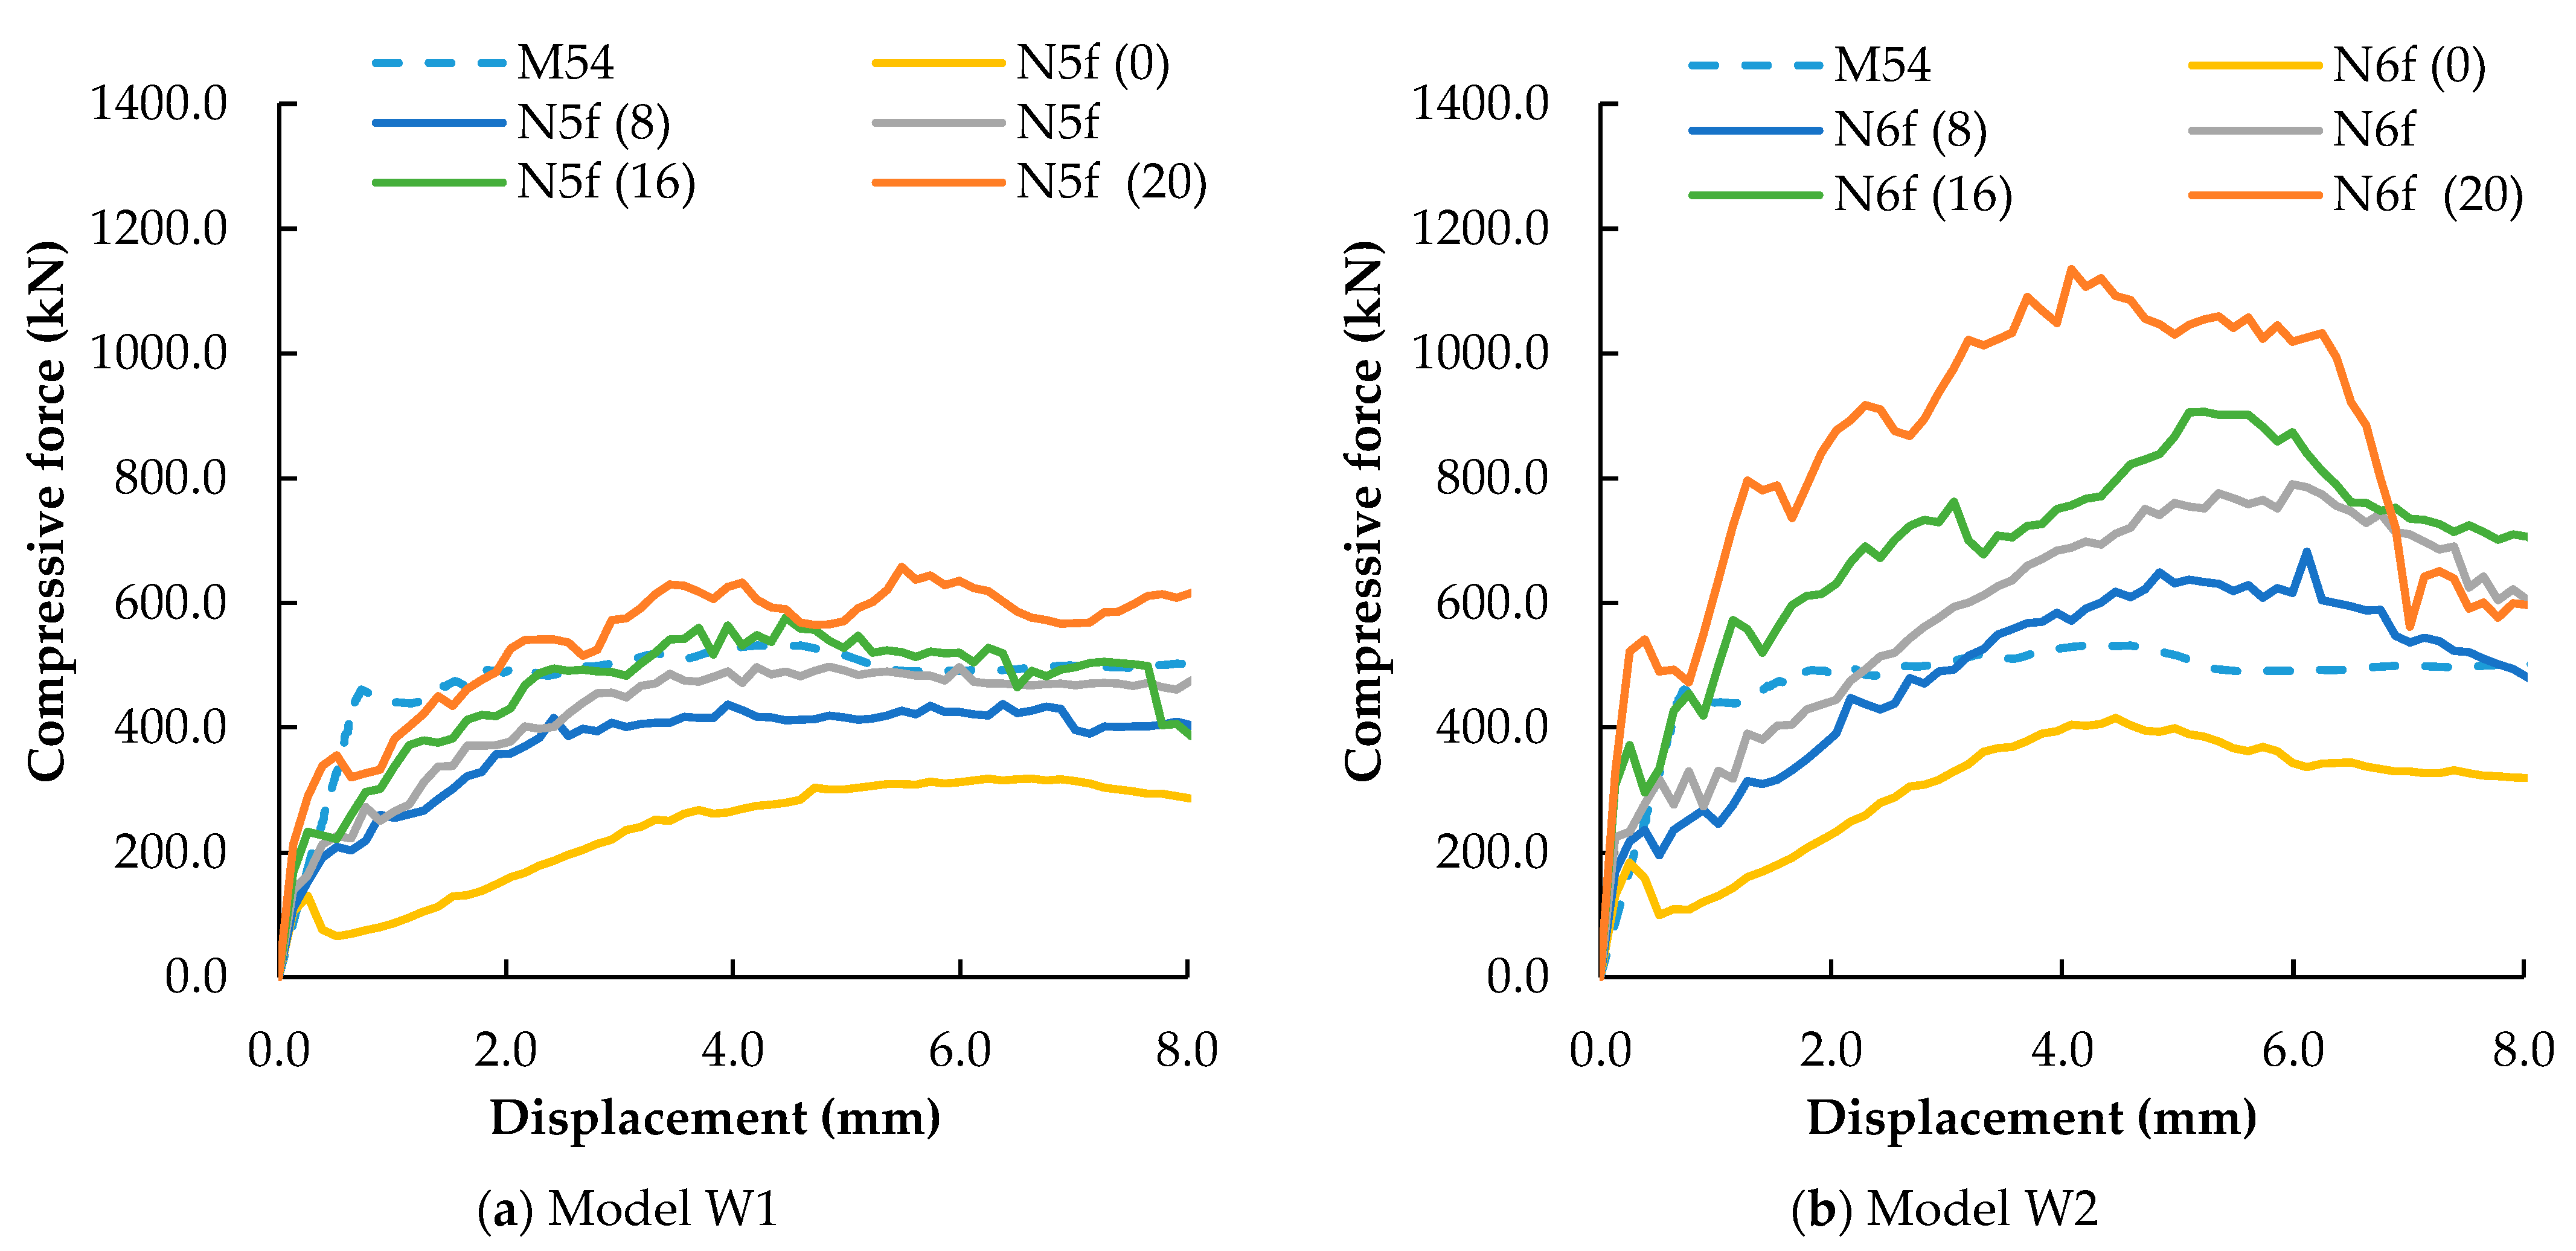
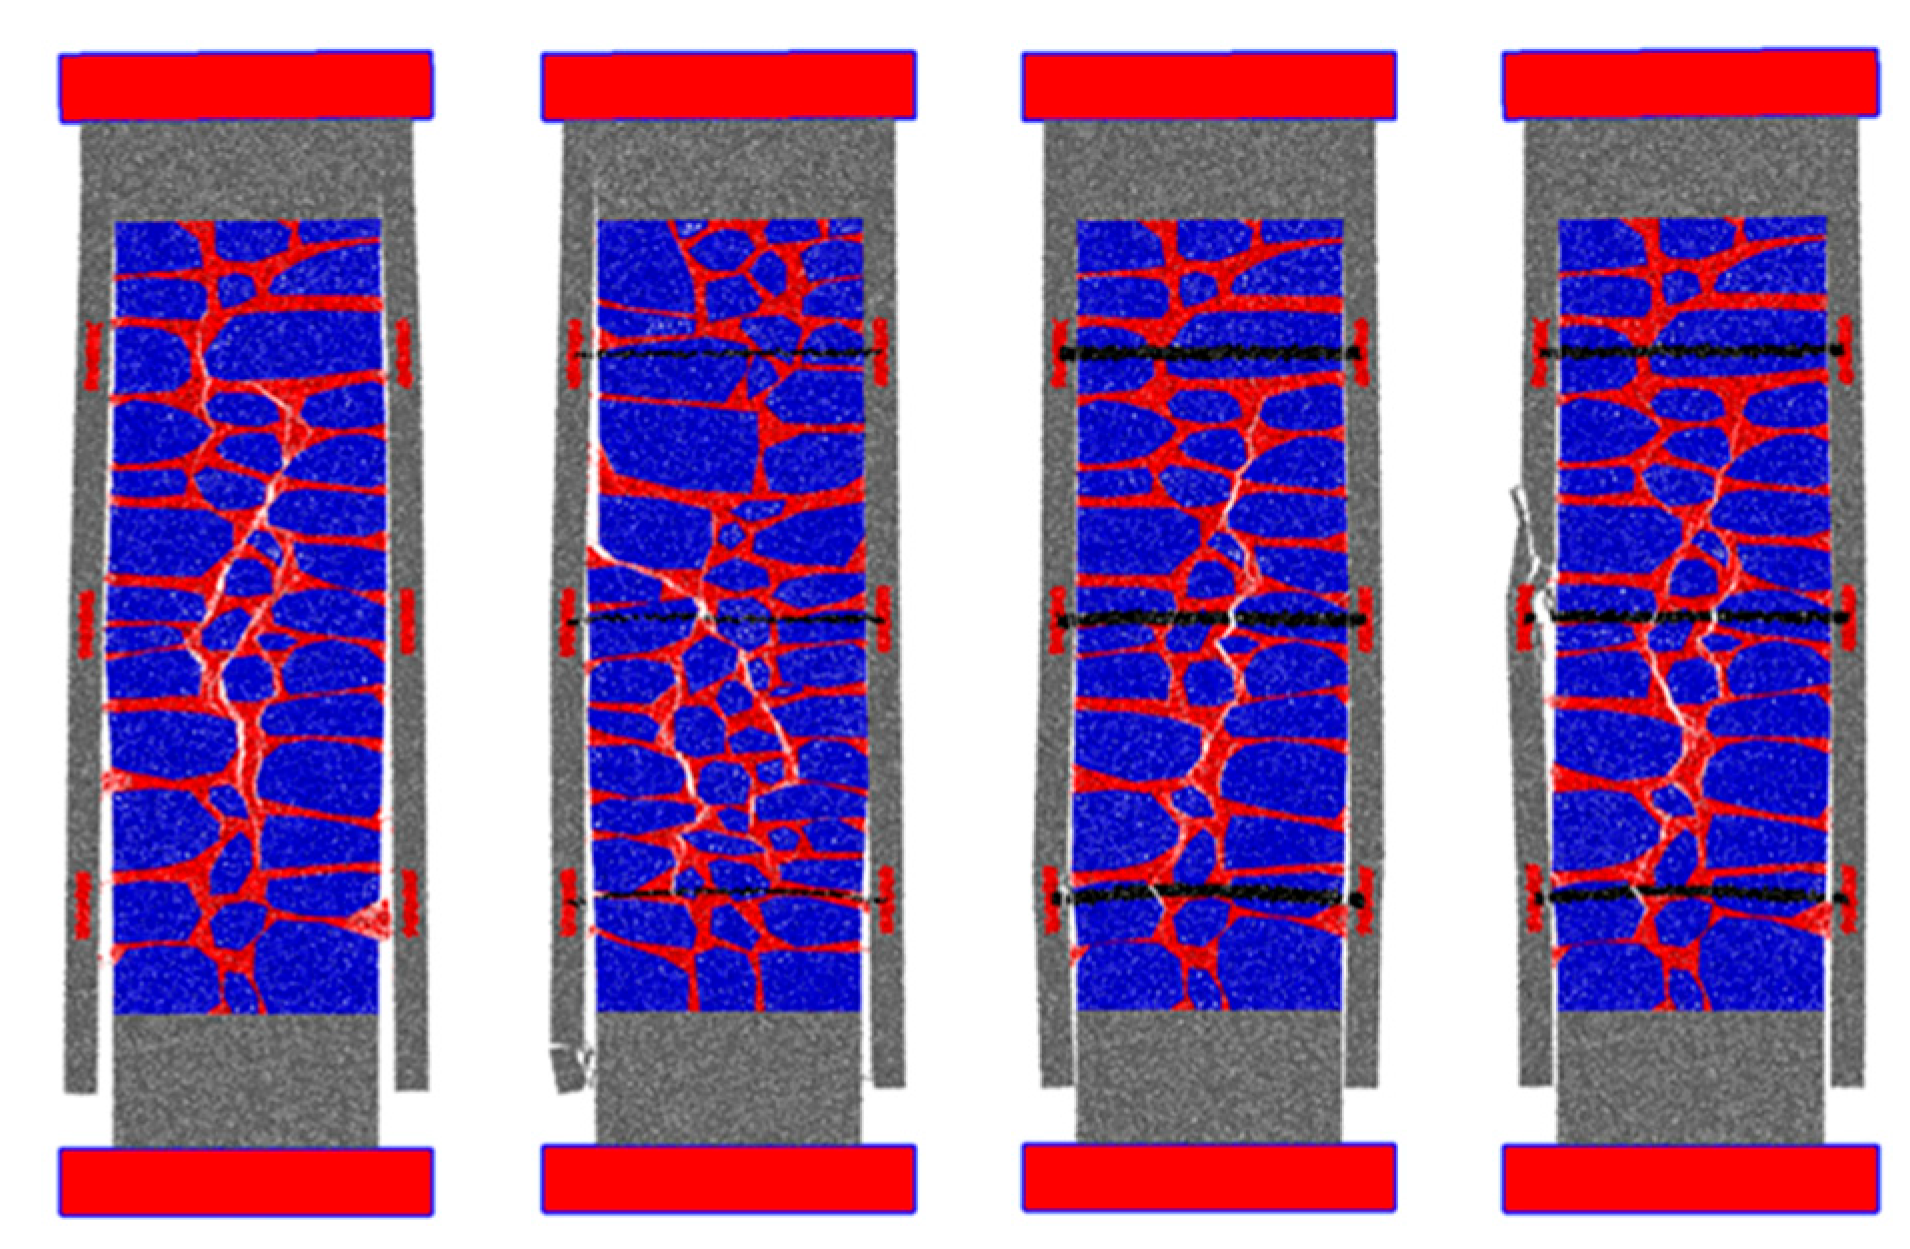
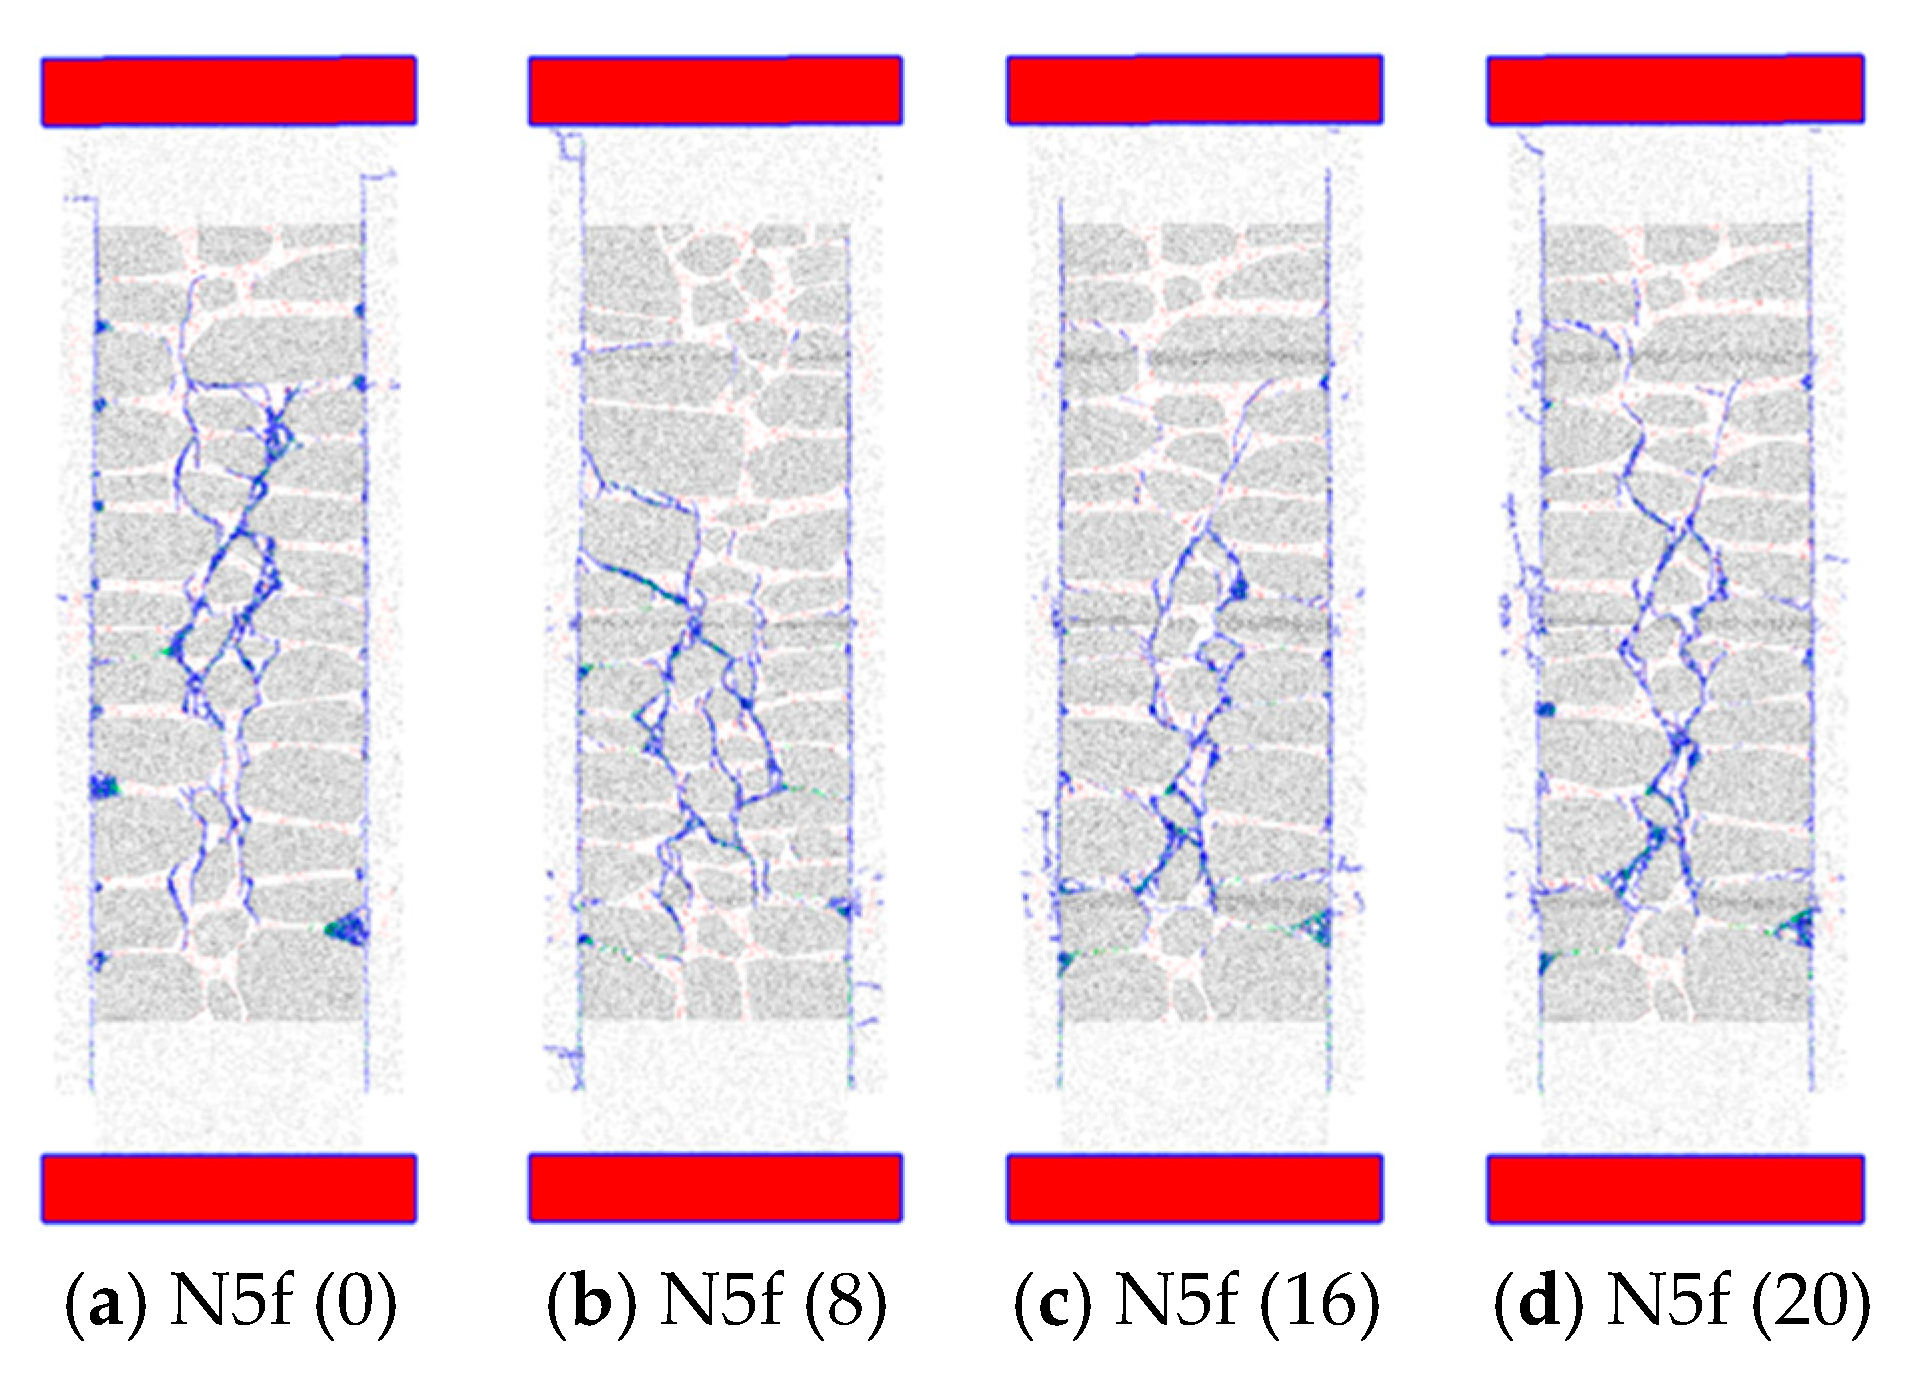
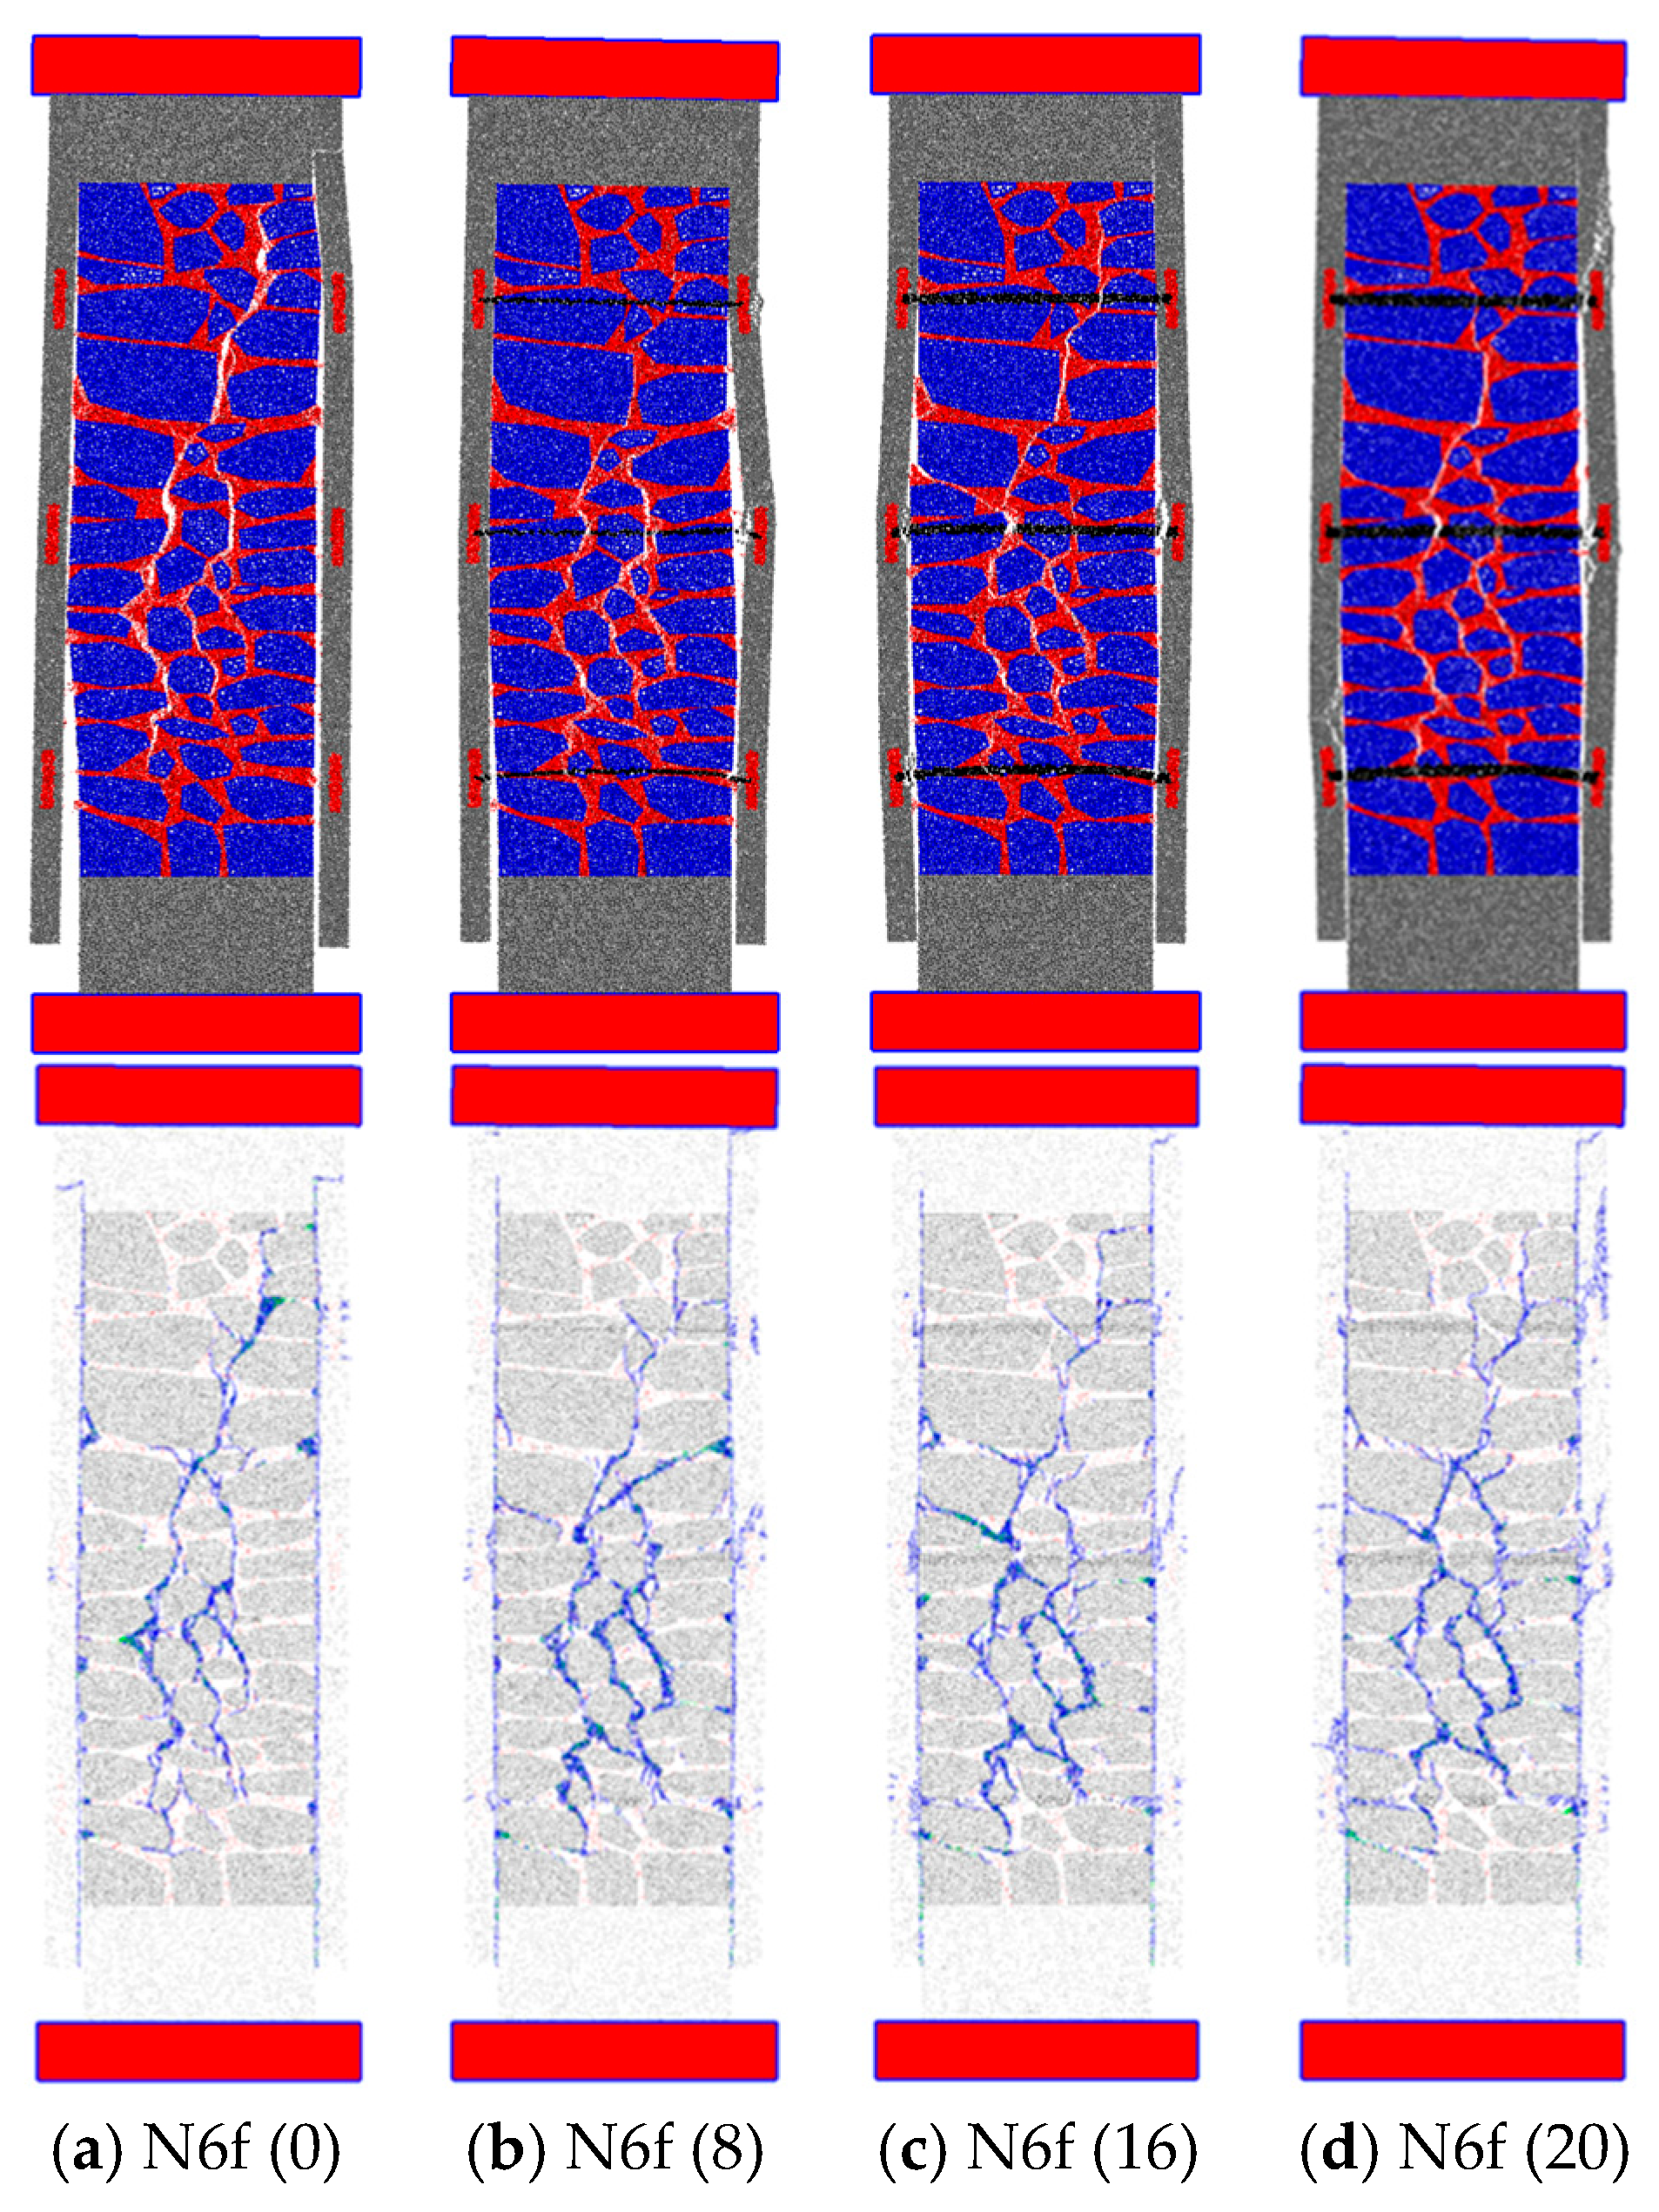
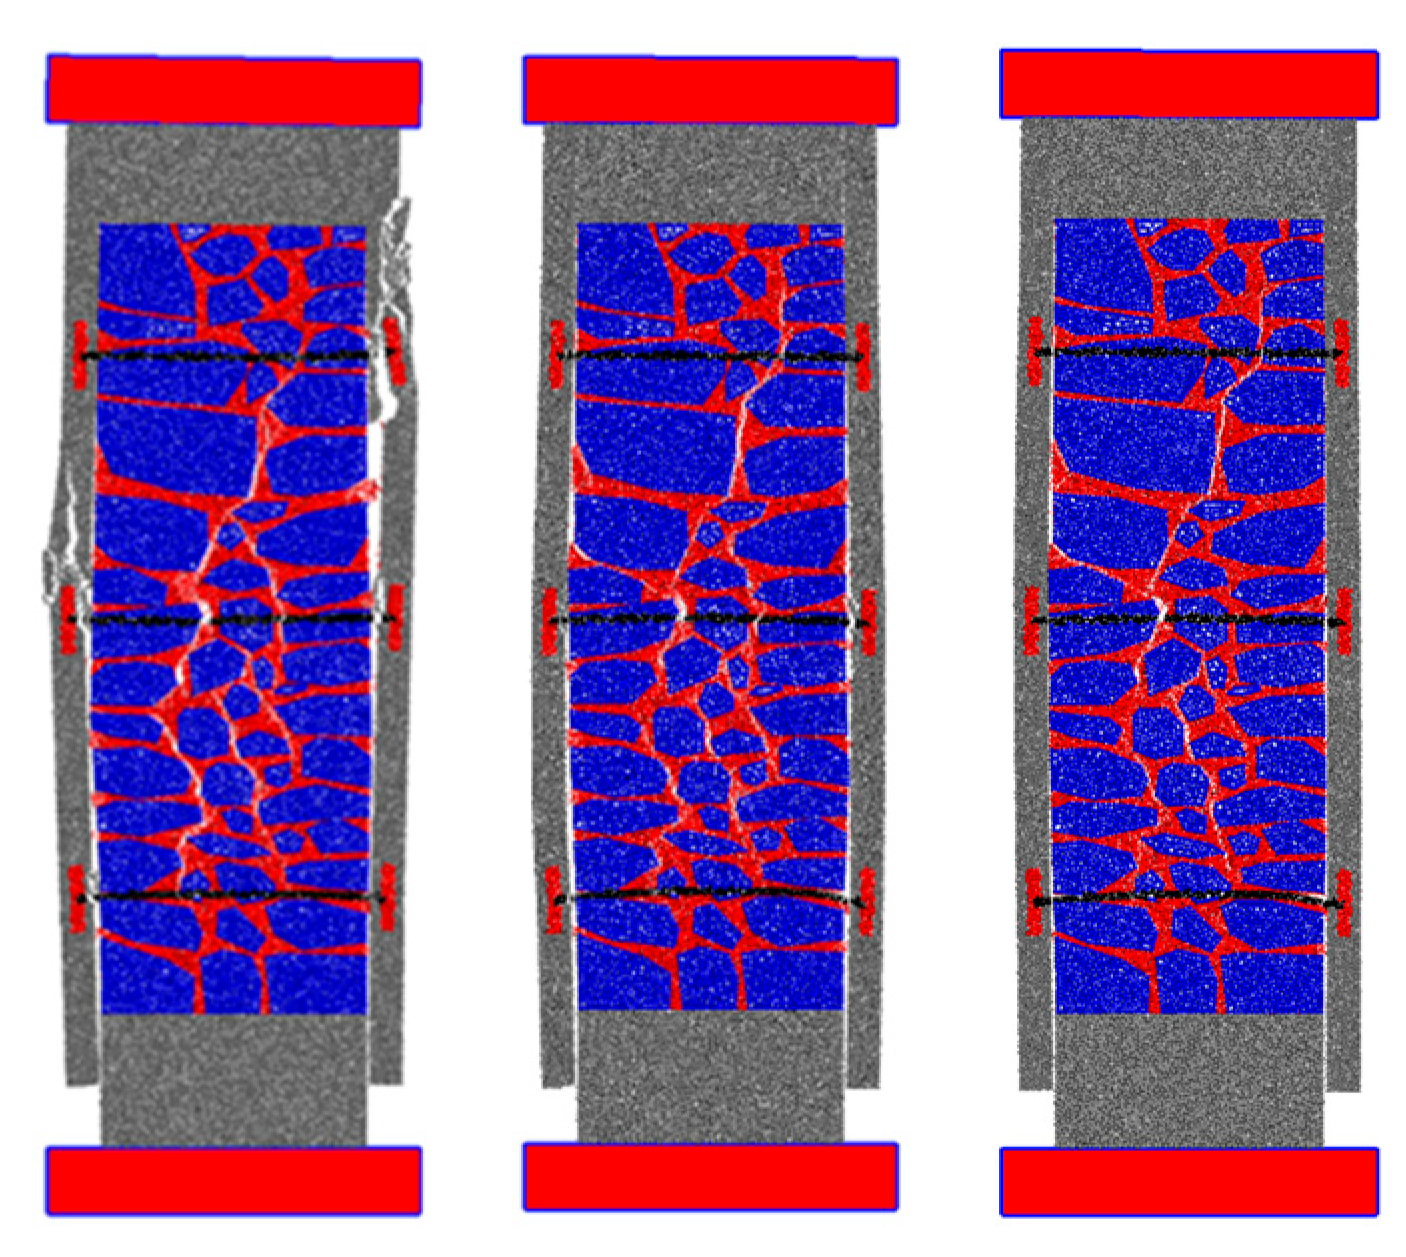
4.2.2. Steel Bar Diameter

In this section, the influence of the diameter of the steel bar on the behavior of the assessed ancient masonry walls is evaluated. Four different diameters are considered, along with a case in which steel bars were absent in the model, Table 3. Only the hypothesis in which the contact between the existing masonry elements and the micro-concrete has the properties of mortar and the mortar contacts have a maximum compressive stress of 2.0 MPa is presented, including both N5f (model W1) and N6f (model W2).
In Figure 14, a comparison is made between the results predicted with the PM for the different steel bar diameters and contact between the masonry elements and the micro-concrete. The experimental results of M54 are also presented [4]. As expected, increasing the connector diameter improves the response of the reinforced masonry walls. The predicted numerical peak strength value is higher, as is the residual term. The absence of steel bars significantly weakens the wall’s macroscopic response, confirming that the connector bar is an essential element for these types of reinforced solutions. The differences between the models based on geometry W1 and those based on geometry W2 remain consistent regardless of the steel bar diameter.
Figure 15 and Figure 16 present, for model W1 and model W2, the failure mode and the final contact crack distribution of the adopted PMs with different connector sizes. Upon analyzing the figures, it is evident that the steel bars play a crucial role in the masonry wall confinement. Regardless of the base model and wall geometry, when these steel bars are absent, the cracks are larger and detachment/delamination of the micro-concrete layer occurs, which is more detrimental to the wall behavior. The maximum vertical force in the absence of transversal confinement is close to the values obtained experimentally for the URM specimens of 137 kN [4]. Transversal confinement resulted in a force amplification factor close to 4.0 [4].
Increasing the steel bars’ diameter resulted in an increase in the strength of the models, however, there were no significant differences in terms of the final deformation and crack patterns.

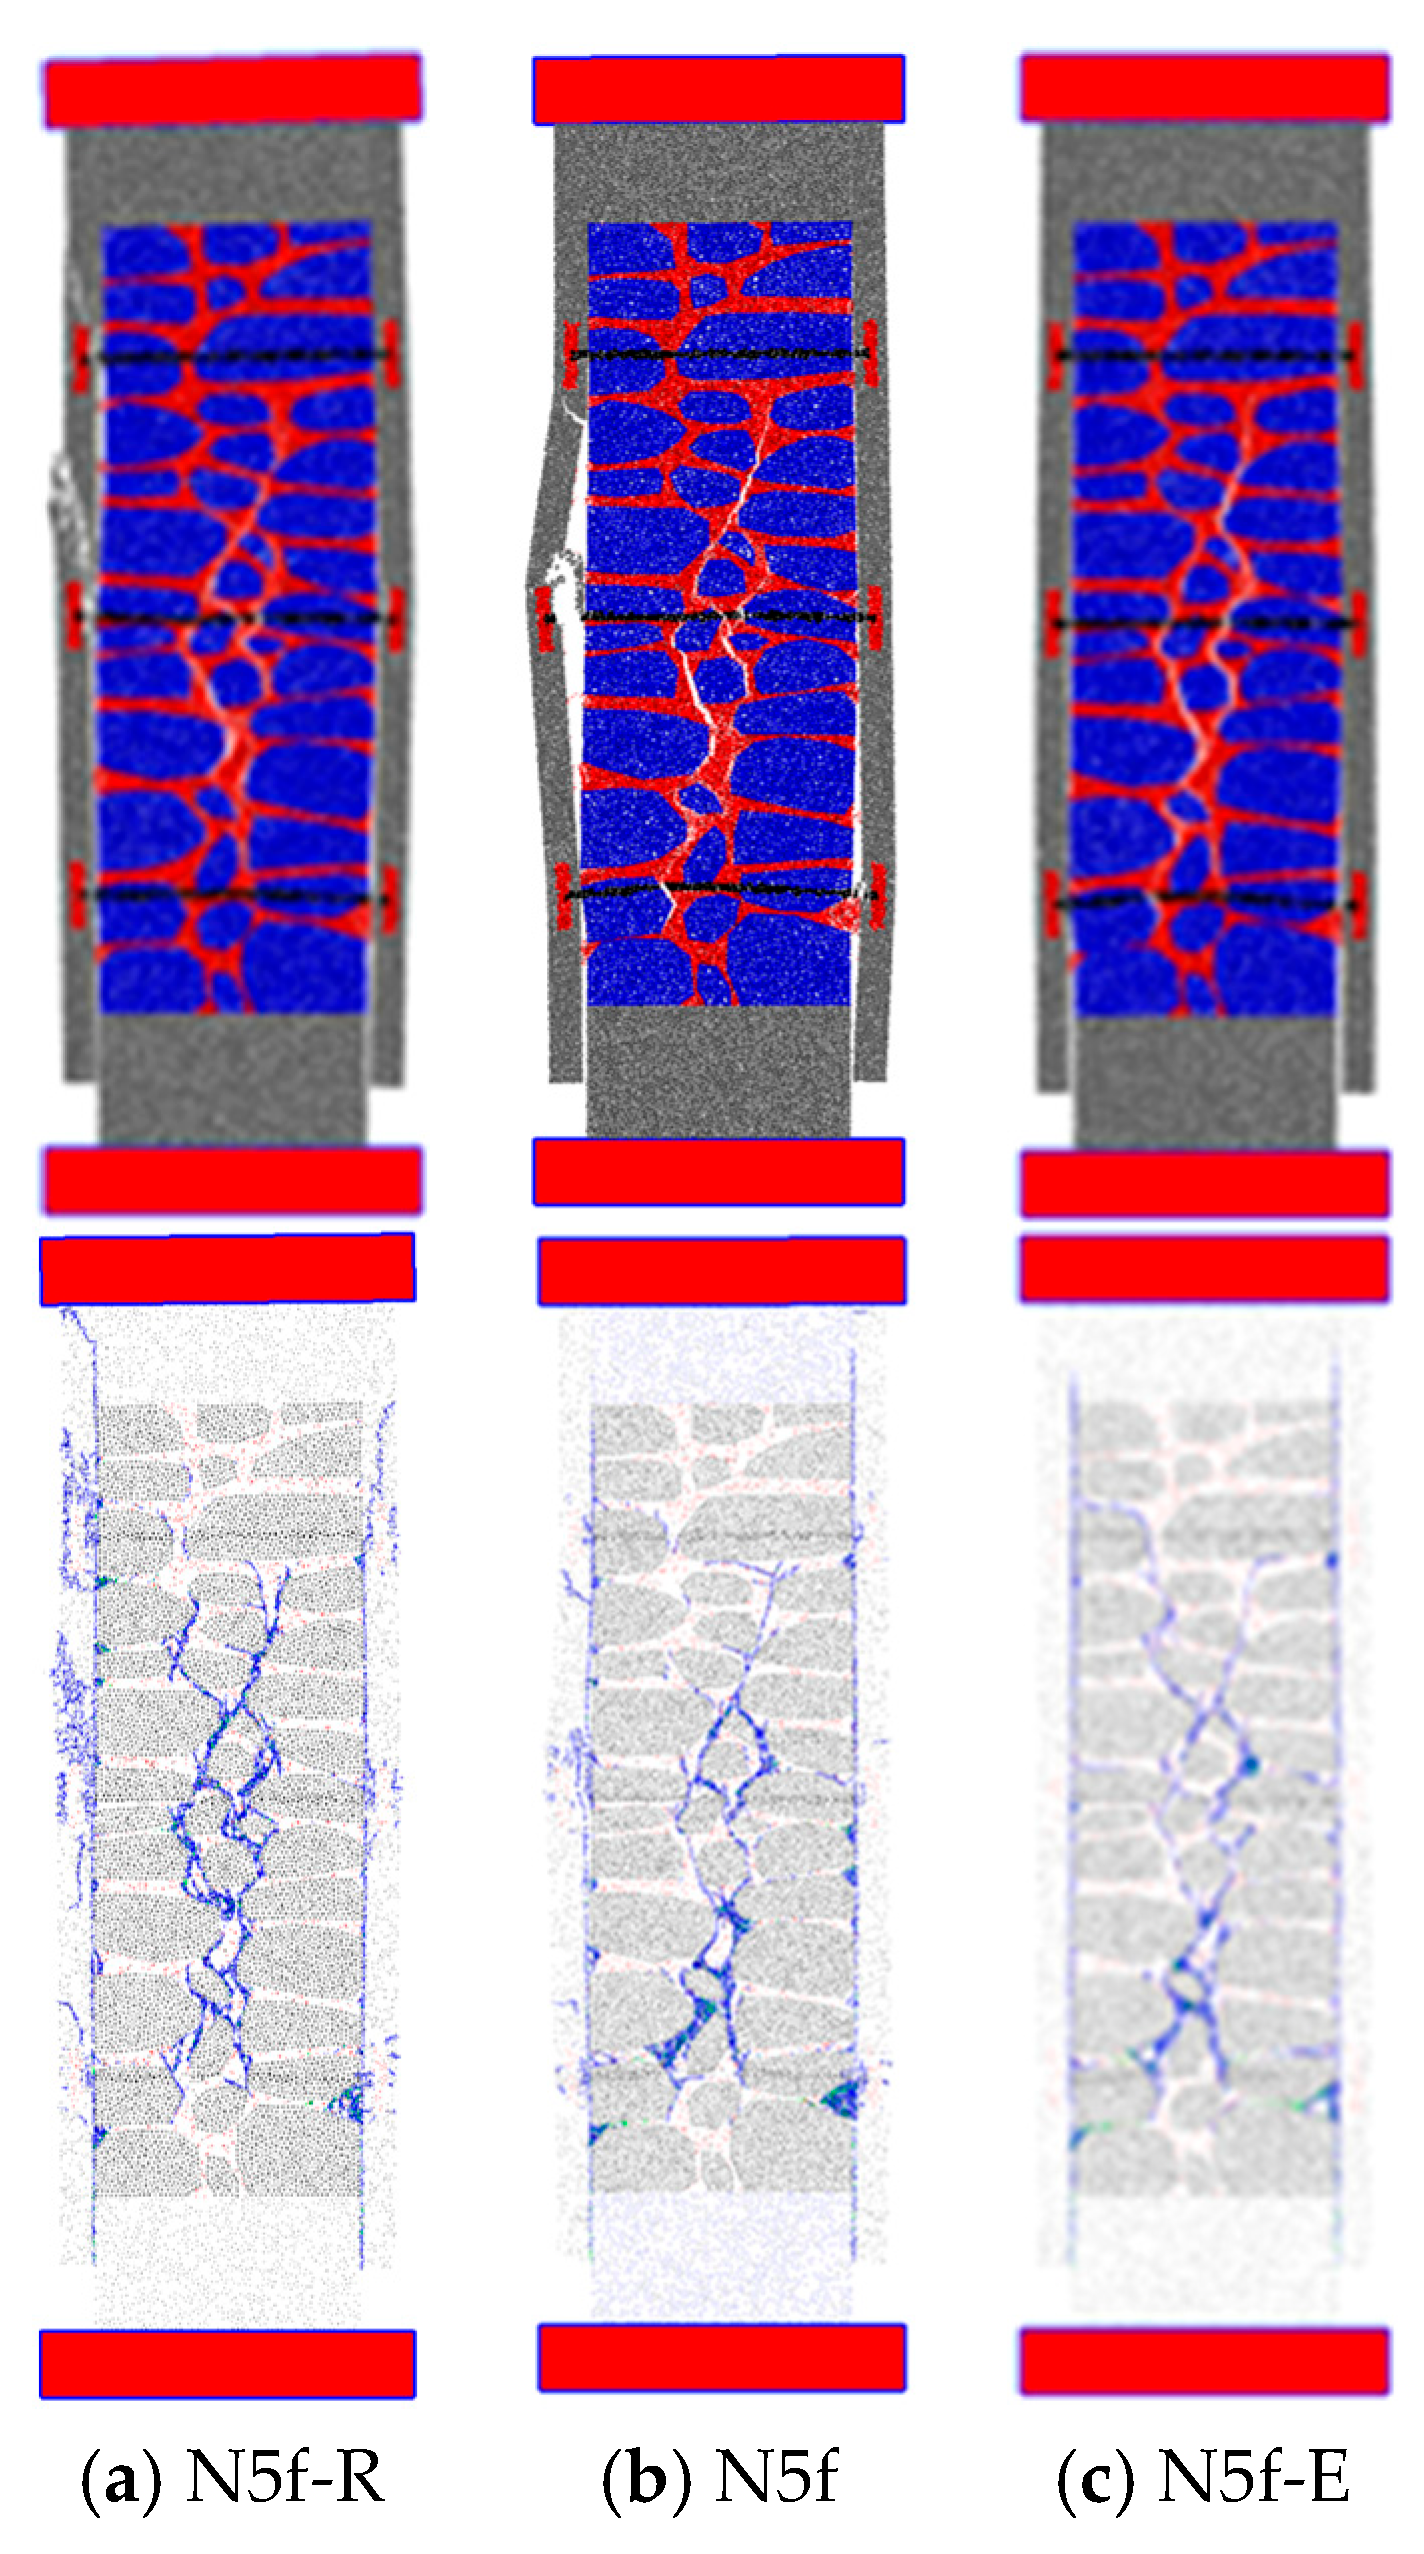
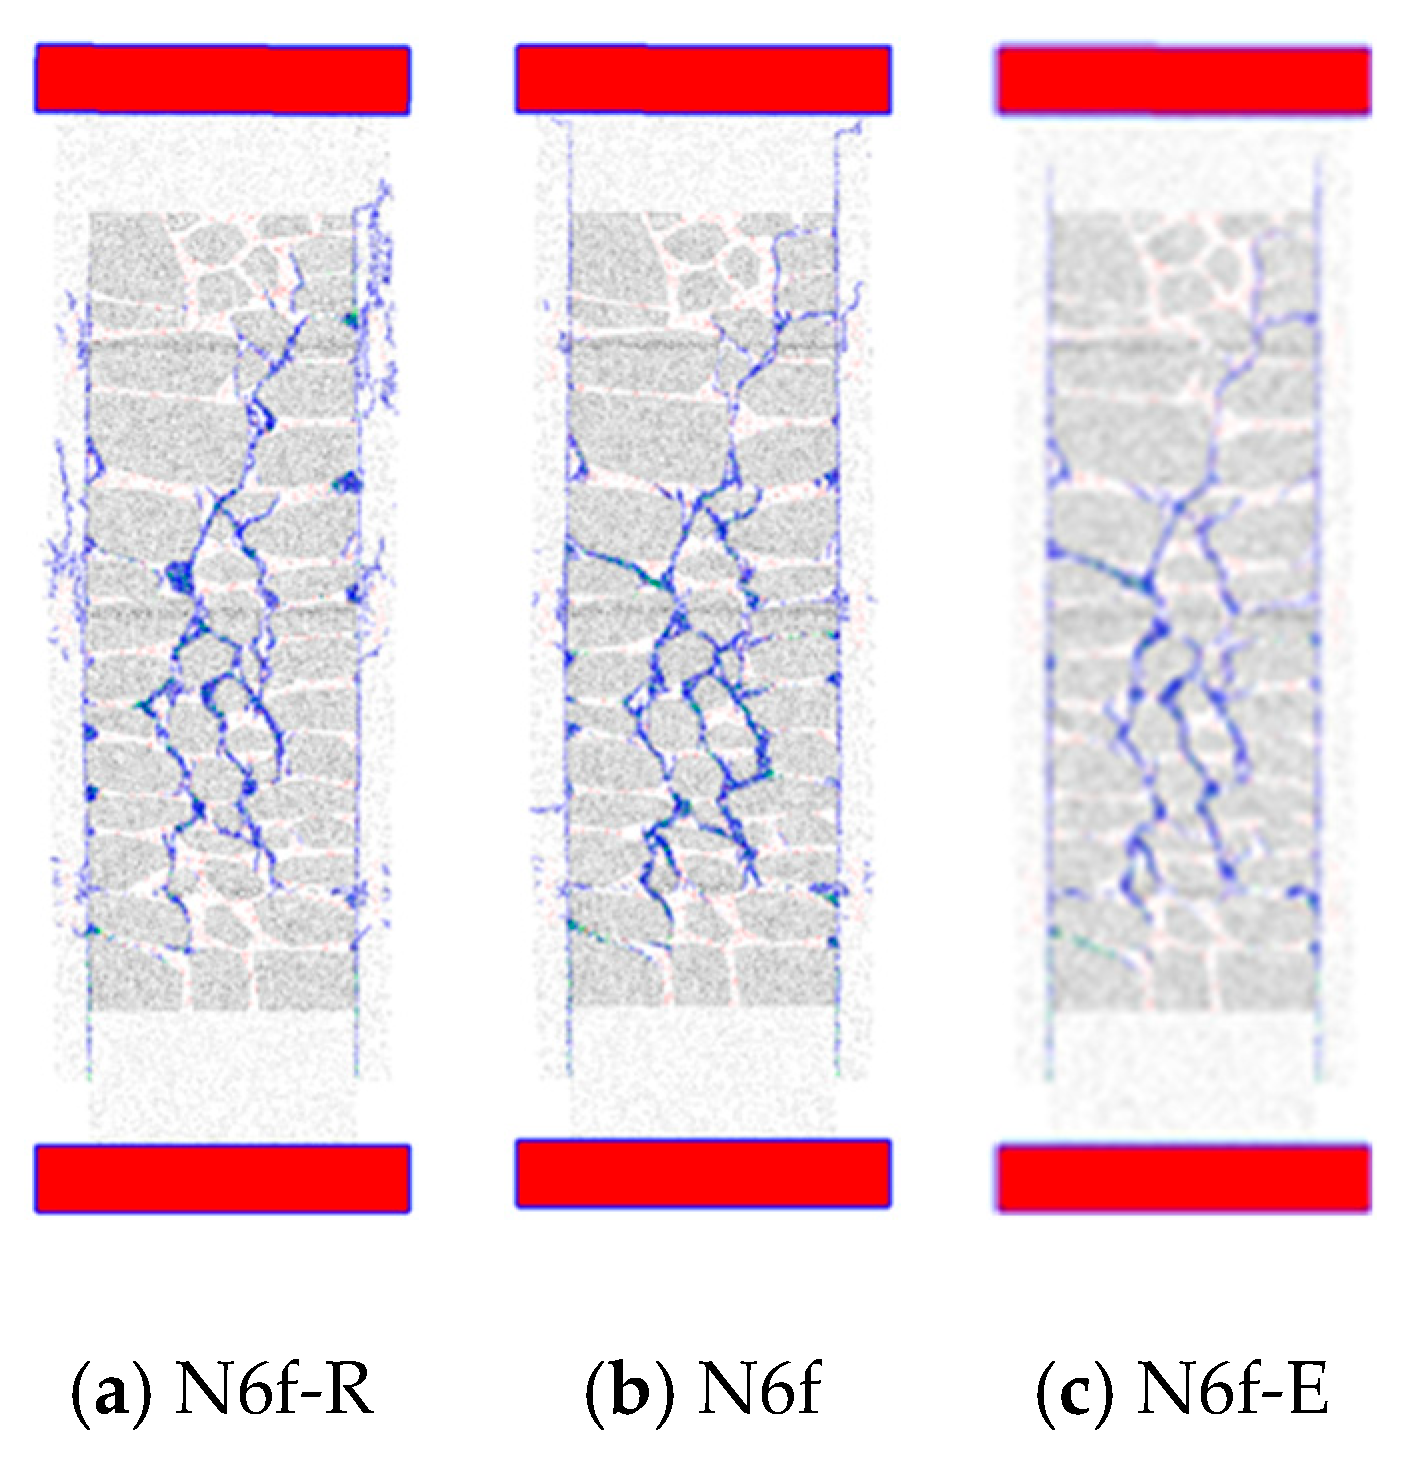
4.2.3. Micro-Concrete Strength Properties

In this section, the effect of the strength properties of micro-concrete on the performance and strength of a reinforced masonry wall is assessed. Like in the previous examples, the effect of the micro-concrete strength on the macroscopic uniaxial response under compression was only evaluated for the modeling hypothesis in which the contacts between the existing masonry elements and the micro-concrete have the properties of mortar and the mortar contacts have a maximum compressive stress of 2.0 MPa: MB5f (model W1) and MB4f (model W2). Four additional numerical PMs were assessed where the strength properties of the micro-concrete were varied (Table 4) and compared with the reference model.
Figure 17 shows the force–displacement diagrams obtained with the PMs under different micro-concrete strength properties, along with the force–displacement diagrams predicted using the micro-concrete strength properties adopted in the reference model (N5f and N6f).
As expected, the properties of the micro-concrete have a significant influence on the behavior of the reinforced masonry wall. For an elastic micro-concrete, both its peak and residual values increase considerably. In contrast, when the strength properties of the micro-concrete are reduced, the predicted peak strength and residual values are lower than those obtained with the PM reference values.
Figure 18 and Figure 19 show the final failure mode and the final contact crack distribution for the assessed PMs (models W1 and W2) with different micro-concrete behavior.
As shown, when the micro-concrete is assumed to be elastic, cracks and damage occur almost exclusively in the mortar. Conversely, in the PMs in which the strength properties of micro-concrete are reduced, these displacements and cracks are more pronounced in the micro-concrete.

4.3. Modeling Limitations and Future Developments

The adopted micro-modeling strategy based on a detailed particle model (PM) is an extremely computationally intensive approach given that it requires a very refined discretization, which limits its application to larger structures. Also, to further understand the out-of-plane behavior of old masonry structures and to better model the localized compression effect of the strengthening bars and steel plates, a 3D modeling approach is required, which has even higher associated computational costs. For these reasons, it is important to improve the efficiency of the adopted numerical approach, either by using more efficient hybrid FEM/DEM techniques [39], or by developing parallel computing techniques for the central processing unit (CPU) [57] or for the graphics processing unit (GPU) [58]. A coarser particle size for the mortar representation may also be pursued to reduce the associated computational running times.
For the adopted PM to be successfully used as a predictive model for old masonry structures, it is fundamental to know, for both stone and mortar, the grain structure, particle size and distribution and the experimental behavior, including the full stress–displacement curves, under compression, under tensile and, if possible, under biaxial tests, to properly calibrate the contact properties (stone, mortar and micro-concrete). With this purpose, an experimental program is also being carried out to characterize the mortar biaxial failure envelope, which will then allow the development of a more accurate contact constitutive model.
The PM was calibrated only based on the experimental results obtained in [21,45]. Therefore, the results obtained with different masonry types, geometries, reinforcement solutions and material properties should be interpreted considering this limitation. Experimental work is also underway to validate reinforcement solutions by adopting smaller wall geometries to reduce the required computational model for 3D PMs.

5. Conclusions

This paper investigates the application of a 2D reinforced particle model to predict the uniaxial compression behavior of a masonry wall that is reinforced, using combination of transverse confinement and micro-concrete layers. The adopted computational approach that accurately captures the heterogeneity and distinctive characteristics of masonry behavior is proving to be a promising approach for this type of analysis.
The particularity of the adopted 2D-RPM is that the contact micro-properties are independently calibrated based on experimental data. The contact properties for which there is no experimental data available are approximated, and in most cases require a parametric study to understand their importance. The comparison between the numerical and the experimental force–vertical displacement curves and the damage distribution allowed the conclusion that the RPM manages to adequately reproduce the behavior observed experimentally, namely the strength, ductility, peak load value, increase in the maximum load value with uniaxial compression of the reinforced walls and the process of crack formation and propagation. It can be concluded that the inter-material contact properties have an important influence on the behavior of these elements under compression. From the presented parametric study, it was found that a more precise agreement with the experimental results is achieved by adopting a maximum compressive strength value of 2 MPa for the contact between mortar–mortar, mortar–stone and mortar–micro-concrete. This result is in line with that observed in [46]. The results presented also show that a closer agreement with the observed behavior is obtained when the interfaces between the micro-concrete and the wall components have the properties adopted for mortar-mortar contacts.
The effectiveness of the strengthening solution is strongly influenced by the mechanical properties of the micro-concrete, and the efficiency of the shear transfer between the micro-concrete layer and the masonry. From the studies presented here, in which the impact of these parameters in the response to the reinforced masonry elements is assessed, the following can be concluded:
  • Micro-concrete strength has a direct influence on both the peak strength and residual strength value. A higher micro-concrete strength yields a higher peak and residual strength.
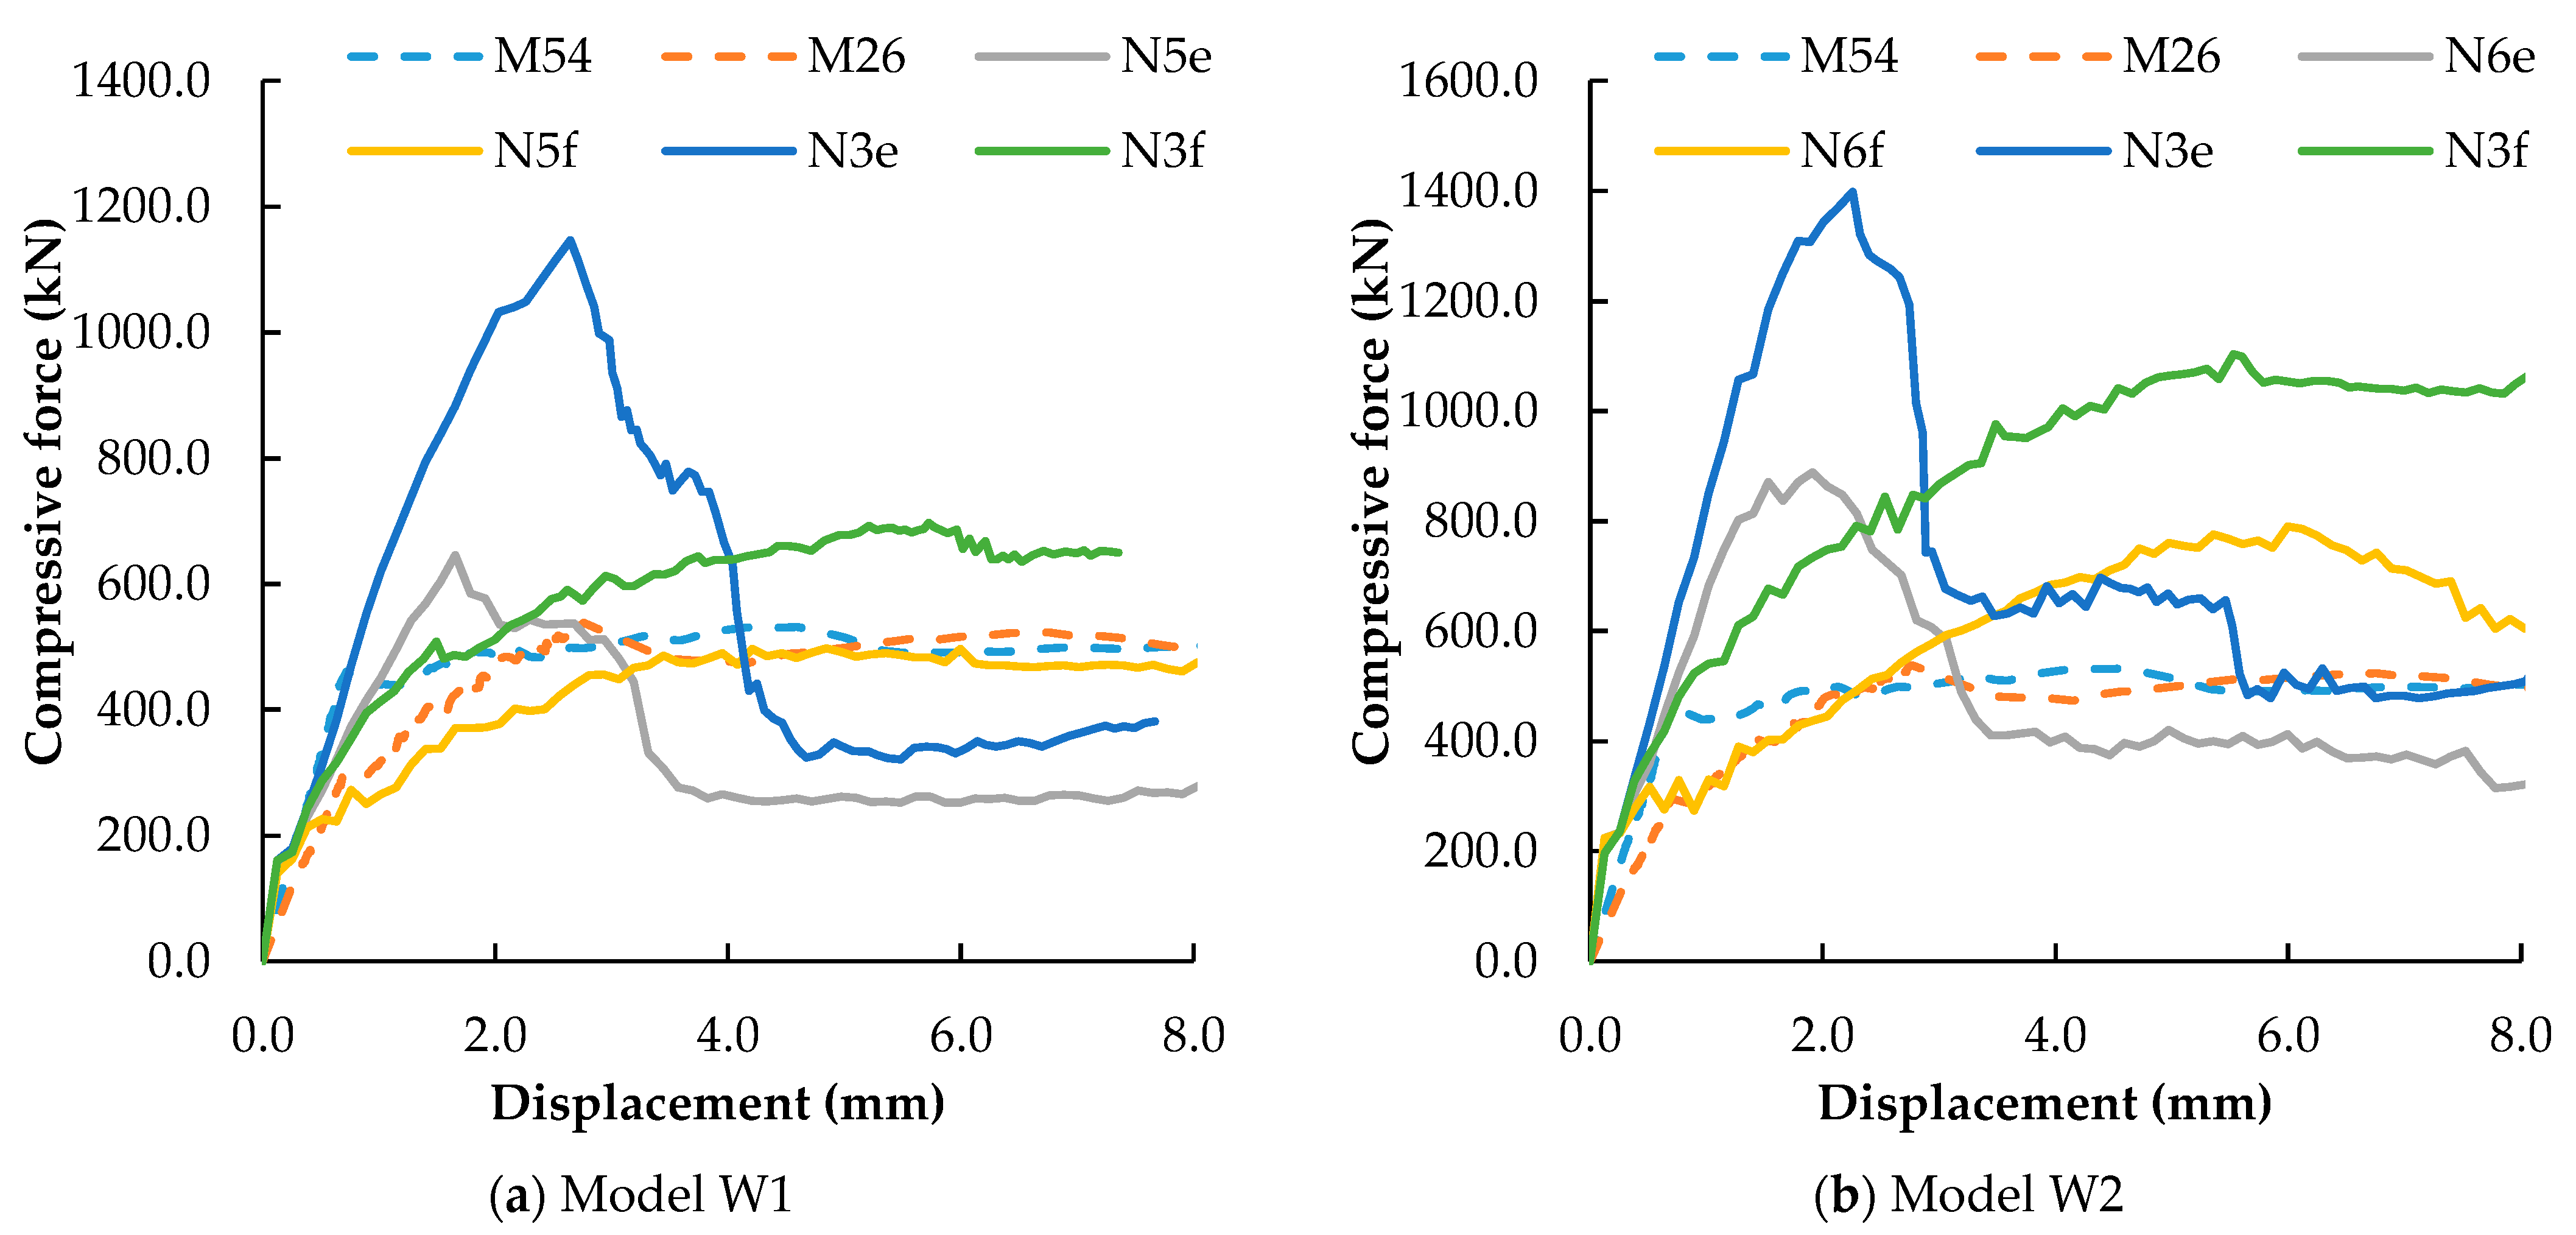
  • The presence of the transverse steel bars is fundamental for lateral confinement to occur, assuring a better transfer of forces from the micro-concrete layer to the masonry walls.
  • Despite possible application difficulties (namely, the need to cover metallic elements), the steel plates that are external to the micro-concrete layers contribute to an increase in resistance/strength, as does the presence of transverse steel bars, which are fundamental for lateral confinement to occur, ensuring a more effective transfer of forces from the micro-concrete layer to the masonry wall.
Overall, it is clearly shown that the adopted modeling approach (2D-RPM) can be readily adopted for the design of similar strengthening solutions, namely in the definition of the reinforcement diameter, number of reinforcements, steel plate and micro-concrete strength and layer thickness.

Author Contributions

Conceptualization, N.M.A.; methodology, N.M.A. and I.C.; software, N.M.A.; validation N.M.A., F.N. and I.C.; writing—original draft preparation, N.M.A., F.F.S.P. and I.C.; visualization, F.N. and I.C.; supervision, N.M.A., F.F.S.P. and I.C.; experiment, F.F.S.P.; revision, N.M.A., I.C., F.N. and F.F.S.P. All authors have read and agreed to the published version of the manuscript.

Funding

The third author is grateful for the Foundation for Science and Technology, Portugal’s support through funding UIDB/04625/2020 from the research unit CERIS (DOI: 10.54499/UIDB/04625/2020).

Data Availability Statement

The original contributions presented in this study are included in the article, and further inquiries can be directed to the corresponding author.

Acknowledgments

This work is part of the research activities of the first author within the research project StepDam: A step forward for the ability to anticipate and prevent failures of concrete dam foundations, supported by LNEC. This work is also part of the research activities of the second and third authors carried out at Civil Engineering Research and Innovation for Sustainability (CERIS).

Conflicts of Interest

The authors declare no conflicts of interest.

Abbreviations

The following abbreviations are used in this manuscript:
URMUnreinforced masonry
RMReinforced masonry
FEMFinite element method
DEMDiscrete element method
PMParticle model
RPMReinforced particle model

References

  1. Roca, P.; Lourenço, P.B.; Gaetani, A. Historic Construction and Conservation: Materials, Systems and Damage; Routledge: New York, NY, USA, 2019. [Google Scholar]
  2. Malomo, D.; DeJong, M.J.; Penna, A. Influence of bond pattern on the in-plane behavior of URM piers. Int. J. Arch. Herit. 2021, 15, 1492–1511. [Google Scholar] [CrossRef]
  3. Pulatsu, B.; Gonen, S.; Parisi, F.; Erdogmus, E.; Tuncay, K.; Funari, M.F.; Lourenço, P.B. Probabilistic approach to assess URM walls with openings using discrete rigid block analysis (D-RBA). J. Build. Eng. 2022, 61, 105269. [Google Scholar] [CrossRef]
  4. Pinho, F.F.S.; Lúcio, V.J.G.; Baião, M.F.C. Rubble stone masonry walls in Portugal strengthened with reinforced micro-concrete layers. Bull. Earthq. Eng. 2012, 10, 161–180. [Google Scholar] [CrossRef]
  5. Coburn, A.; Spence, R. Earthquake Protection; John Wiley & Sons: Hoboken, NJ, USA, 1992. [Google Scholar]
  6. Ferretti, F.; Ferracuti, B.; Mazzotti, C.; Savoia, M. Destructive and minor destructive tests on masonry buildings: Experimental results and comparison be-tween shear failure criteria. Constr. Build. Mater. 2019, 199, 12–29. [Google Scholar] [CrossRef]
  7. İzol, R.; Işık, E.; Avcil, F.; Arslan, M.H.; Arkan, E.; Büyüksaraç, A. Seismic performance of masonry structures after 06 February 2023 earthquakes; site survey and FE modelling approach. Soil Dyn. Earthq. Eng. 2024, 186, 108904. [Google Scholar] [CrossRef]
  8. Adhikari, R.K.; D’Ayala, D. Nepal earthquake: Seismic performance and post-earthquake reconstruction of stone in mud mortar masonry buildings. Bull. Earthq. Eng. 2020, 18, 3863–3896. [Google Scholar] [CrossRef]
  9. Brando, G.; Rapone, D.; Spacone, E.; O’Banion, M.S.; Olsen, M.J.; Barbosa, A.R.; Faggella, M.; Gigliotti, R.; Liberatore, D.; Russo, S.; et al. Damage reconnaissance of unreinforced masonry buildings after the 2015 Gorkha, Nepal, earthquake. Earthq. Spectra 2017, 33 (Suppl. 1), 243–273. [Google Scholar] [CrossRef]
  10. Sorrentino, L.; Cattari, S.; da Porto, F.; Magenes, G.; Penna, A. Seismic behaviour of ordinary masonry buildings during the 2016 central Italy earthquakes. Bull. Earthq. Eng. 2019, 17, 5583–5607. [Google Scholar] [CrossRef]
  11. Vlachakis, G.; Vlachaki, E.; Lourenço, P.B. Learning from failure: Damage and failure of masonry structures, after the 2017 Lesvos earthquake (Greece). Eng. Fail. Anal. 2020, 11, 104803. [Google Scholar] [CrossRef]
  12. Bilgin, H.; Leti, M.; Shehu, R.; Özmen, H.B.; Deringol, A.H.; Ormeni, R. Reflections from the 2019 Durrës Earthquakes: An Earthquake Engineering Evaluation for Masonry Typologies. Buildings 2023, 13, 2227. [Google Scholar] [CrossRef]
  13. Vintzileou, E.; Palieraki, V. Damage to stone masonry buildings in historical centers due to the 2023 earthquake sequence in Turkey. Earthq. Spectra 2024, 40, 2306–2338. [Google Scholar] [CrossRef]
  14. Borri, A.; Corradi, M.; De Maria, A. The Failure of Masonry Walls by Disaggregation and the Masonry Quality Index. Heritage 2020, 3, 1162–1198. [Google Scholar] [CrossRef]
  15. Costa, A.; Arêde, A.; Costa, A.; Guedes, J.; Silva, B. Experimental testing, numerical modeling and seismic strengthening of traditional stone masonry: Comprehensive study of a real azorean pier. Bull. Earthq. Eng. 2012, 10, 135–159. [Google Scholar] [CrossRef]
  16. Gkournelos, P.D.; Triantafillou, T.C.; Bournas, D.A. Seismic upgrading of existing masonry structures: A state-of-the-art review. Soil Dyn. Earthq. Eng. 2022, 161, 107428. [Google Scholar] [CrossRef]
  17. Keshmiry, A.; Hassani, S.; Dackermann, U.; Li, J. Assessment, repair, and retrofitting of masonry structures: A comprehensive review. Constr. Build. Mater. 2024, 442, 137380. [Google Scholar] [CrossRef]
  18. Oliveira, D.V.; Silva, R.A.M.; Garbin, E.; Lourénço, P.B. Strengthening of three-leaf stone masonry walls: An experimental research. Mater. Struct. 2012, 45, 1259–1276. [Google Scholar] [CrossRef]
  19. Porto, F.; Valluzzi, M.R.; Munari, M.; Modena, C.; Arêde, A.; Costa, A.A. Strengthening of Stone and Brick Masonry Buildings. In Strengthening and Retrofitting of Existing Structures; Costa, A., Arêde, A., Varum, H., Eds.; Building Pathology and Rehabilitation; Springer: Singapore, 2018; Volume 9. [Google Scholar] [CrossRef]
  20. Rezaee, S.R.S.; Soltani, M.; Nikooravesh, M. Cyclic in-plane behavior of un-reinforced and confined masonry walls retrofitted by shotcrete: Experimental investigation. Eng. Struct. 2022, 264, 114432. [Google Scholar] [CrossRef]
  21. Pinho, F.F.S. Paredes de alvenaria ordinária—Estudo experimental com modelos simples e reforçados, Tese de doutoramento em Engenharia Civil—Ciências da Construção. Ph.D. Thesis, FCT NOVA, Universidade Nova de Lisboa, Lisboa, Portugal, 2007. (In Portuguese). [Google Scholar]
  22. Pinho, F.F.S.; Lúcio, V.J.G.; Baião, M.F.C. Rubble Stone Masonry Walls Strengthened By Three-dimensional Steel Ties and Textile Reinforced Mortar Render, under Compression and Shear Loads. Int. J. Archit. Herit. 2015, 9, 844–858. [Google Scholar] [CrossRef]
  23. Penna, A. Seismic assessment of existing and strengthened stone-masonry buildings: Critical issues and possible strategies. Bull. Earthq. Eng. 2015, 13, 1051–1071. [Google Scholar] [CrossRef]
  24. Pinho, F.F.S.; Lúcio, J.G.V. Rubble stone masonry walls. Material properties, carbonation depth and mechanical characterization. Int. J. Archit. Herit. 2017, 11, 685–702. [Google Scholar] [CrossRef]
  25. Lourenço, P.B. Computations of historical masonry constructions. Prog. Struct. Eng. Mater. 2002, 4, 301–319. [Google Scholar] [CrossRef]
  26. D’altri, A.M.; Sarhosis, V.; Milani, G.; Rots, J.; Cattari, S.; Lagomarsino, S.; Sacco, E.; Tralli, A.; Castellazzi, G.; de Miranda, S. Modeling Strategies for the Computational Analysis of Unreinforced Masonry Structures: Review and Classification. Arch. Comput. Methods Eng. 2020, 27, 1153–1185. [Google Scholar] [CrossRef]
  27. Ibrahim, Y.; Nagy, B.; Benedek, C. Deep Learning-Based Masonry Wall Image Analysis. Remote Sens. 2020, 12, 3918. [Google Scholar] [CrossRef]
  28. Wang, Q.; Santos, K.R.M.; Beyer, K. Micro Modeling of Irregular Stone Masonry Walls Using Mathematical Programming. In Structural Analysis of Historical Constructions; SAHC 2023. RILEM Bookseries; Endo, Y., Hanazato, T., Eds.; Springer: Cham, Switzerland, 2024; Volume 46. [Google Scholar] [CrossRef]
  29. Zhang, S.; Mousavi, S.M.T.; Richart, N.; Molinari, J.F.; Beyer, K. Micro-mechanical finite element modeling of diagonal compression test for historical stone masonry structure. Int. J. Solids Struct. 2017, 112, 122–132. [Google Scholar] [CrossRef]
  30. Zhang, S.; Hofmann, M.; Beyer, K. A 2D typology generator for historical masonry elements. Construct. Build. Mater. 2018, 184, 440–453. [Google Scholar] [CrossRef]
  31. Roca, P.; Cervera, M.; Gariup, G.; Pela’, L. Structural analysis of masonry historical constructions. Classical and advanced approaches. Arch. Comput. Methods Eng. 2010, 17, 299–325. [Google Scholar]
  32. Lourenço, P.B.; Rots, J.G. Multisurface Interface Model for Analysis of Masonry Structures. J. Eng. Mech. 1997, 123, 660–668. [Google Scholar] [CrossRef]
  33. Lemos, J. Discrete element modelling of the seismic behaviour of stone masonry arches. In Computer Methods in Structural Masonry—4 Fourth International Symposium, 1st ed.; Pande, G., Middleton, J., Kralj, B., Eds.; CRC Press: London, UK, 1998; pp. 220–227. ISBN 9780419235408. [Google Scholar]
  34. Azevedo, N.M.; Lemos, J.V.; Rocha, J.d.A. Discrete Element Particle Modelling of Stone Masonry. In Computational Modeling of Masonry Structures Using the Discrete Element Method; IGI Global: Hershey, PA, USA, 2016; pp. 146–170. [Google Scholar]
  35. Sarhosis, V.; Lemos, J. A detailed micro-modelling approach for the structural analysis of masonry assemblages. Comput. Struct. 2018, 206, 66–81. [Google Scholar] [CrossRef]
  36. Cismaşiu, C.; Silva, P.B.S.; Lemos, J.V.; Cismaşiu, I. Seismic Vulnerability Assessment of a Stone Arch Using Discrete Elements. Int. J. Archit. Herit. 2021, 17, 730–744. [Google Scholar] [CrossRef]
  37. Smoljanović, H.; Živaljić, N.; Željana, N. A combined finite-discrete element analysis of dry stone masonry structures. Eng. Struct. 2013, 52, 89–100. [Google Scholar] [CrossRef]
  38. Munjiza, A.; Smoljanović, H.; Živaljić, N.; Mihanovic, A.; Divić, V.; Uzelac, I.; Nikolić, Ž.; Balić, I.; Trogrlić, B. Structural applications of the combined finite–discrete element method. Comput. Part. Mech. 2020, 7, 1029–1046. [Google Scholar] [CrossRef]
  39. Azevedo, N.M.; Lemos, J.V. A Hybrid Particle/Finite Element Model with Surface Roughness for Stone Masonry Analysis. Appl. Mech. 2022, 3, 608–627. [Google Scholar] [CrossRef]
  40. Wu, B.; Dai, J.; Jin, H.; Bai, W.; Chen, B. Numerical simulation on the seismic performance of retrofitted masonry walls based on the combined finite-discrete element method. Earthq. Eng. Eng. Vib. 2023, 22, 777–805. [Google Scholar] [CrossRef]
  41. Chen, X.; Liang, Z.; Chan, A.H. Simulating the damage of rubble stone masonry walls using FDEM with a detailed micro-modelling approach. Comput. Part. Mech. 2024, 11, 2839–2855. [Google Scholar] [CrossRef]
  42. Azevedo, N.M.; Lemos, J. Aggregate shape influence in the fracture be-haviour of concrete. Struct. Eng. Mech. 2006, 24, 411–427. [Google Scholar] [CrossRef]
  43. Azevedo, N.M.; Lemos, J.V.; Almeida, J. A discrete particle model for reinforced concrete fracture analysis. Struct. Eng. Mech. 2010, 36, 343–361. [Google Scholar] [CrossRef]
  44. Cundall, P.A.; Strack, O.D.L. Discrete numerical model for granular assemblies. Géotechnique 1979, 29, 47–65. [Google Scholar] [CrossRef]
  45. Azevedo, N.M.; Fernando, F.F.S.; Cismasiu, I.; Souza, M. Prediction of Rubble-Stone Masonry Walls Response under Axial Compression Using 2D Particle Modelling. Buildings 2022, 12, 1283. [Google Scholar] [CrossRef]
  46. Cismaşiu, I.; Azevedo, N.M.; Fernando, F.F.S. Numerical Evaluation of Transverse Steel Connector Strengthening Effect on the Behavior of Rubble Stone Masonry Walls under Compression Using a Particle Model. Buildings 2023, 13, 987. [Google Scholar] [CrossRef]
  47. Devanand, K.; Ghiassi, B.; Faramarzi, A.; Mehravar, M. Particle-Based DEM to Assess Masonry Behaviour Under Compression. In 18th International Brick and Block Masonry Conference; Milani, G., Ghiassi, B., Eds.; IB2MaC 2024. Lecture Notes in Civil Engineering; Springer: Cham, Switzerland, 2025; Volume 613. [Google Scholar] [CrossRef]
  48. Vasconcelos, G.; Lourenço, P.B. Experimental characterization of stone masonry in shear and compression. Constr. Build. Mater. 2009, 23, 3337–3345. [Google Scholar] [CrossRef]
  49. Ponte, M.; Penna, A.; Bento, R. In-plane cyclic tests of strengthened rubble stone masonry. Mater. Struct. 2023, 56, 41. [Google Scholar] [CrossRef]
  50. Saloustros, S.; Settimi, A.; Ascencio, A.C.; Gamerro, J.; Weinand, Y.; Beyer, K. Geometrical digital twins of the as-built microstructure of three-leaf stone masonry walls with laser scanning. Sci. Data 2023, 10, 533. [Google Scholar] [CrossRef]
  51. Murano, A.; Ortega, J.; Rodrigues, H.; Vasconcelos, G. Updating mechanical properties of two-leaf stone masonry walls through experimental data and Bayesian inference. Constr. Build. Mater. 2021, 298, 123626. [Google Scholar] [CrossRef]
  52. Croce, P.; Beconcini, M.L.; Formichi, P.; Landi, F.; Puccini, B.; Zotti, V. Bayesian Methodology for Probabilistic Description of Mechanical Parameters of Masonry Walls. ASCE-ASME J. Risk Uncertain. Eng. Syst. Part A Civ. Eng. 2021, 7, 04021008. [Google Scholar] [CrossRef]
  53. Kibriya, G.; Botzheim, J.; Orosz, Á.; Bagi, K. Automatic calibration of a discrete element model of a masonry arch by swarm intelligence methods. Comput. Struct. 2024, 299, 107401. [Google Scholar] [CrossRef]
  54. Oliveira, D.V.; Lourenço, P.B. Implementation of a constitutive model for the cyclic behaviour of interface elements. Comput. Struct. 2004, 82, 1451–1461. [Google Scholar] [CrossRef]
  55. Senthivel, R.; Lourenço, P.B. Finite element modelling of deformation characteristics of historical stone masonry shear wall. Eng. Struct. 2009, 31, 1930–1943. [Google Scholar] [CrossRef]
  56. Riddington, J.R.; Naom, N.F. Finite element prediction of masonry compressive strength. Comput. Struct. 1994, 52, 113–119. [Google Scholar]
  57. Yan, B.; Regueiro, R.A. Comparison between pure MPI and hybrid MPI-OpenMP parallelism for Discrete Element Method (DEM) of ellipsoidal and poly-ellipsoidal particles. Comput. Part. Mech. 2019, 6, 271–295. [Google Scholar]
  58. Dong, Y.; Yan, D.; Cui, L. An Efficient Parallel Framework for the Discrete Element Method Using GPU. Appl. Sci. 2022, 12, 3107. [Google Scholar] [CrossRef]
Figure 1. Particle–particle single point contact.
Buildings 15 01058 g001
Figure 2. Steel bar–particle contact interface geometry. Adapted from [46].
Buildings 15 01058 g002
Figure 3. Ancient stone masonry wall model generation steps.
Buildings 15 01058 g003
Figure 4. Micro-concrete PM cracking distribution in uniaxial compression and tensile tests.
Buildings 15 01058 g004
Figure 5. Photographic material of axial compression testing system and of masonry walls M26, M52 and M54.
Buildings 15 01058 g005
Figure 6. Schematic representation of adopted reinforcement strengthening system.
Buildings 15 01058 g006
Figure 7. The PMs representing the lateral faces of the reinforced walls.
Buildings 15 01058 g007
Figure 8. Force–displacement diagrams of PMs based on W1 and W2 and experimental specimens M54 and M26 [4].
Buildings 15 01058 g008
Figure 9. Final failure mode and contact crack distribution for PMs N5e, N5f and N5g (model W1) and PMs N6e, N6f and N6g (model W2).
Buildings 15 01058 g009aBuildings 15 01058 g009b
Figure 10. PM-predicted force–displacement diagram and damage evolution (dashed line represents the damage evolution).
Buildings 15 01058 g010
Figure 11. PM N5f (model W1) displacement and contact damage evolution.
Buildings 15 01058 g011
Figure 12. Force–displacement diagrams of the PMs based on W1 and W2, including the numerical response with the external steel plates and the experimental specimens M54 and M26 [4,21].
Buildings 15 01058 g012
Figure 13. PMs failure modes and contact crack distribution (model W1)–Inner versus outer anchor positioning.
Buildings 15 01058 g013
Figure 14. Force–displacement diagrams of PMs based on model W1 and W2 for different steel bar diameters, including experimental results M54 [4,21].
Buildings 15 01058 g014
Figure 15. Final failure mode (two times amplified) and contact crack distribution for different steel diameters–model W1.
Buildings 15 01058 g015aBuildings 15 01058 g015b
Figure 16. Final failure mode (two times amplified) and contact crack distribution for different steel diameters–model W2.
Buildings 15 01058 g016
Figure 17. Force–displacement diagrams of PMs based on model W1 and W2 for micro-concrete strength properties, including experimental results M54 [4,21].
Buildings 15 01058 g017
Figure 18. Final failure mode (two times amplified) and contact crack distribution for different micro-concrete behavior–Model W1.
Buildings 15 01058 g018
Figure 19. Final failure mode (two times amplified) and contact crack distribution for different micro-concrete behavior–Model W2.
Buildings 15 01058 g019aBuildings 15 01058 g019b
Table 1. Elastic and strength macroscopic values: experimental values and numerical values after contact calibration.
MaterialExperimental ValuesCalibrated Values
σ c (MPa) σ t (MPa) E (GPa) v σ c (MPa) σ t (MPa) E (GPa) v
Stone47.8-6.00.2947.8-5.90.30
Mortar0.650.300.0750.160.660.160.0750.16
Micro-concrete37.43-28.500.2037.441.8628.500.20
Concrete (C25/30)--0.0750.16--30.000.20
Table 2. Calibrated properties of PM elastic and strength.
Contacts E ¯
(GPa)
α σ n . t
(MPa)
τ
(MPa)
μ c G f . n
(N/m)
G f . s
(N/m)
s-s8.60.118.935.71.00.383856.1403
m-m0.090.430.220.221.00.00130.0031
mc-mc35.380.321.9230.500.56.550046,949.44
c-c37.500.32-----
Table 3. Steel bar diameter assessment—PM designation.
Model Φ (mm) Main CharacteristicDesignation
W10.0Steel bars are absentN5f (0)
W20.0N6f (0)
W18.08 mm diameter steel barsN5f (8)
W28.0N6f (8)
W112.012 mm diameter steel bars (reference model)N5f
W212.0N6f
W116.016 mm diameter steel barsN5f (16)
W216.0N6f (16)
W120.020 mm diameter steel barsN5f (20)
W220.0N6f (20)
Table 4. Micro-concrete strength properties assessment – PM designation.
ModelMain CharacteristicDesignation
W1Elastic micro-concreteN5f-E
N6f-E
W2
W1Reference modelN5f
N6f
W2
W1Micro-concrete with half of the strengthN5f-R
N6f-R
W2
Disclaimer/Publisher’s Note: The statements, opinions and data contained in all publications are solely those of the individual author(s) and contributor(s) and not of MDPI and/or the editor(s). MDPI and/or the editor(s) disclaim responsibility for any injury to people or property resulting from any ideas, methods, instructions or products referred to in the content.

