Article

The Risk Assessment of Bridge Pile Foundation Construction in Karst Regions Based on the Fuzzy Analytic Hierarchy Process

1
Guangdong Transportation Industrial Investment Co., Guangzhou 525299, China
2
School of Geosciences and Info-Physics, Central South University, Changsha 410083, China
3
Laboratory of Metallogenic Prediction of Nonferrous Metals and Geological Environment Monitoring Ministry of Education, School of Geoscience and Infophysics, Central South University, Changsha 410083, China
4
Hunan Key Laboratory of Nonferrous Resources and Geological Hazards Exploration, Changsha 410083, China
*
Author to whom correspondence should be addressed.
Buildings 2025, 15(7), 1059; https://doi.org/10.3390/buildings15071059
Submission received: 17 February 2025 / Revised: 20 March 2025 / Accepted: 24 March 2025 / Published: 25 March 2025
(This article belongs to the Section Building Structures)

Abstract

The construction of bridge pile foundations in karst regions faces significant risks, including karst collapse and ground subsidence caused by dewatering during excavation. Both karst collapse and shallow soil cavity subsidence are influenced by numerous factors, which significantly complicates the risk assessment of bridge pile foundation construction in these areas. This study proposes a risk assessment method for bridge pile foundation construction in karst regions based on the Fuzzy Analytic Hierarchy Process (FAHP). An evaluation index system for pile foundation construction risks was established through experimental research, expert surveys, and data analysis. Additionally, the concept of fuzzy mathematics was introduced to quantify the weights of the indicators, enabling the comprehensive assessment of multi-source risks. Experimental results from bridges across the project area demonstrate that this method exhibits a certain level of reliability in assessing the risks of bridge pile foundation construction in karst regions, with the evaluation results aligning well with actual conditions.

1. Introduction

Karst is the most distinctive geological process and phenomenon in carbonate rock distribution areas. Influenced by the chemical dissolution and mechanical erosion of water, karst forms grooves, cavities, and fissures in rock masses, which exhibit a highly complex distribution and morphology [1]. These features are often concealed underground, making them difficult to detect. For pile foundation engineering, karst landforms such as caves, fissures, grooves (trenches), underground rivers, and soil caves developed in bedrock pose significant geological hazards [2]. The randomness and unpredictability of these karst landforms can lead to frequent risks during construction, including borehole collapse, slurry leakage, and ground subsidence. These risks not only threaten construction safety but may also cause project delays and cost overruns. The primary risk in bridge pile foundation construction in karst regions is karst collapse. However, due to the influence of numerous interrelated factors, the assessment and prediction of pile foundation construction risks in these areas are highly complex. The risks associated with pile foundation construction in karst regions are multi-source and coupled [3]. In addition to the predominant risk of karst-induced ground collapse, the following risk types are also significant: (1) Hydrogeological Risks: These include the thickness of the overburden, the degree of fissure development in the rock layers, and the intensity of groundwater activity. For example, insufficient stability in the cave roof may lead to pile-bearing capacity failure, loose overburden can cause borehole wall collapse, and fluctuations in groundwater levels may result in sudden drops in slurry levels, exacerbating the risk of borehole collapse [4,5,6]. (2) Technical Risks: These encompass risks related to pile foundation construction techniques, cave treatment technologies, and concrete-pouring processes [7,8]. (3) Environmental and External Risks: These include risks to adjacent structures, ecological impacts, and water source contamination. For instance, vibrations from pile foundation construction may cause cracking in nearby buildings, and the infiltration of chemically treated slurry into karst conduits may pollute groundwater [9,10,11]. (4) Management and Design Risks: These arise from deficiencies in geological surveys and design, as well as lapses in construction management [12,13]. The complexity and interdependence of these factors make risk assessment and management in pile foundation construction in karst regions a challenging yet critical task.
Early research on risk assessment primarily relied on empirical judgment and qualitative analysis. For instance, geological experts assessed risk levels through field surveys and drilling data [1]. However, such approaches struggled to quantify risk probabilities, heavily depended on expert experience, and lacked systematic rigor, making them inadequate for addressing the complexity and uncertainty of karst geology. In recent years, scholars both domestically and internationally have gradually introduced quantitative analysis tools, such as probabilistic statistics, numerical simulation techniques, and the Analytic Hierarchy Process (AHP) [2,9,10,14,15,16,17]. Nevertheless, these methods still fall short in effectively handling the inherent fuzziness and data deficiencies in risk assessment. To address these limitations, the concept of fuzzy mathematics and multi-criteria decision-making methods have been increasingly integrated into the field of risk assessment. For example, Perrin et al. proposed a multi-criteria approach based on weight-of-evidence analysis for predicting karst geological hazards [18]. Zhang et al. [19] developed a system for assessing surface stability in karst regions using an improved fuzzy comprehensive evaluation method, with the results showing good agreement with historical records of ground subsidence. Wei et al. [20] combined the Analytic Hierarchy Process, catastrophe theory, and entropy models to evaluate susceptibility to karst collapse. Lou et al. [21] introduced a high-precision risk assessment method specifically tailored to thermokarst hazards in permafrost regions. Zhang et al. [22] established a risk assessment system for ground subsidence along tunnels in karst areas by refining and extending evaluation methods. Additionally, Lu et al. [23] enhanced the network structure analysis method, addressing the inherent subjectivity in weight allocation.
In summary, although existing studies have established multi-level risk assessment frameworks for construction in karst regions, they often analyze individual risks in isolation and fail to adequately consider the interactions among geological, technical, and managerial factors. Furthermore, most assessments are conducted based on regional engineering projects, and a unified standard system has yet to be established. The establishment of a unified standard system can improve the accuracy and credibility of risk assessment. To address these issues, this paper proposes a risk assessment model for bridge pile foundation construction in karst areas based on the Fuzzy Analytic Hierarchy Process (FAHP). By utilizing fuzzy mathematics to quantify the uncertainty of expert judgment and incorporating a dynamic weight adjustment mechanism, the model enables the collaborative assessment of multi-source risks. This research is expected to provide more accurate risk prediction and decision-making support for bridge engineering in complex geological conditions.

2. Fuzzy Analytic Hierarchy Process (FAHP)

FAHP is an extension of the traditional Analytic Hierarchy Process (AHP) that incorporates fuzzy logic to handle uncertainty and imprecision in decision-making [19]. It combines the principles of AHP with fuzzy set theory to address situations where the criteria or judgments are subjective, vague, or unclear.

2.1. Establishing the Hierarchy

According to the AHP method, based on the specific conditions of bridge pile foundations in karst regions, we selected the primary and secondary factor sets that influenced the risk levels, established a hierarchy that reflected the relationships between these factors, and constructed a hierarchical structure.

2.2. Calculating Triangular Fuzzy Numbers

Triangular fuzzy numbers are used to integrate the experts’ opinions, thereby establishing a more objective fuzzy judgment matrix as much as possible. It is assumed that through expert surveys, the relative importance between the i and j elements at a certain level under a given criterion has been determined by k experts and is represented by B i j k .
a i j = l i j , m i j , u i j
l i j = min ( B i j k )
m i j = k = 1 n B i j k 1 / n
u i j = max B i j k
where k is the number of scoring experts; B i j k is the score of experts k on the relative importance of attributes i and j; min B i j k is the minimum value of all expert scoring results; max B i j k is the maximum value of all expert scoring results; and k = 1 n B i j k 1 / n is the geometric mean of all expert scoring results.

2.3. Establishing a Fuzzy Judgment Matrix

By combining the actual conditions of bridge pile foundations in karst areas with expert surveys, field tests, mechanical experiments, and other methods, the importance of various factors affecting the risk classification of bridge pile foundations is obtained. Triangular fuzzy numbers are calculated, and a fuzzy judgment matrix can be established.
A = a i j n × n = a 11 a 1 n a n 1 a n n
where a i j = l i j , m i j , u i j denotes the triangular fuzzy number, and a j i = 1 u i j , 1 m i j , 1 l i j , a i j > 0 , a i j × a i j 1 ( i , j = 1 , 2 , 3 , n ). The scale of a i j is judged according to the scale method of 1 to 9. A two-by-two comparison is performed of the importance of factors at the same level, as shown in Table 1.

2.4. Calculating Fuzzy Weights

Based on the obtained judgment matrix, the fuzzy weight values for each influencing factor can be calculated. In the process of calculating the comprehensive evaluation fuzzy weights, the geometric mean fuzzy weight method proposed by J. J. Buckley is used to calculate the fuzzy weights of the factors in the fuzzy pairwise comparison matrix. This method not only considers the consistency index (CI) but also meets the normalization requirements [24]. It also has significant advantages in terms of stability, consistency, multi-level decision-making, mathematical properties, fuzzy handling, and computational simplicity. The consistency test states that the CR of the matrix should be less than 0.1. The calculation process is as follows:
C R = C I R I
C I = λ max n n 1
In this formula, λ max represents the maximum eigenvalue of the judgment matrix, and n denotes the order of the matrix. RI is the random consistency index, which can be obtained by referring to a standard table. The standardized table is shown in Table 2.
We assume that the fuzzy matrix A = a i j has satisfied the consistency requirement of becoming a symmetric matrix and a i j = l i j , m i j , u i j is a triangular fuzzy number. The first step is to calculate the column geometric mean of each column of matrix A.
z i = a i 1 a i n 1 / n
Then, the weight of the ith factor is
w i = z i z 1 z n 1
where and denote the addition and multiplication of fuzzy numbers, respectively, and W i is a column vector of fuzzy weights for each factor.
After obtaining the fuzzy weights of each factor, the fuzzy values are regularized by geometric averaging to obtain explicit weight values:
W ˜ i = w i l × w i m × w i u 3
W i = W ˜ i / j = 1 n W ˜ j

2.5. Calculating the Construction Safety Risk Value

When establishing a hierarchical structure for safety risk assessment in bridge pile foundation construction in a karst area, it is necessary to formulate the corresponding scoring criteria at the same time. Based on the scoring criteria, a value r i can be assigned to each influence factor, and after obtaining the fuzzy weight W i of each evaluation factor, the total value for the construction safety risk assessment can be calculated.
R = i = 1 n ( r i × W i )

2.6. Establishing Grading Standards

After obtaining the total safety risk value for bridge pile foundation construction in karst areas, it is necessary to establish a grading standard for construction risks. This will allow the risk level of the project to be determined based on the value, providing a reference for the next steps in risk management. The risk level reference table is shown in Table 3.

3. Application Case

3.1. Project Overview

The research is based on the Qinghua Expressway project located in Guangdong Province, China. The route generally runs from north to south, starting in Taiping Town, Qingxin District, Qingyuan City, and ending in Tanbu Town, Huadu District, Guangzhou City. The total length of the route is approximately 53.728 km, with 45 mainline bridges spanning a total of 29,774.1 m. Among these, there are 11 extra-large bridges totaling 14,153.6 m, 28 large bridges totaling 15,175.5 m, and 6 medium bridges totaling 445.0 m. The bridge-to-total-length ratio is approximately 55.42%.
The Qinghua Expressway project traverses a variety of geomorphological types, primarily including tectonically denuded hills interspersed with inter-hill valleys, alluvial plains, and local low-relief hills and low-mountainous areas. The project area is influenced by the Qinhuang River, Beijiang River, its tributary the Dayan River, and the Baini River, which have formed extensive alluvial plains. The plain regions are characterized by flat and open terrain, offering relatively convenient transportation conditions. The primary adverse geological conditions in the project area include concealed karst, collapses, and sand liquefaction. According to the geological survey results of the Qinghua Expressway project, karst regions are widely distributed along the route, with a cumulative length of approximately 34.8 km, accounting for 64% of the total route length. The borehole encounter rate of cavities at bridge sites ranges from 34.8% to 100%, while the linear dissolution rate varies between 5.0% and 42.4%. The geologic overview of the study area is shown in Figure 1.
The groundwater in the study area exhibits significant annual variations, with one to two peak water levels occurring between April and September, and a low water level observed in January. Additionally, the water table of the Quaternary unconsolidated porous aquifers is relatively shallow, with the thickness of the Quaternary strata generally ranging from 5 to 60 m. Following heavy rainfall, the water level rises rapidly, typically reaching its peak within about 10 h. The annual fluctuation range of the water level is between 1 and 4 m.

3.2. Evaluation Content

3.2.1. Determination of Evaluation Indicators

The methods for determining evaluation indicators include theoretical analysis, expert interviews, questionnaire surveys, and analysis of practical engineering cases. In this study, the risk assessment indicator system was established by reviewing the distribution characteristics of karst in Guangdong, researching disaster mechanisms, and consulting experts. The assessment indicators and scoring guidelines are shown in Table 4, Table 5 and Table 6.

3.2.2. Calculation of Indicator Weights

The weights of the indicators were determined using the FAHP method, and the calculation process is as follows: Firstly, it is necessary to collect the importance evaluation results of each factor independently provided by five experts in related fields (the criteria for selecting experts here are that at least five professors or experts from different fields should be selected and these experts should include, for example, geological engineers, geotechnical engineers, construction technicians, etc. These experts should have high recognition and a good reputation in the industry, to ensure the comprehensiveness and accuracy of the evaluation). Then, a fuzzy positive reciprocal matrix A is established using fuzzy theory. For the first-level factor set (A1, A2, A3, A4), matrix A can be decomposed into three matrices.
A = 1 , 1 , 1 0.111 , 0.237 , 1 0.111 , 1.236 , 7 0.111 , 0.542 , 7 1 , 4.213 , 9 1 , 1 , 1 3 , 5.733 , 9 7 , 8.207 , 9 0.143 , 0.809 , 9 0.111 , 0.174 , 0.333 1 , 1 , 1 0.111 , 1.747 , 7 0.143 , 1.845 , 9 0.111 , 0.122 , 0.143 0.143 , 0.572 , 9 1 , 1 , 1 ,
l = 1 0.111 0.111 0.111 1 1 3 7 0.143 0.111 1 0.111 0.143 0.111 0.143 1 ,   m = 1 0.237 1.236 0.542 4.213 1 5.733 8.207 0.809 0.174 1 1.747 1.845 0.122 0.572 1 ,   μ = 1 1 7 7 9 1 9 9 9 0.333 1 7 9 0.143 9 1
We calculate the geometric mean of the columns:
k = 1 4 l 1 k 1 / 4 = ( 1 , 1 , 0.143 , 0.143 ) 1 / 4 = 0.192
The same reasoning leads to
k = 1 4 l 2 k = 2.141 , k = 1 4 l 3 k = 0.205 , k = 1 4 l 4 k = 0.218
k = 1 4 m 1 k = 0.631 , k = 1 4 m 2 k = 3.752 , k = 1 4 m 3 k = 0.705 , k = 1 4 m 4 k = 0.599
k = 1 4 u 1 k = 2.646 , k = 1 4 u 2 k = 5.196 , k = 1 4 u 3 k = 2.140 , k = 1 4 u 4 k = 1.845
The fuzzy weights are then calculated:
w 1 0 = ( k = 1 6 l 1 k ) 1 / 6 j = 1 6 k = 1 6 u j k 1 / 6 , ( k = 1 6 u 1 k ) 1 / 6 j = 1 6 k = 1 6 l j k 1 / 6 = 0.016 , 0.960 ,   w 1 1 = ( k = 1 6 m 1 k ) 1 / 6 j = 1 6 k = 1 6 m j k 1 / 6 = 0.111
i.e., w 1 = 0.016 , 0.111 , 0.960 . Similarly, the fuzzy weights of the remaining factors can be obtained as follows:
w = 0.181 0.660 1.885 0.017 0.124 0.777 0.019 0.105 0.669
The regularization of the fuzzy weight values using the geometric mean method gives the relative weights of the first-level factors:
(A1, A2, A3, A4) = (0.159, 0.536, 0.157, 0.148)
The remaining indicators were calculated in the same way as above, and the results are shown in Table 7. The target level weights (WTL) are equal to the weight of each level 2 indicator multiplied by the weight of the corresponding level 1 indicator.
In addition to consistency checks, the results of the calculations need to ensure that the sum of the weights of the indicators at each level is 1, thus guaranteeing the homogeneity of the system.

3.3. Evaluation Results

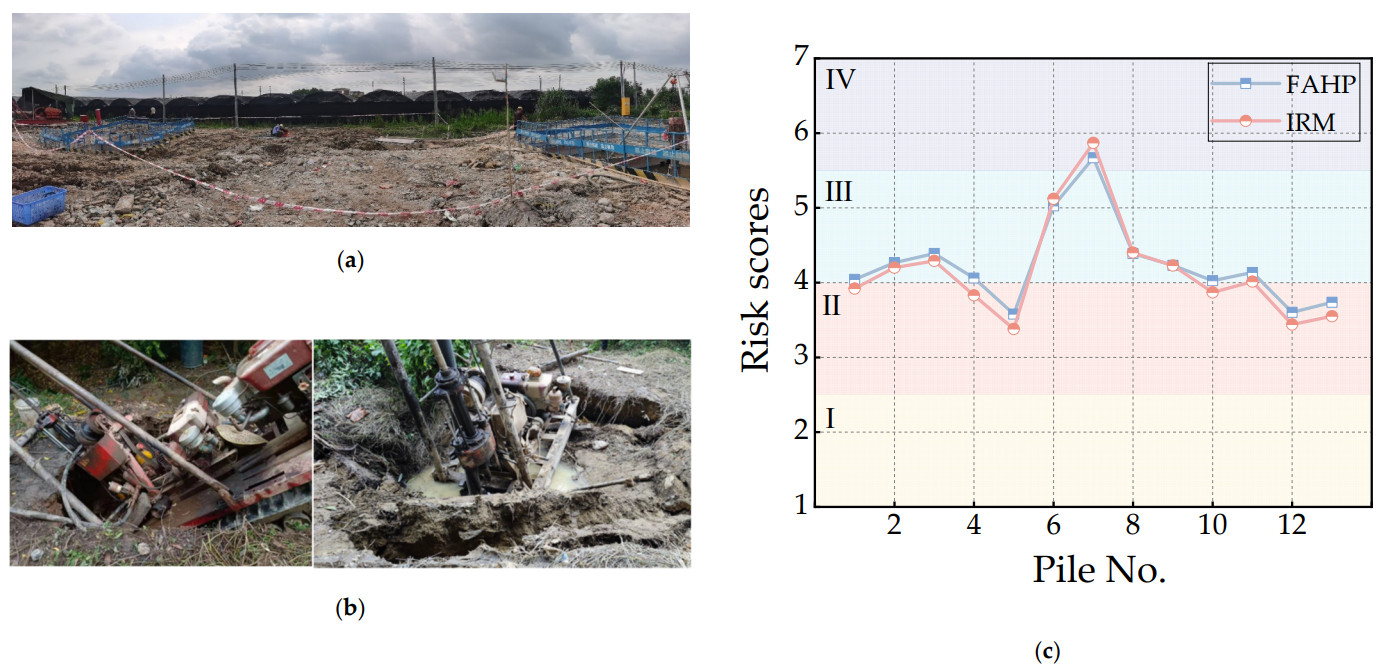
According to the construction ground investigation report of the Qinghua Expressway section, some pile foundations were involved in accidents such as ground collapse and borehole collapse during the investigation and construction stages, as shown in Table 8. Based on the determined index system, the weight coefficients of each factor were calculated by the FAHP and IRM (refer to Appendix A for the calculation methodology) methods, respectively (e.g., Table 7), and then the risk assessment of accidental pile foundations in Table 8 was carried out. The scoring criteria for the indicators are shown in Table 6 (on a 10-point scale).
The evaluation results are shown in Figure 2c, where the scores for the accident pile foundations are generally consistent between the two methods. Specifically, when the score is greater than 4.4, the IRM yields a higher score than the FAHP method. When the score is lower than 4.4, the FAHP method yields a higher score than the IRM. Based on the weight coefficient values of the two methods presented in Table 7, this outcome arises because the IRM, in comparison to the FAHP method, assigns slightly larger weights to the higher-ranked factors and smaller weight coefficients to the lower-ranked factors. This may be due to the IRM not adequately taking into account the correlation between the indicators and the systematic nature of the indicators. For pile foundations 1, 4, and 10, the evaluation levels differ between the two methods, with the FAHP method assigning a Level III rating and the IRM assigning a Level II rating. Since all evaluated pile foundations are accident pile foundations, a higher risk evaluation score indicates greater reliability for high-risk pile foundations. Therefore, it can be concluded that the FAHP method provides a more accurate assessment in this case, as the evaluation results are more in line with the actual situation and are thus more reasonable.
Finally, the risk of pile foundation construction for four different types of bridge in the Qinghua Expressway section was evaluated using the FAHP method, and the relevant parameters of the bridges are shown in Table 9.
The evaluation results are illustrated in Figure 3. As can be observed from the results, among the four bridges, Class II piles constitute the largest proportion: 40.48% for the Baini River Grand Bridge, 53.33% for the Hengbei Bridge, 60% for the main bridge of the Dayan River Grand Bridge, and 64.44% for the Beijiang Grand Bridge. The proportions of Class I and Class IV piles are relatively smaller. Specifically, Class I piles account for 21.43%, 33.33%, 0%, and 0%, respectively, while Class IV piles account for 6.55%, 0%, 7.32%, and 4.44%, respectively. Notably, besides the Hengbei Bridge, the other three bridges have pile foundations with Class IV construction risks. This is attributed to the relatively stable site conditions and weaker karst development (the linear karst rate is 12.3%) in the bridge area of the Hengbei Bridge. The mean risk scores for four bridges are all in the range of 3–4, and the standard deviation of the scores was around 1.000, The specific values are shown in Table 10. This result indicates that the overall construction risk of bridge pile foundations in the area is average to high, with small differences in risk between bridges. Based on the evaluation results and actual construction survey data, the risk level assessments of the four bridges are generally consistent with the actual working conditions. Therefore, the evaluation results can serve as an important reference for subsequent construction activities.

4. Conclusions and Future Prospects

A risk assessment model for bridge pile foundation construction in karst areas based on the Fuzzy Analytic Hierarchy Process (FAHP) is proposed, establishing a comprehensive evaluation index system. This model employs fuzzy mathematical concepts to quantify the subjective experiences inherent in traditional evaluations while incorporating a dynamic weight adjustment mechanism to enable the synergistic assessment of multi-source risks.
The construction risk scores of accident pile foundations were calculated based on the weight coefficients of each factor obtained using the FAHP method and the IRM, respectively. The results indicate that the scores derived from the FAHP method are relatively higher. Higher scores signify greater pile foundation risks, which aligns with the initial assumptions, thereby demonstrating that the weight coefficients calculated by the FAHP method are more reasonable. Finally, the FAHP method was employed to assess the construction risks of pile foundations for four different types of bridges within the working area. The results show that the average risk values of the bridges are all in the range of 3 to 4 points, and the standard deviations are all around 1.000. The evaluation conclusions are largely consistent with actual working conditions.
There are many risk factors affecting the pile foundation construction of bridges in karst regions, and different regions have corresponding local characteristics. This evaluation was conducted based on the area along the Qinghua Expressway in Guangdong Province, where the project is located. The selection of risk factors may have certain limitations. Further research can be conducted in the future to identify more representative risk factors, thereby expanding the scope of application.

Author Contributions

Conceptualization, J.H., G.L. and J.Y.; methodology, G.L.; software, J.Y.; validation, J.Y.; formal analysis, J.Y.; investigation, J.Y.; resources, G.L.; data curation, J.Y.; writing—original draft preparation, J.Y.; writing—review and editing, J.Y. and J.H.; visualization, J.Y.; supervision, J.H. All authors have read and agreed to the published version of the manuscript.

Funding

This research was funded by the Guangdong Province Transportation Science and Technology Program, grant No. 2024-G-018; Science and Technology Research and Development Plan of China Railway Co., Ltd. Grant No. 2022-Major Project-07; and Hunan Province Transportation Science and Technology Program Project, grant No. 202217; Natural Science Foundation of Hunan Province, grant No: 2025JJ80007.

Data Availability Statement

The original contributions presented in the study are included in the article; further inquiries can be directed to the corresponding author.

Acknowledgments

Thank you to all the authors who worked together in the writing of this article, to the reviewers for their suggested revisions.

Conflicts of Interest

Author Jian Han was employed by the company Guangdong Transportation Industrial Investment Co. The remaining authors declare that the research was conducted in the absence of any commercial or financial relationships that could be construed as a potential conflict of interest.

Abbreviations

The following abbreviations are used in this manuscript:
FAHPFuzzy Analytic Hierarchy Process
IRMimportance ranking method
Llength
Ddiameter
Qquantity
Hheight
WTLweight of target level
Rcuniaxial saturated compressive strength of rocks

Appendix A

The importance ranking method (IRM) is a commonly used method of assigning weights, also known as the main factor indicator system method, which ranks the assessment indicators in order of importance and consider the difference between the weight coefficients of neighboring indicators to be the same. The main advantages of the importance ranking method are its simplicity, intuition, flexibility, and transparency, which make it particularly suitable for preliminary weight allocation, the treatment of qualitative indicators, and decision-making problems that require the incorporation of multiple expert opinions. The disadvantage of IRM is that it is susceptible to subjective factors when ranking indicators. The IRM weighting factors are calculated as follows:
ω = 2 n 2 m + 1 n 2
where n is the number of assessment indicators and m is the importance number of the assessment indicator.

References

  1. Liu, L.; Shi, Z.; Peng, M.; Georgios, P. Investigation of Geological Anomalies at Pile Foundation Location in Urban Karst Areas Using Single Borehole Radar. Geosciences 2020, 10, 232. [Google Scholar] [CrossRef]
  2. Huang, M.; Jiang, S.; Xu, C.; Xu, D. A new theoretical settlement model for large step-tapered hollow piles based on disturbed state concept theory. Comput. Geotech. 2020, 124, 103626. [Google Scholar] [CrossRef]
  3. Guo, D.; Song, Z.; Xu, T.; Zhang, Y.; Ding, L. Coupling Analysis of Tunnel Construction Risk in Complex Geology and Construction Factors. J. Constr. Eng. Manag. 2022, 148, 04022097. [Google Scholar] [CrossRef]
  4. Chen, X.; Xue, M.; Song, Y. Analysis of the Influence of Groundwater Level Fluctuation on Karst Soil Cave Collapse. Geofluids 2023, 2023, 7540561. [Google Scholar] [CrossRef]
  5. Xiao, X.; Xu, M.; Ding, Q.; Kang, X.; Xia, Q.; Du, F. Experimental study investigating deformation behavior in land overlying a karst cave caused by groundwater level changes. Environ. Earth Sci. 2018, 77, 64. [Google Scholar] [CrossRef]
  6. Bai, H.; Ma, D.; Chen, Z. Mechanical behavior of groundwater seepage in karst collapse pillars. Eng. Geol. 2013, 164, 101–106. [Google Scholar] [CrossRef]
  7. Xu, M.; Zhang, F.; Ni, P.; Mei, G. Load-settlement behaviour of membrane-confined grouted pile: Experimental and analytical study. Acta Geotech. 2023, 18, 2777–2793. [Google Scholar] [CrossRef]
  8. Liu, D.; Zhang, X.; Tang, Y.; Jin, Y.; Cao, K. Study on the Impact of Different Pile Foundation Construction Methods on Neighboring Oil and Gas Pipelines under Very Small Clearances. Appl. Sci. 2024, 14, 3609. [Google Scholar] [CrossRef]
  9. Lee, C.J.; Jacobsz, S.W. The influence of tunnelling on adjacent piled foundations. Tunn. Undergr. Space Technol. 2006, 21, 430. [Google Scholar] [CrossRef]
  10. Lin, G.; Ke, W.; Guo, S.; Lin, Z.; Xu, C.; Chi, M.; Xiao, Y. Influence of Pile Foundation Construction on Existing Tunnels in a Metro Protection Area: Field Test and Numerical Simulation. Buildings 2024, 14, 2280. [Google Scholar] [CrossRef]
  11. Tang, C.; Shen, C.; Zhang, J.; Guo, Z. Identification of Safety Risk Factors in Metro Shield Construction. Buildings 2024, 14, 492. [Google Scholar] [CrossRef]
  12. Collinge, W.H.; Farghaly, K.; Mosleh, M.H.; Manu, P.; Cheung, C.; Osorio-Sandoval, C. BIM-based construction safety risk library. Autom. Constr. 2022, 141, 104391. [Google Scholar] [CrossRef]
  13. Malekitabar, H.; Ardeshir, A.; Sebt, M.; Stouffs, R. Construction safety risk drivers: A BIM approach. Saf. Sci. 2016, 82, 445–455. [Google Scholar] [CrossRef]
  14. Li, Z.; Nie, L.; Xue, Y.; Li, W.; Fan, K. Model Testing on the Processes, Characteristics, and Mechanism of Water Inrush Induced by Karst Caves Ahead and Alongside a Tunnel. Rock Mech. Rock Eng. 2025, 1–18. [Google Scholar] [CrossRef]
  15. Feng, S.; Lei, H.; Wan, Y.; Jin, H.; Han, J. Influencing factors and control measures of excavation on adjacent bridge foundation based on analytic hierarchy process and finite element method. Front. Struct. Civil. Eng. 2021, 15, 461–477. [Google Scholar] [CrossRef]
  16. Tixier AJ, P.; Hallowell, M.R.; Rajagopalan, B. Construction Safety Risk Modeling and Simulation. Risk Anal. 2017, 37, 1917–1935. [Google Scholar] [CrossRef]
  17. Yu, J.; Zhong, D.; Ren, B.; Tong, D.; Hong, K. Probabilistic Risk Analysis of Diversion Tunnel Construction Simulation. Comput. Aided Civil. Infrastruct. Eng. 2017, 32, 748–771. [Google Scholar] [CrossRef]
  18. Perrin, J.; Cartannaz, C.; Noury, G.; Vanoudheusden, E. A multicriteria approach to karst subsidence hazard mapping supported by weights-of-evidence analysis. Eng. Geol. 2015, 197, 296–305. [Google Scholar] [CrossRef]
  19. Zhang, K.; Zhou, Z.; Chen, S. Stability Assessment of Ground Surface along Tunnels in Karst Terrain Using Improved Fuzzy Comprehensive Evaluation. Adv. Civil. Eng. 2021, 2021, 5523668. [Google Scholar] [CrossRef]
  20. Wei, A.; Li, D.; Zhou, Y.; Deng, Q.; Yan, L. A novel combination approach for karst collapse susceptibility assessment using the analytic hierarchy process, catastrophe, and entropy model. Nat. Hazards 2020, 105, 405–430. [Google Scholar] [CrossRef]
  21. Lou, P.; Wu, T.; Yin, G.; Chen, J.; Zhu, X.; Wu, X.; Li, R.; Yang, S. A novel framework for multiple thermokarst hazards risk assessment and controlling environmental factors analysis on the Qinghai-Tibet Plateau. Catena 2024, 246, 108367. [Google Scholar] [CrossRef]
  22. Zhang, K.; Zheng, W.; Liao, Z.; Xie, H.; Zhou, C.; Chen, S.; Zhu, J. Risk assessment of ground collapse along tunnels in karst terrain by using an improved extension evaluation method. Tunn. Undergr. Space Technol. 2022, 129, 104669. [Google Scholar] [CrossRef]
  23. Lu, Y.; Nie, C.; Zhou, D.; Shi, L. Research on programmatic multi-attribute decision-making problem: An example of bridge pile foundation project in karst area. PLoS ONE 2023, 18, e0295296. [Google Scholar] [CrossRef] [PubMed]
  24. Buckley, J. Fuzzy hierarchical analysis. Fuzzy Sets Syst. 1985, 17, 233–247. [Google Scholar] [CrossRef]
Figure 1. Map of geological features of the study area (The red boxed line shows the work area of the project).
Buildings 15 01059 g001
Figure 2. Accident site photos in the construction area and accident pile foundation assessment scores: (a) ground subsidence; (b) borehole collapse; (c) accident pile foundation assessment score.
Buildings 15 01059 g002
Figure 3. Qinghua Expressway bridge construction risk assessment results (I, II, III, and IV in the pie chart refer to the risk level of the bridge pile foundation): (a) Bai Nihe Bridge; (b) Hengbei Bridge; (c) Dayanhe Super Bridge Main Span; (d) Beijiang Super Bridge. (e) Results for risk score statistics (the error bars represent the standard deviation of the scores).
Buildings 15 01059 g003
Table 1. Scale definitions for 1 to 9.
ScaleDefine
1Indicates that the two are of equal importance compared to each other
3Indicates the relative importance of the former compared to the latter
5Indicates that the former is more important than the latter
7Indicates that the former is quite important compared to the latter
9Indicates that the former is very important compared to the latter
2, 4, 6, 8Indicates a compromise between the two scales
Countdown of the above valuesDenotes that the latter is more important than the former
Table 2. Standard table of random consistency index (RI) values.
Order of Matrix12345678910
RI0.000.000.580.901.121.241.321.411.451.49
Table 3. Risk classification reference table for bridge pile foundation construction in a karst area.
Risk LevelOverall Risk Value for Bridge Piling Construction Safety, R
Significant risk (IV)R > 5.5
Higher risk (III)4 < R ≤ 5.5
General risk (II)2.5 < R ≤ 4
Low risk (I)R ≤ 2.5
The data in the table are empirical values obtained from experiments and are for reference only. Can be adapted to the actual situation.
Table 4. Level 1 indicators (criterion-level).
L1 IndicatorClarification
Pile characteristics (A1)Pile length, diameter, and quantity directly affect construction difficulty.
Geohydrological conditions (A2)Directly affects the stability of pile foundations and is a core risk factor in karst areas.
Construction environment (A3)Constraints on construction space due to terrain, crossings, etc.
Construction technology (A4)Lack of technical maturity and experience may lead to operational errors.
Table 5. Level 2 indicators (alternative-level).
L1L2 IndicatorClarification
A1Foundation pile factor (A11)Includes type of piles, length of piles, and number of pile foundations.
A2Geological engineering conditions (A21)Indicates the geological structure of the work area, adverse geological phenomena, etc.
Degree of karst development (A22)Refers to the distribution density, size, and filling of caves.
Groundwater dynamics (A23)Depth of burial and seasonal variations in groundwater.
Cover thickness (A24)Type of foundation soil layer (e.g., sand, clay) and its thickness.
Hardness of the top rock layer (A25)Lithology and hardness of the rock layer on the roof of the cave.
A3Route crossing (A31)Refers to local topographical conditions and transportation.
Nearby facilities(A32)Foundation form and load distribution of neighboring buildings and their effect on pile foundation construction.
A4Construction process (A41)Refers to the method of hole formation, concrete placement process, etc.
Construction experience (A42)Successes and failures in construction under similar geologic conditions.
Table 6. Scoring criteria for indicators.
IndicatorsRate
[0,2][3,5][6,8][9,10]
Foundation pile factor (A11)L < 10 m/D < 1 mL < 30 m/D < 2 mL > 30 m/D > 2 mL > 50 m/D > 5 m
Geological engineering conditions (A21)Simple geology, no karstWeak karst geologySingle-story caveMultilayered cavern
Degree of karst development (A22)Linear karst ratio: <10%Linear karst ratio: 10–30%Linear karst ratio: 3060%Linear karst ratio: >60%
Groundwater dynamics (A23)Q < 50 m3/d/fluctuation < 0.5 m/dQ ≤ 200 m3/d/fluctuation ≤ 2 m/dQ > 200 m3/d/fluctuation > 2 m/d-
Cover thickness (A24)H > 30 m30 m > H > 10 mH < 10 mH < 5 m
Hardness of the top rock layer (A25)Rc ≤ 30 MpaRc ≤ 60 MpaRc > 60 Mpa-
Route crossing (A31)Non-crossingCountry roadClass I roads/class IV waterwaysCrossing high-speed rail or highway
Nearby facilities (A32)No50 m < Gap5 m < gap < 50 m-
Construction process (A41)MatureSimpleConventionalComplex
Construction experience (A42)Similar projects ≥ 3Similar projects ≥ 1Inexperienced-
Table 7. Table of indicator weights.
L1WeightL2WeightWTLWTLIRM
Pile characteristics (A1)0.159Foundation pile factor (A11)1.0000.1590.170
Geohydrological conditions (A2)0.536Geological engineering conditions (A21)0.1810.0970.110
Degree of karst development (A22)0.3520.1890.190
Groundwater dynamics (A23)0.1960.1050.130
Cover thickness (A24)0.1360.0730.050
Hardness of the top rock layer (A25)0.1350.0720.030
Construction environment (A3)0.157Route crossing (A31)0.5170.0810.090
Nearby facilities (A32)0.4830.0760.070
Construction technology (A4)0.148Construction process (A41)0.9040.1340.150
Construction experience (A42)0.0960.0140.010
It should be noted that the weights in the table are empirical values obtained from this experiment and may have some regional limitations. When applying them to other work areas, it is necessary to recalculate and dynamically adjust the weighting coefficients of the indicators to ensure the accuracy of the evaluation.
Table 8. Pile foundation incident record table.
Pile No.Borehole NumberAccident TypeFAHP ScoreIRM Score
1BNHQZK11Ground subsidence4.0423.920
2BNHQZK107Ground subsidence4.2664.200
3BNHQZK106Ground subsidence4.3884.290
4BNHQZK110Pile machine tilting4.0613.830
5BNHQZK14Borehole collapse3.5793.380
6BNHQZK160Ground subsidence5.0255.120
7BNHQZK170Ground subsidence5.6705.870
8BNHQZK179Pile machine tilting4.3894.400
9BNHQZK198Ground subsidence4.2314.230
10BNHQZK66Ground subsidence4.0253.870
11HBIQZK15Pile machine tilting4.1364.013
12HSQZK20Borehole collapse3.6023.440
13HSQZK29Borehole collapse3.7373.550
Table 9. Parameters related to bridges.
BridgeLength/mNo. PilesKarst Encounter RateLinear Karst RateDepth of Groundwater Table/mRoute Crossing
Bai Nihe Bridge2166.400169.00053.670%3.140–36.860%1.000–7.300Crossing S112, Baini River
Hengbei Bridge975.60030.00036.000%5.200–39.900%0.800–16.800Plain
Dayanhe Super Bridge 325.00041.00070.500%31.500%0.600–3.200Crossing the Dayan River
Beijiang Super Bridge1440.00045.00071.000%12.300%0.900–2.000Crossing the North River
Table 10. Bridge scoring result statistics.
BridgeBai NiheHengbeiDayanheBeijiang
Average ± standard deviation3.674 ± 1.1343.072 ± 0.8943.984 ± 1.0003.867 ± 0.825
Disclaimer/Publisher’s Note: The statements, opinions and data contained in all publications are solely those of the individual author(s) and contributor(s) and not of MDPI and/or the editor(s). MDPI and/or the editor(s) disclaim responsibility for any injury to people or property resulting from any ideas, methods, instructions or products referred to in the content.

