Article

Demand Flexibility of Pre-Cooling Strategies for City-Scale Buildings Through Urban Building Energy Modeling

1
College of Civil Engineering, Hunan University, Changsha 410082, China
2
Key Laboratory of Building Safety and Energy Efficiency of Ministry of Education, Hunan University, Changsha 410082, China
*
Author to whom correspondence should be addressed.
Buildings 2025, 15(7), 1051; https://doi.org/10.3390/buildings15071051
Submission received: 25 February 2025 / Revised: 18 March 2025 / Accepted: 22 March 2025 / Published: 25 March 2025
(This article belongs to the Special Issue Flexible Interaction between Buildings and Power Grid)

Abstract

With the increasing demand for electricity, it is causing a growing burden on the power grid. In order to alleviate the pressure on the power system, a series of demand response (DR) strategies have emerged. This paper studied the DR potential and energy flexibility on city-scale building clusters under pre-cooling combined with temperature reset. This study firstly selected 18 types of buildings, each containing three construction years as prototype buildings, to represent the 228,539 buildings in Shenzhen. Then several pre-cooling strategies were developed, and after comparative analysis, the optimal strategy was obtained and applied to the entire Shenzhen building cluster, with simulation and analysis conducted for the nine administrative districts. Among them, this paper used AutoBPS-DR and added pre-cooling code based on the Ruby language to automatically generate building models with DR strategies and finally simulated the energy consumption results by EnergyPlus. The results showed that a pre-cooling duration of 0.5 h and a change of 2 °C in both pre-cooling temperature and reset temperature was the optimal strategy. Under this strategy, small and medium prototype buildings can achieve better results, with a maximum load reduction of 23.89 W/m2 and a reduction rate of 56.82%. In the simulation results of the building cluster, Guangming District showed the best results. Finally, the peak electricity reduction amount and reduction rate of the entire building cluster were calculated to be 0.007 kWh/m2 and 21.87%, respectively, with the maximum cost saving and saving percentage of 0.081 CNY/m2 and 15.05%, respectively. From this, it can be seen that the Shenzhen building cluster had shown considerable DR potential under the pre-cooling strategy.

1. Introduction

In recent years, population and economic growth led to a sharp increase in global energy consumption. The proportion of global electricity consumption in final energy had significantly increased from 2000 to 2020. The rapid development of electrification in China is expected to reach 32% of final energy consumption by 2025, with a maximum power load growth rate of 4.8%. It increased the peak load of the power grid [1]. In addition, peak electricity consumption accumulates during peak load periods, resulting in disruption to the supply–demand balance of the power grid and posing a greater threat to the stability of the power system. The electric system can deal with the uncertainty and variability of power demand and supply to a certain extent. On the supply side, this kind of flexibility is achieved through power plants with different response times [2], and the flexibility of the demand side is usually reflected in the ability of power users to adjust their electricity consumption behavior according to the operational needs of the power system.
Nowadays, countries are changing their power grid structures to maximize the utilization of renewable resources and further achieve better economic and environmental benefits [3]. In order to adapt to the development of the power system and improve its reliability, a series of measures have emerged. Among them, demand response (DR), as an advanced demand-side management technology, effectively alleviates the damage to the balance of the power grid during on-peak periods. A typical demand side management technique mainly includes four aspects: demand limiting, demand shedding, demand shifting, and on-site generation [4]. In most existing studies, specific measures include heating, ventilation, and air conditioning (HVAC) control, temperature reset, pre-cooling, lighting control, plug load control, etc. Generally, researchers will select several different strategies and explore the effects of combination strategies. For example, Peng et al. [5] selected sixty-six prototype building models in Changsha for simulation. Results in their study showed that the effectiveness of the four DR strategies implemented in the case building simulation was ranked as follows: combined control, plug load control, temperature reset, and lighting control, with the electricity demand reduction rates of 22.00%, 8.72%, 7.94%, and 5.80%, respectively.
Pre-cooling is a DR strategy to transfer the electricity load during peak periods, among which an HVAC system overcools internal space during off-peak hours and uses the building structure as passive thermal storage to alleviate the load pressure during on-peak hours [6]. The pre-cooling strategy can reduce the electricity load of the HVAC system during peak hours and consume cheaper electricity during off-peak hours. Most of the pre-cooling methods can be divided into two categories: rule-based and optimization-based strategies. Rule-based pre-cooling control, for example, Kishore et al. [7] investigated the effect of different pre-cooling strategies on the heat gains of lightweight building walls. Results showed that the proposed optimal pre-cooling strategy could transfer the peak heat gain by 14 h, reducing the heat gain during the peak load period by 95%. Moreover, in the study of Chen et al. [8], two kinds of DR strategies, including pre-cooling and temperature reset, were selected for the experiment. It was found that the strategies had certain effects on both 0.5 h and 2 h DR events. Similar to these studies, such rule-based strategies are relatively easy to implement, but they cannot flexibly adapt to constantly changing conditions, so the results are usually not the most effective.
On the other hand, optimization-based pre-cooling strategies were developed. Wang et al. [1] developed a co-simulation framework based on EnergyPlus and a genetic algorithm to evaluate the effectiveness of pre-cooling combined with temperature reset strategies. Then, an optimal control strategy was found by minimizing power consumption and electricity costs while considering the time of use (ToU) electricity price and thermal comfort. Results showed that, compared with the rule-based strategies proposed in this study, the energy consumption of the variable refrigerant flow system under the optimal DR strategy can be reduced by a maximum of 80.12% during the DR period, and the daily electricity cost can be saved by a maximum of 14.98%. Wang et al. [9] formulated an integer linear programming problem to find an optimal pre-cooling strategy through simulation. The results also showed that, compared to the other three rule-based DR strategies, the optimal control strategy can demonstrate better DR potential, with a saving of 56.82%, 45.52%, and 20.00%, respectively.
Obviously, the effectiveness of the pre-cooling strategy largely depends on the thermal mass of a building, which is commonly used to describe the capability of building structures and internal objects to store thermal energy. When pre-cooling before the on-peak hours, the cooling setpoint is lower than normal, and cooling energy is stored in the construction materials and furniture. When it reaches the on-peak hours, pre-cooling ends, and the cooling setpoint is raised so that the cooling energy stored in the construction materials and furniture is gradually released. The existing research on utilizing building thermal mass focused on applications that shift load or limit peak demand [10]. But Shan et al. [11] investigated the energy-saving potential in recovering the stored cooling energy. This study proposed a model-based control strategy and validated it on-site and on a dynamic simulation platform. The results of both kinds of experiments were consistent, indicating that the control strategy had a good energy-saving effect. The maximum energy-saving rate during the energy recovery time in the on-site verification can reach 85.8%, while in the simulation experiments, 83.8% of cooling energy can be saved during the period.
Moreover, much research has been conducted to explore how to improve thermal mass. One of the most familiar ones among them was integrating phase change material (PCM) into building envelopes [7,12,13] to improve the thermal capacity. What is more, in the study of Jaradat et al. [14], they conducted research on a more advanced PCM: a bio-based PCM, which was extracted from renewable biomass. Results showed that this bio-based PCM can improve the thermal characteristics of building envelopes more significantly, leading to better economic and environmental benefits. These research results indicated that PCM-integrated walls can increase the thermal mass of building envelopes and provide higher DR potential and finally lead to a decrease in electricity load and bills. However, Jarvinen et al. [15] designed a unique pre-cooling method. While most people were considering pre-cooling before peak time, they used a different approach to reduce peak demand by changing occupied zone setpoints outside of occupied hours long before the peak demand event but not during occupied hours. Results in their study showed that maximum capacity pre-cooling for 2–12 h can reduce peak power demand by 3.4%, and for an oversized cooling plant, it could be 6.6%. Though it led to higher overall energy consumption, it may still bring a small cost saving under practical electricity prices.
Most of the existing research chose a single building for simulation analysis, and the impact of different building types on DR potential could not be concluded. In addition, they only selected one region for pre-cooling research or conducted comparative analysis from different building types, without discussing DR potential according to different regions such as administrative divisions. Although electricity prices in China are generally regulated, most cities had already implemented ToU electricity prices, and pre-cooling is to utilize the peak-to-valley electricity tariff difference. When the electricity price is low, pre-cooling is carried out to store cold capacity, and then during peak electricity consumption periods, when the electricity price is high, users actively reduce energy consumption. Thereby, total expenses can be reduced, and more than this, the effect of shifting peak hours and filling valleys can relieve the pressure on the power grid during peak electricity consumption periods and ultimately respond to the demand of the power grid. Thus, it can be seen that conducting an impact analysis of electricity prices in pre-cooling research can better assist users in demand response, ensuring the safe and economic operation of the power grid system.
In order to make up for the shortcomings of existing research and solve the remaining problems, a simulation-based method was proposed to evaluate the pre-cooling effect of city-scale buildings under ToU electricity price rules and applied it to the case models to study the energy flexibility of overall buildings under different pre-cooling control strategies. The pre-cooling strategies proposed in this paper combined temperature reset to make the results more significant. Moreover, in order to simplify the modeling process and reduce the modeling time, we used AutoBPS-DR [5], a tool for automatically generating DR models of prototype buildings, which can modify temperature setpoints and schedules to achieve different pre-cooling strategies. Then simulated and analyzed building energy consumption through EnergyPlus. The energy consumption of all buildings in the Shenzhen building cluster in this study was calculated by simulating the energy consumption of all representative types of prototype models and then aggregating them based on area information. On the basis of previous studies, the main aims and contributions of this paper were as follows:
(1)
Exploring the factors related to indoor temperature changes and thermostat settings and how to develop reasonable and relatively effective pre-cooling strategies with temperature reset based on electricity pricing rules.
(2)
Combining EnergyPlus with AutoBPS to achieve more efficient and rapid establishment of DR models and obtain energy consumption results.
(3)
Expanding the simulation from individual buildings to the entire building cluster. To explore the pre-cooling implementation effects on different districts and finally summarize the DR potential of the entire building cluster, which has reference value for architectural design and urban construction.
(4)
Exploring the effect of peak shaving and valley filling based on electricity bills and evaluation indicators, achieving quantitative evaluation of energy flexibility, and thereby providing constructive suggestions for control optimization of HVAC systems.
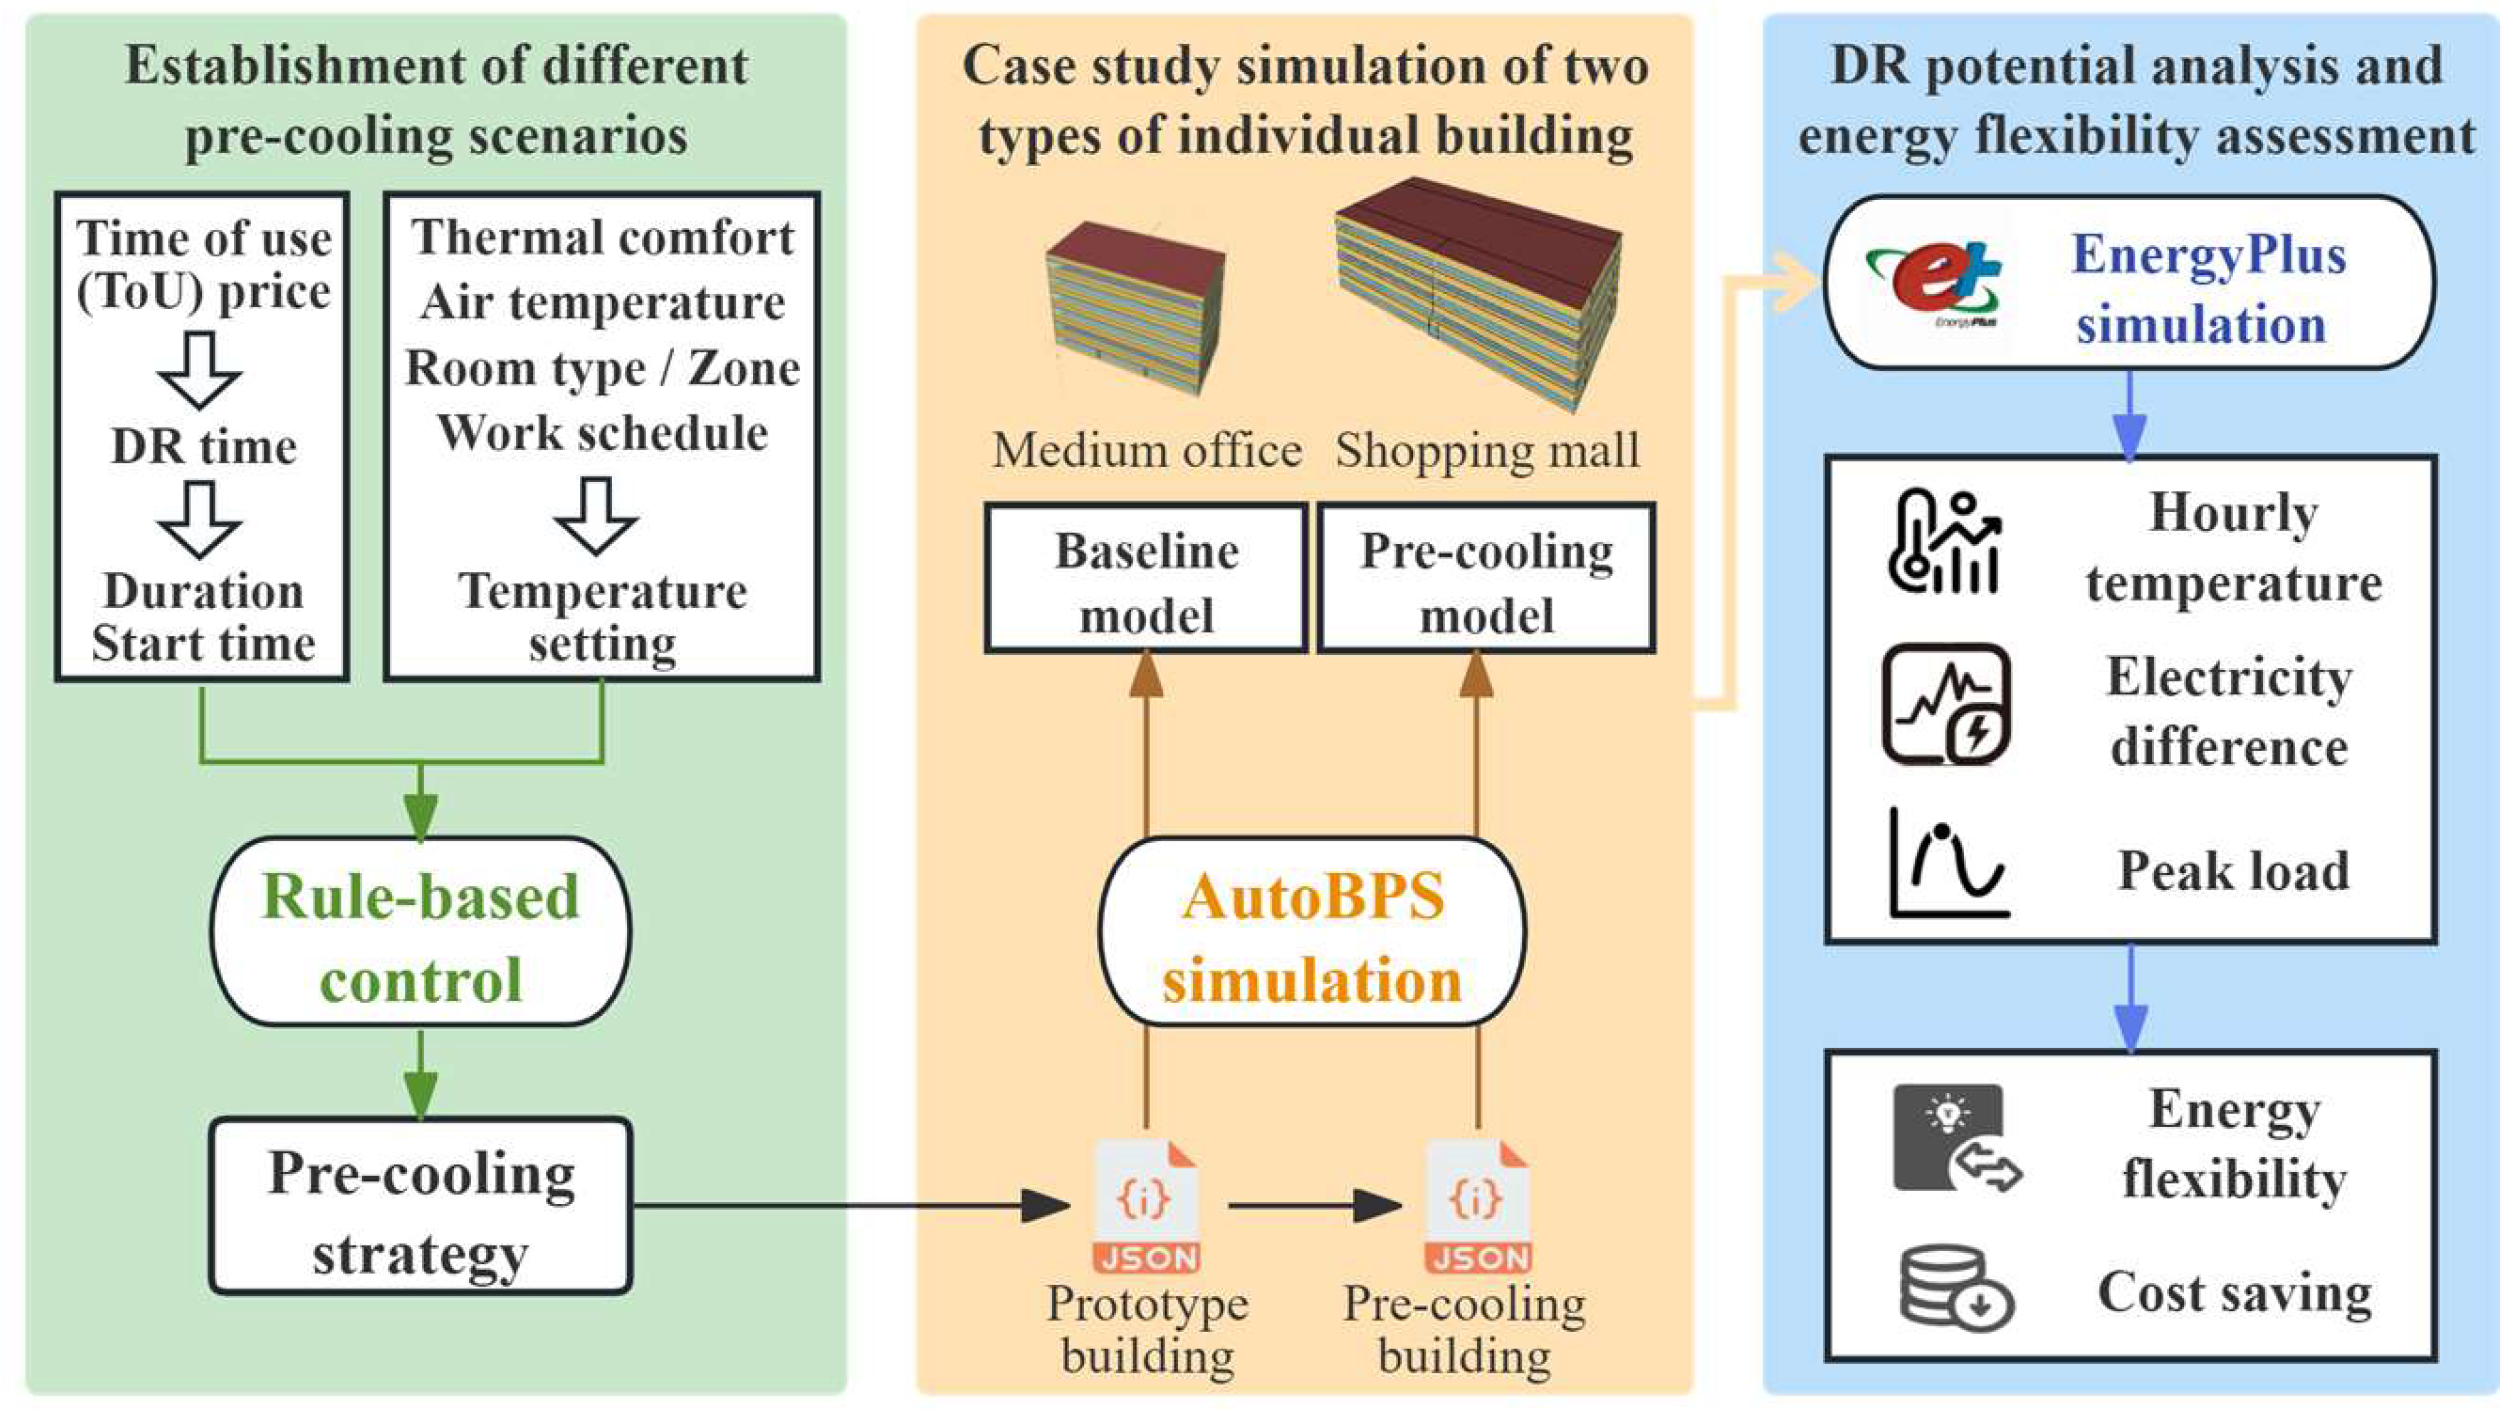
2. Method

Figure 1 illustrates the overall workflow of the demand flexibility exploration process adopted in this study. The first step was to select a case study building and establish its model in EnergyPlus. The information collection of the selected simulated building had been studied in previous research. So, this study mainly focused on the development of a DR strategy. The simulated case buildings in this study were located in Shenzhen, China, and therefore the real ToU electricity price in Shenzhen was investigated. Based on peak and valley electricity price, the period of time for demand response was set, which determined the duration and start time of the implementation of DR strategies. At the same time, the temperature setting of each strategy was developed according to thermal comfort, outdoor temperature change, zone type, and work schedule, combined with relevant regulations and literature to set the temperature range. By combining the time and temperature settings, several different pre-cooling strategies can be obtained under rule-based control conditions. These pre-cooling strategies applied both pre-cooling and temperature reset. The second step was to simulate the building models by AutoBPS. AutoBPS was an automated building performance simulation tool developed by Hunan University in China [16]. Two different types of individual buildings were considered in this study: medium office buildings and shopping malls. Through running the JSON files of prototype buildings and buildings with pre-cooling strategies by AutoBPS, the baseline models and varied pre-cooling models under DR strategies were obtained. The third step was to get the results through EnergyPlus simulation and mainly observe hourly indoor air temperature, hourly electricity difference, and peak load reduction. Then, the time over which power can be shifted and the amount of energy or power that can be shifted or shed from these data were calculated. Moreover, the final cost savings of each pre-cooling scenario were calculated through the ToU prices investigated initially. Then, the more effective pre-cooling strategy was compared and summarized. Finally, the optimal pre-cooling control strategy was applied to building clusters, and the DR potential was further explored under the entire group of buildings. This step served as an analysis of the electric power peak-load shifting capability and energy flexibility of pre-cooling implementation.

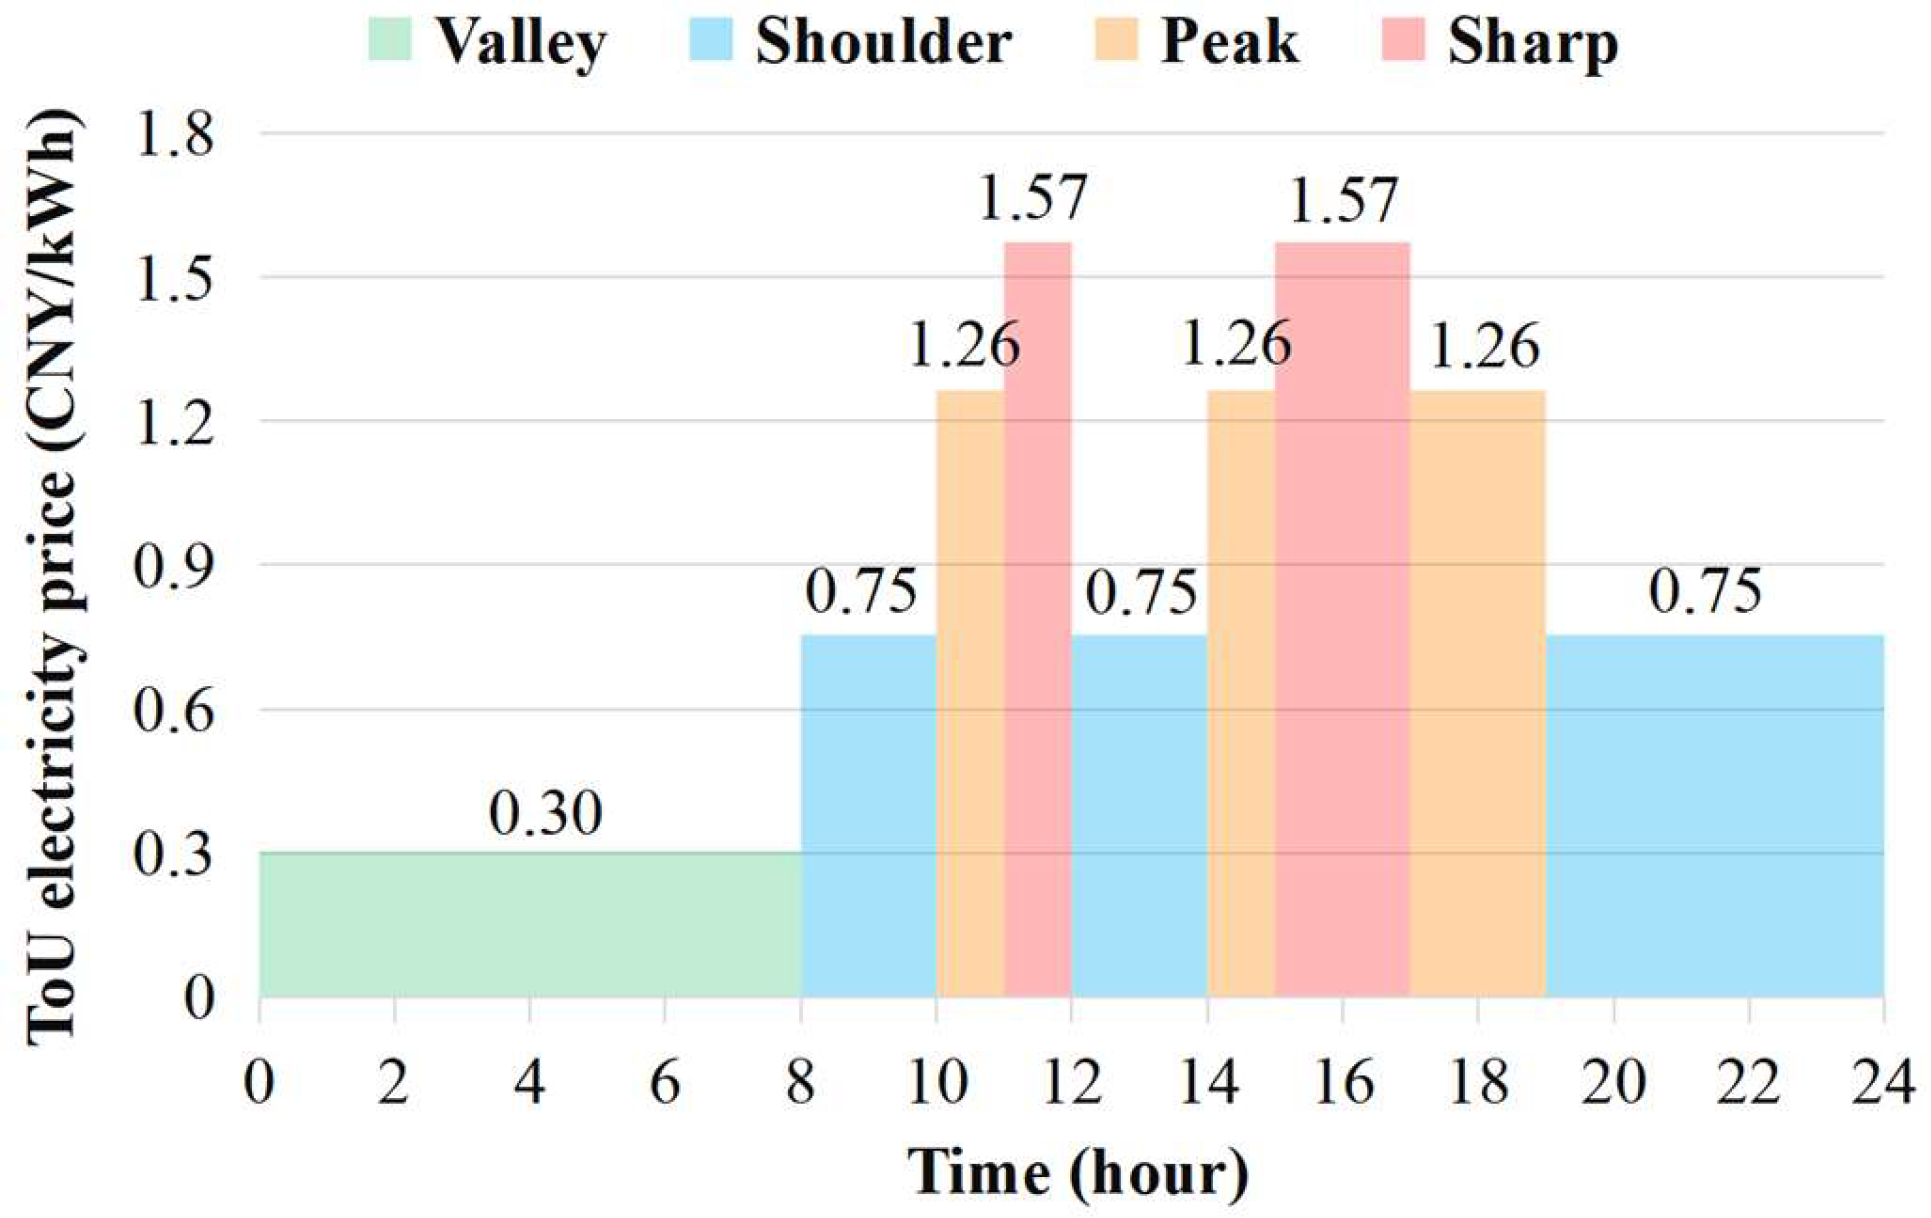
2.1. Investigation of ToU Price

In terms of cost savings, pre-cooling essentially relies on changing electricity prices based on ToU rates, so a more significant change in electricity prices can make the implementation of pre-cooling more effective. And research has found that more electricity costs could be saved as the peak-to-valley electricity tariff difference became wider [17]. In this paper, buildings in Shenzhen were selected for simulation, and through research, it was found that there was a significant difference in peak and valley electricity prices in Shenzhen. As shown in Figure 2, actual electricity price rules of the region from 1 to 31 July 2024, were used as a reference. Based on the peak-valley time of electricity prices, the DR time can be defined, and the final electricity bills can be figured out.

2.2. Case Study Buildings

2.2.1. Individual Building

As shown in Figure 3, this paper selected two types of individual buildings as case study buildings for detailed research, namely, medium office building and shopping mall. The main zones of the medium office building and shopping mall were of the same type: office and retail, respectively. According to the Design Standard for Energy Efficiency of Public Buildings (GB 50189-2005, GB 50189-2015) [18,19] and for Energy Efficiency of Residential Buildings in Hot Summer and Cold Winter Zones (JGJ 134–2001, JGJ 134–2010) [20,21], as well as referencing the DOE Prototype Building Models, some settings for building envelope and other property parameters had been defined in Table 1, Table 2 and Table 3, which was applicable to all types of prototype buildings. The building data after 2022 were set according to the General Code for Energy Efficiency and Renewable Energy Application in Buildings (GB 55015-2021) [22], which applied to both residential and commercial buildings. However, the case study buildings in this research focused on buildings before 2022 and had not yet considered buildings after that. As for temperature change analysis, two rooms on the top floors were selected for each model to study the hourly temperature, as they were greatly affected by the environment. If these rooms can meet the temperature conditions, then the other rooms can also meet the requirements.

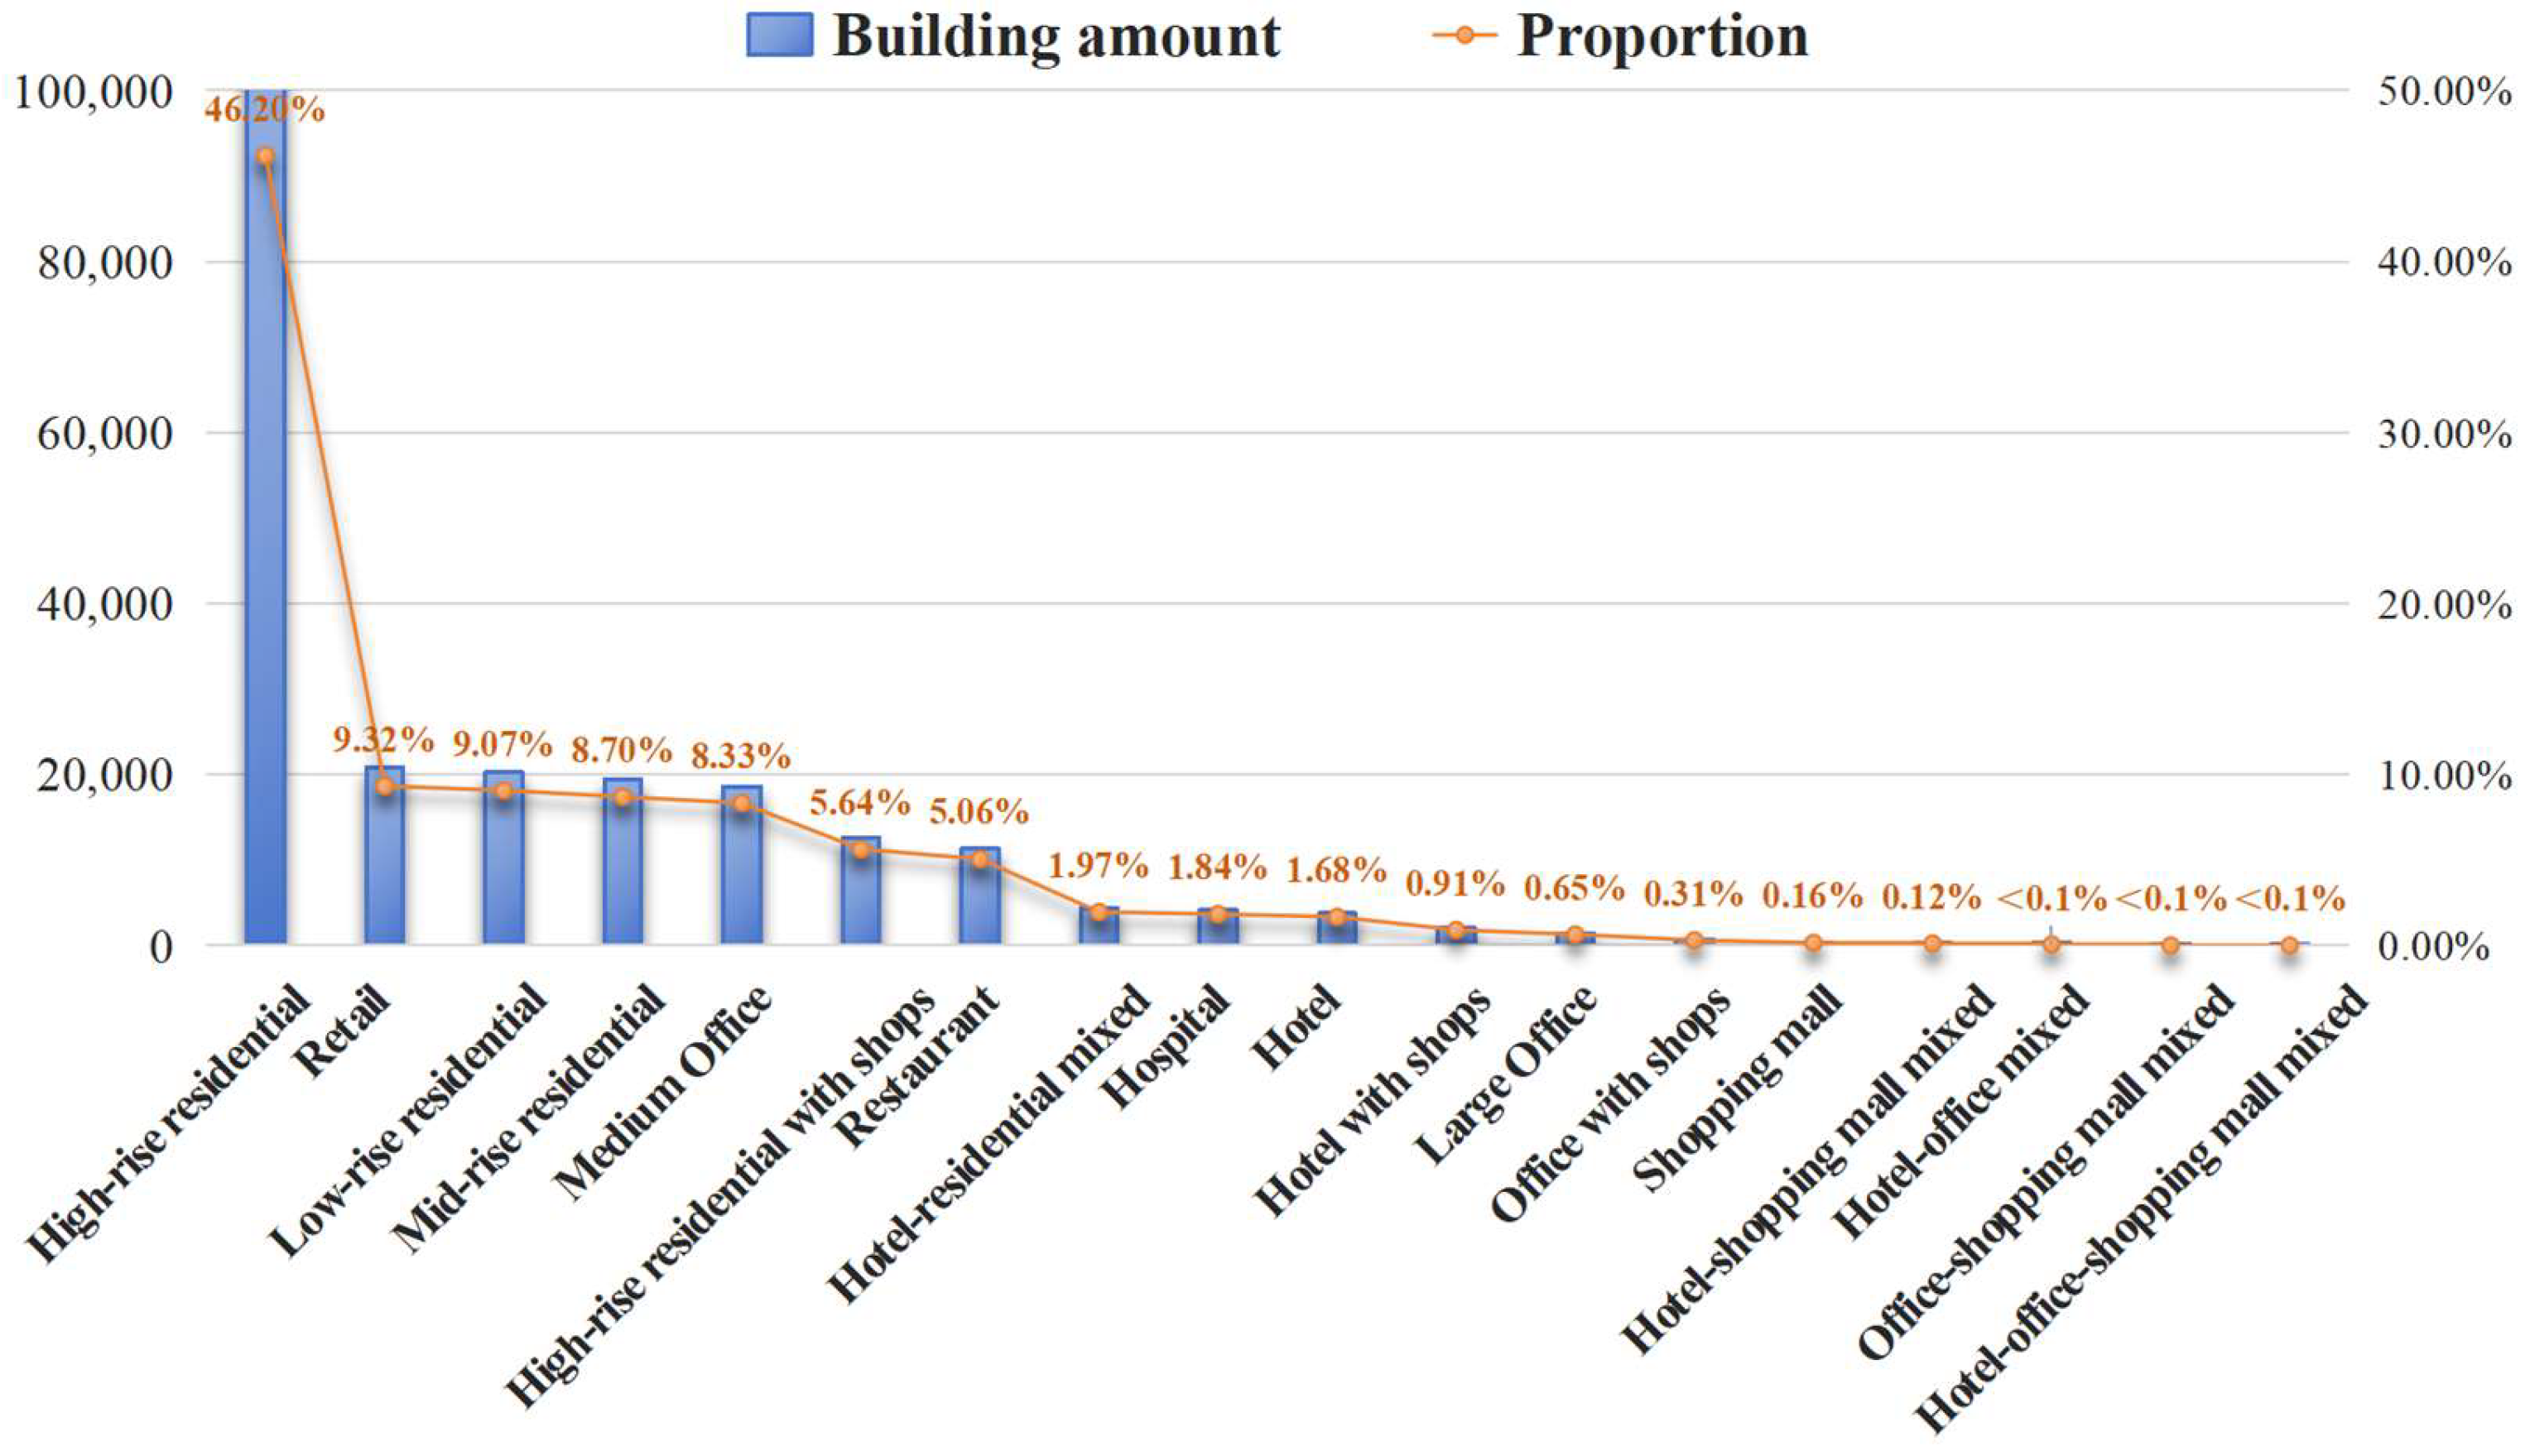
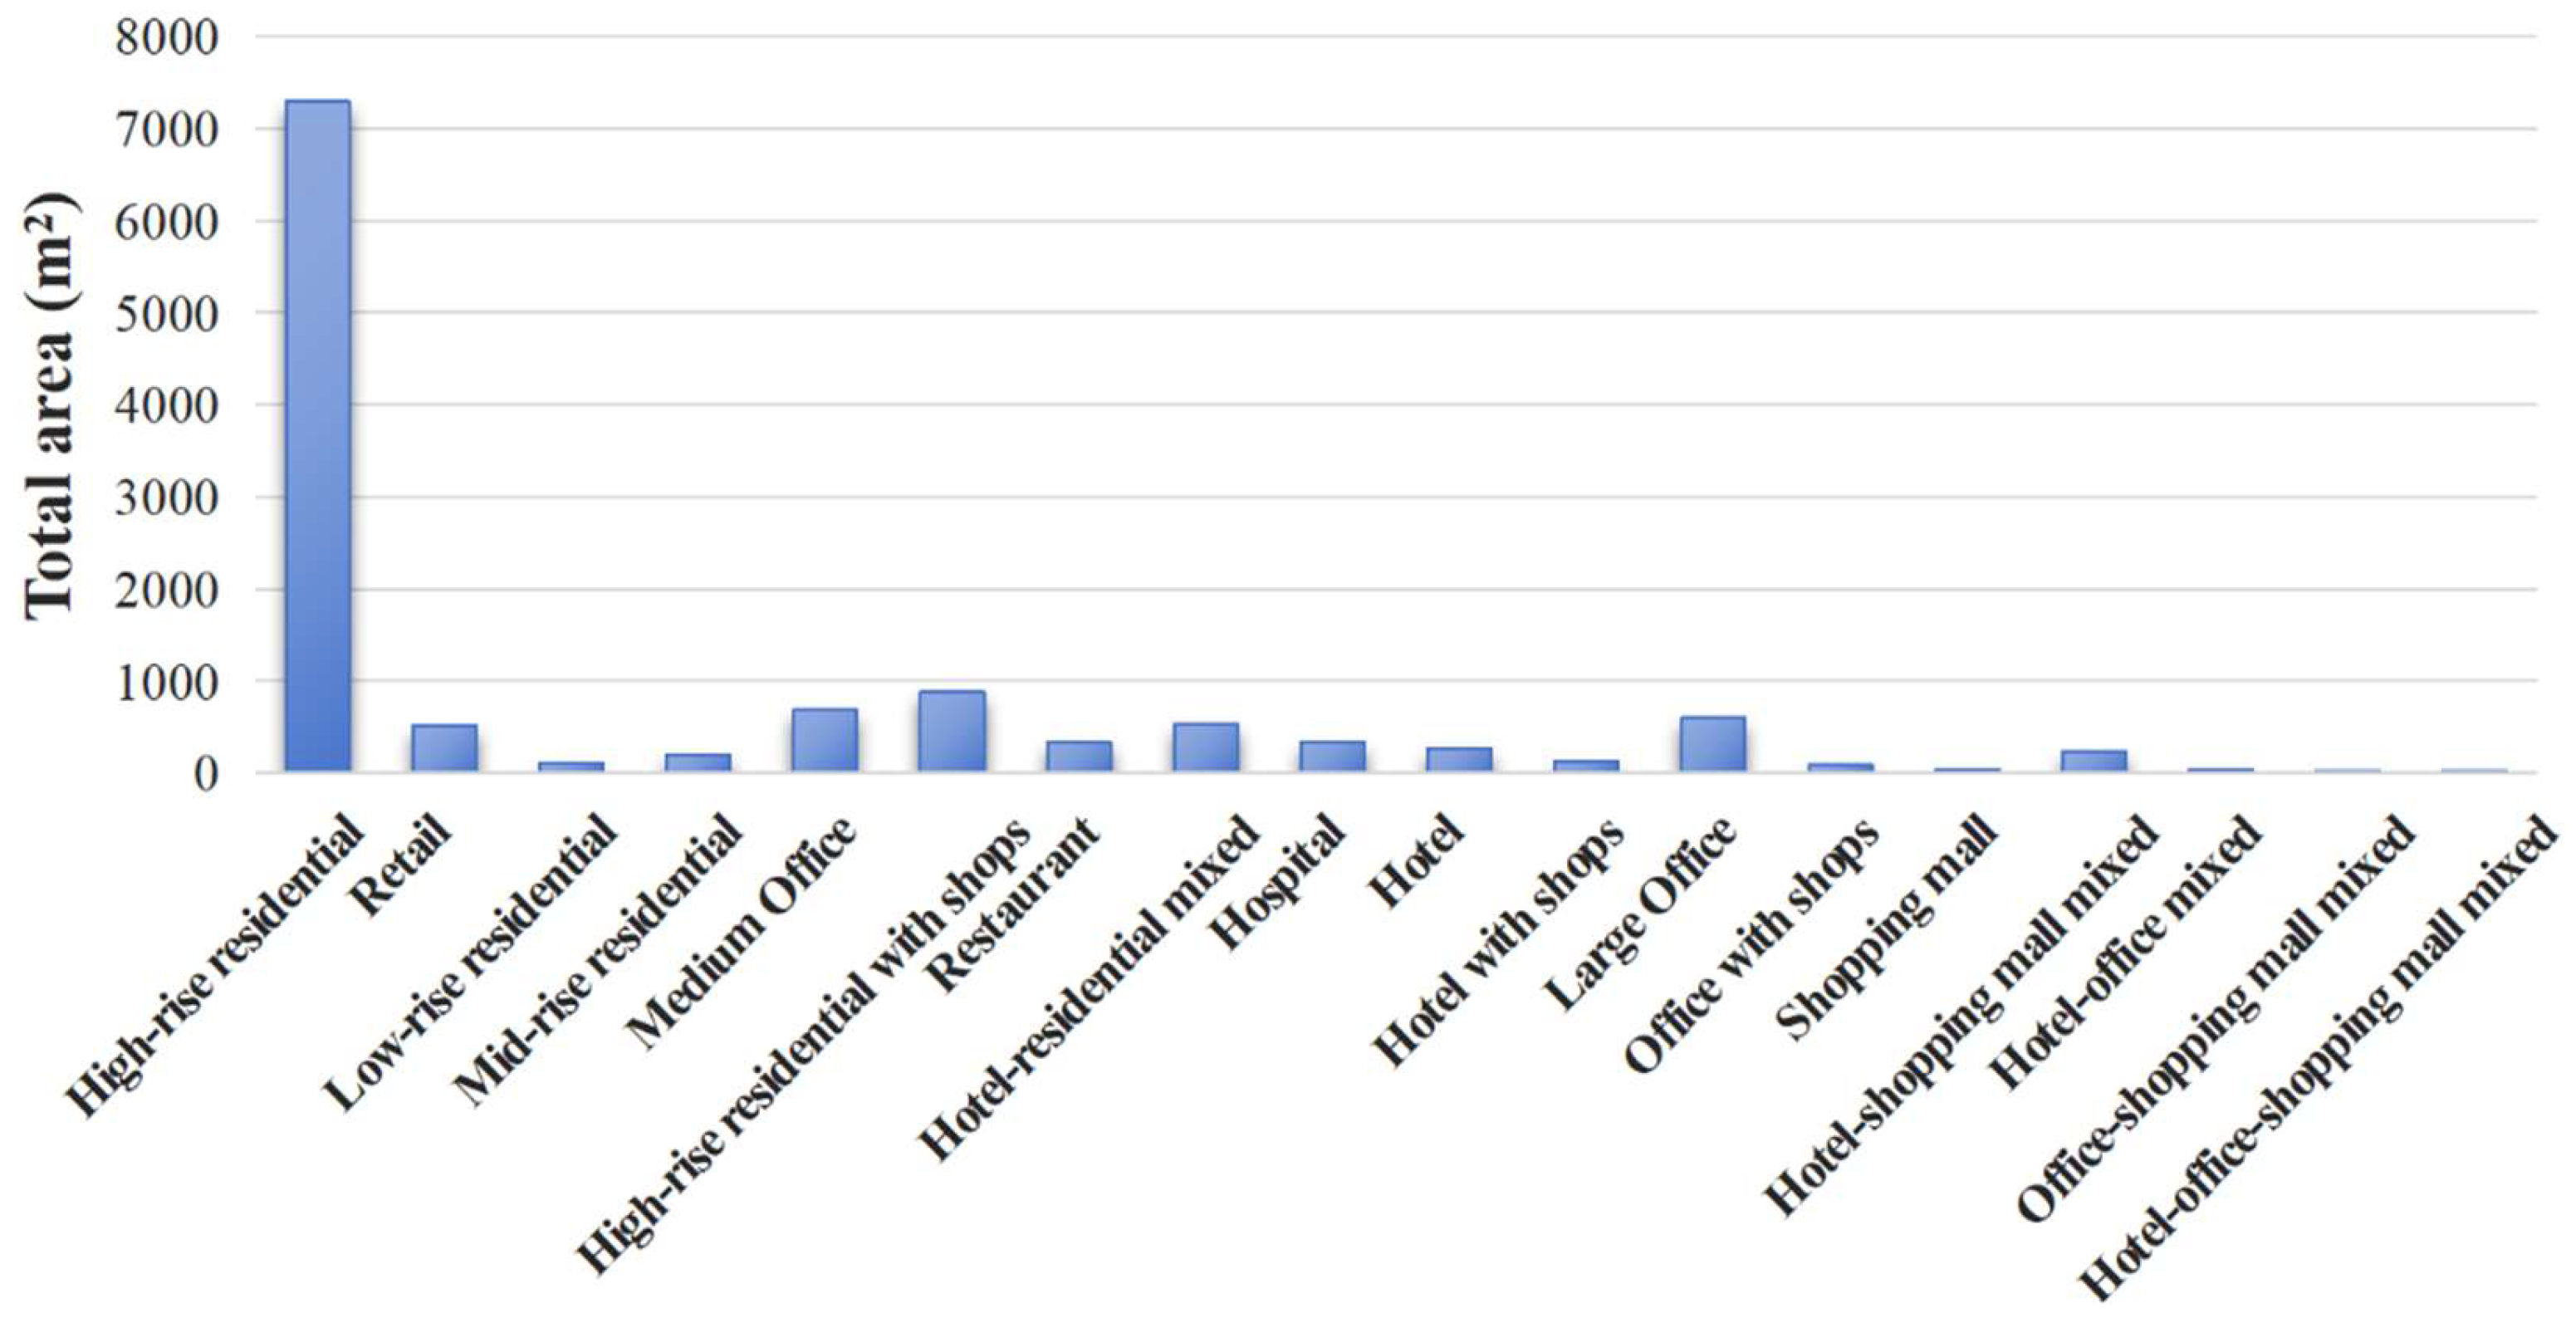
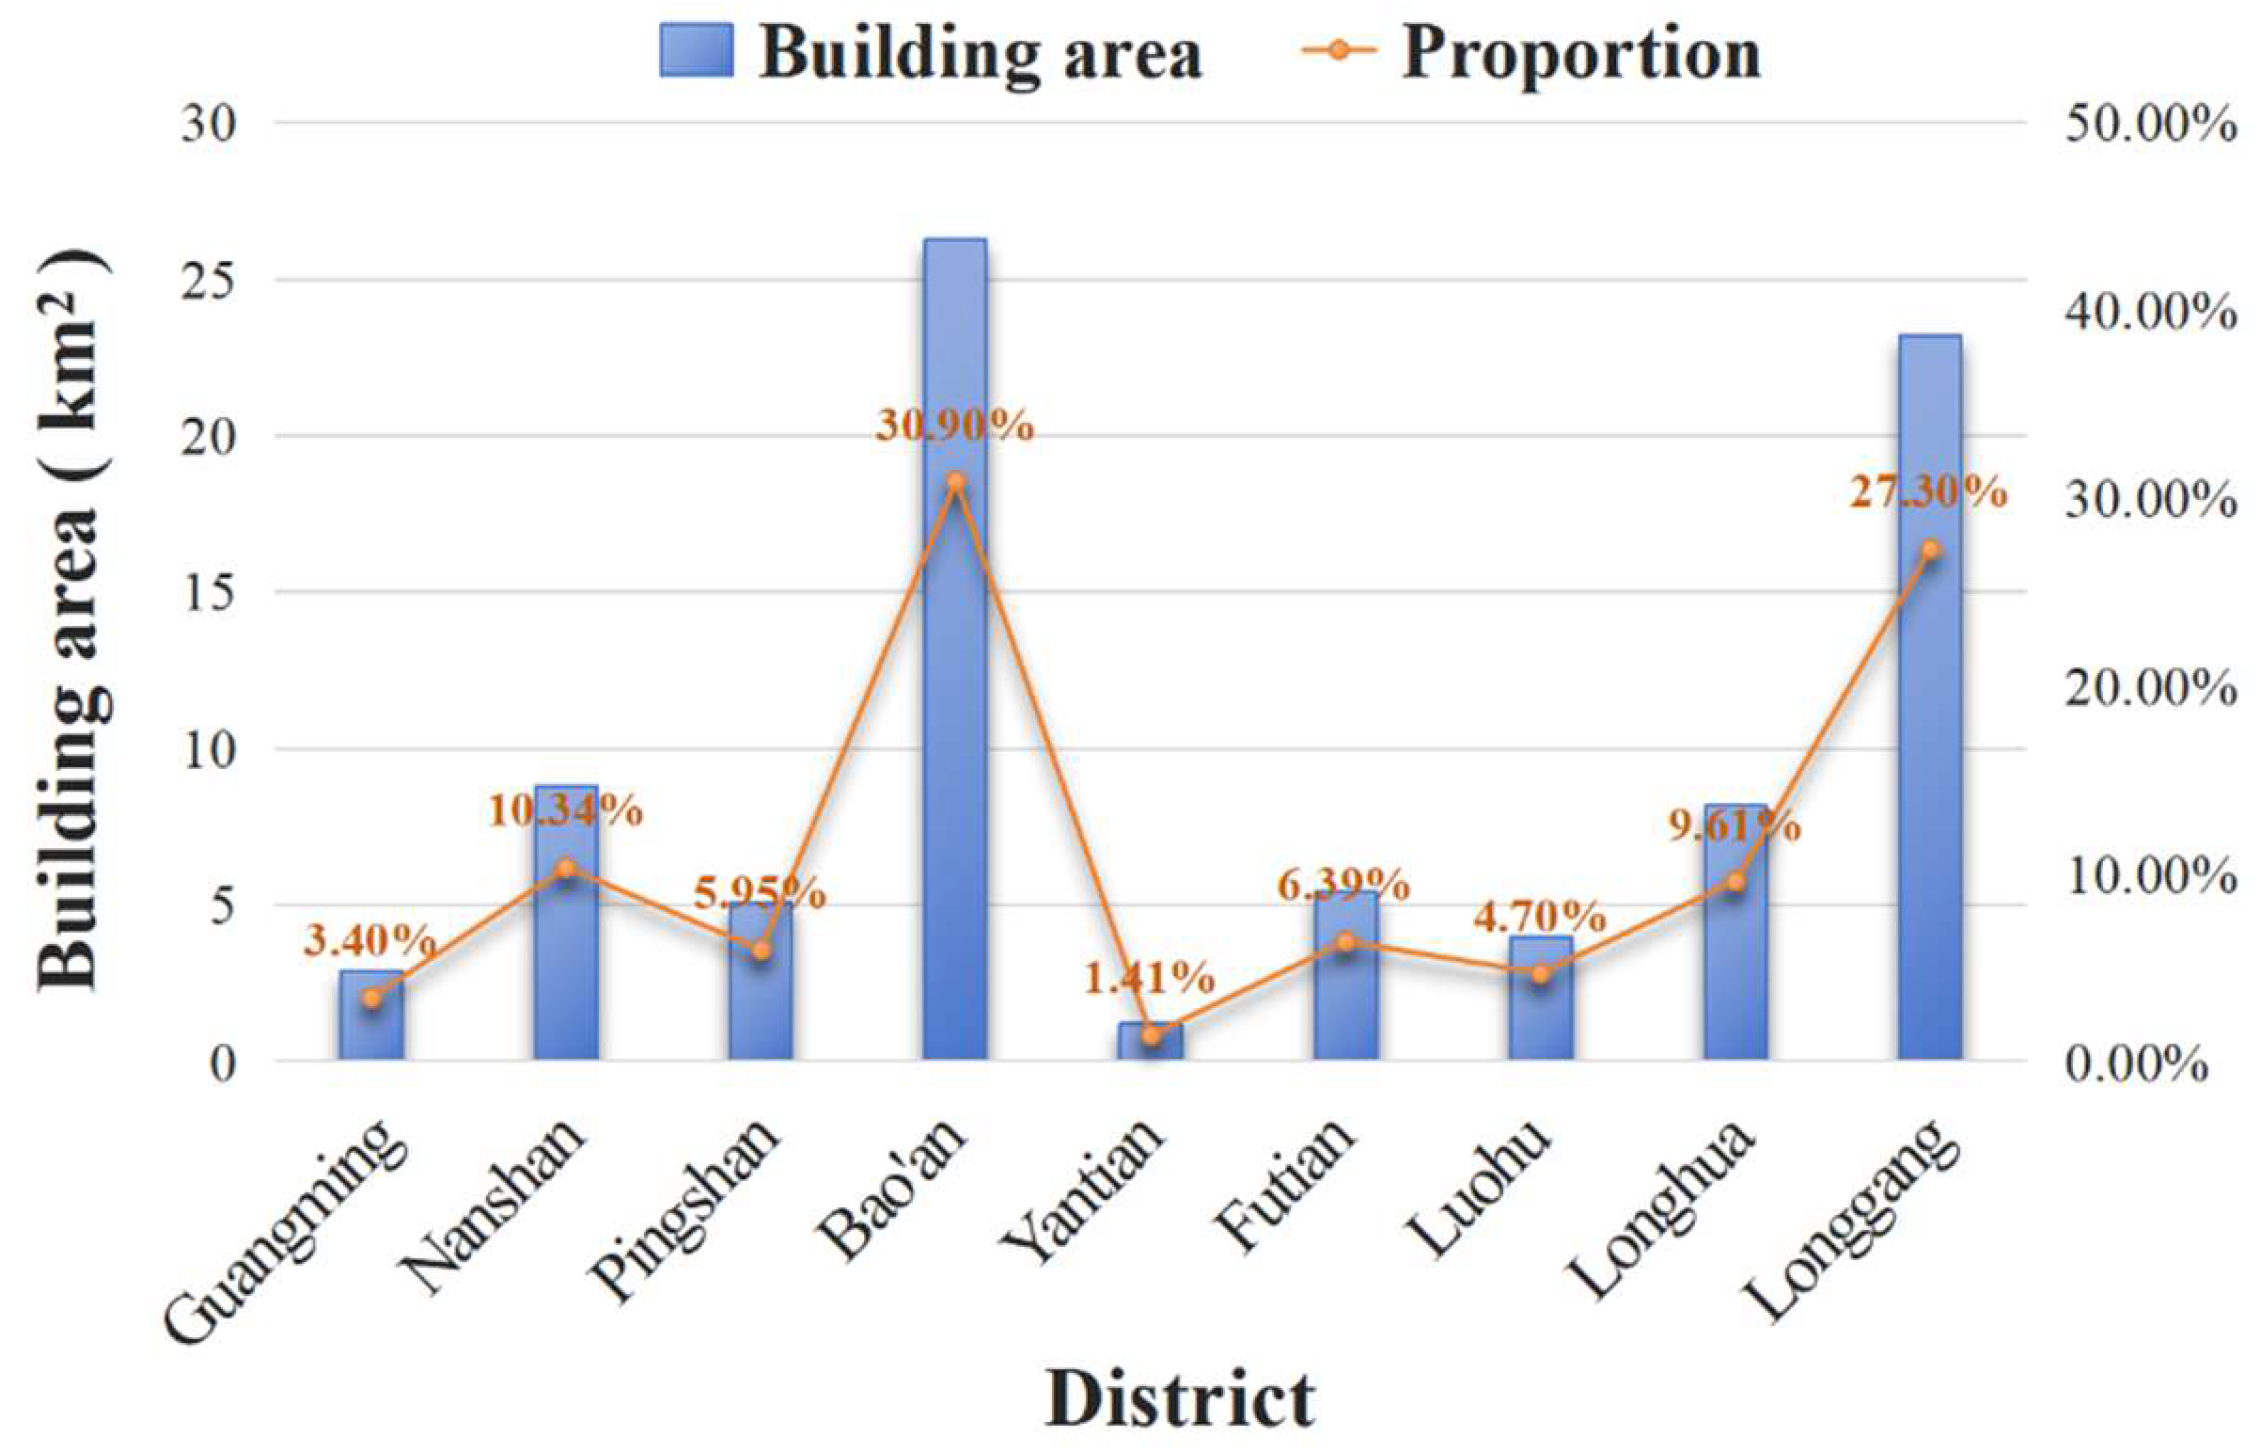
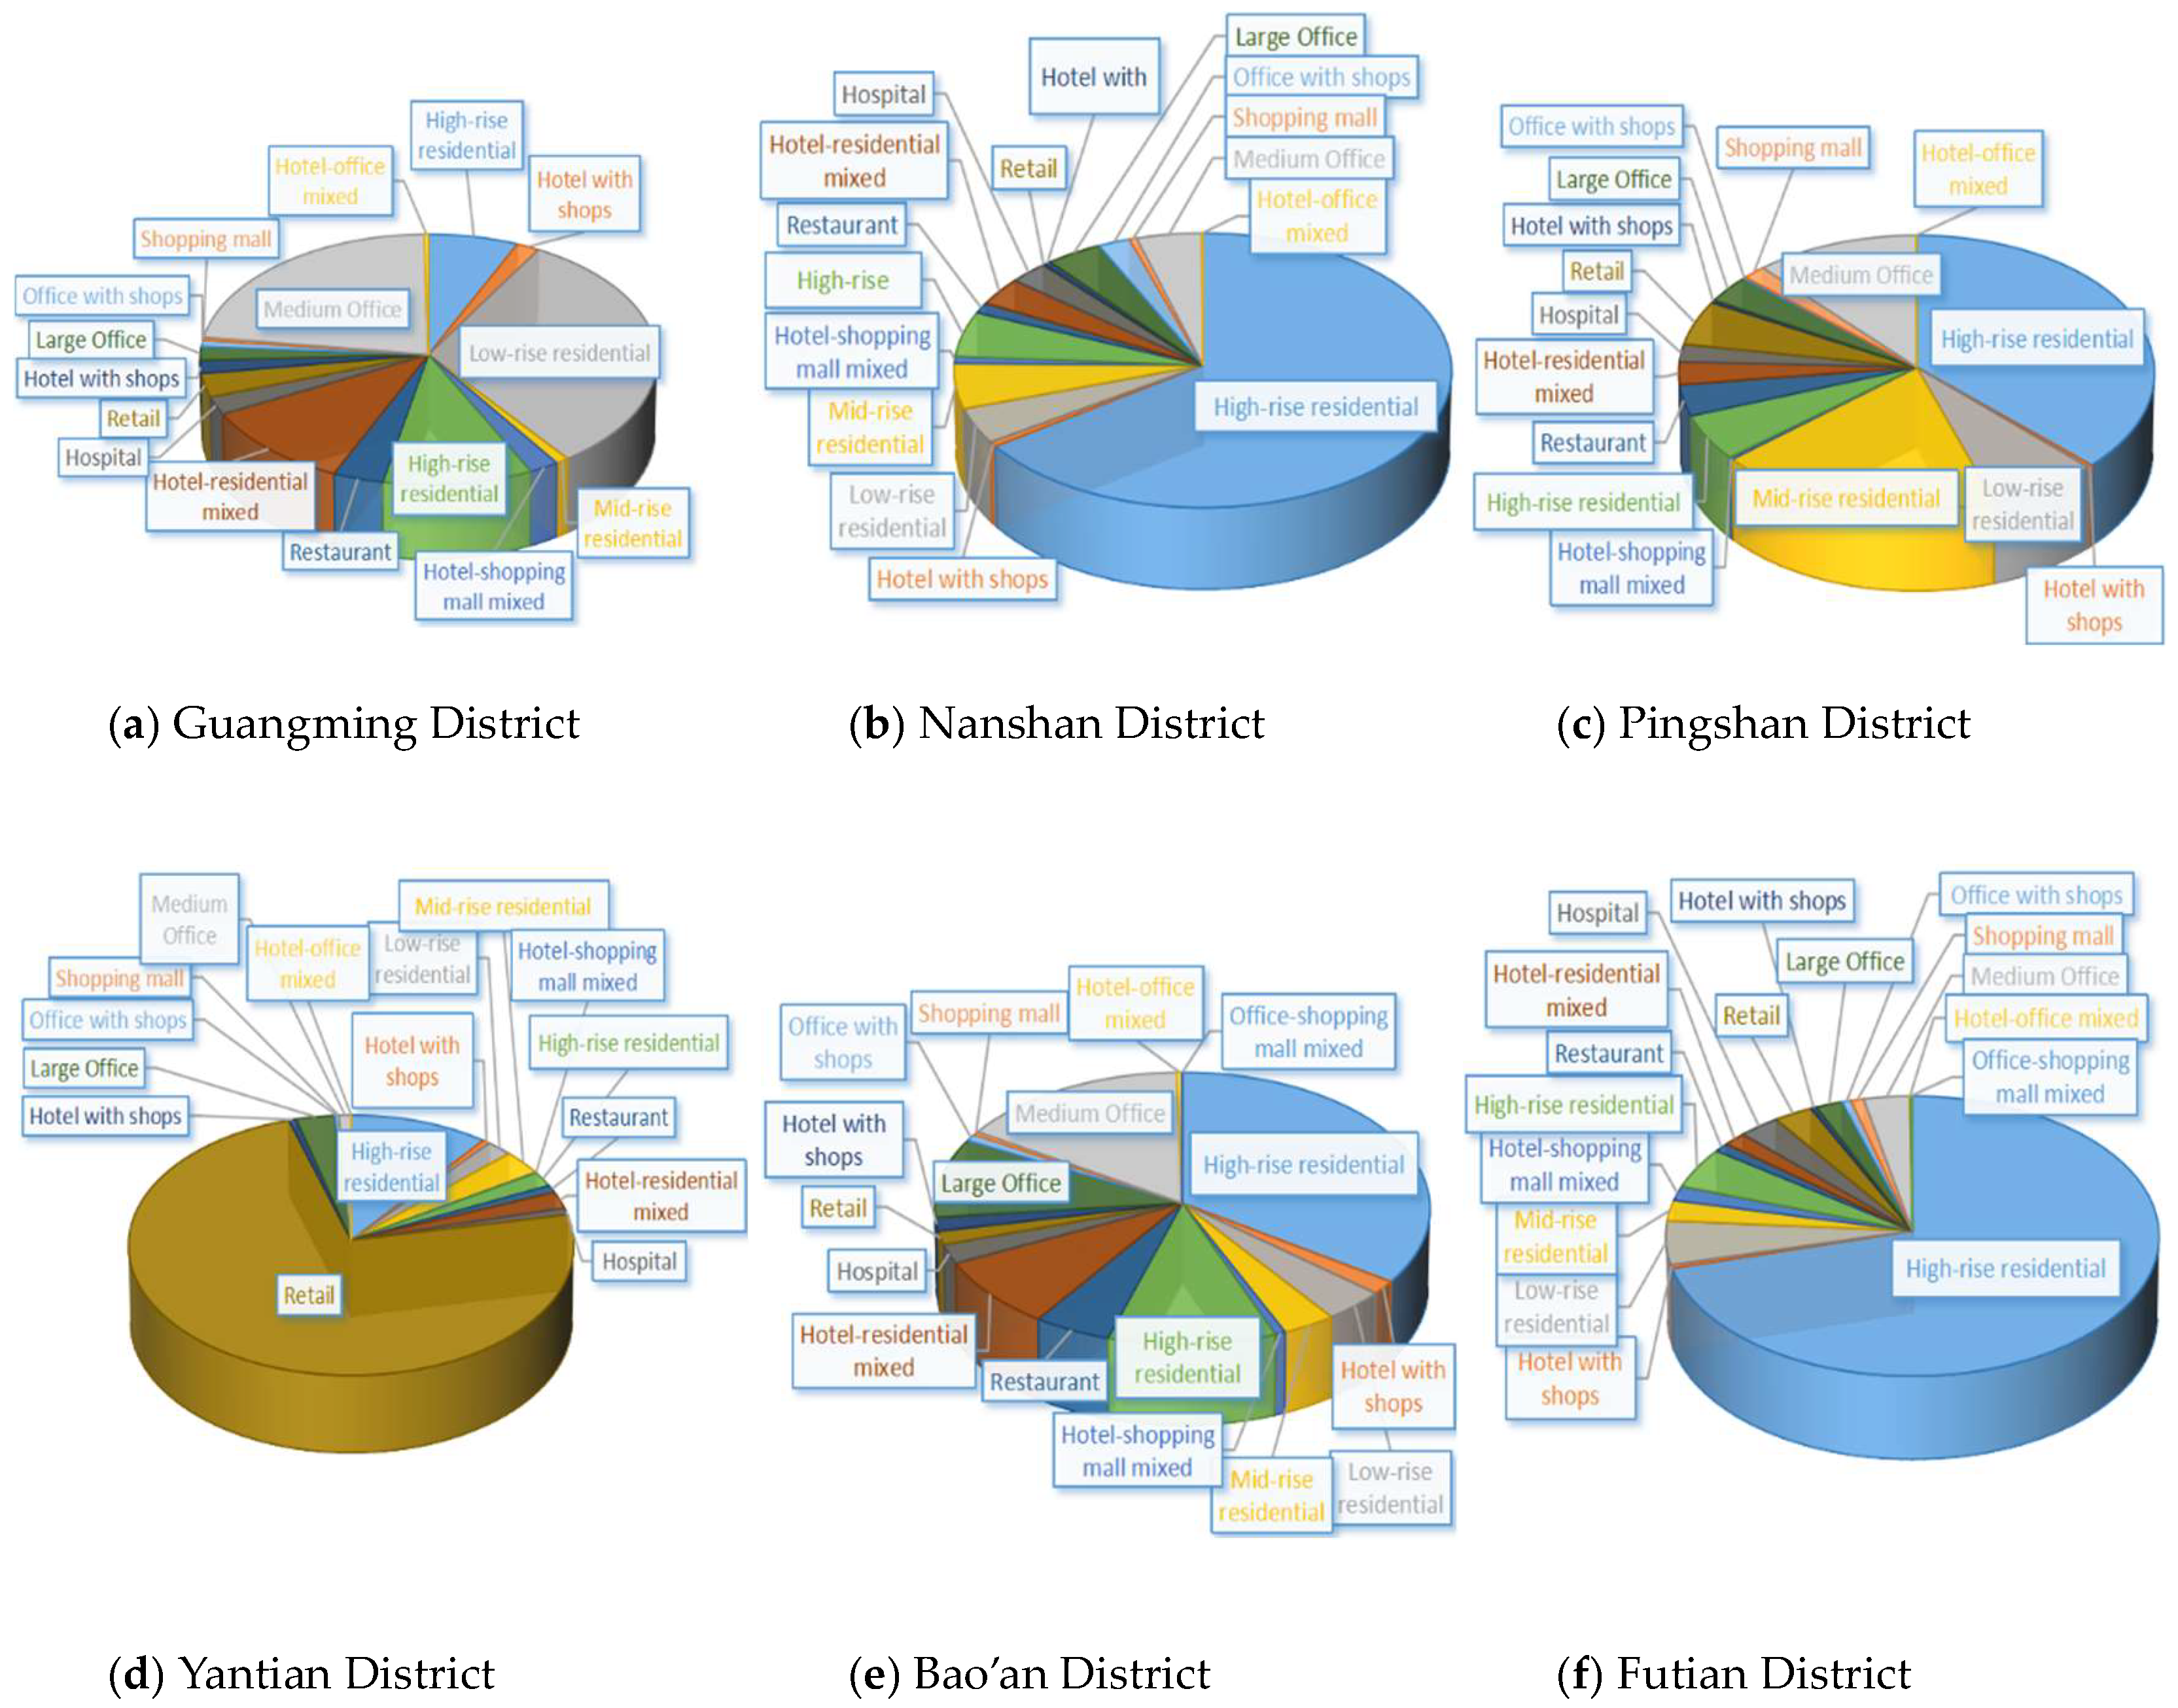
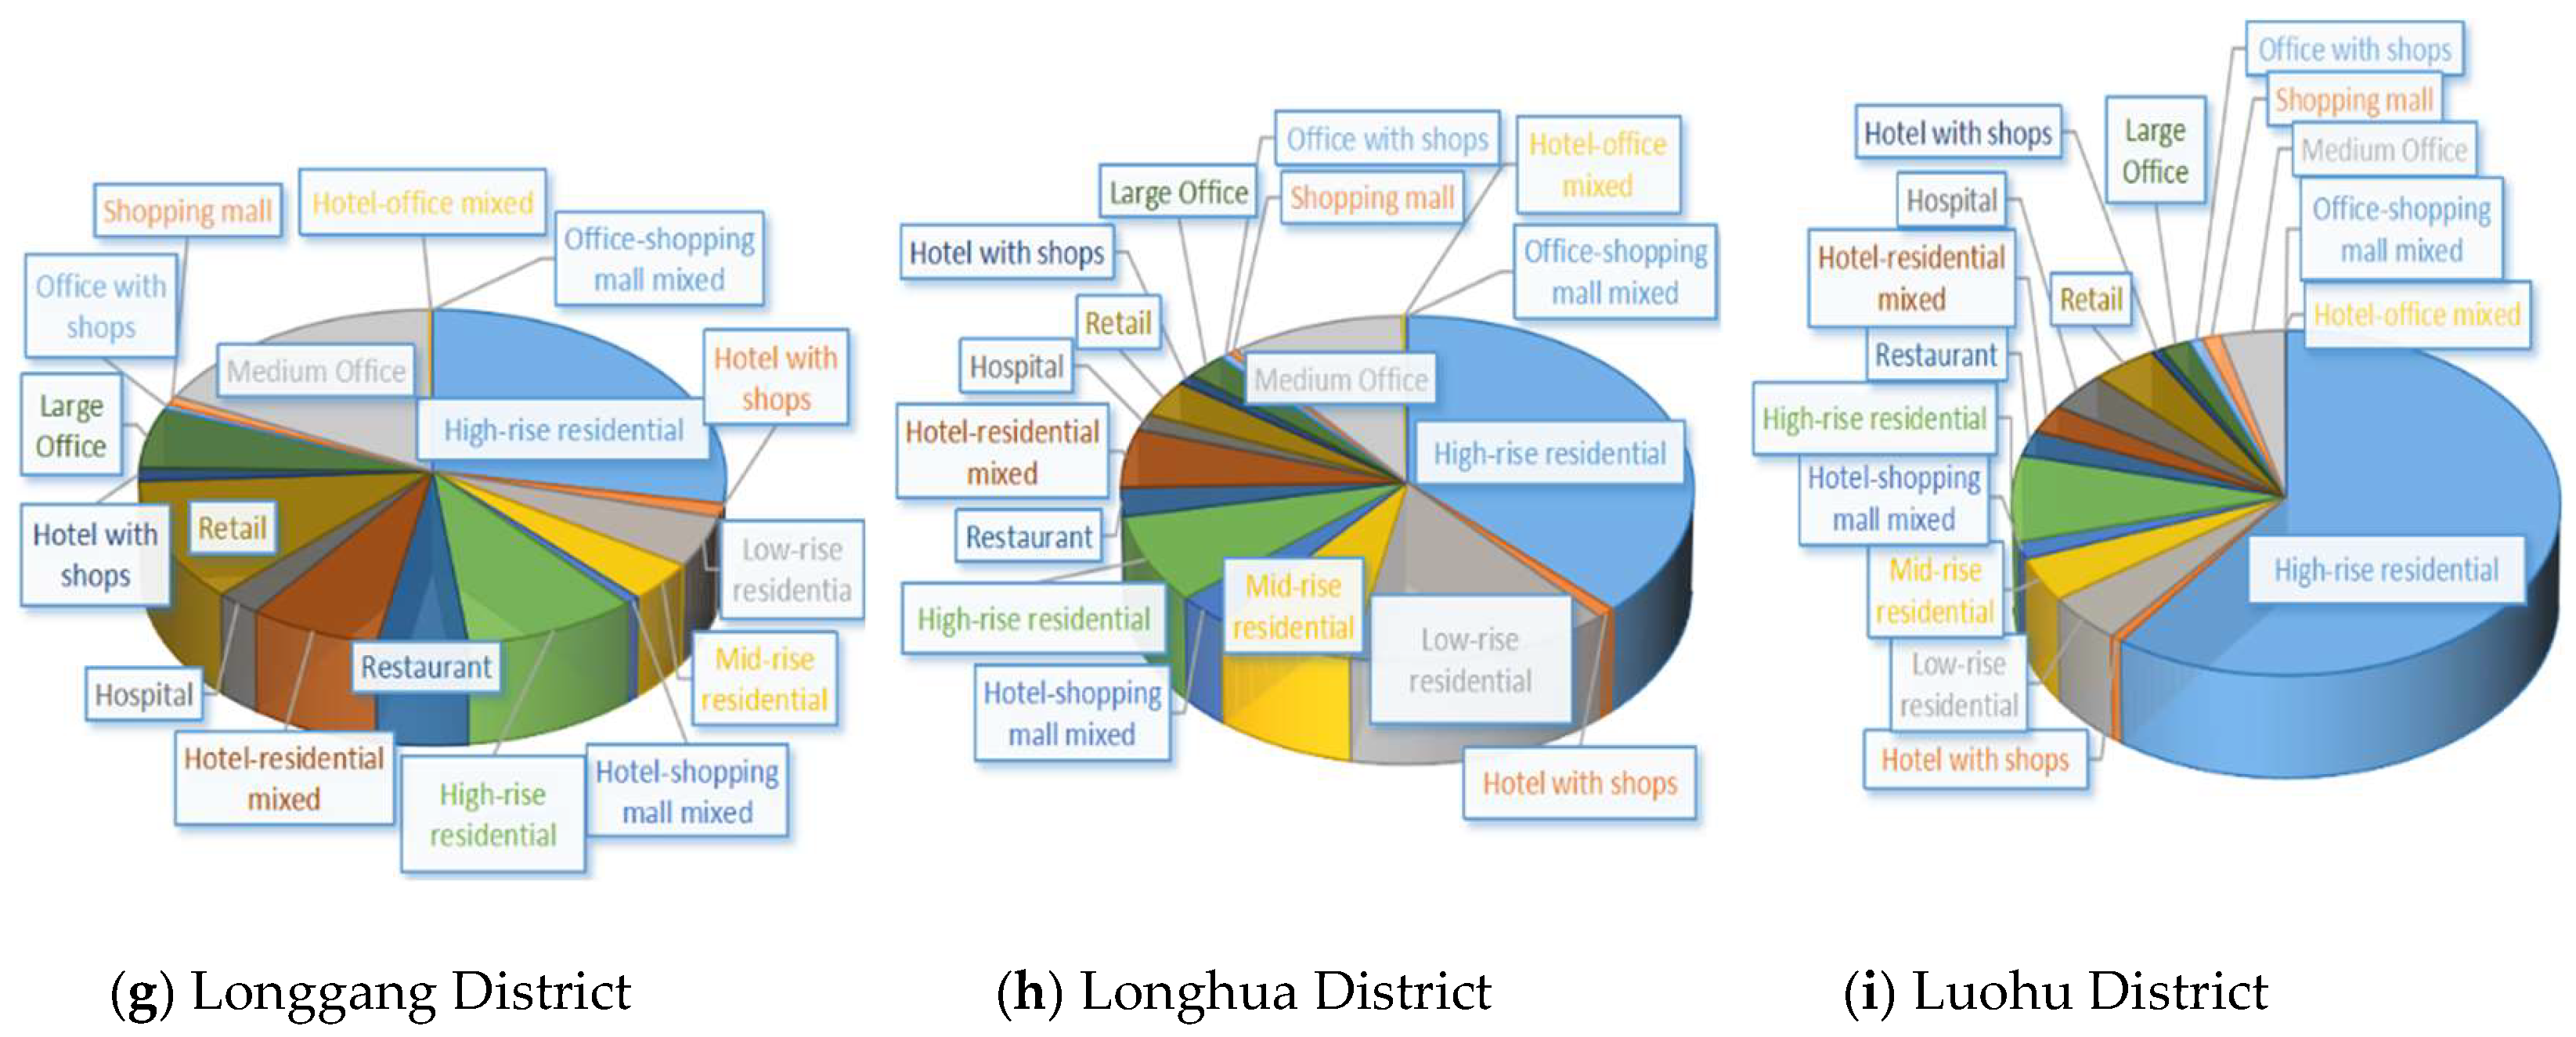
2.2.2. Building Cluster

The research object of this paper was a building cluster selected in Shenzhen. There were 228,539 buildings in this cluster, accounting for approximately 55% of the total number of buildings and 85.3% of the total floor area in Shenzhen. Shenzhen, a sub-provincial city in Guangdong Province, is located in the southeastern part of Guangdong, on the eastern shore of the Pearl River Estuary, and belongs to a climate zone with hot summers and warm winters. There are nine districts in this city: Guangming District, Nanshan District, Pingshan District, Bao’an District, Yantian District, Futian District, Luohu District, Longhua District, and Longgang District. The entire building cluster was divided according to the building type and construction year, and building types can also be classified into single-use buildings and mixed-use buildings based on their functions. In the previous studies, our team’s researchers proposed a method to determine building information for city-scale buildings by integrating point of interest and community boundary datasets, and the point-of-interest was based on the Geographic Information System (GIS). On the basis of their research, 18 kinds of prototype building models were obtained in this study, all of which included three construction years: pre-2005, 2006–2014, and 2015–2021 for commercial buildings; pre-2001, 2002–2009, and 2010–2021 for residential buildings. The models of the Shenzhen building cluster can be classified as these prototype models. The main room types and HVAC system forms used in these prototype building types are detailed in Table 4. The building envelope’s property settings and internal load parameters of all prototype building types had been shown in Table 1, Table 2 and Table 3, which were mainly divided into residential and commercial buildings for setting. Among them, the mixed-use building types included in commercial buildings were set separately according to the different functions of rooms.
Figure 4 and Figure 5 summarized the amounts and areas of all building types in the building cluster. It can be seen that high-rise residential accounted for the vast majority with the largest amount and area. From the amount distribution of prototype buildings, there were significantly more residential buildings than commercial buildings, with a number of 142,766 buildings, accounting for 64.97% of the total building stock. Moreover, this study also summarized all room types included in the case buildings in Table 5, as well as whether to HVAC control. Among them, the conference room, guest room, and apartment were equipped with independent HVAC systems, which cannot be centrally controlled. Therefore, the implementation of pre-cooling strategies for these rooms relied on people manually adjusting the temperature setpoint independently. In the simulation of the building cluster, this paper conducted a comparative study on the effects of pre-cooling strategies in different administrative districts of Shenzhen and thereby analyzed the DR potential of different regions. The area information of administrative districts was obtained from GIS data. Detailed area data of the research scope selected in different administrative districts are shown in Figure 6, and the proportion of each type of building in the nine administrative districts of Shenzhen is shown in Figure 7.

2.3. DR Control Strategies

This study mainly focused on the energy flexibility under pre-cooling, and the effect of pre-cooling essentially depends on the changing electricity price. When using the pre-cooling strategy simply, the effect was not very significant under the Chinese electricity price situation due to the small difference between peak and valley electricity prices. Considering the inability to adjust the electricity prices, the only solution was to increase the temperature difference to make the effect clearer. Therefore, a temperature reset was added in the study to increase the temperature when demand response occurred after pre-cooling without compromising human thermal comfort, thereby reducing the load during the peak power consumption period more.

2.3.1. Pre-Cooling

Pre-cooling, as a DR control technology for demand shifting that can reduce the pressure on the power grid during peak hours by shifting the cooling load to off-peak hours [23], had received increasing attention and research. In the exploration of Tian et al. [24], they conducted research on the energy cost-saving potential of pre-cooling and ceiling fans for DR during a critical peak pricing period and found that the optimal pre-cooling air temperature setpoint of the small building is 0.5 h before the critical peak pricing time and 2–3 °C lower than the design setpoint. In addition, Chen et al. [8] considered the pre-cooling temperature with a drop of 2 °C in their experiment. Based on the experience of previous research, this study set the pre-cooling temperature to be 2 °C lower than the initial design setpoint. Because this study used various types of large and small building models, it was necessary to consider different pre-cooling durations. Here, 0.5 h and 1 h were selected to simulate.

2.3.2. Temperature Reset

Temperature reset is a common DR strategy for demand shedding to directly reduce the electricity load of HVAC systems by adjusting the temperature setpoint of each thermal zone. This strategy is easy to operate, but sometimes the change in indoor air temperature may break thermal comfort. Therefore, the temperature reset was combined with pre-cooling to cool the indoor air before peak time. This can not only shift the peak load but also delay temperature rise. In most studies related to temperature reset, researchers increased the maximum temperature setpoint by 2 °C according to regulations and standards [1,5,25,26,27]. Therefore, the strategy used in this study also increased the temperature during DR time by 2 °C, which complies with ASHRAE guidelines.

2.3.3. Rule-Based Strategies

There are two related concepts regarding rule-based strategies: pre-defined temperature setpoint and HVAC operation schedule, which are modified to become pre-cooling strategies [28]. These strategies may not be optimal, so in some cases they may not reduce the total load or peak load. However, by simulating multiple schemes and comparing the results, it can be known how to implement pre-cooling more effectively. Then, by combining the optimal pre-cooling strategy with ToU electricity prices, the goal of shifting peak load and saving total costs can ultimately be achieved.

2.4. Building Simulation Tool

2.4.1. Urban Building Energy Modeling (UBEM)

Building energy modeling is of great significance in exploring energy conservation and emission reduction potential. In previous studies, many researchers had conducted studies on collecting building information for UBEM, as well as energy-saving renovation modeling [29]. This study used a UBEM tool, AutoBPS, which was developed by Deng et al. [16]. AutoBPS can automatically establish building energy models for calculating urban building energy demand and analyzing energy retrofit and rooftop photovoltaic potential. EnergyPlus contained a demand-limiting control module that enables some DR functions, such as temperature reset and control of equipment including HVAC systems and lighting.
Since AutoBPS already included default settings for basic building information, it was only necessary to input the building type and construction year to generate the building energy consumption model. In previous studies, researchers improved AutoBPS based on the Ruby programming language, developing AutoBPS-DR to generate input data files (IDF) with DR files used in EnergyPlus. Then, the demand-limiting control module in EnergyPlus was used to implement the required DR functions, thereby establishing the DR models automatically. However, EnergyPlus did not come with a pre-cooling module, so it was necessary to control the temperature and schedule of the thermostat to achieve pre-cooling. Based on the work, this study enhanced AutoBPS-DR by adding pre-cooling code to modify the temperature and schedule of the HVAC system thermostat, which can achieve the automated rapid modeling of buildings with pre-cooling strategies. The process of creating EnergyPlus IDF with pre-cooling strategies by AutoBPS-DR (an internal tool module of AutoBPS) is shown in Figure 8.

2.4.2. Energy Consumption Calculation

The process of calculating building energy consumption and total electricity cost is shown in Figure 9. Firstly, EnergyPlus was used to simulate the building energy consumption of all prototype models with DR strategies generated by AutoBPS-DR. EnergyPlus [30] is a building energy consumption simulation program developed by the U.S. Department of Energy (DOE) and Lawrence Berkeley National Laboratory (LBNL), and it uses the heat balance method as the core of load calculation. This program can dynamically simulate the hourly energy consumption of thermal zones by solving the balance between the indoor loads (from building envelope heat transfer, occupants, equipment, and lighting) and the required heating/cooling capacity for different forms of HVAC systems. Then, based on the performance curves of the chiller, water pump, and cooling tower, the electricity consumption under partial load can be calculated. By combining building area information, the electricity consumption per unit area of each prototype building can be further determined. After that, the GIS information of the building cluster in Shenzhen was used to calculate the total area of each building type. By multiplying the unit electricity consumption with the total area and summing up all values, the overall energy consumption of the building cluster was obtained. Finally, based on ToU electricity price and hourly electricity consumption, the total electricity cost can be worked out.

2.5. Simulation Scenarios

2.5.1. Baseline Model

According to the work schedule, the HVAC system of the medium office building operated from 6:00 to 17:00, and the desired indoor air temperature setpoint during this time in summer was 24 °C. As for the shopping mall, the work time of the HVAC system was from 5:00 to 20:00 with a temperature of 24 °C. In addition, some other types of buildings in the Shenzhen building cluster had different temperature settings for rooms with different functions. The specific temperature setpoint of each room can be seen in Figure 10.

2.5.2. Pre-Cooling Model

From the ToU electricity price in Shenzhen, it can be seen that the price during the off-peak period from 8 to 10 o’clock in a day was 0.75 CNY/kWh, while the peak period and sharp period from 10:00 to 12:00 was 1.26 CNY/kWh and 1.57 CNY/kWh. The difference between off-peak price and sharp price was more than twice, so pre-cooling could perform more effectively. Therefore, 10:00 to 12:00 of the day was chosen as the DR period, and pre-cooling was implemented during the off-peak period in the preceding hours. Through simulation, it was found that the effect of simple pre-cooling was ineffective. Therefore, a temperature reset was added to assist with pre-cooling, that is, to increase the temperature setpoint during the DR time after pre-cooling.
This paper firstly developed three pre-cooling strategies on the two types of individual buildings for detailed research, including only pre-cooling for 0.5 h and 1 h, respectively, and pre-cooling combined with a temperature reset. As stated in Section 2.3, for the adjustment of pre-cooling temperature in some other related studies, it was generally set to decrease by 2 °C. And relevant studies have shown that the cooling temperature setting can be increased by at least 2 °C without significantly affecting the comfort of residents [31]. From this, the temperature setpoints for pre-cooling and temperature reset of the strategies were defined as shown in Figure 11. Based on the simulation results of individual buildings, the most effective strategy was obtained and implemented in the entire Shenzhen building cluster.
The detailed temperature setpoint schedule for DR strategies used in different types of rooms was mainly divided into three kinds, as shown in Figure 10. Among them, the common room included a banquet hall, dining hall, laundry, lobby, café and exercise room. And PC-22 °C-0.5 h + TR-26 °C referred to a pre-cooling temperature of 22 °C for 0.5 h combined with a reset temperature of 26 °C during the DR period. The same went for other strategies.

2.6. Evaluation Metrics

Three general properties of energy flexibility had been observed in previous studies [32,33,34]: (1) time period during which energy and electricity can be shifted or reduced; (2) amount of energy and electricity that can be shifted or reduced; (3) related impacts of efficiency or cost generated by this flexible operation. Moreover, Li et al. [35] summarized the top five popular metrics found in their reviewed articles. This study selected several metrics from it as references for energy flexibility assessment.

2.6.1. Peak Power Reduction and Percentage

Peak power reduction refers to the reduced power demand during peak hours due to flexible operation. Peak power reduction percentage refers to the percentage of reduced power demand during peak hour due to flexible operation. The formulas are as follows:
P = P p e a k   r e f P p e a k   f l e x i b l e
P % = 1 P p e a k   f l e x i b l e P p e a k   r e f

2.6.2. Cost Saving

The ultimate goal of DR is to reduce costs. Based on the detailed ToU electricity price, the final cost savings can be calculated through Equation (3).
C o s t   s a v i n g = P r e c o o l i n g   s t a r t s D R   e n d s ( E l e c t r i c i t y   d i f f e r e n c e   w i t h   b a s e l i n e · T o U   p r i c e ) d t

2.6.3. Flexibility Index (FI)

FI refers to the proportion of saved cost from a flexible strategy compared with baseline operation. It can be calculated by Equation (4).
F I = 1 C o s t   o f   f l e x i b l e   o p e r a t i o n C o s t   o f   b a s e l i n e   o p e r a t i o n

3. Results

This section presented and compared the simulation results of setting the several pre-cooling strategies for different types of selected individual buildings under the Shenzhen peak-valley electricity price in order to explore the effect of pre-cooling and compare to find an optimal pre-cooling setting. And simulation results were obtained for the Shenzhen building cluster applying the optimal pre-cooling strategy, based on which the DR potential of pre-cooling on the overall building cluster and its impact on energy flexibility were explored.

3.1. Results of Individual Buildings

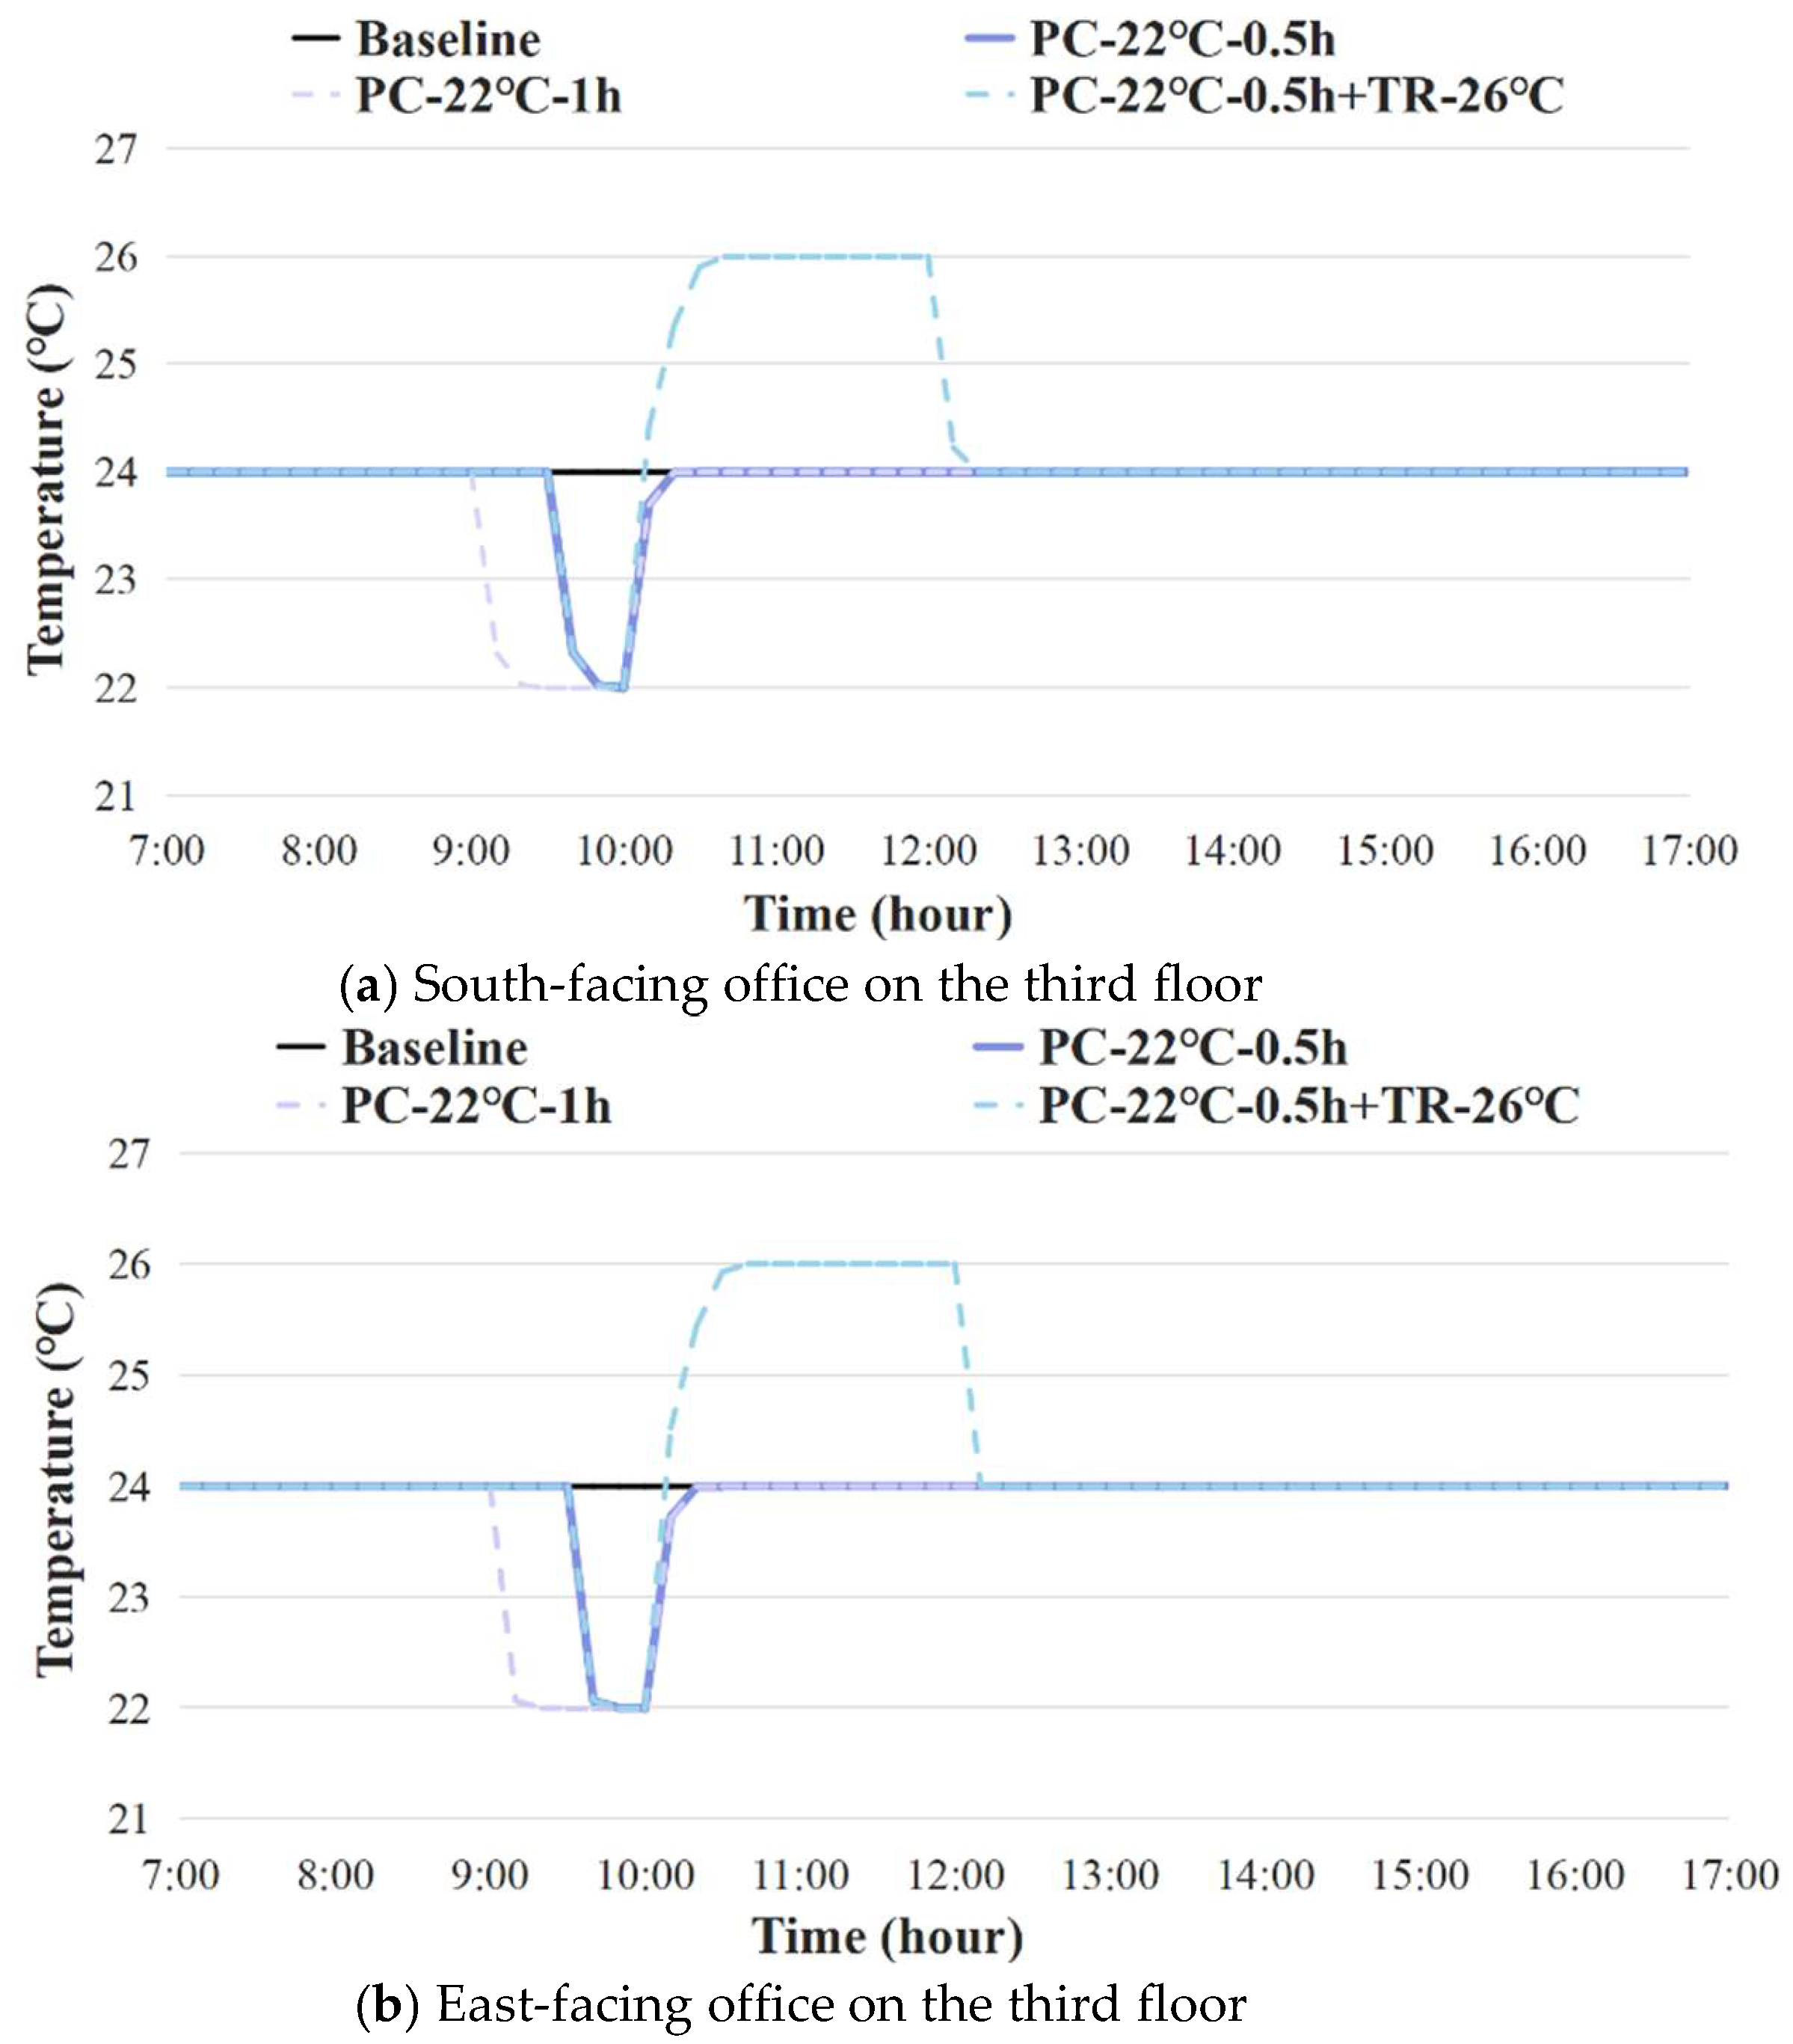
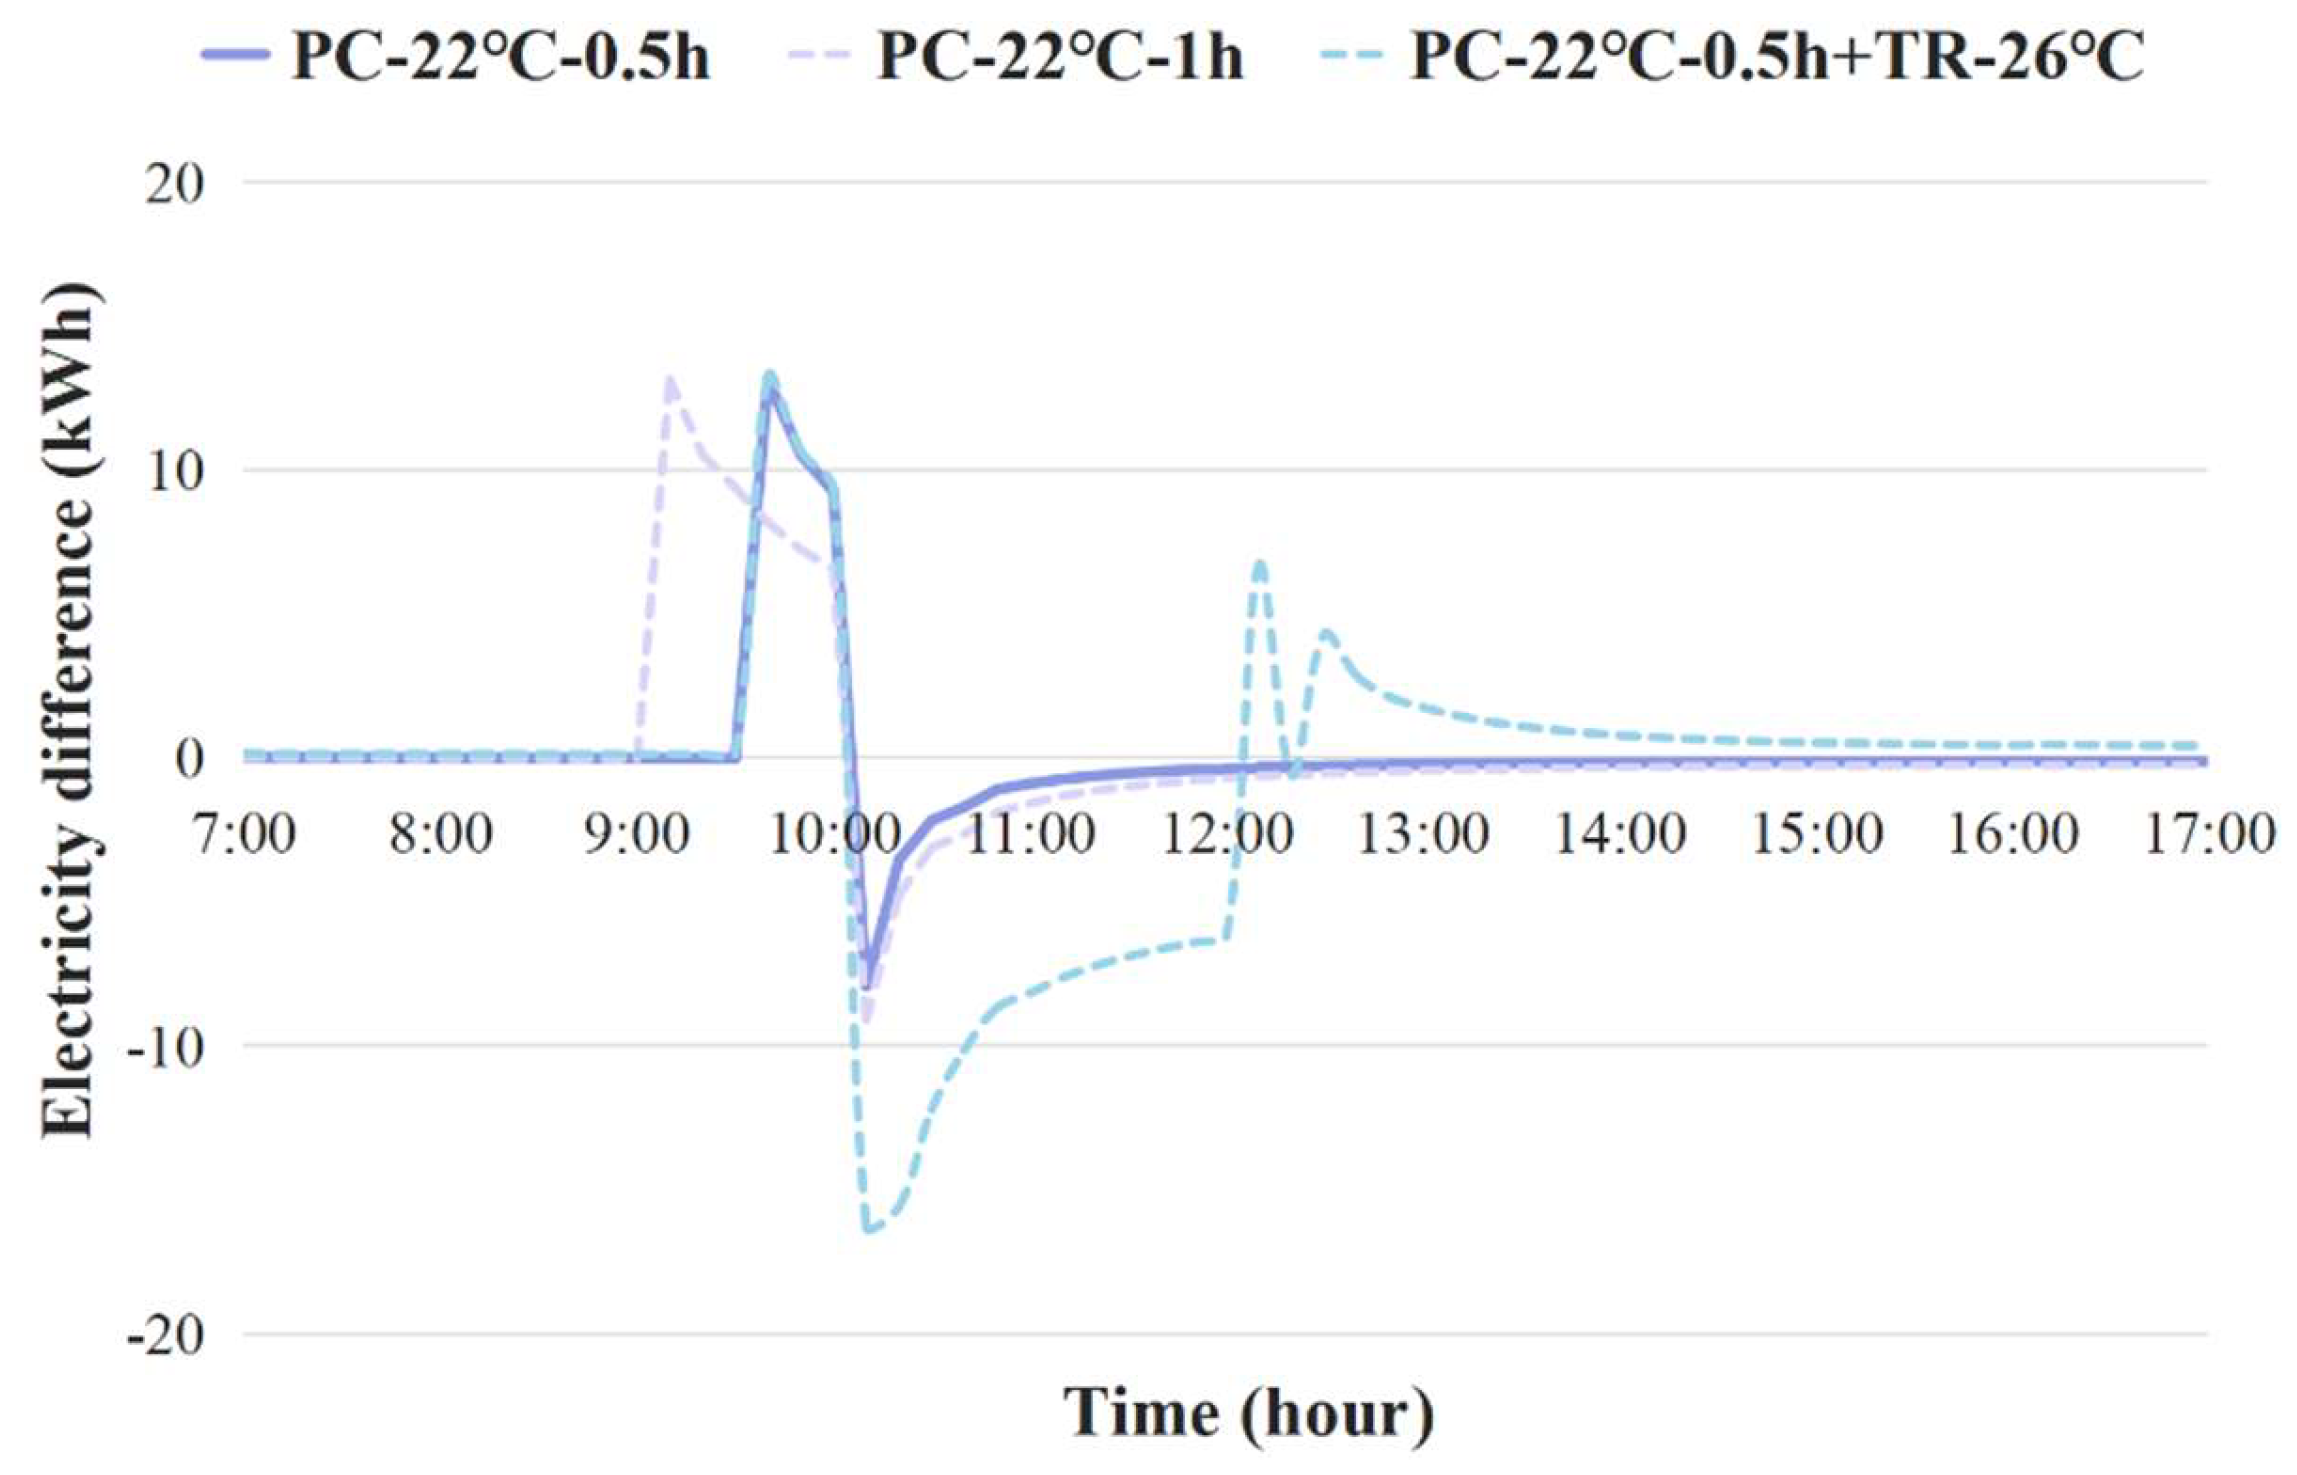
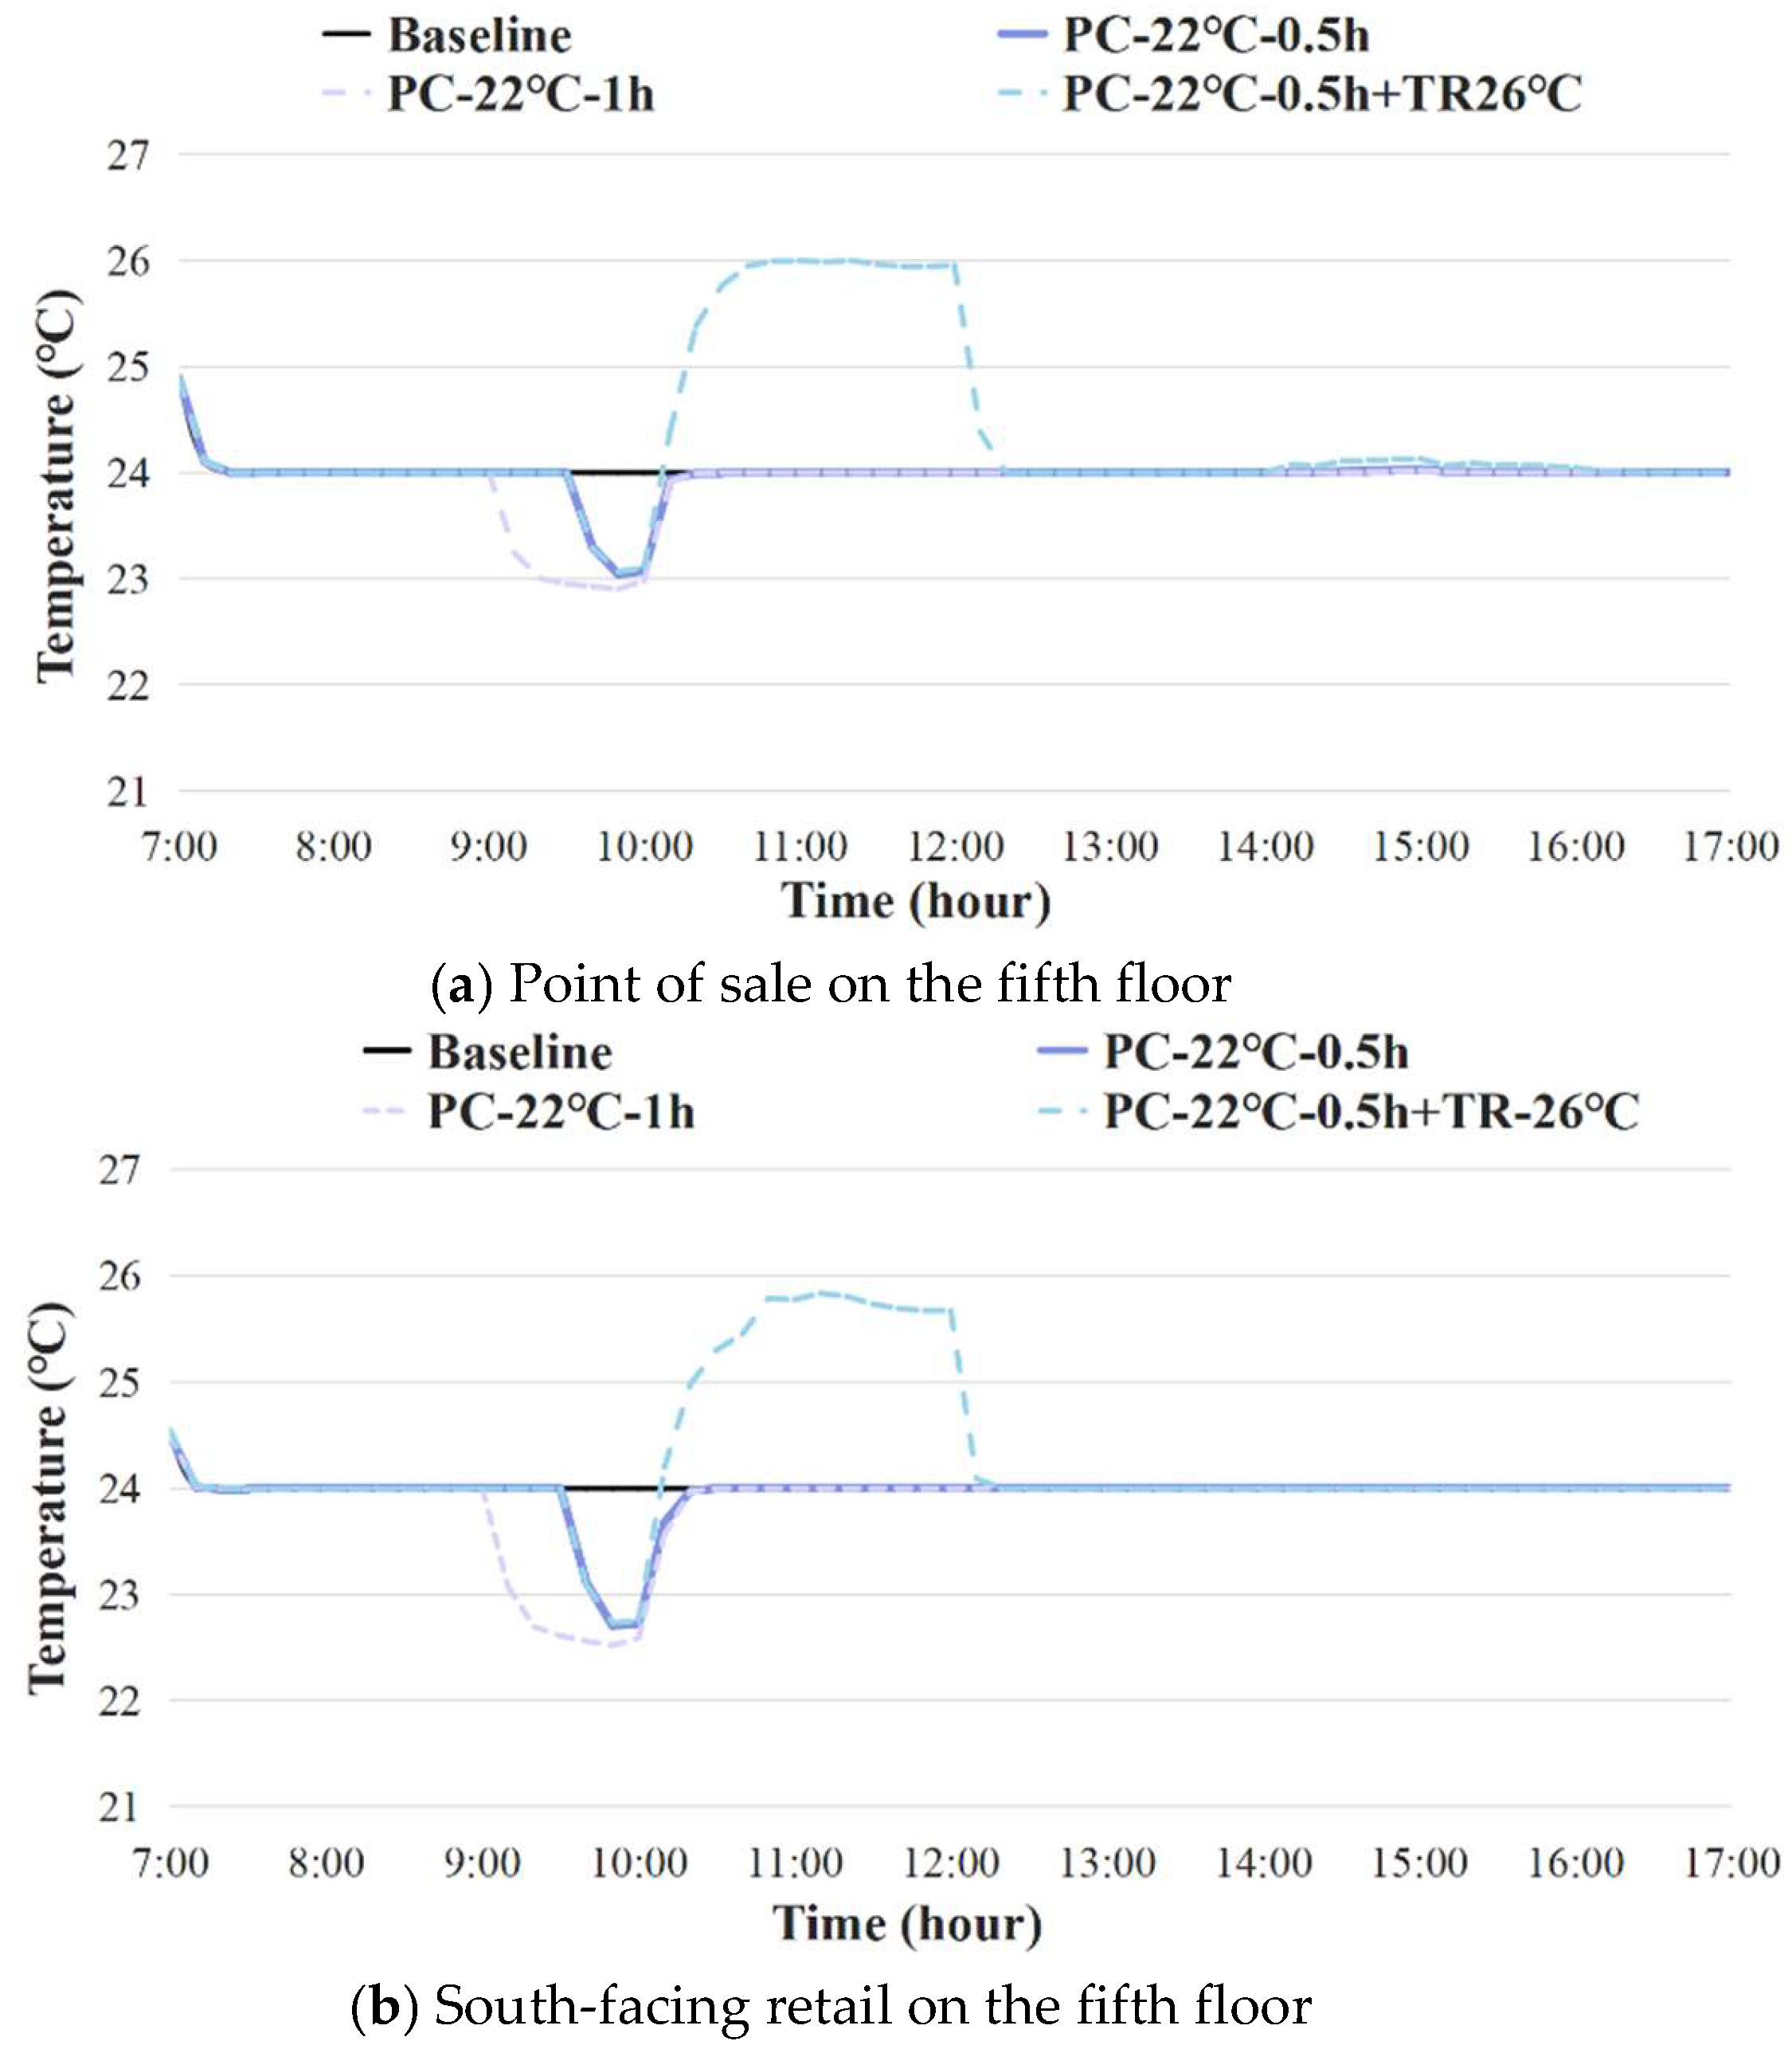
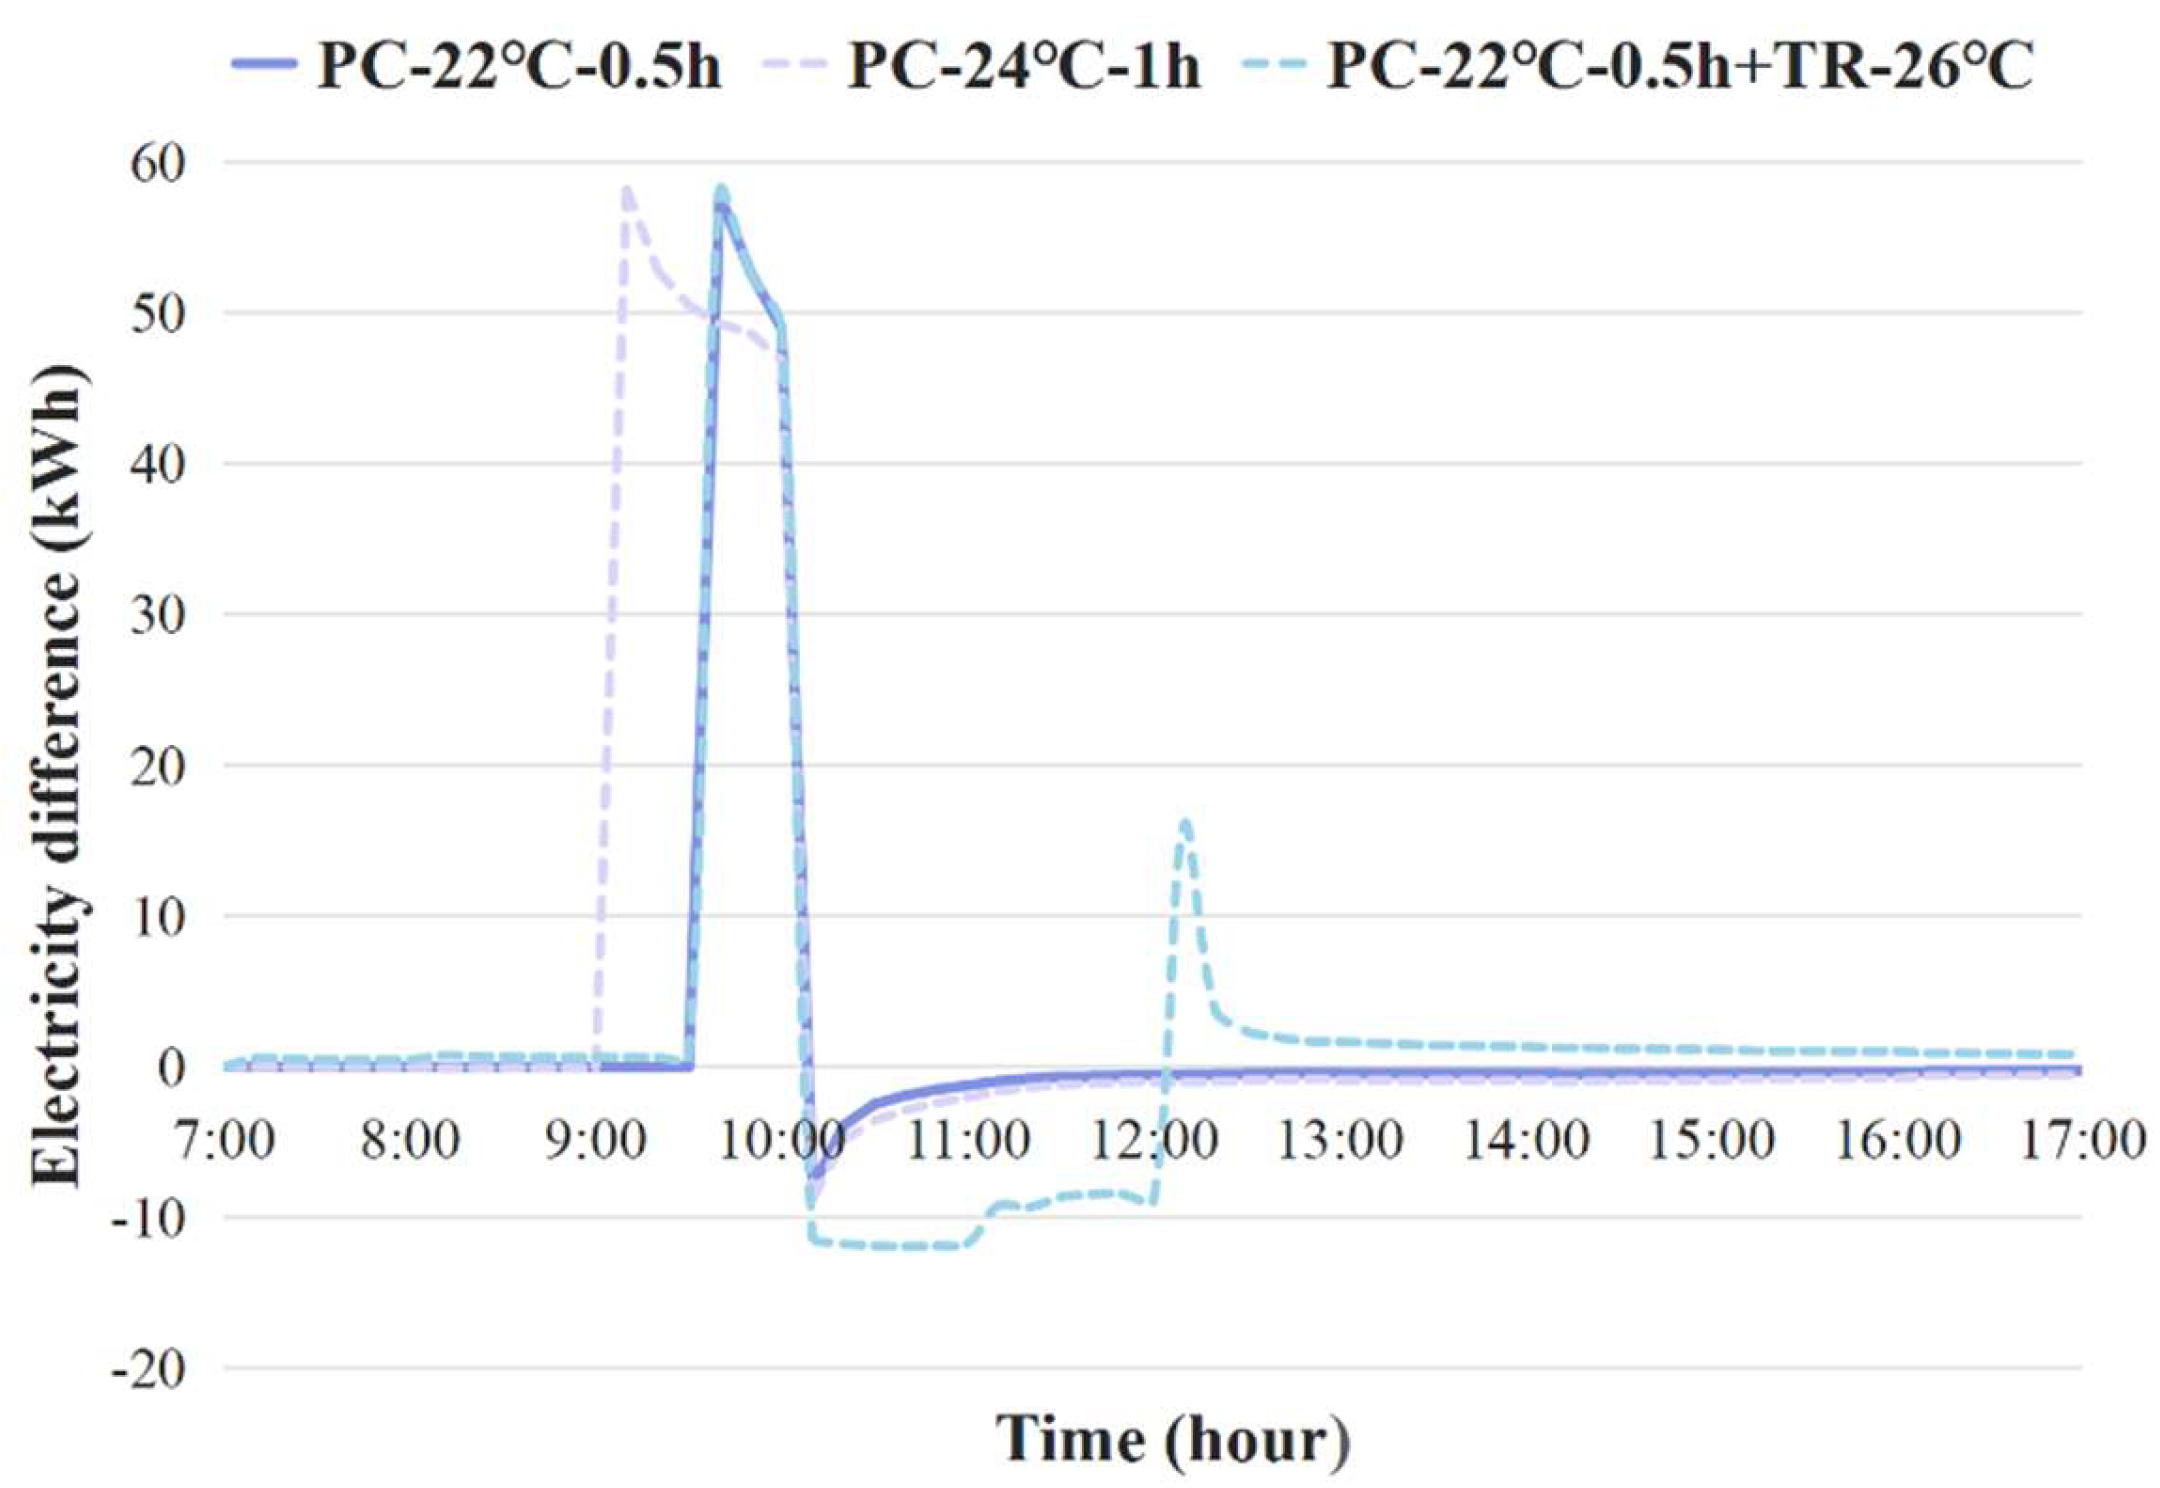
3.1.1. Detailed Results of Two Individual Buildings

According to the hourly temperature results of the medium office building in Figure 12, there was not much difference in temperature changes between rooms in different locations, indicating that the direction of the rooms had little impact on the effect of pre-cooling strategies for this type of building. Moreover, pre-cooling for only 0.5 h on a medium office building can bring the indoor temperature to the pre-cooling setpoint, and compared with 1 h of pre-cooling, there was no difference in their impact on temperature changes during the subsequent DR period. From the hourly electricity consumption difference with the baseline strategy in Figure 13, it can also be seen that 1 h of pre-cooling did not better reduce the load during the DR period but increased electricity consumption for longer pre-cooling, resulting in unnecessary energy waste.
According to the hourly temperature results of the shopping mall in Figure 14, the impact of pre-cooling strategies implementation on indoor temperature varied across different zones. With a temperature setpoint of 22 °C, it can be seen in Figure 14a that the point of sale can only approach 23 °C at the end of pre-cooling, while the south-facing retail in Figure 14b can lower it more but ultimately tends to 22.5 °C and cannot reach 22 °C. It was mainly because the shopping mall had a large building area, and the main indoor loads came from a large number of people, lighting, equipment, and other heat sources. When the temperature setpoint decreased, the HVAC system needed to overcome these continuous heat loads, which made it hard to lower the indoor temperature to pre-cooling temperature. The same as the medium office building, it can be seen from the hourly electricity consumption difference with the baseline in Figure 15 that 1 h of pre-cooling did not have a more significant effect compared to 0.5 h of pre-cooling for the shopping mall but caused energy waste.
Table 6 presents the changes in electricity cost and peak electricity consumption for two types of buildings under these three flexible strategies. It verified that simple pre-cooling cannot achieve good results and ultimately increased electricity costs. However, increasing the pre-cooling duration can slightly improve the reduction in peak load, but at the same time increase energy consumption, resulting in a significant increase in electricity costs. Comparing the results of the two types of buildings, the DR effect of the medium office building was better, which may be due to the smaller area, so it was more controllable for the indoor environment, resulting in higher efficiency of the HVAC system.
Due to the temperature reset during the DR period causing an increase in temperature, electricity consumption increased for a period of time after DR time. However, the electricity price was in an off-peak period at this time, so it was not considered.
The simulation results of the pre-cooling strategies for these two individual buildings showed that setting the pre-cooling temperature to decrease by 2 °C half an hour in advance and resetting the temperature to increase by 2 °C during the DR period was a relatively optimal solution. Thus, the strategy was applied to all types of buildings, and a comprehensive analysis was conducted.

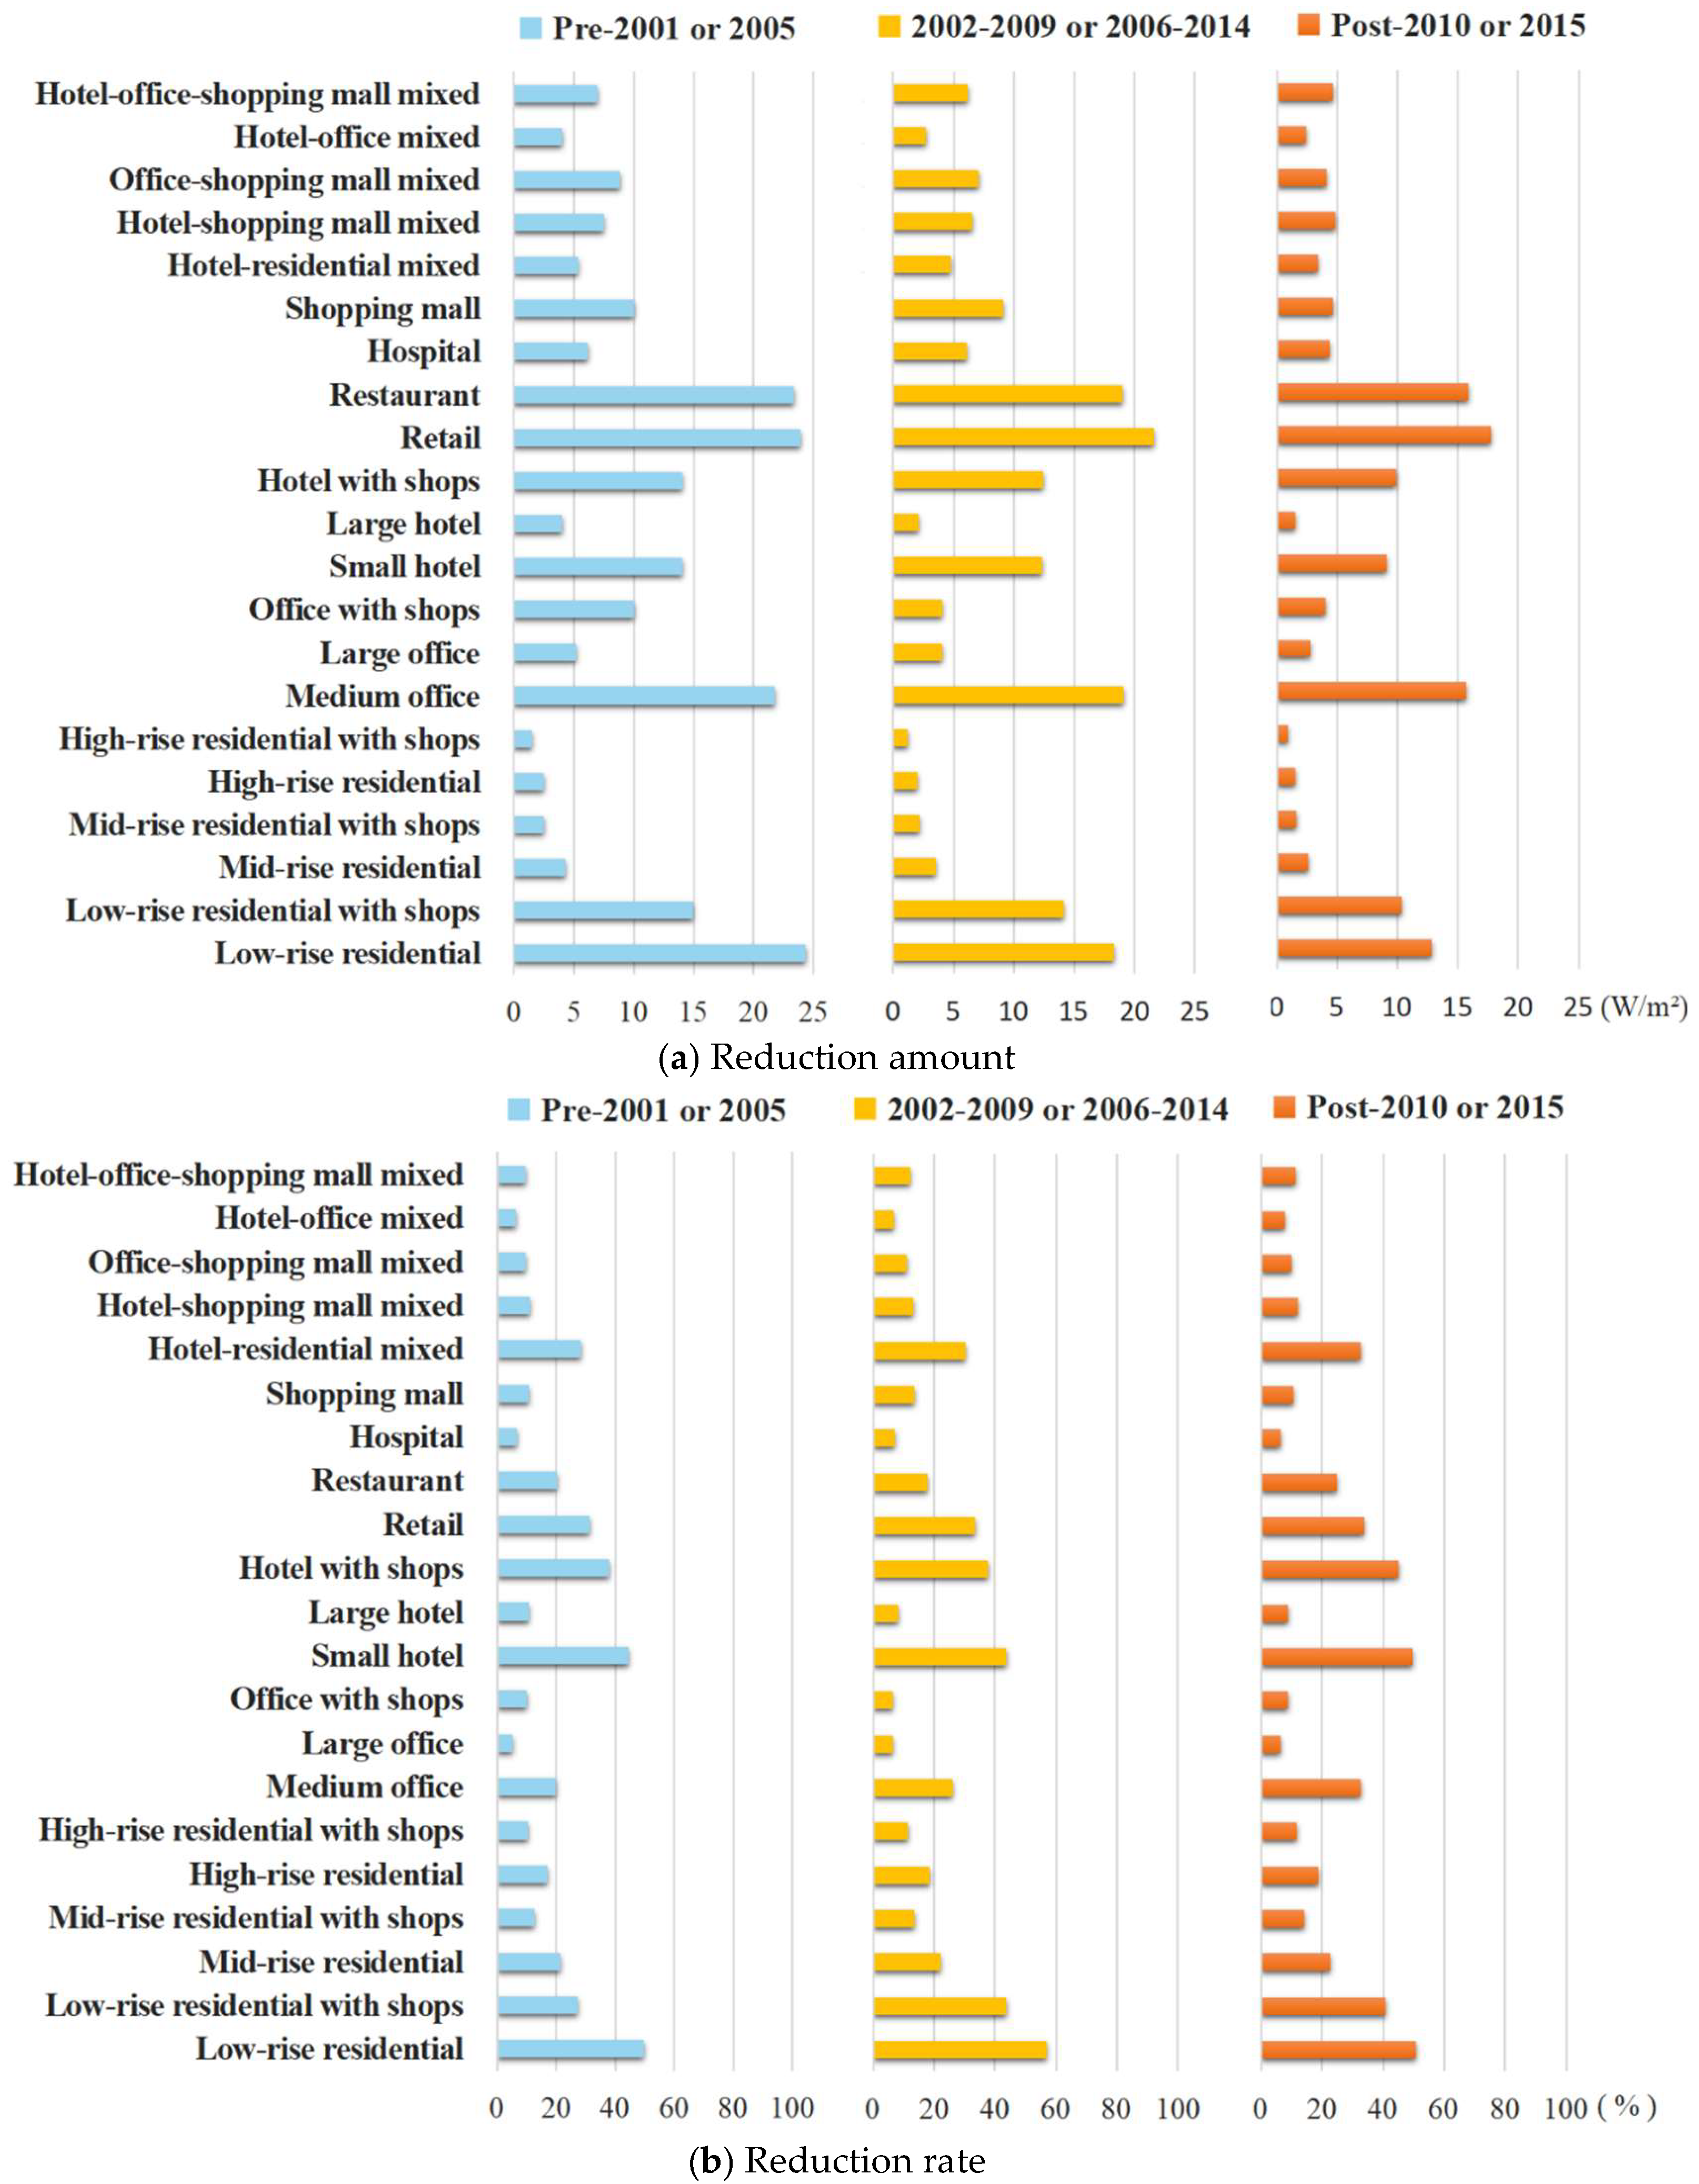
3.1.2. Power Reduction Effect of All Prototype Buildings

Figure 16 reflects the effects of electricity power reduction during the DR time of each prototype building under the better pre-cooling strategy obtained in Section 3.1.1. Among them, Figure 16a presents the results of average electricity power reduction per unit area; it can be seen that the overall power reduction effect of retail was the best. The reductions for the three construction eras were 23.89 W/m2 of pre-2005, 21.61 W/m2 of 2006–2014 and 17.73 W/m2 of post-2015 respectively. And the results of high-rise residential with shops, high-rise residential, and mid-rise residential with shops are poor, which was because most rooms in residential buildings were equipped with independent air conditioning inside, and residents had poor autonomy in responding to electricity demand. During DR time, they may not adjust the temperature upward, which could affect thermal comfort.
Figure 16b presents the results of the power reduction rate during the peak electricity consumption period. It can be seen that hotel with shops, small hotel, and low-rise residential had better effects with the largest reduction percentage of 56.82%. This was due to the small construction area of these buildings, so the indoor temperature can be better controlled, and the lower floors made these buildings less affected by sunlight and external temperature rise. On the contrary, large buildings such as large office building and hospital had obviously poor effects with the minimum percentage of 5.06%.

3.2. DR Potential of Pre-Cooling on Shenzhen Building Cluster

3.2.1. Electricity Demand Difference of Building Cluster

The electricity demand difference with baseline of the Shenzhen building cluster under the optimal pre-cooling strategy on the selected simulation day is shown in Figure 17. Pre-cooling started at 9:30, and the temperature setpoint was lowered, so the electricity load began to increase. At 9:40, the electricity difference reached the maximum of 4750.94 MW and then gradually declined. The reduction in electricity power occurred at the beginning of the DR event, and after 10 min, the demand reduction reached a maximum of 4199.98 MW at 10:10 and then decreased slowly. After the DR event ended, due to the temperature in the room being 2 °C higher than normal at this time, the HVAC systems had returned to the normal settings, resulting in an increase in electricity consumption compared to the baseline. However, the increased energy consumption after DR was not considered in this study.

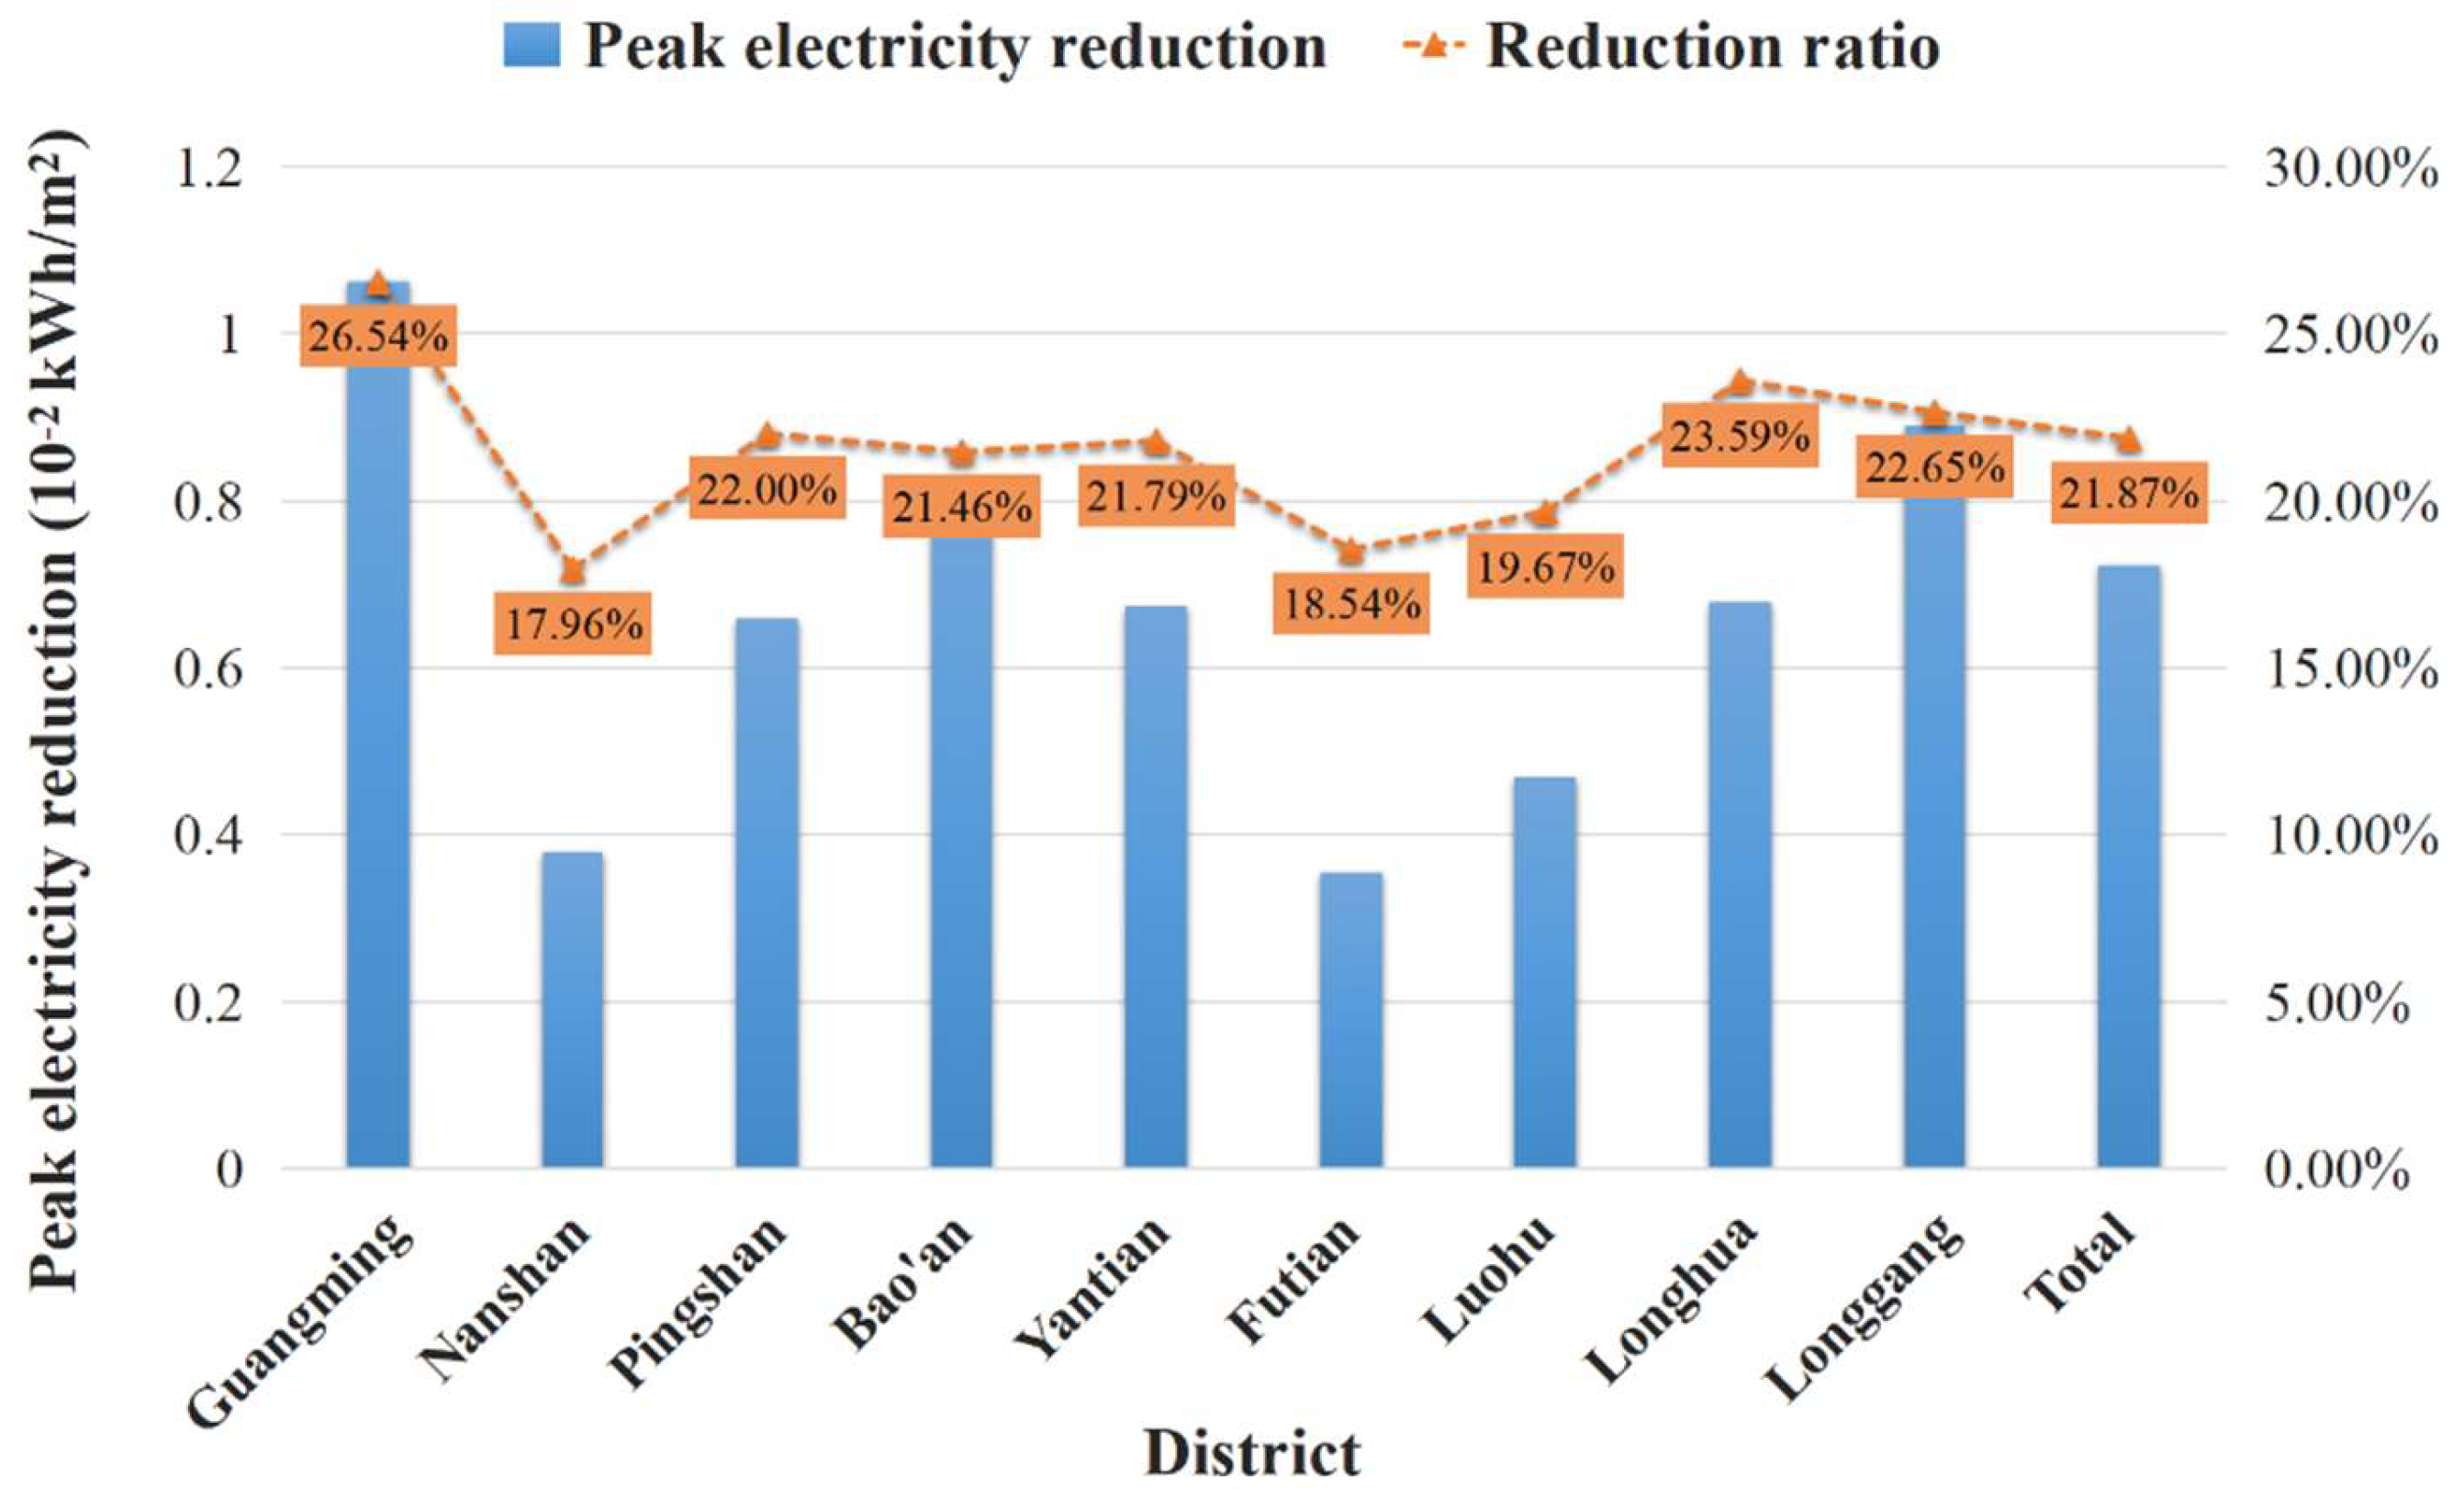
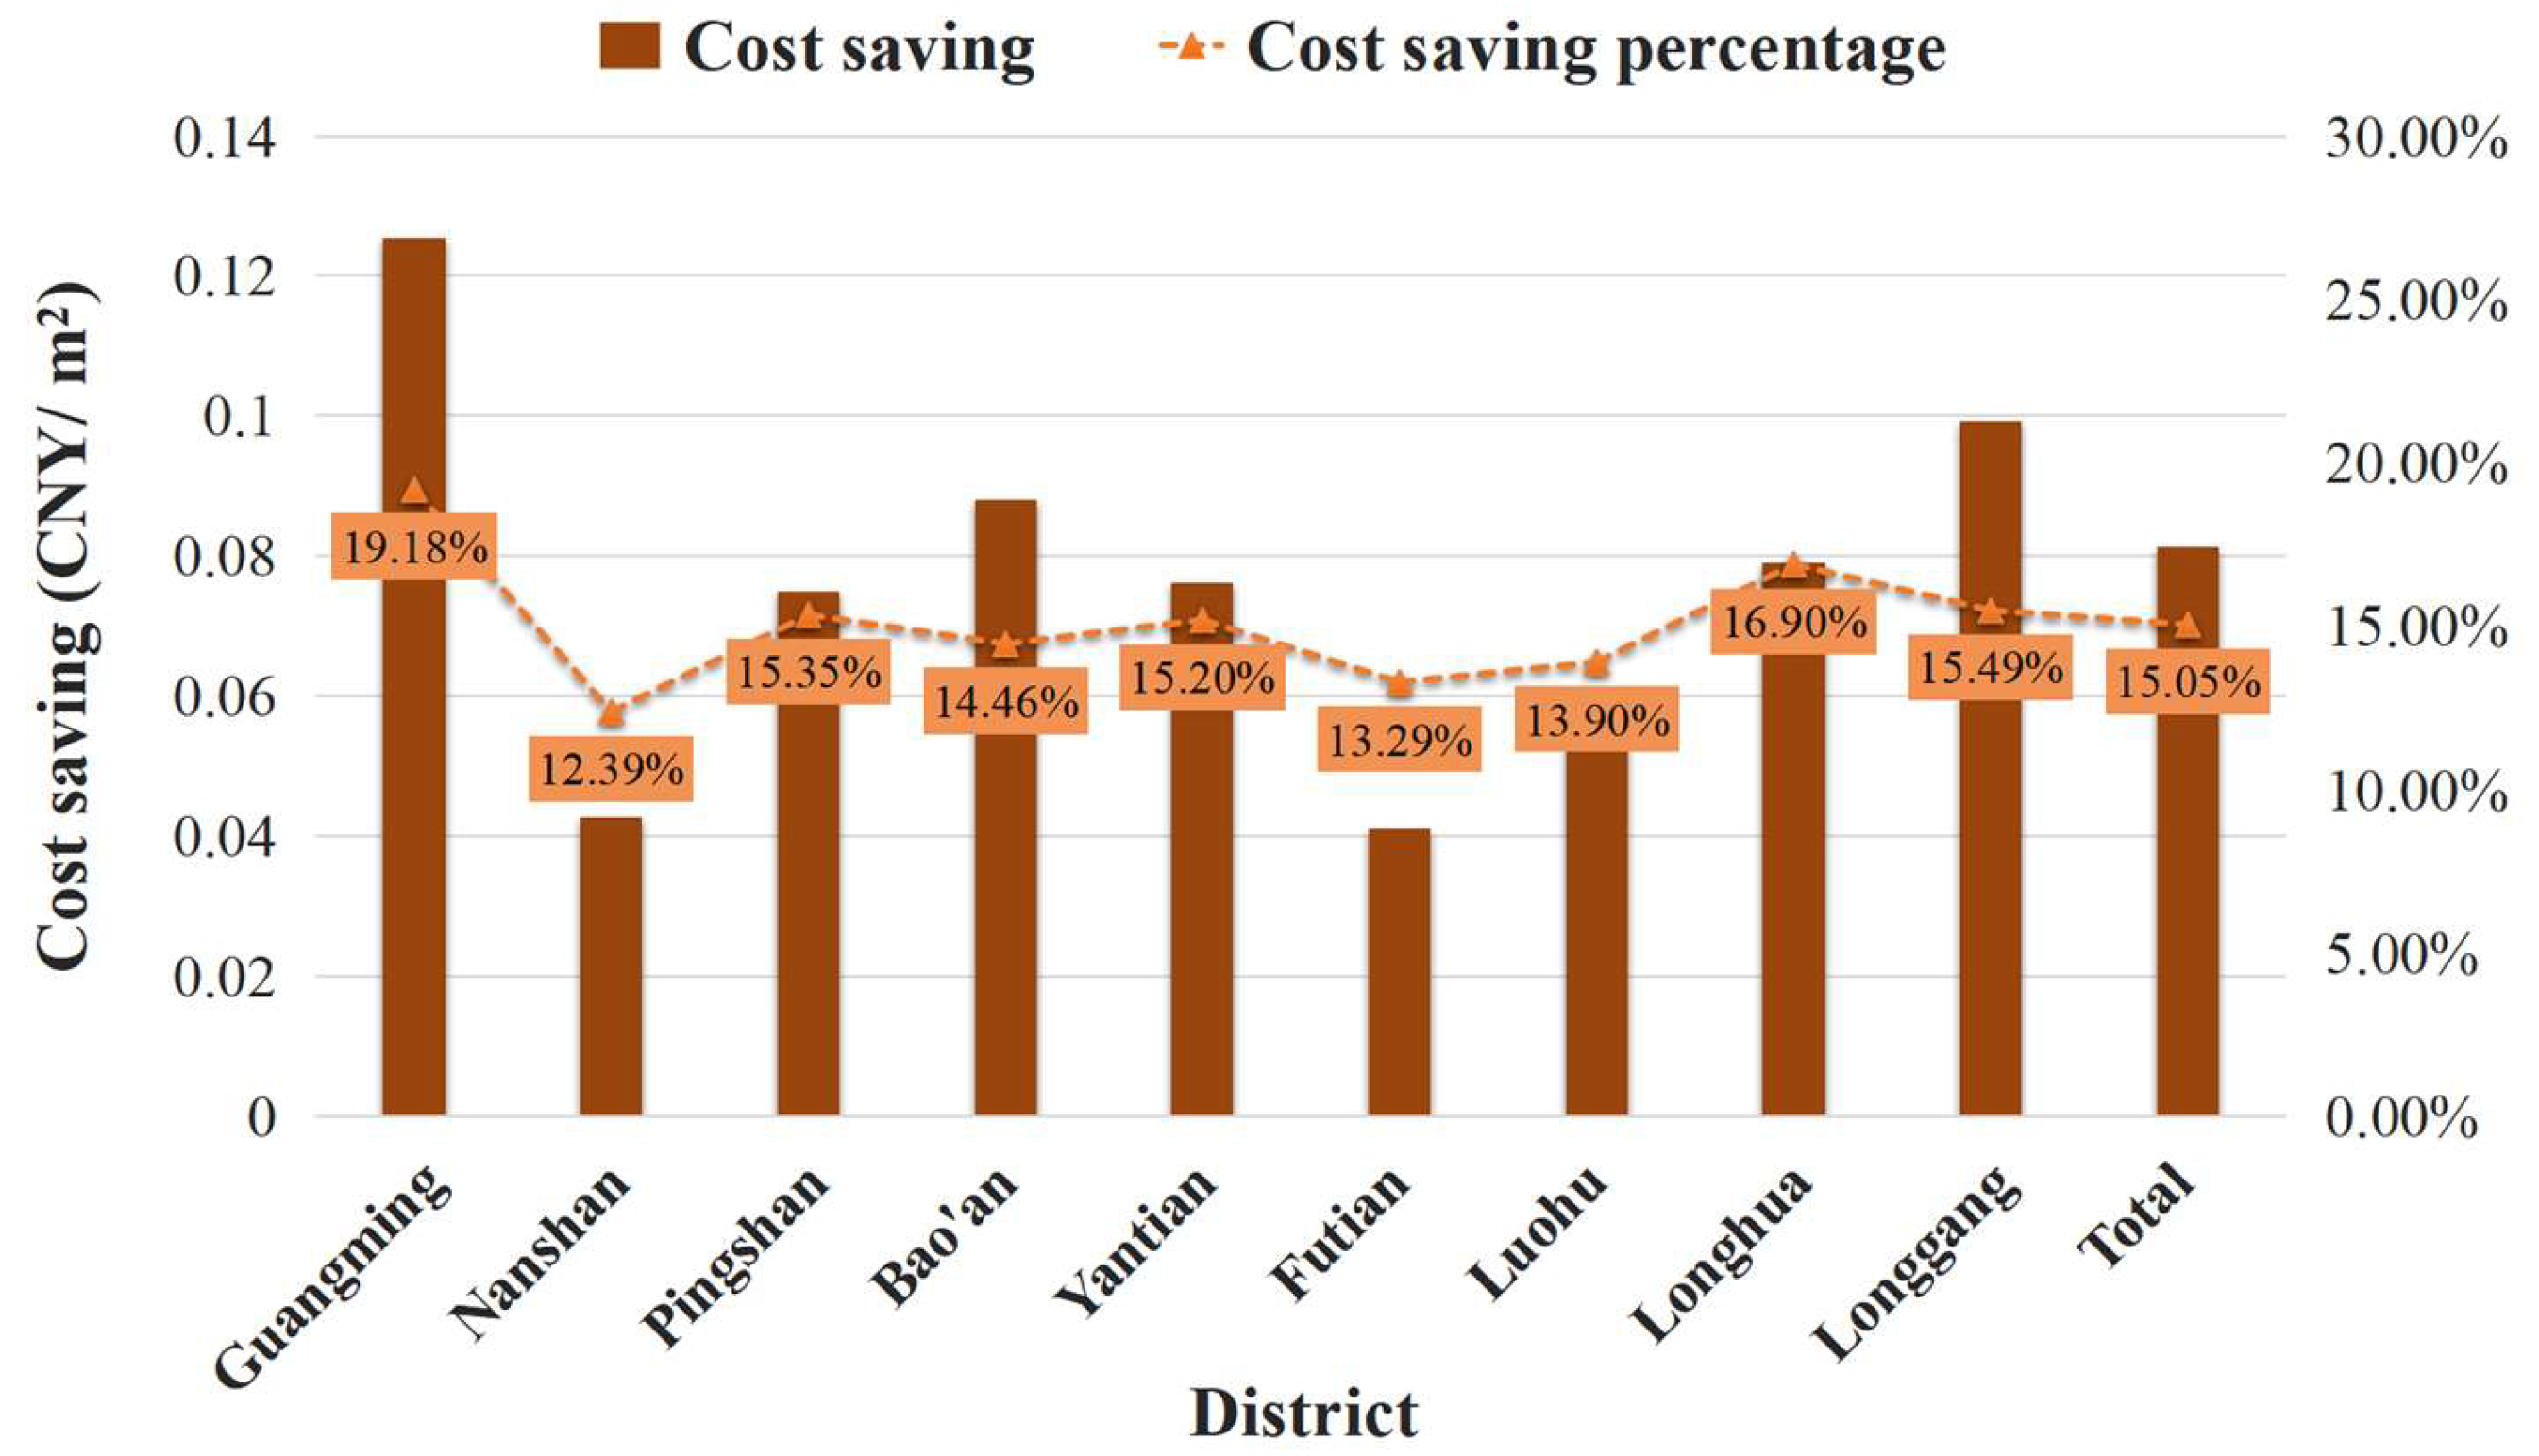
3.2.2. DR Potential of Different Districts and Overall Analysis

Figure 18 shows the peak electricity reduction of different districts in Shenzhen under the pre-cooling strategy and compared the energy-saving effects of each district by reduction ratio. It can be seen that the pre-cooling strategy had the best implementation effect in Guangming District, which was 26.54% lower than the baseline with a peak electricity reduction of 0.011 kWh/m2. The results in Nanshan District and Futian District were poor, which had relatively low electricity reduction amounts and rates. Figure 18 finally displays the total result for all districts, with an overall reduction of 0.007 kWh/m2 and a reduction rate of 21.87%.
Figure 19 shows the cost-saving results of the nine districts, and the DR potential analysis was conducted by combining the saving amount and percentage. It should be pointed out that the cost-saving percentage represented the FI in Section 2.6.3, as the calculation methods for both were the same. Overall, Figure 19 corresponds to the changes in peak electricity reduction in Figure 18, which also showed the best effect in Guangming District, with the highest cost saving of 0.125 CNY/m2 and a 19.18% reduction in electricity cost. The saving results in Nanshan District and Futian District were not good, with the cost savings of 0.043 CNY/m2 and 0.041 CNY/m2, and the saving percentages of 12.39% and 13.29%, respectively. Based on the simulation results, the total cost saving and saving percentage were obtained to be 0.081 CNY/m2 and 15.05%, which were close to the average of most districts.

4. Discussions

On the basis of previous research by other scholars, this article established a large-scale urban building cluster model that included 18 prototype building models from their research results. Pre-cooling, as the main DR strategy studied in this article, was combined with temperature reset to achieve more significant effects. In addition, the case study building cluster was selected in Shenzhen, with the nine administrative districts added to the research.
According to the actual ToU electricity price in Shenzhen, the DR time was determined to be 10–12 a.m., and pre-cooling was carried out before this time. Based on factors such as outdoor environment, indoor thermal disturbance, and thermal comfort, three pre-cooling strategies were developed for medium-sized office buildings and shopping malls in advance, namely PC-22 °C-0.5 h, PC-22 °C-1 h, and PC-22 °C-0.5 h + TR-26 °C. Detailed simulation results, including hourly temperature, hourly electricity consumption difference with baseline, and cost saving, were analyzed. It was found that the implementation effect of two durations of pre-cooling was not significantly different, indicating that 0.5 h of pre-cooling had already saturated the stored cooling capacity of the building’s internal structure. A longer cooling period cannot release much more cooling energy during the DR time but increases the load of pre-cooling and results in more cost waste. Therefore, the optimal pre-cooling strategy was found to be PC-22 °C-0.5 h + TR-26 °C, which was applied to the entire Shenzhen building cluster.
In the results of all prototype buildings’ power reduction effect, retail performed the best in reducing electricity consumption, while small hotel and low-rise residential performed the best in power reduction percentage during peak electricity consumption periods. These types of buildings had a common feature of small building area; on the contrary, the large buildings, such as large hotel, large office building, and high-rise residential, performed poorly in both of the two aspects. Obviously, a large building scale affects the implementation of pre-cooling strategies, with the large building area possibly leading to uneven temperature distribution in the internal space, resulting in poor effects of temperature control. And if the floor is higher, it is more susceptible to the influence of the external environment and sunlight radiation. From different construction periods, buildings built before 2001 or 2005 had greater electricity power reduction amounts. This was because the buildings were too old, and after optimization strategies, energy consumption had significantly decreased, indicating that older buildings have great potential for energy-saving renovation.
There were more commercial buildings included in the building cluster, which accounted for a larger proportion of the total electricity consumption difference with baseline under the pre-cooling strategy. Moreover, for residential buildings, people usually went out during the day and returned in the evening, while commercial buildings had a large air conditioning load during daytime business hours, so the amount of reduction was also greater.
In the study of DR potential in nine administrative districts of Shenzhen, it was found that there was a certain correlation between the performance of each region in terms of peak electricity changes and cost savings. The large amount of peak load reduction was usually accompanied by higher cost savings. Moreover, there was a deviation between the trend of reduction amount and rate between different districts, indicating that a high reduction amount did not necessarily correspond to a large reduction rate. The energy-saving effect was also related to the original electricity consumption of baseline, and greater energy consumption led to a larger extent for pre-cooling strategy implementation, which can show better DR potential. The same went for cost saving and cost saving percentage.
In regard to enhancing energy efficiency in buildings, adding PCMs into building envelopes has great research value and prospects. Taking advantage of PCMs in improving the thermal mass of buildings, the envelope structures can store more cooling capacity when pre-cooling is implemented and release it during DR periods, thereby delaying temperature rise. However, in addition to the properties of PCMs such as material, thickness, melting point, and placement, which can have different effects on heat capacity, differences in geographical location and climate zones can also have different effects. Therefore, for different building types and different cities or regions, it is necessary to optimize the performance of PCMs and conduct climate adaptability design, combined with economic and environmental assessments for adjustment, to maximize the pre-cooling effect and create better DR potential.
This paper investigated the demand flexibility of urban buildings from multiple perspectives. From the results, we can work out the electricity consumption patterns of various building types and obtain different impacts on the usage time and energy consumption characteristics of residential and commercial buildings. At the same time, as for the differences in policies or resources in different administrative districts, targeted DR strategies can be formulated, and supplying electricity between different regions to balance electricity demand can even be considered. However, despite conducting the exploration of DR potential in different zones and overall at the level of building clusters, as well as the quantitative assessment of energy flexibility, there were still some limitations in our approach:
(1)
When formulating the pre-cooling strategies, this article set the same temperature variation for all types of rooms, but in fact, rooms at different locations and floors are affected differently by the external environment, and their sensitivity to temperature varies, resulting in different indoor temperature changes. Therefore, in future research, it is necessary to consider controlling the temperature setpoint for different types of rooms separately.
(2)
The simulation results of this article show that after 1.5 h of pre-cooling, the cooling capacity of the internal structure of buildings is already saturated, so increasing the cooling time to 1 h will not release more cooling capacity during DR time. This involves the issue of internal thermal mass in buildings, and how to rely on the concept to improve pre-cooling potential is something that needs to be considered in future research.
(3)
The cost saving effect of pre-cooling essentially depends on the structure of electricity price rates. However, our current research is based on static electricity prices, pursuing a greater difference in peak and valley electricity prices. In the future, we need to expand to dynamic electricity prices abroad and conduct exploration of DR potential and evaluation of energy flexibility.

5. Conclusions

This study quantitatively evaluated the DR potential of an urban building cluster under the background of electricity demand response and the rules of ToU electricity prices. The main DR operation was pre-cooling combined with a temperature reset. The effectiveness of pre-cooling strategies developed reasonably was studied through applying them to the case study building models. A method combining EnergyPlus and AutoBPS was proposed to achieve more efficient and rapid establishment of pre-cooling models and obtain energy consumption results. By comparing the simulation results of different pre-cooling strategies on individual buildings, the optimal one was obtained and then applied to the study of the entire large-scale building cluster. In addition, this paper quantified energy flexibility by combining the final electricity bill calculated based on electricity prices and various evaluation indicators, thereby quantitatively analyzing the potential of pre-cooling strategies in DR events. The main conclusions of this paper are summarized as follows:
(1)
Through detailed analysis of the individual buildings’ simulation results, it is found that 0.5 h is the most suitable pre-cooling duration for the simulation in this study. In order to achieve a better DR effect without affecting thermal comfort, temperature reset was combined with the flexible operation with a temperature rise of 2 °C, thus forming the optimal pre-cooling strategy.
(2)
The implementation of a pre-cooling strategy is more effective for small buildings because it is more controllable. Commercial buildings have better pre-cooling effects than residential buildings because during the duration of DR strategies implementation, the occupancy rate of commercial buildings is higher.
(3)
Guangming District has shown the best results in peak electricity reduction and cost saving among the nine districts in Shenzhen. Under the optimal pre-cooling strategy, the total electricity consumption reduction of the entire Shenzhen building cluster during peak hours is 38,371.23 MW, with the total electricity cost saving of approximately CNY 99.69 million. This indicates that the impact of pre-cooling on the entire building cluster is enormous.

Author Contributions

Conceptualization, A.X. and Y.C.; methodology, A.X. and Y.C.; validation, A.X.; formal analysis, A.X., C.S. and W.Z.; investigation, A.X.; resources, C.S. and W.Z.; data curation, C.S. and W.Z.; writing—original draft preparation, A.X.; writing—review and editing, Y.C., C.S. and W.Z.; supervision, Y.C.; project administration, A.X. and Y.C. All authors have read and agreed to the published version of the manuscript.

Funding

This paper is supported by the National Natural Science Foundation of China (NSFC) through Grant No. 52478088. This paper is also funded by the Key Research and Development Project of Hunan Province of China through Grant No. 2024AQ2011.

Data Availability Statement

The original contributions presented in the study are included in the article, further inquiries can be directed to the corresponding author.

Acknowledgments

During the preparation of this work, the authors used Grammarly and ChatGPT to improve readability and detect spelling/grammar mistakes. After using these tools/services, the authors reviewed and edited the content as needed and take full responsibility for the content of the publication.

Conflicts of Interest

The authors declare no conflict of interest.

References

  1. Wang, J.; Wei, Z.; Zhu, Y.; Zheng, C.; Li, B.; Zhai, X. Demand Response via Optimal Pre-Cooling Combined with Temperature Reset Strategy for Air Conditioning System: A Case Study of Office Building. Energy 2023, 282, 128751. [Google Scholar] [CrossRef]
  2. Lund, P.D.; Lindgren, J.; Mikkola, J.; Salpakari, J. Review of Energy System Flexibility Measures to Enable High Levels of Variable Renewable Electricity. Renew. Sustain. Energy Rev. 2015, 45, 785–807. [Google Scholar]
  3. Ahrari, M.; Shirini, K.; Gharehveran, S.S.; Ahsaee, M.G.; Haidari, S.; Anvari, P. A Security-Constrained Robust Optimization for Energy Management of Active Distribution Networks with Presence of Energy Storage and Demand Flexibility. J. Energy Storage 2024, 84, 111024. [Google Scholar] [CrossRef]
  4. Shan, K.; Wang, S.; Yan, C.; Xiao, F. Building Demand Response and Control Methods for Smart Grids: A Review. Sci. Technol. Built Environ. 2016, 22, 692–704. [Google Scholar] [CrossRef]
  5. Peng, C.; Chen, Z.; Yang, J.; Liu, Z.; Yan, D.; Chen, Y. Assessment of Electricity Consumption Reduction Potential for City-Scale Buildings Under Different Demand Response Strategies. Energy Build. 2023, 297, 113473. [Google Scholar] [CrossRef]
  6. Jiang, Y.; Andrew Ejenakevwe, K.; Wang, J.; Tang, C.Y.; Song, L. Development, Implementation, and Impact Analysis of Model Predictive Control-Based Optimal Precooling Using Smart Home Thermostats. Energy Build. 2024, 303. [Google Scholar] [CrossRef]
  7. Kishore, R.A.; Bianchi, M.V.A.; Booten, C.; Vidal, J.; Jackson, R. Modulating Thermal Load through Lightweight Residential Building Walls Using Thermal Energy Storage and Controlled Precooling Strategy. Appl. Therm. Eng. 2020, 180, 115870. [Google Scholar] [CrossRef]
  8. Chen, Y.; Xu, P.; Chen, Z.; Wang, H.; Sha, H.; Ji, Y.; Zhang, Y.; Dou, Q.; Wang, S. Experimental Investigation of Demand Response Potential of Buildings: Combined Passive Thermal Mass and Active Storage. Appl. Energy 2020, 280, 115956. [Google Scholar] [CrossRef]
  9. Wang, J.; Tang, C.Y.; Song, L. Design and Analysis of Optimal Pre-Cooling in Residential Buildings. Energy Build. 2020, 216, 109951. [Google Scholar] [CrossRef]
  10. Yin, R.; Xu, P.; Piette, M.A.; Kiliccote, S. Study on Auto-DR and Pre-Cooling of Commercial Buildings with Thermal Mass in California. Energy Build. 2010, 42, 967–975. [Google Scholar] [CrossRef]
  11. Shan, K.; Wang, J.; Hu, M.; Gao, D.-c. A Model-Based Control Strategy to Recover Cooling Energy from Thermal Mass in Commercial Buildings. Energy 2019, 172, 958–967. [Google Scholar] [CrossRef]
  12. Wijesuriya, S.; Brandt, M.; Tabares-Velasco, P.C. Parametric Analysis of a Residential Building with Phase Change Material (PCM)-Enhanced Drywall, Precooling, and Variable Electric Rates in a Hot and Dry Climate. Appl. Energy 2018, 222, 497–514. [Google Scholar] [CrossRef]
  13. You, Z.; Sun, Y.; Mo, S.; Zou, W.; Zhang, X.; Gao, D.C. Experimental Evaluation of the Effects of Passive Phase Change Material Walls on the Building Demand Response for Smart Grid Applications. Buildings 2022, 12, 1830. [Google Scholar] [CrossRef]
  14. Jaradat, M.; Al Majali, H.; Bendea, C.; Bungau, C.C.; Bungau, T. Enhancing Energy Efficiency in Buildings Through PCM Integration: A Study across Different Climatic Regions. Buildings 2024, 14, 40. [Google Scholar] [CrossRef]
  15. Jarvinen, J.; Goldsworthy, M.; Pudney, P.; White, S.; Cirocco, L.; Bruno, F. Aggressive Pre-Cooling of an Office Building to Reduce Peak Power During Extreme Heat Days through Passive Thermal Storage. Sustain. Energy Grids Netw. 2024, 38, 101313. [Google Scholar] [CrossRef]
  16. Deng, Z.; Chen, Y.; Yang, J.; Causone, F. AutoBPS: A Tool for Urban Building Energy Modeling to Support Energy Efficiency Improvement at City-Scale. Energy Build. 2023, 282, 112794. [Google Scholar] [CrossRef]
  17. Dong, Y.; Zhang, L.; Wang, P.; Liu, Z.; Su, X.; Liao, H.; Jiang, X. Potential Evaluation of Energy Flexibility and Energy-Saving of PCM-Integrated Office Building Walls. J. Build. Eng. 2023, 79, 107857. [Google Scholar] [CrossRef]
  18. GB 50189–2005; Ministry of Housing and Urban-Rural Development, Design Standard for Energy Efficiency of Public Buildings. China Architecture & Building Press: Beijing, China, 2005.
  19. GB 50189–2015; Ministry of Housing and Urban-Rural Development, Design Standard for Energy Efficiency of Public Buildings. China Architecture & Building Press: Beijing, China, 2015.
  20. JGJ 134–2001; Ministry of Housing and Urban-Rural Development, Design Standard for Energy Efficiency of Residential Buildings in Hot Summer and Cold Winter Zone. China Architecture & Building Press: Beijing, China, 2001.
  21. JGJ 134–2010; Ministry of Housing and Urban-Rural Development, Design Standard for Energy Efficiency of Residential Buildings in Hot Summer and Cold Winter Zone. China Architecture & Building Press: Beijing, China, 2010.
  22. GB 55015-2021; Ministry of Housing and Urban-Rural Development, General Code for Energy Efficiency and Renewable Energy Application in Buildings. China Architecture & Building Press: Beijing, China, 2021.
  23. Turner, W.J.N.; Walker, I.S.; Roux, J. Peak Load Reductions: Electric Load Shifting with Mechanical Pre-Cooling of Residential Buildings with Low Thermal Mass. Energy 2015, 82, 1057–1067. [Google Scholar] [CrossRef]
  24. Tian, Z.; Si, B.; Wu, Y.; Zhou, X.; Shi, X. Multi-Objective Optimization Model Predictive Dispatch Precooling and Ceiling Fans in Office Buildings under Different Summer Weather Conditions. Build. Simul. 2019, 12, 999–1012. [Google Scholar] [CrossRef]
  25. Zhu, J.; Niu, J.; Tian, Z.; Zhou, R.; Ye, C. Rapid Quantification of Demand Response Potential of Building HAVC System via Data-Driven Model. Appl. Energy 2022, 325, 119796. [Google Scholar] [CrossRef]
  26. Tang, H.; Wang, S. A Model-Based Predictive Dispatch Strategy for Unlocking and Optimizing the Building Energy Flexibilities of Multiple Resources in Electricity Markets of Multiple Services. Appl. Energy 2022, 305, 117889. [Google Scholar] [CrossRef]
  27. Song, Z.; Shi, J.; Li, S.; Chen, Z.; Jiao, F.; Yang, W.; Zhang, Z. Data-Driven and Physical Model-Based Evaluation Method for the Achievable Demand Response Potential of Residential Consumers’ Air Conditioning Loads. Appl. Energy 2022, 307, 118017. [Google Scholar] [CrossRef]
  28. Naderi, S.; Heslop, S.; Chen, D.; Macgill, I.; Pignatta, G. Consumer Cost Savings, Improved Thermal Comfort, and Reduced Peak Air Conditioning Demand Through Pre-Cooling in Australian Housing. Energy Build. 2022, 271, 112172. [Google Scholar] [CrossRef]
  29. Song, C.; Deng, Z.; Zhao, W.; Yuan, Y.; Liu, M.; Xu, S.; Chen, Y. Developing Urban Building Energy Models for Shanghai City with Multi-Source Open Data. Sustain. Cities Soc. 2024, 106, 105425. [Google Scholar] [CrossRef]
  30. Crawley, D.B.; Lawrie, L.K.; Winkelmann, F.C.; Buhl, W.F.; Huang, Y.J.; Pedersen, C.O.; Strand, R.K.; Liesen, R.J.; Fisher, D.E.; Witte, M.J.; et al. EnergyPlus: Creating a New-Generation Building Energy Simulation Program. Energy Build. 2001, 33, 319–331. [Google Scholar] [CrossRef]
  31. Aghniaey, S.; Lawrence, T.M.; Sharpton, T.N.; Douglass, S.P.; Oliver, T.; Sutter, M. Thermal Comfort Evaluation in Campus Classrooms During Room Temperature Adjustment Corresponding to Demand Response. Build. Environ. 2019, 148, 488–497. [Google Scholar] [CrossRef]
  32. Reynders, G.; Amaral Lopes, R.; Marszal-Pomianowska, A.; Aelenei, D.; Martins, J.; Saelens, D. Energy Flexible Buildings: An Evaluation of Definitions and Quantification Methodologies Applied to Thermal Storage. Energy Build. 2018, 166, 372–390. [Google Scholar] [CrossRef]
  33. Lind, J.; Möllerström, E.; Averfalk, H.; Ottermo, F. Energy Flexibility Using the Thermal Mass of Residential Buildings. Energy Build. 2023, 301, 113698. [Google Scholar] [CrossRef]
  34. Jensen, S.Ø.; Marszal-Pomianowska, A.; Lollini, R.; Pasut, W.; Knotzer, A.; Engelmann, P.; Stafford, A.; Reynders, G. IEA EBC Annex 67 Energy Flexible Buildings. Energy Build. 2017, 155, 25–34. [Google Scholar] [CrossRef]
  35. Li, H.; Wang, Z.; Hong, T.; Piette, M.A. Energy Flexibility of Residential Buildings: A Systematic Review of Characterization and Quantification Methods and Applications. Adv. Appl. Energy 2021, 3, 100054. [Google Scholar] [CrossRef]
Figure 1. Workflow of this study.
Buildings 15 01051 g001
Figure 2. Profile of ToU electricity prices in Shenzhen.
Buildings 15 01051 g002
Figure 3. Case individual building model legend.
Buildings 15 01051 g003
Figure 4. Amount distribution of prototype buildings.
Buildings 15 01051 g004
Figure 5. Total area of prototype buildings.
Buildings 15 01051 g005
Figure 6. Total area and proportion of each district.
Buildings 15 01051 g006
Figure 7. Proportion of each type of building in the nine administrative districts.
Buildings 15 01051 g007aBuildings 15 01051 g007b
Figure 8. Process of creating IDF files with pre-cooling strategies by AutoBPS-DR.
Buildings 15 01051 g008
Figure 9. Process of calculating building energy consumption.
Buildings 15 01051 g009
Figure 10. Temperature settings of different room types.
Buildings 15 01051 g010
Figure 11. Temperature settings of baseline and pre-cooling strategies.
Buildings 15 01051 g011
Figure 12. Hourly temperature change of medium office building.
Buildings 15 01051 g012
Figure 13. Electricity consumption difference with baseline of medium office building.
Buildings 15 01051 g013
Figure 14. Hourly temperature change of shopping mall.
Buildings 15 01051 g014
Figure 15. Electricity consumption difference with baseline of shopping mall.
Buildings 15 01051 g015
Figure 16. Power reduction results of all prototype buildings.
Buildings 15 01051 g016
Figure 17. Electricity demand difference with baseline of building cluster.
Buildings 15 01051 g017
Figure 18. Peak electricity reduction amount and ratio of nine districts in Shenzhen.
Buildings 15 01051 g018
Figure 19. Cost saving amount and percentage of nine districts in Shenzhen.
Buildings 15 01051 g019
Table 1. Settings of building envelope in residential prototype building models.
ParametersPre-20012002–20092010–2021
Exterior wall U-value (W/(m2⋅K))1.9610.8
Roof U-value (W/(m2⋅K))1.660.80.5
Window U-value (W/(m2⋅K))6.63.22.8
Window SHGC0.850.480.34
Table 2. Settings of building envelope in commercial prototype building models.
ParametersPre-20052006–20142015–2021
Exterior wall U-value (W/(m2⋅K))210.6
Roof U-value (W/(m2⋅K))1.50.70.4
Window U-value (W/(m2⋅K))6.432.6
Window SHGC0.690.430.35
Table 3. Internal loads settings and cooling/heating setpoint of different main zones.
ParametersResidential
Building
Hotel
Guestroom
OfficeRetail
Lighting power density (W/m2)7151112
Equipment power density (W/m2)4.3202013
Occupancy (person/m2)0.050.040.1250.125
Cooling/Heating setpoint (°C)26/1825/2226/2024/21
Table 4. Main rooms and HVAC system forms for all types of prototype buildings.
Building TypeMain Room TypeHVAC System
Single-useLow-rise residentialApartmentMini-split heat pump
Mid-rise residentialApartmentMini-split heat pump
High-rise residentialApartmentMini-split heat pump
Medium officeOfficeMini-split heat pump
Large officeOfficeChiller and gas boiler
HotelGuestroomChiller and gas boiler
RetailRetailMini-split heat pump
Shopping mallRetailChiller and gas boiler
RestaurantDining roomMini-split heat pump
Mixed-useHigh-rise residential with shopsApartment, retailMini-split heat pump
Hotel-residential mixedGuestroom, apartmentMini-split heat pump
Hotel with shopsSmall guestroom, retailMini-split heat pump
Office with shopsOffice, retailChiller and gas boiler
Hotel-shopping mall mixedLarge guestroom, retailChiller and gas boiler
Hotel-office mixedGuestroom, officeChiller and gas boiler
Office-shopping mall mixedOffice, retailChiller and gas boiler
Hotel-office-shopping mall mixedGuestroom, office, retailChiller and gas boiler
HospitalPatient room, officeChiller and gas boiler
Table 5. Main room types and whether to HVAC control.
Room TypeWhether to
HVAC Control
Room TypeWhether to
HVAC Control
OfficeCafe
RetailExercise room
Point of saleConference room
Banquet hallGuestroom
Dining hallApartment
KitchenRestroom×
LaundryBasement×
LobbyStorage×
Table 6. Comparison of cost and peak load for three strategies.
Operation StrategyMedium OfficeShopping Mall
Cost Change (CNY)Peak Load Change (10−2 kWh/m2)Cost Change (CNY)Peak Load Change (10−2 kWh/m2)
PC-22 °C-1 h+3.04−0.41+188.30−0.12
PC-22 °C-0.5 h−2.13−0.29+89.58−0.09
PC-22 °C-0.5 h
+ TR-26 °C
−129.35−1.57−52.14−0.46
Disclaimer/Publisher’s Note: The statements, opinions and data contained in all publications are solely those of the individual author(s) and contributor(s) and not of MDPI and/or the editor(s). MDPI and/or the editor(s) disclaim responsibility for any injury to people or property resulting from any ideas, methods, instructions or products referred to in the content.

