1. Introduction
The rapid development of a high density of public buildings not only leads to serious environmental problems, such as air pollution and the heat island effect [
1,
2], but also tends to cause psychological and physical stress to local residents due to the lack of contact with nature [
3]. How to solve this problem is an important issue facing the development of modern cities. Green space infrastructure is an important part of cities, providing essential ecosystem services, improving the environment, and relieving stress [
4]. However, due to the scarcity of space, the construction of large urban parks can be a daunting task. Pocket parks have gained widespread attention as the conflict between increasing urban building density and limited recreational green space intensifies. Pocket parks, also known as vestibule parks, mini-parks, green space pockets, or street corner parks, are a kind of small urban green space [
5]. Currently, scholars lack a uniform definition of pocket parks [
6,
7], but their smaller scale and public nature as parks are their key features. Unlike some traditional parks, pocket parks are smaller and more flexible, and as a kind of urban micro-space they have a high utilization rate and reflect the urban landscape to a certain extent. Studies have shown that pocket parks are good at providing recreational and interactive experiences, relieving stress, and improving local environmental quality [
8,
9,
10].
The planning, design, and value assessment system of the pocket park should be based on the synergistic analysis of local resources and social value. The social value is a compound, including both explicit economic demands and implicit demands that cannot be measured by efficiency indicators alone. The significance of complex social values depends on the consistency of individual assessments and the ability to combine them based on multi-dimensional profiles [
11]. Therefore, to correctly estimate the value of complex societies it is necessary to carry out a qualitative–quantitative assessment of the decomposition of a certain number of criteria. The traditional single-dimension economic efficiency assessment does not fully reflect the multiple attributes of social value, so it is necessary to construct a comprehensive assessment model that combines qualitative and quantitative criteria at multiple levels. The importance of this composite value system is reflected in two aspects: first, the convergence of the cognition of different assessment subjects, and second, the integrability of multiple value dimensions. Excellent pocket park design not only needs to realize the basic functional positioning but also should reach the depth of the user’s emotional appeal and spatial experience [
12]. This study innovatively constructs a multi-dimensional evaluation index system, aiming to break through the previous limitations of favoring economic benefits and expert judgments, and provide designers with a scientific program comparison tool through the establishment of a decision-making model that includes multiple value dimensions such as economic feasibility, social inclusiveness, ecological sustainability, and so on. This systematic assessment method can not only enhance the scientific nature of design decision making, but also effectively avoid the design bias brought by subjective empiricism and ultimately achieve the dual goals of design efficiency optimization and precise resource allocation.
At present, some scholars have carried out relevant research in design and decision making for pocket park programs. The main research methods can be divided into micro and macro aspects. (1) Among the micro methods, the traditional methods include case studies, expert assessment, questionnaire research, and microclimate simulation. For example, Babalis analyzed the functions, configurations, and elements of 13 different types of pocket parks to determine the design principles of pocket parks [
13]. Fatiah et al. used expert assessment to evaluate the design quality of pocket parks from the perspective of accessibility, attractiveness, functionality, and safety of the design solutions [
14]. Using a visual online questionnaire, NAGHIBI et al. completed the evaluation of 25 pocket park solutions and obtained user preference characteristics from them [
6]. Zwangsleitner conducted a simulation analysis of the thermal comfort of pocket parks based on the weather parameters and 3D modeling through the use of different vegetation types and materials [
15]. In such methods, the case study, expert assessment, and questionnaire research methods all contain a great deal of subjectivity, making it difficult to accomplish a scientific and reliable quantitative assessment. Although better objective data can be obtained based on microclimate simulation, this method cannot fully consider the subjective emotions of users. At the same time, the current research has not yet formed a unified evaluation system. (2) In the evaluation using macro methods, it is often necessary to complete the construction of the database based on a large amount of historical data. Dong et al. used remote sensing and geographic information system (GIS) technology to calculate the quantitative indicators for pocket parks, and established a complete and feasible workflow, which provided a strong reference for the optimization of the design scheme of pocket parks [
16]. Hu et al. established a GIS database to assess the applicability of pocket parks by collecting extensive data on the population, history, vegetation, and conservation in the Shichahai area of Beijing [
17]. It is worth noting that relevant studies using macro spatio-temporal analysis are widely conducted in China, but the application of various methods in pocket park design is more diverse and comprehensive in Europe [
5]. New technologies can break through the limitations of spatio-temporal dimensions in traditional planning and make breakthroughs at the level of the fine-grained design of pocket parks. However, compared with the optimization of landscape elements at the micro-scale, the systematic planning framework and multi-objective assessment system at the macro-scale still need to be improved.
In summary, there is still a lack of a complete and reliable evaluation index system for the design evaluation of pocket parks. At the same time, the existing micro evaluation method has strong subjectivity and cannot obtain objective and reliable evaluation results. The macro method is more objective but cannot realize the rapid decision-making work of the design method. Therefore, this study proposes an objective and fast method of pocket park design scheme preference decision making through the construction of an evaluation index system, combined with the empowerment method and multi-attribute decision-making theory. This study is organized as follows: firstly, the construction of the evaluation index system is completed from multiple perspectives such as functionality, safety, and ecology of pocket park design. Secondly, the assignment work of the indicators is carried out through the subjective and objective comprehensive weight determination method, and the evaluation of the design scheme is carried out by the multi-attribute decision-making method. Finally, the corresponding index weights and index scores of the pocket park design scheme are analyzed for differences, and the optimization direction of the preferred scheme is clarified.
2. Establishment of the Evaluation Index System for the Optimization of Design Schemes
In the pocket parks’ design process, designers interpret the surrounding urban environment with a human-centered approach. Numerous design principles must be followed during the design process, such as holistic design, environmental protection design, human-centered design, refined design, and functional design. It is essential to clarify the design concept, arrange the spatial layout, reflect local characteristics, and embody the spirit of the place. By integrating local elements and culture, the design can achieve a more significant impact through the “gaps” in the city, awakening the city’s memory. The goal is to achieve the coexistence of ecological environment and cultural development, ensuring a human-centered approach that serves the city [
18,
19].
This paper explores potential factors used for pocket park design evaluation through extensive literature reading [
20,
21,
22,
23]. After obtaining a large number of evaluation indexes, the final evaluation indexes were derived by the Delphi method. According to the empirical formula, the number of experts should be greater than or equal to the arithmetic square root of the total indicator. Five experts were invited to give their anonymous opinions on the evaluation metrics of the pocket park design program. The experts invited in the preliminary stage of this study all have doctoral degrees and senior titles in landscape design, all have more than 5 years of experience in public space design projects, and all have led the design experience of more than three provincial pocket parks. They include two professors in the direction of urban landscape design, one chief engineer of municipal landscape, one researcher of environmental psychology, and one community planning consultant. Therefore, the indicator system derived from their evaluation has high credibility. This study utilized a hybrid questionnaire containing both closed-ended scoring and open-ended recommendations in two rounds of the Delphi process. In the first round, the closed-ended questionnaire was used for initial indicator screening, while in the second round the closed-ended questionnaire was used to determine whether a consensus was reached. After conducting a secondary classification of the experts’ views, the results were sent back to the experts for further debate and evaluation. After the second round, the harmonization coefficient of experts’ opinions (Kendall’s W) reached 0.82 (
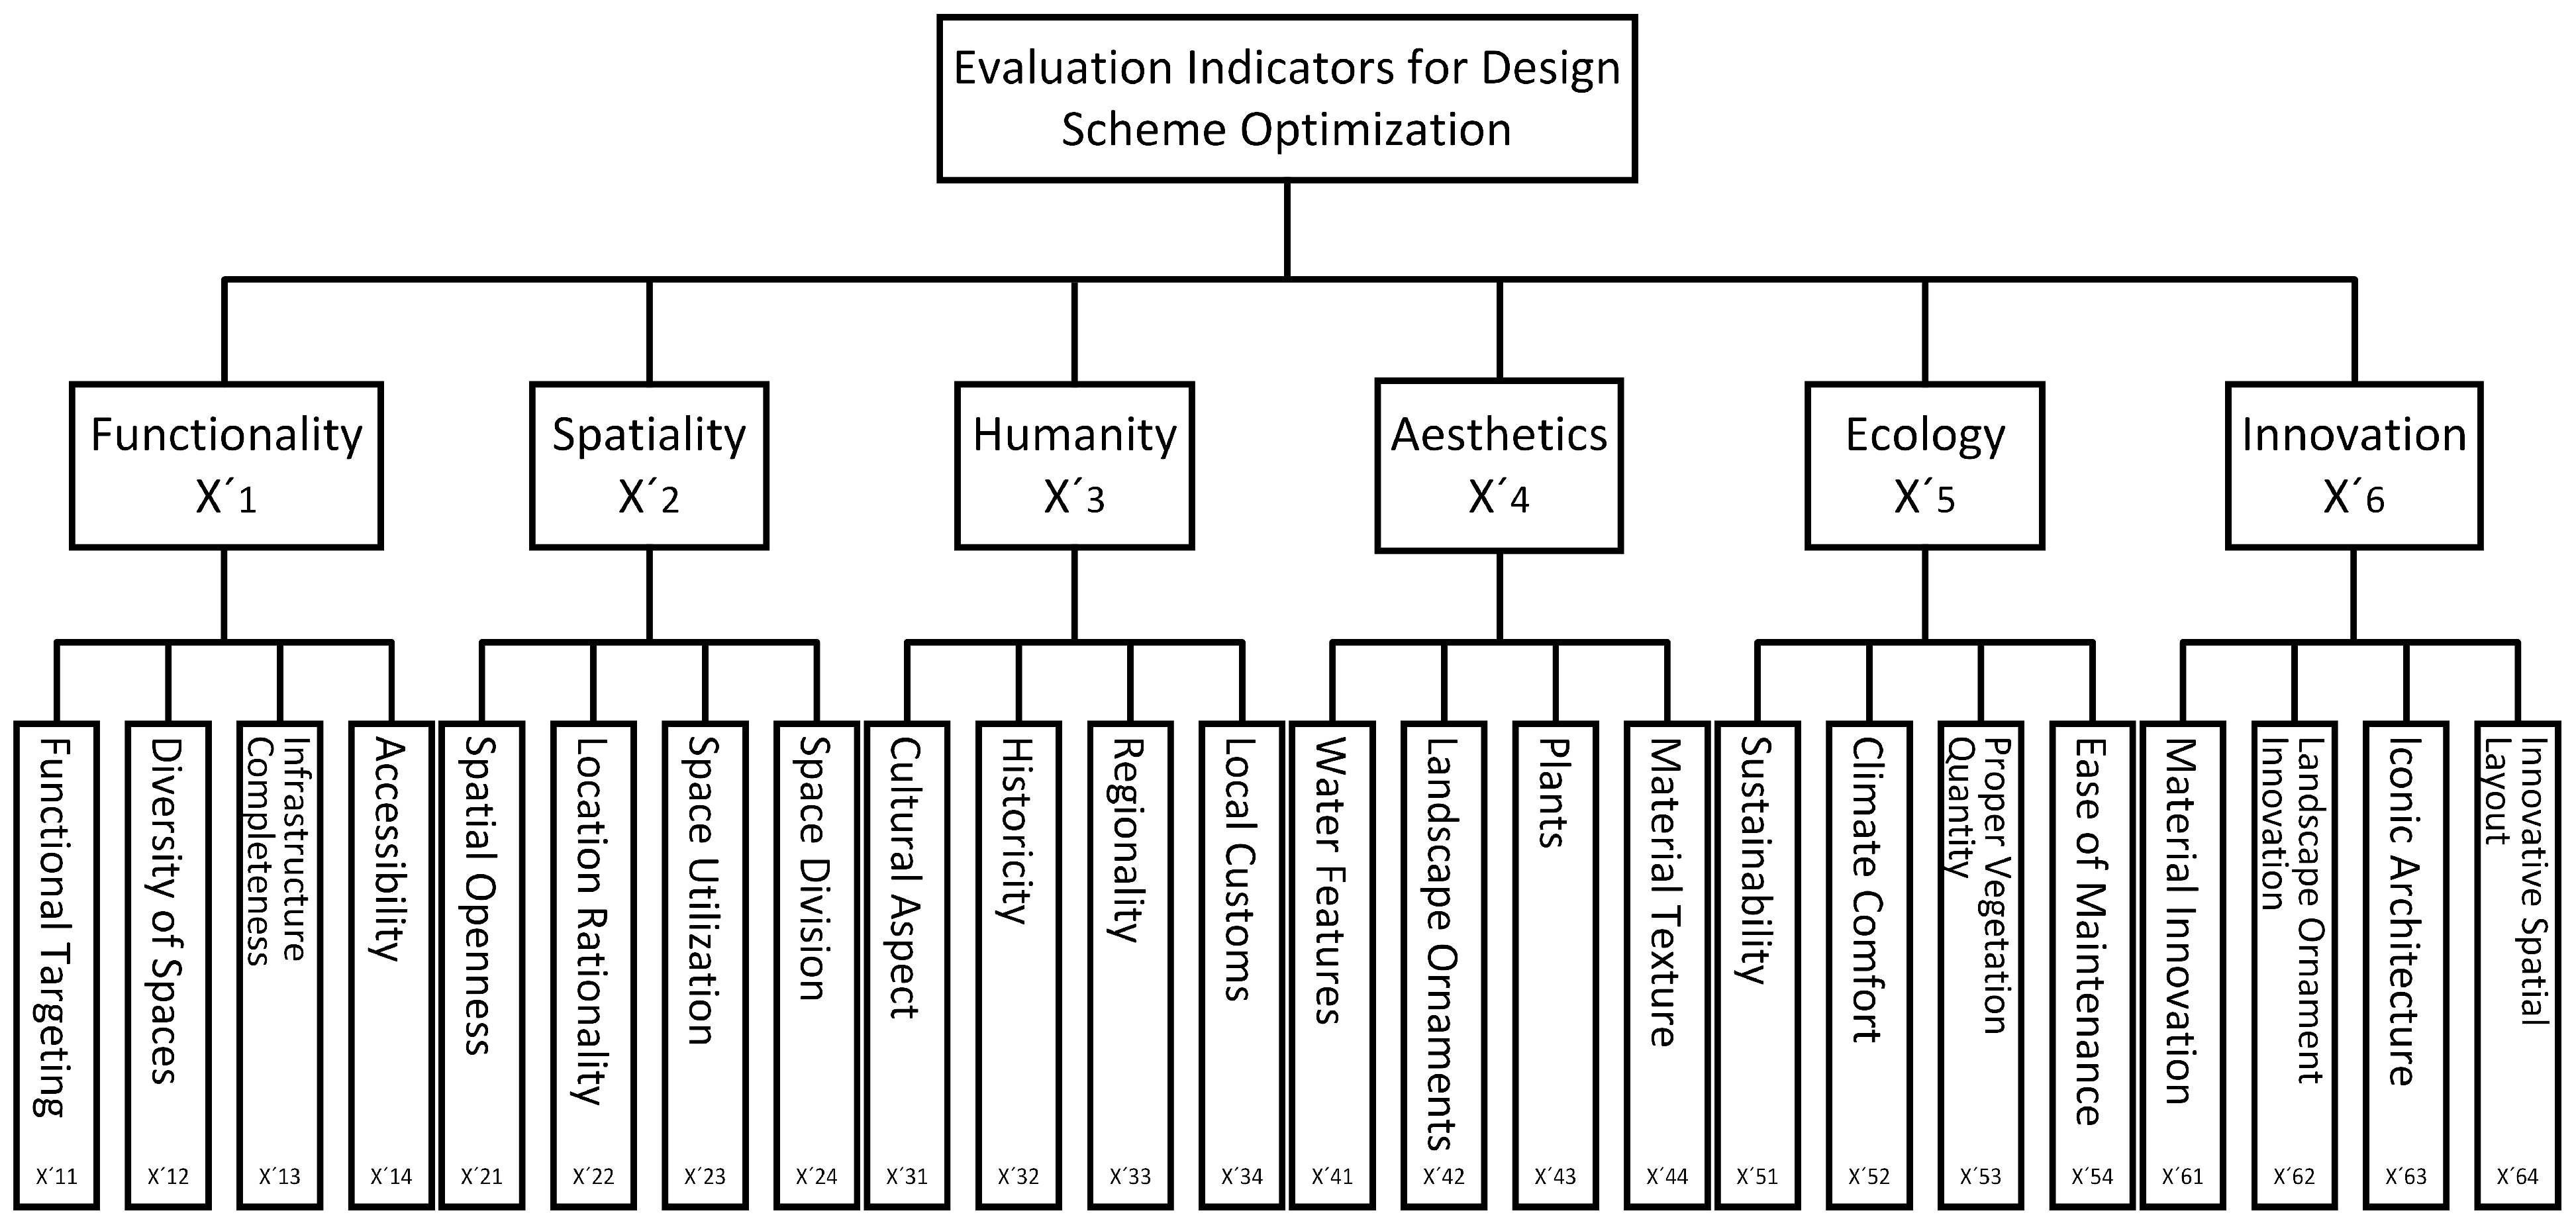
p < 0.01), exceeding the threshold value of 0.7. A total of 90% of the experts in the open-ended questions said, “no further comments”, indicating that a consensus had been formed. Six primary evaluation indicators were identified: functionality, spatiality, humanity, aesthetics, ecology, and innovation. The evaluation elements and conceptual explanations for each primary indicator are shown in
Table 1.
According to the optimization evaluation indicators and evaluation elements shown in
Table 1, and in combination with the Analytic Hierarchy Process (AHP), the primary indicators in the evaluation of pocket park design schemes are denoted as
. Each primary indicator has several evaluation factors, which are defined as secondary indicators in the evaluation system and are denoted as
. Four secondary indicators are established for each primary indicator. The evaluation system contains six primary and twenty-four secondary indicators, as shown in
Figure 1. Based on the same principle, the number of evaluation layers and indicators are set according to the specific situation when evaluating different schemes.
3. Optimization Model for the Evaluation and Selection of Design Schemes
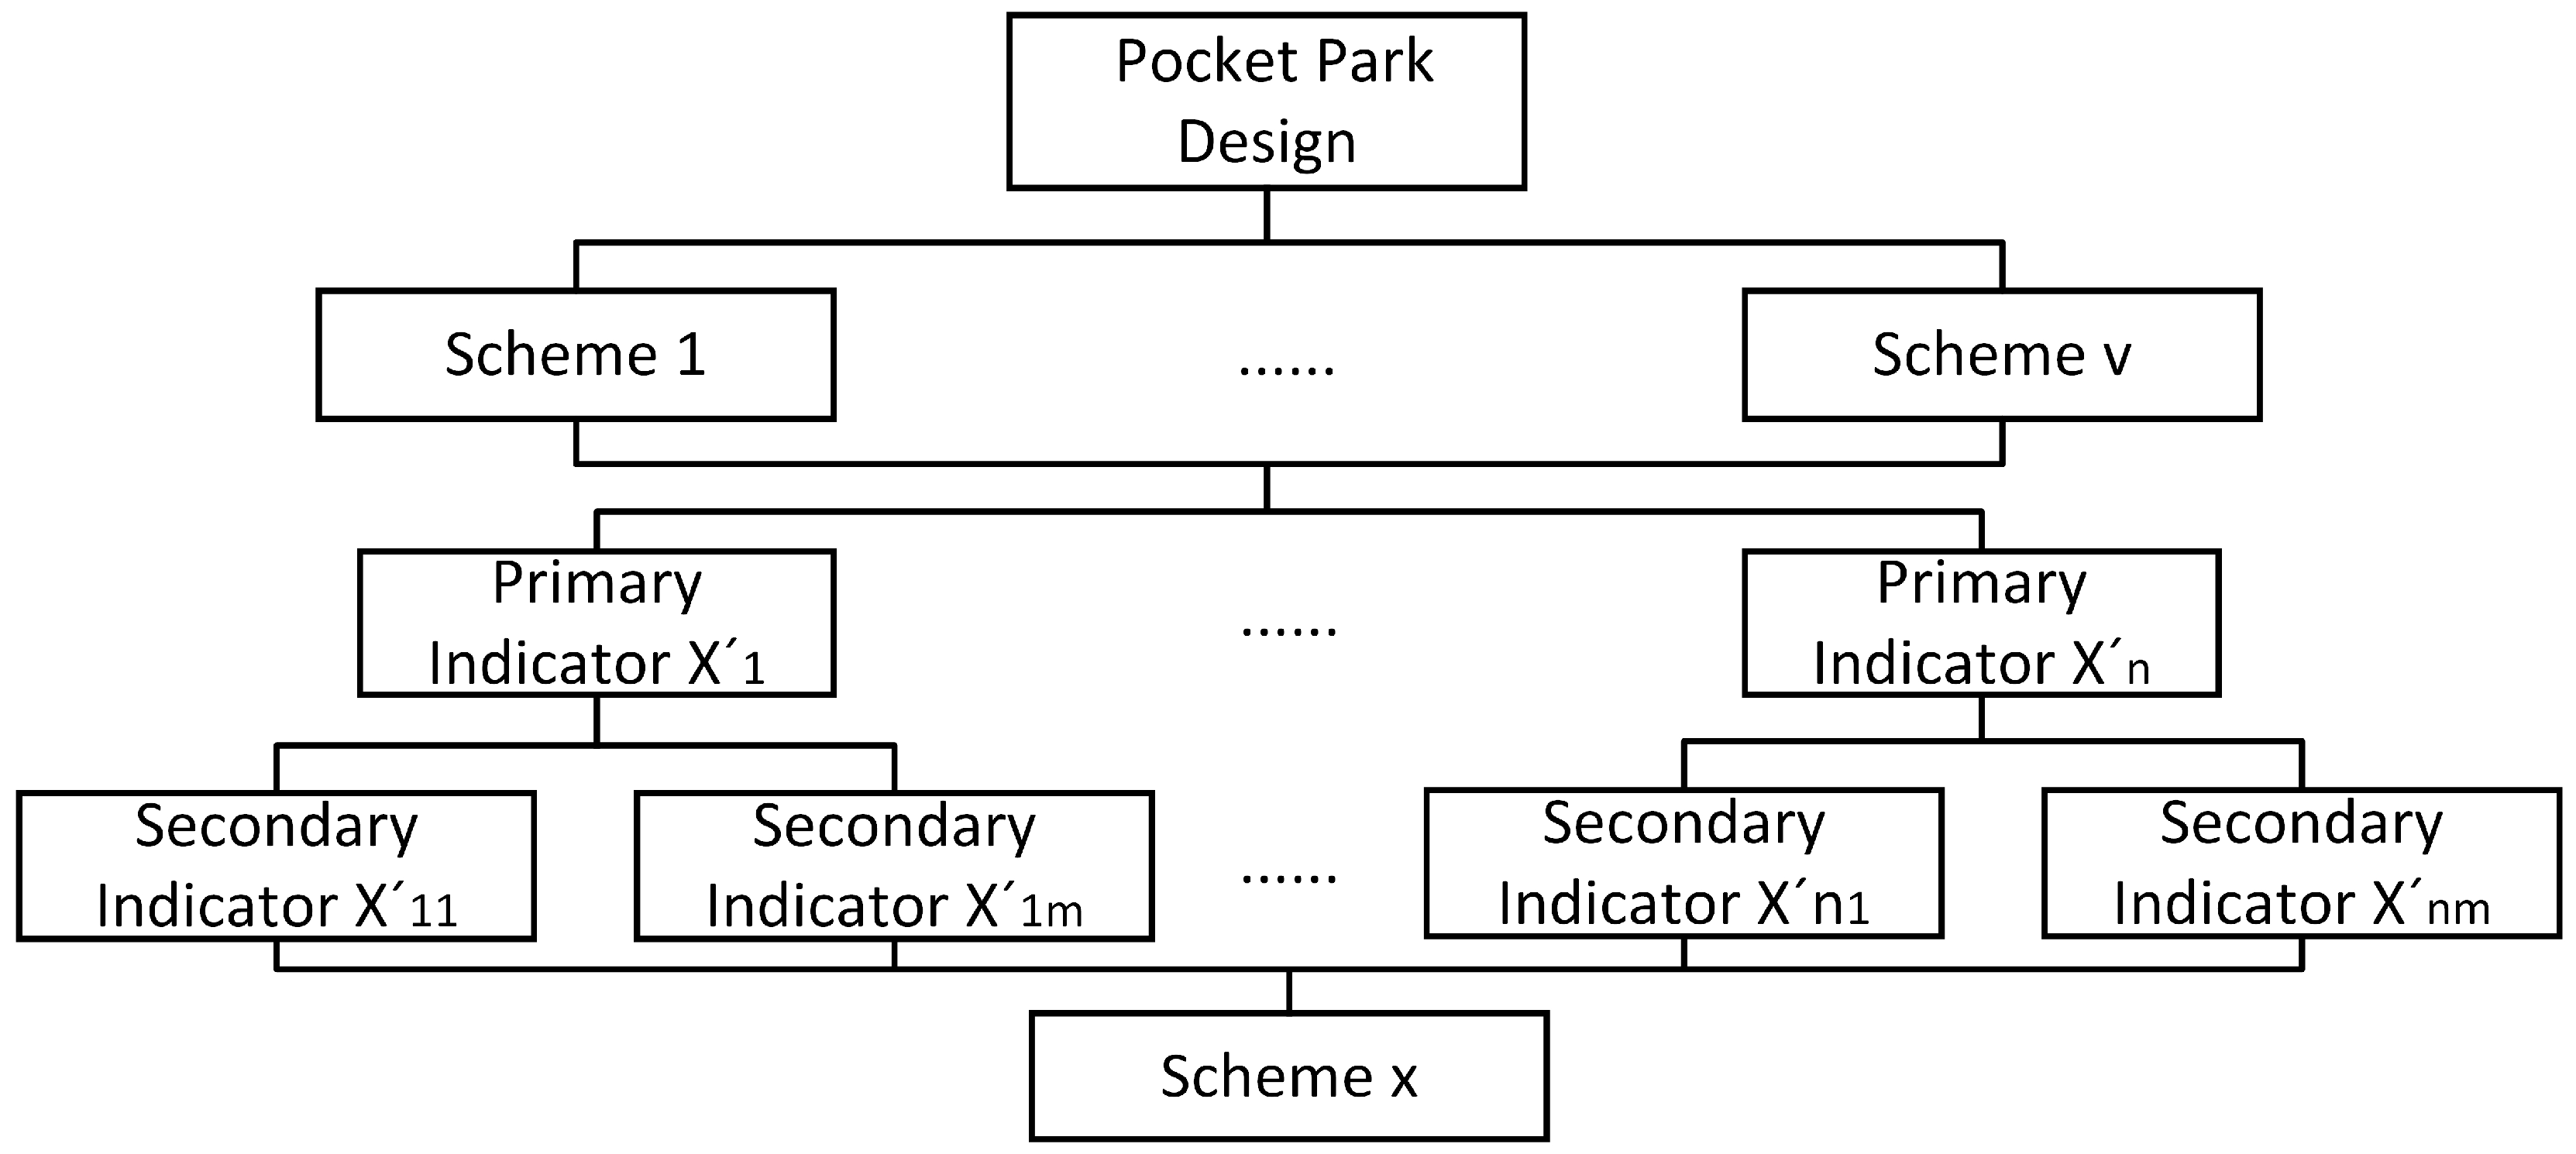
Based on the established evaluation index system, this paper develops a hierarchical structure model for design scheme evaluation, as shown in
Figure 2. In this study, a five-point Likert scale was used, with each indicator rated from one to five, corresponding to very poor, poor, fair, good, and very good, respectively. Experts use the Likert scale to score each evaluation indicator for every design scheme. All experts were asked to score the second-level indicators based on the conceptual design proposal. In the evaluation of any proposal, the average of each expert’s scores for each second-level indicator will be the final score for that proposal for that second-level indicator. Finally, we calculate the multi-dimensional spatial geometric distances between the design solutions and the ideal solution by the TOPSIS method after obtaining the score matrix of each solution to obtain the distance between each solution and the ideal solution. The preference ranking of the design solutions is completed based on the distance calculation results in order to select the best solution.
3.1. Improved TOPSIS Method for the Design Scheme Evaluation Process
In the research of multi-attribute decision making, the existing methods contain the fuzzy comprehensive evaluation method, rank-sum ratio method, gray correlation method, and so on. But compared with these methods, the Technique for Order of Preference by Similarity to Ideal Solution (TOPSIS) method avoids the subjectivity of data, does not need objective function, does not need to pass the test, and can better portray the comprehensive impact strength of multiple impact indicators. The TOPSIS method has no strict limitations on the distribution of data, the sample size, and the number of indicators, and it is applicable to both small sample data and large systems with multiple evaluation units and indicators. Therefore, the TOPSIS method was chosen as the main program for multi-attribute decision making in this study.
However, in previous studies the determination of TOPSIS weights is often subjectively evaluated by the AHP or expert opinion, which makes it difficult to ensure the objective reliability of the weights. Therefore, in this paper, in order to increase the credibility of the data in the process of calculating the weights, a combination of qualitative–quantitative and subjective–objective methods are used to calculate the weights of the indicators. The Analytic Hierarchy Process (AHP) starts from the theory of system engineering, and its core is hierarchical weight decision analysis, and its biggest advantage is that it puts forward the concept of hierarchy, which allows users to clearly and comprehensively consider and measure the relative importance of indicators, and to establish a hierarchical model of the laddered indicator system from the bottom up. However, it has the disadvantages of over-reliance on experts, too many qualitative factors, and complexity when too much data are available. Therefore, this paper introduces the Entropy Weight Method to correct the subjective randomness of the AHP on the basis of retaining expert opinions. The Entropy Weight Method originates from thermodynamics, which is a measure of the uncertainty of the system state [
24]. The greater the information entropy, the higher the information dispersion, the smaller the utility value, and the smaller the weight of the indicator. This study combines the AHP with the Entropy Weight Method, which fully utilizes the advantages of the AHP in dealing with the field of non-independent hierarchical assessment and can be used for objective weight correction.
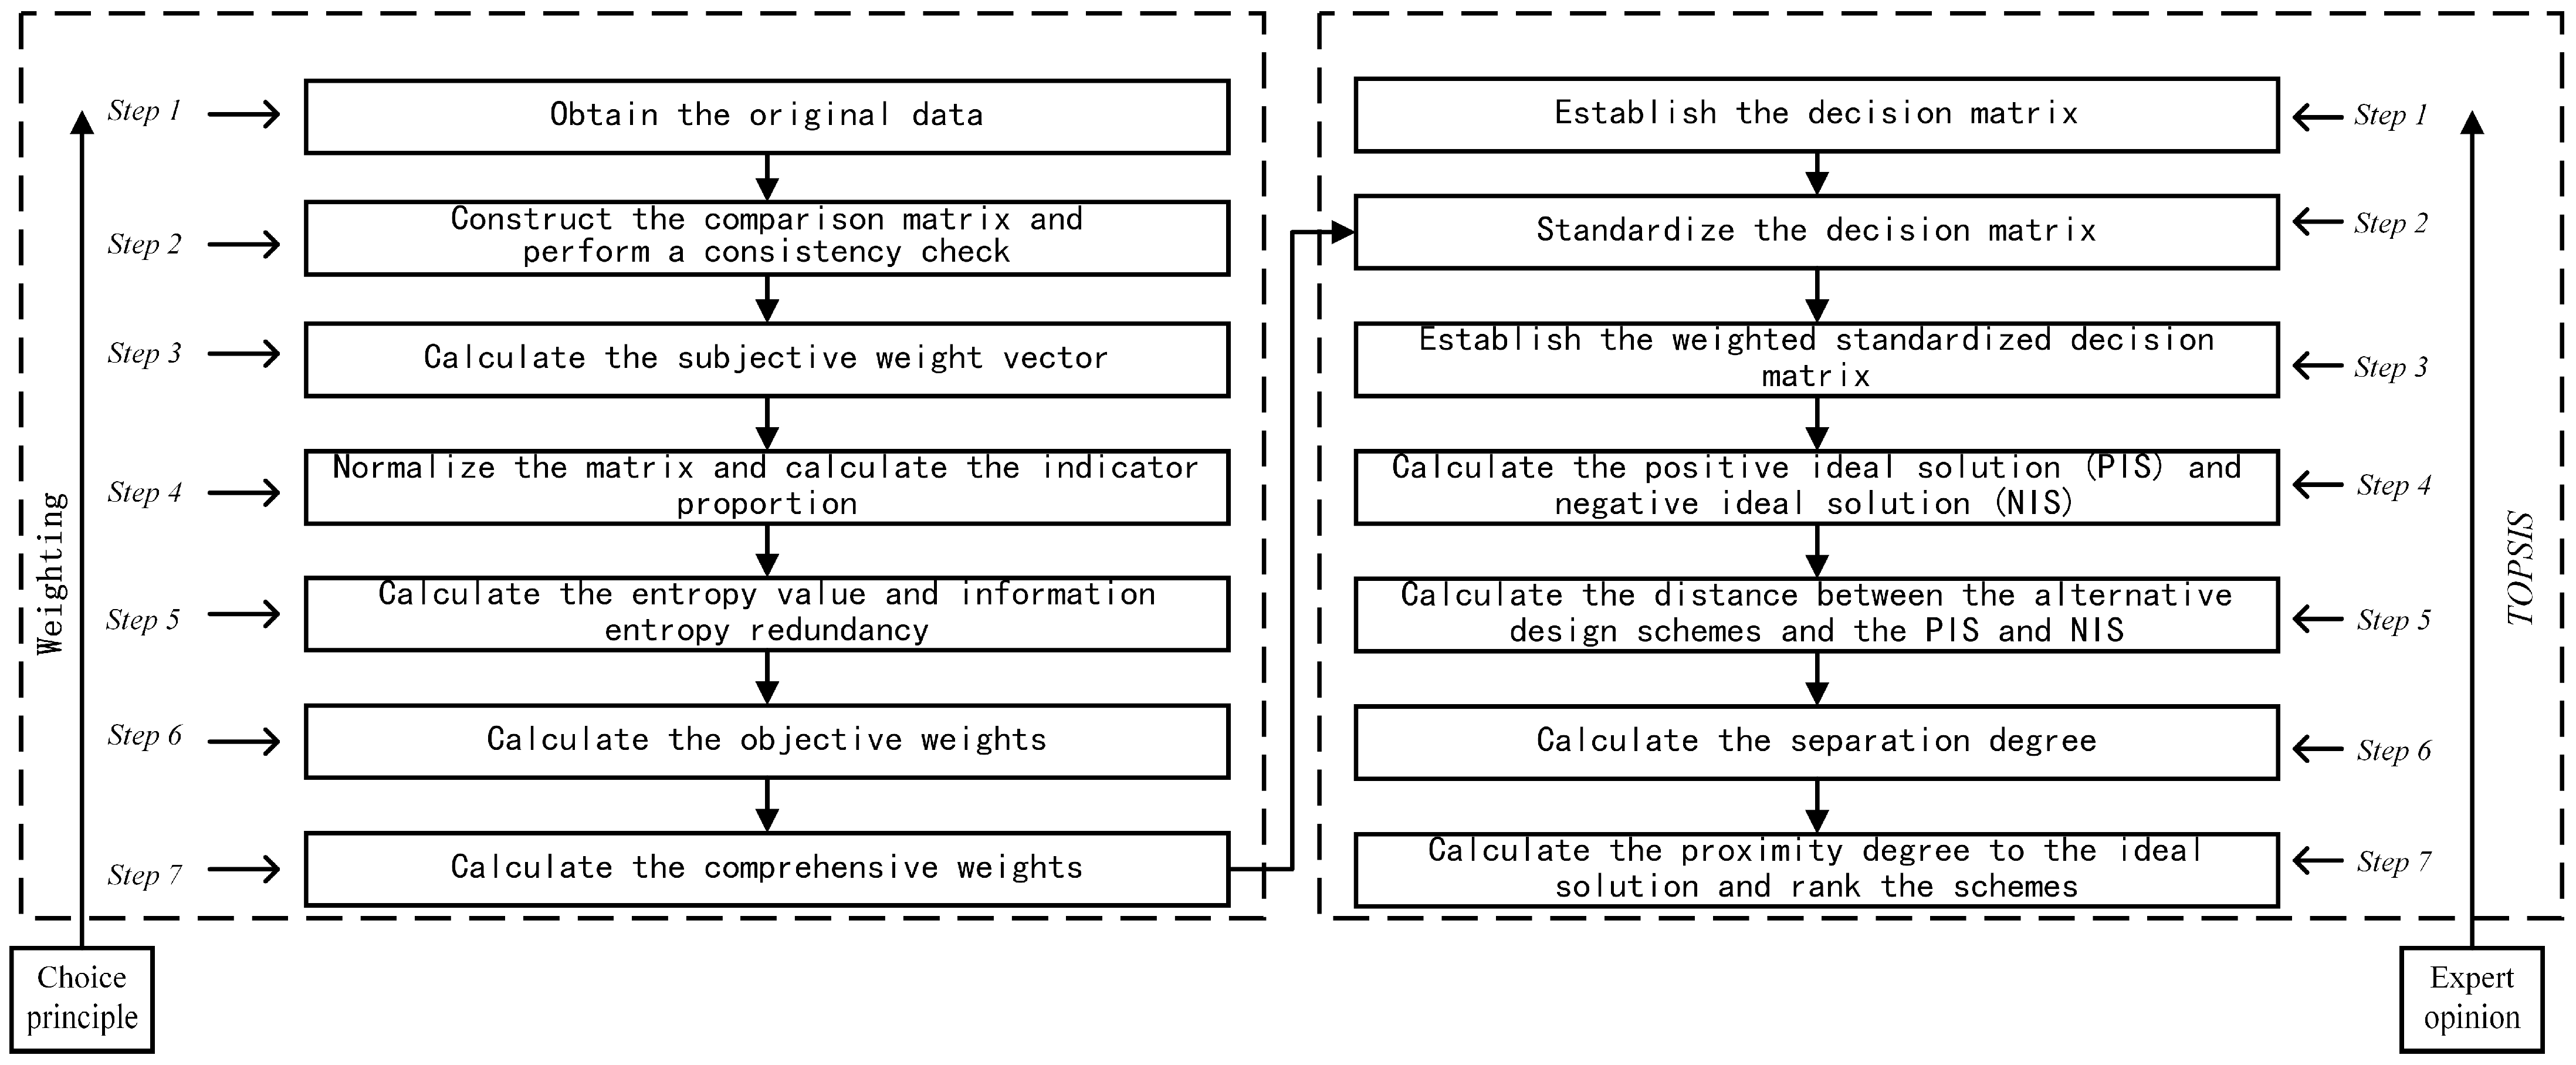
Therefore, on the basis of the existing AHP-based weight determination method, this paper uses the Entropy Weight Method combined with the TOPSIS algorithm [
25] to optimize the decision-making process of the pocket park design scheme. While retaining expert opinions, this paper fully exploits the user experience data and solves the comprehensive weights using a combination of objective–subjective methods. Selecting the best solution based on multiple evaluation indicators is a typical multi-objective decision-making process when evaluating design schemes. The Technique for Order of Preference by Similarity to Ideal Solution (TOPSIS) effectively addresses this issue. This method calculates the distance between the evaluation scheme and the ideal solution and ranks the schemes accordingly. The closer the evaluated design scheme is to the positive ideal solution, and the farther it is from the negative ideal solution, the better the scheme is. Moreover, by integrating the TOPSIS method, which is not influenced by data characteristics, distribution, or sample size, and considering its convenience and practicality, the proposed optimization model for scheme evaluation is more reliable and scientific. The specific operational process is shown in
Figure 3.
3.2. Calculation of Comprehensive Weights
This paper employs a combined objective–subjective approach to increase the objectivity and scientific nature of the weight calculation process. It linearly combines the subjective weights calculated by the AHP with the objective weights calculated by the Entropy Weight Method. By retaining expert opinions, this approach significantly enhances the objectivity of the weight calculation and increases the credibility of the results.
3.2.1. Calculation of Subjective Weights Using the AHP
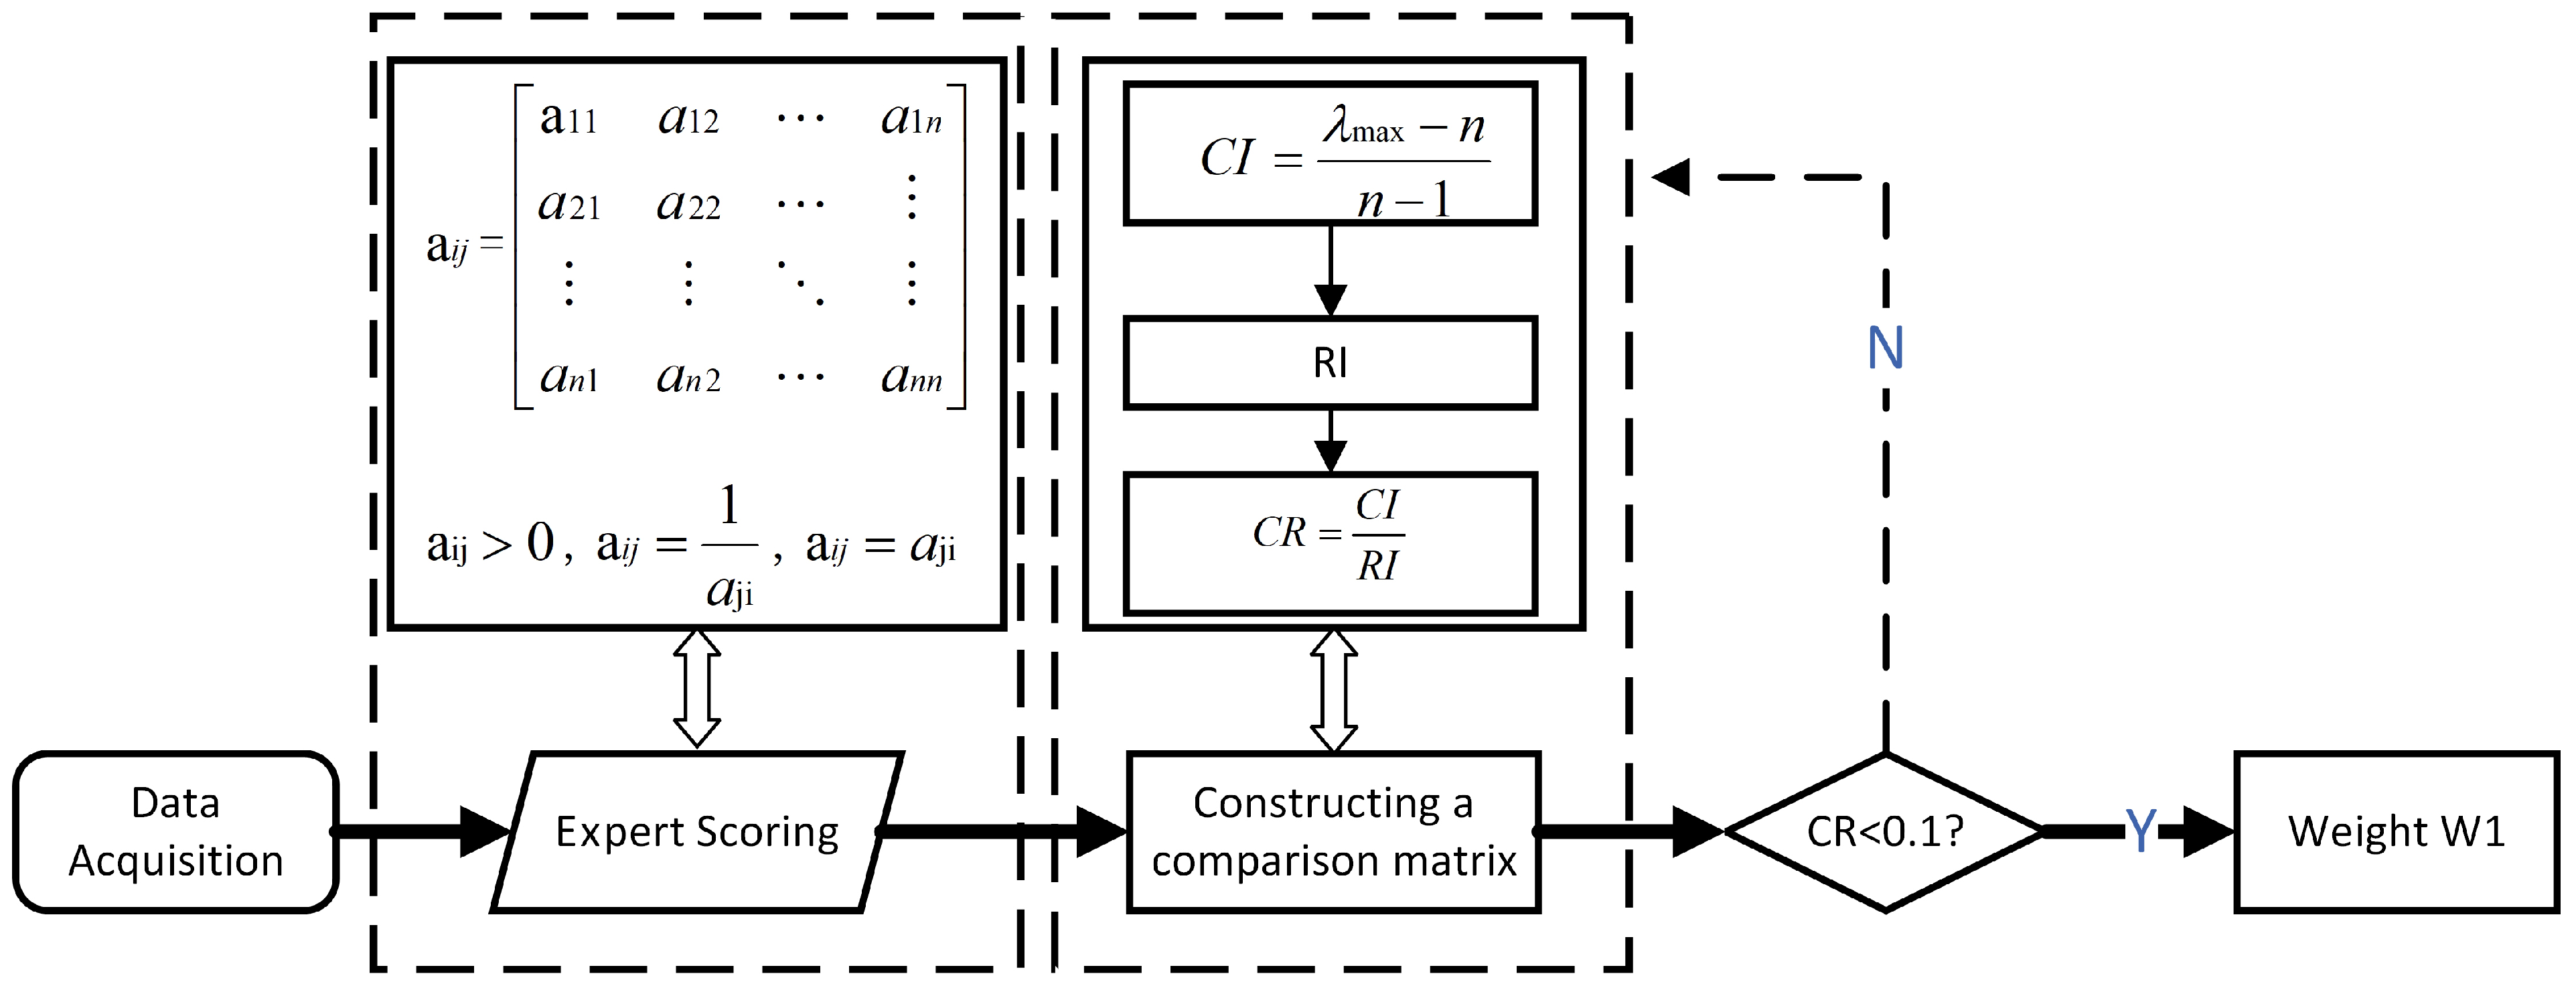
The Analytic Hierarchy Process (AHP) is based on systems engineering theory, which deepens the analysis process. Its core is hierarchical weight decision analysis. The greatest advantage of the AHP is its introduction of the hierarchy concept, allowing users to clearly and comprehensively consider and measure the relative importance of indicators. The AHP treats a complex multi-objective decision problem as a system, decomposing the goal into multiple objectives or criteria and then further breaking them down into multiple levels of indicators (or criteria constraints), which creates a step-by-step indicator hierarchy model from the bottom up [
26].
Assume that the decision problem of a design scheme requires establishing an evaluation set containing
n indicators. This evaluation set consists of
i primary indicators and
j secondary indicators. Experts are invited to score them according to the Saaty nine-point scale method (
Table 2), forming a comparison matrix and performing a consistency check, the corresponding random index values for different order matrices are shown in
Table 3. Here,
represents the influence degree of the
i-th indicator on the
j-th indicator. The specific operational process is shown in
Figure 4.
3.2.2. Calculation of Objective Weights Using the Entropy Weight Method
The steps for calculating the weights using the Entropy Weight Method to modify the AHP weight assignment are shown in
Figure 5.
Construct a rating matrix
based on the original scores for
n indicators from
m users:
where
represents the score given by the
l-th user for the
j-th indicator.
Normalize the matrix to obtain
:
where
;
.
Calculate the proportion of each indicator
P, where
is the proportion of information provided by the
l-th user for the
j-th indicator:
Calculate the entropy value for indicator
j:
Calculate the information entropy redundancy (difference):
Calculate the weight for each indicator:
3.2.3. Calculation of Comprehensive Weights
After obtaining the subjective and objective weights through the abovementioned calculations, the comprehensive weight is calculated using Equation (7). The calculation process for both weights is shown in
Figure 5:
where
τ is the proportional coefficient. In calculating the comprehensive weight, both the subjective weight calculated by the AHP and the objective weight calculated by the Entropy Weight Method should be considered [
27]. To better reflect the importance of user experience in the evaluation system, it is recommended to set
τ = 0.4. The final formula for calculating the comprehensive weight is as follows:
3.3. TOPSIS Method for Design Scheme Evaluation and Optimization
Based on the established evaluation system for specific pocket park design schemes, the evaluated schemes are denoted as D, with a total of n schemes, and the evaluation indicators are represented as . denotes the score for the j-th indicator of the i-th scheme.
Invite experts or relevant industry personnel to score the evaluation schemes and the scores from the decision matrix:
- 2.
Standardizing the Decision Matrix
- 3.
Establishing the Weighted Normalized Matrix
where
represents the weight of the
j-th indicator, calculated using Equation (8) (above).
- 4.
Determining the Positive and Negative Ideal Solutions
- 5.
Calculating the Distance Measures
The distances of each design scheme from the positive and negative ideal solutions are calculated using the n-dimensional Euclidean distance:
where
represents the distance between the evaluation target and the ideal solution. The smaller
is, the closer the scheme is to the ideal solution, indicating a better evaluation scheme.
represents the distance between the evaluation target and the negative ideal solution. The larger
is, the better the scheme is, as it is further from the negative ideal solution.
Calculating the Ideal Fit Degree
The schemes are then ranked based on the degree of ideal fit. The higher the value of , the better the scheme is. The scheme with the highest value is the optimal evaluation scheme.
4. Example Validation
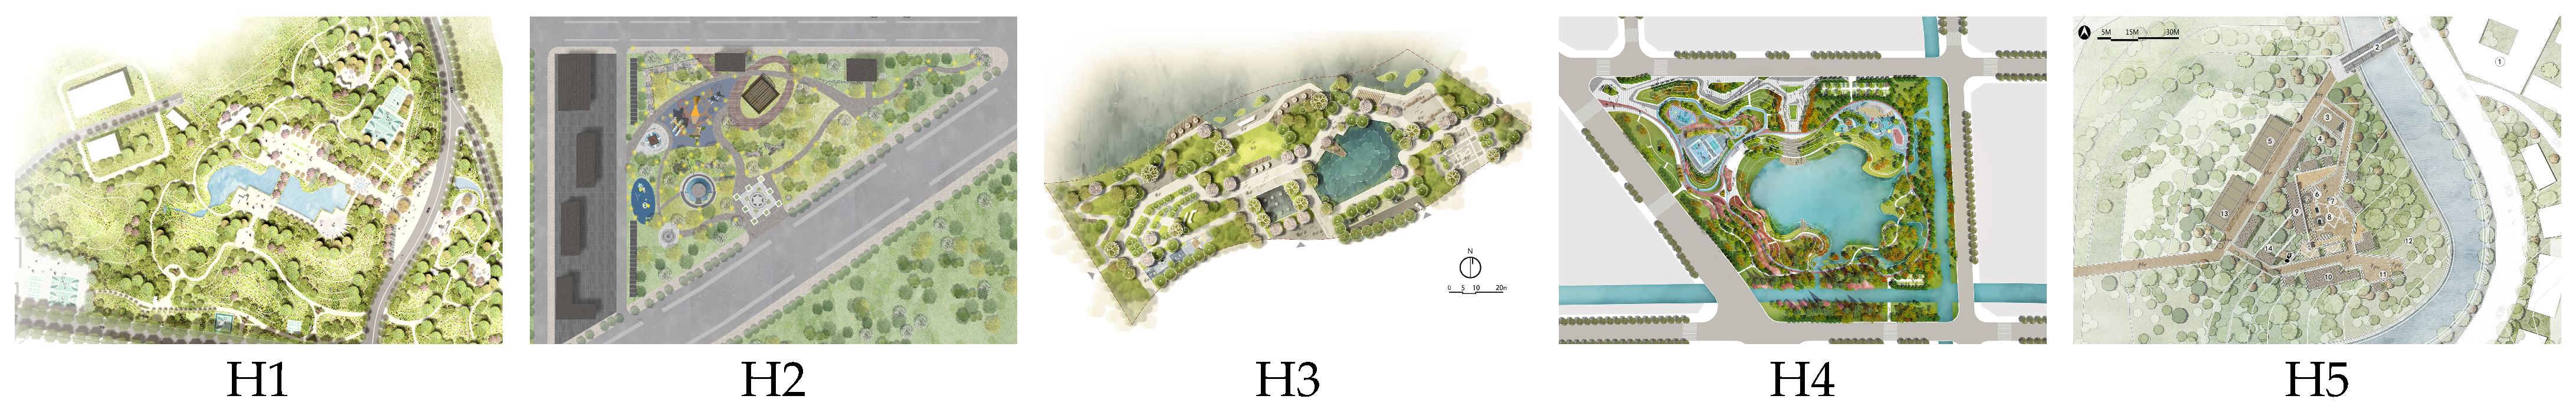
In this paper, the design process of a pocket park in an urban area of Xi’an was chosen as a case study. Five design schemes were initially proposed, labeled H1 to H5 (
Figure 6). These five schemes need to be evaluated and optimized to select the best design as the final solution. Following the abovementioned procedure, the proposed pocket park design evaluation and optimization model is applied to these schemes.
We use a five-point Likert scale. A scoring team comprises five design students, five university professors, and five residents. The team scores 24 evaluation indicators for the five pocket park design schemes. The final score for each scheme is calculated as the average of all the scores given by the scoring team members. The scores for all schemes are shown in
Table 4.
4.1. Comprehensive Weighting of Cases
Using the AHP, the subjective weights of the indicators are calculated based on expert scores, with the results shown in
Table 5. The objective weights of each evaluation indicator are calculated using the Entropy Weight Method (as shown in
Table 6). The comprehensive weights are then calculated by linearly combining the weights from
Table 5 and
Table 6 using the comprehensive weight Equation (8) to obtain the results (
Table 7).
4.2. TOPSIS Scheme Optimization
Using the TOPSIS algorithm, the five design schemes (H1 to H5) are evaluated and optimized based on the data in
Table 4. The comprehensive weight data from
Table 7 are applied in Equation (11) to establish the weighted normalized matrix. The final evaluation data for the design schemes are shown in
Table 8, with the visualization of the ranking results presented in
Figure 7. The results show the proximity of each evaluation scheme to the ideal solution, with the ranking as follows: H1 > H5 > H2 > H3 > H4. Therefore, design scheme H1 is ultimately selected as the optimal scheme for further refinement.
4.3. Optimization of the Selected Scheme
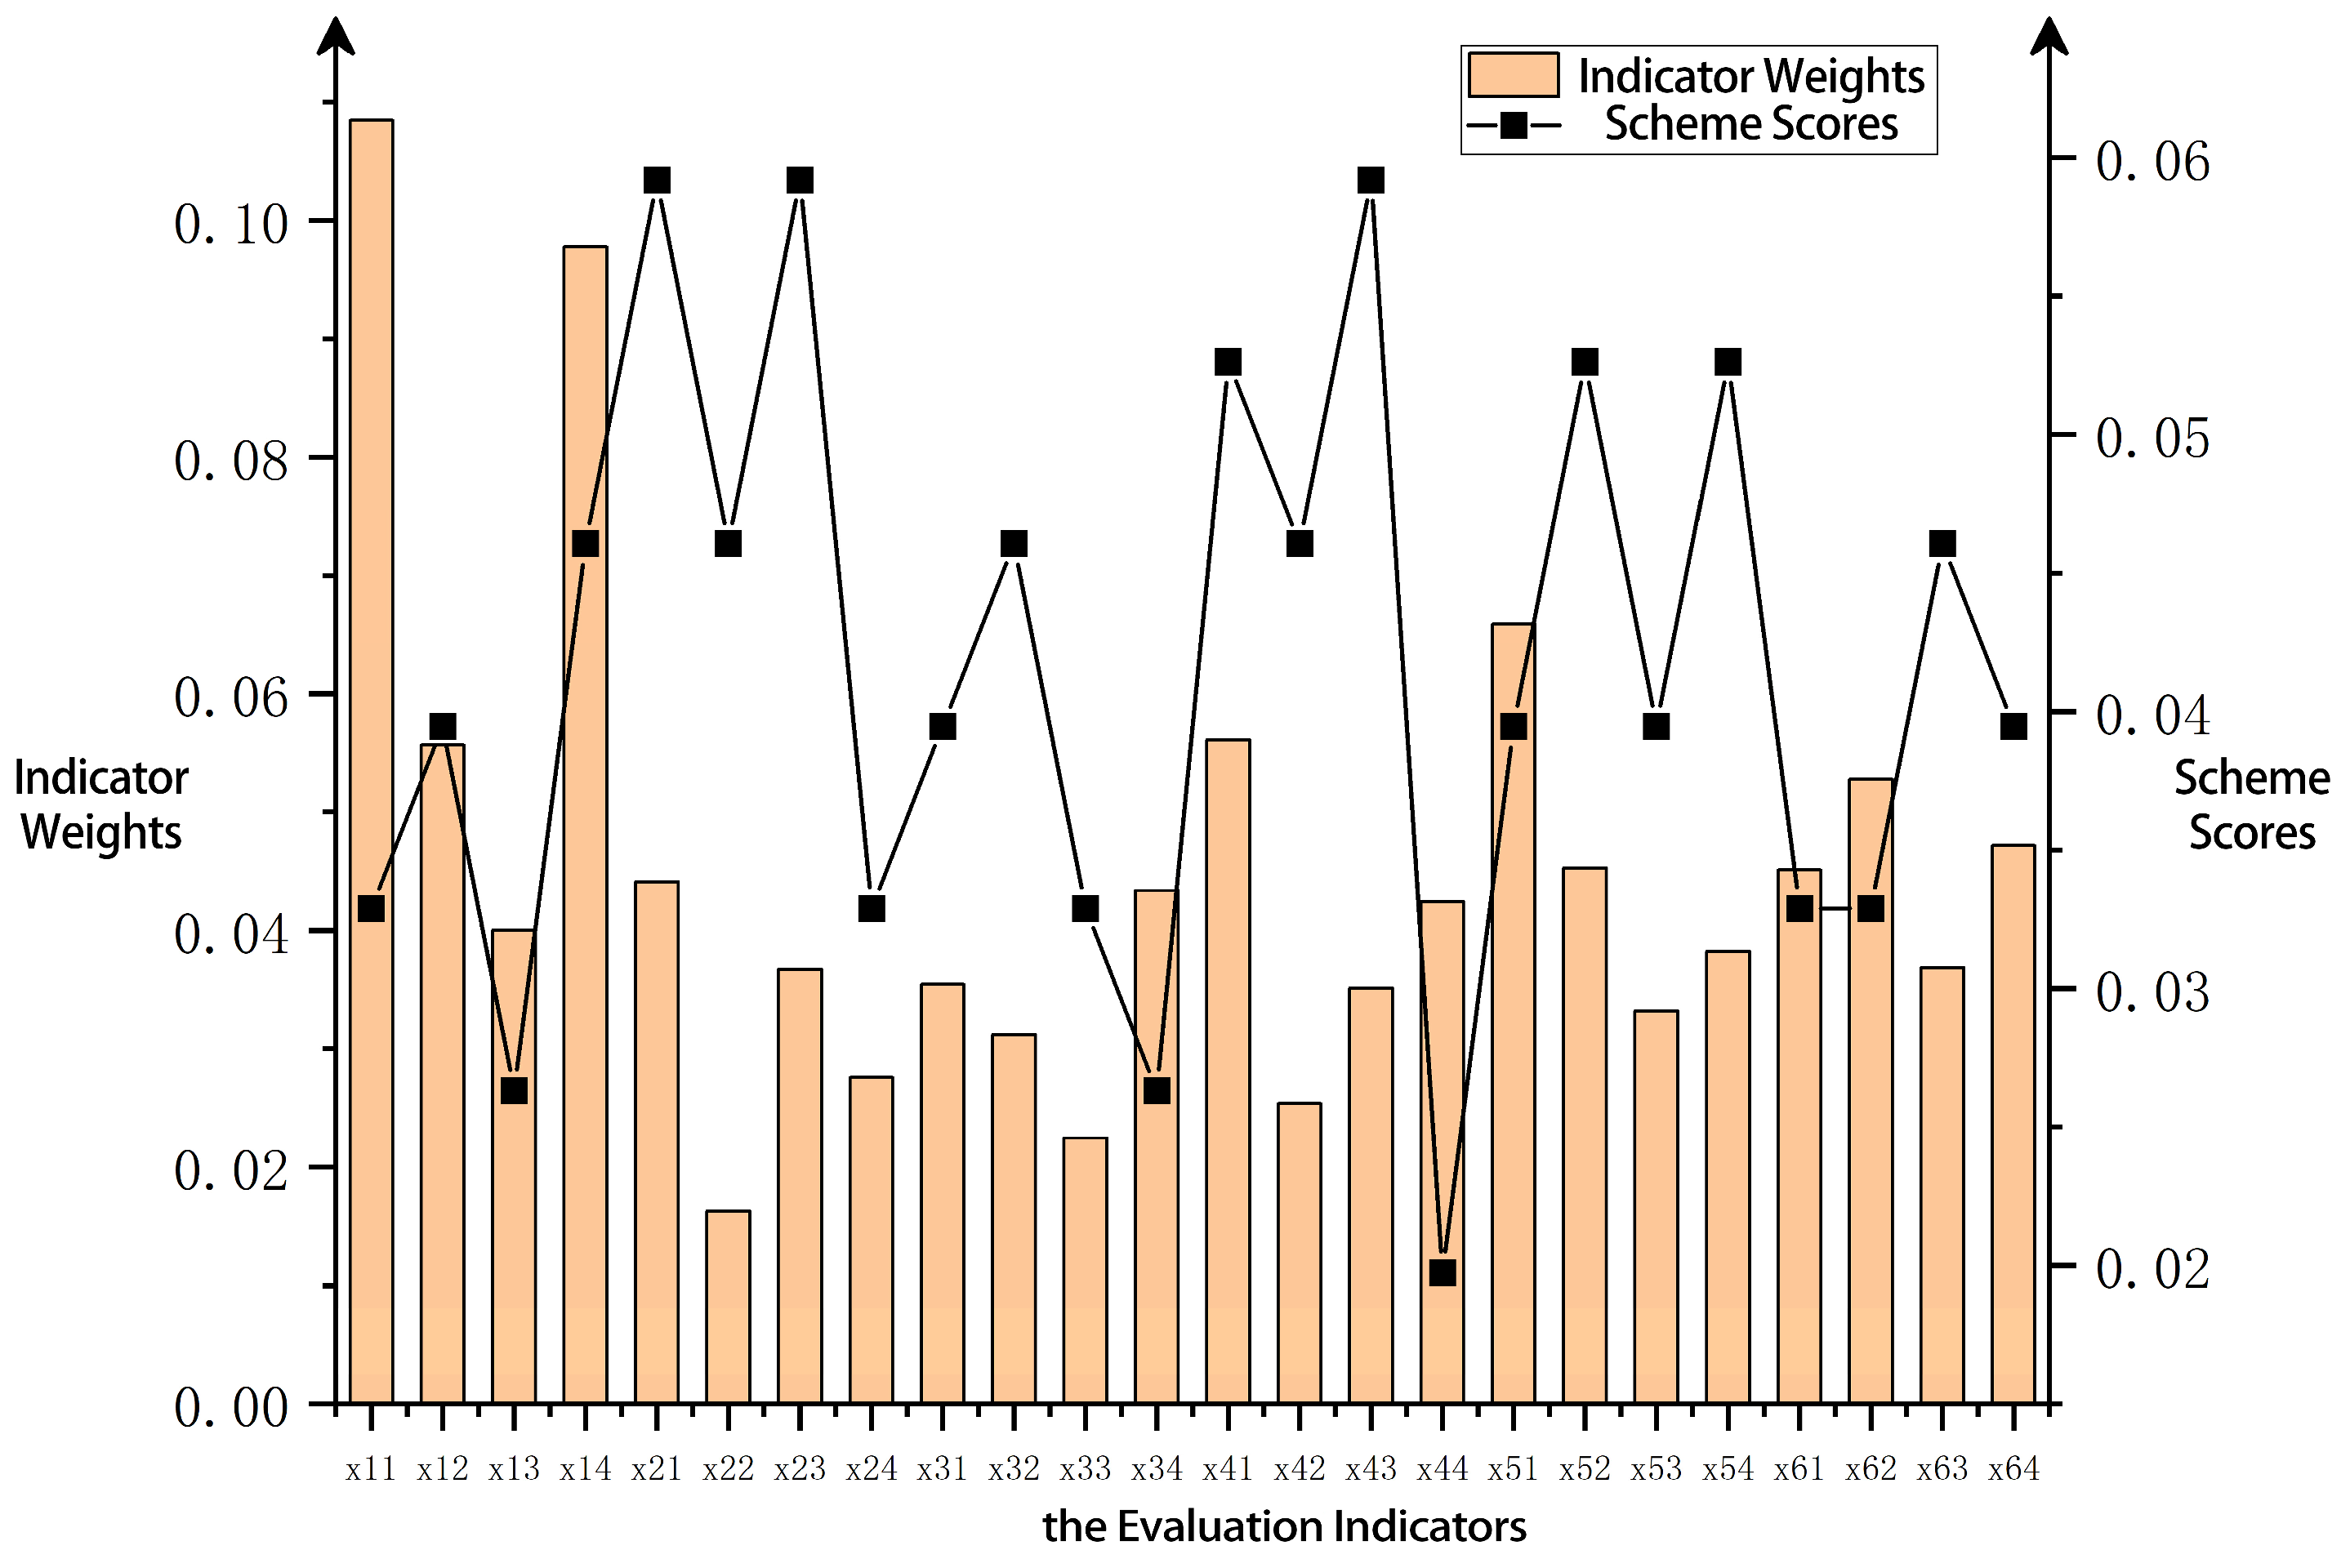
The selected pocket park design scheme (H1) is further refined. First, the score matrix of the design scheme is normalized based on the evaluation indicators. Next, the design scheme scores and indicator weights are plotted using a dual Y-axis graph in Origin software (version 2022), with evaluation indicators as the X-axis, as shown in
Figure 8.
An analysis of
Figure 8 reveals that the evaluation indicators X11 and X44 for design scheme H1 have relatively high indicator weights but low scores, which do not meet the design requirements. According to
Table 1, the evaluation indicators X11 and X44 correspond to the functionality targeting and material texture beauty of scheme H1, respectively. Therefore, optimization should focus on these two indicators.
To address the insufficient functionality targeting of the scheme, the design area is located in a triangular zone with surrounding residential areas. After completion, it will provide a recreational and entertainment space for nearby residents and the public. The walkway not only connects the roads but also links people with nature. The park’s pathways incorporate straight and curved designs, creating richer spatial layers. Native tree species are predominantly selected for planting, combining trees, shrubs, and grasses, ensuring seasonal interest. At night, LED breathing gradient lights are installed along the pathways to accommodate older adults and children, creating an ambience while making it easier for pedestrians to enjoy the space and rest, reflecting a human-centered approach.
To improve the scheme’s material texture beauty, the space size was carefully considered when designing the pavements, and vibrant colors were chosen to highlight the city’s vitality. For such a small space, rough paving materials are not suitable. Instead, refined, smooth materials were used, which are more approachable and comfortable for the public. Pavement design is one of the most direct and effective methods to improve the park’s environmental quality.
4.4. Discussion
This study proposes an optimization decision framework for pocket park design solutions by constructing an AHP–Entropy Weight Method–TOPSIS hybrid model. The following three aspects are discussed in terms of methodological innovation and limitations:
This study quantified the evaluation indexes of pocket park design solutions through the construction of the index system. This study carried out the optimization of design solutions through a multi-attribute decision-making method. Compared with the traditional method based on experts’ experience and questionnaires, the objective reliability of the evaluation results is significantly improved. Despite this, the method of this paper may be slightly insufficient compared with the macro method of big data. However, the method of this paper occupies a significant advantage in decision-making cost. At the same time, compared with the traditional TOPSIS method, the method proposed in this paper is based on the combination of the AHP and Entropy Weight Method to optimize the weights. The combination method can effectively guarantee the expert’s opinion while reducing the randomness of the expert’s direct assignment by quantifying the discrete degree of index data. This research echoes the concept of “data-driven design balance”.
Although the model shows significant advantages, it still has the following shortcomings: (1) This study only evaluates the scheme selection in the design phase, and in the future it is necessary to track the sustainable performance of the completed park with the post-use evaluation to form the closed-loop optimization of “design-operation”. (2) The acquisition of evaluation data in this paper relies on user and expert evaluations, which require higher costs when there are a large number of design options. (3) The determination of weights in this paper cannot be universal due to the existence of expert opinions. Therefore, in future research we will continue to optimize the existing methods and try to explore automated expert knowledge extraction techniques based on large language models in combination with artificial intelligence and further enhance the reliability of the results in this paper in combination with objectivity methods such as neural networks.
5. Conclusions
The AHP–Entropy Weight Method–TOPSIS hybrid decision model constructed in this study provides a quantifiable and transferable assessment framework for pocket park design optimization.
The innovations of this study are mainly reflected in the following two points: (1) We constructed an evaluation index system for pocket park design options based on 6 first-level and 24 second-level evaluation indexes. (2) This study combines expert experience (AHP) and data-driven weighting (Entropy Weight Method), and the model effectively balances subjective preferences and objective indicator discretization, which solves the problem of insufficient adaptability of traditional methods in complex urban scenarios.
This study confirms that the science of small- and micro-space design decisions can be significantly improved through the algorithmic fusion of subjective and objective data. However, the real value of the model needs to be realized in cross-cultural and cross-scale continuous validation, which also points out the innovation path of technology–humanities synergy for the next generation of smart city design tools.


