Abstract
The prefabrication and assembly of rebar parts can reduce construction costs and time while enhancing construction quality and safety. The primary objective of this paper is to quantify the overall stiffness of rebar parts. A three-dimensional rotational stiffness solution model of welded spots is proposed from the perspective of revealing the overall stiffness required for welded rebar parts. Considering the influence of the rebar diameter, 105 sets of T-type welded rebar specimens and two types of loading devices were designed, and a graded loading failure test was carried out. On this basis, the constitutive model of welded spots and the method for evaluating the model parameters are presented. Moreover, in order to verify the rationality of the proposed constitutive model and its parameter values, the deformation of welded rebar parts for the middle pylon of Changtai Yangtze River Bridge was tested onsite. The results show that analyzing the three-dimensional rotational stiffness of welded spots is the key to obtaining the overall stiffness of welded rebar parts, and its rotational stiffness decreases rapidly after an elastic platform. The constitutive model parameters of welded spots such as initial stiffness, elastic rotation angle, and stiffness degradation rate conform to Gaussian distribution. When the model parameters of welded spots are taken as the mean value of the distribution function, the simulated values are basically in good agreement with the measured values, with a maximum error of only 8.54%, indicating that the proposed constitutive model can better quantify the overall stiffness of the welded rebar parts.
1. Introduction
At present, manual binding in situ after processing into units in the factory is the most common construction mode for the steel rebar of pylons with cast-in-place concrete, which involves high labor requirements, a high safety risk due to aerial work, a low construction efficiency, and compromised quality control [1]. Against the background of rapid rising labor costs, a shortage of skilled workers, and a strong demand for high-quality development, the traditional construction mode has been unable to meet the requirements of industrial construction [2,3,4,5]. Therefore, prefabricated and assembly technology for rebar parts is proposed [6]. Its core concept involves modular design, factory production, assembly construction, and intelligent control. Specifically, after the rebar skeleton is split into several rebar mats or rebar cages, it is processed and molded in advance using special intelligent equipment in the factory and then transported to the site for assembly. Thus, we can achieve a transformation from high-altitude operation in complex environments to pipeline production in the factory and greatly improve the efficiency and quality of rebar construction [7,8].
Once prefabricated and assembly technology for rebar was suggested, it was quickly popularized and applied in concrete structures such as pylons, piers, capping beams, and box girders [9,10,11,12,13]. According to Simonsson and Emborg, approximately 50% of the total construction costs for bridge infrastructure comes from rebar and pouring concrete in situ. They comment that from an ideal theoretical point of view, the reduction in time spent onsite can achieve up to 80% savings [14]. Park et al. [6] proposed a method for assembling the rebar parts of the pier cap beam, which eliminated mutual interference in rebar between the coping and pier to meet design requirements. Pacheco et al. [11] divided the bottom rebar of the box girder with cast-in-place concrete into several rebar parts with a length of 12 m and greatly improved the construction efficiency through the prefabrication and assembly of rebar parts.
The production method for rebar parts involves binding and welding. The stiffness of binding rebar parts is low, and the rebar spacing is easy to change during transportation and hoisting [14]. In addition, binding is more difficult to automate than welding. Therefore, the rebar parts of pylons are basically formed by welding [15,16]. In many welding processes, CO2 gas-shielded welding separates the molten metal from the air to prevent the oxidation of the molten metal. It has the advantages of good welding quality, excellent shape, and high toughness. Additionally, it is easy to achieve the automatic operation of the equipment [17]. The welded rebar parts of pylons are divided into several segments, which are prefabricated in the factory and transported to the construction site for assembly. In this process, the welded rebar parts need to undergo multiple hoisting operations, and the main rebar connection of the upper and lower segments of the welded rebar parts needs to be achieved by means of taper sleeve locking connection [18,19,20]. The overall stiffness of the rebar parts will directly affect the hoisting safety and the difficulty of the alignment connection. In addition, a pylon is generally a multi-limb structure, and each limb has a certain inclination. The overall stiffness of the rebar parts will also further affect the structural alignment and the thickness of the concrete cover. Therefore, the quantitative calculation for the overall stiffness of rebar parts is particularly important.
A series of studies have been carried out on rebar parts. Devine et al. [14] investigated the change in rebar spacing in two-dimensional rebar mats and three-dimensional rebar cages made by binding during transportation and the final placement of prefabricated rebar assemblies, and the influence of the number of rebar layers, the type of transverse rebar, and the thickness of the rebar cage on the change in rebar spacing has been analyzed. Giudice et al. [21] studied the mechanical properties of concrete columns with rebar parts by numerical simulation and a scale model test. Yuan et al. [22] proposed two methods to process the point cloud for rebar parts in a box girder. The average errors for spacing and angle were less than 2 mm and 0.1°, respectively, which could be used in the production and installation quality control of rebar parts. With the rapid development of industrialized and intelligent construction, prefabricated rebar components have been widely adopted and represent a growing trend. However, although existing research has investigated the deformation and stability of tied rebar components, studies on welded rebar components remain unreported.
In this paper, we first reveal the essential stiffness of welded rebar parts, then a mechanical constitutive model of welded spots and its evaluation method are constructed through experiments and theoretical analysis and verified through application in the middle pylon of Changtai Yangtze River Bridge. The findings of this study will provide a theoretical foundation for the design and construction of welded rebar components, offering significant practical value. In addition, the research ideas of this paper can be further extended to stainless rebar parts, which have the characteristics of durability and resistance to corrosion [23,24,25,26,27,28,29].
2. Theoretical Analysis of the Overall Stiffness of Welded Rebar Parts
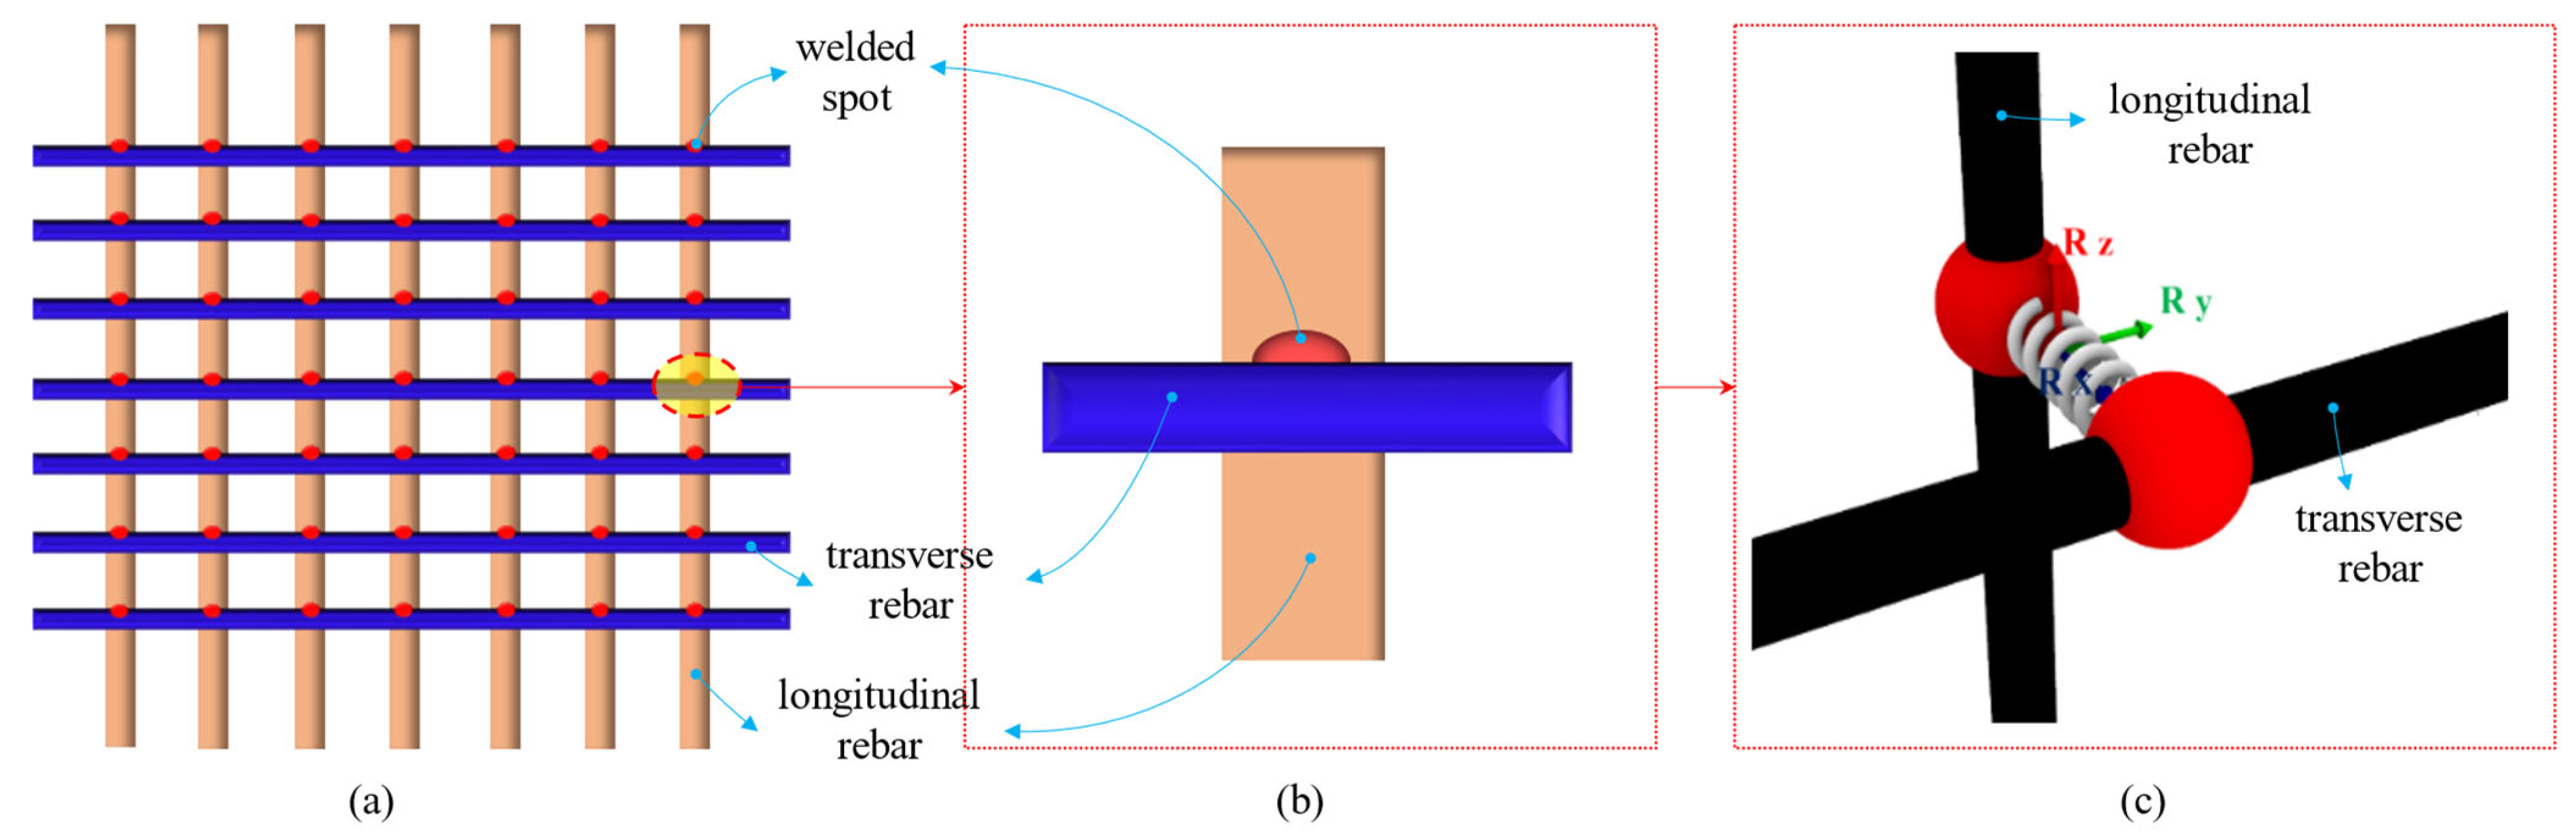
The main types of welded rebar parts are the rebar mat and rebar cage, and the intersection of the longitudinal rebar and transverse rebar is fixed by welding. Analyzing the three-dimensional rotational stiffness of welded spots is the key to determining the overall stiffness of welded rebar parts. The three-dimensional rotational stiffness is Rx, Ry, and Rz, respectively (Figure 1). Rx represents the rotational stiffness of the transverse rebar in the plane of the longitudinal rebar and the transverse rebar. Ry represents the rotational stiffness of the longitudinal rebar with the transverse rebar as the rotation axis. Rz represents the rotational stiffness of the transverse rebar with the longitudinal rebar as the rotation axis.
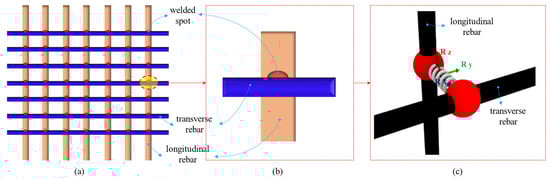
Figure 1.
Schematic of welded spot stiffness: (a) rebar part; (b) welded spot location; (c) three-dimensional rotational stiffness definitions.
3. Rotational Stiffness Experiment of Welded Spot
3.1. Experimental Design
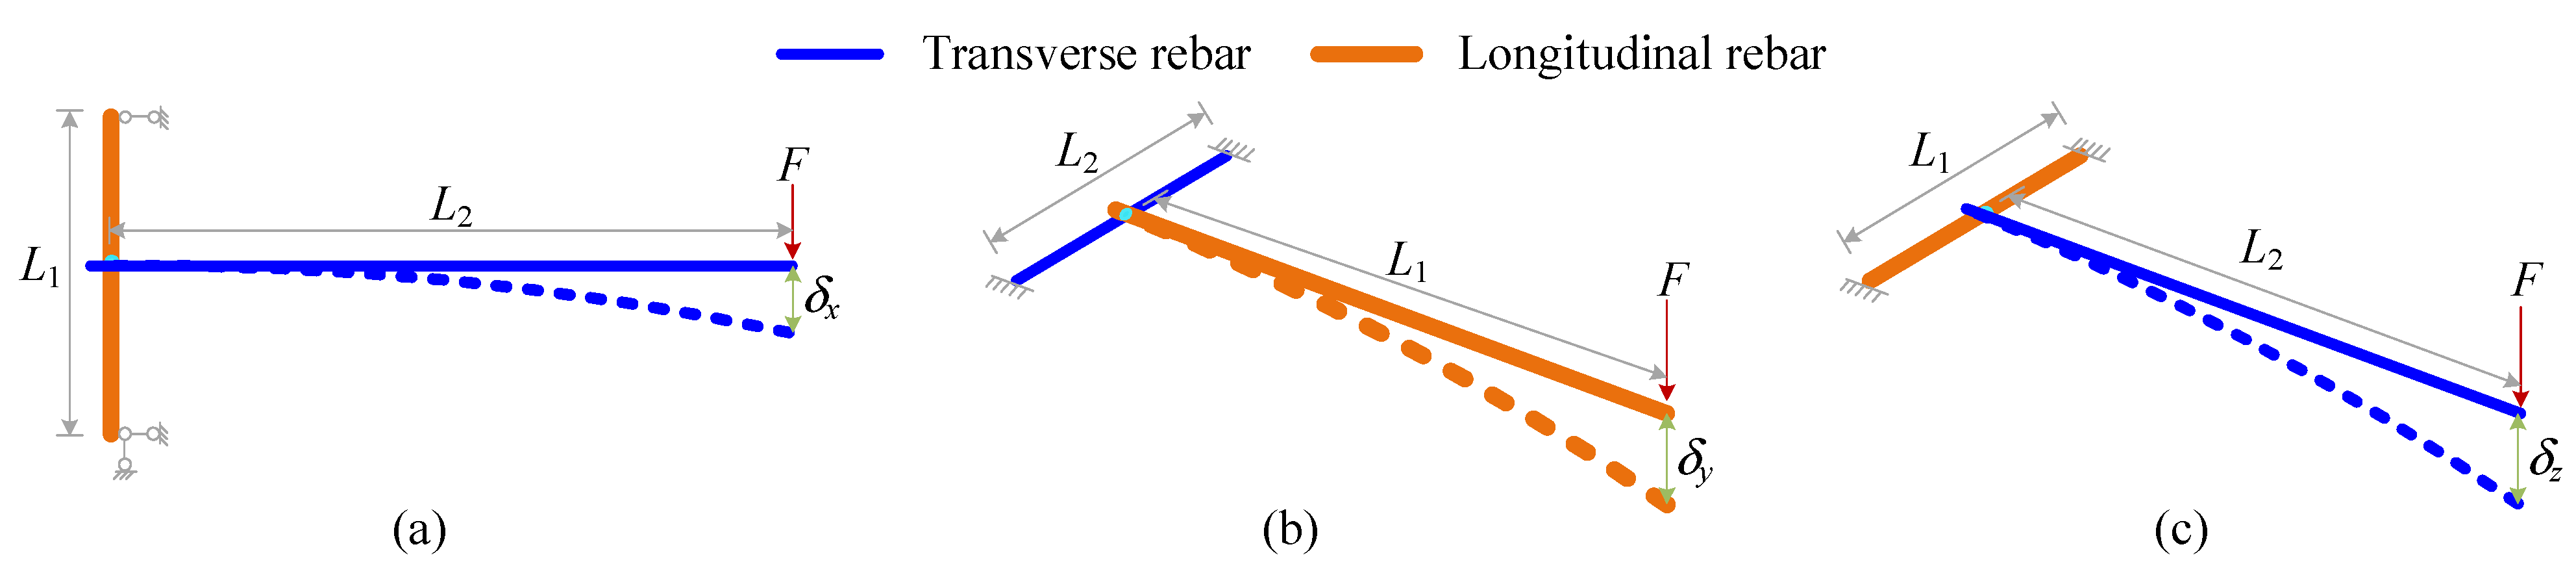
In order to determine the three-dimensional rotational stiffness of the welded spot independently, a mechanical solution model was designed, as shown in Figure 2.
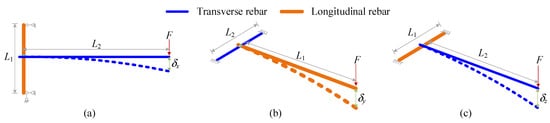
Figure 2.
Mechanics solving model of three-dimensional rotational stiffness: (a) Rx; (b) Ry; (c) Rz.
For the Rx, the two ends of the longitudinal rebar are hinged. The vertical deformation () of the transverse rebar subjected to the force F can be determined as follows:
where L1 and L2 are the length of the longitudinal rebar and transverse rebar, respectively; I1 and I2 are the bending inertia moment of the longitudinal rebar and transverse rebar, respectively; E is the elastic modulus of the rebar; and is the rotational angle of the transverse rebar in the plane of the longitudinal rebar and the transverse rebar.
For Ry, the two ends of the transverse rebar are consolidated. The vertical deformation () of the longitudinal rebar subjected to the force F can be determined as follows:
where G is the torsional modulus of the steel rebar; is the torsional inertia moment of the transverse rebar; and is the rotational angle of the longitudinal rebar with the transverse rebar as the rotation axis.
For Rz, the two ends of the longitudinal rebar are consolidated. The vertical deformation () of the transverse rebar subjected to the force F can be determined as follows:
where is the torsional inertia moment of the longitudinal rebar, and is the rotational stiffness of the transverse rebar with the longitudinal rebar as the rotation axis.
Based on the investigation of numerous rebar designs for pylons, four types of very widely used diameter combinations of longitudinal rebar and transverse rebar were selected. The selection of rebar length followed these principles: (1) the directly loaded rebar should not be too short, as this would result in minimal deformation and potentially significant errors; (2) the directly loaded rebar should not be too long, as this could lead to inelastic deformation and reduce the proportion of end deformation caused by rotation, thereby also resulting in significant errors. Based on these principles, the rebar length used in Table 1 was determined through preliminary calculations. A total of 105 specimens were designed, the information for which is shown in Table 1. Among them, the Sx1 group included 50 specimens for probabilistic statistical analysis, and the other groups included 5 specimens.

Table 1.
Specimen information.
The specimens were single-side spot-welded by the CO2 gas-shielded welding process [30,31]. The welding duration was 3 s, and the welded spot position was consistent, as shown in Figure 1. There was no gap between the transverse rebar and longitudinal rebar during welding, and the longitudinal ribs of the rebar were avoided. All welding operations for the specimens were conducted in a windless factory environment.
3.2. Loading Device Design
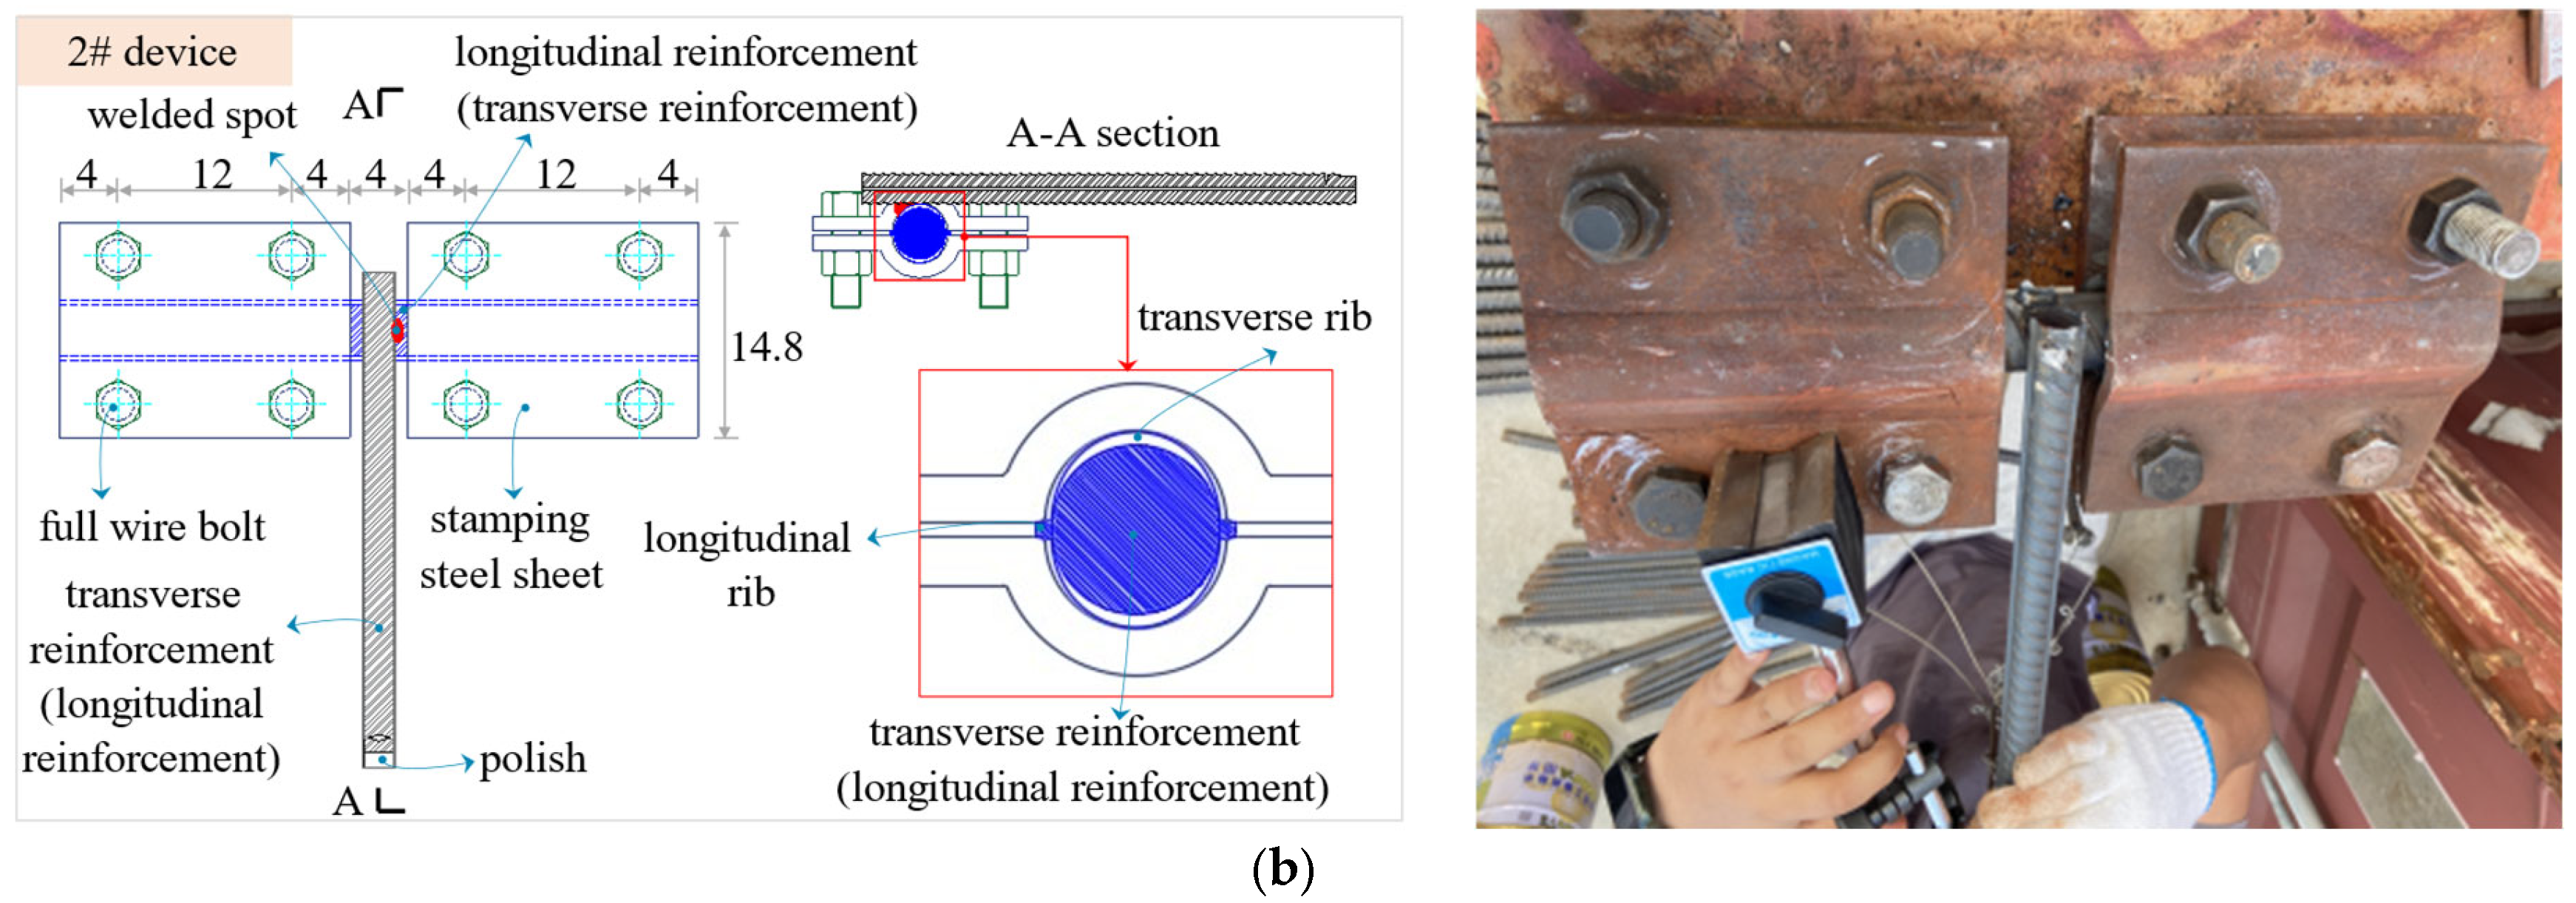
For the proposed mechanics solution model of three-dimensional rotational stiffness, two test loading devices were designed, as shown in Figure 3. 1# device was used for Sx group specimens to obtain the rotational stiffness (Rx). The top plate, bottom plate, and end plate in 1# device work together to build the hinge joints at both ends of the longitudinal rebar. The distance between the top plate and the bottom plate is 30 cm, which corresponds to L1 in Equation (1). 2# device was used for specimens of the Sy group and Sz group to obtain the rotational stiffness (Ry and Rz). Both ends of the restrained rebar (Sy group specimens are transverse rebars, and Sz group specimens are longitudinal rebars) are fixed by full wire bolts and stamping steel sheets with a length of 20 cm and a width of 14.8 cm to ensure consolidation constraints. The net distance of stamping steel sheets is 4 cm, that is, the length of L2 in Equation (2) and L1 in Equation (3). The inner diameters of the circular arc of the stamping steel sheets are matched one by one with the diameter of the constrained rebar, so that they can be tightly constrained to prevent mutual rotation.
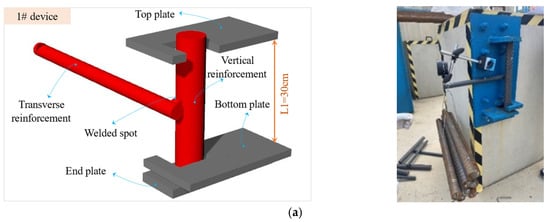
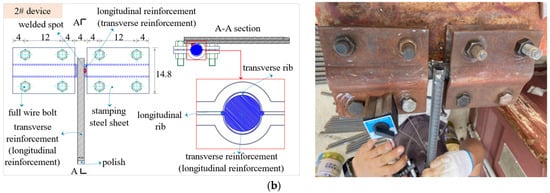
Figure 3.
Test loading device: (a) 1# device; (b) 2# device (unit: cm).
A single steel rebar with a mass of 1 kg was used for graded loading, and the data were read 30 s. after loading. This magnitude of each load increment and the time interval between successive loading stages enabled the acquisition of precise experimental data while maintaining testing efficiency. The vertical displacement was measured by a digital dial gauge with a measurement accuracy of 0.001 mm. In order to prevent deviation in the digital dial gauge during the loading process, the end of the restrained rebar was polished.
3.3. Results and Discussion
The failure of all specimens begins with the fracture of the welded spots. The longitudinal rebar and transverse rebar are always elastic during the loading process. The welded spot is approximately elliptical, and its long axis and short axis are parallel to the transverse rebar and longitudinal rebar, respectively. Figure 4 shows the typical fracture section of welded spots.
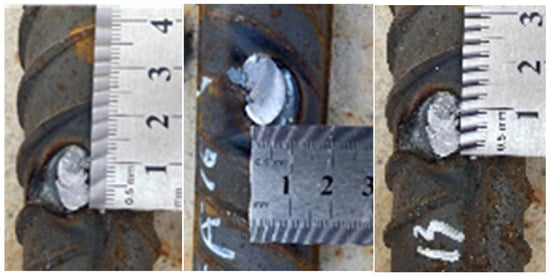
Figure 4.
Typical fracture section of welded spots.
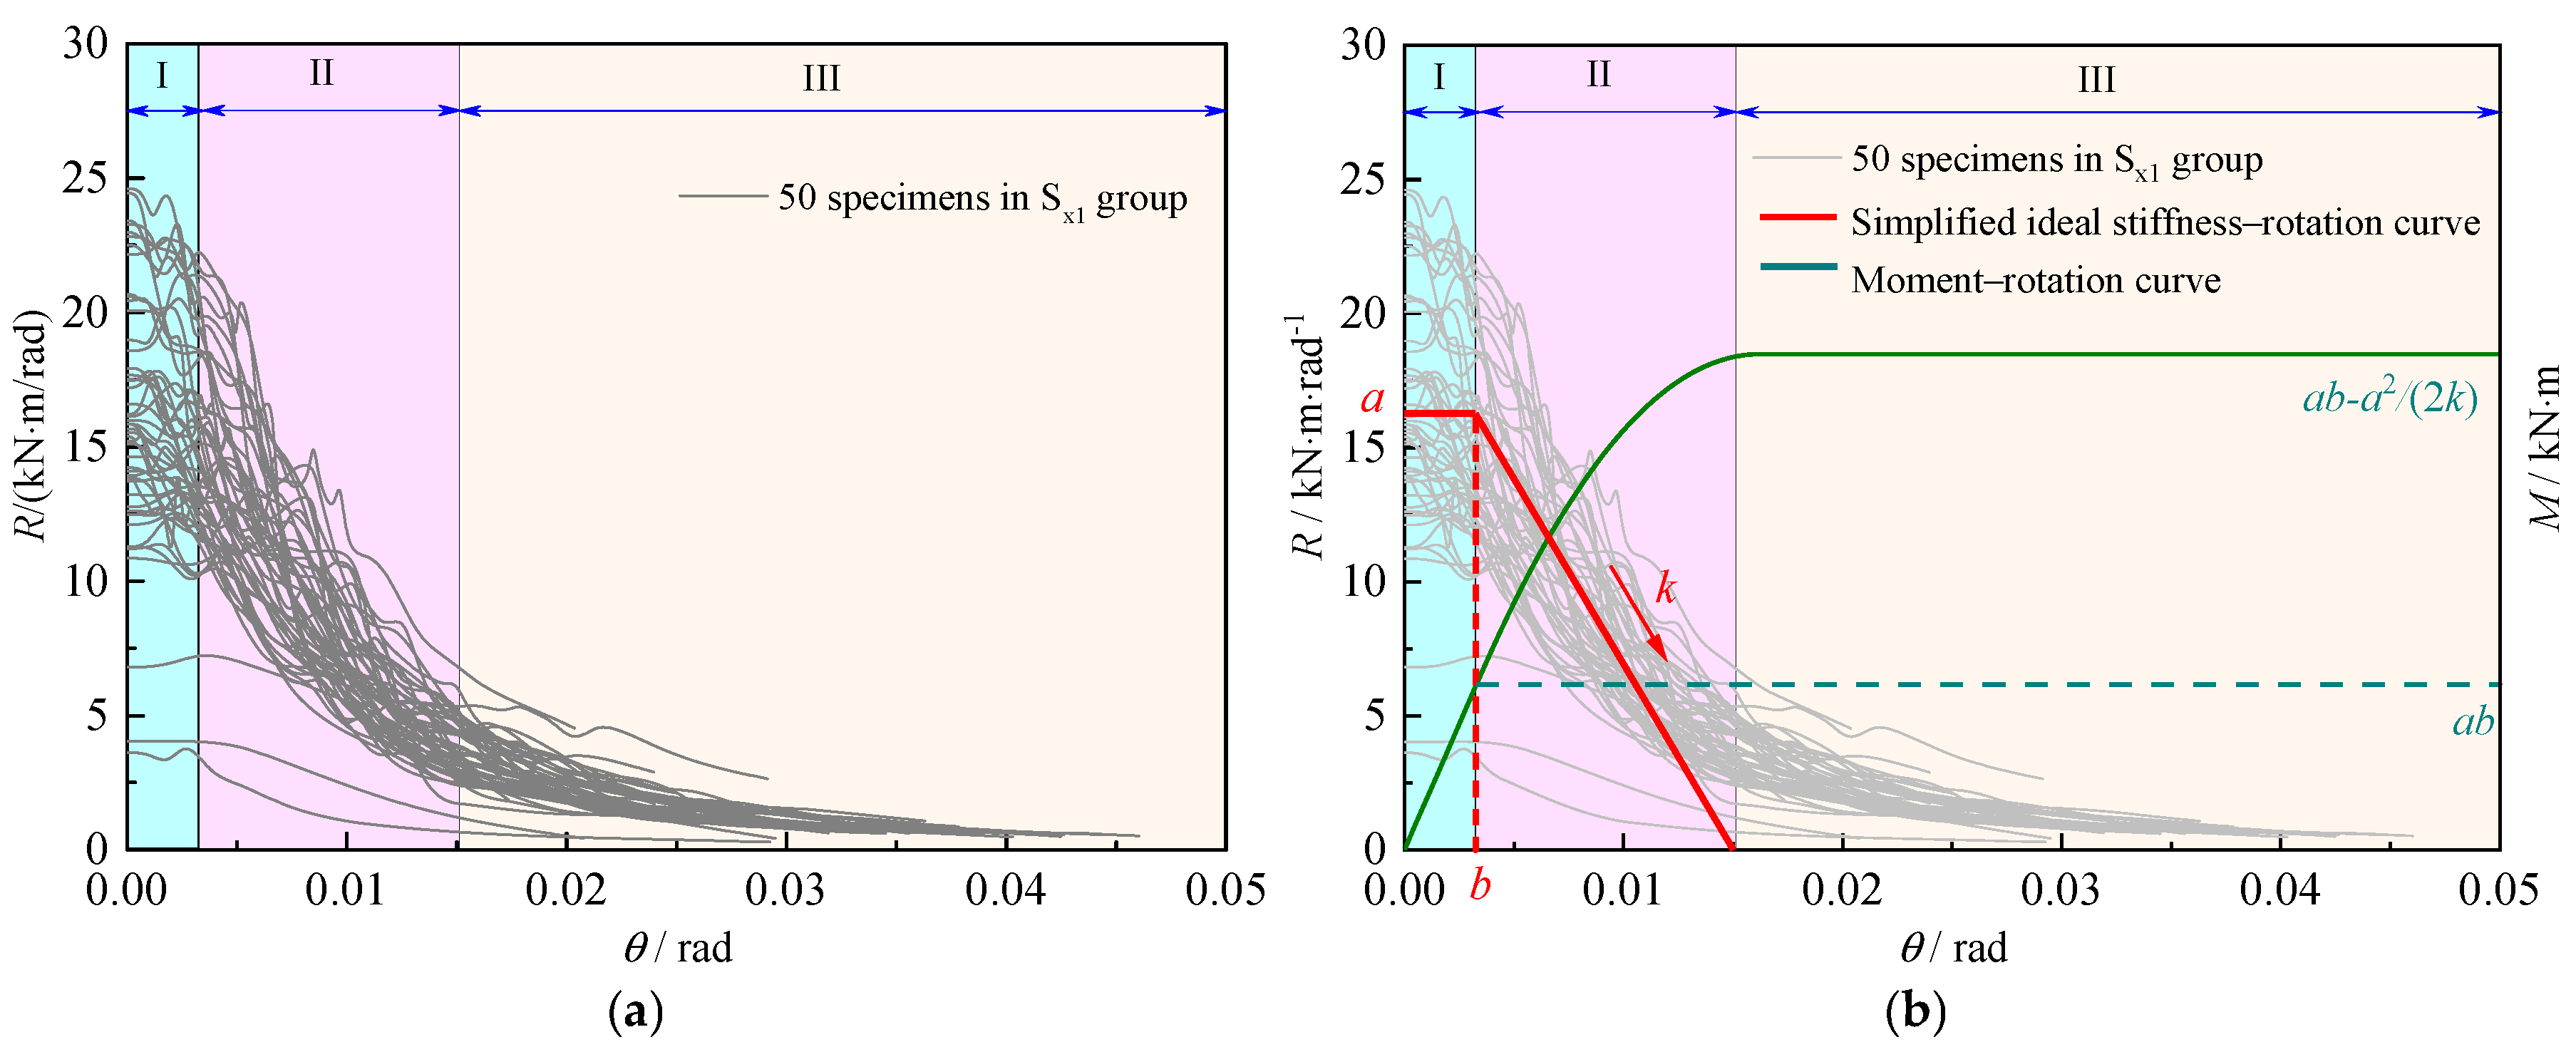
The stiffness–rotation curves of all specimens are basically consistent. Figure 5 shows the stiffness–rotation curves of 50 specimens in Sx1 group: (1) the stiffness–rotation curve of the same group specimens shows a certain discreteness; (2) the stiffness–rotation curves can be divided into three stages: the initial elastic stage (I), stiffness degradation stage (II), and residual stiffness stage (III). Among them, the characteristics of the initial elastic stage are basically unchanged in stiffness, as the welded joint remains in the elastic phase; the main characteristic of the stiffness degradation stage is that the stiffness decreases rapidly with the increase in the rotation angle, indicating that the welded joint has entered the hardening phase after yielding; the main characteristic of the residual stiffness stage is that the stiffness continues to decrease with the increase in the rotation angle, but the rate of decrease is very slow, signifying that the welded joint is gradually entering the failure phase. It is worth noting that during the residual stiffness stage, the specimens cannot be self-stabilized even when the load does not increase. In addition, the rebar remains in the elastic stage until the specimen fails.
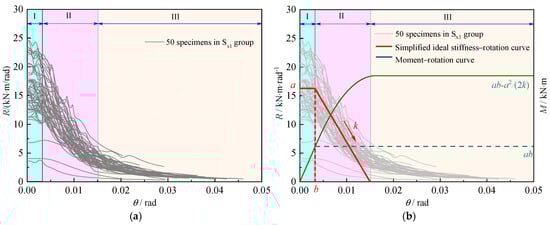
Figure 5.
Analysis of test results: (a) stiffness–rotation curves; (b) moment–rotation constitutive model (where I denotes the initial elastic stage; II denotes stiffness degradation stage and III denotes residual stiffness stage).
4. Establishment of Moment–Rotation Constitutive Model of Welded Spots
4.1. Moment–Rotation Constitutive Model
From the stiffness–rotation curve of the welded spot shown in Figure 5a combined with the actual engineering application, a simplified ideal stiffness–rotation model [32] was established in Figure 5b. The simplified stiffness–rotation model consists of a flat line in the initial elastic stage and an oblique line in the stiffness degradation stage. Because the stiffness in the residual stiffness stage is small and the specimens cannot be self-stabilized, the stiffness in this stage is not considered. The simplified ideal stiffness–rotation model can be expressed as follows:
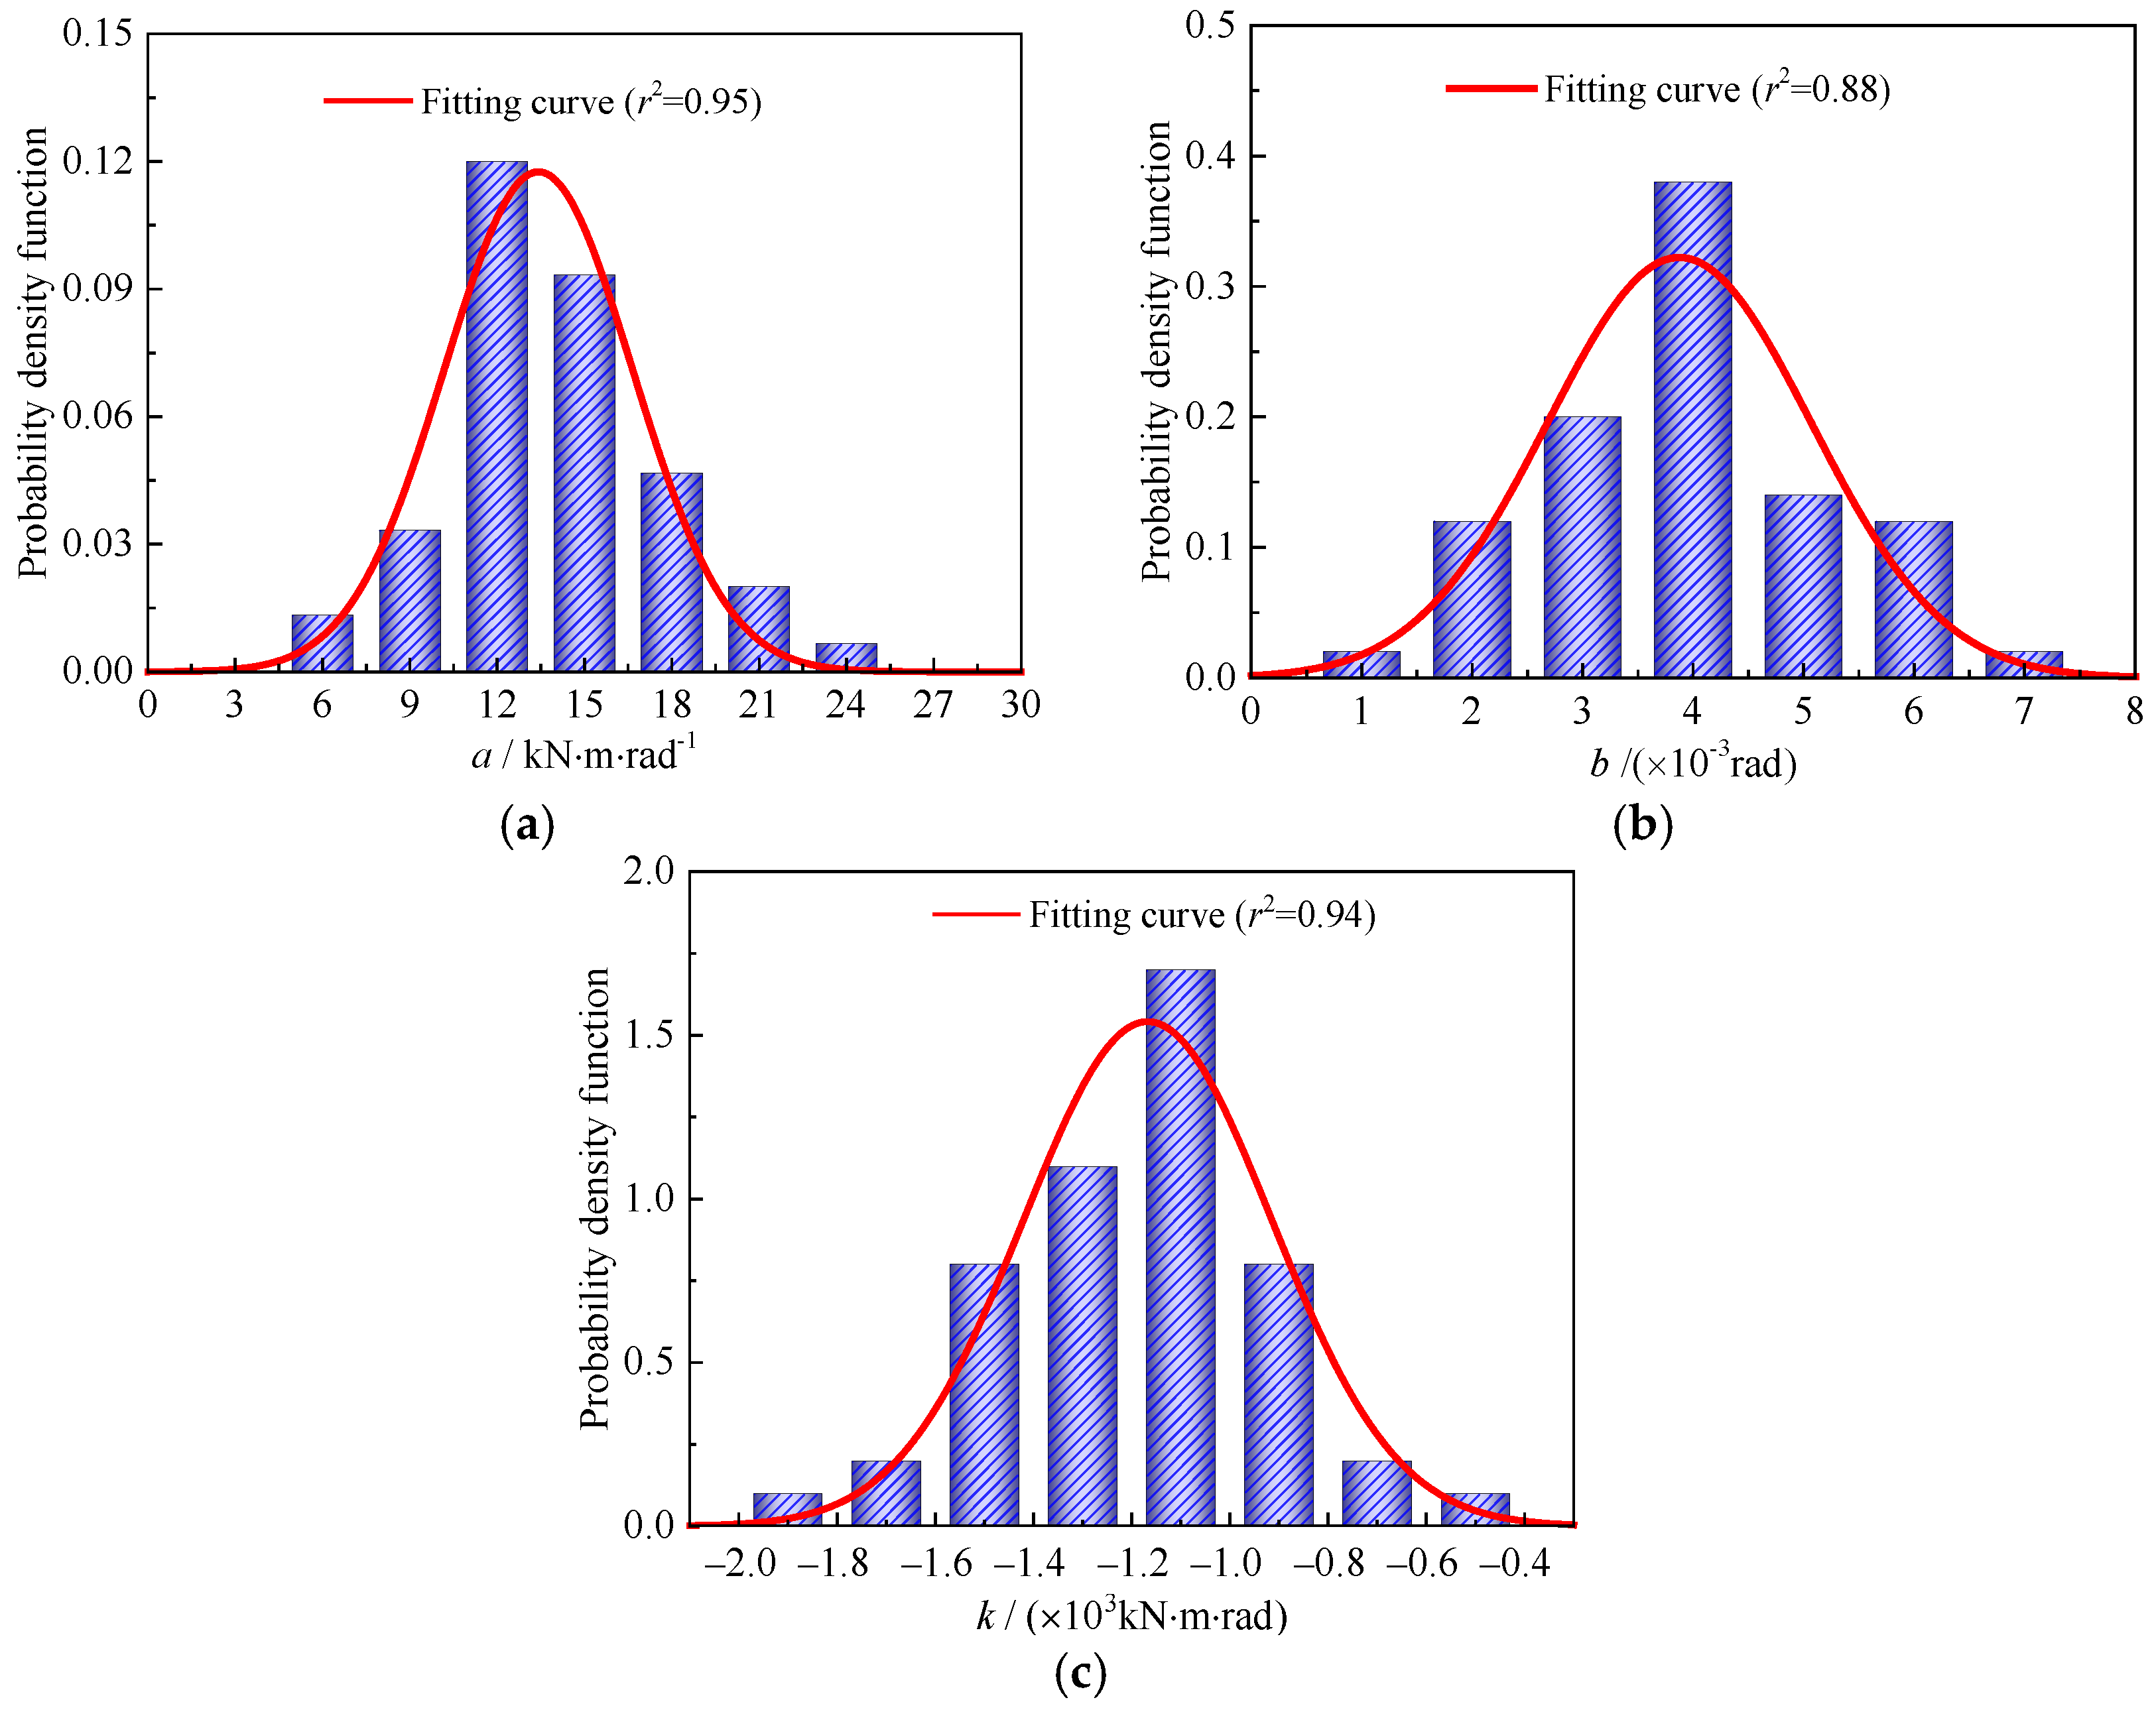
where a is the initial stiffness, b is the elastic rotation angle, and k is the stiffness degradation rate. Figure 6 shows that a is mainly distributed in 10~25 kN⋅m/rad, b is basically within 0.005 rad, and k is concentrated in −2000~−400 kN⋅m/rad2. By performing the integration calculation for Equation (4), the moment–rotation constitutive model of welded spots can be obtained:
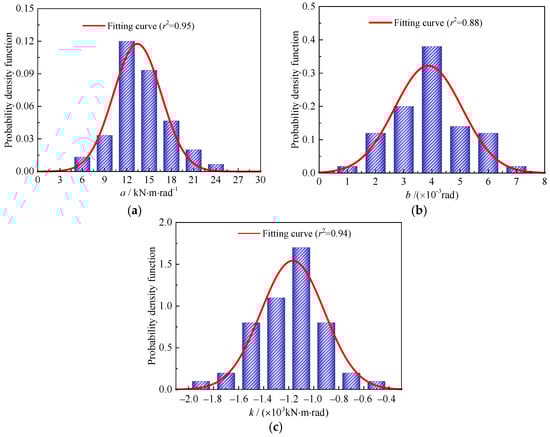
Figure 6.
Probability distribution function fitting: (a) initial stiffness; (b) elastic rotation angle; (c) stiffness degradation rate.
4.2. Parameter Analysis
In order to further determine the reasonable value of the parameters in the moment–rotation constitutive model, the initial stiffness (a), elastic rotation angle (b), and stiffness degradation rate (k) were extracted from the stiffness–rotation curve of 50 specimens in Sx1 group one by one, and the probability statistical analysis was carried out, as shown in Figure 6.
Figure 6 depicts the model parameters (a, b, k) conforming to Gaussian distribution, and its fitting degrees are 0.95, 0.88, and 0.94, respectively. The specific distribution function is as follows:
Based on the Sx1 group, the mean and standard deviation of the Gaussian function for the other groups were normalized:
where , are the mean and standard deviation for the model parameters i (i = a, b, k) in the group j (j = x1, x2, …, z4), respectively; , are the normalized correction coefficients of the mean and standard deviation for the model parameters i in group j, respectively (Table 2); and , are the average value of mean and standard deviation for the model parameters i in the group j, respectively. The values of model parameters in Sx1 group can be obtained from Equations (6)–(8): , , , , , .
Table 2.
Normalized correction coefficients.
Table 2 also shows the influence of rebar diameter on the value of model parameters. By comparing , it can be seen that the initial stiffness is most affected by the rebar diameter and decreases with the decrease in the rebar diameter. The elastic rotation angle and stiffness degradation rate are less affected by the rebar diameter. This is because the larger the rebar diameter, the larger the contact area during welding, the larger the size of the welded spot, and, ultimately, the larger the initial stiffness. However, the elastic rotation angle and stiffness degradation rate reflect the limit of elastic deformation and the development speed after entering plasticity, respectively, which has little to do with the size of the welded spot. For the same diameter combination of longitudinal rebar and transverse rebar, the initial stiffness satisfies ax > az > ay, the elastic rotation angle satisfies by > bz > bx, and the stiffness degradation rate satisfies kx > kz > ky. The value of is in the range of 0.85~1.15, which indicates that the rebar diameter has little effect on the discreteness of the initial stiffness, elastic rotation angle, and stiffness degradation rate. This is because the welding of all specimens is basically carried out under the same conditions, and the welding environment, welding current, welding voltage, welding duration and other parameters are consistent.
5. Application of Welded Rebar Parts in Changtai Yangtze River Bridge
5.1. Overview of Pylon
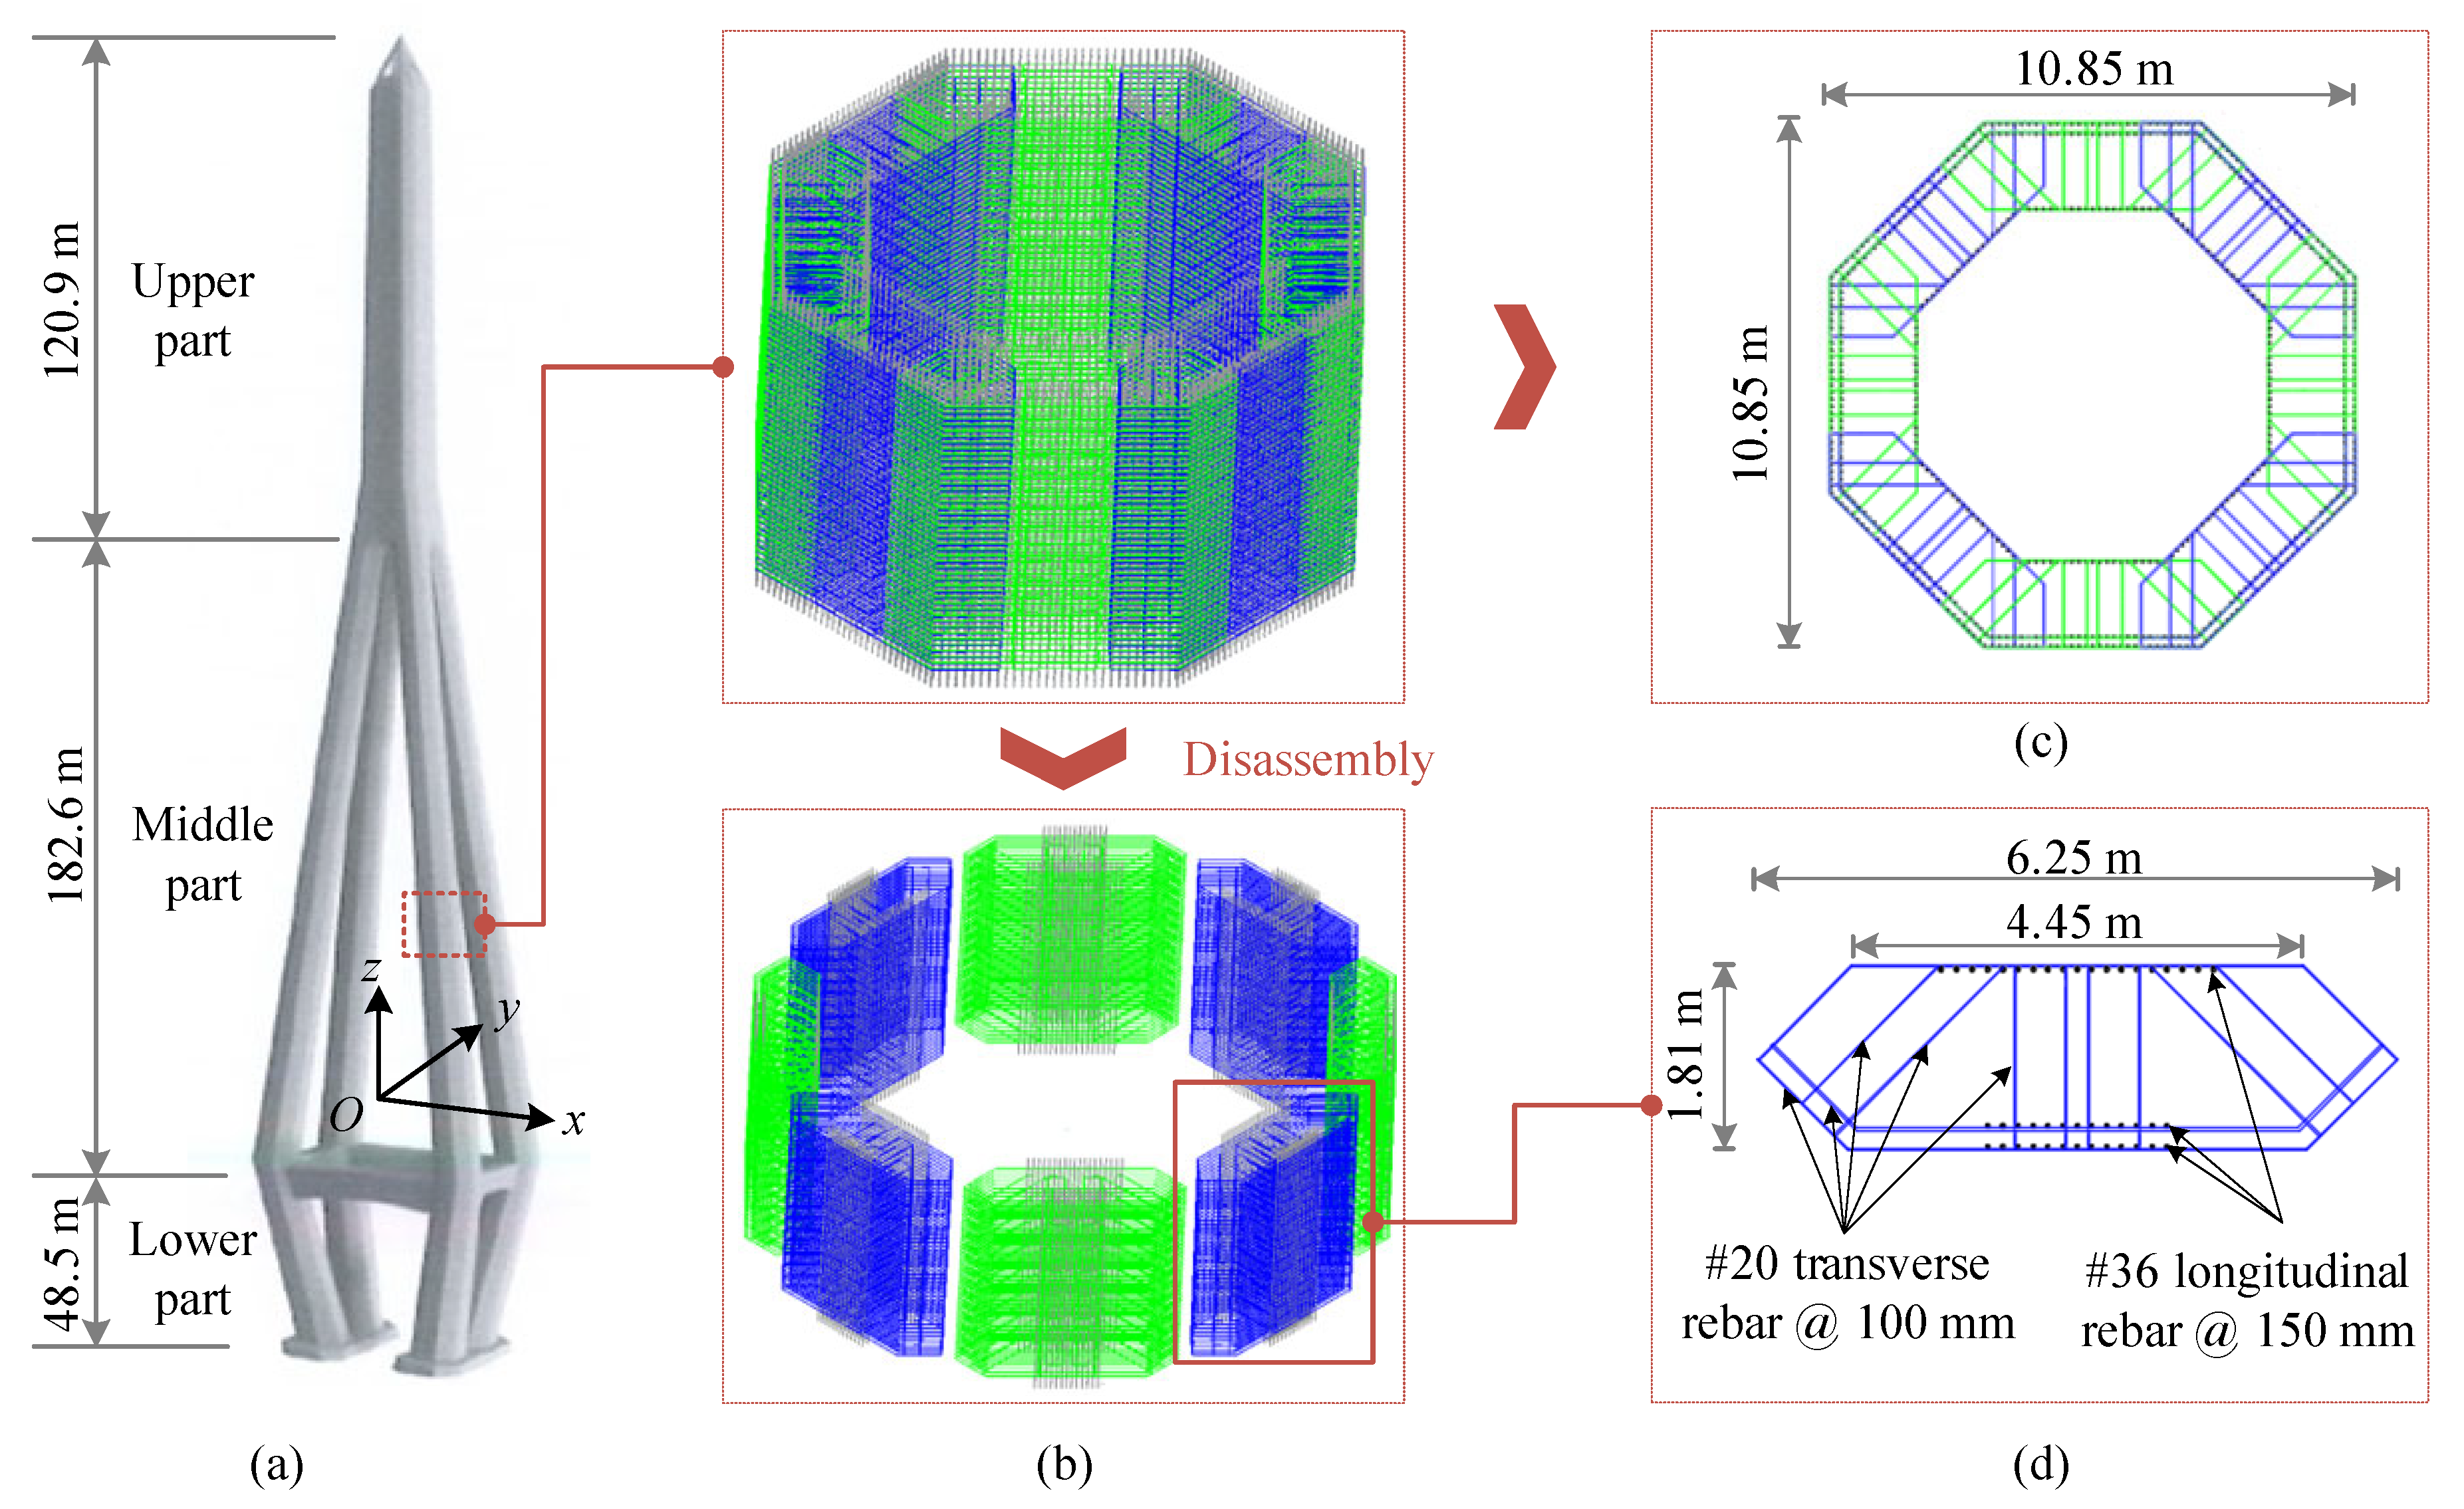
The middle pylon of Changtai Yangtze River Bridge, with a height of 352 m, is a steel-core concrete diamond-shaped composite structure (Figure 7), which is the highest pylon in the world at present [33,34]. Its upper part, with a height of 120.9 m, is a steel–concrete composite structure; the middle part, with a height of 182.6 m, and the lower part, with a height of 48.5 m, are space diamond-type concrete structures with four limbs. The inclination angles of the middle part in the transverse directions (x-axis) and longitudinal directions (y-axis) are 3.7° and 7°, respectively, and the inclination angles of the lower part in the transverse directions and longitudinal directions are 8.7° and 11.5°, respectively. The middle and lower parts are octagonal sections. The rebar part of the middle part is prefabricated and assembled. The segment height of rebar parts is 6 m, and the transverse rebar at the upper and lower rebar parts with a height of 0.48 m is reserved. There are 120 segments of rebar parts in the middle part of the pylon, and the segments of rebar parts are connected by a taper sleeve. The longitudinal rebar and transverse rebar are HRB400 with diameters of 36 mm and 20 mm, respectively. The intersection of the longitudinal rebar and transverse rebar was connected by single-sided spot welding using the CO2 gas-shielded welding process. Single-sided lap welding was used between the transverse rebar, and the welding length is 10 times the diameter of the transverse rebar.
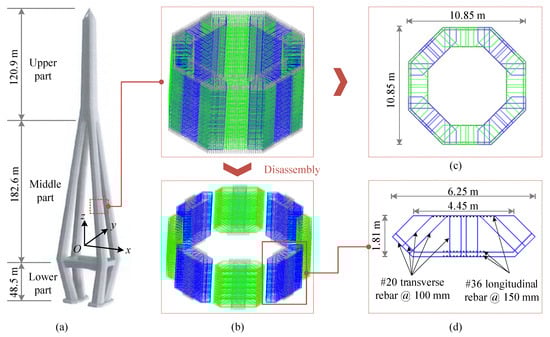
Figure 7.
Rebar part of pylon: (a) pylon; (b) three-dimensional rebar part; (c) rebar part section; (d) rebar cage section.
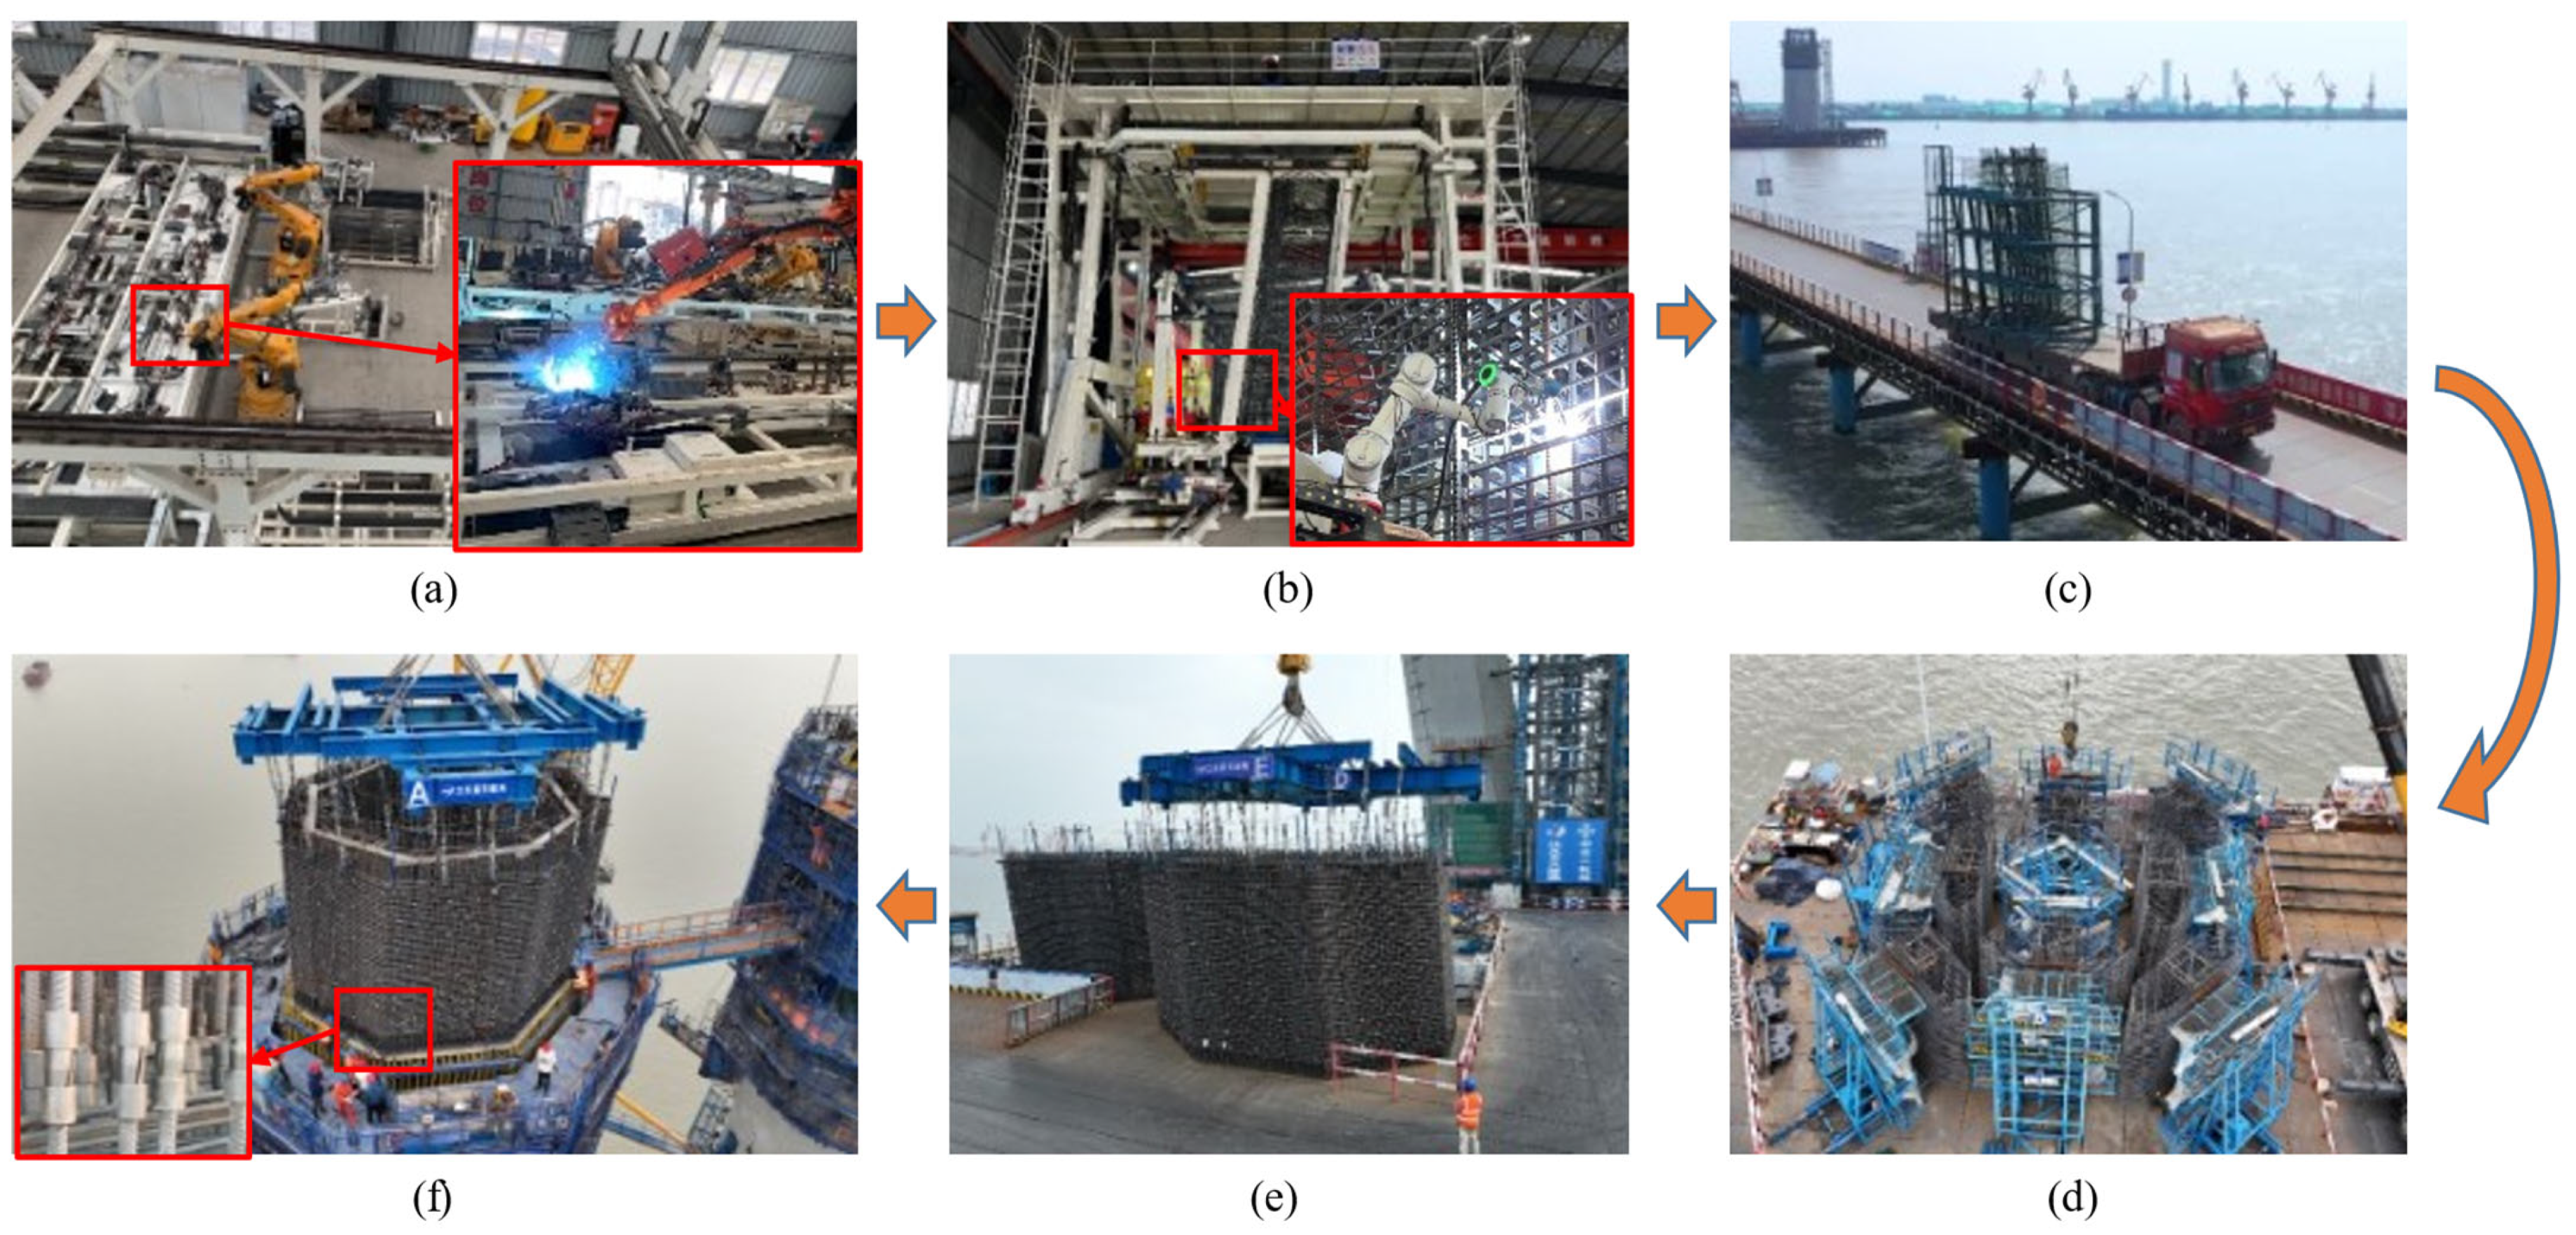
The rebar part is disassembly into eight cages prefabricated in the factory [35], as shown in Figure 7. The prefabrication process of the rebar cage is as follows (Figure 8): (1) the welding of the transverse rebar by robots; (2) the installation of the longitudinal rebar; (3) the arrangement of the transverse rebar along the longitudinal rebar with equal spacing; (4) the welding of the longitudinal rebar and transverse rebar by robots. After the prefabrication was completed, the cages were transported from the factory to the field, and eight rebar cages were assembled into rebar part segments on the tire frame in the field. Finally, the rebar parts were hoisted and connected with the lower segment by a taper sleeve. It is worth noting that the specimens for the rotational stiffness test and rebar parts were welded by robots, and the welding parameters (e.g., welding duration, current, and electrode force) were consistent [36,37].
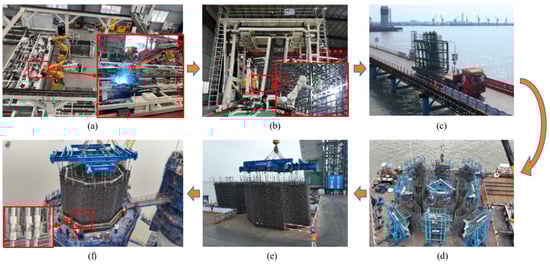
Figure 8.
Prefabrication and assembly process for rebar parts: (a) transverse rebar prefabricated by robots in the factory; (b) rebar cage prefabricated by robots in the factory; (c) rebar cage transportation to the field from the factory; (d) rebar part segment assembled by 8 rebar cages; (e) hoisting of the rebar part segment; (f) installing and connecting the rebar part segment.
5.2. Scheme of Field Test
It can be seen from Figure 8 that there are two main stress states in rebar parts: (1) hoisting from the ground to the top of the pylon; (2) connecting the local longitudinal rebar by a taper sleeve on the pylon and removing the sling. Correspondingly, the vertical deformation of rebar parts under a hoisting state and the plane deformation of rebar parts under a supporting state were tested.
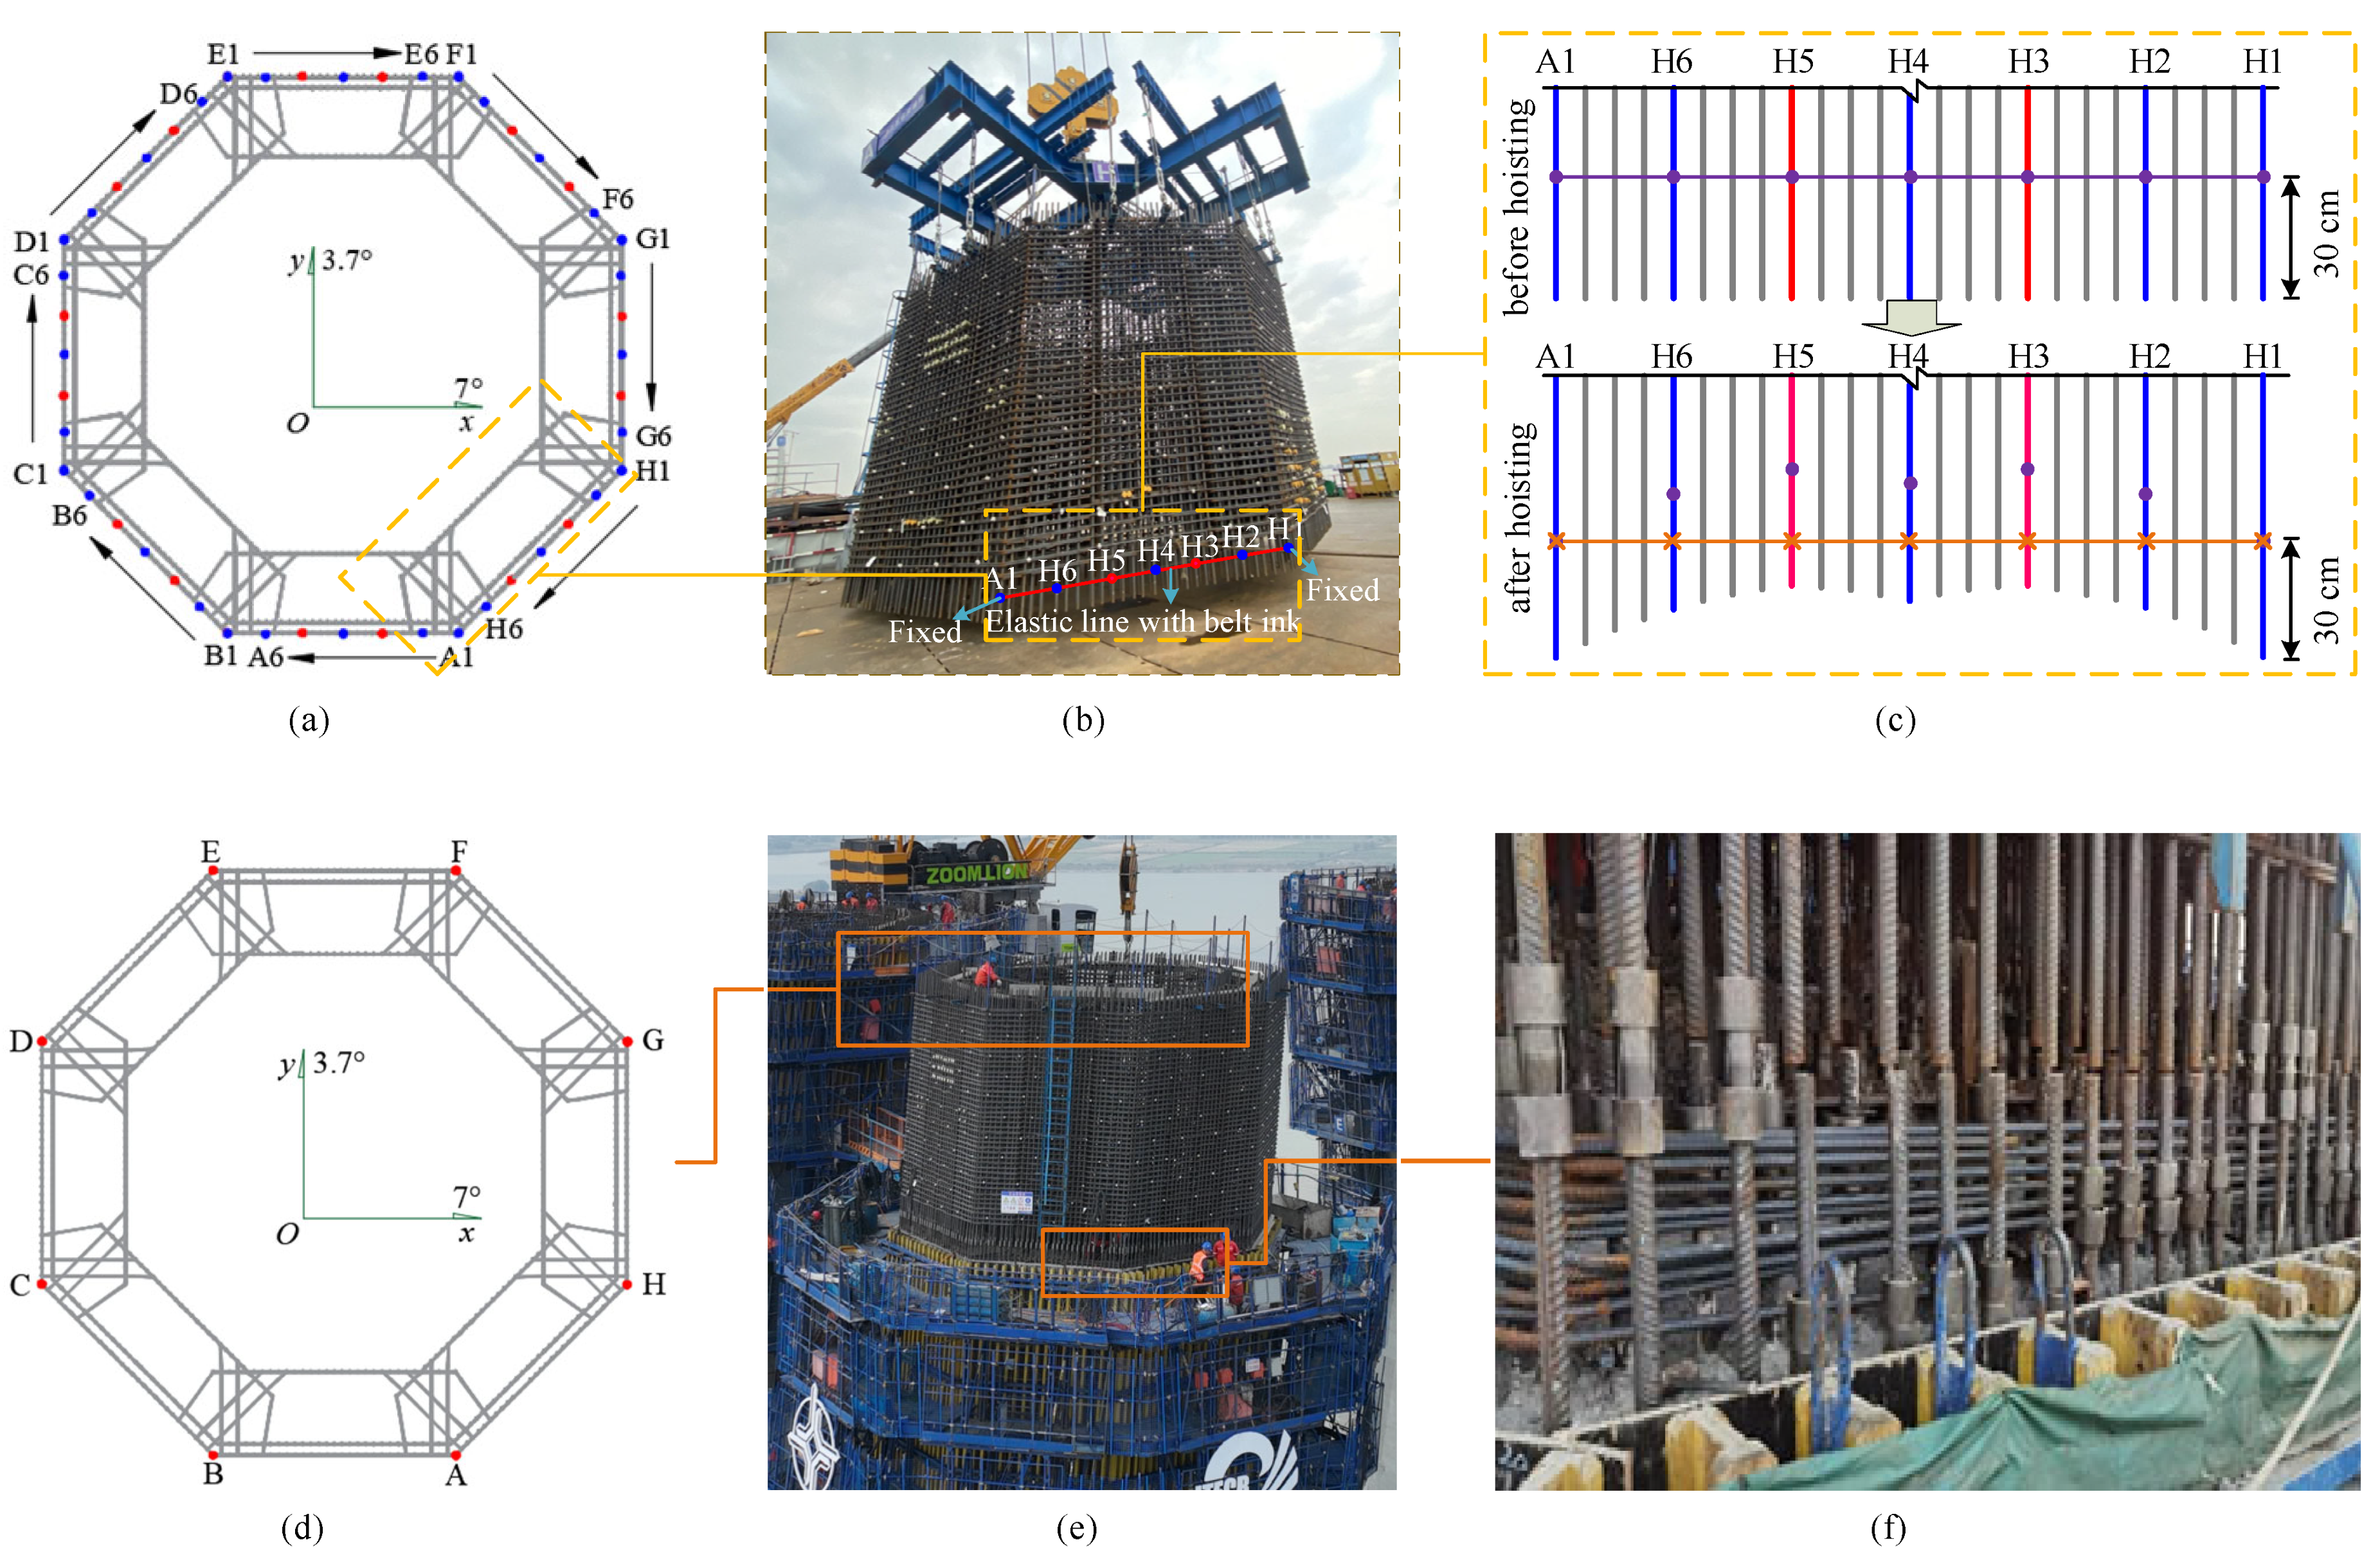
The vertical deformation test scheme for the hoisting state is shown in Figure 9. A total of 48 measuring points, located at six equidistant points along the side length, are arranged on the eight sides of rebar parts (Figure 9a). Among them, 16 red measuring points (A3, A5, …, H3, H5) correspond to the hoisting points, and the measuring points are 30 cm above the bottom of the longitudinal rebars. Before hoisting, the rebar part is supported on the ground through the longitudinal rebars. Currently, there is no relative deformation between the longitudinal rebars. After hoisting, the rebar part is separated from the ground, and its stress state is changed from the state of being supported by the longitudinal rebar to the lifting state. At this time, the longitudinal rebar will undergo relative deformation under the action of self-weight (Figure 9c). Taking the edge of H1 and A1 as an example, before hoisting, the first marking of each measuring point (H2, H3, H4, H5, H6) is carried out based on the elasticity of the ink of the measuring point A1 and H1 (Figure 9b); after lifting, the elasticity is tensioned again with the same position of measuring points A1 and H1 and the second marking is carried out. By measuring the distance between the first and second marking points on each measuring point, the vertical relative deformation of the rebar under the action of self-weight can be obtained. In order to distinguish the two marked points on the same measuring point, the color of the elastic ink used before and after hoisting is different.

Figure 9.
Vertical and plane deformation test in a hoisting state: (a) layout of vertical measuring points (where the blue points and the red points represent the measuring points, and the red points are also the hoisting points.); (b) field measurements; (c) deformation diagram before and after hoisting; (d) layout of plane measuring points; (e) supporting state at the top of the pylon; (f) partial longitudinal rebar connection of the rebar part.
The plane deformation test scheme for the supporting state is shown in Figure 9. A total of eight measuring points (A, B, …, H) are set at eight external corners on the top of the rebar part (Figure 9d). During the installation of the rebar part, 112 (15 unilateral) longitudinal rebars are connected, and the sling is removed (Figure 9f). At this time, rebar parts are only subjected to self-weight load (Figure 9e). The coordinates of the measuring points in this state are measured. By comparing with the initial state coordinates of the rebar parts after forming, the plane deformation of rebar parts under a supporting state can be obtained.
5.3. Finite Element Simulation
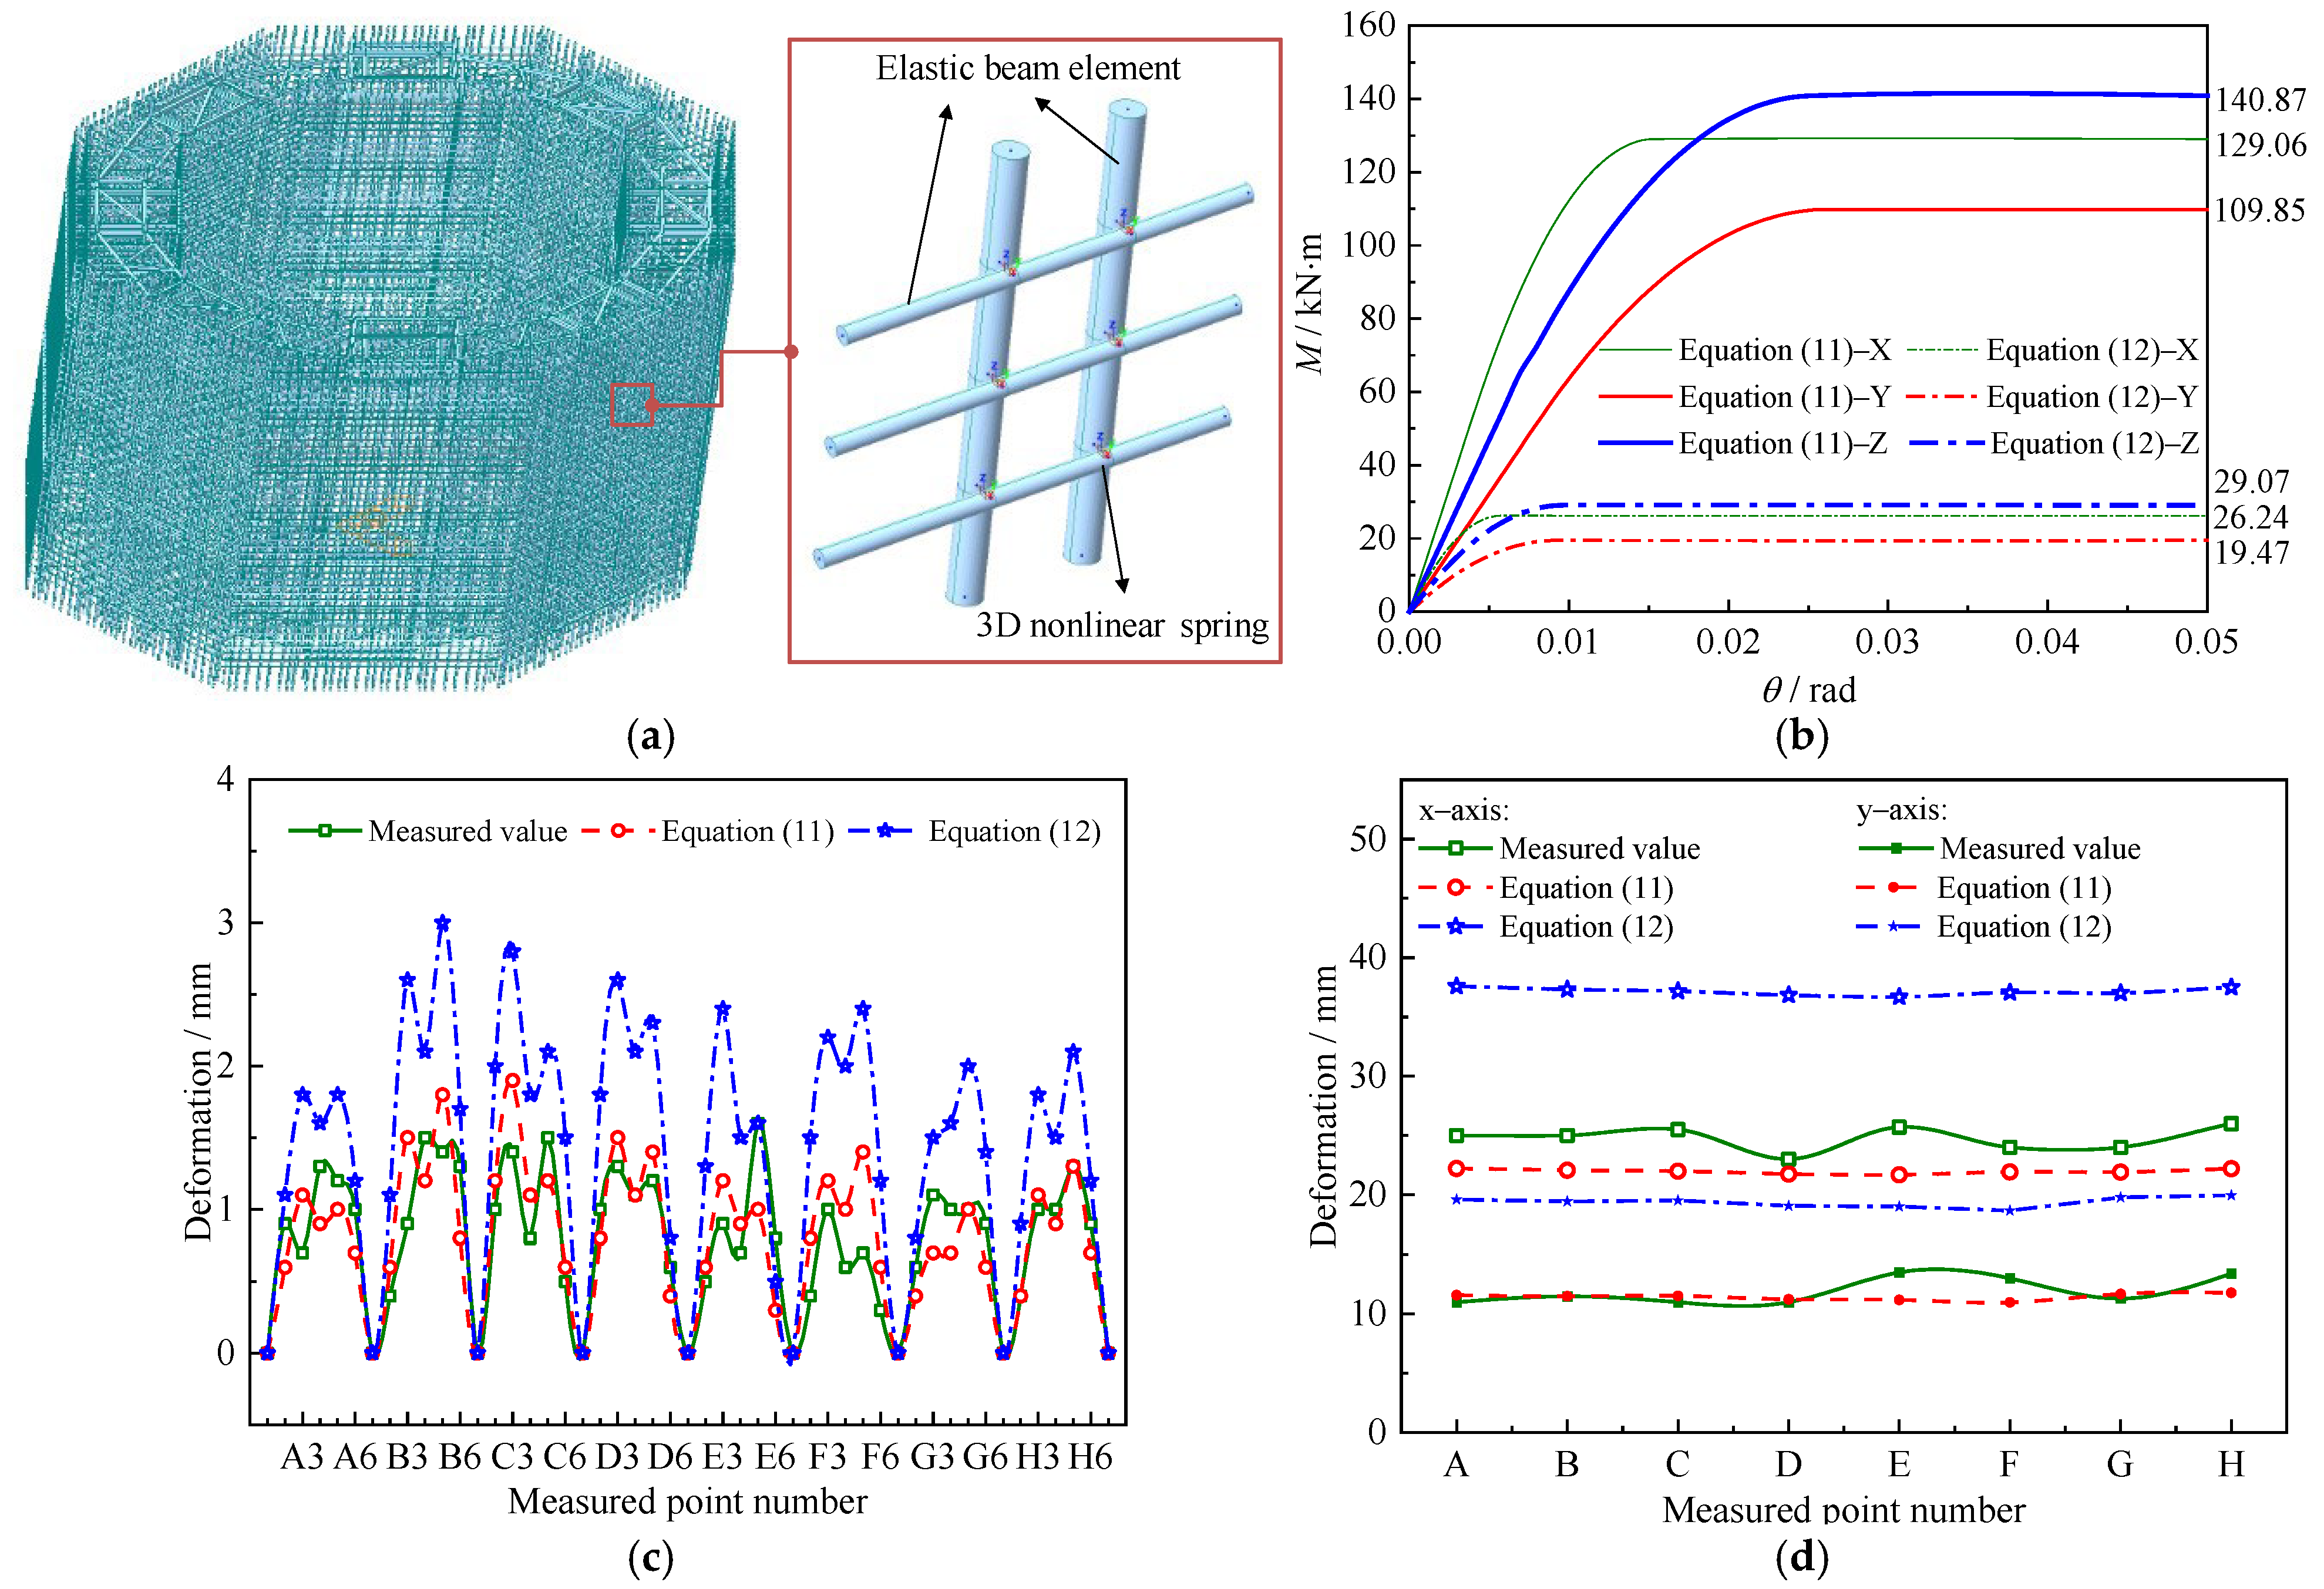
The finite element model for a rebar part segment was established by Midas Civil, as shown in Figure 10a. The preliminary simulation results show that rebars are in the elastic range under a hoisting state and a supporting state, so the elastic beam element is used to simulate rebars. The three-dimensional rotational stiffness for the welded spots is simulated by a nonlinear spring. The Newton–Raphson method is used for nonlinear iterative analysis, and the displacement convergence criterion is adopted [38,39,40]. The three-dimensional moment–rotation curves of nonlinear spring are shown in Figure 10b, considering two methods for the values of model parameters (a, b, k): (1) take the mean value of the distribution function, as shown in Equation (11); (2) take the value to satisfy the 95% guarantee rate, as shown in Equation (12).
where represents the value of the model parameter i (i = a, b, k) for j (j = x1, y1, z1) group specimens.
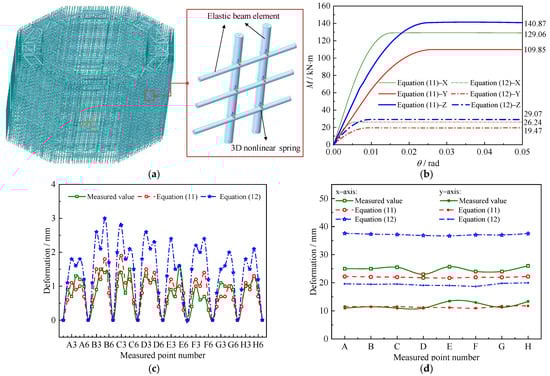
Figure 10.
Comparative analysis of deformation results: (a) finite element model; (b) three-dimensional moment–rotation curves; (c) hoisting state; (d) supporting state.
5.4. Discussion of Results
Figure 10c depicts the measured and simulated results for vertical deformation in a hoisting state: (1) the vertical relative deformation of a rebar part subjected to a self-weight load is small, and the measured value is within 2 mm; (2) the vertical relative deformation for the eight sides of the rebar part is similar; (3) the vertical deformation of the rebar part is greatly affected by the value of model parameters; (4) when the model parameters are determined based on Equation (11), the simulated values show excellent agreement with the measured values, with a maximum error of only 8.54%; and (5) when the model parameters are valued based on Equation (12), the simulated values are greater than the measured values, and the results are conservative.
Figure 10d shows the measured and simulated results of vertical deformation in a supporting state: (1) the deformation value in the transverse direction (x-axis) is greater than that in the longitudinal direction (y-axis), which is because the inclination angle of the rebar part in the transverse direction relatively large; (2) the plane deformation values of eight corners of the rebar are basically equal, the deformation value in the transverse direction is nearly 25 mm, and the deformation value in the longitudinal direction is nearly 11 mm; (3) the plane deformation of the rebar part is greatly affected by the values of the model parameters; (4) when the model parameters are determined based on Equation (11), the simulated values show excellent agreement with the measured values, with a maximum error of only 1.87%; (5) when the model parameters are valued based on Equation (12), the simulated values are greater than the measured values, and the results are conservative.
6. Conclusions
In this paper, a calculation method for the overall stiffness of rebar parts in pylons is studied. The essential stiffness of rebar parts is revealed. The test results, including 105 groups of T-type welded rebar specimens, are analyzed. A constitutive model of welded spots and an evaluation method for the model parameters are proposed. The research results were verified through application to Changtai Yangtze River Bridge. The following conclusions can be drawn:
- The moment–rotation constitutive model of welded spots proposed in this paper is only driven by three parameters: the initial stiffness, elastic rotation angle, and stiffness degradation rate. It not only has reliable calculation accuracy but is also very suitable for practical engineering applications.
- Model parameters such as initial stiffness, elastic rotation angle, and stiffness degradation rate all conform to the Gaussian distribution, but the standard deviation is relatively large. It is advisable to promote the use of automatic welding robots and establish standardized welding parameters.
- The initial stiffness is greatly affected by the rebar diameter and decreases with the decrease in the rebar diameter. The elastic rotation angle and stiffness degradation rate are basically not affected by the rebar diameter.
- The deformation evaluation of rebar parts can guide the design of the rigid skeleton to make the rebar connecting feasible by means of a taper sleeve or straight thread sleeve and can also be used to calculate the pre-offset of the rebar parts so that the thickness of the concrete cover and the overall alignment meet the requirements of the specification.
There are many factors affecting the welding quality, which determines the welding stiffness to a certain extent. It can also be seen from the test data in this paper that the stiffness–rotation curve for specimens in the same group shows a large discreteness. This paper does not analyze the influence of welding parameters (e.g., welding duration, current, and electrode force) on welding stiffness, which will be the subject of future studies.
Author Contributions
Methodology, Z.L.; Validation, H.S.; Formal analysis, Z.X.; Writing—original draft, H.Z. All authors have read and agreed to the published version of the manuscript.
Funding
This research was funded by the National Natural Science Foundation of China, grant number 52278210.
Data Availability Statement
Data used in this study can be requested from the corresponding author.
Conflicts of Interest
Author Hehui Zheng was employed by the company CCCC Second Harbour Engineering Co., Ltd. Author Huijun Shen was employed by the company CCCC Second Harbour Engineering Co., Ltd., Key Laboratory of Large-Span Bridge Construction Technology, Ltd. and CCCC Highway Bridge National Engineering Research Centre Co., Ltd. The remaining authors declare that the research was conducted in the absence of any commercial or financial relationships that could be construed as a potential conflict of interest.
References
- Tuesta, R.; Vicuña, M.; Del Savio, A.A.; Palpan, A.; Valle, E.; Quiroz, F. Prefabricated reinforcement in construction using VDC: Case study Ovalo Monitor Bridge. In Proceedings of the 30th Annual Conference of the International Group for Lean Construction (IGLC), Edmonton, AB, Canada, 25–31 July 2022; pp. 27–29. [Google Scholar]
- Qi, B.; Razkenari, M.; Costin, A.; Kibert, C.; Fu, M. A systematic review of emerging technologies in industrialized construction. J. Build. Eng. 2021, 39, 102265. [Google Scholar] [CrossRef]
- Zhou, X.; Zhang, X. Thoughts on the development of bridge technology in China. Engineering 2019, 5, 1120–1130. [Google Scholar] [CrossRef]
- He, X.; Wu, T.; Zou, Y.; Chen, Y.F.; Guo, H.; Yu, Z. Recent developments of high-speed railway bridges in China. Struct. Infrastruct. Eng. 2017, 13, 1584–1595. [Google Scholar] [CrossRef]
- Harryson, P. Industrial Bridge Engineering-Structural Developments for More Efficient Bridge Construction. Ph.D. Thesis, Chalmers Tekniska Hogskola, Gothenburg, Sweden, 2008. [Google Scholar]
- Park, B.S.; Park, S.H.; Cho, J.Y. A pre-assembly method of steel reinforcement to improve the constructability of pier coping. Eng. Struct. 2013, 48, 166–175. [Google Scholar] [CrossRef]
- Palpan, A.; Vega, S.; Quiroz, F.Q.; Vicuña, M.; Tuesta, R.; del Savio, A.A. VDC management in the industrialization process using prefabricated reinforcement cages. Case Study: Ovalo Monitor Bridge. In Proceedings of the Modular and Offsite Construction (MOC) Summit Proceedings, Edmonton, AB, Canada, 27–29 July 2022; pp. 217–224. [Google Scholar]
- Vahedi, M.; Ebrahimian, H.; Itani, A.M. Experimental investigation of U-bolt connectors for application in rebar cages. J. Struct. Eng. 2023, 149, 04022216. [Google Scholar] [CrossRef]
- Lee, K.M.; Lee, Y.B.; Shim, C.S.; Park, K.L. Bridge information models for construction of a concrete box-girder bridge. Struct. Infrastruct. Eng. 2012, 8, 687–703. [Google Scholar] [CrossRef]
- Simonsson, P.; Emborg, M. Industrialization in Swedish Bridge Engineering: A Case Study of Lean Construction. In Proceedings of the Annual Conference of the International Group for Lean Construction, East Lansing, MI, USA, 18–20 July 2007; Michigan State University Press: East Lansing, MI, USA, 2007; pp. 244–253. [Google Scholar]
- Pacheco, P.; Coelho, H.; Borges, P.; Resende, A.; Carvalho, D. New frontiers in multi-span prestressed concrete deck construction: A case study. Struct. Eng. Int. 2021, 31, 106–117. [Google Scholar] [CrossRef]
- Young, Y.J.; Han, C.S. Development of pier coping pre-assembly method. Mag. Korea Concr. Inst. 2004, 16, 91–95. [Google Scholar]
- Kim, Y.J.; Choi, H.S.; Shin, W.S. Ground fabrication of coping rebar of rectangular pier. Mag. Korea Concr. Inst. 2006, 18, 52–55. [Google Scholar]
- Devine, R.D.; Barbachyn, S.M.; Thrall, A.P.; Kurama, Y.C. Effect of tripping prefabricated rebar assemblies on bar spacing. J. Constr. Eng. Manag. 2018, 144, 04018099. [Google Scholar] [CrossRef]
- Chen, H.; Chen, S. Key information perception and control strategy of intellignet welding under complex scene. Acta Met. Sin 2022, 58, 541–550. [Google Scholar] [CrossRef]
- Wang, B.; Hu, S.J.; Sun, L.; Freiheit, T. Intelligent welding system technologies: State-of-the-art review and perspectives. J. Manuf. Syst. 2020, 56, 373–391. [Google Scholar] [CrossRef]
- Wahba, M.; Mizutani, M.; Katayama, S. Hybrid welding with fiber laser and CO2 gas shielded arc. J. Mater. Process. Technol. 2015, 221, 146–153. [Google Scholar] [CrossRef]
- Li, J.; Shang, X.; Yuan, M. Research on reliability of straight thread connection of reinforcement cage of bridge foundation. E3S Web Conf. 2021, 238, 03064. [Google Scholar] [CrossRef]
- Dabiri, H.; Kheyroddin, A.; Dall’Asta, A. Splice methods used for reinforcement steel bars: A state-of-the-art review. Constr. Build. Mater. 2022, 320, 126198. [Google Scholar] [CrossRef]
- Zhao, E.; Song, C.; Zhang, X.; Zhou, Q.; Yan, K. Experimental study on monotonic, cyclic mechanics and fatigue performance of pressed cone sleeve splices. In Structures; Elsevier: Amsterdam, The Netherlands, 2022; pp. 482–495. [Google Scholar] [CrossRef]
- Del-Giudice, L.; Wróbel, R.; Katsamakas, A.A.; Leinenbach, C.; Vassiliou, M.F. Physical modelling of reinforced concrete at a 1: 40 scale using additively manufactured reinforcement cages. Earthq. Eng. Struct. Dyn. 2022, 51, 537–551. [Google Scholar] [CrossRef]
- Yuan, X.; Smith, A.; Moreu, F.; Sarlo, R.; Lippitt, C.D.; Hojati, M.; Alampalli, S.; Zhang, S. Automatic evaluation of rebar spacing and quality using LiDAR data: Field application for bridge structural assessment. Autom. Constr. 2023, 146, 104708. [Google Scholar] [CrossRef]
- Rabi, M.; Shamass, R.; Cashell, K.A. Structural performance of stainless steel reinforced concrete members: A review. Constr. Build. Mater. 2022, 325, 126673. [Google Scholar] [CrossRef]
- Rabi, M.; Shamass, R.; Cashell, K.A. Experimental investigation on the flexural behaviour of stainless steel reinforced concrete beams. Struct. Infrastruct. Eng. 2023, 19, 1847–1859. [Google Scholar] [CrossRef]
- Rabi, M.; Cashell, K.A.; Shamass, R. Analysis of concrete beams reinforced with stainless steel. In Proceedings of the fib Symposium 2019: Concrete-Innovations in Materials, Design and Structures 2019, Krakow, Poland, 27–29 May 2019; pp. 690–697. [Google Scholar]
- Rabi, M. Bond prediction of stainless-steel reinforcement using artificial neural networks. Proc. Inst. Civ. Eng. Constr. Mater. 2023, 177, 87–97. [Google Scholar] [CrossRef]
- Rabi, M.; Cashell, K.A.; Shamass, R. Ultimate behaviour and serviceability analysis of stainless steel reinforced concrete beams. Eng. Struct. 2021, 248, 113259. [Google Scholar] [CrossRef]
- Rabi, M.; Cashell, K.A.; Shamass, R.; Desnerck, P. Bond behaviour of austenitic stainless steel reinforced concrete. Eng. Struct. 2020, 221, 111027. [Google Scholar] [CrossRef]
- Rabi, M.; Cashell, K.A.; Shamass RJ, E.S. Flexural analysis and design of stainless steel reinforced concrete beams. Eng. Struct. 2019, 198, 109432. [Google Scholar] [CrossRef]
- Kim, J.H.; Cho, Y.; Jang, Y.H. Estimation of the weldability of single-sided resistance spot welding. J. Manuf. Syst. 2013, 32, 505–512. [Google Scholar] [CrossRef]
- Nishibata, H.; Fukumoto, M.; Uchihara, M. Influence of welding conditions on nugget formation in single-sided resistance spot welding process. Weld. World 2009, 53, 15–22. [Google Scholar] [CrossRef]
- Rabi, M.; Shamass, R.; Cashell, K.A. Description of the constitutive behaviour of stainless steel reinforcement. Case Stud. Constr. Mater. 2024, 20, e03013. [Google Scholar] [CrossRef]
- Wang, Z.; Zhang, W.; Tian, G.; Liu, Z. Joint values determination of wind and temperature actions on long-span bridges: Copula-based analysis using long-term meteorological data. Eng. Struct. 2020, 219, 110866. [Google Scholar] [CrossRef]
- Ge, P.Y.; Xu, P.D.; Sun, P.L.; Sun, P.Z. Introduction: Recent structures and research in China. Struct. Eng. Int. 2022, 32, 133. [Google Scholar] [CrossRef]
- Garg, A.; Kamat, V.R. Virtual prototyping for robotic fabrication of rebar cages in manufactured concrete construction. J. Archit. Eng. 2014, 20, 06013002. [Google Scholar] [CrossRef]
- Karadeniz, E.; Ozsarac, U.; Yildiz, C. The effect of process parameters on penetration in gas metal arc welding processes. Mater. Des. 2007, 28, 649–656. [Google Scholar] [CrossRef]
- Gao, M.; Zeng, X.; Hu, Q. Effects of gas shielding parameters on weld penetration of CO2 laser-TIG hybrid welding. J. Mater. Process. Technol. 2007, 184, 177–183. [Google Scholar] [CrossRef]
- Rabi, M.; Abarkan, I.; Shamass, R. Buckling resistance of hot-finished CHS beam-columns using FE modelling and machine learning. Steel Constr. 2024, 17, 93–103. [Google Scholar] [CrossRef]
- Rabi, M.; Jweihan, Y.S.; Abarkan, I.; Ferreira FP, V.; Shamass, R.; Limbachiya, V.; Tsavdaridis, K.D.; Santos LF, P. Machine learning-driven web-post buckling resistance prediction for high-strength steel beams with elliptically-based web openings. Results Eng. 2024, 21, 101749. [Google Scholar] [CrossRef]
- Jweihan, Y.S.; Al-Kheetan, M.J.; Rabi, M. Empirical model for the retained stability index of asphalt mixtures using hybrid machine learning approach. Appl. Syst. Innov. 2023, 6, 93. [Google Scholar] [CrossRef]


Disclaimer/Publisher’s Note: The statements, opinions and data contained in all publications are solely those of the individual author(s) and contributor(s) and not of MDPI and/or the editor(s). MDPI and/or the editor(s) disclaim responsibility for any injury to people or property resulting from any ideas, methods, instructions or products referred to in the content. |
© 2025 by the authors. Licensee MDPI, Basel, Switzerland. This article is an open access article distributed under the terms and conditions of the Creative Commons Attribution (CC BY) license (https://creativecommons.org/licenses/by/4.0/).