Article

Spatial Evolution Characteristics and Driving Factors of Historic Urban Areas: A Case Study of Zhangye Historic Centre, China

1
School of Architecture, Xi’an University of Architecture and Technology, Xi’an 710000, China
2
School of Public Administration, Xi’an University of Architecture and Technology, Xi’an 710000, China
3
School of Architecture and Urban Planning, Lanzhou Jiaotong University, Lanzhou 730070, China
*
Author to whom correspondence should be addressed.
Buildings 2025, 15(6), 961; https://doi.org/10.3390/buildings15060961
Submission received: 24 February 2025 / Revised: 13 March 2025 / Accepted: 15 March 2025 / Published: 19 March 2025
(This article belongs to the Section Architectural Design, Urban Science, and Real Estate)

Abstract

This study aimed to determine the characteristics and driving factors of spatial evolution in urban historical areas during urbanization and urban renewal and recommend how to protect these areas. The urban historical district of Zhangye, a famous historical and cultural city in China, was chosen as the study area. The research used a land transfer matrix, spatial design network analysis (sDNA), GIS analysis, and relevant statistical methods. It analyzed the spatial evolution characteristics of the district by considering the transformation of land use, the evolution of road networks, and the renewal of building profiles. GeoDetector was used to explore the effects of the factors. The study found that in the district, commercial and business land increased while industrial, manufacturing, logistics, and warehouse land decreased. The evolution speed at each stage had a wave-like development. The street pattern maintained the basic “cross” shape, with continuous improvements in the road system and overall accessibility. The building volume also increased gradually. The main types of architectural renewal included setback, integration, demolition, and addition. Meanwhile, economic and industrial factors had the most significant influence on the renewal of the district, whereas cultural factors had increasing influence. Finally, the dual-factor effects were more significant than the single-factor impacts.

1. Introduction

In 1987, with the introduction of the Washington Charter (Charter for the Conservation of Historic Towns and Urban Areas), the global community began to recognize the value of preserving historic urban areas, and the protection of such areas and their historical environments has obtained international consensus [1,2,3,4]. Since the beginning of the 21st century, a substantial body of international research has emerged to explore the role of historic city preservation in urban revitalization [5]. Among these studies, Gilderbloom et al. argue that historic preservation can create employment opportunities and promote the sustainability of the urban environment [6]. David Listokin suggests that heritage tourism, which relies on historic preservation, can increase residents’ incomes but also poses risks to urban development [7]. Additionally, other scholars’ research indicates that historic city preservation may lead to rising housing prices and the aggregation of middle-class populations in urban centers [8,9,10], or conversely, result in declining housing prices and population loss in underdeveloped urban areas [11,12].
Similarly, in China, with the continuous improvement of urbanization, historic urban districts are inevitably affected by urban renewal. Urbanization has led to a large influx of people from rural areas into cities, prompting many historic cities to undertake adaptive transformations. This, in turn, has triggered significant changes in the spatial and morphological characteristics of historical urban areas, posing a considerable threat to the authenticity of historical heritage [13]. In response, China designated its first batch of historic and cultural cities in 1982, beginning to address the various contradictions between preserving the historical appearance of urban historical districts and urban development [14,15,16].
Urban renewal and evolution is an adaptive adjustment that cities make in response to economic development and resident needs [17]. In this process, historical areas inevitably undergo spatial and functional restructuring [18], with the focus shifting from material and economic factors to cultural and social orientations [19]. Scholars such as Nasser, Miles, and Mehanna have pointed out that emphasizing economic value in neighborhood renewal can lead to the loss of socio-cultural identity [20,21,22]. Monterrubio et al. have argued that the commodification of culture may undermine the authenticity of cultural heritage and affect local traditions [23]. Unlike the renewal process involving large-scale demolition and construction, the spatial renewal of urban historical districts is predicated on the protection of cultural character and continuation of historical context using more nuanced methods [24,25]. This approach respects the traditional urban fabric while adapting to urban development trends. The spatial evolution of urban historical districts often involves two levels: external manifestation and internal logic. External manifestation is reflected macroscopically in the changes to the urban spatial form and microscopically in the reconstruction and evolution of roads, alleys, architectural textures, and land textures [26,27,28,29]. The internal logic of the spatial evolution of historical urban areas primarily involves changes to the social relations, institutional evolution, dynamics between the government and residents, involvement of local capital, and succession of traditional cultures [30,31,32,33,34].
Current research on the renewal and spatial evolution of historical cities primarily involves three perspectives. The first is that of historical urban landscapes, where researchers focus on the evolution and characteristics of urban historical elements as well as their value assessment [35,36]. Most such studies take specific projects as their research subjects, attempting to propose a method, model, or pathway addressing the protection constraints and renewal demands of cultural heritage in historical neighborhoods [37,38]. They are typically oriented toward renewal projects and engineering and employ historical data collation and diagrammatic analysis as their primary methods [39,40].
The second perspective is that of urban morphology, a field of study aimed at understanding the developmental context of cities [41]. It primarily concentrates on the interrelation of urban spatial structures and society. Urban form is the intuitive representation of the city’s physical shape and an external reflection of its material appearance and internal generative logic, encompassing three levels: plots, neighborhoods, and the city as a whole [42,43,44]. Research has been conducted on the evolution of urban and residential forms, focusing on different stages of land use, architectural textures, and street environments [45,46,47]. Subsequently, domestic scholars in China have begun to integrate morphological theories and methods for the protection and planning of urban history and culture, providing effective theoretical and methodological tools for the preservation and renewal of historical cities.
The third perspective focuses on geography and involves analyzing changes in the urban spatial patterns from the perspective of urban construction land and exploring their underlying influencing factors [48]. Due to the limitations in data precision, such studies often focus on entire urban administrative districts, built-up areas, or even broader regions.
In summary, existing research on the spatial evolution of urban historic districts lacks, on one hand, a targeted and effective rational analysis methodology. On the other hand, the scale of the analysis objects is too large, and the precision is insufficient, making it difficult to adapt to the special research subjects such as historical areas. Additionally, the influencing factors of historical district spatial evolution, such as social, economic, and cultural factors, are often overlooked in relevant studies [49,50]. This reality is not conducive to correctly and comprehensively understanding the development process of urban historic areas.
However, the urban historic districts in China have clear boundaries such as city walls and moats. They represent a spatial entity that has undergone multidimensional, long-term renewal, which has resulted in a complete system comprising various interrelated urban elements. Therefore, research on urban historical districts in China must explore the evolution process and characteristics of material space from multiple dimensions, interpreting the various influencing factors and mechanisms that affect the changes therein. It is particularly important to effectively clarify the mechanisms of spatial evolution of such districts during urbanization and urban renewal processes and to explore the influencing factors and their mechanisms. This can provide ideas on and a foundation for reasonably protecting and inheriting historical districts in urban renewal.
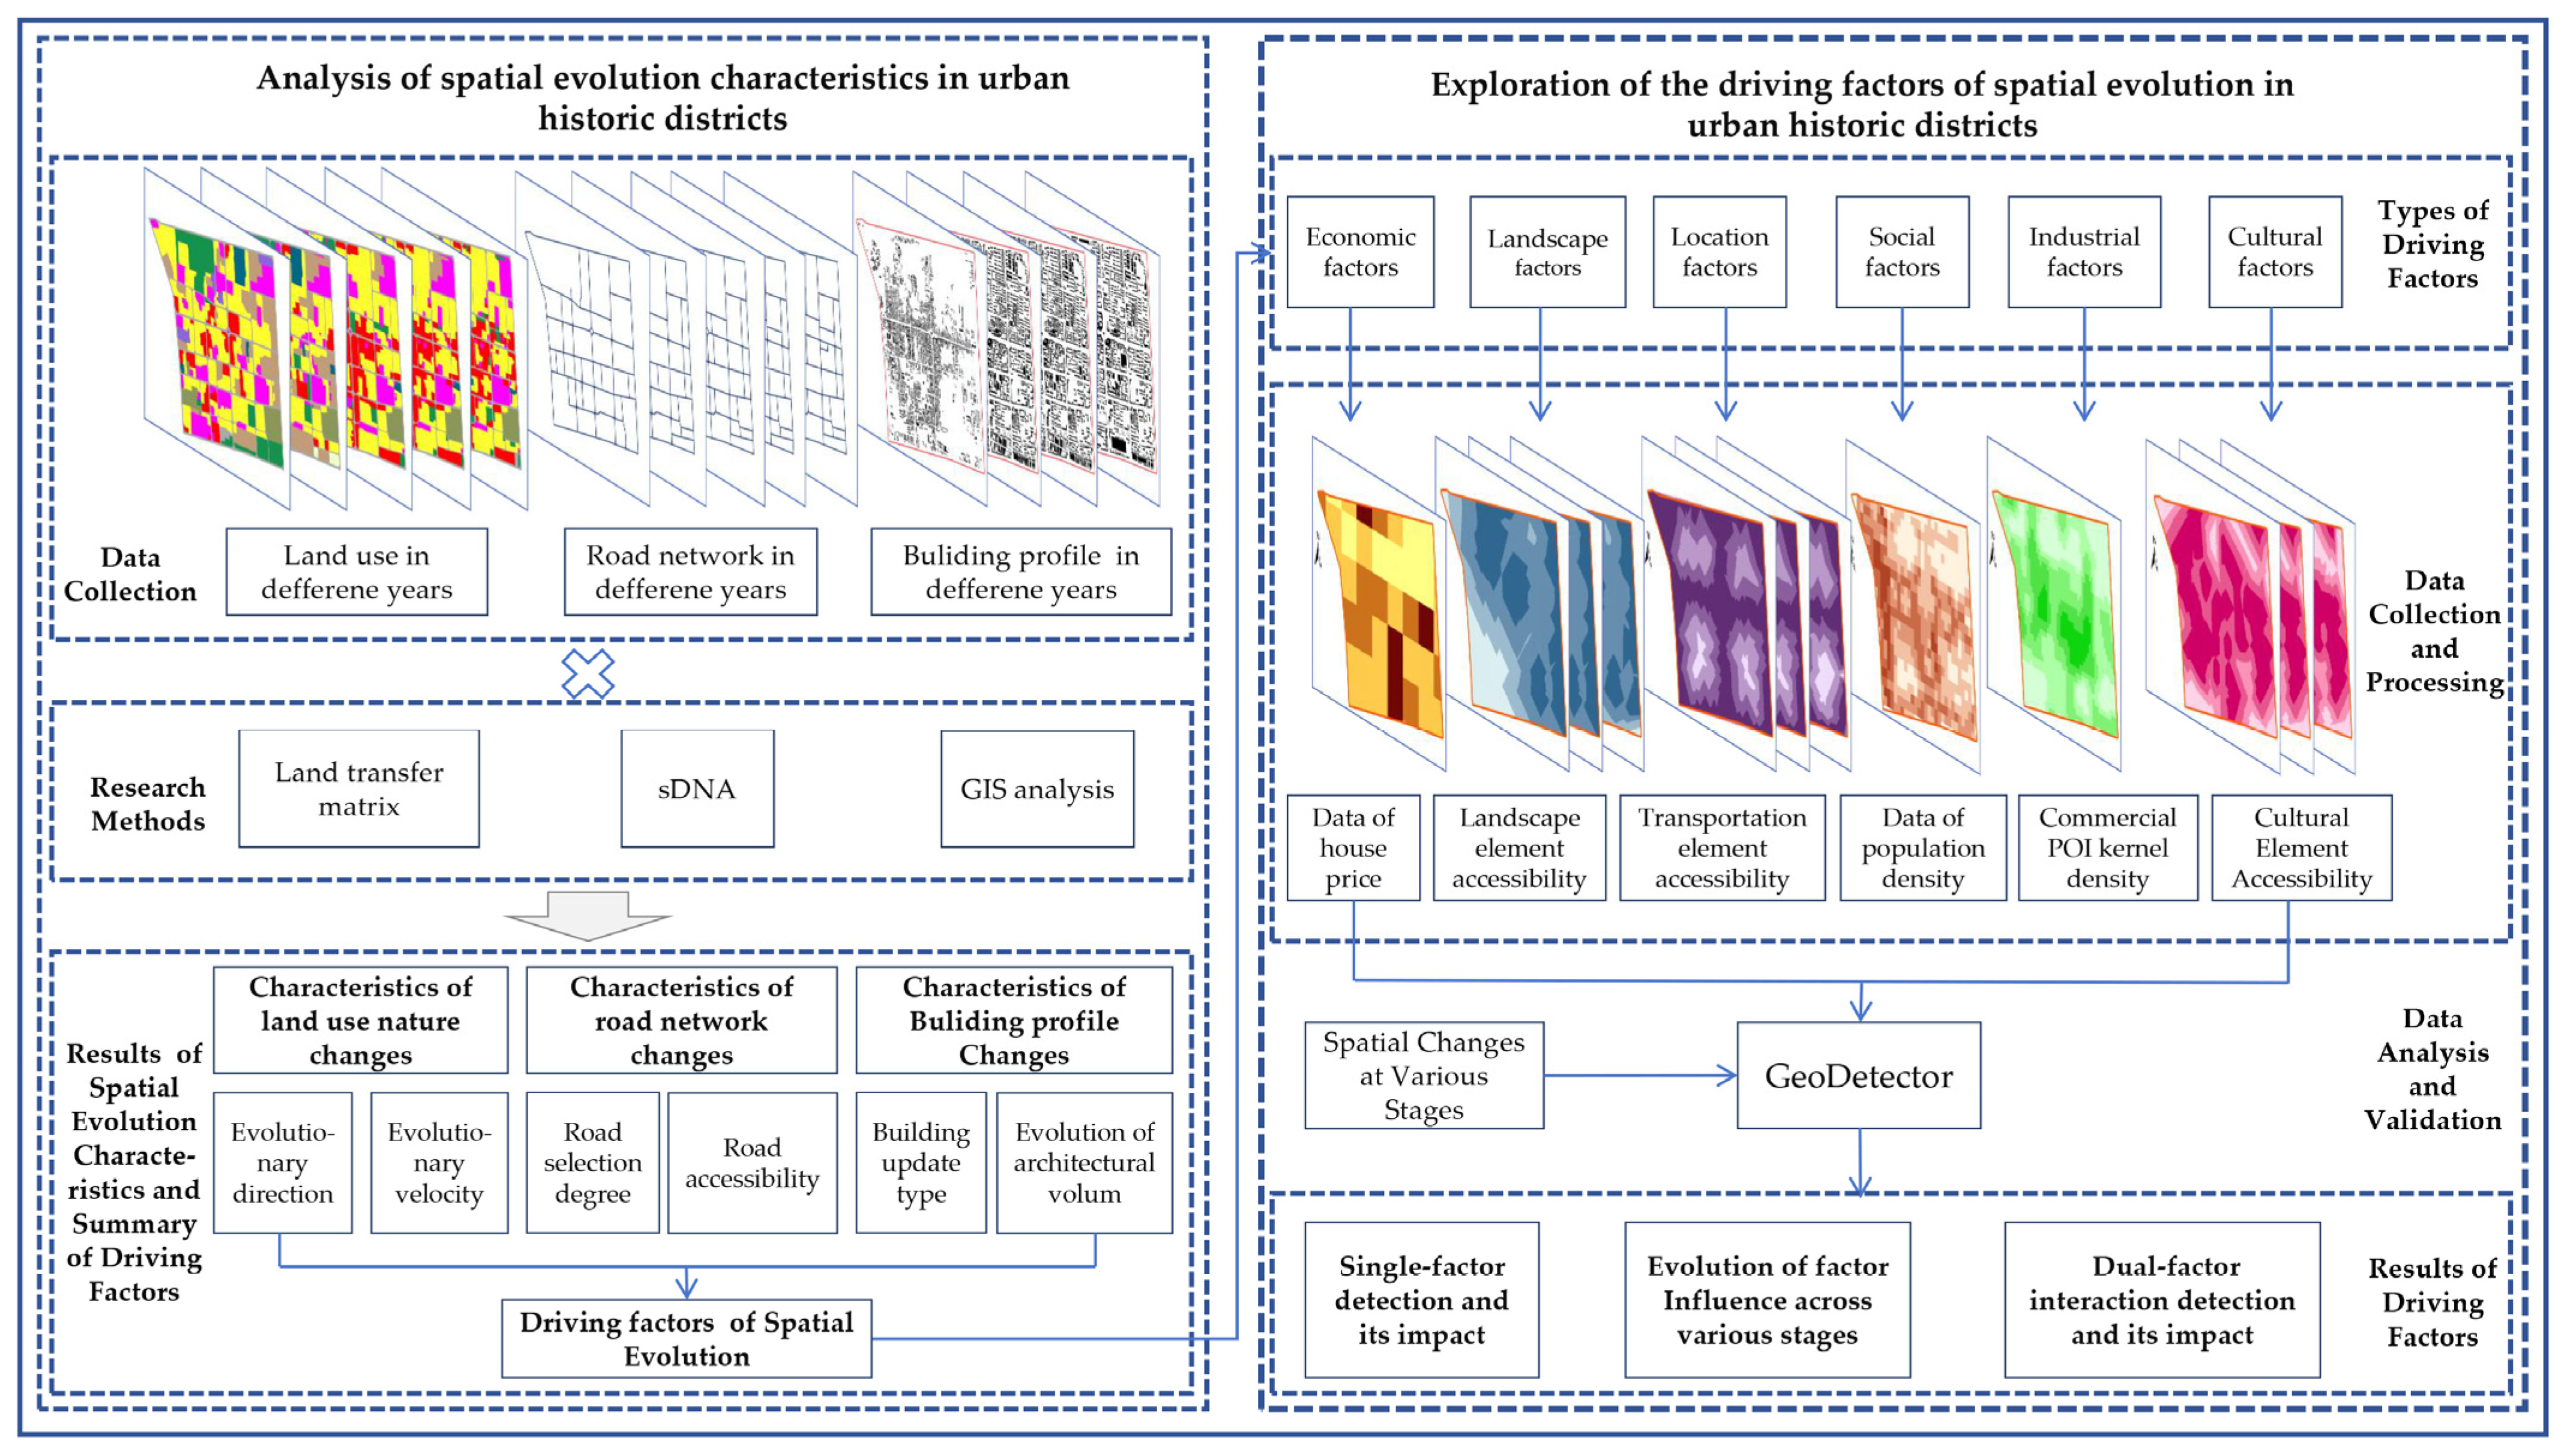
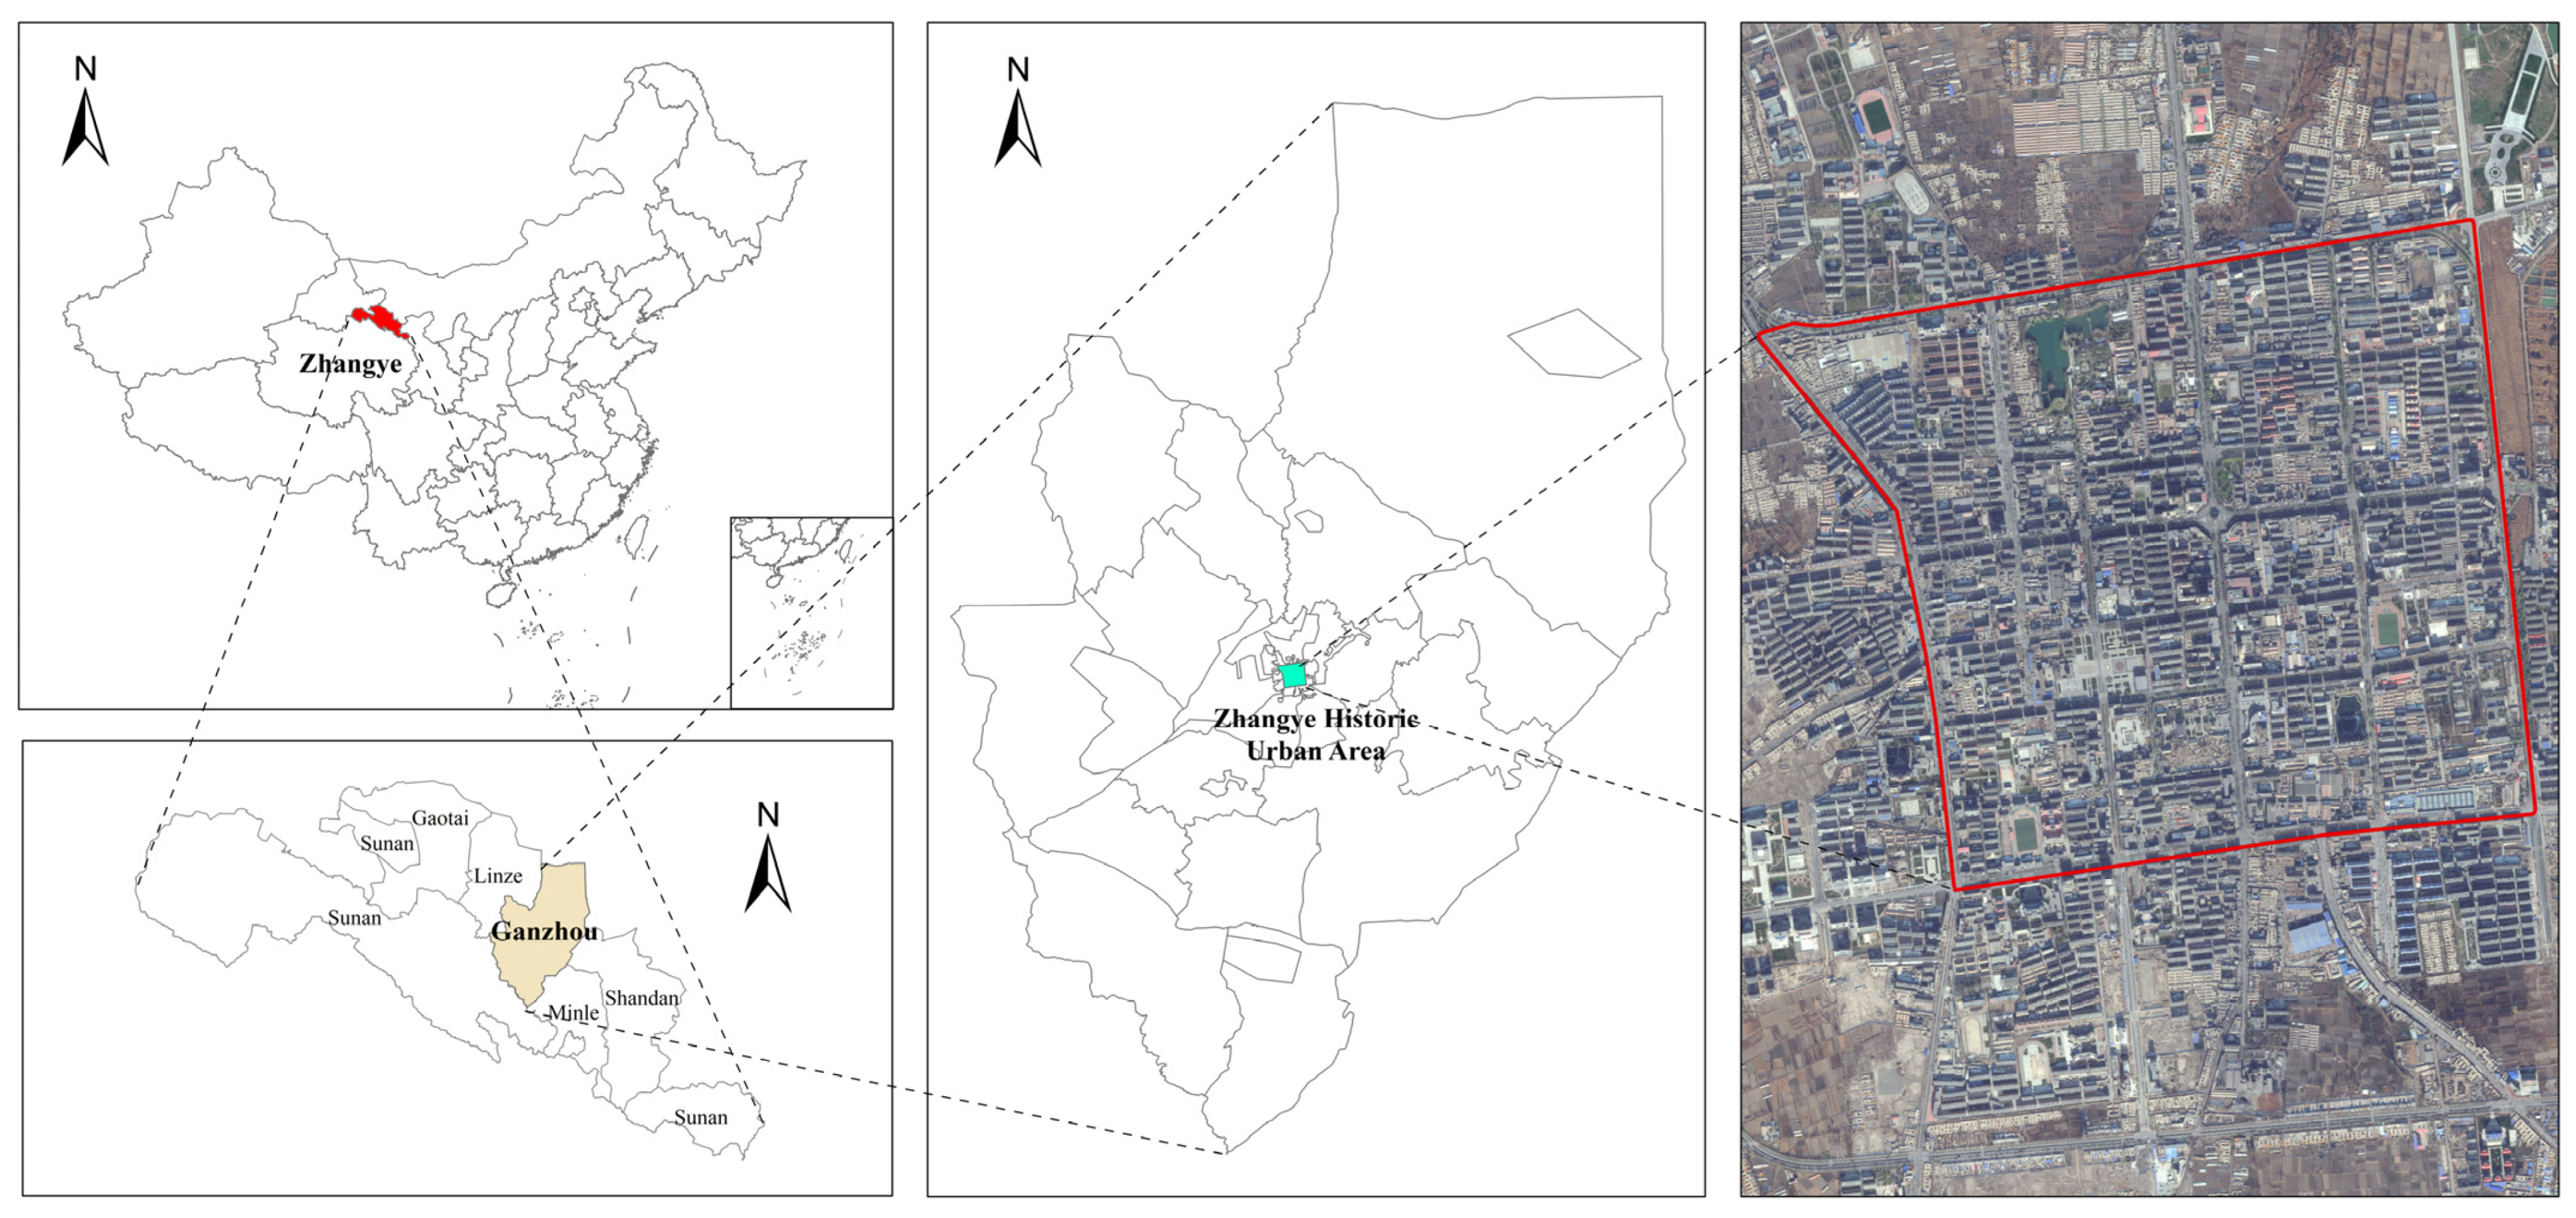
Therefore, this study takes the historical district of Zhangye as a case study and conducts research from the following three aspects: Firstly, it integrates systematic analytical approaches drawn from geography, urban morphology, and statistical methodologies and establishes a comprehensive research framework. Secondly, it attempts to clarify the mechanisms of spatial evolution in historical areas from land use, road network, and building profile aspects. Finally, focusing on the external manifestations of spatial evolution in historic districts, it analyzes the internal logic and driving factors: economic, landscape, location, social, industrial, and cultural factors.

2. Research Framework

The current research framework contains two parts: analysis of the spatial evolution characteristics and exploration of its driving factors in urban historical districts. Figure 1 depicts the research framework.

3. Data and Methods

3.1. Overview of the Study Area

Zhangye (37°36′ N–39°54′ N, 97°23′ E–102°13′ E), situated in the western part of Gansu Province, China, is an important historical city in the northwest region and a vital node on the Hexi Corridor section of the Silk Road. Established during the Tang Dynasty, the city has a history spanning over a thousand years. It has abundant historical and cultural resources as well as distinctive local characteristics. In 1986, Zhangye was officially designated as one of China’s historically and culturally famous cities. The urban area contains 2 national-level historical and cultural blocks and 1 provincial-level historical and cultural block, with 45 cultural relics protection units at various levels, 34 historical buildings, and numerous traditional residences. Since 1970, the historical urban district has undergone numerous renewals of varying scales, including demolition and construction activities. This has led to significant changes in the architectural texture, road pattern, and land use and substantial challenges to the preservation of the traditional characteristics and historical context.
Therefore, the urban historical district of Zhangye (Figure 2) was chosen as the study area. This district has the most abundant historical and cultural resources within the city, encompassing a total area of approximately 7.1 km2. By establishing a research framework for the spatial evolution mechanism, this study aimed to delineate the process of spatial evolution, determine its internal structure, and analyze its patterns within the district.

3.2. Data Source

For the purposes of this study, the data on land use in various stages (Figure 3) were obtained from the historical city master plans and territorial spatial planning materials provided by the Zhangye Municipal Bureau of Natural Resources (https://www.zhangye.gov.cn/wgxj/, accessed on 3 February 2024). This included the city master plans of Zhangye from 1981, 1991, 2004, and 2012, as well as the latest 2021 version of the “Zhangye Territorial Spatial Master Plan” (2021–2035), that is, five versions of the planning status maps. These maps were vectorized using ArcGIS and then classified according to China’s land use classification standards from 2011.
The road network data (Figure 4) were taken from the city master plans from 1981, 1991, 2004, and 2012 as well as the latest 2021 version of the “Zhangye Territorial Spatial Master Plan” (2021–2035), resulting in five versions of the planning status maps. These maps were integrated with the Google satellite imagery (https://www.google.cn/intl/zh-CN/earth/, accessed on 5 September 2023) from the corresponding periods to create vector data for the road center lines for each version using ArcGIS.
The building profile data (Figure 5) were obtained through the identification and extraction of the available imagery data, including the 1972 U.S. Keyhole satellite imagery (https://earthexplorer.usgs.gov/, accessed on 30 November 2023) and Google satellite imagery (https://www.google.cn/intl/zh-CN/earth/, accessed on 5 September 2023) from 2004, 2012, and 2016. After identifying and vectorizing the architectural textures for each year, the data on the building profile within the district were collected.
The data used to analyze the factors influencing the spatial evolution of the historic urban district included points of interest (POI) data, Python network data, WorldPop data, and data released by government departments. Moreover, the scope of Zhangye’s historic urban district referred to here is based on the designated area outlined in the “Conservation Plan for the Historic and Cultural City of Zhangye (2012–2020)” (Table 1).

3.3. Research Method

3.3.1. Land Transfer Matrix

The land transfer matrix is an algorithm for the quantitative statistical description of land use structure and the evolution of land use types between different years, which can be used to calculate the land use structure and the evolution of land use types [51,52,53,54]. In this study, this method was employed to analyze the characteristics of land use evolution within historic urban areas. The calculation was as follows:
S i j = S 11 S 1 n S n 1 S n n
Here, S i j represents the area of Class j land in year i.
Meanwhile, land transfer coefficient refers to the dynamic degree of land use, which quantified the evolution rate of land use within the study area in a given year. It encompasses both the single dynamic degree, indicative of change within a specific land use category, and the comprehensive dynamic degree, which reflects the aggregate transformation across all land use types. The calculations were made using the following equations:
S i , L U D = S i , L U t 2 S i , L U t 1 / S i , L U t 1 × t 2 t 1 1 × 100 %
S i , L U D = i = 1 n S i , L U / 2 i = 1 n S i , L U t 1 × t 2 t 1 1 × 100 %
To assess the holistic alterations across diverse land use categories, the extent of transformation for each land use type was quantified through the overall change amplitude ( S n j ), while the velocity of change was articulated using the comprehensive dynamic degree of single land use ( S j ). The calculations were made using Equations (4) and (5):
S n j = j = 1 n S i , L U D
S j = j = 1 n S i , L U D / n

3.3.2. Spatial Design Network Analysis (sDNA)

The spatial design network analysis (sDNA) model mainly applies to the analysis of traffic networks from the perspective of geometric structure and correlation analysis [55]. Here, roads are abstracted as axis networks, and the road network is divided into segments based on the intersections and road corners. Additionally, the closeness and betweenness of roads can be calculated in different years [56,57]. In this study, ArcGIS 10.7 and sDNA 4.1.1 were employed to calculate road network metrics across different years, thereby analyzing the evolution characteristics of the road network in the historic urban area of Zhangye. Among them, the value of NQPD (network quantity penalized by distance) reflects the proximity of the road, with a higher value indicating greater road accessibility. The value of betweenness reflects the frequency of road selection, with a higher value indicating a higher degree of road selectivity.
In this method, NQPD (network quantity penalized by distance), which takes distance as a resistance factor, was used to measure the accessibility of a section, using Equation (6):
N Q P D ( x ) = y R W ( y ) P ( y ) d ( x , y )
Here, x is the road section to be calculated, Rx is the set of other reachable sections within radius R starting from section x, W(y) is the weight of section y, d(x, y) is the distance between section x and y, and P(y) is the proportion of the length of section y within radius R.
Betweenness refers to the probability that a road section is between other different roads and that it is chosen for the shortest trip. If a section serves as the shortest path bridge frequently, then the centrality is stronger. The calculations were made using Equations (7) and (8):
Betweenness ( x ) = y N z R y W ( y ) W ( z ) P ( z ) O D ( y , z , x )
O D ( y , z , x ) = 1 ,   if   x   is   on   the   geodesic   found   from   y   to   z ; 1 / 2 ,   x = y z ; 1 / 2 ,   x = z y ; 1 / 3 ,   x = y = z ; 0 ,   otherwise
Here, N is the set of all road sections in the study area, Ry is the set of other reachable sections starting from the y section and within radius R, W(z) is the weight of section z, P(z) is the length proportion of road section z in Ry, and OD(y,z,x) is the assignment of the shortest path under different conditions.

3.3.3. GeoDetector

GeoDetector is a statistical method used to detect spatial differentiation and reveal the driving force of a change. It helps detect any correlation and similarity between the independent and dependent variables in spatial distribution [58,59]. By vectorizing the data of multiple independent variables and the dependent variable and inputting them into the GeoDetector software 2015 (http://www.geodetector.cn/, accessed on 3 March 2025), the p values and q values of each independent variable, as well as the interaction effects between two factors, can be calculated. In this research, the method has been employed to analyze the magnitude of the driving forces exerted by various factors on the spatial evolution of historic urban areas across different periods.
In single-factor detection, the q value represents the influence of a factor. The calculation was as follows:
q = 1 1 / N σ 2 h = 1 L N h σ h 2
Here, L represents the stratification of a variable; N and σ respectively represent the number and variance of units in the study area, respectively; Nh and σh are the number and variance of the h layer, respectively. The value range of q is [0, 1]. The larger the value of q, the stronger the explanatory ability of the independent variable to the dependent variable and the stronger its influence on the result [60]. In this study, the plot data reflecting the spatial changes in the historic urban area across different years were used as the dependent variable, while data from six aspects—economic; landscape; location; social; industrial; and cultural—were employed as independent variables. These variables were input into the GeoDetector to calculate and analyze the impact of each factor on the spatial evolution of the historic urban area at different stages. Additionally, the interaction detection function of the GeoDetector was utilized to analyze the interaction effects between pairs of factors.

4. Results

4.1. Evolution Characteristic Analysis

4.1.1. Characteristics of the Land Use Evolution

Based on the vector data on land use at various stages, a land use transfer matrix for the study area was established. Based on the analysis results, the evolution of land use types was categorized into five patterns:
  • Increasing type: This included commercial and business land and road, street, and transportation land, with the proportion of such land use showing an increasing trend as the district developed.
  • Decreasing type: This included industrial and manufacturing land as well as logistics and warehouse land, with the proportion of these land use types decreasing as the secondary industry within the historical urban district diminished.
  • Stable type: This included special land and administration and public services land, which experienced minimal changes and remained essentially stable.
  • Decreasing and then increasing type: This included green space and square land as well as public utility land, which initially decreased due to other constructions and then increased as the population grew and the demand for facilities increased.
  • Special type: This includes residential land, which is characterized by changes that are primarily divided into three phases. In the first phase, low-rise, high-density housing was rebuilt into multi-story, low-density housing, leading to a decrease in residential land use. In the second phase, economic development promoted an increase in population within the district, resulting in an increase in residential land use. In the third phase, policies related to shantytown renovation and the renewal of old residential areas led to the redevelopment of old communities, causing a decline in residential land area (Figure 6).
The results of the calculation of land transfer matrix indicate that the pace of the spatial evolution of the historical urban district exhibited a wave-like characteristic. Commercial and business land experienced the greatest increase and industrial and manufacturing land the greatest decrease in amplitude, followed by the logistics and warehouse land. Furthermore, the transformation of the secondary industry to tertiary industry had a direct impact on the changes in land use. The calculation of the comprehensive dynamic degree of single land use showed that industrial and manufacturing land underwent the fastest overall change, while the administration and public services land changed at the slowest pace (Table 2).
According to the statistics on land use transfer in various stages, the area of land use change from 1981 to 1991 was 180.62 hectares. From 1991 to 2004, the area of land use change was 311.26 hectares. The area of total land change from 2004 to 2012 was 74.9 hectares. The area of land changed from 2012 to 2021 is 66.53 hectares. Overall, the area of land use change in Zhangye’s historic urban area increased from 1981 to 2004, while it decreased from 2004 to 2021, indicating that the district has shifted from large-scale to small-scale reconstruction, and the land use change in Zhangye’s historic urban district has gradually become stable (Figure 7).

4.1.2. Evolution Characteristics of the Road Network

sDNA was used to analyze the betweenness and NQPD for five years in the historic urban district. The analysis found that from 1981 to 2021, road selection degree and proximity in historic urban districts gradually increased; road network length, road network density, and road land area steadily increased; and the growth rate slowed down, indicating that the road traffic system continuously improved. The evolution of the historic urban road system is mainly reflected in the addition of roads and adjustment of road linearity (Figure 8).
In the historic urban district, the cross-shaped road skeleton pattern centered on the Drum Tower as well as the traditional street pattern were retained. Based on the standard deviation analysis of road betweenness and NQPD, the increasing standard deviation of choice degree indicates that the dispersion of road traffic choice degree and the difference of road traffic volume were enhanced, and the roads were more prone to congestion. Meanwhile, the standard deviation of proximity decreased, indicating that the proximity difference of the district decreased and the overall road accessibility increased (Table 3). In addition, the length and density of the road network have gradually increased, indicating that the road system of the Zhangye historic urban area was constantly improving.

4.1.3. Evolution Characteristics of the Building Profile

Employing the overlay analysis technique within ArcGIS, this study examined the architectural transformations in the study area across 1972, 2004, 2012, and 2021. Based on the findings, the patterns of architectural renewal in the urban historical district can be categorized into four distinct types:
  • Setback: In response to the surge in population and vehicular traffic, structures along the primary thoroughfares were dismantled, with new constructions set back to expand the road widths.
  • Integration: Demolition of high-density, low-rise, and small-scale buildings was followed by land use consolidation, leading to the development of new low-density, multi-story or high-rise, large-scale structures that encompassed the integration and construction of commercial, office, and residential complexes.
  • Demolition: To create green spaces or squares, certain existing structures within sight corridors and key public building areas were razed, thereby clearing principal pathways and dispersing pedestrian traffic.
  • Addition: In zones with low-density construction, new buildings were erected on peripheral vacant lands to augment architectural density (Table 4).
From 1972 to 2021, there was a significant increase in both the maximum and average building areas; however, the minimum area remained relatively stable (Table 5). This trend suggests a continuous consolidation of building space and an escalation in building volume. The data analysis revealed a decrease in the number of buildings smaller than 400 m2 but a gradual increase in the number of buildings ranging from 1000 to 1600 m2. This shift reflects the erosion of traditional architectural textures and the emergence of new ones (Figure 9). Additionally, the standard deviation of the building footprint exhibited a year-on-year upward trend, indicating an increased dispersion in building volumes and a growing divergence in building profiles.

4.2. Analysis of the Spatial Evolution Driving Factors

4.2.1. Analysis of the Single-Factor Detection and Its Impact

Based on the analysis of the renewal characteristics in Zhangye’s urban historical district discussed earlier, this study categorized the driving factors of spatial evolution into six aspects: economic, landscape, location, social, industrial, and cultural factors. Subsequently, relevant specific data were collected as independent variables to represent these factors, while the spatial evolution of the urban historical district at various stages was treated as the dependent variable (Table 6). These data were then input into the GeoDetector for analysis. The landscape, location, and cultural factors were based on the data sourced from various years, while the economic, social, and industrial factors were derived using the data from 2021.
According to the GeoDetector results, all factors that influenced spatial evolution were significant at each stage, with larger q-values implying a stronger influence. The main factors influencing the spatial evolution of the urban historical district were the economic and industrial factors from 1981 to 1991, economic and landscape factors from 1991 to 2004, industrial and landscape factors from 2004 to 2012, and economic and industrial factors from 2012 to 2021 (Table 7).
Synthesizing the influencing factors of spatial evolution across the four stages, economic factors had the strongest influence, followed by the landscape and industrial factors and then cultural and location factors. A weak correlation was found between population density and the spatial evolution of the urban historical district, indicating that social factors had a relatively minor impact on the spatial evolution. Furthermore, as society developed and the industrial structure adjusted, the influence of cultural factors on the spatial evolution of the urban historical district was found to strengthen gradually. This trend underscores that alterations in the spatial fabric of historical urban areas are frequently in positive correlation with shifts in a spectrum of cultural elements, with this correlation becoming increasingly robust over time. Consequently, safeguarding the cultural elements within historic urban areas emerges as an exceedingly crucial component in the endeavor to preserve their traditional spatial configurations. However, as transportation development in the urban historical district approached saturation, the role of location factors in spatial evolution decreased.

4.2.2. Analysis of the Dual-Factor Interaction Detection

The Geographical Detector was used to perform a dual-factor exploration of the influencing factors on the spatial evolution of Zhangye’s urban historical district from 1981 to 2021. The results indicate that the dual-factor interactions were characterized by nonlinear enhance and bi-variable enhance: q(X1∩X2) > Max(q(X1,X2)) and q(X1∩X2) > q(X1) + q(X2), respectively. This suggests that the combined effect of two factors on the spatial evolution of the district was greater than the effect of either factor alone. Specifically, the economic factors combined with other factors exhibited the strongest influence from 1991 to 2004 and 2012 to 2021; similarly, the industrial factors combined with other factors had a significant impact from 1981 to 1991 and 2004 to 2012 (Figure 10).

5. Discussion

The historic urban areas of a city are concentrated regions of urban historical and cultural heritage, embodying the city’s unique appearance, traditional culture, and historical information. On one hand, they contribute to the continuation of urban cultural context and urban characteristics. On the other hand, they provide the foundation and physical space for the development of the city’s economy and society. However, historical districts worldwide, including those in the United States, Germany, Malaysia, Russia, Ethiopia, Iran, and other countries, have suffered from the destruction of their traditional urban fabric due to the impact of economic development [61,62,63,64]. Thus, the spatial evolution and protection of historical districts have become significant issues in the planning and development of historical cities. This study’s research framework addressing the spatial evolution characteristics and driving factors of urban historic districts plays an essential role in elucidating the mechanisms underlying the spatial evolution of historical sites. It provides methodological insights into the developmental context, patterns, and characteristics of historical urban districts. In addition, the result of this study provides a research foundation for the preservation of historical sites and guidance for spatial management and planning in such areas, which are as follows:
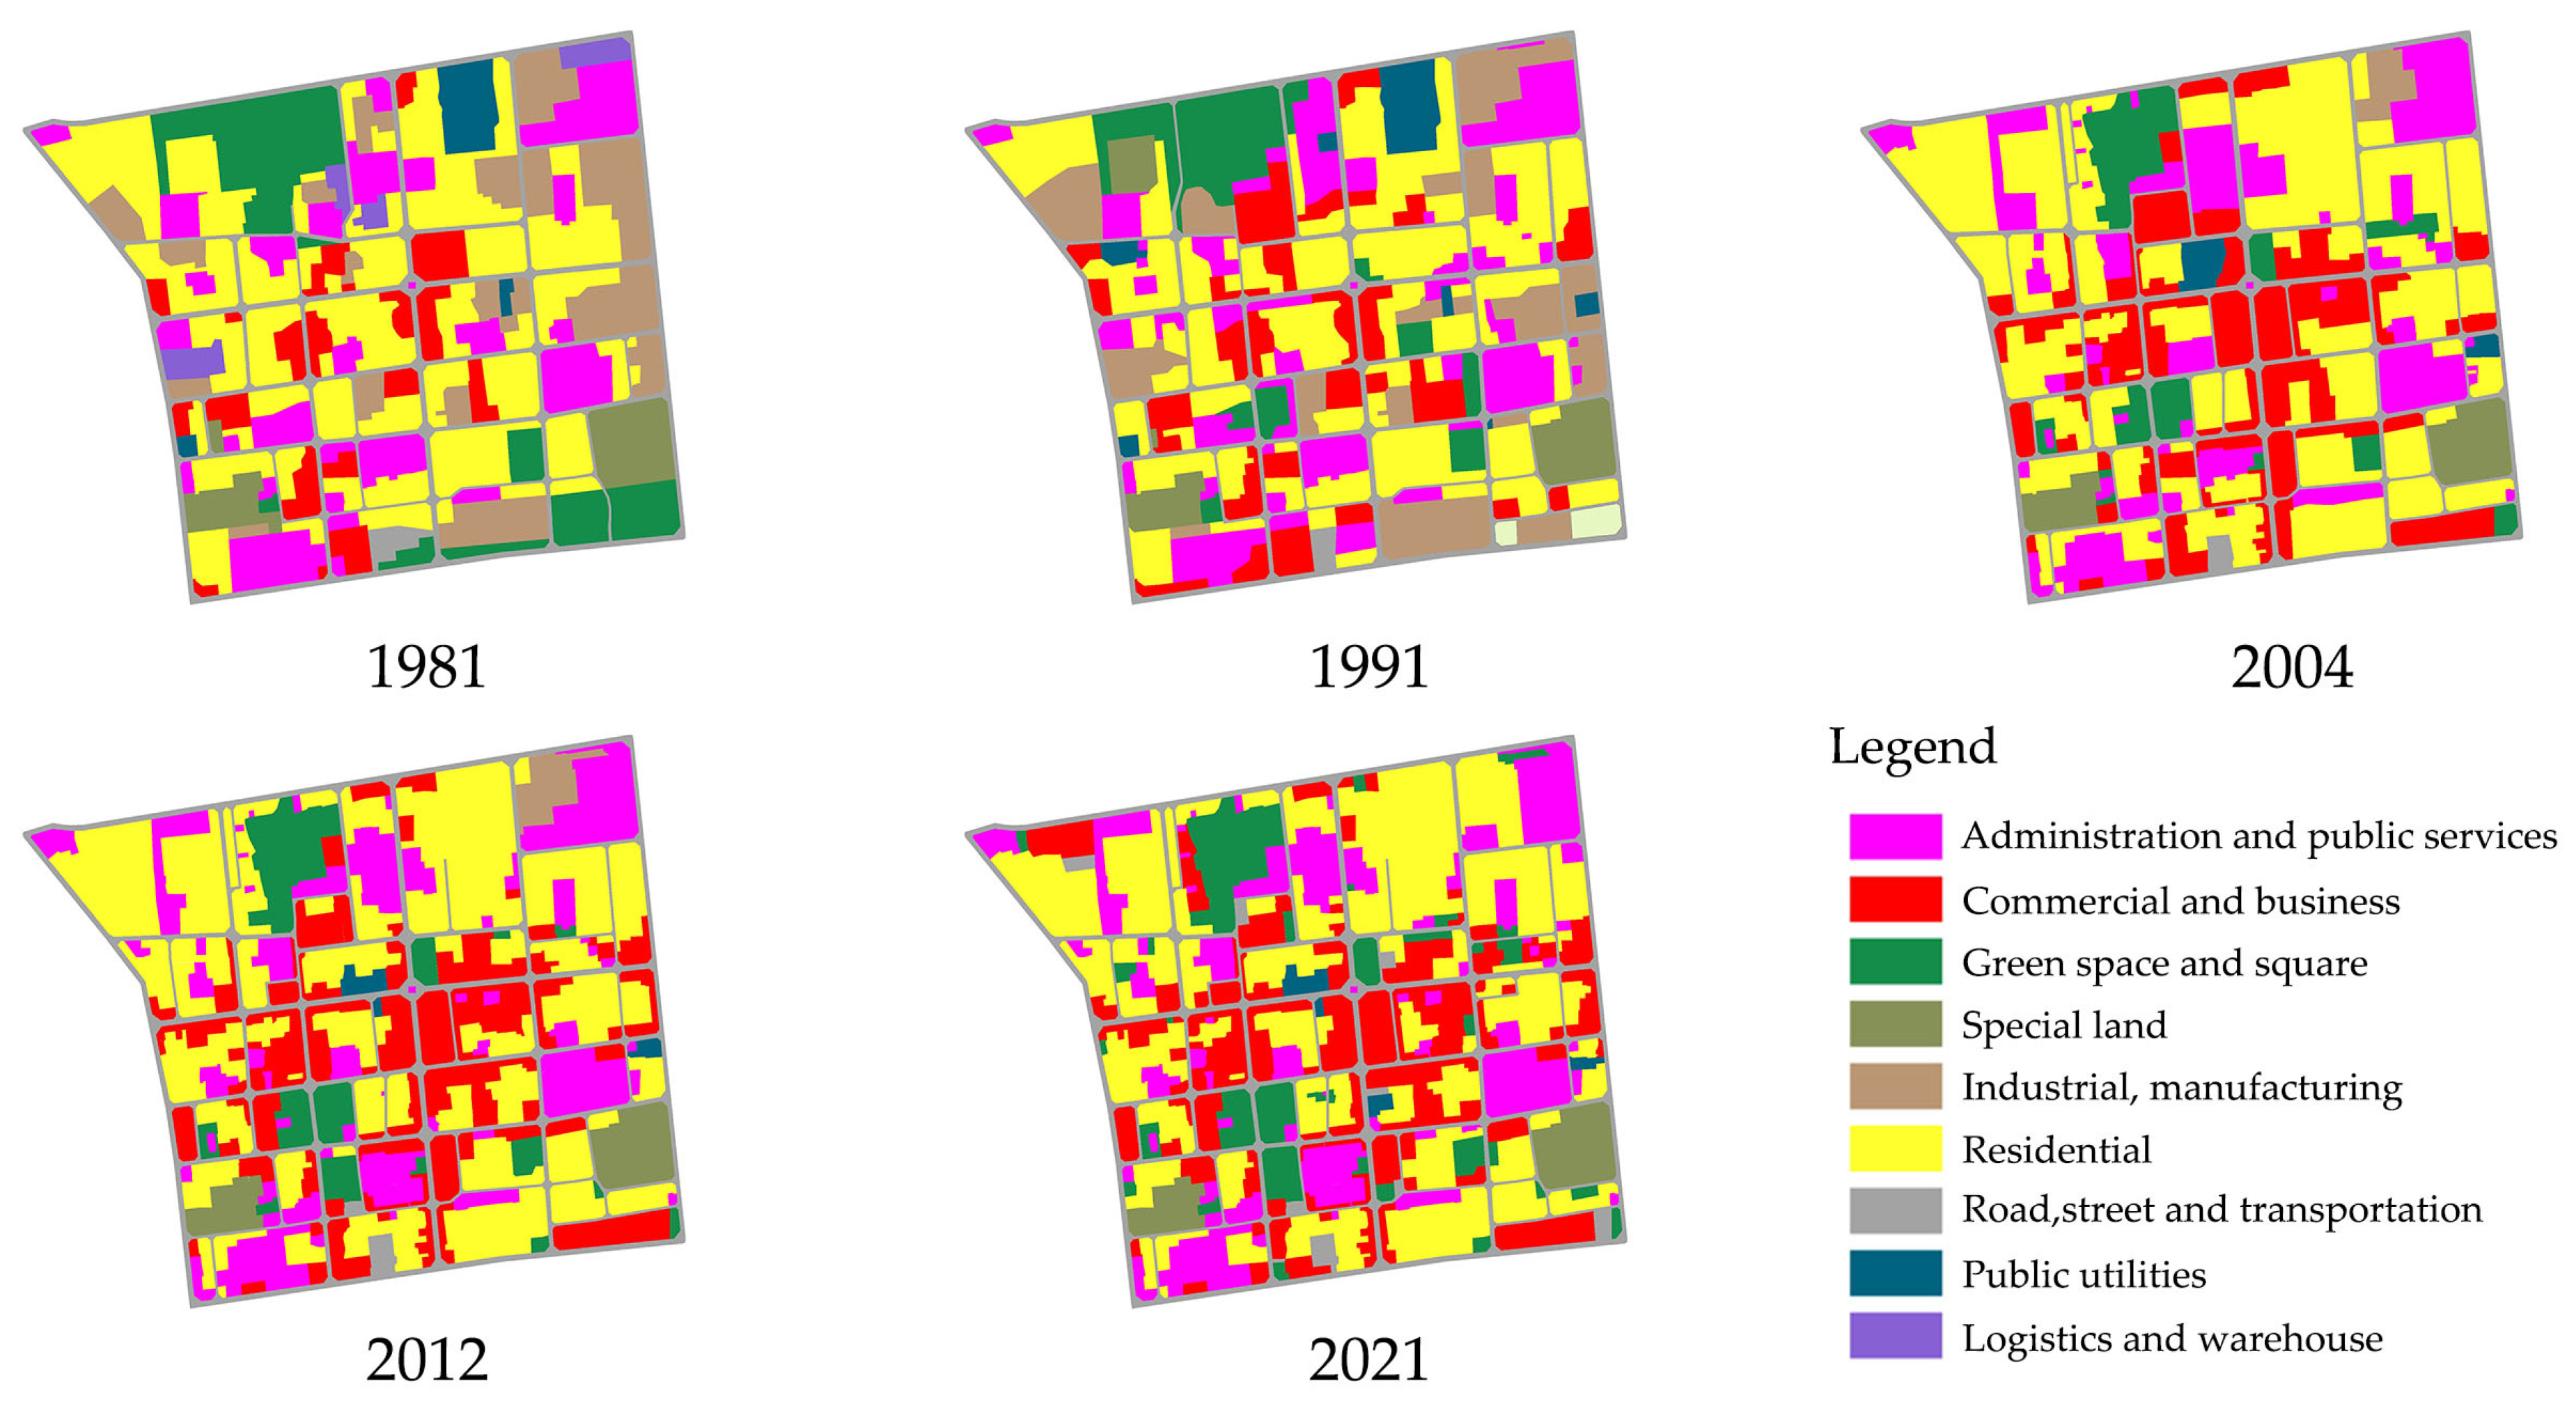
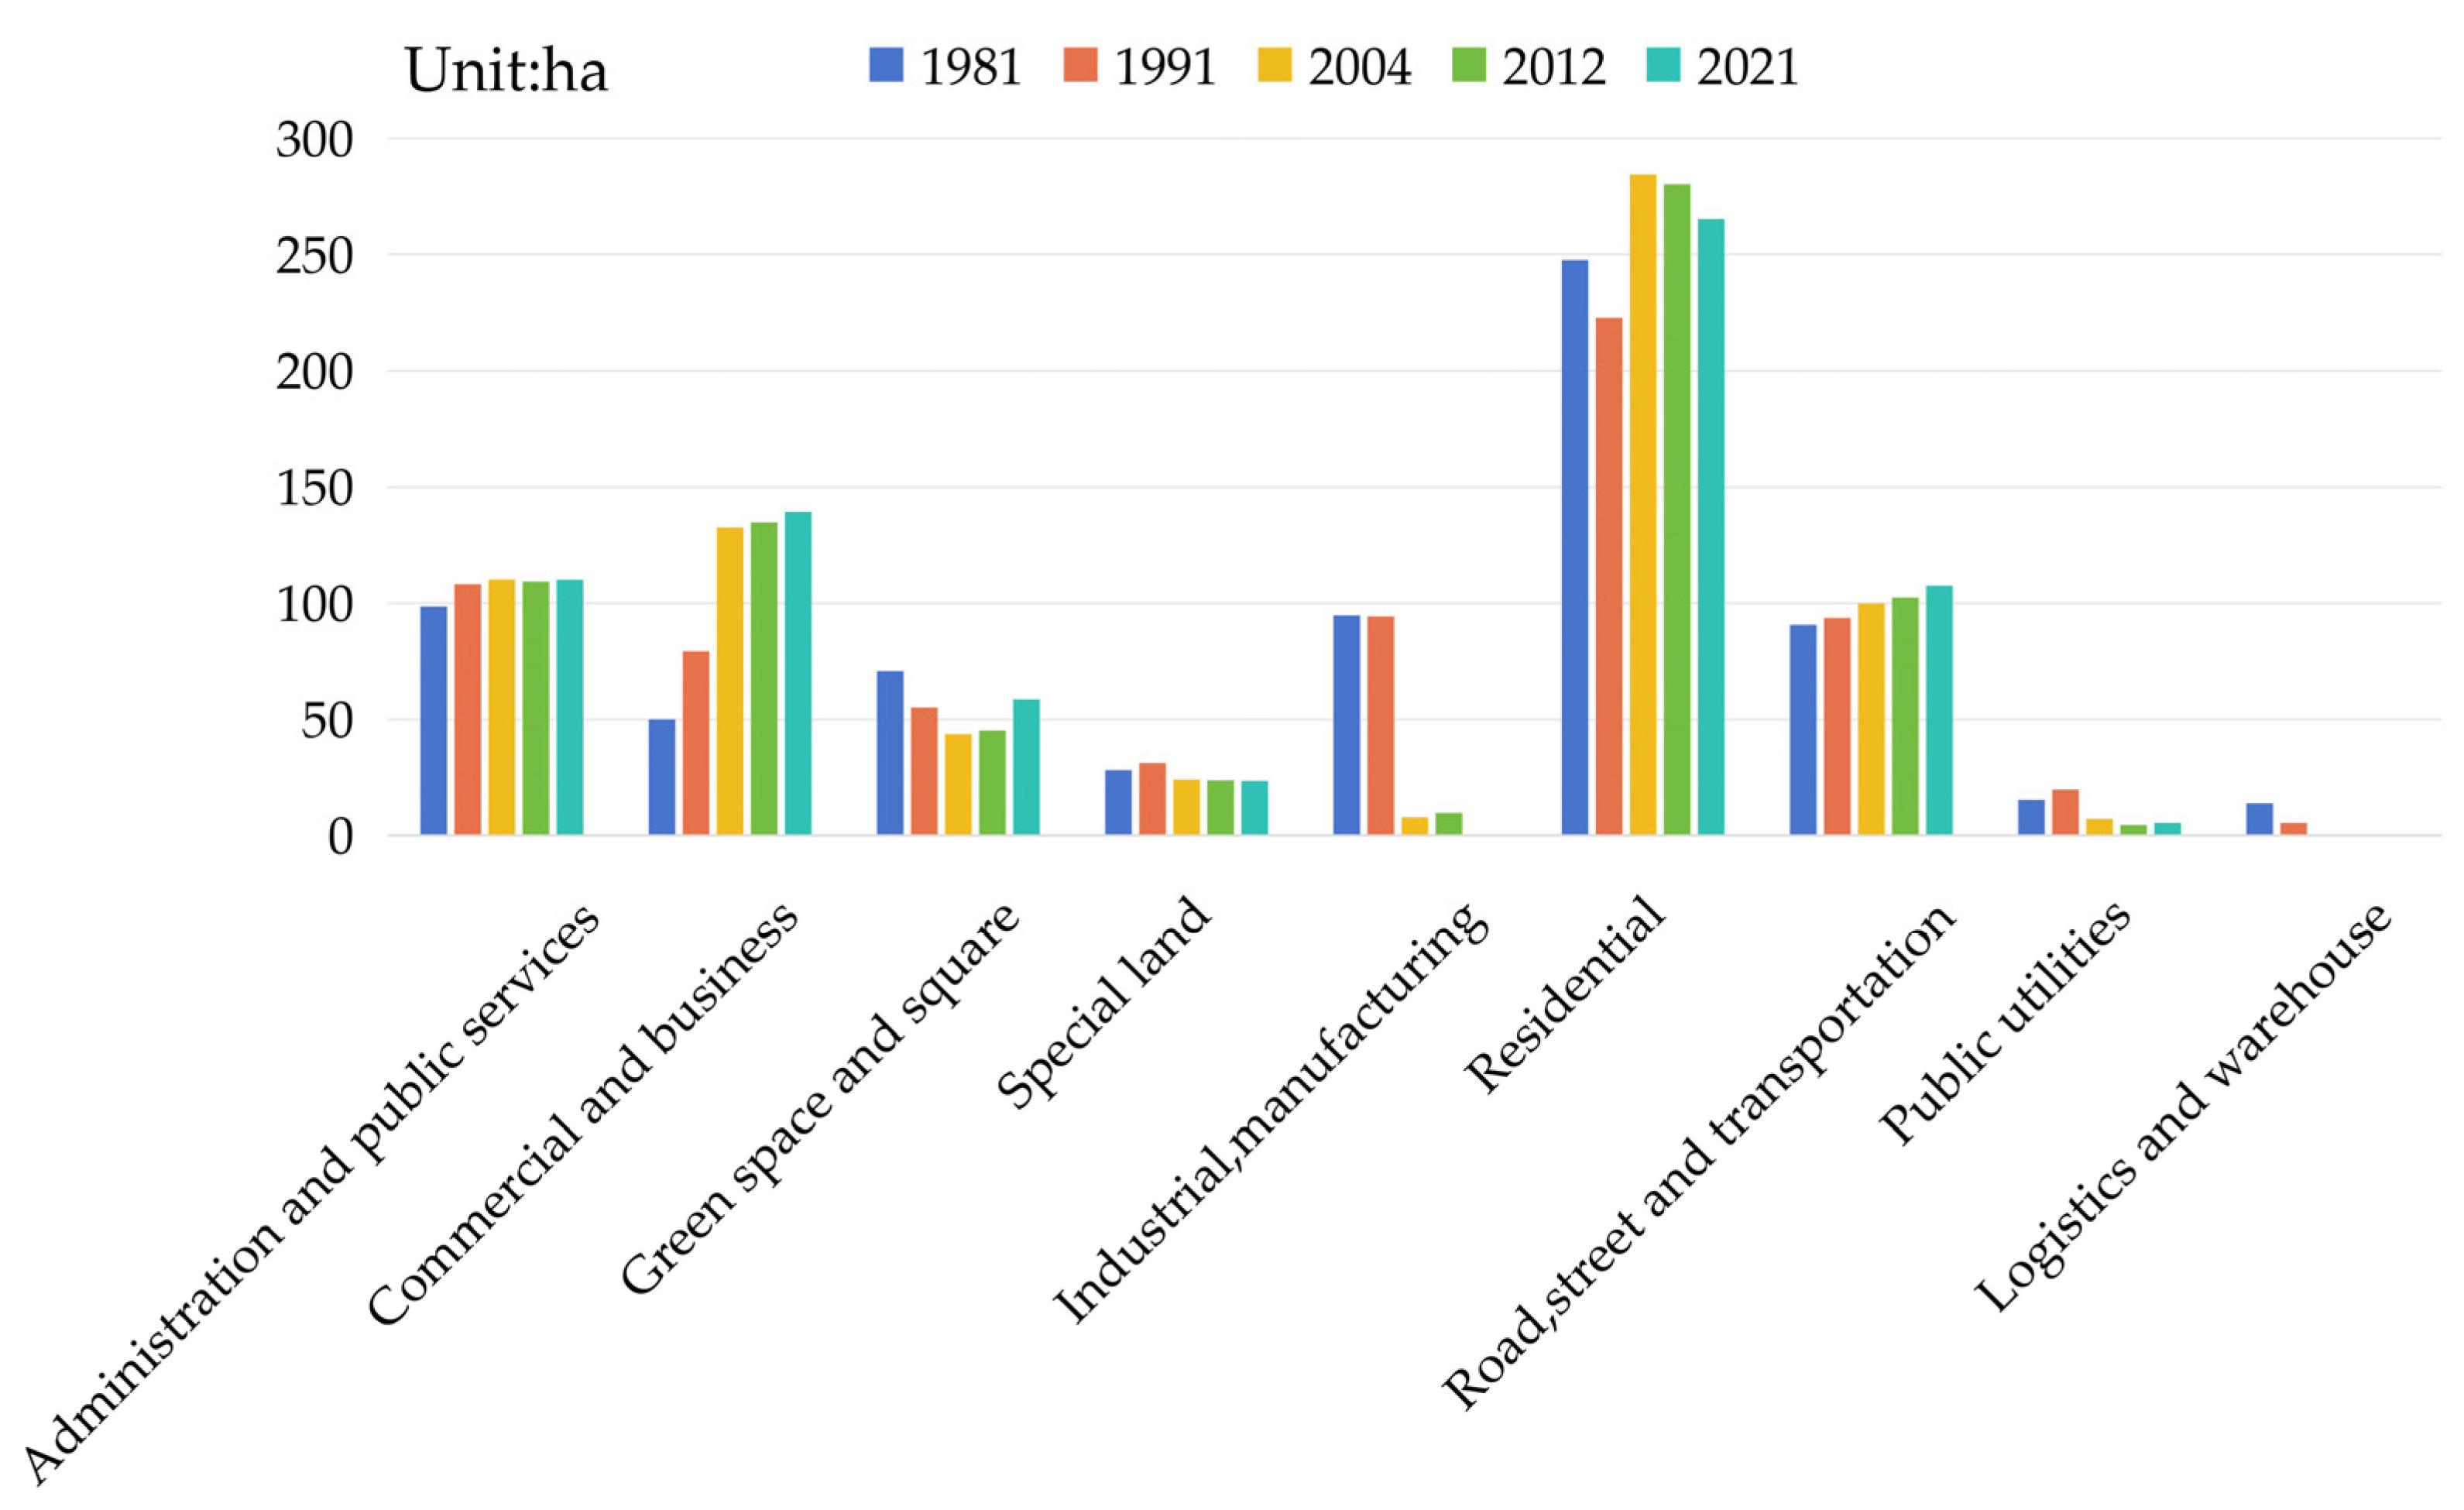
First, the spatial evolution and functional transformation of historical districts are often accompanied by changes in land use. In the current practice of protecting historical urban areas in China, historical buildings and districts within the urban area are protected by designating core protection zones and construction control areas. However, this method of regional division is rather coarse, and there is a lack of a refined management system for the use of these areas. As a result, the traditional urban fabric and distinctive characteristics of historical urban areas are being compromised during urban renewal. Urban planners and managers can implement a tiered and categorized management of land use based on varying protection needs, classifying land into three types based on its capacity to change use functions: land that can change its use function, land that can change its use function under certain conditions, and land that cannot change its use function. Moreover, detailed conservation plans for historical urban areas, as well as relevant standards and regulations for the management of historical urban renewal, should be formulated for specific historic urban areas to enhance the management and control of related constructions within these areas. This approach will help to better preserve the traditional layout of historic urban areas during the process of urban development.
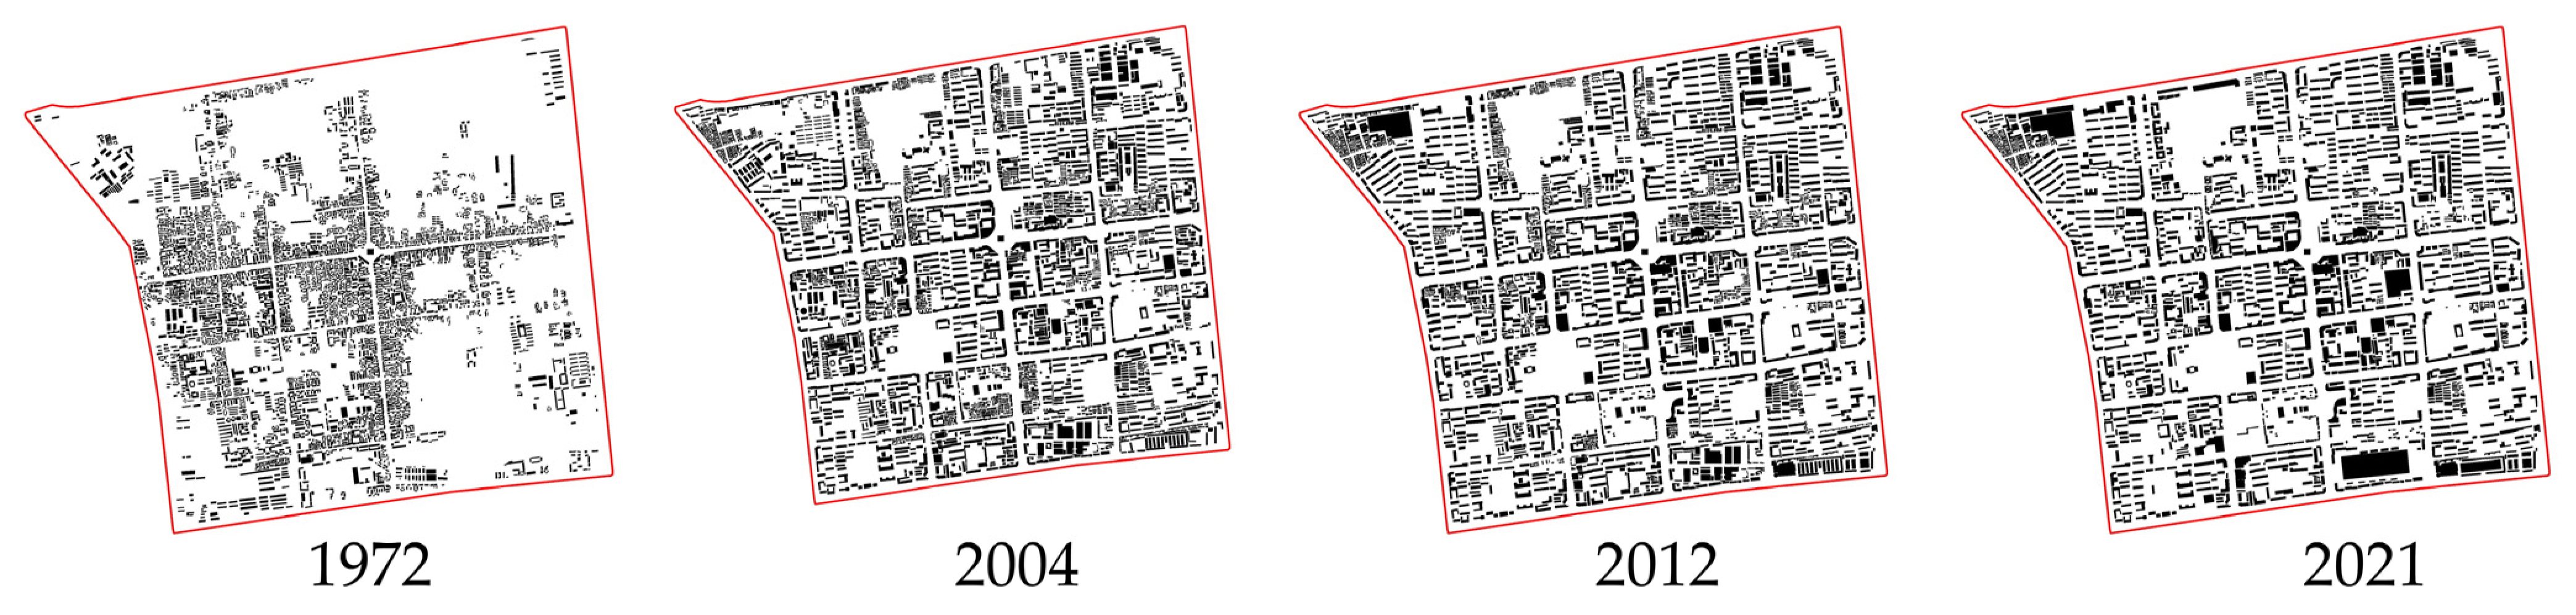
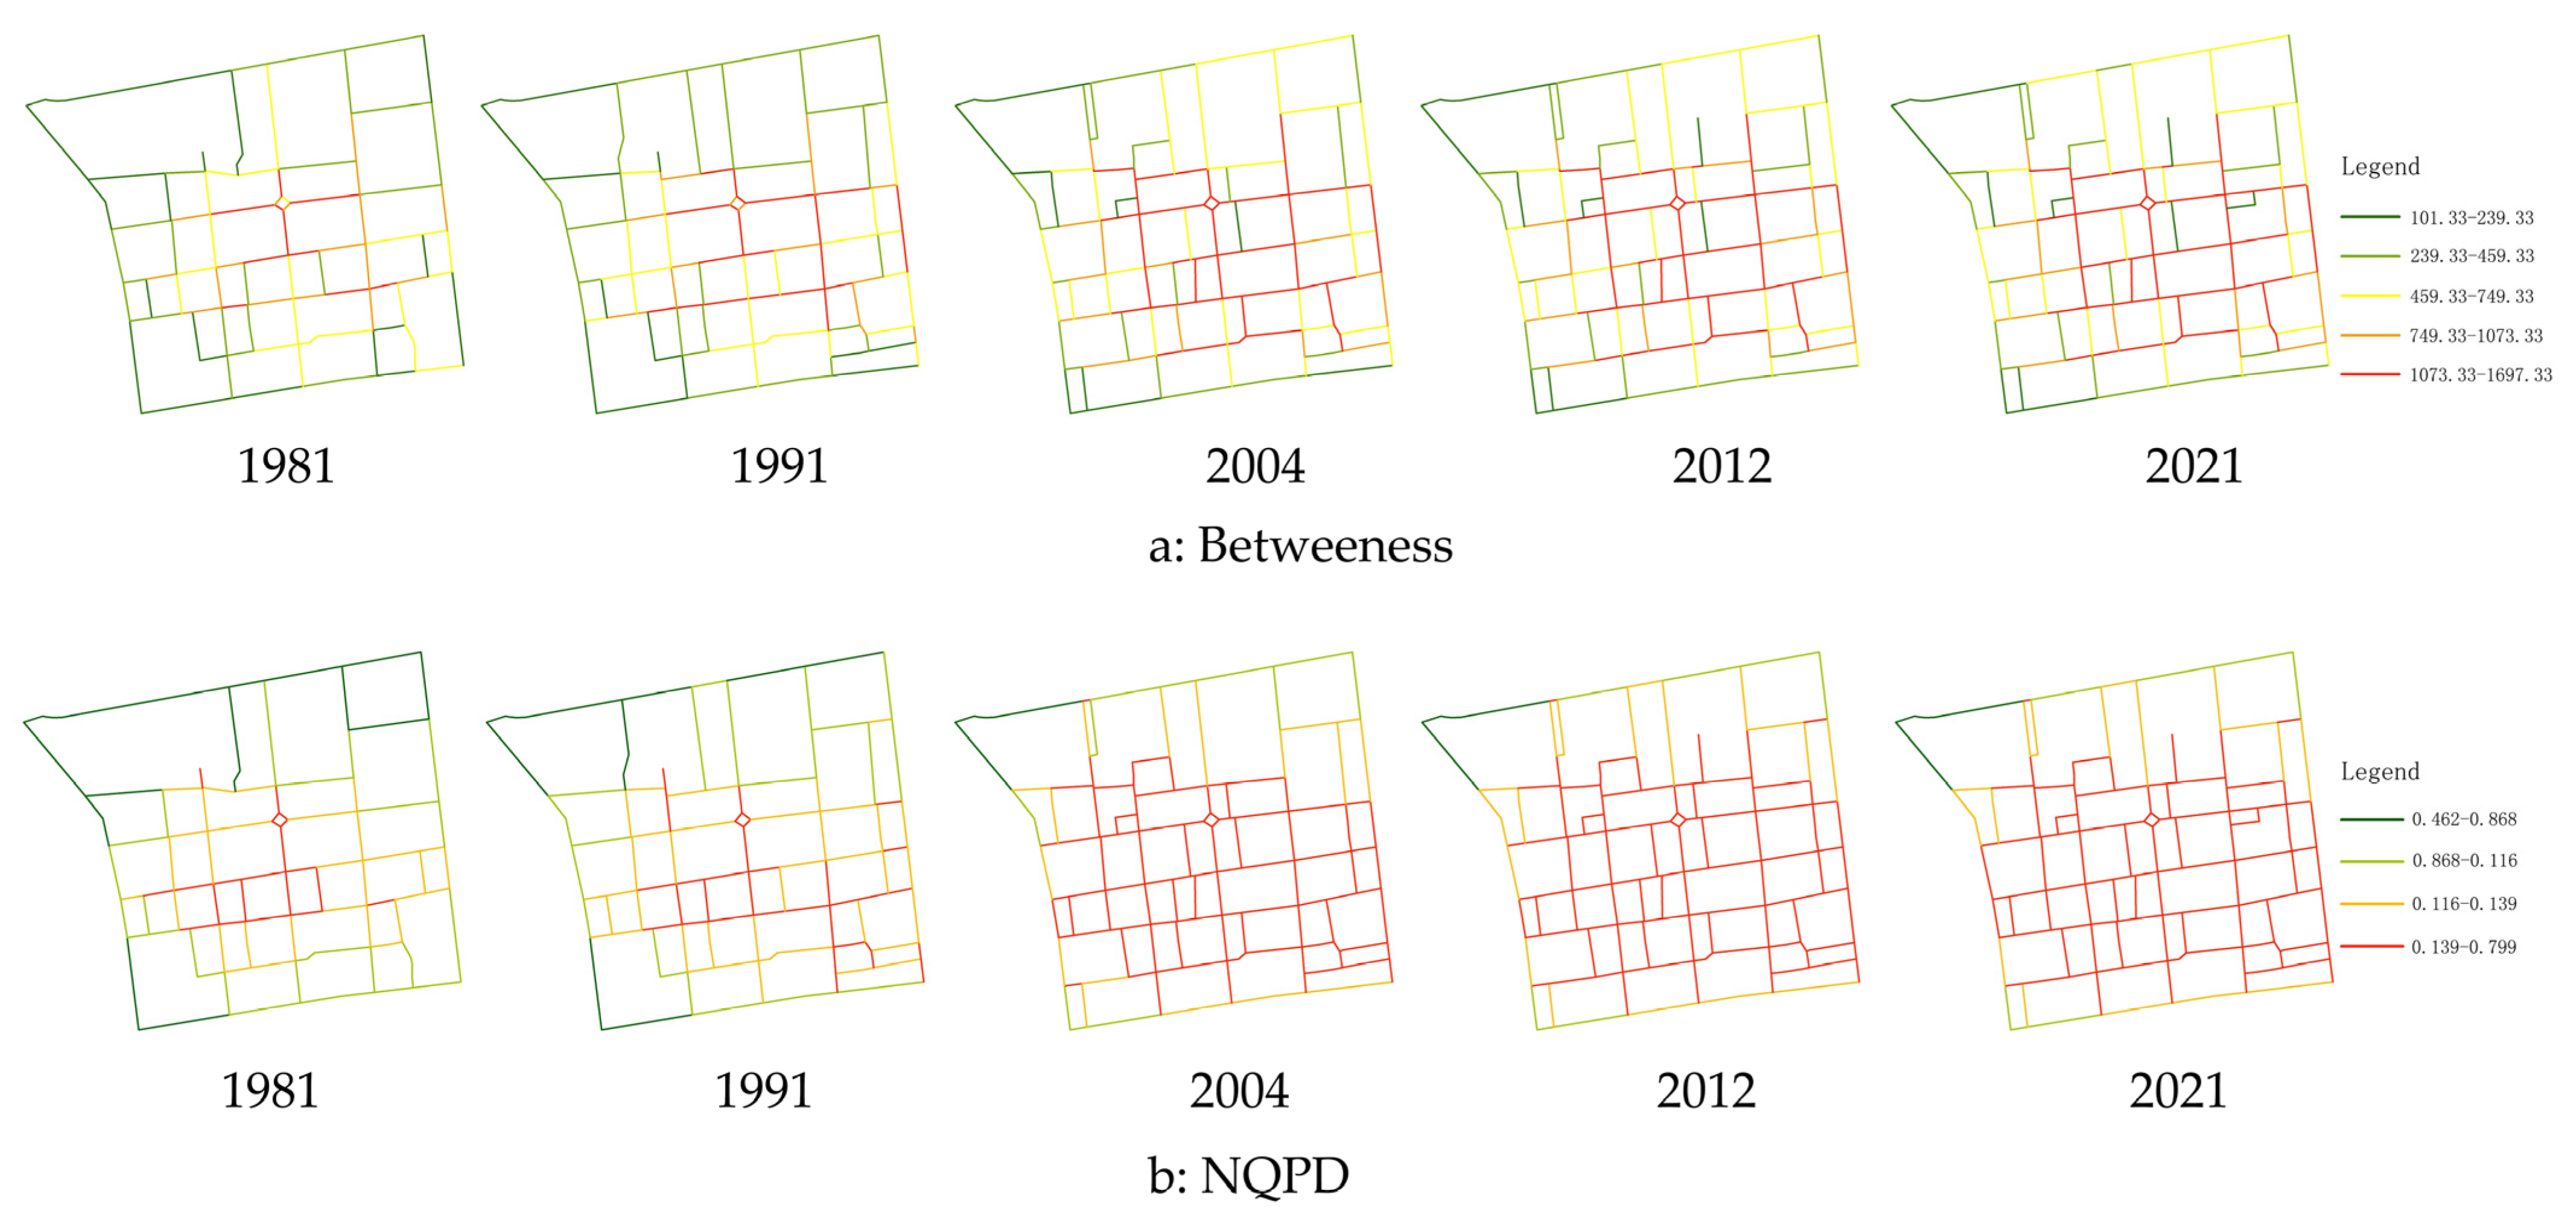
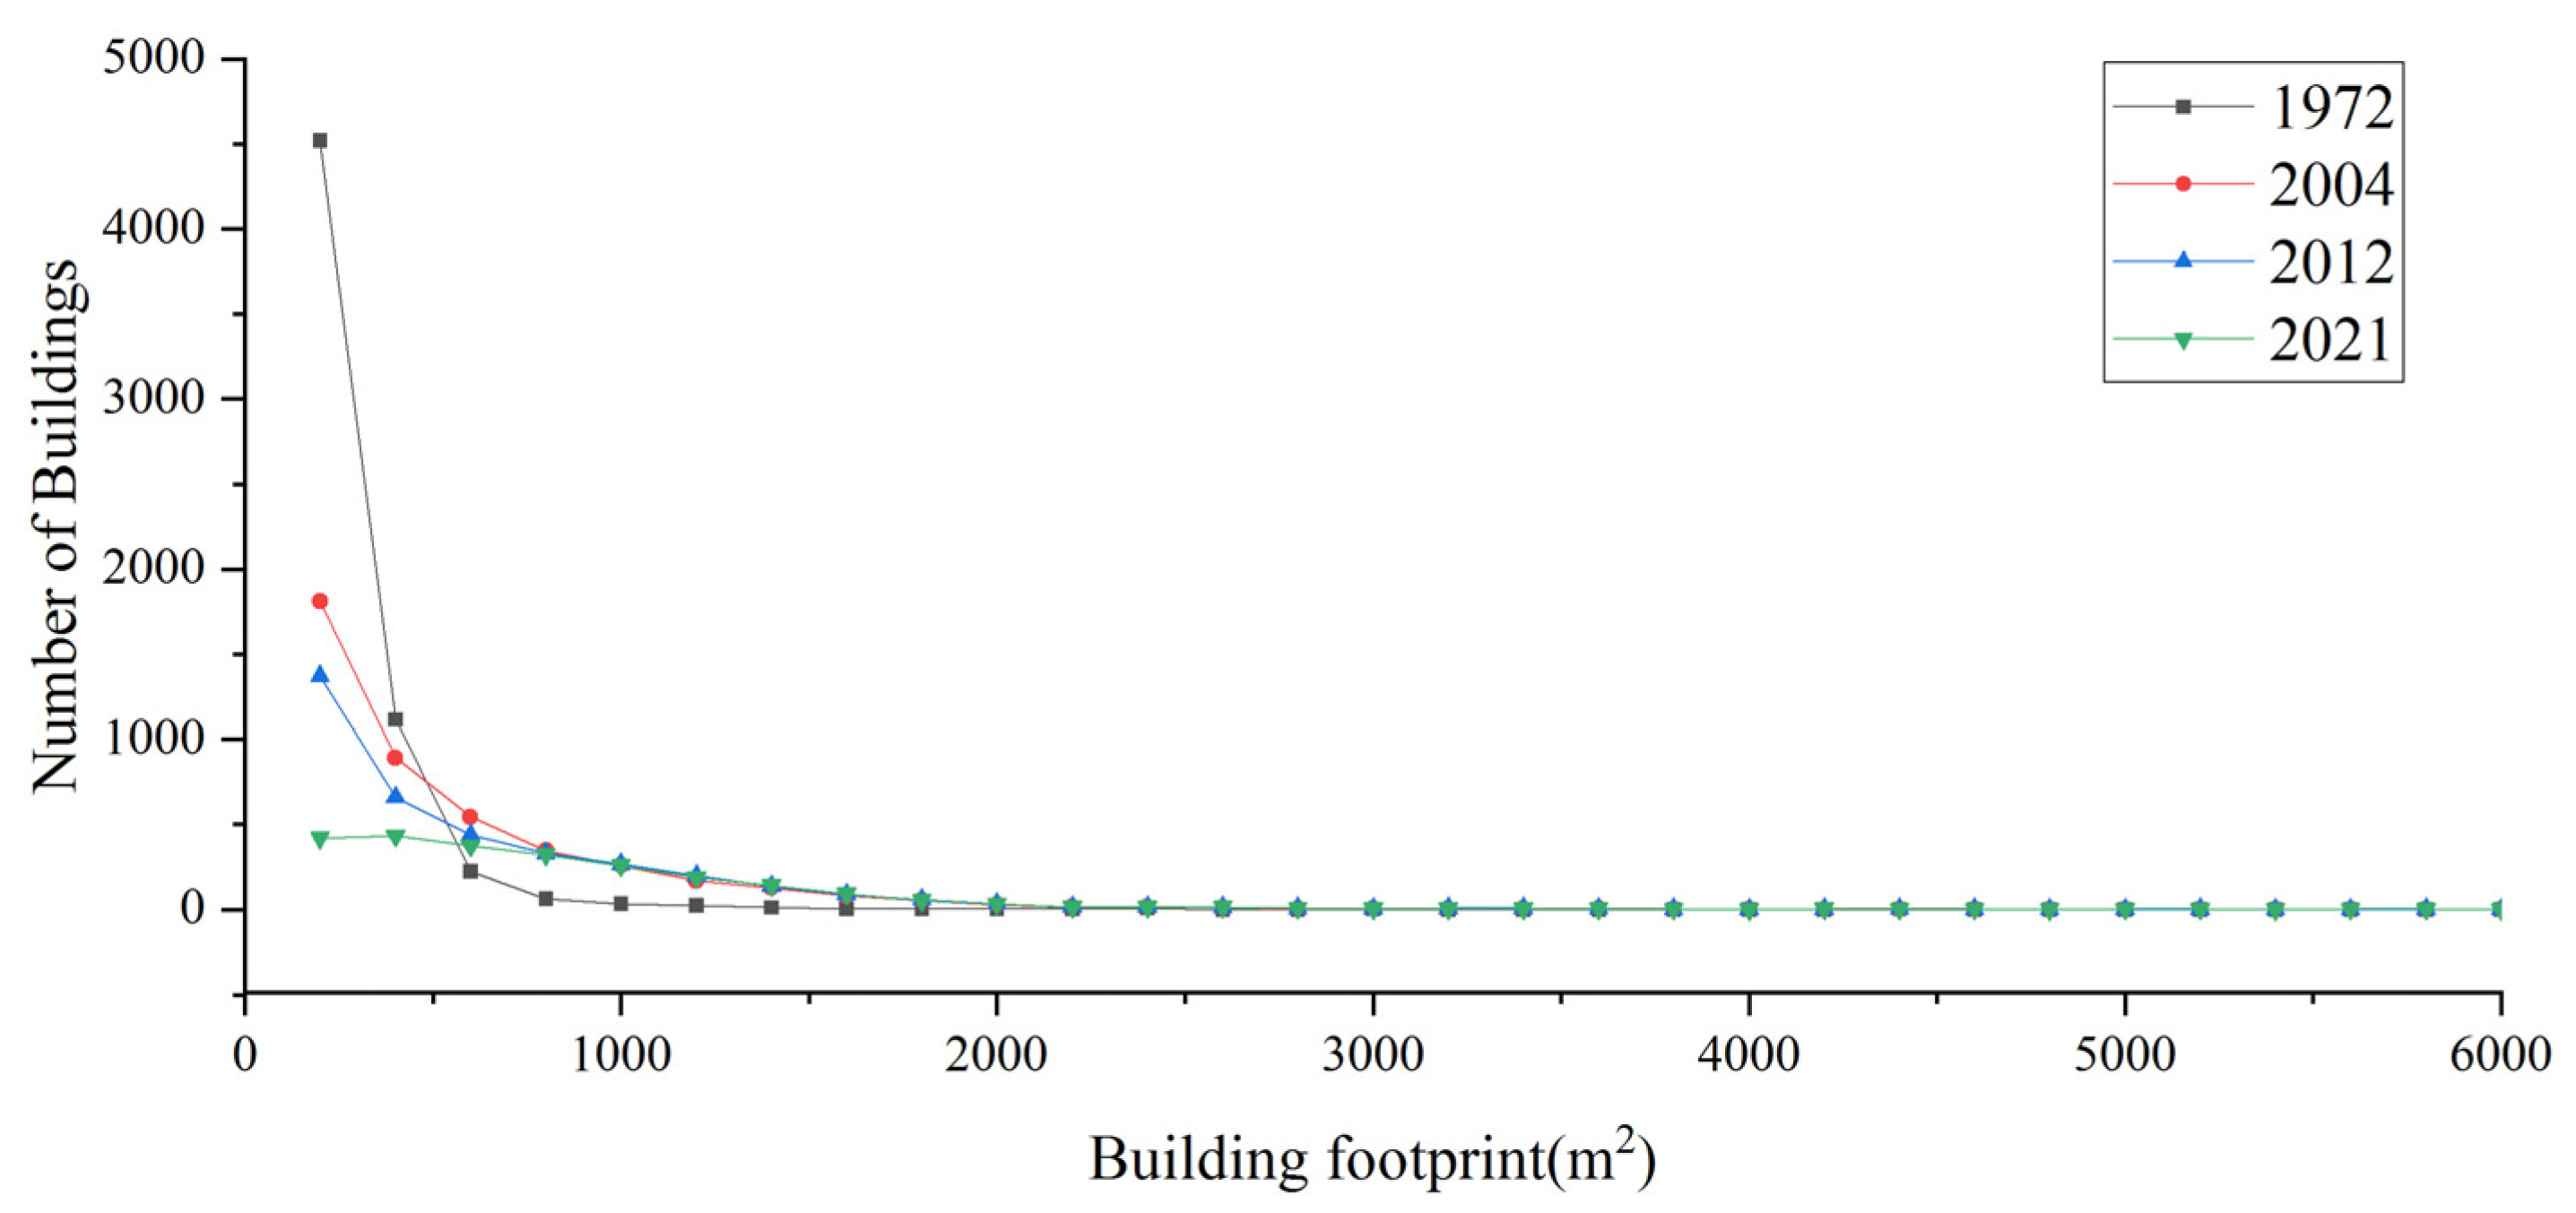
Second, the traditional cross-shaped main arteries in the center of the urban historical district represented an important component of the axis structure of traditional Chinese cities, bearing the city’s traditional nature. In the future, urban renewal must maintain the basic pattern of the main roads while appropriately increasing the road network density to improve accessibility, and adapting to residents’ needs while preserving the city’s historical context. Additionally, the texture of traditional urban architecture is characterized by the organization of high-density, small-scale building groups. Therefore, during renewal, the number of large-scale buildings should be strictly controlled, and traditional Chinese courtyard-style buildings should be adopted as much as possible to retain the city’s traditional texture.
Third, the analysis of the factors influencing the spatial evolution of historic urban areas indicates that, up to now, economic development and industrial transformation have been the main challenges faced in the protection of these areas. Meanwhile, the influence of cultural elements has further increased. Therefore, in future urban development, it is essential to preserve the original functional uses of historic districts, historical buildings, and cultural heritage sites, while allowing the continuation of residents’ daily lives and avoiding excessive commercialization and industrialization. It is also crucial to fully explore the multifaceted values of urban historic districts, especially those related to cultural protection and heritage transmission, rather than focusing solely on their economic value.
Despite the various findings, there are also issues that merit refinement in future research. In terms of data source selection for this study, the data for each influencing factor were obtained from relevant map websites and real estate sales websites. These raw data required manual screening before they could be utilized for analysis. The land-use data for the period from 1981 to 2021 were derived from surveys of land-use types conducted by government departments in specific years. Land-use types across different years necessitated a unified classification standard and a unified coordinate system. Failure to process the raw data in the aforementioned manner would result in inaccurate analysis outcomes. In terms of driving factors, this study chose the economic, landscape, locational, social, industrial, and cultural factors based on the spatial evolution characteristics of the study area and obtained data to represent these factors for analysis according to their availability and precision. Notably, however, the key driving factors for the spatial evolution of different cities and historical districts may vary, and other factors can also impact the spatial evolution of urban historical districts, such as the improvement of public and service facilities, relevant government policy changes, and innovations in relevant technologies. Additionally, since the GeoDetector can only detect the influence of factors by analyzing spatial correlations, it is incapable of detecting factors that cannot be spatially located.
Therefore, in light of the limitations mentioned above, future research could focus on exploring methods for accurately crawling and filtering website data, employing more scientific approaches to obtain more precise online data for relevant studies. Additionally, given the differences among various historical towns, it is essential to select driving factors based on the specific characteristics of the spatial evolution of the chosen historical districts, utilizing a variety of survey and analysis methods, such as social surveys, questionnaires, and expert consultations. Lastly, combining multiple analytical methods to assess the influence of driving factors can enhance the credibility of research results. This can include quantitative analysis methods like principal component analysis and regression analysis, as well as qualitative approaches such as system dynamics and machine learning.

6. Conclusions

This study examined the urban historical district of Zhangye and established a research framework to determine the characteristics and driving factors of spatial evolution in urban historic areas. It offered insights on how to protect, inherit, and utilize urban historical areas in future urban planning. The main conclusions of this study are as follows:
  • Land use changes: the commercial land in Zhangye’s urban historical district gradually increased while industrial and storage land decreased, reflecting the transformation from the secondary to the tertiary industry. The speed of land change exhibited a wave-like development trend, and the magnitude of change was gradually stabilizing.
  • Road network: the accessibility and choice of roads in the study area were enhanced, the road system was continuously improved, and the traditional cross-shaped main traffic arteries were inherited.
  • Building profile: the number of small buildings below 400 m2 in the study area decreased while the number of buildings with an area of 1000–1600 m2 increased. The main mode of architectural renewal was found to be demolition and reconstruction, and the renewal methods were setback, integration, demolition, and addition.
  • Driving factors: the main driving factors were economic, landscape, location, social, industrial, and cultural factors, all of which significantly influenced the spatial evolution of the area. Among them, the impact of the economic and industrial factors was significant, the influence of cultural factors was steadily strengthening, and the combined effect of dual factors was greater than the influence of single factors.

Author Contributions

Conceptualization, Y.G. and Y.R.; methodology, Y.G. and Z.F.; software and validation, Y.G. and Z.F.; investigation and resources, Y.G.; data curation, Y.G., J.L. and Y.R.; writing—original draft preparation, Y.G.; writing—review and editing, Y.G. and X.Z.; visualization, Y.G. and X.Z.; supervision, Y.R.; project administration, Y.R.; funding acquisition, Y.R. All authors have read and agreed to the published version of the manuscript.

Funding

This research was funded by the National Natural Science Foundation of China [52478070], The National Ethnic Affairs Commission of the People’s Republic of China General Projects [2024-GMB-033], and the Major Project of the Key Research Base of Humanities and Social Sciences of the Ministry of Education in 2022 [22JJD770054].

Data Availability Statement

The original contributions presented in the study are included in the article; further inquiries can be directed to the corresponding author.

Conflicts of Interest

The authors declare no conflicts of interest.

References

  1. Zhou, L. Cultural routes and the network construction of the World Cultural Heritage conservation. In Proceedings of the 15th ICOMOS General Assembly and International Symposium: ‘Monuments and Sites in Their Setting-Conserving Cultural Heritage in Changing Townscapes and Landscapes’, Xi’an, China, 17–21 October 2005; Available online: https://openarchive.icomos.org/id/eprint/446 (accessed on 2 December 2024).
  2. Icomos CIVVIH; Icomos-Korea. Urban Heritage and Sustainability, 1st ed.; Sofia Avgerinou-Kolonia, RII Hae Un: Seoul, Republic of Korea, 2017; pp. 68–71. [Google Scholar]
  3. Rojas, E. Historic Cities and the Venice Charter: Contributions to the Sustainable Preservation of Urban Heritage. Chang. Over Time 2014, 4, 196–203. [Google Scholar] [CrossRef]
  4. Chinese National Committee for the International Council on Monuments and Sites. Available online: http://www.icomoschina.org.cn/uploads/download/20210312144359_download.pdf (accessed on 2 December 2024).
  5. Ryberg-Webster, S.; Kinahan, K.L. Historic Preservation and Urban Revitalization in the Twenty-First Century. J. Plan. Lit. 2014, 29, 119–139. [Google Scholar] [CrossRef]
  6. Gilderbloom, J.I.; Hanka, M.J.; Ambrosius, J.D. Historic Preservation’s Impact on Job Creation, Property Values, and Environmental Sustainability. J. Urban. Int. Res. Placemak. Urban Sustain. 2009, 2, 83–101. [Google Scholar] [CrossRef]
  7. Listokin, D.; Listokin, B.; Lahr, M. The Contributions of Historic Preservation to Housing and Economic Development. Hous. Policy Debate 1998, 9, 431–478. [Google Scholar] [CrossRef]
  8. Waights, S. The Preservation of Historic Districts—Is It Worth It? J. Econ. Geogr. 2019, 19, 433–464. [Google Scholar] [CrossRef]
  9. Ijla, A.; Ryberg, S.; Rosentraub, M.S.; Bowen, W. Historic Designation and the Rebuilding of Neighborhoods: New Evidence of the Value of an Old Policy Tool. J. Urban. Int. Res. Placemaking Urban Sustain. 2011, 4, 263–284. [Google Scholar] [CrossRef]
  10. McCabe, B.J.; Ellen, I.G. Does Preservation Accelerate Neighborhood Change? Examining the Impact of Historic Preservation in New York City. J. Am. Plan. Assoc. 2016, 82, 134–146. [Google Scholar] [CrossRef]
  11. Noonan, D.S.; Krupka, D.J. Making—Or Picking—Winners: Evidence of Internal and External Price Effects in Historic Preservation Policies. Real Estate Econ. 2011, 39, 379–407. [Google Scholar] [CrossRef]
  12. Knippschild, R.; Zöllter, C. Urban Regeneration between Cultural Heritage Preservation and Revitalization: Experiences with a Decision Support Tool in Eastern Germany. Land 2021, 10, 547. [Google Scholar] [CrossRef]
  13. Qian, Z.; Li, H. Urban Morphology and Local Citizens in China’s Historic Neighborhoods: A Case Study of the Stele Forest Neighborhood in Xi’an. Cities 2017, 71, 97–109. [Google Scholar] [CrossRef]
  14. Zhao, Z.S.; Lan, W.J. Formation and Evolution of The Concepts of Historic and Cultural City Protection System. City Plan. Rev. 2022, 46, 20–26. [Google Scholar]
  15. Zhang, S. Review on the Legal System Building of China Cultural Heritage Protection. China Anc. City 2009, 03, 27–33. [Google Scholar] [CrossRef]
  16. Shi, Y.L.; Xiao, L.; Yang, L.C.; Li, J. Review and Prospect of Chinese and Western Historical and Cultural City Preservation Process, Theory, and Method. Planners 2023, 39, 56–65. [Google Scholar] [CrossRef]
  17. Yang, L.; Tang, F. Research and Consideration on the Implementation Model of Historic and Cultural Districts Renewal in China. Urban Dev. Stud. 2019, 26, 32–38. [Google Scholar] [CrossRef]
  18. Wen, S.; Liao, J.; Cai, H.; Chen, X. Spatial reconstruction and cultural practice of the regeneration of historic blocks in the process of urbanization: A case study of Yongqing Fang, Guangzhou City. Prog. Geogr. 2017, 40, 161–170. [Google Scholar] [CrossRef]
  19. Chahardowli, M.; Sajadzadeh, H.; Aram, F.; Mosavi, A. Survey of Sustainable Regeneration of Historic and Cultural Cores of Cities. Energies 2020, 13, 2708. [Google Scholar] [CrossRef]
  20. Nasser, N. Planning for Urban Heritage Places: Reconciling Conservation, Tourism, and Sustainable Development. J. Plan. Lit. 2003, 17, 467–479. [Google Scholar] [CrossRef]
  21. Miles, S.; Paddison, R. Introduction: The Rise and Rise of Culture-Led Urban Regeneration. Urban Stud. 2005, 42, 833–839. [Google Scholar] [CrossRef]
  22. Mehanna, W.A.E.-H. Urban Renewal for Traditional Commercial Streets at the Historical Centers of Cities. Alex. Eng. J. 2019, 58, 1127–1143. [Google Scholar] [CrossRef]
  23. Monterrubio, C.; Bermúdez, M. Les Impacts Du Tourisme Sur l’artisanat Local Au Costa Rica: Commercialisation et Préservation de La Culture. Téoros 2014, 33, 4. [Google Scholar] [CrossRef]
  24. Qian, Z. Historic District Conservation in China: Assessment and Prospects. Tradit. Dwell. Settl. Rev. 2007, 19, 59–76. [Google Scholar]
  25. Zhang, C.; Li, X. Urban Redevelopment as Multi-Scalar Planning and Contestation: The Case of Enning Road Project in Guangzhou, China. Habitat Int. 2016, 56, 157–165. [Google Scholar] [CrossRef]
  26. Allahmoradi, M.; Cömert, N.Z. A New Complementary Model for Integrating Historico-Geographical and Configurational Approaches: The Case of Famagusta. Urban Morphol. 2021, 25, 115–136. [Google Scholar] [CrossRef]
  27. Fan, J.; Zheng, B.; Tang, Q.; Zhang, B.; Liu, N. The Changsha Historic Urban Area: A Study on the Changing Accessibility of the Road Network. Appl. Sci. 2022, 12, 2796. [Google Scholar] [CrossRef]
  28. He, Y.; Deng, W. Prototype, Evolvement and Identification of Urban Texture in Nanhuamen Historic District. Urban Plan. Forum 2014, 3, 97–103. [Google Scholar] [CrossRef]
  29. Liu, P.; Markus, N. A Research on the Conservation of Plot Pattern of Chinese Historic Cities: Connotations, Transformations and Strategies. Urban Plan. Forum 2020, 5, 92–99. [Google Scholar] [CrossRef]
  30. Liu, Y.H.; Zhu, T.K.; Cao, X.J. Everyday Life and Social Space Evolution of Culture-Led Regeneration Based on Field Theory: A Case Study of Pingjiang and Xietang Districts in Suzhou. Trop. Geogr. 2023, 43, 1787–1799. [Google Scholar] [CrossRef]
  31. Zhang, H.; Yao, G.K. The Discourse, Concept, and Institution in Historic Area Regeneration. Planners 2023, 39, 56–63. [Google Scholar] [CrossRef]
  32. Whitehand, J.W.R.; Gu, K.; Whitehand, S.M.; Zhang, J. Urban Morphology and Conservation in China. Cities 2011, 28, 171–185. [Google Scholar] [CrossRef]
  33. Quinn, B. The Tourist–Historic City, Retrospect and Prospect of Managing the Heritage City, by G. J. Ashworth and J. E. Tunbridge. Pergamon, Elsevier Science Ltd., Oxford, 2000 No. of Pages: 344. Price Euro 70.34 US $75 (Hardback). ISBN 0-08-043675-7. J. Tour. Res. 2002, 4, 482–483. [Google Scholar] [CrossRef]
  34. Pannell, C. China’s Urban Transition. J. Geogr. 1995, 94, 394–403. [Google Scholar] [CrossRef] [PubMed]
  35. Bai, X.; Jiao, X.; Sakai, T.; Xu, H. Mapping the Past with Historical Geographic Information Systems: Layered Characteristics of the Historic Urban Landscape of Nanjing, China, since the Ming Dynasty (1368–2024). Herit. Sci. 2024, 12, 283. [Google Scholar] [CrossRef]
  36. Li, X.; Zhou, X.; Weng, F.; Ding, F.; Wu, Y.; Yi, Z. Evolution of Cultural Landscape Heritage Layers and Value Assessment in Urban Countryside Historic Districts: The Case of Jiufeng Sheshan, Shanghai, China. Herit. Sci. 2024, 12, 96. [Google Scholar] [CrossRef]
  37. Wang, W.; Li, M.Y.; Li, J.; Zhang, Y.P. Exploration on Renewal and Protection Methods of Historical and Cultural Cities: A Case Study of Suzhou CIM. Urban Dev. Stud. 2023, 30, 96–102. [Google Scholar] [CrossRef]
  38. Shi, Y.; Chen, P. Protection and Renewal Strategy for the Railway Heritage Zone in Mega Cities Under the Background of Urban Regeneration. Ind. Constr. 2023, 53, 51–58+12. [Google Scholar] [CrossRef]
  39. Song, J.; Chen, Y.; Zheng, L.; Tang, Q. The Evolution of Traditional Ancient Towns in South China: Tangjiawan Ancient Town in Zhuhai City. J. Asian Archit. Build. Eng. 2024, 1–19. [Google Scholar] [CrossRef]
  40. Wang, S.; Gu, K. Pingyao: The Historic Urban Landscape and Planning for Heritage-Led Urban Changes. Cities 2020, 97, 102489. [Google Scholar] [CrossRef]
  41. Moudon, V. Urban Morphology as an Emerging Interdisciplinary Field. Urban Morphol. 1997, 1, 3–10. [Google Scholar] [CrossRef]
  42. Oliveira, V. Teaching Urban Morphology; The Urban Book Series; Springer International Publishing: Cham, Switzerland, 2018; ISBN 9783319761251. [Google Scholar]
  43. Whitehand, J.W.R. British Urban Morphology: The Conzenian Tradition. Urban Morphol. 2001, 5, 103–109. [Google Scholar] [CrossRef]
  44. Whitehand, J.W.R. The changing face of cities: A study of development cycles and urban form. Town Plan. Rev. 1990, 61, 209–211. [Google Scholar]
  45. Conzen, M.R.G. The Urban Landscape: Historical Development and Management; The Morphology of Town in Britain During the Industrial Era; Academic Press: New York, NY, USA, 1981; pp. 87–126. [Google Scholar]
  46. Gu, K.; Tian, Y.; Whitehand, J.W.R. Residential Building Types as an Evolutionary Process: The Guangzhou Area, China. Urban Morphol. 2022, 12, 97–115. [Google Scholar] [CrossRef]
  47. Whitehand, J.W.R.; Gu, K. Research on Chinese Urban Form: Retrospect and Prospect. Prog. Hum. Geogr. 2006, 30, 337–355. [Google Scholar] [CrossRef]
  48. Wang, X.; Xiao, F.; Zhang, Y.; Yin, L.; Lesi, M.; Guo, B.; Zhao, Y. Thirty-year Expansion of Construction Land in Xi’an: Spatial Pattern and Potential Driving Factors. Geol. J. 2018, 53, 309–321. [Google Scholar] [CrossRef]
  49. Chen, F. Interpreting Urban Micromorphology in China: Case Studies from Suzhou. Urban Morphol. 2012, 16, 133–148. [Google Scholar] [CrossRef]
  50. Lin, Y.; Meulder, B.D.; Wang, S. From Village to Metropolis: A Case of Morphological Transformation in Guangzhou, China. Urban Morphol. 2010, 15, 5–20. [Google Scholar] [CrossRef]
  51. Wang, J.; Hou, L.G.; He, X.Q.; Liu, T.; Deng, Y.J. Land Use Change and Its Eco-environmental Effects in Urban Agglomeration of Chengdu Plain During 2000–2019. Bull. Soil Water Conserv. 2022, 42, 360–368. [Google Scholar]
  52. Yang, X.; Liu, X. Carbon Conduction Effect and Temporal-Spatial Difference Caused by Land Type Transfer in Chang-Zhu-Tan Urban Agglomeration from 1995 to 2018. Acta Ecol. Sin. 2022, 42, 338–347. [Google Scholar] [CrossRef]
  53. Yang, D.; Zhang, P.; Zhang, J.; Liu, Y.; Liu, Z.; Chen, Z. Land Use Assessment under Dynamic Evolution: Multi-Objective Optimization and Multi-Scenario Simulation Analysis. J. Environ. Manag. 2025, 373, 123456. [Google Scholar] [CrossRef]
  54. Pei, W.; Peng, Y.; Fan, K.; Zhang, J.; Chen, Y.; Wang, B.; Chen, L.; Liu, S.; Li, J. The Impact of Land Use on Eco-Environment in the Dianchi Basin. Heliyon 2024, 10, e32085. [Google Scholar] [CrossRef]
  55. Cooper, C.H.V.; Chiaradia, A.J.F. sDNA: 3-d Spatial Network Analysis for GIS, CAD, Command Line & Python. SoftwareX 2020, 12, 100525. [Google Scholar] [CrossRef]
  56. Song, X.D.; Tao, Y.; Pan, J.W.; Xiao, Y. A Comparison of Analytical Methods for Urban Street Network: Taking Space Syntax, sDNA and UNA as Examples. Urban Plan. Forum 2020, 2, 19–24. [Google Scholar] [CrossRef]
  57. Huang, Y.H.; Yang, X.M.; Yue, J.T. Urban street bicycle flow analysis based on multi-scale geographically weighted regression model. J. Tsinghua Univ. (Sci. Technol.) 2022, 62, 1132–1141. [Google Scholar]
  58. Wang, J.F.; Xu, C.D. Geodetector: Principle and Prospective. Acta Geogr. Sin. 2017, 72, 116–134. [Google Scholar] [CrossRef]
  59. Wang, J.; Li, X.; Christakos, G.; Liao, Y.; Zhang, T.; Gu, X.; Zheng, X. Geographical Detectors-Based Health Risk Assessment and Its Application in the Neural Tube Defects Study of the Heshun Region, China. Int. J. Geogr. Inf. Sci. 2010, 24, 107–127. [Google Scholar] [CrossRef]
  60. Wang, J.-F.; Hu, Y. Environmental Health Risk Detection with GeogDetector. Environ. Model. Softw. 2012, 33, 114–115. [Google Scholar] [CrossRef]
  61. Said, S.Y.; Aksah, H.; Ismail, E.D. Heritage Conservation and Regeneration of Historic Areas in Malaysia. Procedia-Soc. Behav. Sci. 2013, 105, 418–428. [Google Scholar] [CrossRef]
  62. Teklemariam, N. Historic Preservation as Sustainable Urban Development in African Cities: A Technical and Technological Framework. Sustainability 2024, 16, 5949. [Google Scholar] [CrossRef]
  63. Natalia, M.; Anna, N.; Igor, P. Historical Cities as an Object of Protection: Approaches to the Preservation of Urban Planning Heritage in Russia. E3S Web Conf. 2020, 164, 05012. [Google Scholar]
  64. Kermani, A.A.; Luiten, E.; Arjomandkermani, A.; Luiten, E.A.J. Preservation and Transformation of Historic Urban Cores in Iran, the Case of Kerman. WSEAS Trans. Environ. Dev. 2010, 6, 53–62. [Google Scholar]
Figure 1. Research framework.
Buildings 15 00961 g001
Figure 2. Map of the study area.
Buildings 15 00961 g002
Figure 3. Data on land use in the urban historical district in different years.
Buildings 15 00961 g003
Figure 4. Road network data for the urban historical district in different years.
Buildings 15 00961 g004
Figure 5. Building profile data for the urban historical district in different years.
Buildings 15 00961 g005
Figure 6. Statistics of land use types in different years in the urban historic district.
Buildings 15 00961 g006
Figure 7. Land use change statistics at each stage: A: administration and public services land; B: commercial and business land; G: green and square land. H: special land; M: industrial and manufacturing land; R: residential land; S: road, street, and transportation land; U: public utilities land; W: logistics and warehouse land.
Buildings 15 00961 g007
Figure 8. Road network evolution from 1981 to 2021.
Buildings 15 00961 g008
Figure 9. Land area occupied by buildings in different stages.
Buildings 15 00961 g009
Figure 10. Results of the dual-factor interaction detection.
Buildings 15 00961 g010
Table 1. Data on the influencing factors and data sources.
Data TypeData Sources
Economic factorsHousing price data retrieved from Anjuke website (https://xa.anjuke.com/, accessed on 10 November 2023) using Python (https://www.python.org/, accessed on 15 November 2023)
Landscape factorsPoints of Interest (POI) data of parks, green spaces, and water bodies obtained from the Gaode map (https://www.amap.com/, accessed on 9 September 2023)
Location factorsPOI data of roads and transportation hubs obtained from the Gaode map (https://www.amap.com/, accessed on 9 September 2023)
Social factorsWorldPop 100 m Precision Population Density Grid Data (https://www.worldpop.org/, accessed on 20 October 2023)
Industrial factorsPOI data of financial and commercial facilities obtained from the Gaode Map (https://www.amap.com/, accessed on 9 September 2023)
Cultural factorsData on cultural heritage units, historical buildings, and historical blocks obtained from Zhangye Municipal Bureau of Culture and Tourism (https://www.zhangye.gov.cn/wgxj/, accessed on 3 February 2024)
Table 2. Land transfer coefficient and change dynamics.
Land Use TypeDynamic Degree of Single Land UseOverall Change Amplitude ( S n j )Comprehensive Dynamic Degree of Single Land Use ( S j )
1981–19911991–20042004–20122012–2021
Administration and public Services0.9830.146−0.1030.0831.110.329
Commercial and business5.8965.1430.2050.37911.622.906
Green and square−2.222−1.6050.4313.325−0.071.896
Special land1.102−1.763−0.182−0.119−0.960.792
Industrial and manufacturing −0.048−7.0553.030−11.111−15.185.311
Residential−1.0082.130−0.187−0.5960.340.980
Road, street, and transportation0.3300.5140.3200.5601.720.431
Public utilities2.883−4.923−4.5952.176−4.463.644
Logistics and warehouse−6.121−7.6920.0000.000−13.813.453
Land use comprehensive dynamic degree0.7001.3340.1430.391//
Table 3. Calculation of road network data from 1981 to 2021.
Year19811991200420122021
BetweennessMean value608.32696.321077.831131.141172.15
Standard deviation364.37425.81760.38809.15850.53
NQPDMean value0.140.140.190.180.19
Standard deviation0.10310.07280.07200.07130.0708
Road network length (km)27.4329.4832.4833.1333.39
Road network density (km/km2)3.864.154.574.674.70
Table 4. Renovation measures for the historical urban buildings in Zhangye.
Building Update TypeArchitectural Renewal FeatureBeforeAfter
Building setbackDemolition of existing street-front buildings, expansion of the street widths, and subsequent reconstruction of new buildings along the broadened streetsBuildings 15 00961 i001Buildings 15 00961 i002
Building integrationReplacement of small-scale, low-rise structures with large-scale, high-rise constructionsBuildings 15 00961 i003Buildings 15 00961 i004
Building demolitionDemolition of buildings obstructing sightlines and construction of squares and public spacesBuildings 15 00961 i005Buildings 15 00961 i006
Building additionConstruction of additional buildings in low-density areas to increase architectural densityBuildings 15 00961 i007Buildings 15 00961 i008
Table 5. Renovation of the architectural texture in the urban historical district.
Year1972200420122021
Number of buildings6012438136612397
Minimum building footprint (m2)12.5412.5412.5420.81
Average floor area of the buildings (m2)178.40459.06545.21792.80
Maximum building footprint (m2)4243.967474.3230,762.6854,134.38
Standard deviation of the building footprint186.76530.92800.201526.56
Table 6. Selection of variables and data sources in GeoDetector.
Independent and Dependent VariablesData TypeData Processing Mode
Economic factors (X1)Data on house priceHousing price data extracted from the Anjuke real estate website using Python, and the areal raster data processed using Kriging interpolation
Landscape factors (X2)Accessibility data of parks, green spaces, and water bodiesEntrance and exit points of various landscape elements, based on the raster data obtained from 80 m/min accessibility analysis in ArcGIS
Location factors(X3)Accessibility data of main roads and transportation hubsMain roads and transportation hubs, based on the raster data derived from the 80 m/min accessibility analysis in ArcGIS
Social factors (X4)Population density raster dataWorldPop 100 m resolution population density raster data
Industrial factors(X5)Kernel density data of commercial elementsRaster data derived from kernel density analysis of financial and commercial points of interest data in ArcGIS
Cultural factors (X6)Accessibility data of historical buildings, historical blocks, and cultural heritage sitesCultural heritage protection units, historical buildings, and historical blocks, based on the raster data obtained from the 80 m/min accessibility analysis in ArcGIS.
Changes in land use at different stages (Y)Data on changes in land use types at various stagesBased on the raster data obtained from the overlay processing of four editions of land use status maps provided by the Zhangye Municipal Bureau of Natural Resources
Table 7. Driving factors of spatial evolution in the urban historic area.
X1X2X3X4X5X6
1981–1991Q value0.1320.0250.0250.0200.1220.007
Ranking of influence134526
1991–2004Q value0.0580.0420.0160.0070.0130.013
Ranking of influence123645
2004–2012Q value0.0170.0660.0100.0290.0990.031
Ranking of influence526413
2012–2021Q value0.3150.1370.0610.1060.2410.131
Ranking of influence136524
Comprehensive sorting135624
Disclaimer/Publisher’s Note: The statements, opinions and data contained in all publications are solely those of the individual author(s) and contributor(s) and not of MDPI and/or the editor(s). MDPI and/or the editor(s) disclaim responsibility for any injury to people or property resulting from any ideas, methods, instructions or products referred to in the content.

