Review

Numerical Modelling of Flat Slabs with Different Amounts of Double-Headed Studs as Punching Shear Reinforcement

by
Frederico P. Maués
1,
Mauricio P. Ferreira
1,*,
Rafael A. S. Díaz
2,
Elyson A. P. Liberati
3,
Leandro M. Trautwein
4 and
João P. B. Santos
5
1
Institute of Technology, Federal University of Para, Belém 66075-110, Brazil
2
Faculty of Civil Engineering and Geosciences, Delft University of Technology, 2628 CN Delft, The Netherlands
3
Department of Civil Engineering, State University of Maringá, Maringá 87020-900, Brazil
4
Department of Structures, State University of Campinas, Campinas 13083-871, Brazil
5
Faculty of Technology, University of Brasilia, Brasilia 70910-900, Brazil
*
Author to whom correspondence should be addressed.
Buildings 2025, 15(6), 960; https://doi.org/10.3390/buildings15060960
Submission received: 17 December 2024 / Revised: 8 February 2025 / Accepted: 19 February 2025 / Published: 19 March 2025

Abstract

Increasing the shear reinforcement ratio (ρw) can help meet architectural and structural requirements but often results in less reliable punching strength estimates from design codes. Nonlinear finite element analysis (NLFEA) has the potential to support a thorough assessment of the punching strength of slabs with shear studs, yet accurately modelling the interaction between concrete and transverse steel to capture the strength provided by shear rebars is challenging while using user-friendly software. This paper explores methodologies to assess the punching strength of slabs with double-headed studs with a commercial NLFEA program. Experimental tests were used to define the input parameters for the concrete’s nonlinear behaviour and to evaluate modelling approaches for shear studs, resulting in two strategies applied to slabs with varying ρw. NLFEA provided accurate punching strength estimates, consistently reproducing slabs’ rotations, crack patterns, and flexural strains. However, discrepancies in shear rebar strains highlight the challenges of using NLFEA to assess the response of slabs with shear reinforcement. Moreover, NLFE and experimental strengths were compared to estimates using the fib Model Code 2010 with levels of approximation (LoA) II, III, and IV, showing that, for the selected tests, increasing complexity in LoA IV did not consistently improve strength estimate accuracy.

1. Introduction

The punching shear resistance is a critical point in the design of slab–column connections, and several measures can be adopted to avoid this type of failure, e.g., increasing the slab thickness, using drop panels and column capitals, or adding punching shear reinforcement, the latter being preferable from economic and architectural points of view. Experimental tests showed that punching shear reinforcement can significantly increase the strength and ductility of reinforced concrete flat slabs, as demonstrated by [1,2,3,4,5]. Still, several aspects of its mechanical behaviour, design, and detailing require further scientific investigation, demanding substantial economic investments in experimental tests on specimens representing actual concrete structures.
The influence of the anchoring conditions on the effective stress and the activation mechanisms of different types of shear reinforcement before failure is a point of interest, especially considering the variety of commercially available punching shear reinforcement [6,7,8,9,10,11,12,13,14]. Figure 1 presents examples of punching shear reinforcement for slab–column connections. Experimental evidence shows that headed studs can provide better anchorage conditions than other types of punching shear reinforcement [3]. Headed studs, commonly used as punching shear reinforcement, have a forged head at one end and a rail on the other (see Figure 1a) or forged heads at both ends, connected by a non-structural element that serves as a spacer (see Figure 1b).
The mechanical interlock between the studs’ head and the concrete provides better anchorage than that developed in shear links and stirrups, which can be affected due to the imprecise quality of the hooks [15]. As [13] discussed, poor bonding and anchorage conditions may lead to slippage of the shear reinforcement, thus reducing their contribution to the punching strength of flat slabs. Punching shear reinforcement, as illustrated in Figure 1c–f, anchored within the flexural reinforcement layers, can fit into this case, and additional detailing measures are adopted to improve their structural efficiency.
The Brazilian code for the design of concrete structures [16] is based on CEB-FIP Model Code 1990 [17]. The Brazilian code recommends closed stirrups and studs as punching shear reinforcement for flat slabs, with the latter being preferable. For slab–column connections with shear reinforcement [16], it assumes a constant contribution given by concrete, regardless of the shear reinforcement ratio (ρw). As demonstrated by [18], this method can result in a higher scattering of the strength estimates, typically leading to over-conservative results and, occasionally, providing unsafe estimates.
The fib Model Code 2020 [19] provisions for punching shear are based on the critical shear crack theory (CSCT) as presented by [20] and the corresponding extension of the method for slabs with shear reinforcement [21]. The punching resistance (VRc) can be taken as a function of the slabs’ rotation (ψ), which can be calculated with four different levels of approximation (LoA), as presented in [19]. All the design methods recommend that, for slabs with shear reinforcement, the punching resistance should be checked for failures within (VRcs) and outside (Vout) the shear reinforced zone, limited by the crushing of the concrete struts in the supported area (Vmax).
Increasing the shear reinforcement ratio is a potential solution to address architectural and structural demands in reinforced concrete slabs subjected to highly concentrated loads, where punching shear resistance plays a critical role in the whole structure’s safety. For such cases, design codes often provide unreliable strength estimates, with potential unsafe trends of VRcs, notably for slabs with high shear reinforcement ratios, showing that it is essential to improve the understanding of the punching shear failure mechanisms. In design practice, the unsafe theoretical strength estimates are indirectly avoided by adopting over-conservative limits for the strength outside the shear-reinforced zone (VR,out) and for the maximum punching resistance (VR,max) of the slab–column connection, as discussed by Ferreira et al. [2].
Several studies have been conducted to address these challenges, leading to significant advancements in understanding punching shear failure and the associated shear mechanisms [5,6,7,8,9,10,11,12,13,14,15,16,17,18,19,20,21,22]. These efforts resulted in the development of sophisticated analytical models, which try to explain the punching shear phenomenon and capture the shear strength provided by the shear reinforcement. For instance, to ensure the practical applicability of the method proposed by [5], the authors of [13] derived simplified closed-form equations to account for the activation mechanisms of different types of shear reinforcement. Still, accurately accounting for the actual performance of slabs with different amounts of shear reinforcement is an open problem due to the complexity introduced by the multiple parameters involved.
Computational-assisted methods are frequently used to analyse the behaviour and resistance of various structural materials. The generalized finite difference method (GFDM), as described in [23], was employed to comprehensively assess the stress distribution within a three-dimensional elastic composite material. The Bézier multi-step method, introduced in [24], was also implemented to evaluate the dynamic response of composite beams reinforced with graphene nanoplatelets subjected to axial loading. These instances exemplify how computational methods can significantly enhance understanding complex nonlinear structural engineering problems.
Nonlinear finite element analysis (NLFEA) is an established method for analysing reinforced concrete structures, particularly for investigating shear-related issues, such as the punching shear resistance of concrete slabs with shear reinforcement [25,26,27,28,29,30,31]. NLFEA can be used to advance the understanding of the contributions of concrete and steel to shear strength in slabs with varying reinforcement ratios, filling gaps in existing experimental data. Widely employed in research, NLFEA is also a promising alternative for optimising the structural assessments of existing structures. However, accurately modelling concrete and transverse steel reinforcement interaction remains a significant challenge, especially with user-friendly commercial software.
Pioneering work from [28] investigated the response and the punching shear resistance of slab–column connections with stirrups through nonlinear finite element analysis. Using truss elements to simulate the stirrups, they observed that unappropriated anchorage representations could result in the non-activation of the shear reinforcement units or early concrete shear failures due to unrealistic damage concentration. Different finite element modelling strategies were used by [29] to simulate the resistance of slab-column connections with post-installed shear bolts. They concluded that beam elements could provide good results and recommended using additional beam elements at the ends to simulate the anchorage conditions properly. Recently, refs. [30,31,32] simulated slabs with double-headed studs using truss elements. The experimental and numerical results showed good agreement, although no additional elements at the ends of the reinforcement units were used. All the works above assumed a perfect bond between the concrete and the shear reinforcement bars.
This paper examines methodologies for the NLFEA of reinforced concrete flat slabs with double-headed studs. A user-friendly commercial software is used to evaluate the aspects of the flexural and shear behaviour that can be accurately simulated computationally, having as reference experimental tests from slabs supported on square and circular columns of various sizes and with a wide range of shear reinforcement ratios. The computational results are compared with experimental data regarding slab rotations, cracking patterns, and strain distributions in the flexural and shear reinforcements, allowing for the critical assessment of the NLFE modelling strategies discussed. Additionally, the paper compares experimentally observed strength and load–rotation curves with computational and theoretical estimates obtained using ATENA v5.6, a user-friendly software for nonlinear analysis and design of reinforced concrete structures, and the fib Model Code 2010 with levels of approximation (LoA) II, III, and IV. The intent was to qualitatively assess the capacity and sensitivity of the NLFEA software to simulate both the structural response and the punching shear strength of slab–column connections with significant increases in the shear reinforcement ratio. Additionally, the paper examines how increasing the complexity of levels of approximation (LoA) impacts the accuracy of theoretical strength estimates from fib Model Code 2010.

2. Selected Experimental Tests

This paper used experimental results from nine reinforced concrete slab–column connections tested by [2,9,14] in the numerical analyses developed. The selected specimens comprised tests on slabs without and with shear reinforcement. The slabs without shear reinforcement were used in the initial analysis to calibrate the setup of input parameters and model the nonlinear behaviour of concrete. For slabs with shear reinforcement, the slabs were selected based on their shear reinforcement ratio (ρw), covering a spectrum of slabs with low (ρw < 0.25%) to moderate (0.25% ≤ ρw ≤ 0.75%) and high (ρw > 0.75%) shear reinforcement ratios. To isolate the influence of the shear reinforcement, only slabs with double-headed studs as punching shear reinforcement were used, and all other characteristics, such as fcm, fys, fyws, d, and ρf, were kept within consistent ranges.
The selection criteria included uniform testing conditions to ensure consistency among the tested slabs. Consequently, all selected slabs were centrally supported and subjected to eight concentric point loads at their edges. Variations in column geometry and dimensions were accepted as a secondary variable, since they might also affect the activation process of the shear reinforcement. Thus, slabs supported on square and circular columns were selected, covering a range of column-to-effective-depth ratios (c/d) from 1.2 to 3.2. These systematic decisions permit a thorough investigation of the punching shear response and resistance of slab–column connections with different amounts of shear reinforcement supported on columns of different sizes and shapes. Table 1 summarises the main characteristics of the selected tested slabs.
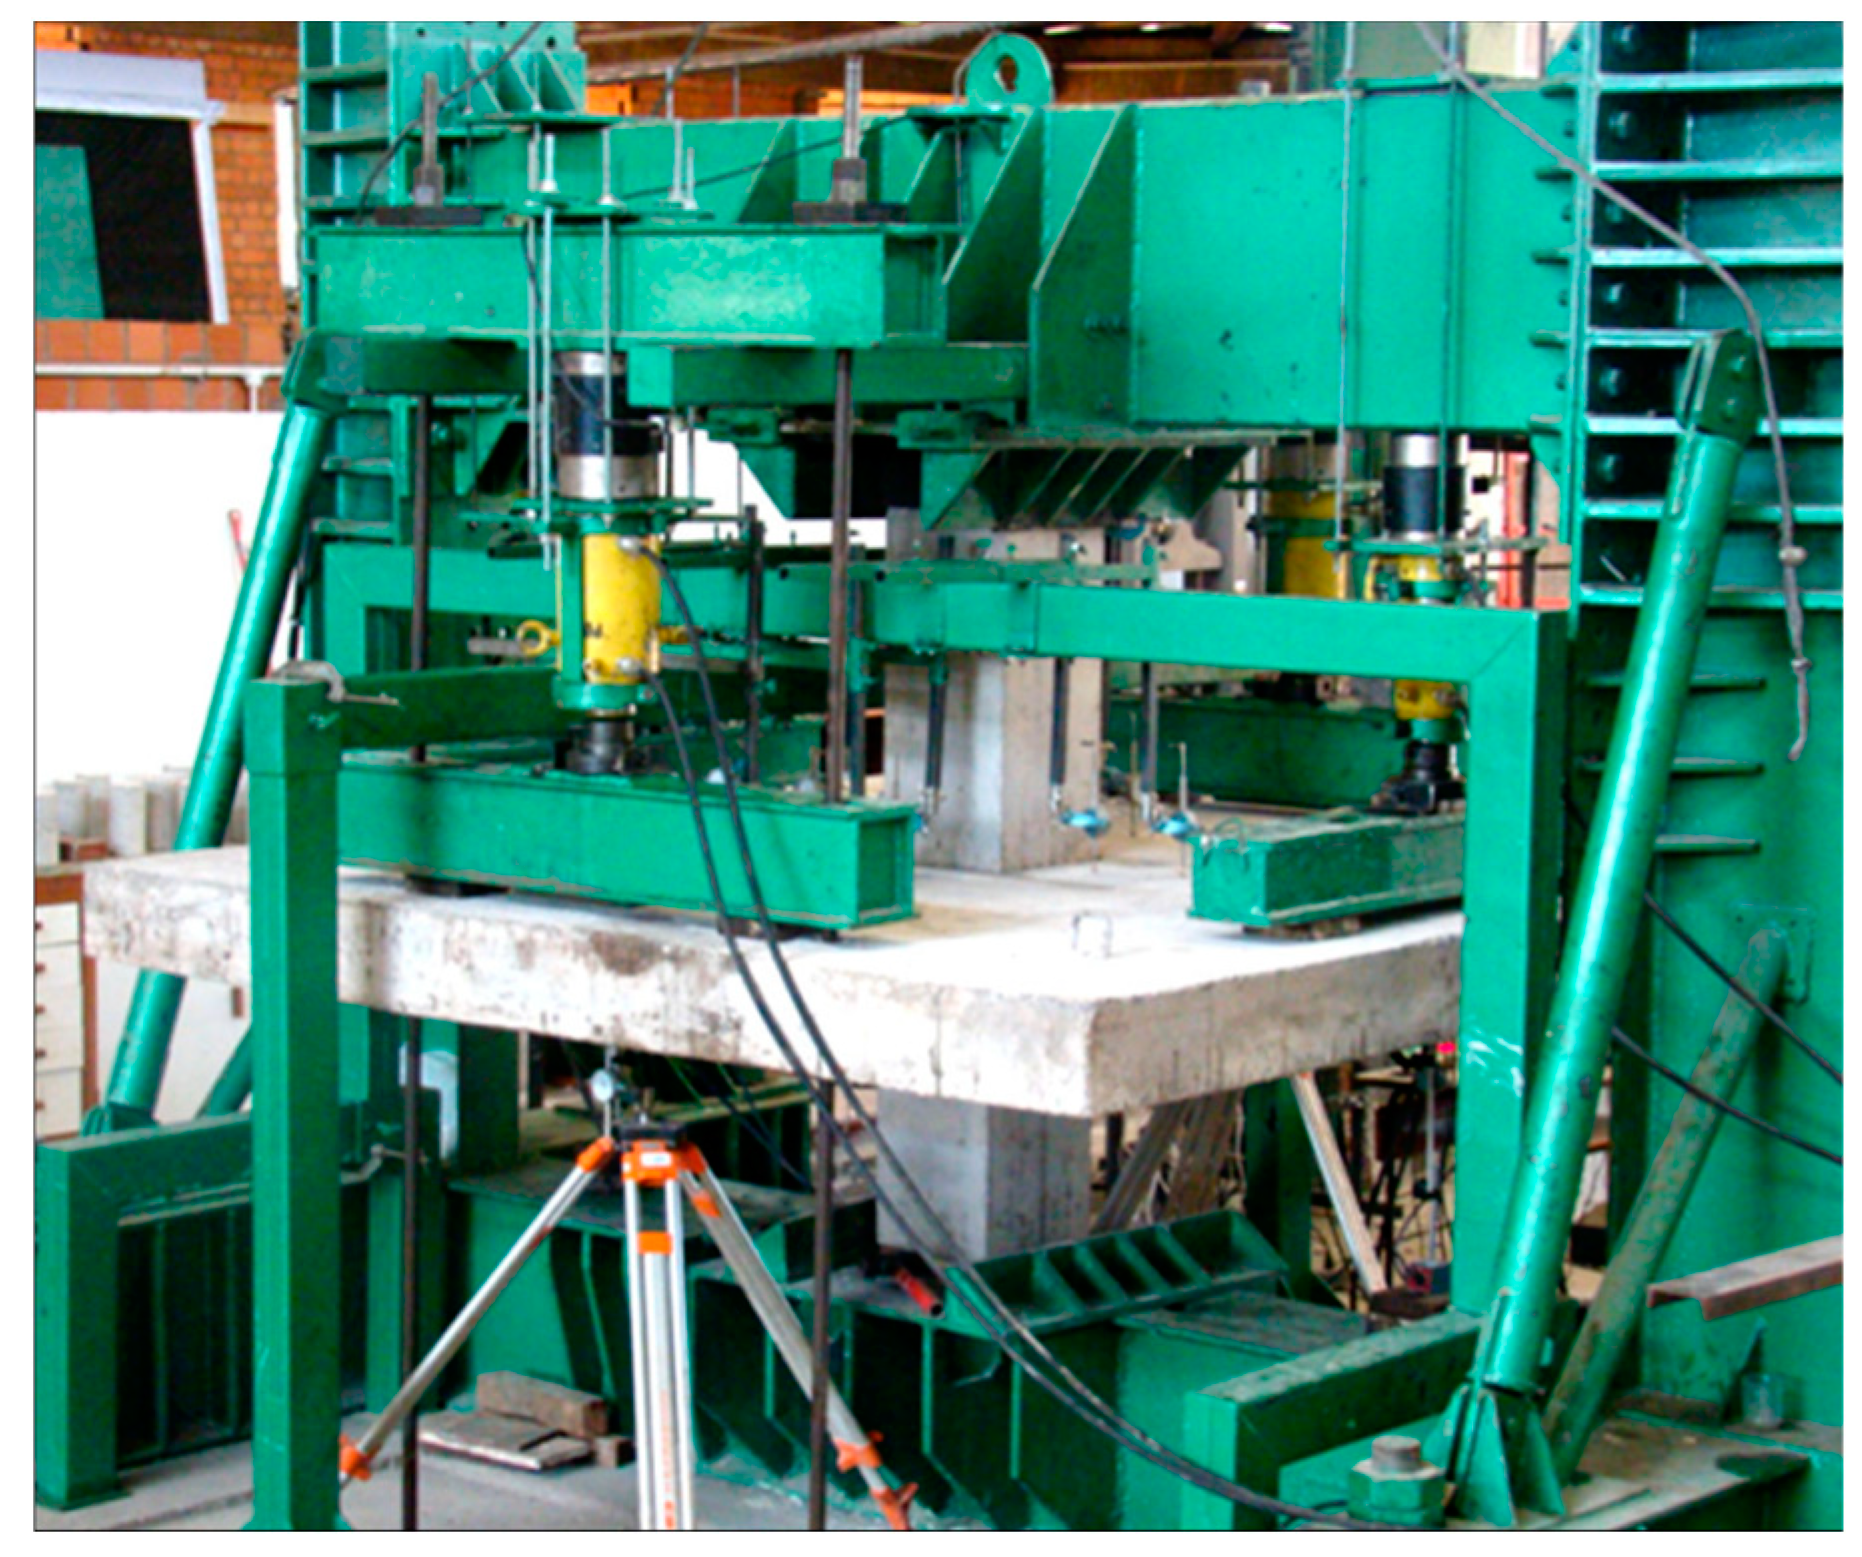
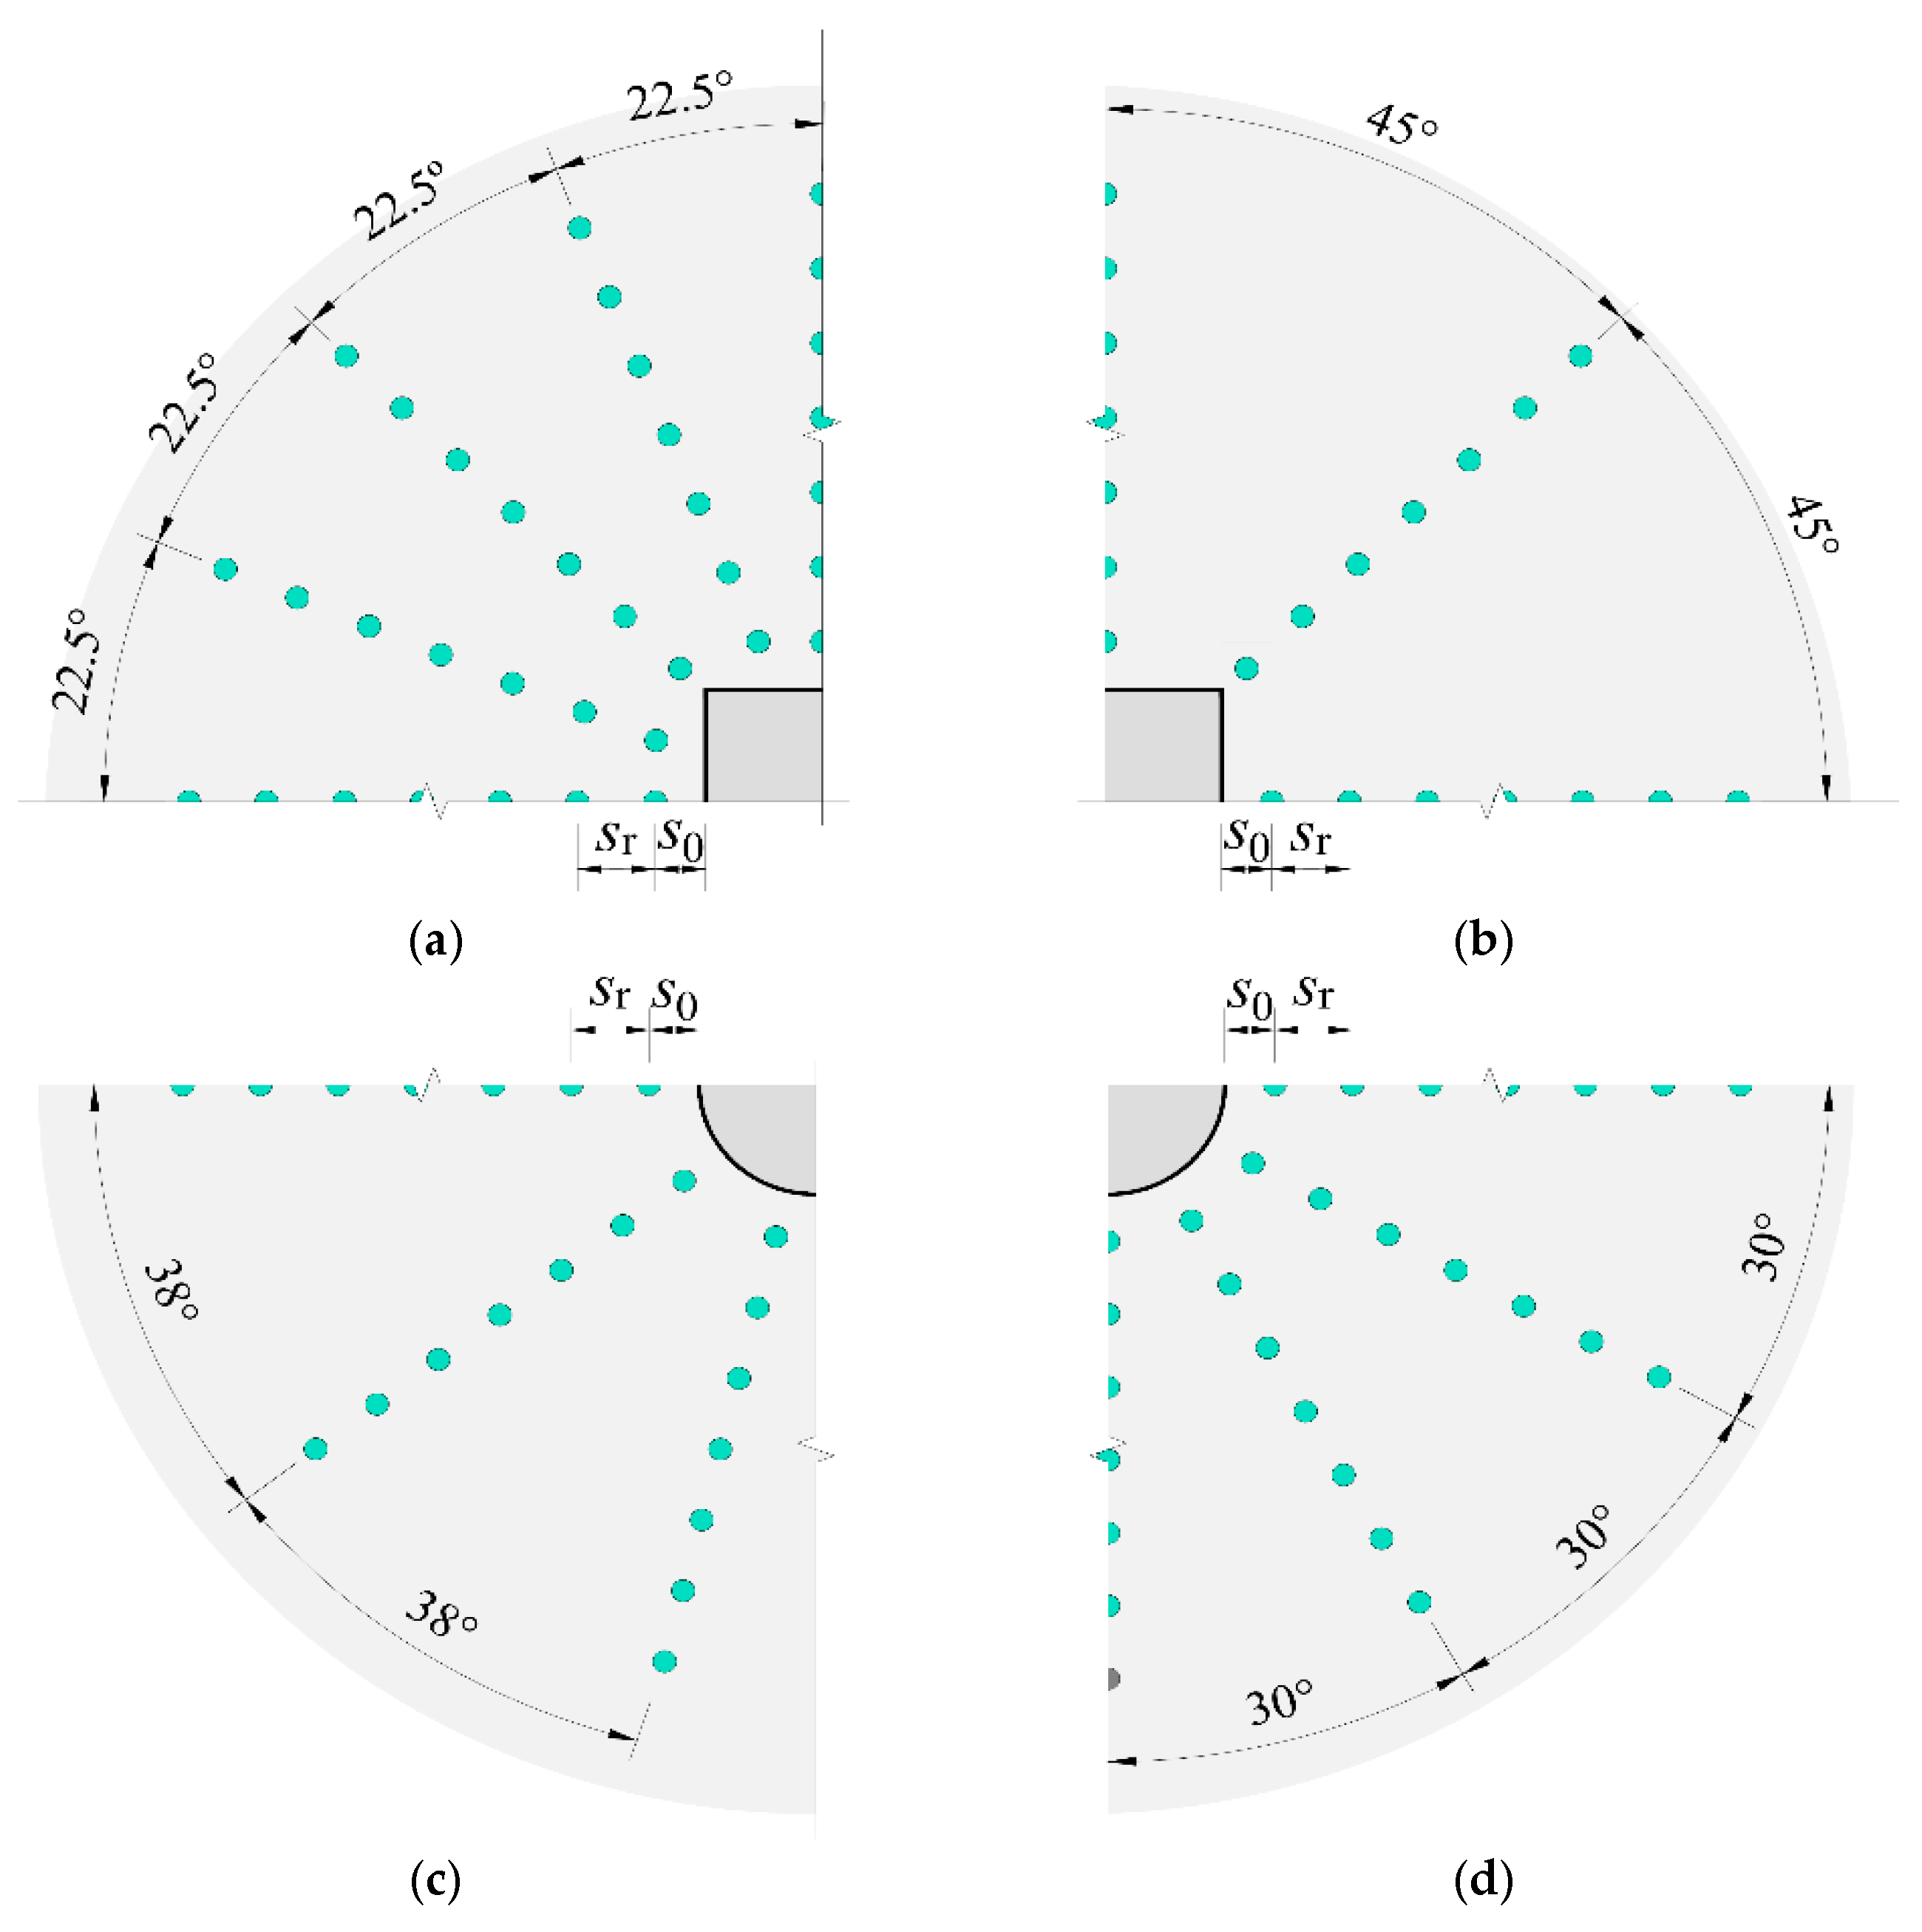
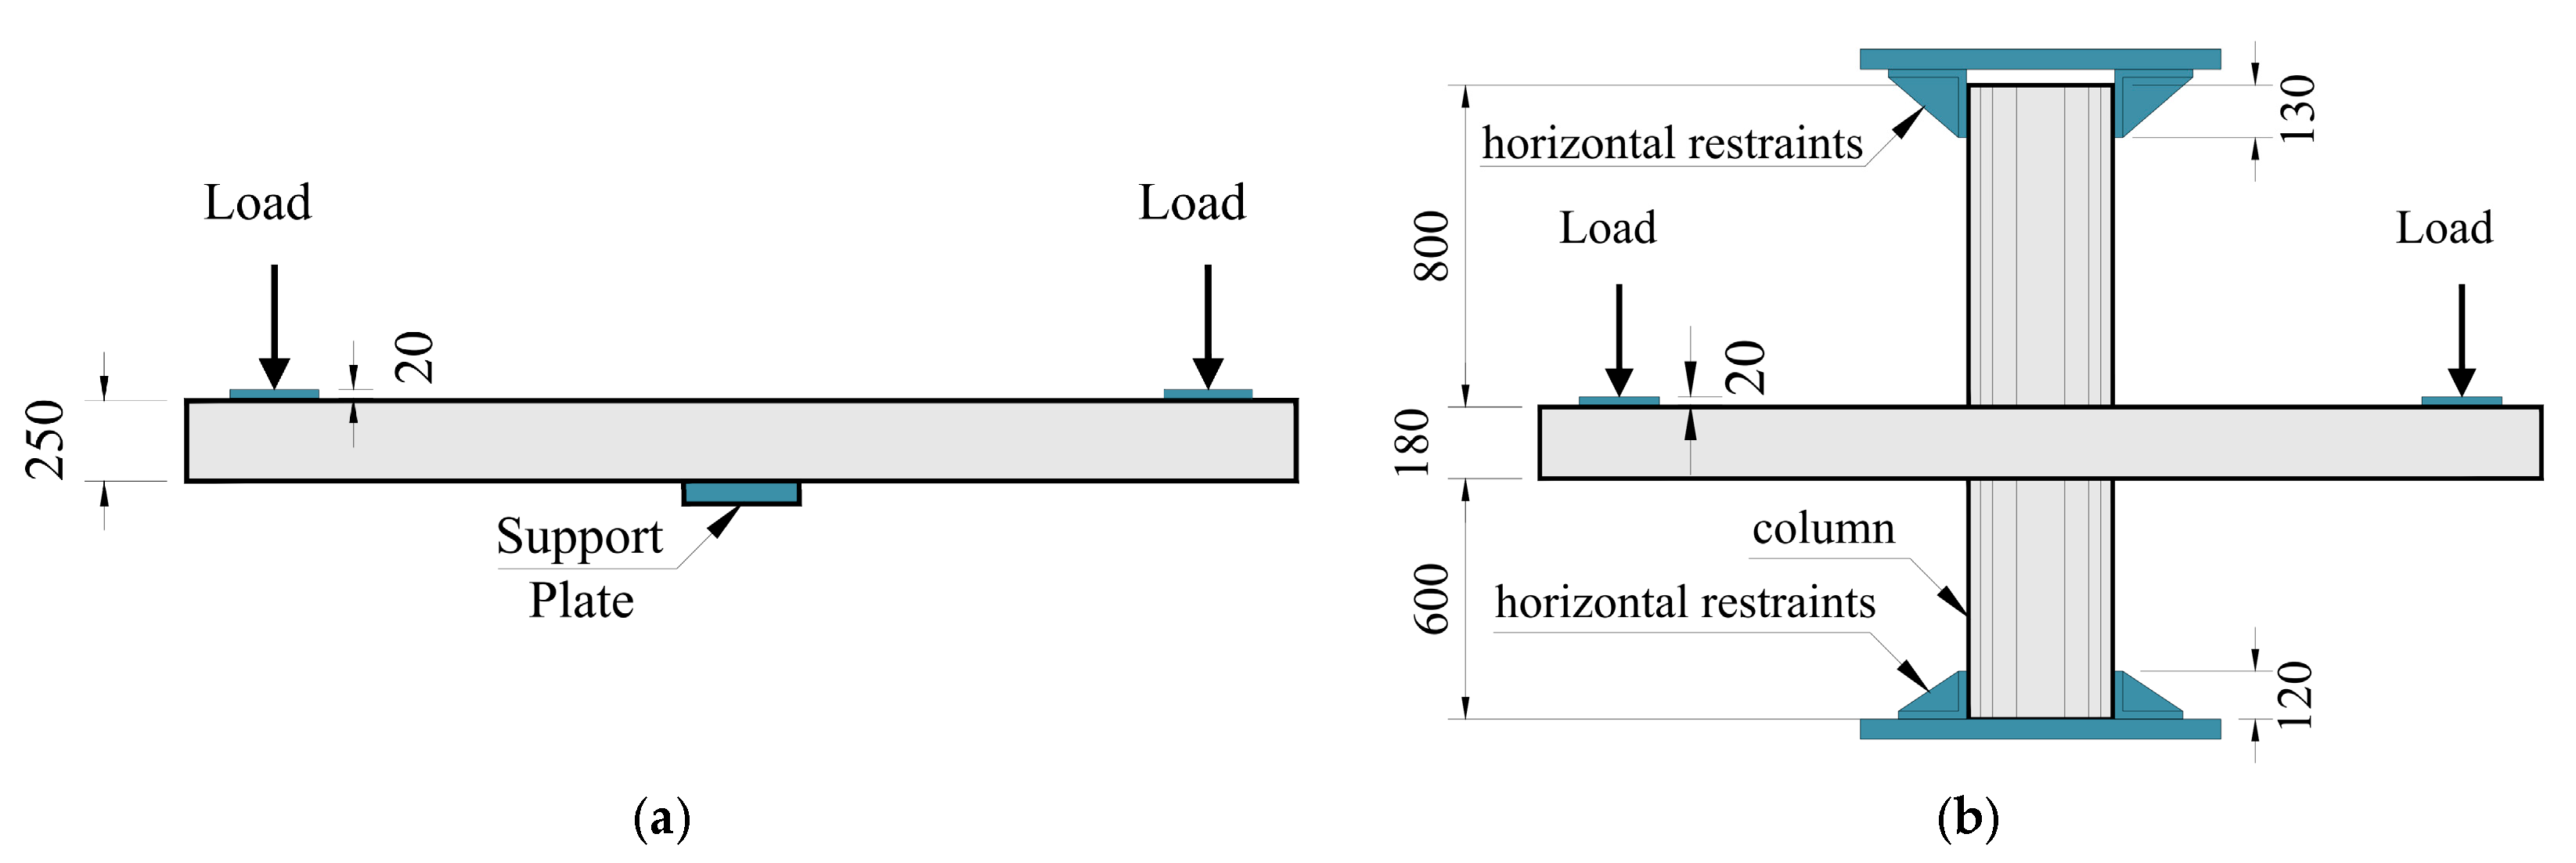
Figure 2 and Figure 3 show the geometry, boundary conditions, details of the flexural reinforcement, and measurement points of displacements and rotation of the slabs, Figure 4 is a photograph of the test setup and Figure 5 presents the arrangement of the double-headed studs. The experimental specimens consisted of isolated square-shaped panels idealised to represent the internal slab–column connections of a flat slab floor with symmetrical loading. Slabs tested by [9] were supported on square plates used to simulate the columns. The slabs tested by [2,14] were supported on column stubs.
The flexural reinforcement ratio of the tested specimens ranged from 1.41% to 1.62% and was defined by the authors to avoid flexural failures. The shear reinforcement ratio was calculated as shown in Equation (1), suggested by [33]. In this equation, Asw,1+2 is the sum of the area of transverse bars in the first two shear reinforcement perimeters, sr is the radial spacing of the shear reinforcement, and u0.5d is the length of the control perimeter at 0.5d from the column face with round corners.
ρ s w = A s w , 1 + 2 2 · s r · u 0.5 d
The slabs without shear reinforcement, PV1 and LS5, were used as benchmarks to calibrate the input parameters related to the concrete. The tests carried out by [2,9,14] assessed the influence of the following parameters: column size (LC1, LC2, LC3); the shear reinforcement ratio (LC2, LC8, PL7, and PL11); and the spacing between the shear reinforcement perimeters (LC2 and LC7). The failure mode of all the selected tests was punching shear within the shear-reinforced zone. The shear reinforcement ratio is the main parameter used to evaluate the performance of the modelling strategies, which ranged from 0.23% to 0.93%, according to Table 1.
All the slabs had double-headed studs whose heads were three times the diameter of their shanks, anchored at the height of the outermost upper and lower flexural reinforcement layers. Dial gauges positioned on the upper surface of the slabs were used by Ferreira et al. [2] to measure the vertical displacements of the tested slabs. Lips et al. [9] used inclinometers at the load application radius to measure the slabs’ rotation along tests. Both authors used a pair of strain gauges to measure the strain in the flexural and shear rebars, and in the shear reinforcement, the strain gauges were placed at mid-height of the double-headed studs’ shanks.

3. Modelling Strategies

3.1. Constitutive Material Models

The numerical simulations were conducted using the ATENA software (version 5.6) developed by Červenka Consulting [34]. The constitutive model used to represent the concrete nonlinear behaviour was CC3DNonLinCememtitious2, which combines constitutive models for tensile (cracking) and compression (plasticity) behaviour.
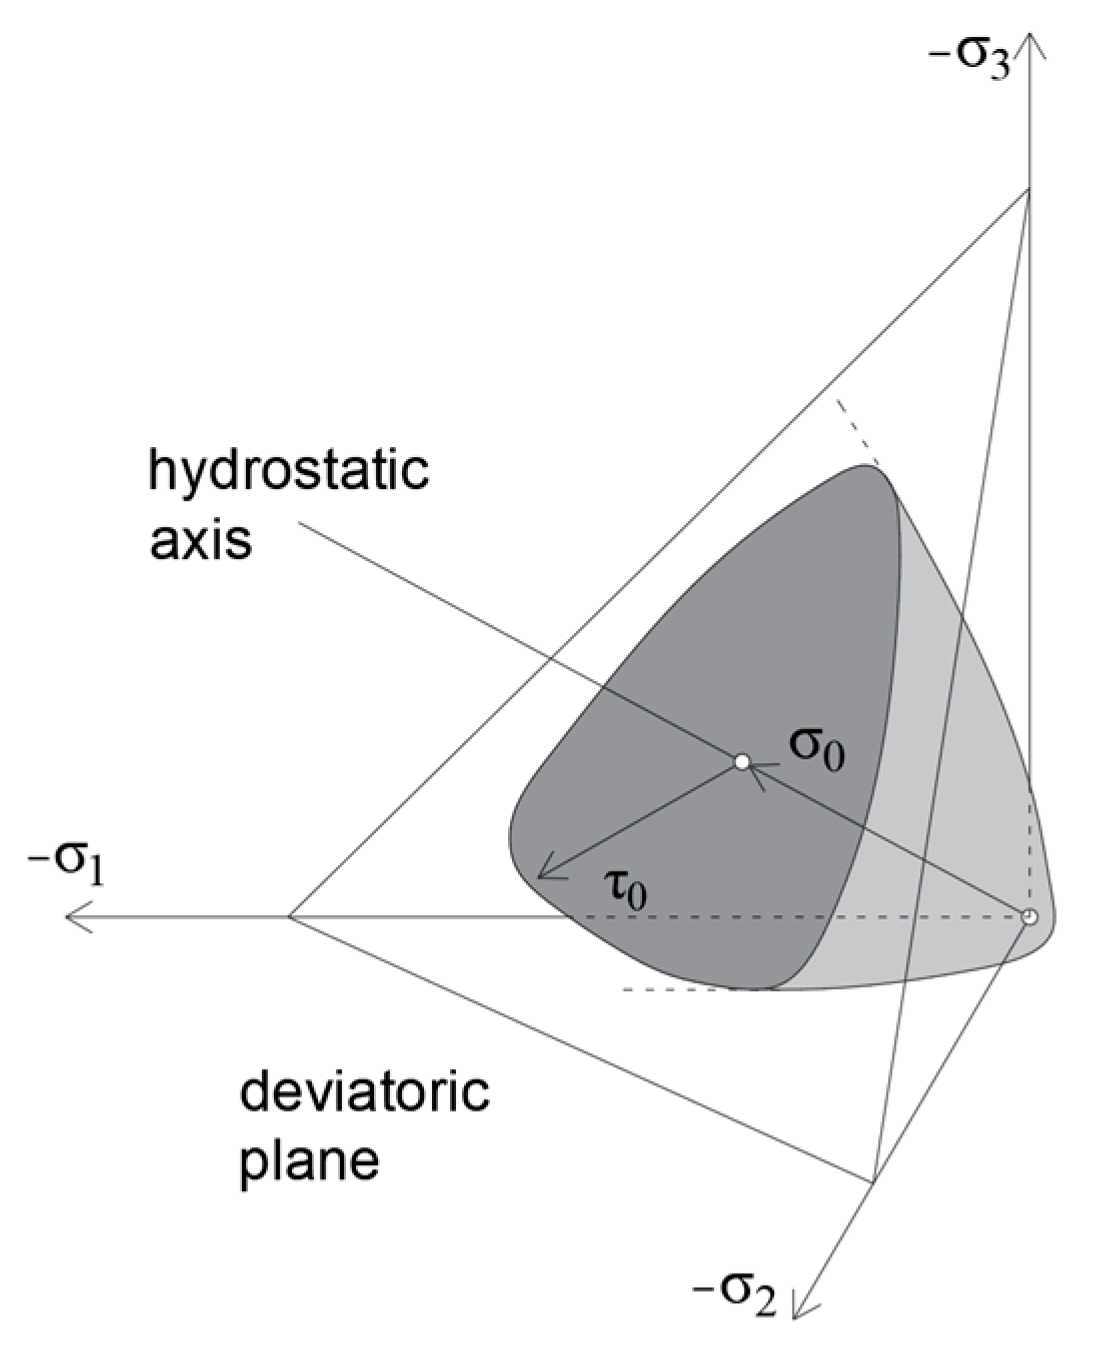
According to [34], the nonlinear concrete behaviour is simulated by the smeared crack approach and crack band model (see Figure 6b). The multiaxial compressive behaviour is given by a plasticity model based on Menétrey–Willam’s failure surface (see Figure 7), which evolves by the hardening/softening laws described in Figure 6a.
In the smeared crack approach, the crack is formed according to the Rankine failure criterion when the principal stress exceeds the tensile strength of the concrete at an integration point.
Fixed or rotating crack formulations are available to represent the cracking process of the slabs. The fixed cracking model keeps the crack direction constant throughout the loading history. In the rotating model, the crack direction changes depending on the principal stress axes. The fixed crack model can consider the aggregate interlock by decreasing the shear modulus with an increase in the normal strain on the crack. More information about the constitutive models available in ATENA can be found in [34,35].
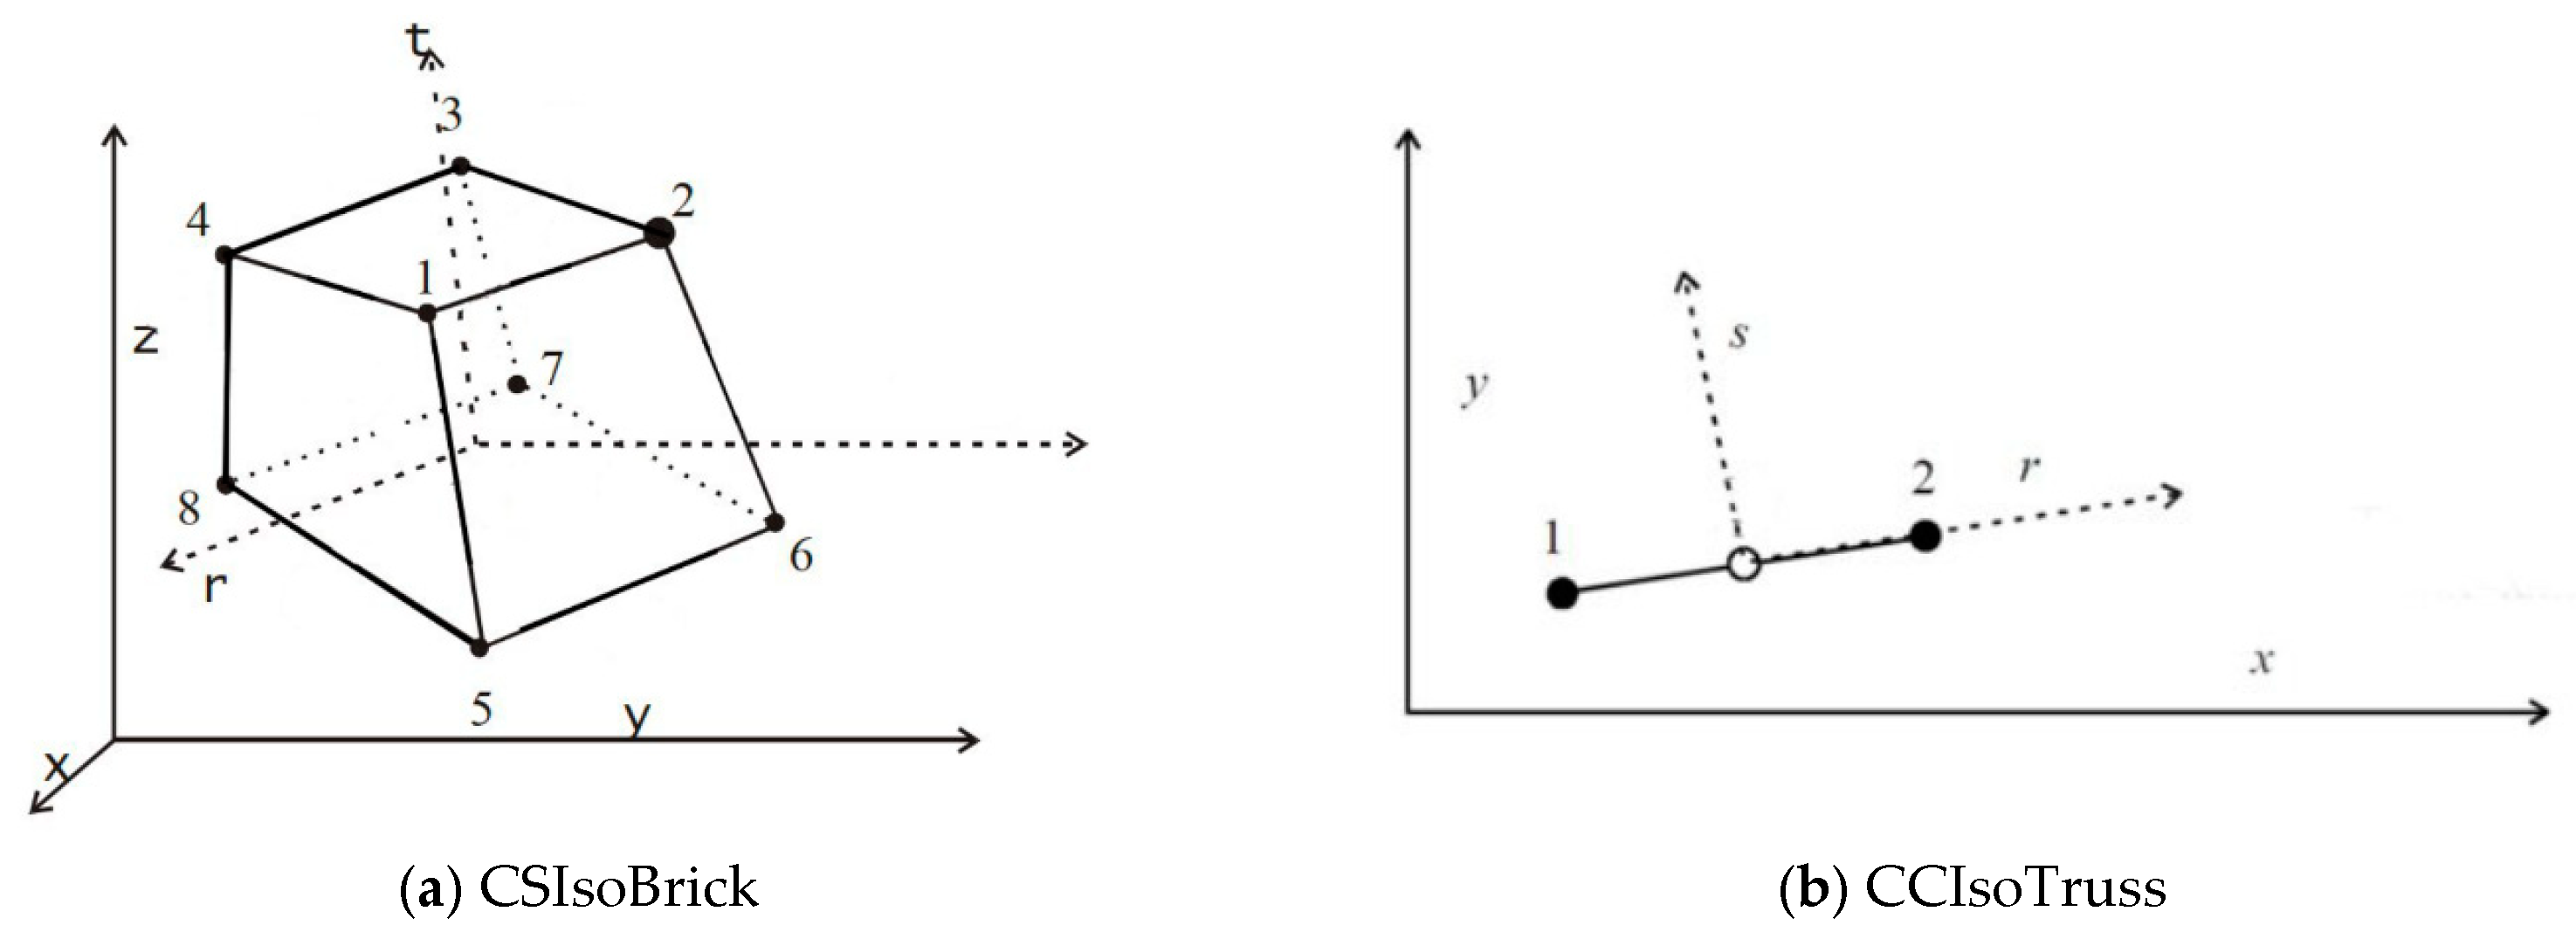
In the numerical models, hexahedral elements (CSIsoBrick in ATENA) were used to represent the concrete and the support plates. These elements consist of eight nodes, one located at each vertex, or 20 nodes, one at each vertex plus the intermediate nodes. The use of the brick-type element is usual in this type of computational modelling (see [25,26,36], among others). Brick elements with eight nodes, as shown in Figure 8a, were used in this work. The flexural reinforcement was represented with CCIsoTruss elements. These are linear truss elements, capable of resisting tensile and compression forces only, and may have two to three nodes, two at the ends and a third intermediate one, as illustrated in Figure 8b.
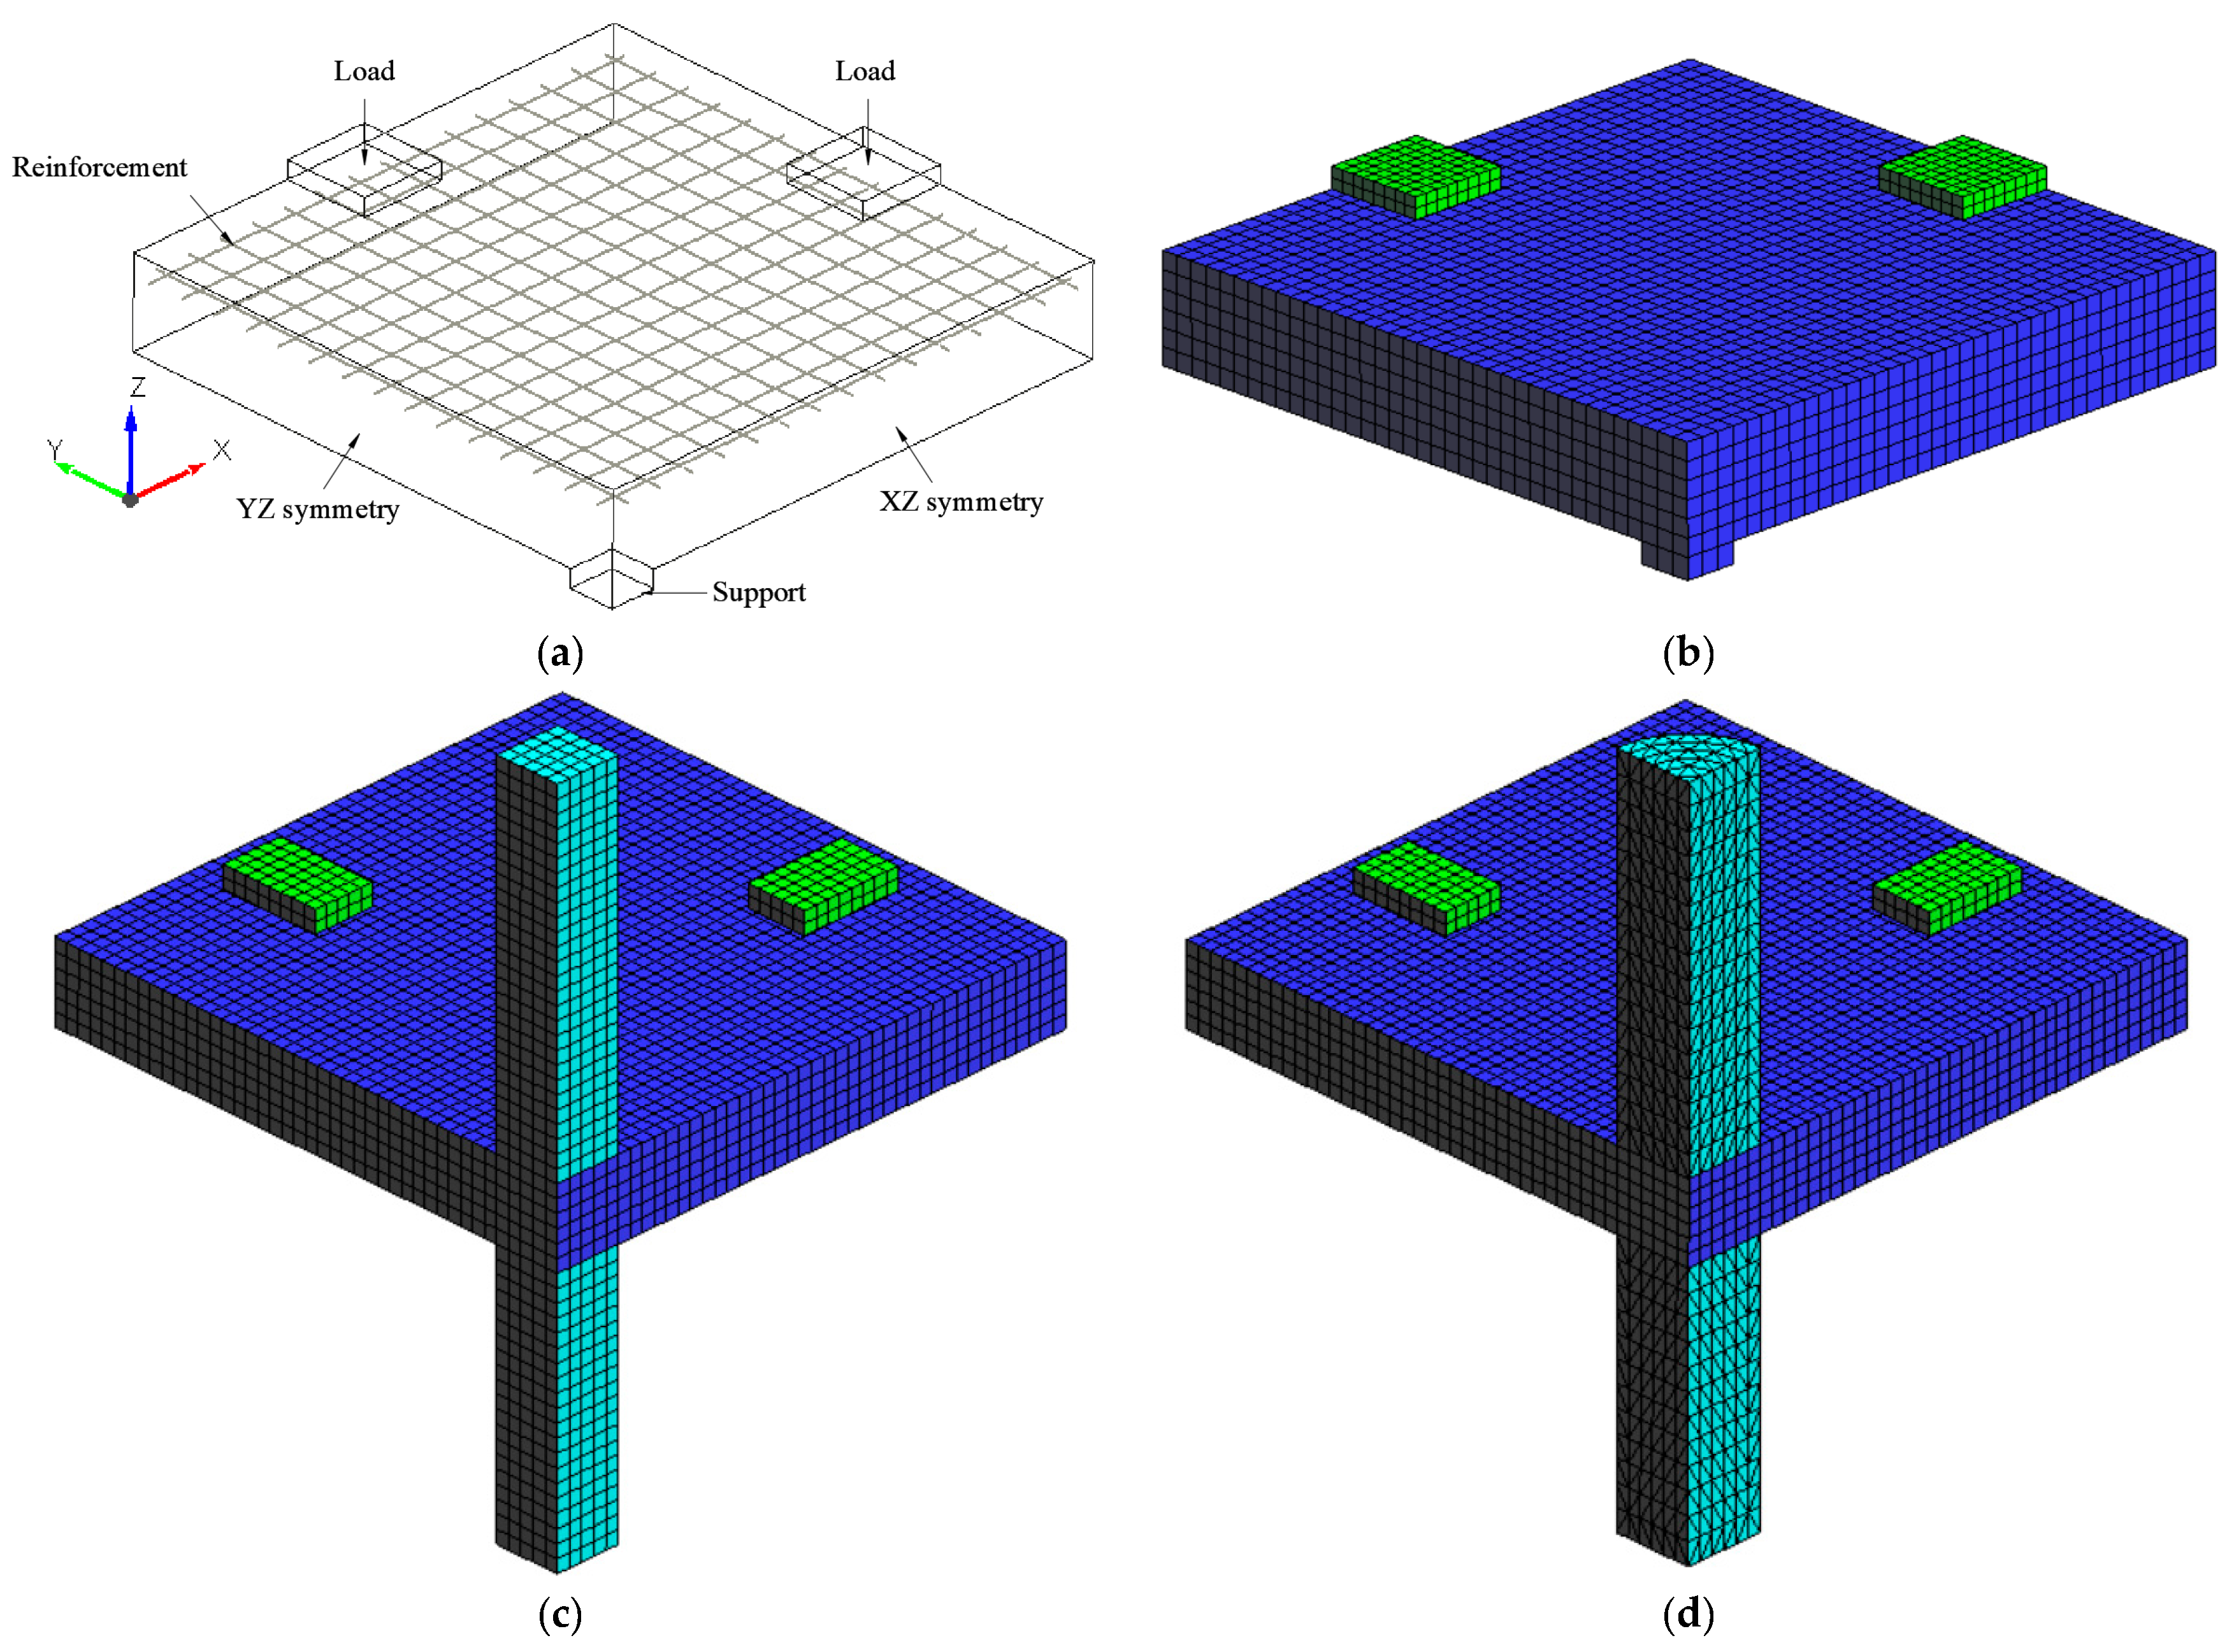
Figure 9 shows the finite element mesh used in the numerical models. The mesh of the column segments kept the same element size as the rest of the slab. The circular column stubs were simulated with tetrahedral elements. The supports and loading plates were modelled with linear elastic isotropic properties. Due to the symmetry of the tested specimens, only one quarter of the slabs were modelled, saving computational time. The continuity in the symmetry regions was simulated with the restriction of horizontal displacements perpendicular to the symmetry axes. The vertical movements of the slab were restrained in the base of the column. The loading was applied as displacement increments in the centre of each loading plate, as shown in Figure 9a, in 100 loading steps of 0.25 mm and 0.40 mm each for series LS-LC and series PV-L, respectively. The Newton–Raphson iteration method was used, and the convergence criteria were maintained with the default values (0.01 in displacement and 0.0001 in energy).
Displacements were measured at several points of each numerical model for comparisons with the experimental results. Since [9] directly reported the rotation of the slabs, Equation (2) was used to calculate the rotation of the numerical models based on displacement measurements. For uniformity, the slab displacements reported by [2] were transformed into rotations using Equation (2). The model’s failure was defined at the peak load, and the aspect of cracks and strains served as a reference for confirmation.
ψ = δ 1 δ 2 r 1 2
where, δ1 is the maximum displacement measured, δ2 is the displacement measured at a distance from the centre of the slab, and r1-2 is the distance between the measuring points for δ1 and δ2 (575 mm for series LC and 900 mm for series PL).

3.2. Preliminary Simulations

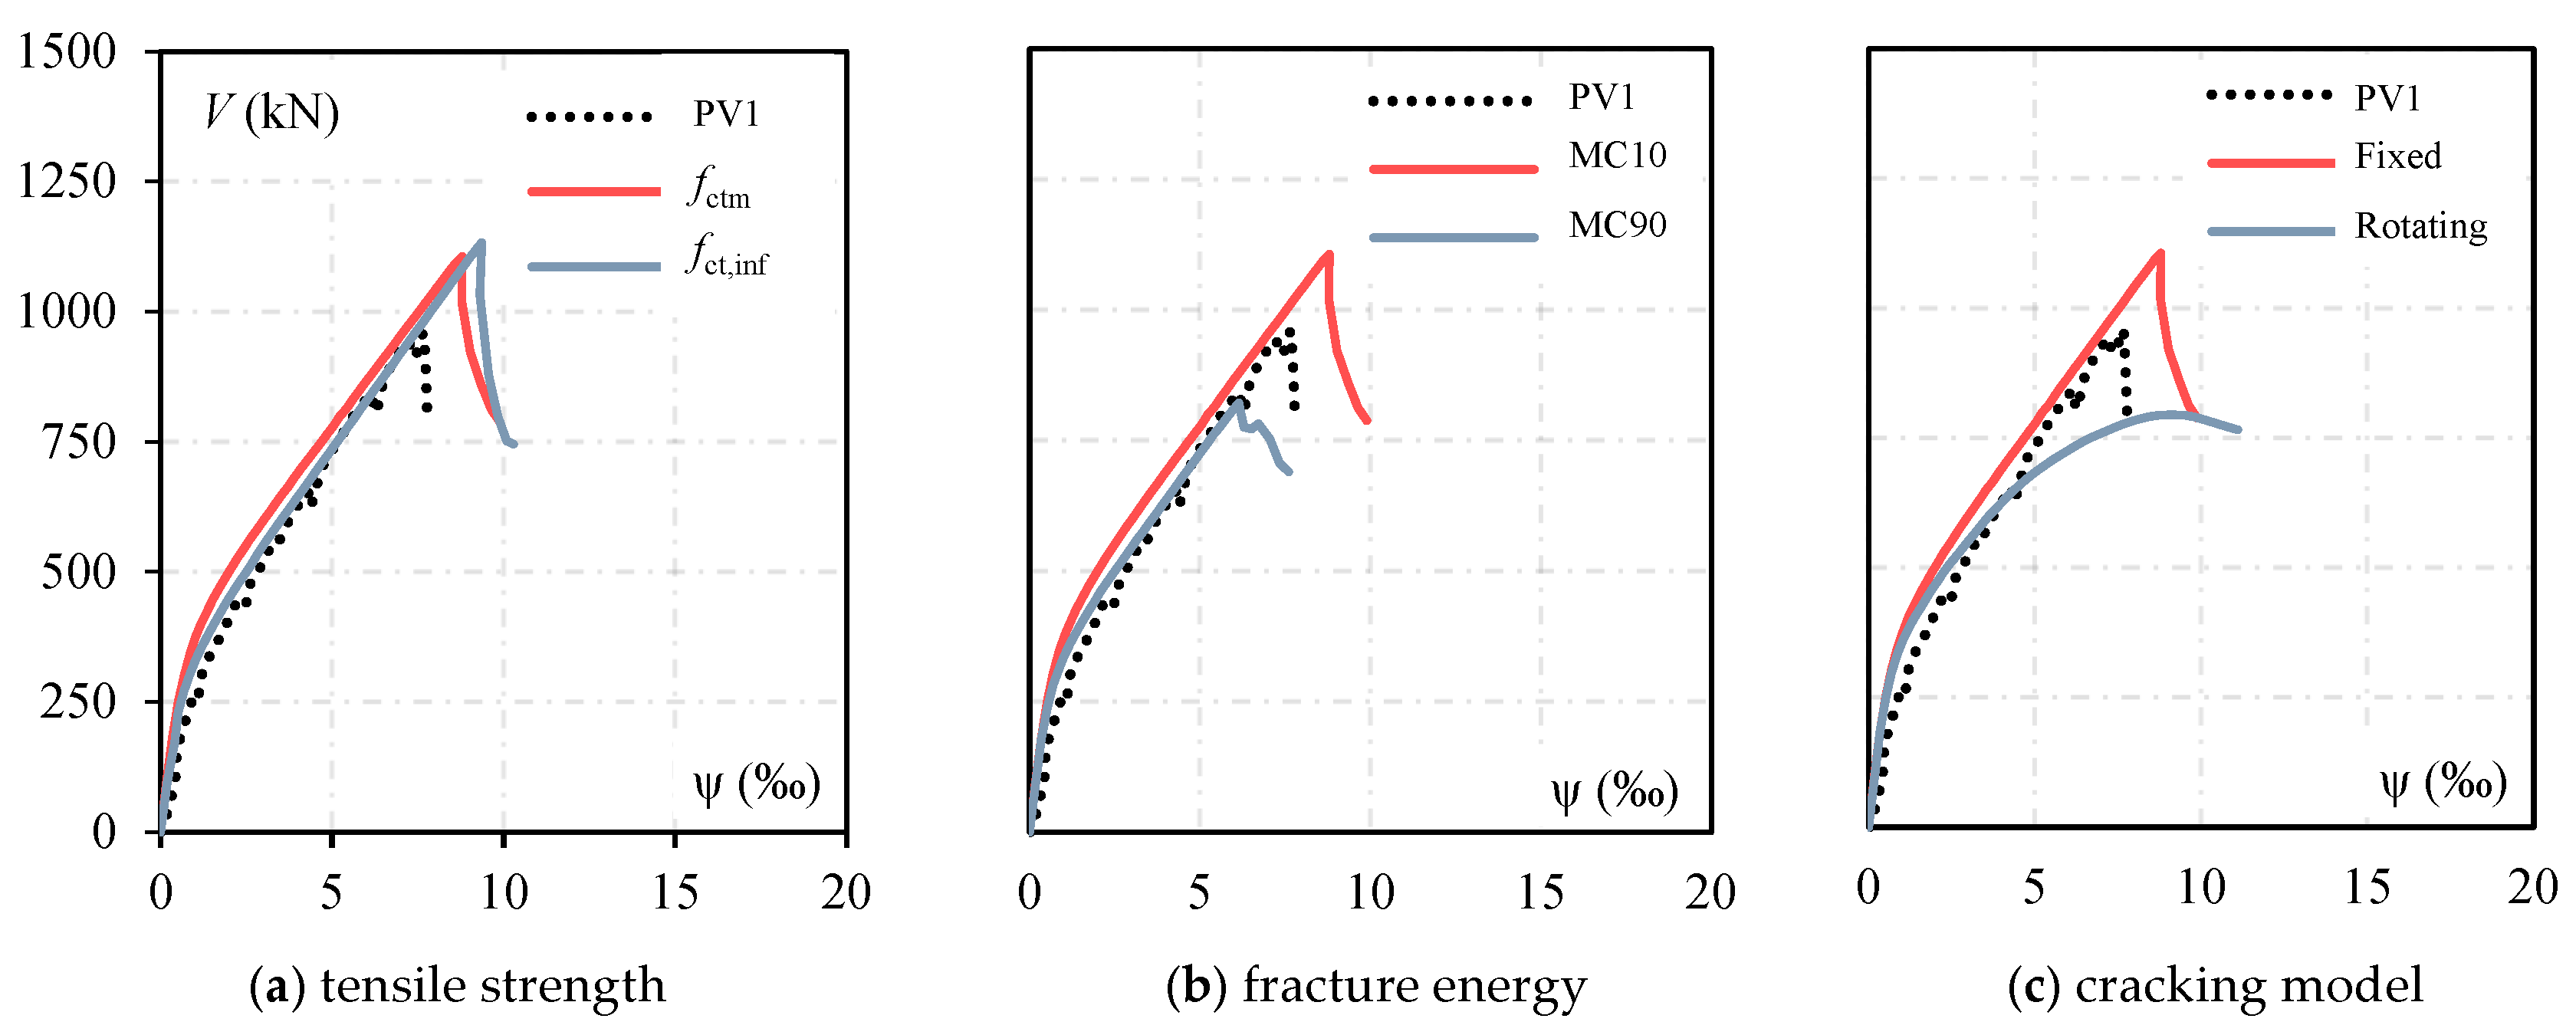
Slab PV1, tested by [9], was defined as a reference for modelling slabs without shear reinforcement. Research by [37] examined the impact of various mesh sizes, primarily by modifying the number of elements across the slab thickness, on the response and resistance of slab–column connections. Based on their results, this research used six elements along the slab thickness in all numerical models. Parametric analysis was also carried out to define the criteria to attribute values for the concrete tensile strength (ft), the concrete fracture energy (Gf), the cracking model, and the shear factor.
The influence of Gf on the response and strength of the numerical model was evaluated considering the recommendations presented by the fib Model Code 2010 [38] and its former version in [17]. Regarding the tensile strength of concrete, in the numerical models, the values used refer to fctm and fct,inf from the [38]. As noted by [39], the tensile strength directly affects the load-carrying capacity of the computational models. Furthermore, a comparison between the fixed and rotating crack models was conducted. Table 2 summarises the parameters for calibrating the reference slab (PV1).
Figure 10 presents the results of the tests. For the concrete tensile strength, it was observed that using the lower bound values (fct,inf) improved the correlation between the experimental and the numerical results, as the cracking starts earlier. The tested values of Gf were 0.138 N/mm and 0.07 N/mm, calculated as recommended by [17,38], respectively. Adopting a lower value of Gf improved the correlation between the numerical and experimental results in terms of both cracking and failure load. On the other hand, calculating Gf as recommended by [38] led to overestimated theoretical results. Authors such as [25,37] recommend calculating Gf as recommended by [17] because the equation presented by [38] does not consider the diameter of the aggregate. However, it should be highlighted that in numerical methods, the value of Gf is intrinsically related to the element crack bandwidth [40]. Therefore, the results above depend on the ATENA crack bandwidth applied to brick elements.
Finally, regarding the concrete cracking models, the rotating crack model showed a poor correlation between the stiffness and load-carrying capacity of the tested slab. Table 3 presents the parameters defined for the final model for PV1 after calibration, and Figure 11 illustrates the load–rotation response obtained for this configuration for both PV1 and LS5, which is the model without shear reinforcement tested by [2]. A good correlation is observed between the computational and experimental responses during linear and nonlinear stages.

3.3. Simulations of Slabs with Shear Reinforcement

The shear reinforcement was modelled using CCIsoTruss elements, assuming a perfect bond between concrete and steel. Despite its simplifications, this modelling strategy has yielded reliable results in previous studies ([26,27,29,30]). An elastic-perfectly plastic constitutive law was adopted for steel, while the concrete and longitudinal reinforcement properties followed the recommendations from prior analyses, as summarised in Table 3. Figure 12 illustrates the numerical representation of the double-headed studs in slab PL7, tested by [9]. Since the model considers only one-quarter of the slab, the studs along the symmetry axis were represented by elements with half of the reinforcement area.
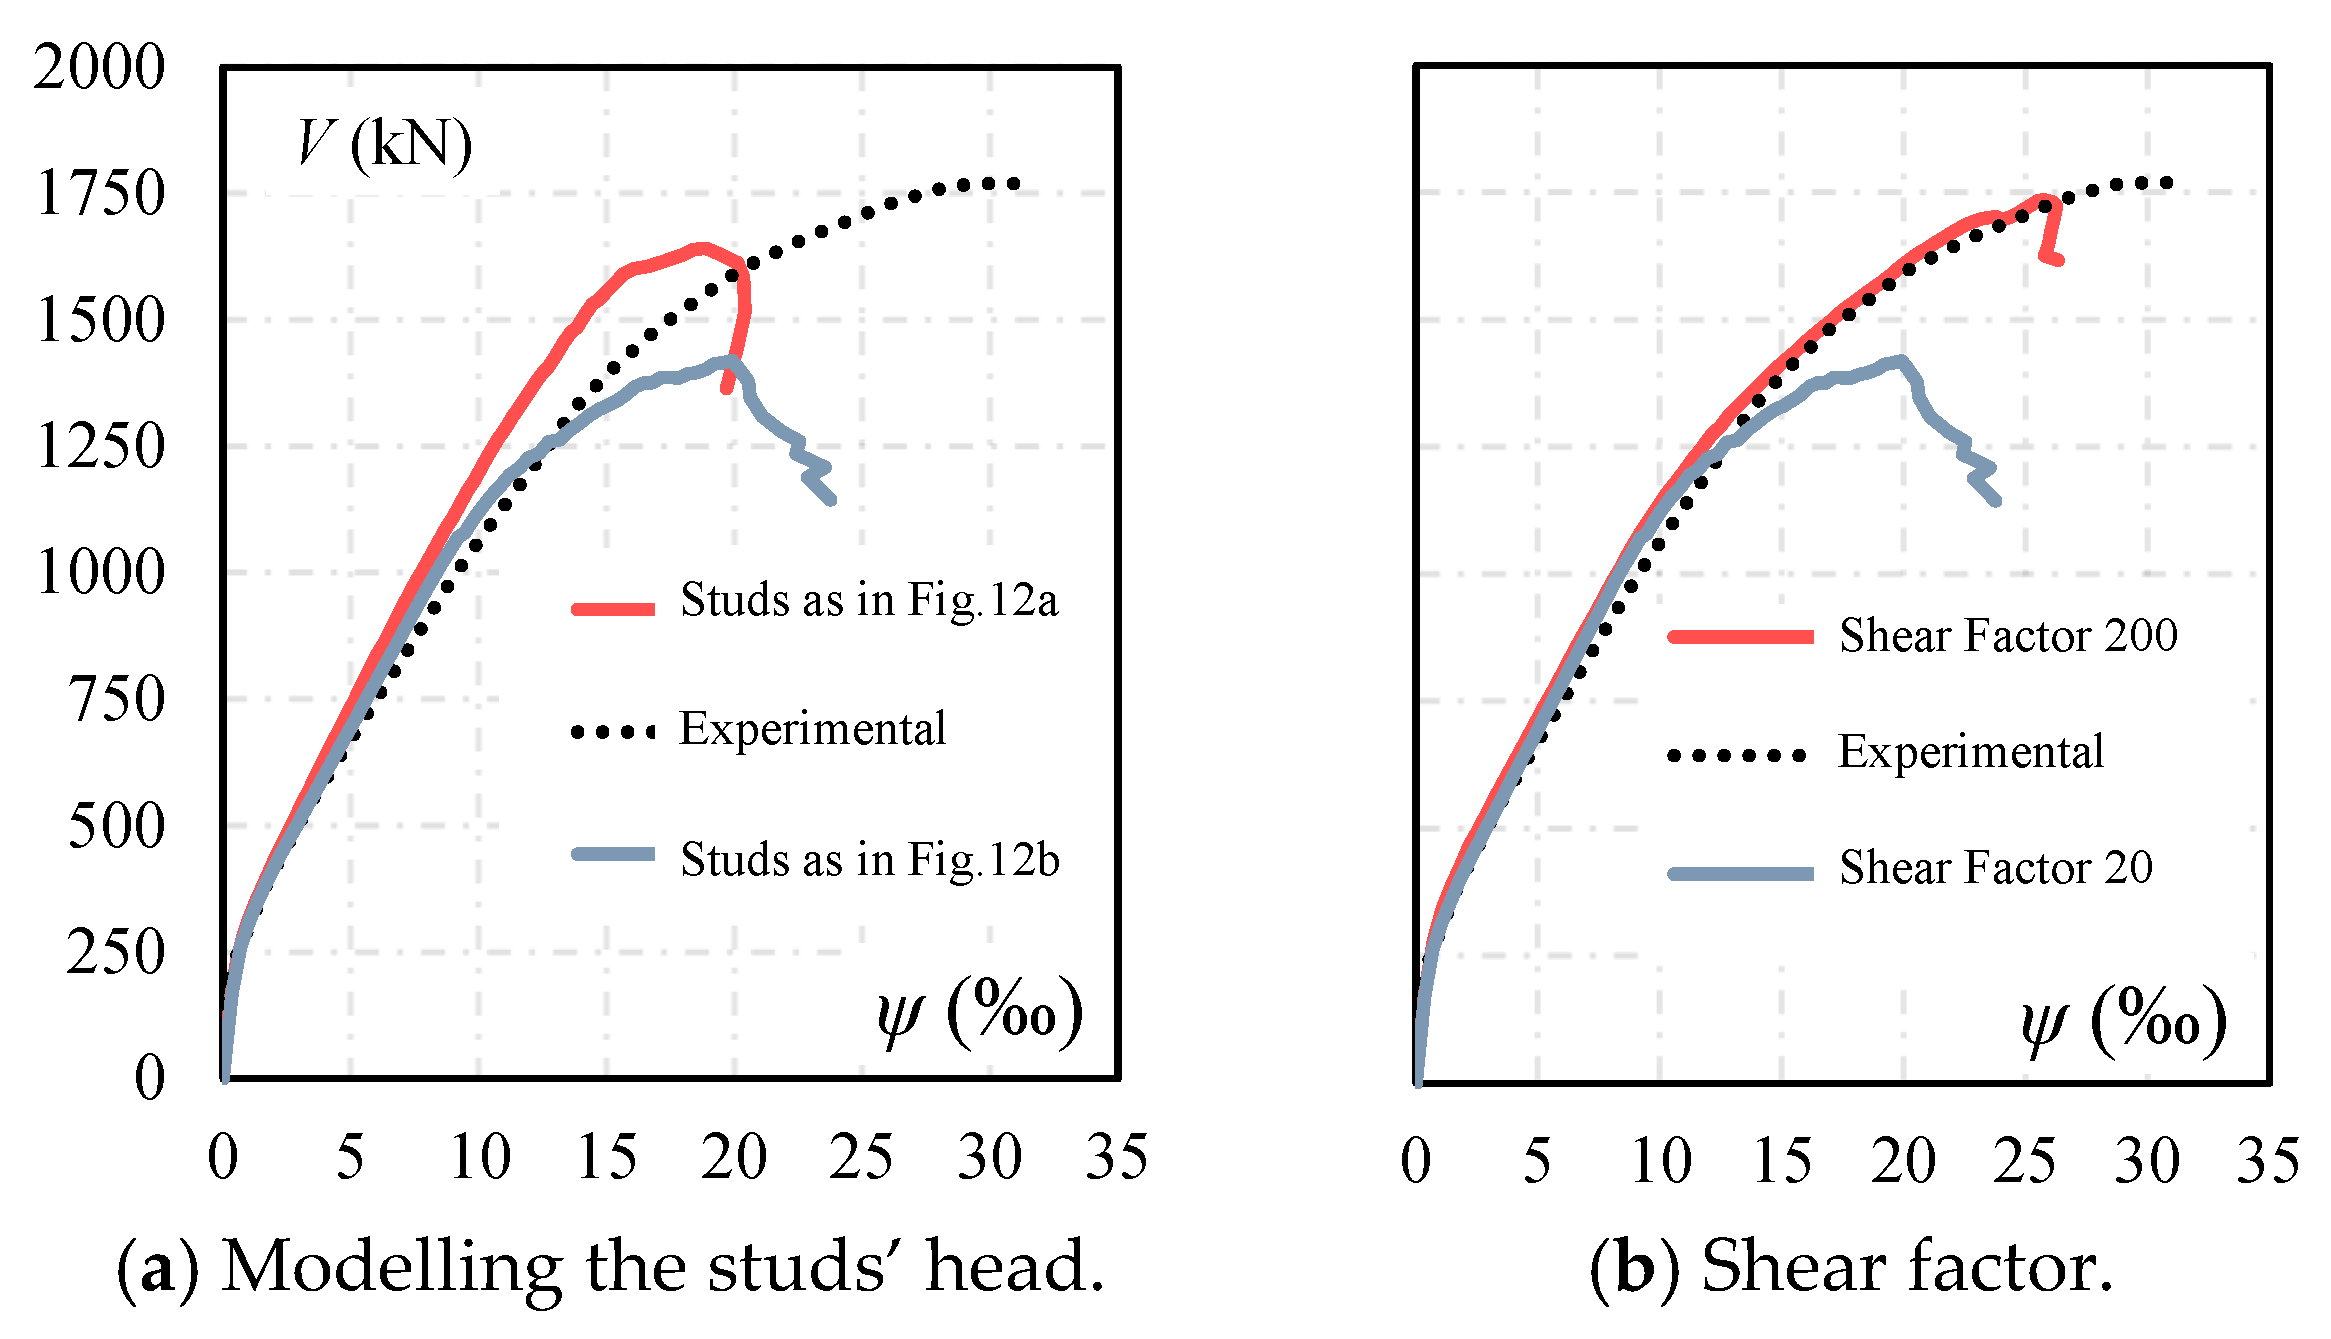
A key aspect investigated was the influence of the stud heads. According to [29], these heads can be represented by additional bar elements at the top and bottom of the stud (Figure 12a) to improve stress distribution and mitigate localised concrete cracking. Figure 13a compares two numerical approaches: in the red line, stud heads were explicitly modelled, while in the blue line, the studs were represented as straight bars (Figure 12b). Although explicit modelling slightly increased the punching resistance, it also altered the slabs’ stiffness, leading to discrepancies in the numerical load–rotation response compared to the experimental data.
The influence of the shear factor (SF) was investigated to refine the numerical predictions further. As described by [41,42], SF is a crucial parameter for modelling shear failures, defining the relationship between normal and shear crack stiffness [34]. In ATENA, the default SF is 20. In [41], the authors varied SF from low values up to 200 when modelling large RC beams, observing premature shear failures at lower values and better correlation with experimental results at SF = 200.
Figure 13b analyses the effect of SF on numerical predictions. In both cases, the studs were modelled without heads, but SF was set to 20 and 200, with the latter considered an upper bound following [41]. Increasing SF significantly improved the agreement between numerical and experimental results, particularly in terms of ultimate punching resistance and load–rotation response.
In addition, as the modelling of the studs’ head resulted in a stiffer load–rotation response than observed on the experimental test, it was decided to discard this approach; thus, the shear reinforcement was modelled, as shown in Figure 12b. Figure 13b compares the effect of the shear factor in the numerical response and resistance of slab PL7. It is possible to note that the increment of the shear factor significantly improved the correlation between the numerical and experimental results for slab PL7, both in terms of stiffness and ultimate load. The assumption of considering the shear factor as 200 was assessed in the remaining slabs presented in Table 1. As expected, it was observed that the trend was to overestimate the punching shear resistance of slabs without or with low-to-moderate shear reinforcement ratios. Based on all the analyses carried out and discussed up to this point, two sets of strategies for the numerical modelling of flat slabs with double-headed studs were defined, as presented in Table 4.
The main differences between these strategies are in the values assumed for the tensile strength of concrete and the shear factor. For Strategy I, the objective was to establish a set of input parameters so that the theoretical response and the punching strength estimates would be accurate but fundamentally on the safe side. Therefore, fct,inf, calculated as presented in Table 2, was used as the tensile strength of concrete (ft), and the shear factor was considered as 20. Alternatively, Strategy II was intended to be a reasonable procedure, but it was able to capture the high levels of punching shear strength observed experimentally in tests on slabs with high ratios of double-headed studs, such as PL7. In this case, fctm was considered for the tensile strength of concrete (ft), and the shear factor was considered as 200.

4. Results and Discussions

4.1. Load–Rotation Curves

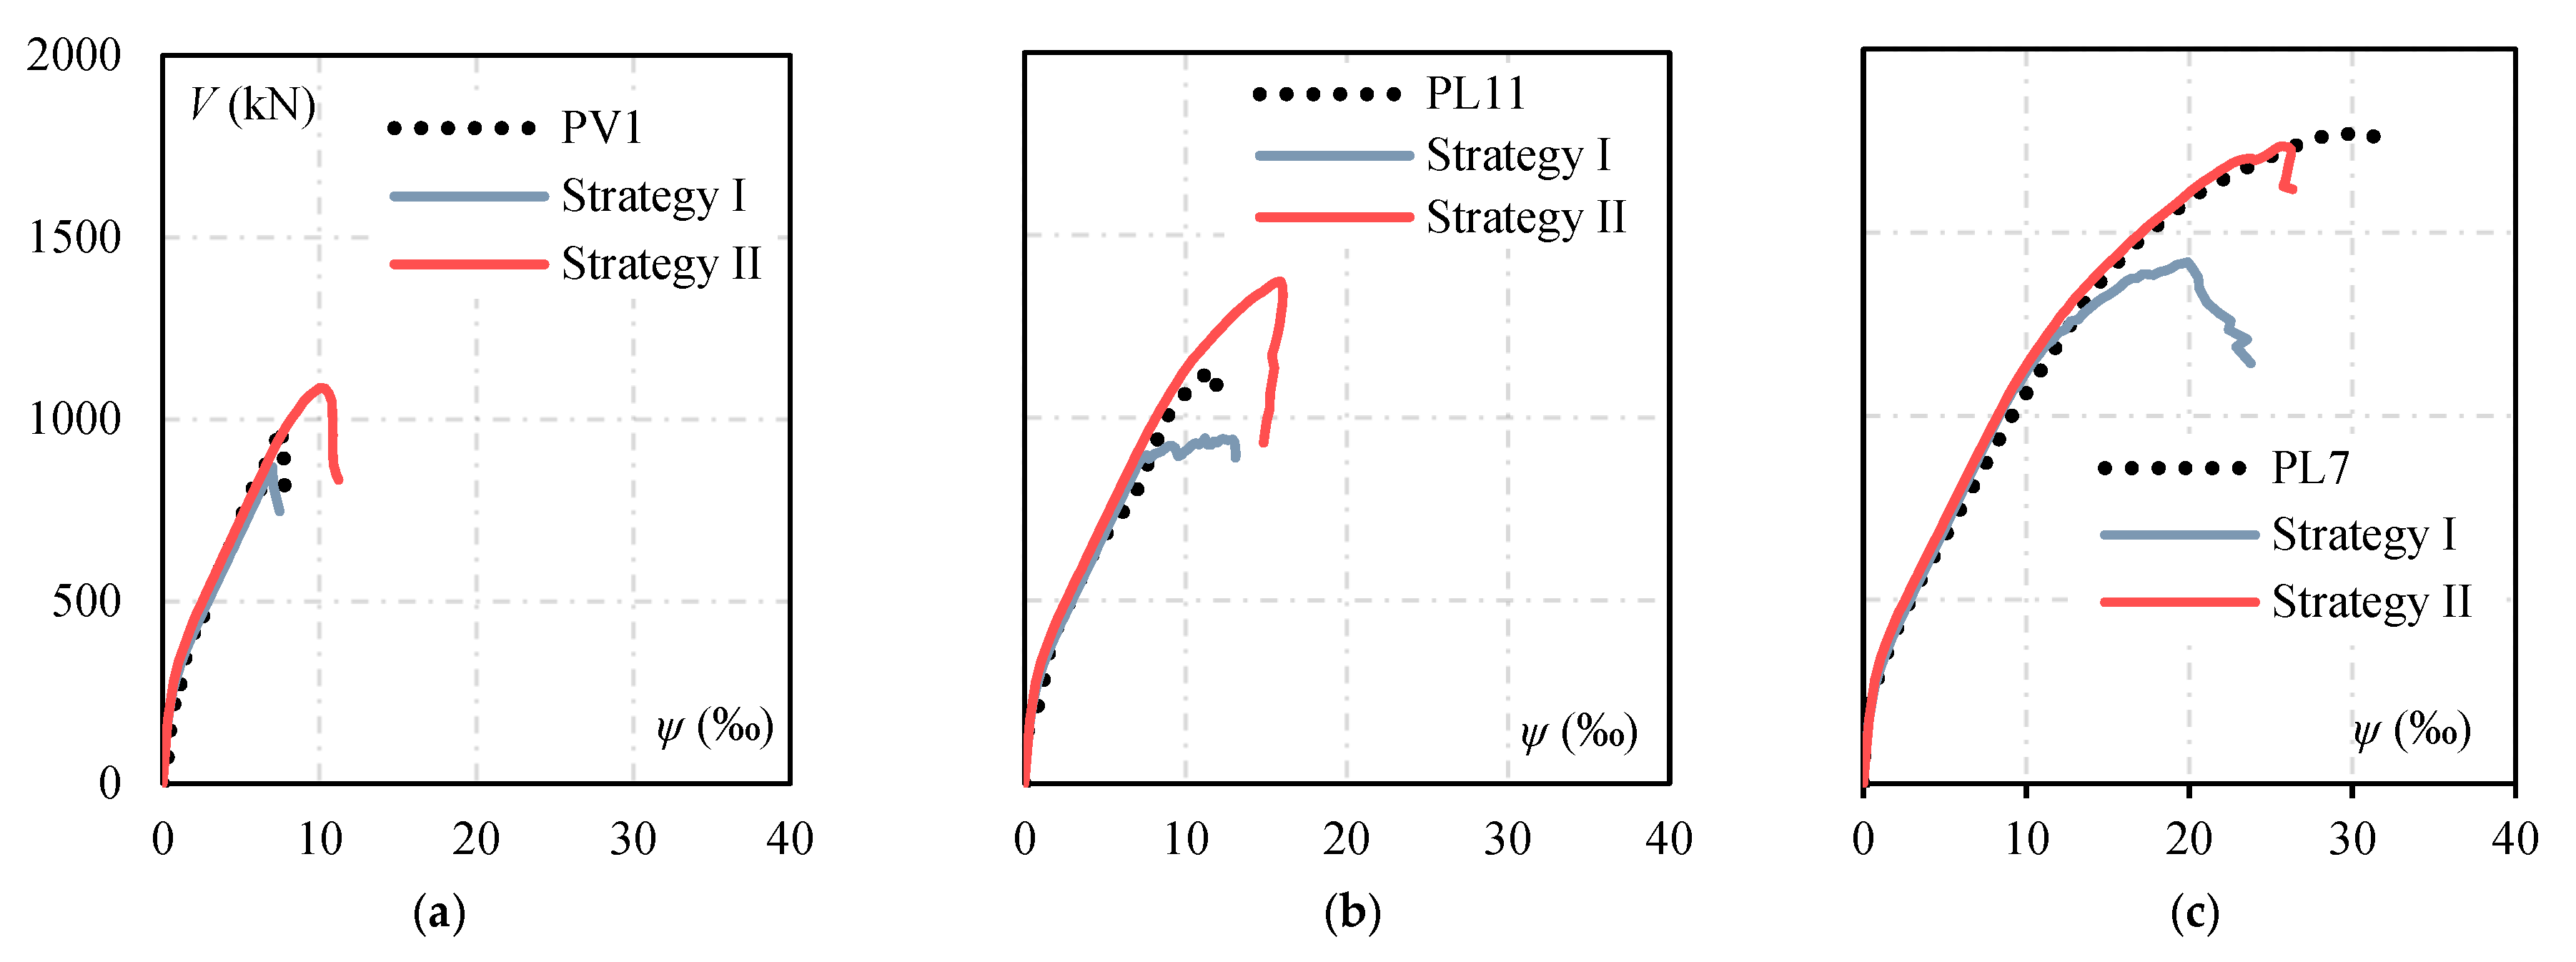
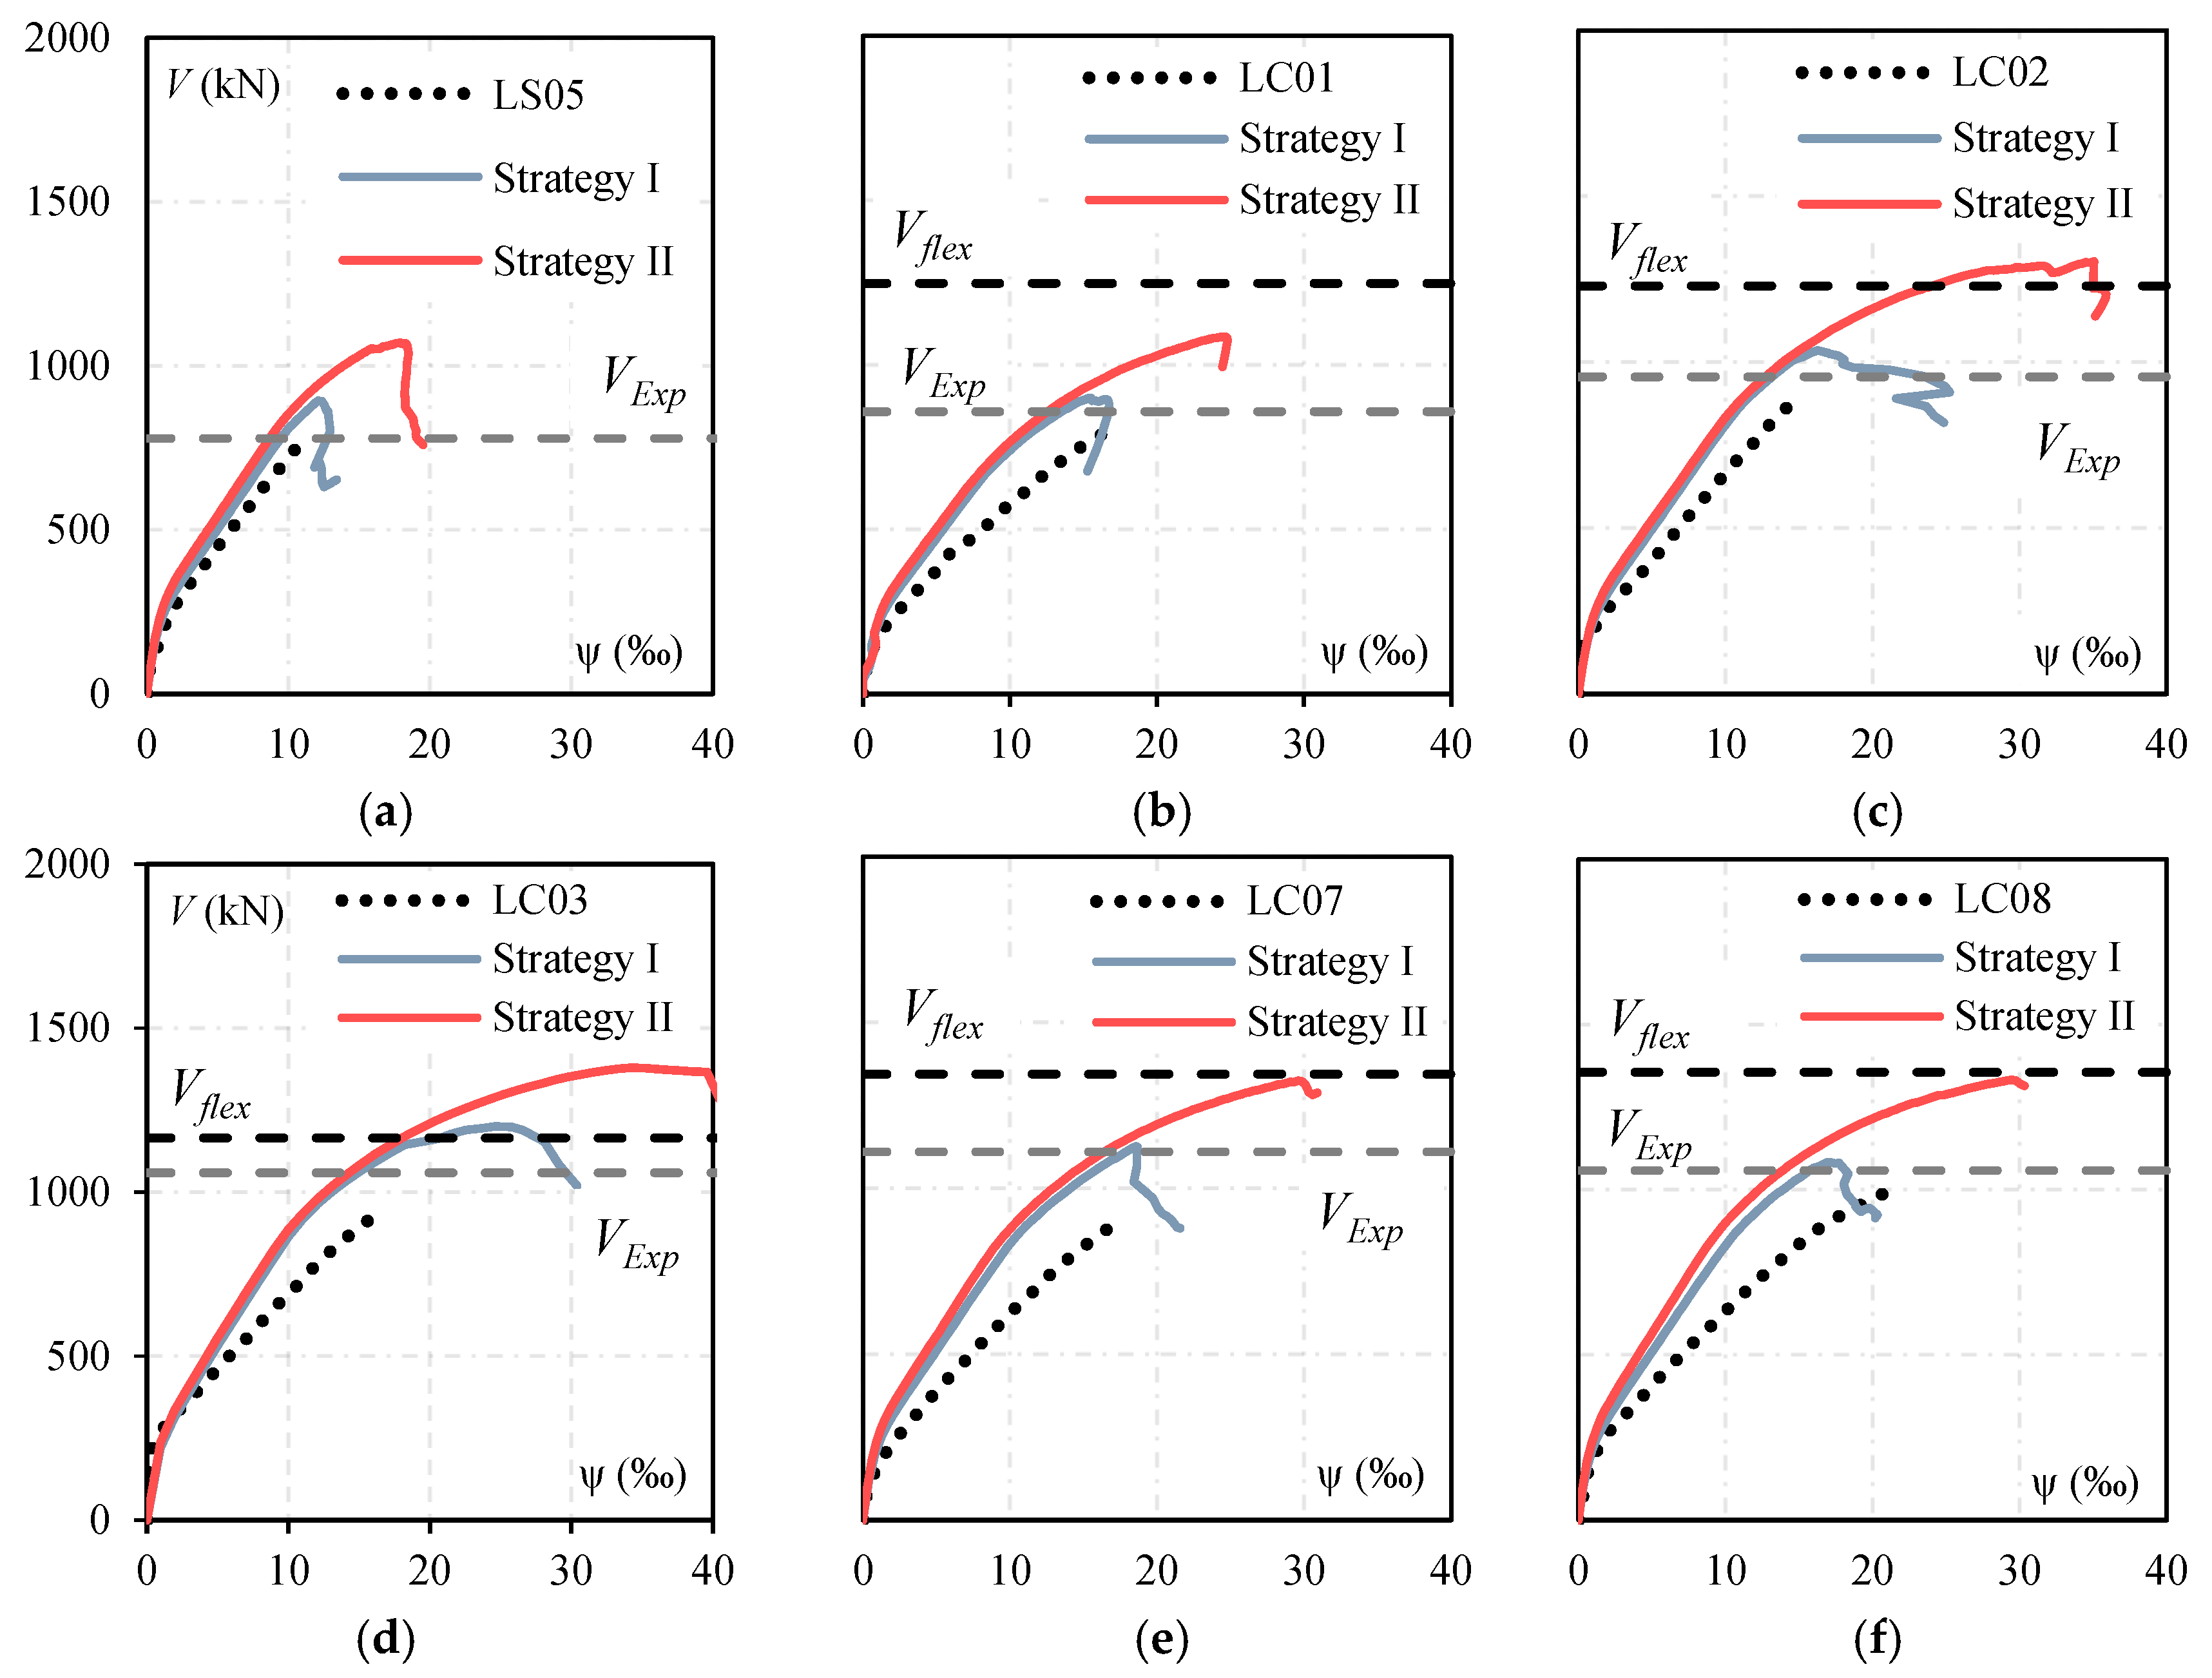
Figure 14 and Figure 15 compare the load–rotation response obtained in the numerical models and the experimental ones for the slabs with shear reinforcement. For series C, a grey dashed line was included in Figure 13 to indicate the experimental strength, as the vertical displacement monitoring was interrupted before failure. Furthermore, the flexural resistance of the slab–column connections, calculated according to [19], is shown by a black dashed line. For the series PL, the flexural resistance was estimated at around 2500 kN, which is relatively higher than the experimental strengths. Thus, Vflex was omitted in Figure 14.
A stiffer behaviour was observed in the load–rotation curves for the slab type LC, even with Strategy I. This disagreement may be related to setup settlements observed during the test, as shown in Figure 4. While the test slab rests entirely on the metal frame reaction frame, the displacement measurement system rests directly on the floor, so it is possible that in addition to displacements due to the deformation of the concrete of the test slabs, small displacements of the test frame were also measured.
Generally, a reasonable agreement between the numerical and experimental strengths for both series of tests can be observed. The results show that Strategy I was adequate in estimating the strength of slabs without or with low-to-moderate amounts of shear reinforcement, while Strategy II was more efficient for slab PL7, with a high shear reinforcement ratio. From this point forward, the computational results obtained using Strategy II will be used to discuss slab PL7, while Strategy I will be used for all the others. Finally, a stiffer behaviour was observed in the load–rotation curves for slabs type LC, even with Strategy I.

4.2. Strains in Flexural and Shear Reinforcement

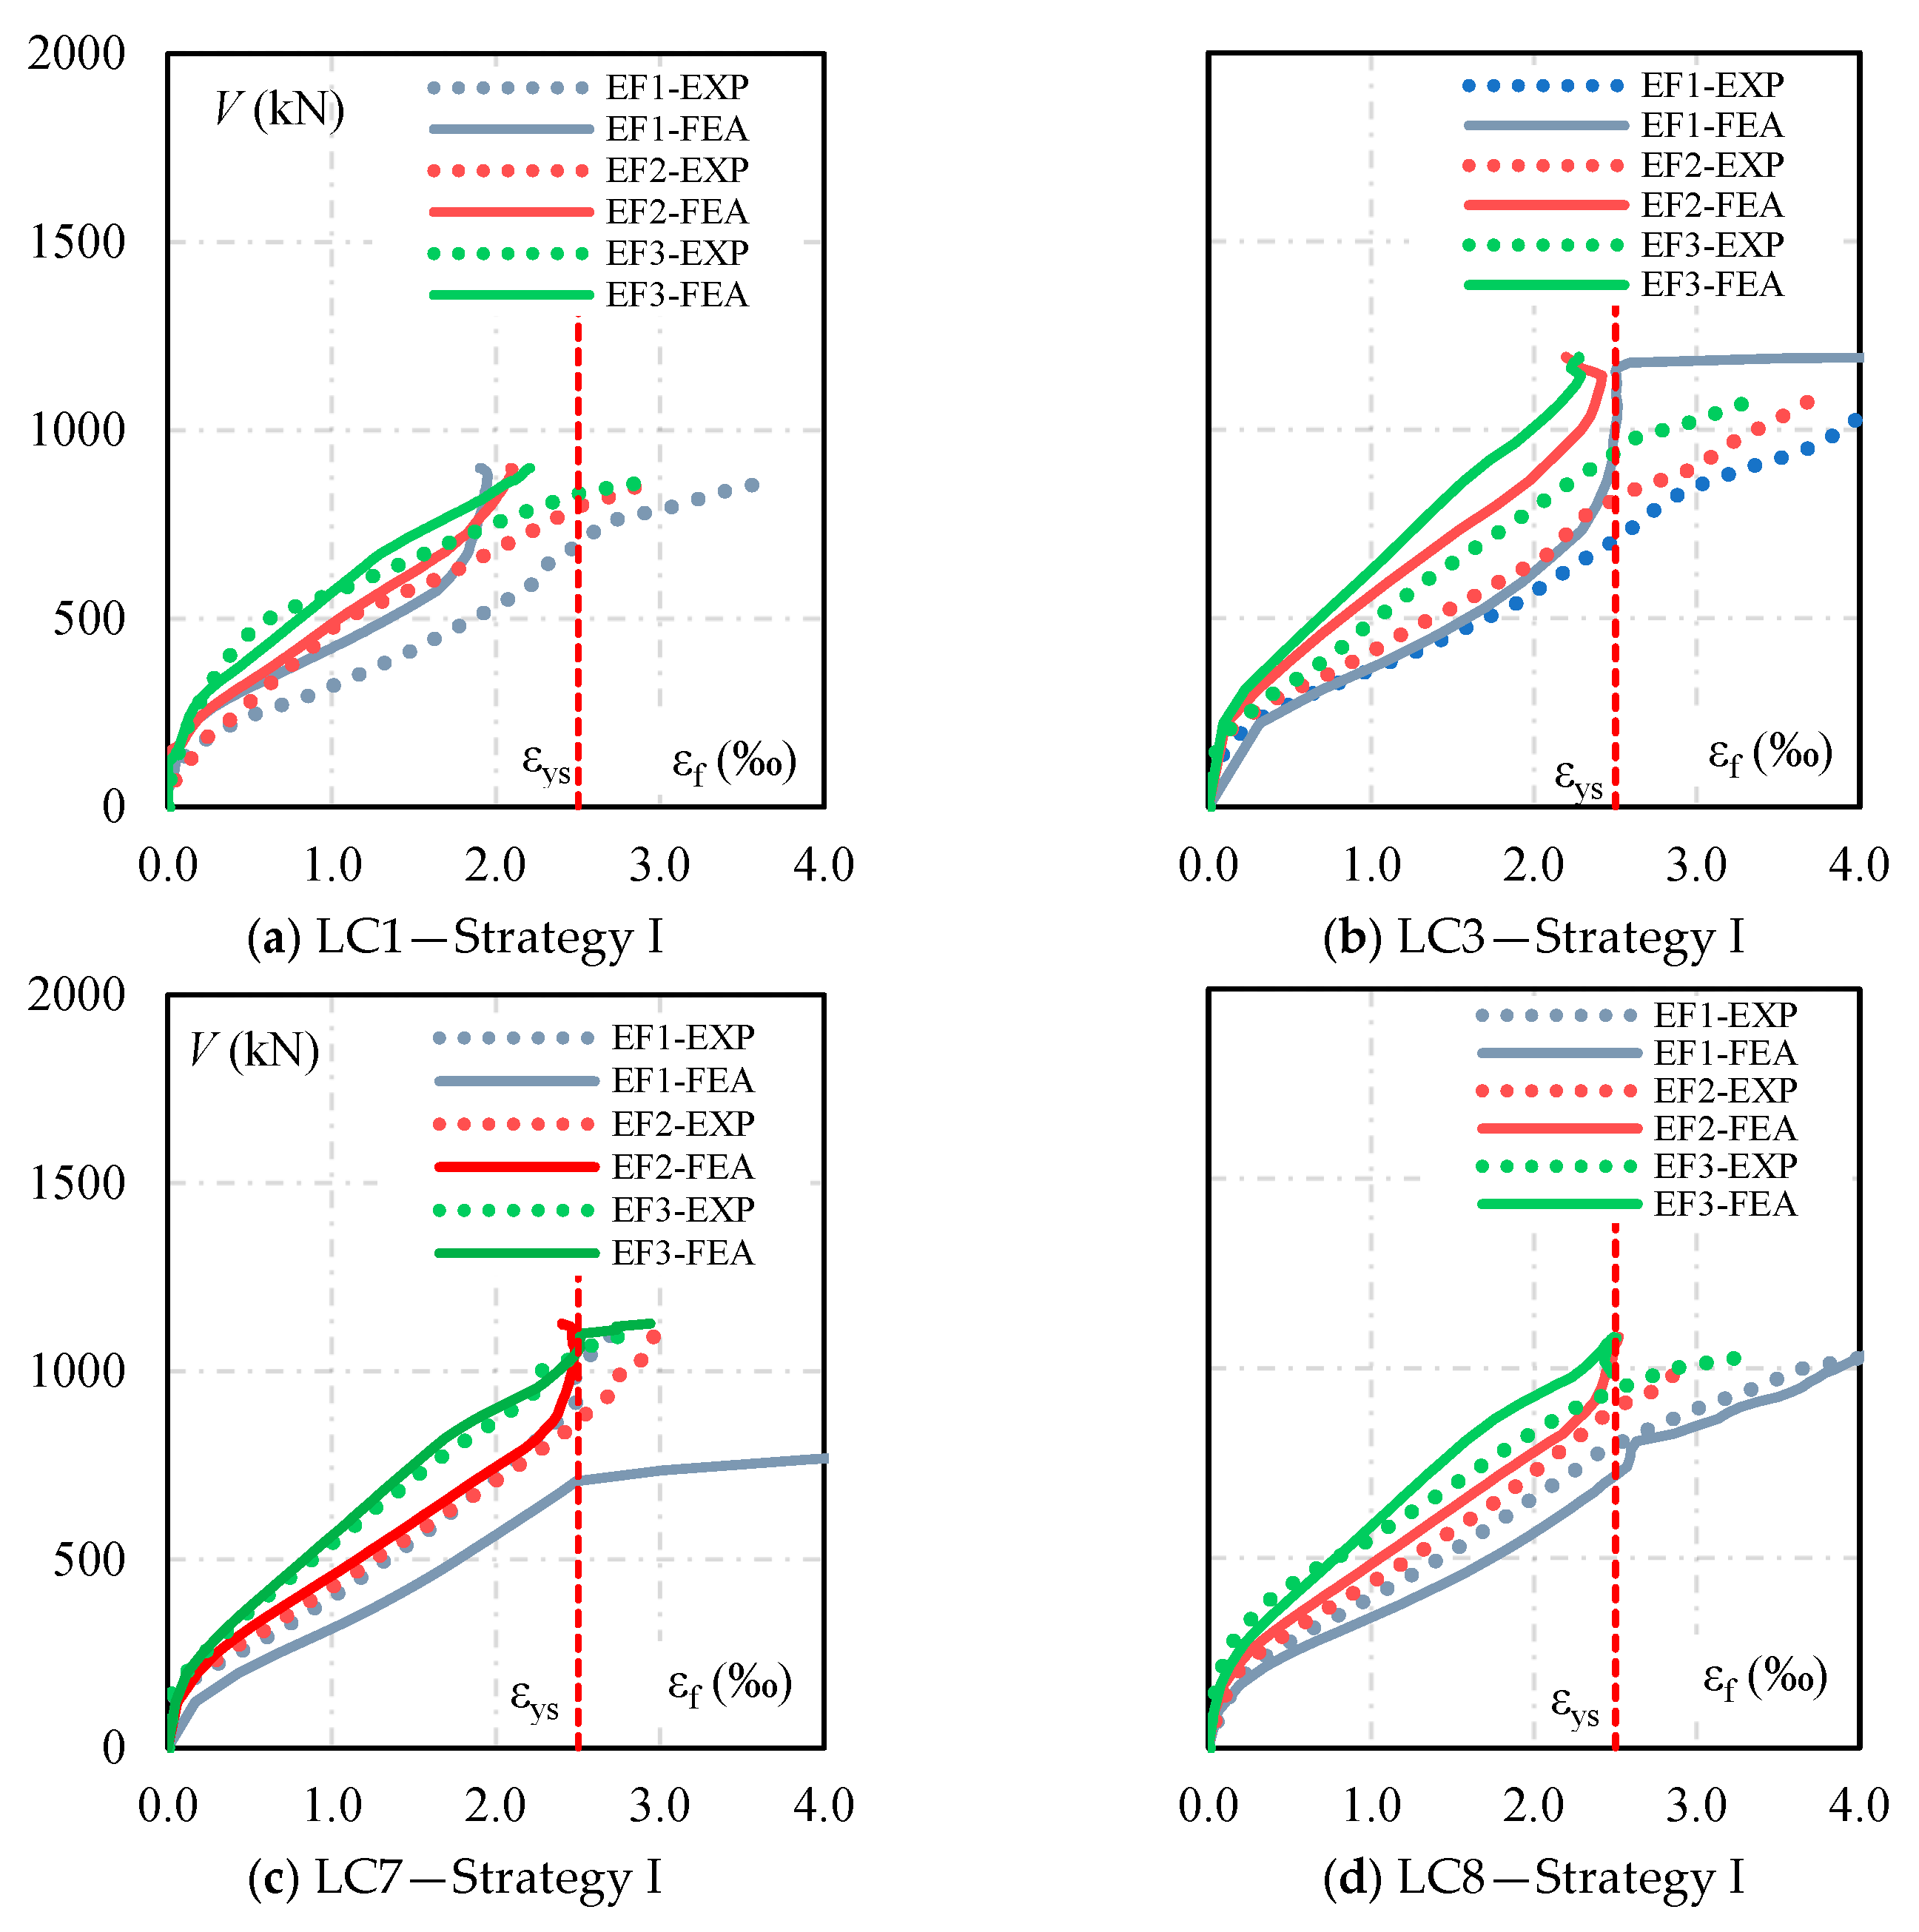
Figure 16 compares the strains in the flexural rebars at the column vicinity in the slabs tested by [2]. Figure 17 and Figure 18 compare the strains in the shear reinforcement for slabs tested by [2,9], respectively. The strain data plotted in the graphs correspond to the mean values of the strains measured in a shear reinforcement perimeter. In the slabs tested by [9], the strains were measured close to the forged heads. No strain data are available for slab PL11.
Using truss elements with the hypothesis of a perfect bond between the flexural reinforcement and concrete provided good correlations with the experimental data. In contrast, discrepancies between experimental and numerical strains in the shear reinforcement can be observed, particularly for LC slabs. Results from LC01, presented in Figure 16a, can illustrate the scenario for this series of slabs. Although the experimental response clearly shows the activation and contribution of the shear reinforcement, the strains measured in the computational model are significantly smaller. This is probably the result of simplifying the perfect bond adopted in the numerical models, which do not allow relative displacements between the studs and the surrounding concrete. In addition, using a higher SF on model PL7 did not improve the activation of the shear reinforcement. This result indicates that the concrete contribution could be overestimated in the numerical model. Based on these findings, more studies are suggested regarding the shear behaviour of cracked concrete and the implementation of bond–slip in the stud connectors.
Concrete compressive strength can also help to understand the worse correlation of the strains on the shear reinforcement observed in the slabs tested by [2] compared to the results of the slabs tested by [9]. In slabs LC03, LC07, and LC08, the shear reinforcement is activated in the computational models close to the peak loading stages, indicating that the concrete contribution was possibly overestimated, and in these slabs, fcm is close to 50 MPa, while in slabs tested by [9], it is around 35 MPa.

4.3. Failure Surface

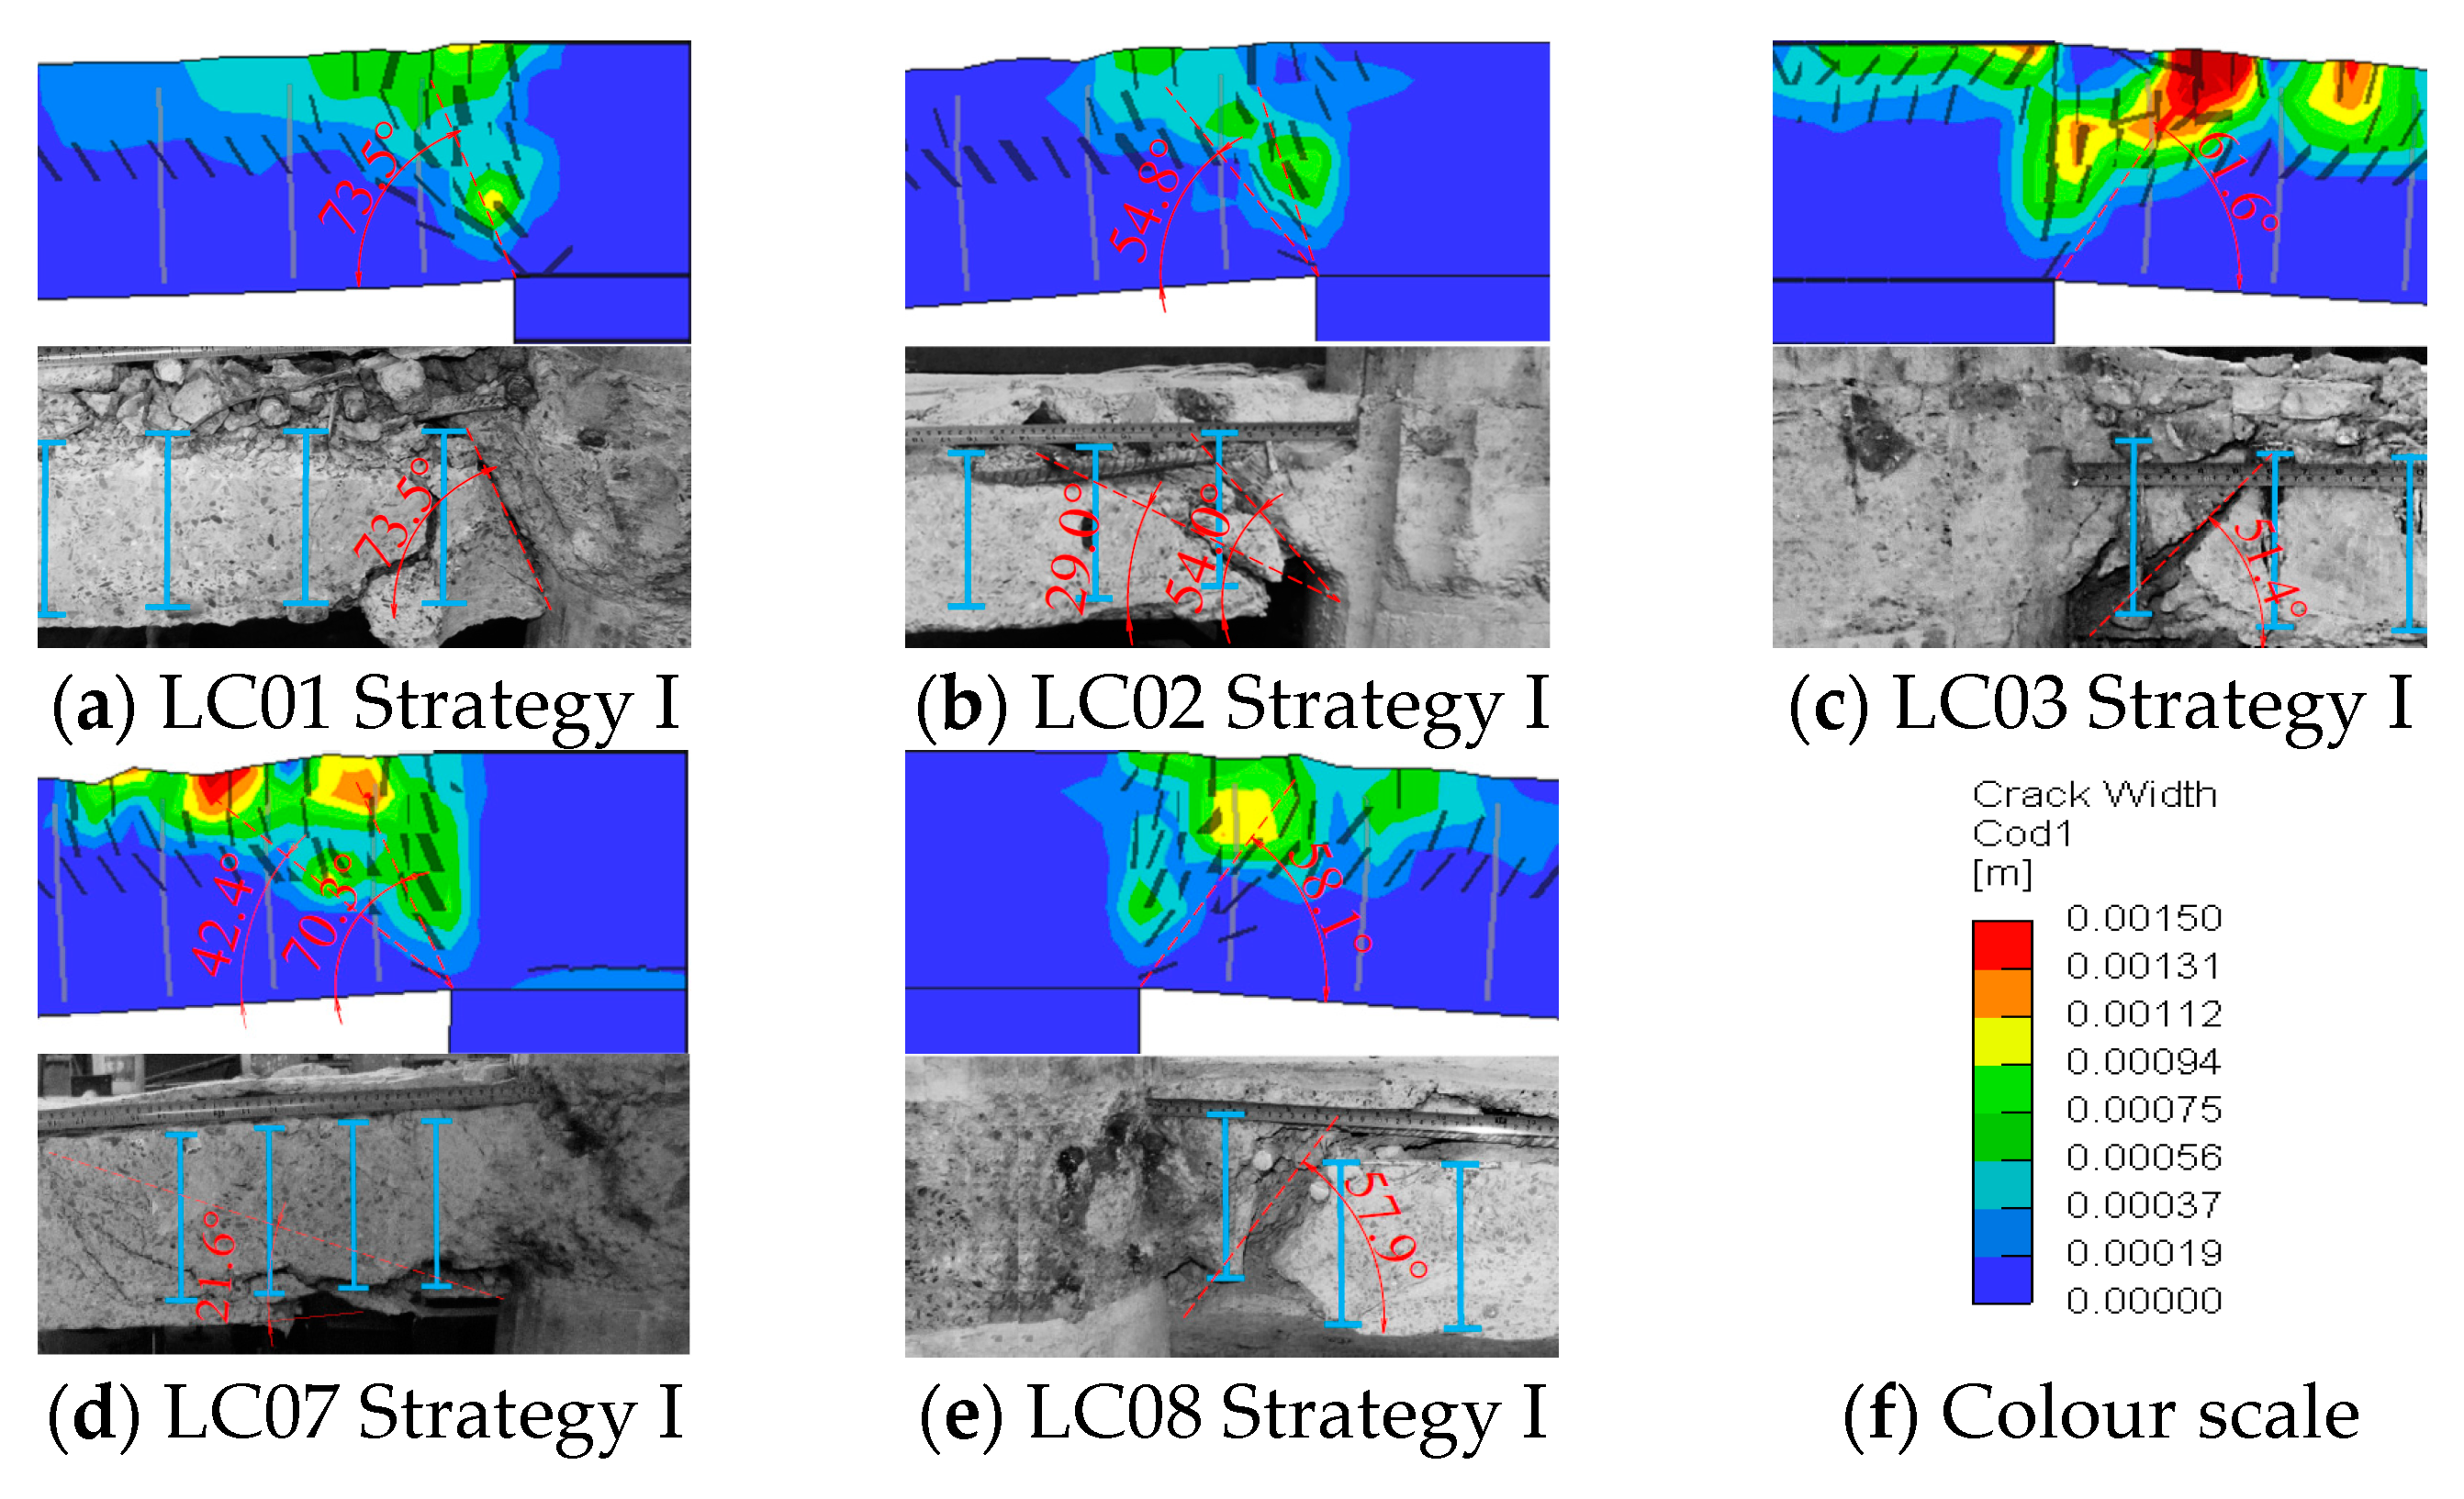
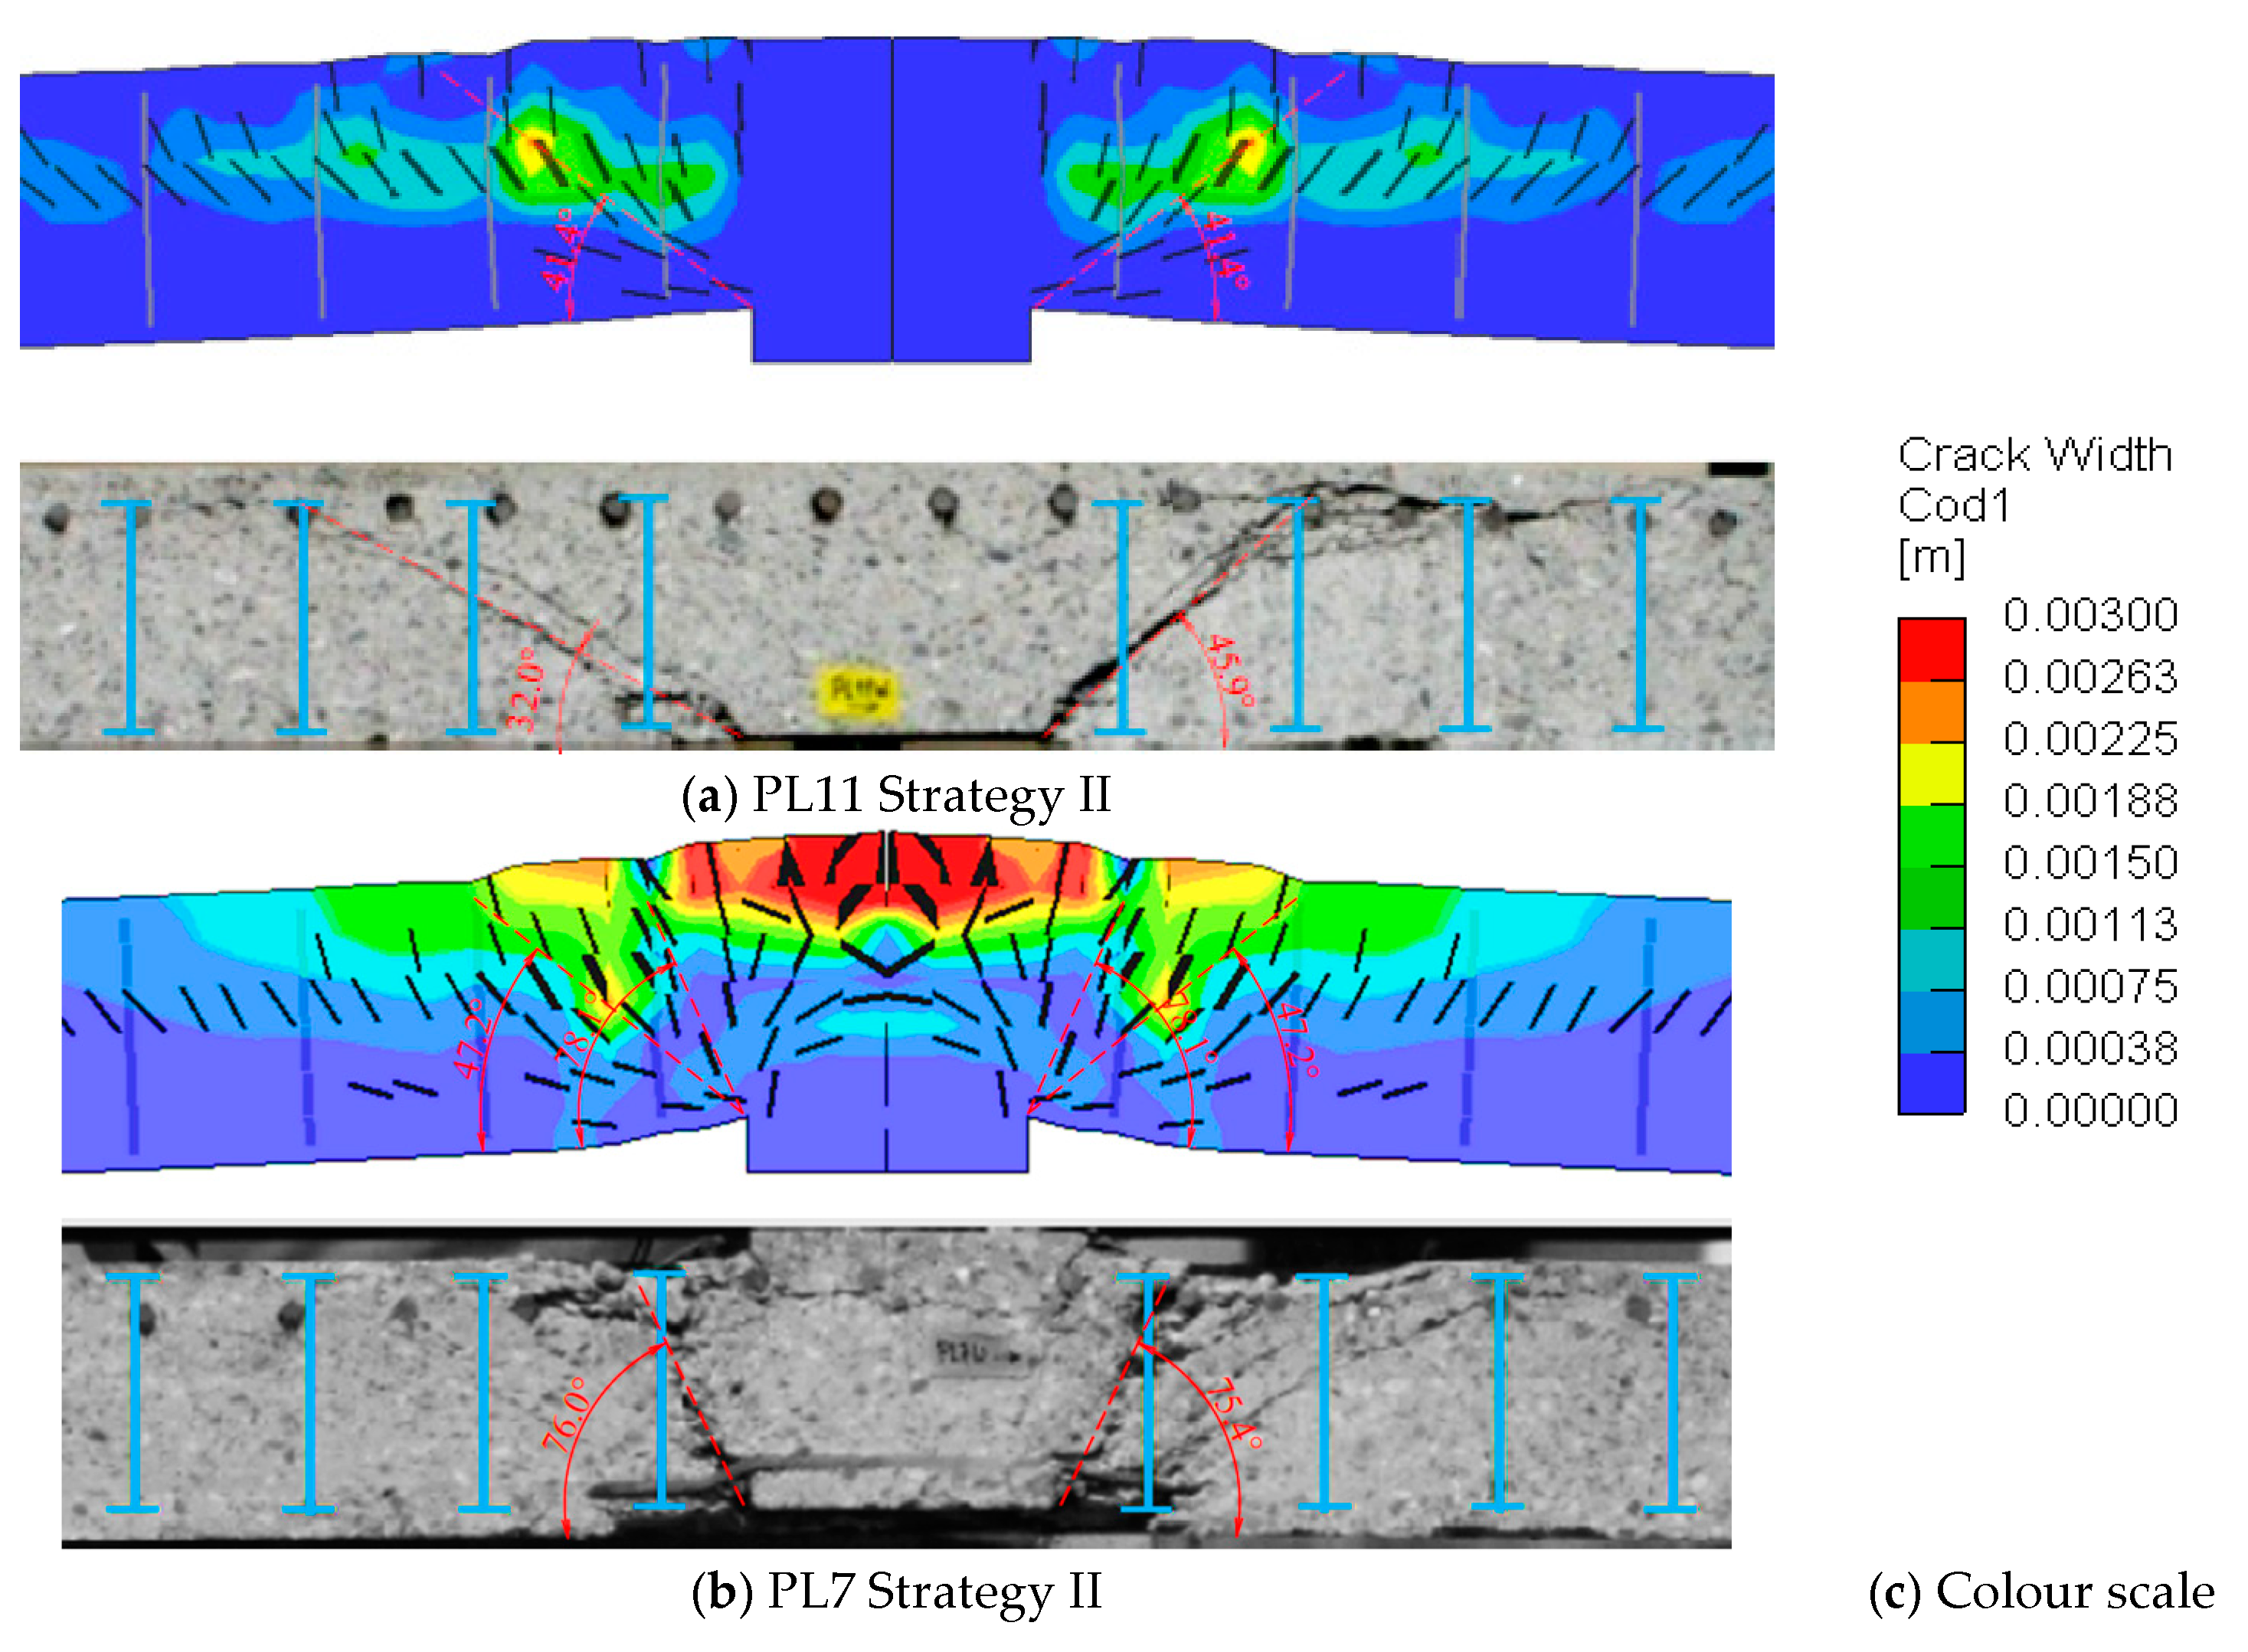
All the selected slabs were saw-cut after tests, allowing for the assessment of the punching shear failure surfaces. Figure 19 and Figure 20 compare the failure surfaces measured on tests with the theoretical results of the numerical models. For better visualisation of cracks on the numerical models, cracks with widths smaller than 0.2 are suppressed. Inclined cracks, typical of shear and punching shear failures, were observed in all the computational simulations. Furthermore, in slabs tested by [2], supported on column stubs, cracks were concentrated in the vicinity of the column, while for those tested by [9], cracks were shifted to the centre of the slab, which is consistent with the crack propagation described by [43].
In general, a good correlation between numerical and experimental results was observed in terms of the inclination of the failure surface. In the numerical models, the inclination of the failure surface was estimated based on the colour contours and the crack representation. In some tests, it is noteworthy that asymmetric failure planes are observed. As for slab PL11, in the computational models, this observation is not possible due to the option of modelling only a quarter of the slabs. In addition, it is difficult for some slabs to identify the critical shear crack both in the numerical and experimental models. In the numerical model of slab PL7, two main shear cracks with different inclinations are observed. The stepper crack is like the main failure crack observed in the experimental test, but two relevant shear cracks are observed in the experimental model on each side of the slab. It is also observed that increments in the shear reinforcement ratio resulted in steeper failure surfaces in both the experimental and numerical models, as evidenced by tests on PL slabs.

4.4. Comparison with Fib Model Code 2020

The numerical and experimental responses, as well as the punching resistance of the selected slabs, are evaluated in comparison with the strength estimates obtained using the formulation presented by [19], which is based on the critical shear crack theory and assumes that the punching resistance is a function of the slab rotation (ψ). The punching shear strength of slabs with shear reinforcement can be calculated according to [19] within four different levels of approximations (LoA), as initially introduced in the fib Model Code 2010. This is a structured methodology in which progressively higher levels of complexity refine the mechanical parameters involved, leading to more accurate punching strength estimates. In the case of slab–column connections, ψ can be calculated within increasing levels of complexity, and in LoA IV, ψ can be obtained from NLFEA accounting for cracking, tension-stiffening, yielding of the reinforcement, and other nonlinear effects.
The advantage of this approach lies in its flexibility, as it allows for both preliminary strength estimates through simplified equations and more advanced evaluations using NLFEA. In this context, the comparison between NLFEA results and the strength estimates obtained through different LoA formulations highlights the advantages and limitations of numerical modelling relative to existing design code methodologies. Specifically, it critically assesses how increasing the complexity of LoA formulations affects the accuracy of punching strength predictions for slabs with different amounts of double-headed studs, examining the role of NLFEA as a complementary tool in structural analysis and design.
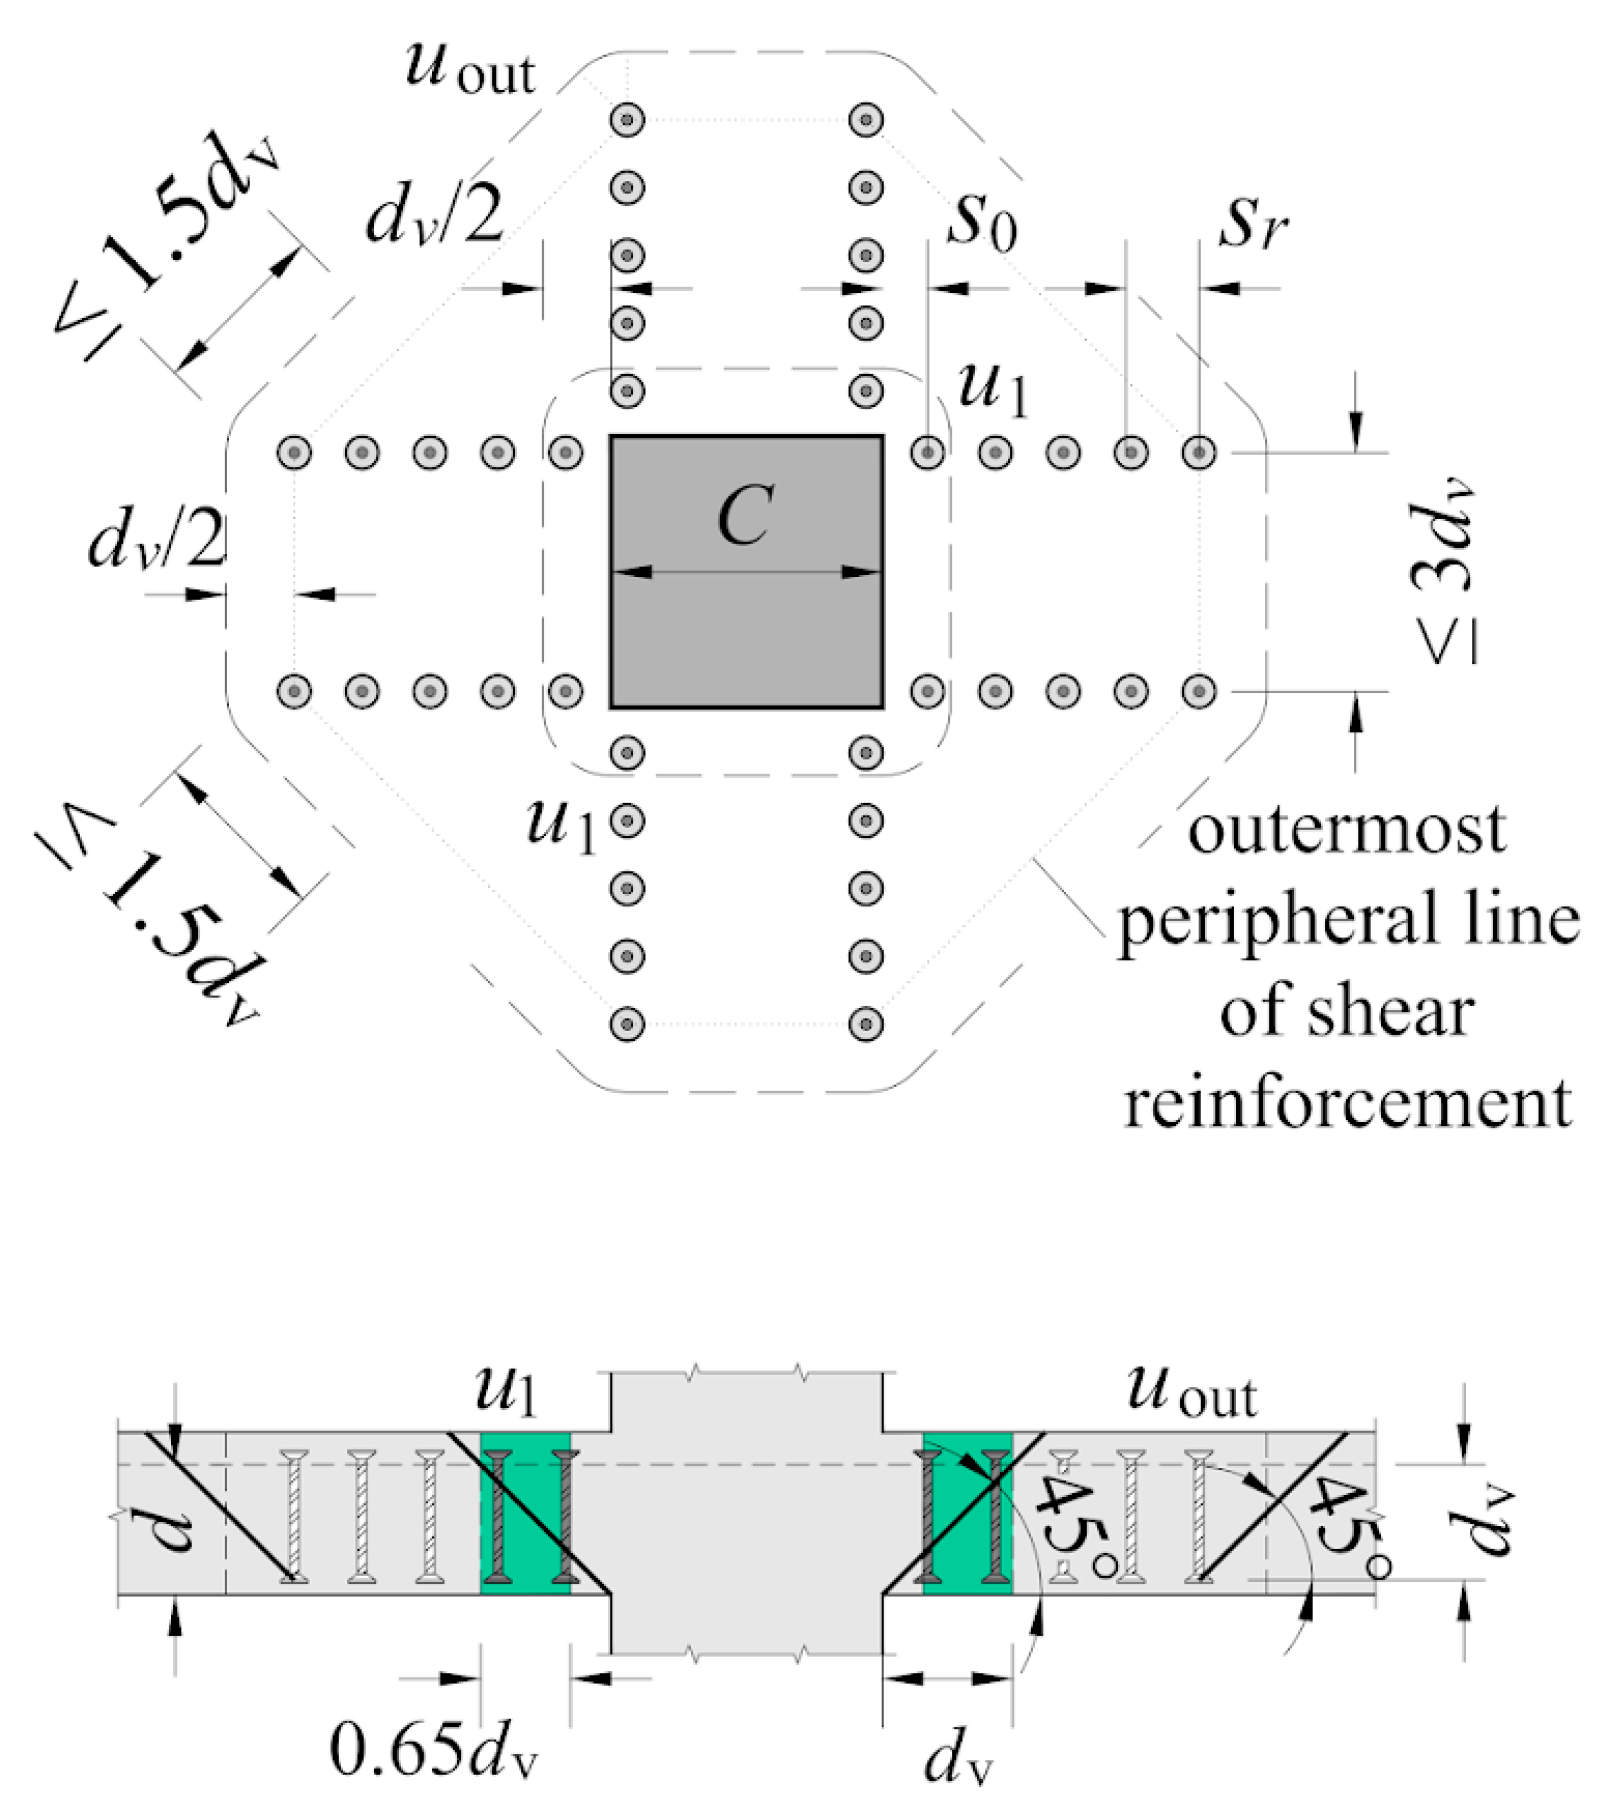
In [19], it is assumed that in the case of slabs with shear reinforcement under symmetric loading, the punching resistance (VMC10) is the least between the resistance estimates for failures within (VR,cs and Vmax) and outside (Vout) the shear reinforced zone, as expressed by Equation (3). As the reported punching shear failures occurred within the shear-reinforced zone in the selected tests, the carried calculations considered only VR,cs and Vmax. Figure 21 summarises the control perimeters and punching shear reinforcement detailing rules presented by [19].
V R = min V R c s = V R c + V R s V o u t = k ψ f c u o u t , e f d v V max = k s y s k ψ u 1 d v f c u 1 d v
where:
  • VRcs is the punching resistance within the shear-reinforced zone;
  • V R c = k ψ f c u 1 d v is the punching resistance of a slab without shear reinforcement;
  • V R s = A s w σ s w is the resistance provided by the punching shear reinforcement;
  • Vout is the punching resistance outside the shear-reinforced zone;
  • Vmax is the maximum punching resistance of a slab–column connection.
  • σ s w = E s ψ 6 1 + f b f y w d ϕ w f y w is the stress in the shear reinforcement.
  • ksys is assumed as 2.8 for studs with heads larger or equal to three times the bar diameter.
  • k ψ = 1 1.5 + 0.9 k d g ψ d 0.6
  • k d g = 32 16 + d g 0.75
  • fb is the bond strength, assumed as 3 MPa for corrugated studs.
The rotation of the slab can be obtained considering four levels of approximation (LoA). The first level is intended to be the most simple and conservative approach, and for the fourth level, the higher effort applied is expected to result in a more accurate and economical solution. Equations (4) and (5) were used to calculate the rotation of the slabs for LoA II and LoA III, respectively. For the sake of simplicity, the same mE value was used in both cases.
For LoA IV, it is assumed by [19] that the rotation can be obtained based on a nonlinear analysis accounting for any relevant effects to accurately assess the structure, as carried out throughout this paper. Figure 22 and Figure 23 and Table 5 present the results in detail.
ψ LoAII = 1.5 r s d f y s E s m E m R 1.5
ψ LoAIII = 1.2 r s d f y s E s m E m R 1.5
where rs is the radius of contra flexure of radial bending moments; mE is the average moment per unit length for calculation of the flexural reinforcement in the support strip (bs) taken as m E = V 8 ; mR is the flexural strength per unit length in the support strip (bs) assumed as m R = ρ f y s d 2 1 ρ f y s 2 f c .
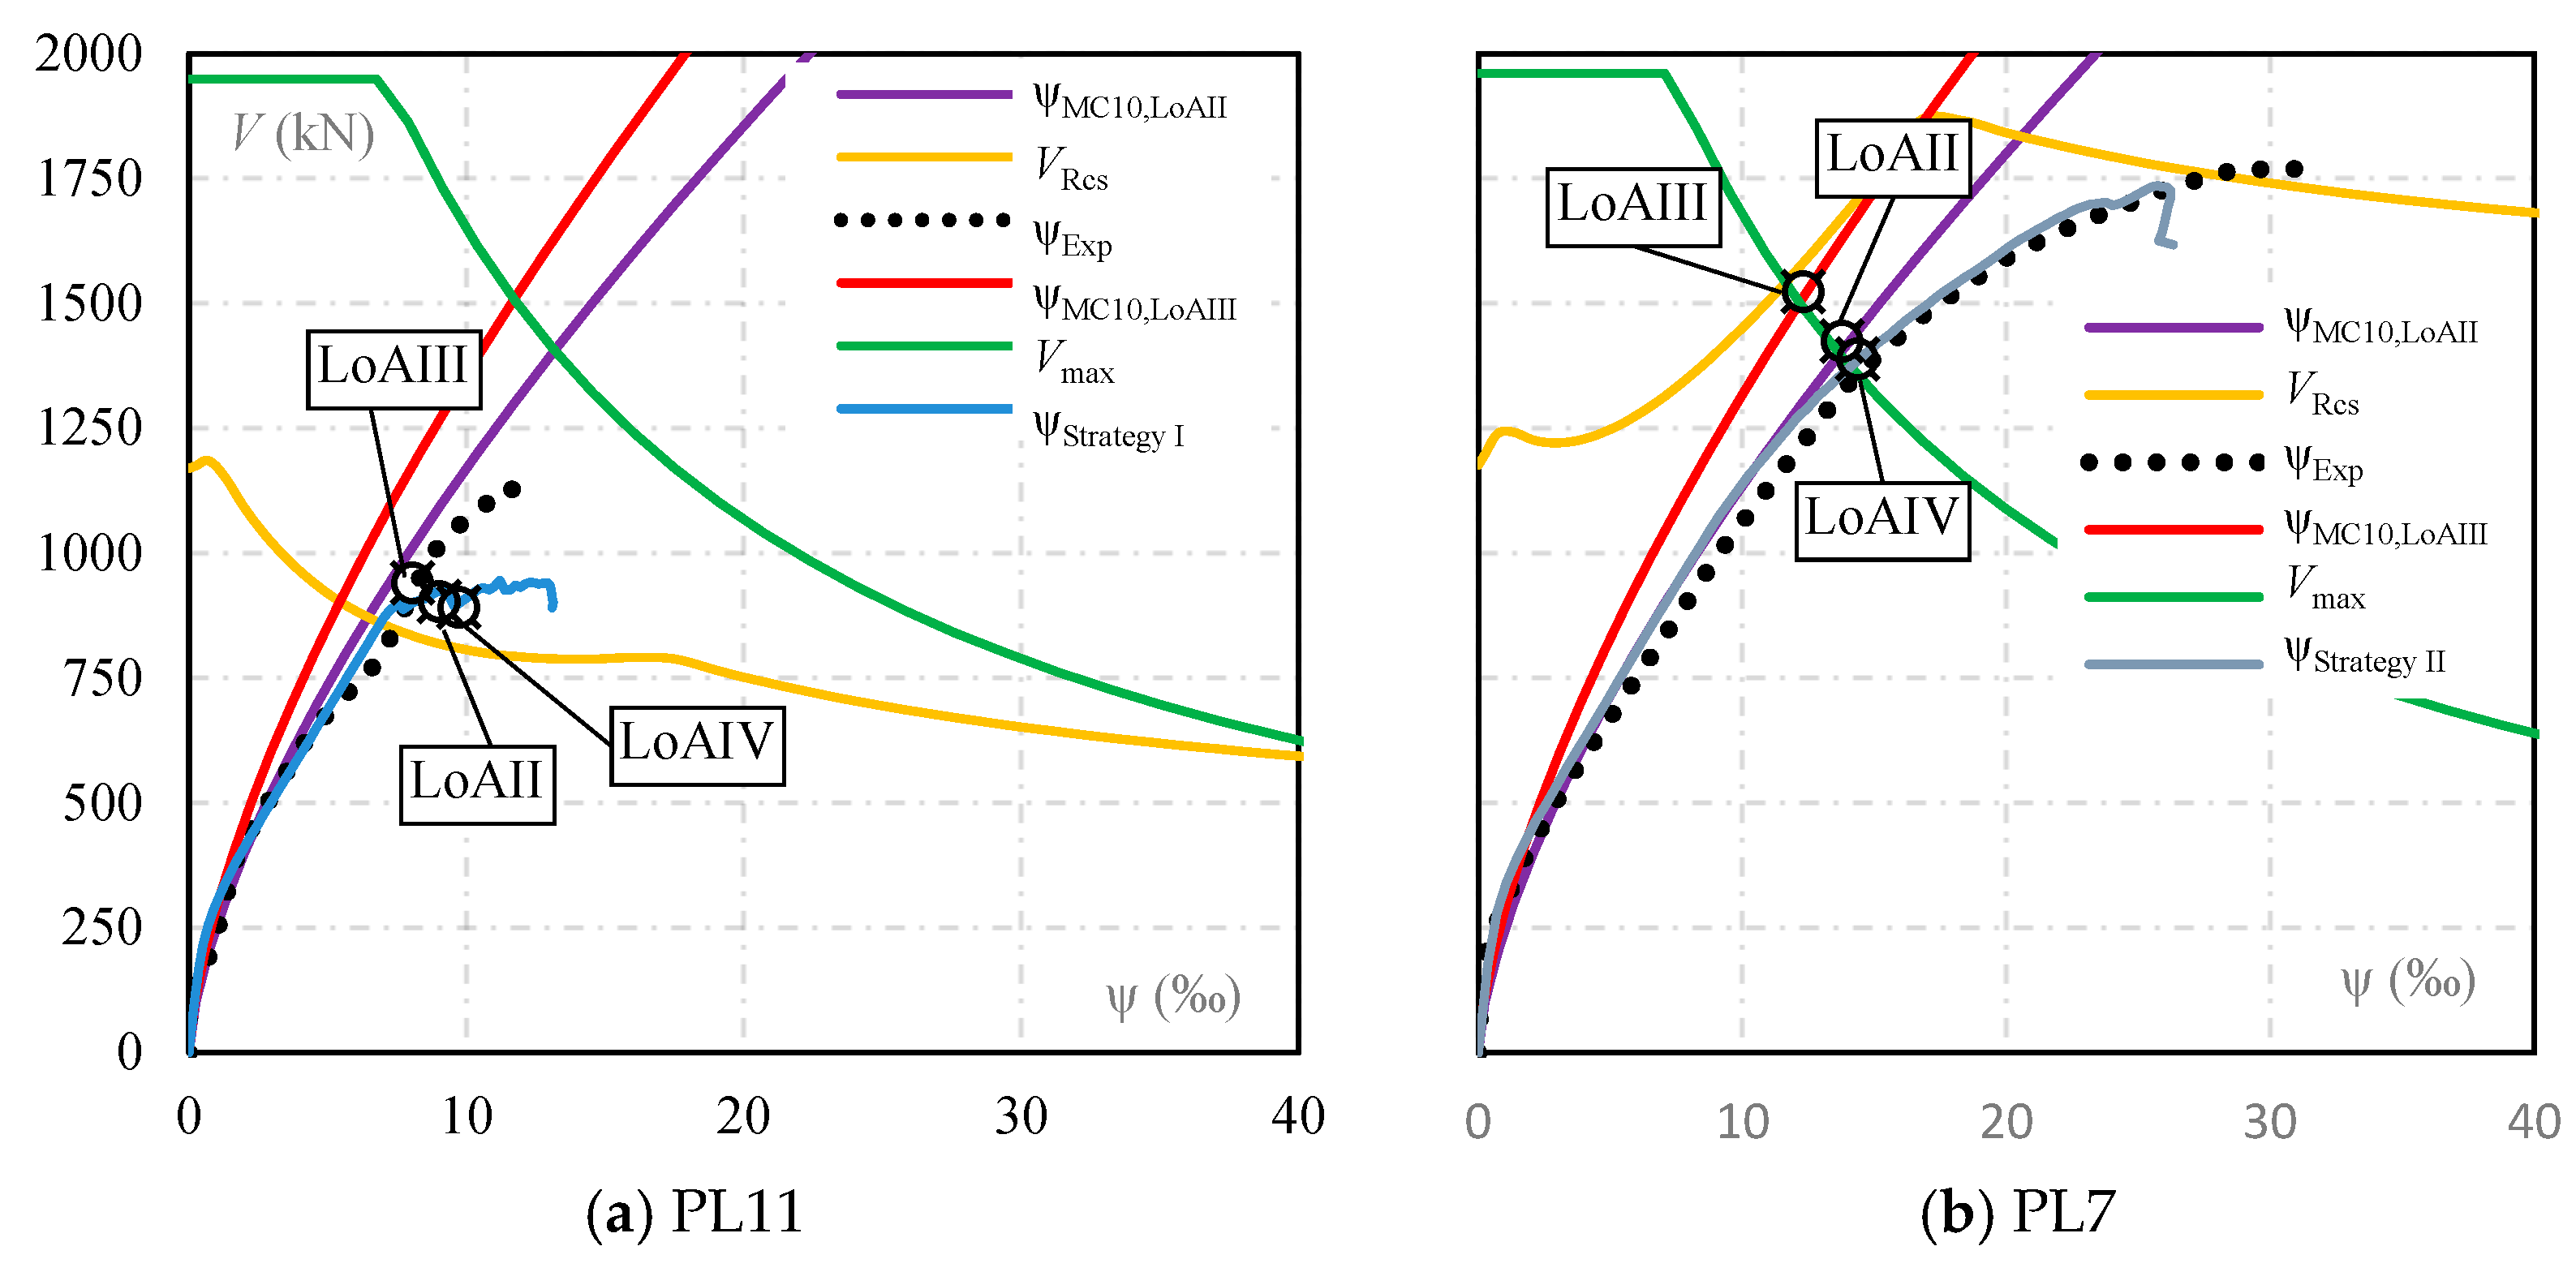
Figure 22 and Figure 23 generally show that the theoretical rotations estimated using equations from LoA II and LoA III fit the experimental results well. In addition, for the case of slabs tested by [9], the rotations from the nonlinear finite element models (LoA IV) virtually covered the experimental results. In terms of the punching shear resistance, the results obtained following [19] were on the safe side, with some conservatism, as shown in Figure 22 and Figure 23, as well as Table 5.
It should be noticed in Figure 22 and Figure 23 that, for slabs tested by [2], increasing the complexity level of the theoretical approach did not lead to more accurate results, as was expected. The strength estimates following the LoA II and LoA III approaches performed better than the resistance estimates obtained using LoA IV. On the other hand, the numerical strengths obtained following the proposed methodologies were more accurate than the fib Model Code 2020 [19], as shown in Table 5.
The more significant resistance discrepancy in Table 5 is for slab PL7. The large amount of shear reinforcement in this slab led to over-conservative strength estimates by fib Model Code 2020 [19], limited by the criteria established in the code for Vmax. The opposite was observed for the numerical model of the referred slab, which could accurately predict the load-carrying capacity measured on tests.

5. Conclusions

This paper investigates strategies for the nonlinear finite element modelling of slab–column connections with varying amounts of double-headed studs used as punching shear reinforcement. Two NLFE modelling strategies were developed to evaluate their accuracy in predicting the behaviour of the slabs, including load–rotation response, crack patterns, and strains in both flexural and shear reinforcement. Additionally, the NLFEA was employed to estimate punching shear strengths and compare these results with experimental data and the fib Model Code 2020 across levels of approximation from II to IV. Based on the obtained results, the following conclusions can be drawn:
  • The flexural and shear reinforcement were modelled using truss elements, assuming a perfect bond between concrete and steel. The NLFE models generally captured flexural response aspects of the slab–column connections, such as load–rotation behaviour, cracking patterns, and flexural reinforcement strains. However, in terms of punching shear, the comparison between numerically predicted strains in the studs and experimental measurements showed poor correlation, indicating limitations in how the NLFE models represent the shear transfer mechanisms.
  • The shear factor (SF) significantly influenced the numerical results, particularly for slabs with high shear reinforcement ratios. Strategy I, in which SF was assumed as 20, provided reasonable estimates for slabs with low-to-moderate reinforcement. In contrast, with SF assumed as 200, Strategy II better captured the behaviour and resistance of slabs with high shear reinforcement ratios, such as PL7. Finally, the computational effort required to solve slabs with Strategy II was mainly governed by the iterative method and mesh size rather than by the chosen SF value. Therefore, adopting SF = 200 did not impose significant practical limitations on structural engineering applications.
  • The modelling of double-headed studs significantly affected numerical results. Simulations that explicitly represented the stud heads led to higher punching resistance estimates than those that ignored them. However, it also altered the slabs’ stiffness, leading to discrepancies in the numerical load–rotation response. These results emphasise the importance of adequately representing the geometry of the studs to enhance accuracy while maintaining realistic structural behaviour. Moreover, these results indicate that the methodologies assessed in this paper are insufficient for detailed investigations into the punching shear failure mechanisms and the activation process of the shear reinforcement.
  • Assuming a perfect bond between the shear reinforcement and concrete led to reasonable punching shear strength estimates. However, it did not accurately capture the development of strains in the shear reinforcement. Softening the perfect bond assumption would introduce an additional modelling complexity, as it would require a constitutive bond–slip model, which would demand additional calibration and computational effort. The perfect bond was adopted to balance accuracy and usability in practical engineering applications. Nevertheless, further studies are recommended to evaluate the impact of bond–slip models on the numerical response and resistance of slabs with different amounts of shear reinforcement.
  • The punching shear strength estimates for the selected slabs obtained using the fib Model Code were conservative compared to the experimental results and with the NLFEA. It was also observed that increasing complexity from LoA II to LoA IV did not consistently improve the accuracy of strength estimates. These results suggest potential limitations in the levels of approximation adopted by the fib Model Code to estimate the punching shear strength of slabs with shear reinforcement. Further investigation is required to determine whether these discrepancies arise from inherent constraints in the theoretical model or uncertainties in the numerical modelling process.
  • The NLFEA methodologies presented in this paper demonstrated a strong correlation with experimental results. They effectively evaluated the punching shear strength and structural response of slabs incorporating varying amounts of double-headed studs as punching shear reinforcement. These findings support the methodologies’ applicability for structural engineering issues, potentially offering more reliable strength estimates than simplified methods outlined in design codes. Future research should focus on bond–slip models to improve strain predictions in shear reinforcement, examine the impact of slab continuity and boundary conditions in practical structural scenarios, and assess the benefits of utilising LoA IV methodology for achieving more consistent strength estimates in the fib Model Code 2020.
This paper provides insights into modelling strategies for the nonlinear finite element analysis of slab–column connections having double-headed studs as punching shear reinforcement. It highlights the strengths and limitations of NLFEA in predicting the response and punching shear resistance, reinforcing the role of advanced numerical methods as complementary tools for structural design. Results suggest that future refinements in NLFEA of slabs with shear reinforcement require further investigations into bond–slip models and strategies for effectively modelling the shear reinforcement so that the numerical models can replicate key aspects of the shear behaviour of flat slabs. Additionally, this paper underscores the need to critically assess the practical applicability of the higher level of approximation proposed by MC20 in engineering practice through comparison with a more extensive experimental database.

Author Contributions

F.P.M.: Conceptualisation, Formal analysis, Investigation, Methodology, Validation, Writing—original draft, Writing—review and editing. M.P.F.: Supervision, Conceptualisation, Methodology, Writing—review and editing. R.A.S.D.: Formal analysis, Methodology, Writing—review and editing. E.A.P.L.: Writing—review and editing. L.M.T. Writing—review and editing. J.P.B.S.: Writing—review and editing. All authors have read and agreed to the published version of the manuscript.

Funding

This research received no external funding.

Data Availability Statement

Data available on request from the authors.

Acknowledgments

The authors are grateful for the support from CAPES, CNPq, FAPESP and FAPESPA, Brazilian Research Development Agencies.

Conflicts of Interest

The authors declare no conflicts of interest.

Notation

dEffective depth of the slab.
dvShear resisting effective depth of the slab.
dgMaximum size of aggregate.
fcCompressive strength of concrete.
fcmMean compressive strength of concrete.
fctmMean tensile strength of concrete.
fct,infLower bound value of the tensile strength of concrete.
ftTensile strength of concrete.
fyYield strength of the flexural reinforcement.
fywYield strength of the shear reinforcement.
GfConcrete fracture energy.
s0Distance from column face to first layer of shear reinforcement.
srRadial spacing of shear reinforcement.
stTangential spacing of shear reinforcement.
st,maxMaximum value of st (generally in outer perimeter of shear reinforcement).
u1Length of control perimeter for calculation of VRc and VRcs.
uoutLength of control perimeter for calculation of Vout.
uout,efEffective value of uout respecting the limits of st,max. limited by fib Model Code 2010 as st,max ≤ 1.5∙dv.
AswSum of the cross-sectional area of all shear reinforcement within the zone bounded by 0.35∙dv and dv from the edge of the supported area (see Figure 20).
Asw/perim.Area of shear reinforcement per perimeter.
CDiameter of a circular column, case of slabs type LC, or the side length of a square column, for all the other slabs.
EsModulus of elasticity of flexural reinforcement, presented in Table 3.
ρflexFlexural reinforcement ratio.
ØwDiameter of the shear reinforcement.
ψRotation of the slab.
EcConcrete modulus of elasticity.
ν Poisson ratio.
EsSteel modulus of elasticity.
VLoad carrying capacity of the model.
VflexExpected flexural load capacity.
VexpExperimental observed load capacity.
VexpComputational observed load capacity.
εys Limit deformation for steel rebars.

References

  1. Birkle, G.; Dilger, W.H. Influence of slab thickness on punching shear strength. ACI Struct. J. 2008, 105, 180–188. [Google Scholar] [CrossRef]
  2. Ferreira, M.P.; Melo, G.S.; Regan, P.E.; Vollum, R.L. Punching of reinforced concrete flat slabs with double-headed shear reinforcement. ACI Struct. J. 2014, 111, 363–374. [Google Scholar] [CrossRef]
  3. Einpaul, J.; Brantschen, F.; Fernández Ruiz, M.; Muttoni, A. Performance of punching shear reinforcement under gravity loading: Influence of type and detailing. ACI Struct. J. 2016, 113, 827–838. [Google Scholar] [CrossRef]
  4. Hegger, J.; Sherif, A.G.; Kueres, D.; Siburg, C. Efficiency of various punching shear reinforcement systems for flat slabs. ACI Struct. J. 2017, 114, 631–642. [Google Scholar] [CrossRef]
  5. Kueres, D.; Schmidt, P.; Hegger, J. Two-parameter kinematic theory for punching shear in reinforced concrete slabs with shear reinforcement. Eng. Struct. 2019, 181, 216–232. [Google Scholar] [CrossRef]
  6. Regan, P.E.; Samadian, F. Shear reinforcement against punching in reinforced concrete flat slabs. Struct. Eng. 2001, 79, 24–31. [Google Scholar]
  7. Eligehausen, R.; Cook, R.A.; Appl, J. Behavior and Design of Adhesive Bonded Anchors. ACI Struct. J. 2006, 103, 822–831. [Google Scholar]
  8. Park, H.-g.; Ahn, K.-s.; Choi, K.-k.; Chung, L. Lattice Shear Reinforcement for Slab-Column Connections. ACI Struct. J. 2007, 104, 294–303. [Google Scholar] [CrossRef]
  9. Lips, S.; Fernández Ruiz, M.; Muttoni, A. Experimental investigation on punching strength and deformation capacity of shear-reinforced slabs. ACI Struct. J. 2012, 109, 889–900. [Google Scholar] [CrossRef]
  10. Furche, J.; Schmidt, P. Orthogonal arrangement of effective lattice punching shear reinforcement. In Proceedings of the fib Symposium—CONCRETE Innovations in Materials, Design and Sructures, Krakow, Poland, 27–29 May 2019. [Google Scholar]
  11. Ferreira, M.; Filho, M.P.; Lima, N.; Oliveira, M. Influence of the flexural and shear reinforcement in the concrete cone resistance of headed bars. Eng. Struct. 2021, 248, 113212. [Google Scholar] [CrossRef]
  12. Trautwein, L.M.; Bittencourt, T.N.; Gomes, R.B.; Bella, J.C.D. Punching Strength of Flat Slabs with Unbraced Shear Reinforcement. ACI Struct. J. 2011, 108, 197–205. [Google Scholar] [CrossRef]
  13. Schmidt, P.; Ungermann, J.; Hegger, J. Contribution of concrete and shear reinforcement to the punching shear resistance of column bases. Eng. Struct. 2021, 245, 112901. [Google Scholar] [CrossRef]
  14. Ferreira, M.d.P.; Oliveira, M.H.; Melo, G.S.S.A. Tests on the punching resistance of flat slabs with unbalanced moments. Eng. Struct. 2019, 196, 109311. [Google Scholar] [CrossRef]
  15. Ghali, A.; Youakim, S.A. Headed studs in concrete: State of the art. ACI Struct. J. 2005, 102, 657–667. [Google Scholar] [CrossRef]
  16. ABNT NBR 6118; Design of Concrete Structures—Procedures. Brazilian Association of Technical Standards: Rio de Janeiro, Brazil, 2014.
  17. Comité Euro-International du Béton. CEB-FIP Model Code 1990; Thomas Telford: London, UK, 1993. [Google Scholar]
  18. Pereira Filho, M.J.M.; Freitas, M.V.P.D.; Santos, D.F.A.D.; Nascimento, A.; Ferreira, M. Slabs strengthened for punching shear with post-installed steel and CFRP connectors. IBRACON Struct. Mat. J. 2019, 12, 445–478. [Google Scholar] [CrossRef]
  19. Fédération Internationale du Béton. fib Model Code for Concrete Structures 2020; Fédération Internationale du Béton: Lausanne, Switzerland, 2023. [Google Scholar]
  20. Muttoni, A. Punching shear strength of reinforced concrete slabs without transverse reinforcement. ACI Struct. J. 2008, 105, 440–450. [Google Scholar] [CrossRef]
  21. Fernández Ruiz, M.; Muttoni, A. Applications of the critical shear crack theory to punching of R/C slabs with transverse reinforcement. ACI Struct. J. 2009, 106, 485–494. [Google Scholar] [CrossRef]
  22. Marí, A.; Cladera, A.; Oller, E.; Bairán, J.M. A punching shear mechanical model for reinforced concrete flat slabs with and without shear reinforcement. Eng. Struct. 2018, 166, 413–426. [Google Scholar] [CrossRef]
  23. Wang, Y.; Gu, Y.; Liu, J. A domain-decomposition generalised finite difference method for stress analysis in three-dimensional composite materials. Appl. Math. Lett. 2020, 104, 106226. [Google Scholar] [CrossRef]
  24. Kabir, H.; Aghdam, M.M. A robust Bézier based solution for nonlinear vibration and post-buckling of random checkerboard graphene nanoplatelets reinforced composite beams. Compos. Struct. 2019, 212, 184–198. [Google Scholar] [CrossRef]
  25. Silva Mamede, N.F.; Pinho Ramos, A.; Faria, D.M.V. Experimental and parametric 3D nonlinear finite element analysis on punching of flat slabs with orthogonal reinforcement. Eng. Struct. 2013, 48, 442–457. [Google Scholar] [CrossRef]
  26. Navarro, M.; Ivorra, S.; Varona, F.B. Parametric computational analysis for punching shear in RC slabs. Eng. Struct. 2018, 165, 254–263. [Google Scholar] [CrossRef]
  27. Navarro, M.; Ivorra, S.; Varona, F.B. Parametric finite element analysis of punching shear behaviour of RC slabs reinforced with bolts. Comput. Struct. 2020, 228, 106147. [Google Scholar] [CrossRef]
  28. Beutel, R. Durchstanzen Schubbewehrter Flachdecken im Bereich von Innenstützen. Ph.D. Thesis, RWTH Aachen, Aachen, Germany, 2003. [Google Scholar]
  29. Genikomsou, A.S.; Polak, M.A. Finite-element analysis of reinforced concrete slabs with punching shear reinforcement. J. Struct. Eng. 2016, 142, 04016129. [Google Scholar] [CrossRef]
  30. Setiawan, A.; Vollum, R.L.; Macorini, L.; Izzuddin, B.A. Numerical modelling of punching shear failure of reinforced concrete flat slabs with shear reinforcement. Mag. Concr. Res. 2021, 73, 1205–1224. [Google Scholar] [CrossRef]
  31. Marques, M.G.; Liberati, E.A.; Pimentel, M.J.; de Souza, R.A.; Trautwein, L.M. Nonlinear finite element analysis (NLFEA) of reinforced concrete flat slabs with holes. Structures 2020, 27, 1–11. [Google Scholar] [CrossRef]
  32. Mendes, R.P.; Mesquita, L.C.; Ferreira, M.P.; Trautwein, L.M.; Marvila, M.T.; Marques, M.G. Numerical Evaluation of the Punching Shear Strength of Flat Slabs Subjected to Balanced and Unbalanced Moments. Buildings 2024, 14, 985. [Google Scholar] [CrossRef]
  33. Kueres, D.; Schmidt, P.; Hegger, J. Punching shear behavior of reinforced concrete flat slabs with a varying amount of shear reinforcement. Struct. Concr. 2019, 21, 235–246. [Google Scholar] [CrossRef]
  34. Červenka, V.; Jendele, L.; Červenka, J. ATENA Program Documentation Part 1 Theory; Červenka Consulting s.r.o.: Prague, Czech Republic, 2016; p. 282. [Google Scholar]
  35. Červenka, J.; Papanikolaou, V.K. Three-dimensional combined fracture–plastic material model for concrete. Int. J. Plast. 2008, 24, 2192–2220. [Google Scholar] [CrossRef]
  36. Belletti, B.; Damoni, C.; Hendriks, M.A.N.; de Boer, A. Analytical and numerical evaluation of the design shear resistance of reinforced concrete slabs. Struct. Concr. 2014, 15, 317–330. [Google Scholar] [CrossRef]
  37. Shu, J.; Plos, M.; Zandi, K.; Johansson, M.; Nilenius, F. Prediction of punching behaviour of RC slabs using continuum nonlinear FE analysis. Eng. Struct. 2016, 125, 15–25. [Google Scholar] [CrossRef]
  38. Fédération Internationale du Béton. Fib Model Code for Concrete Structures 2010; Fédération Internationale du Béton: Lausanne, Switzerland, 2013. [Google Scholar]
  39. Sanabria Diaz, R.A.; de Oliveira, L.H.B.; Trautwein, L.M.; de Almeida, L.C.; dos Santos, A.C. Aspects of finite element modeling of punching shear behavior of reinforced concrete flat slabs. Lat. Am. J. Solids Struct. 2018, 15, e120. [Google Scholar] [CrossRef]
  40. Hendriks, M.A.N.; Roosen, M. Guidelines for Non-Linear Finite Element Analysis of Concrete Structures; Rijkswaterstaat Technical Document (RTD), Report RTD:1016-1:2022; Rijkswaterstaat: Utrecht, The Netherlands, 2022. [Google Scholar]
  41. Cervenka, V.; Cervenka, J.; Pukl, R.; Sajdlova, T. Prediction of shear failure of large beams based on fracture mechanics. In Proceedings of the International Conference on Fracture Mechanics of Concrete and Concrete Structures, Berkeley, CA, USA, 28 May–1 June 2016. [Google Scholar]
  42. Cervenka, V.; Cervenka, J.; Rymes, J. Numerical simulation of concrete structures—From research to engineering application. Struct. Concr. 2024, 25, 751–772. [Google Scholar] [CrossRef]
  43. Simões, J.T.; Fernández Ruiz, M.; Muttoni, A. Validation of the Critical Shear Crack Theory for punching of slabs without transverse reinforcement by means of a refined mechanical model. Struct. Concr. 2018, 19, 191–216. [Google Scholar] [CrossRef]
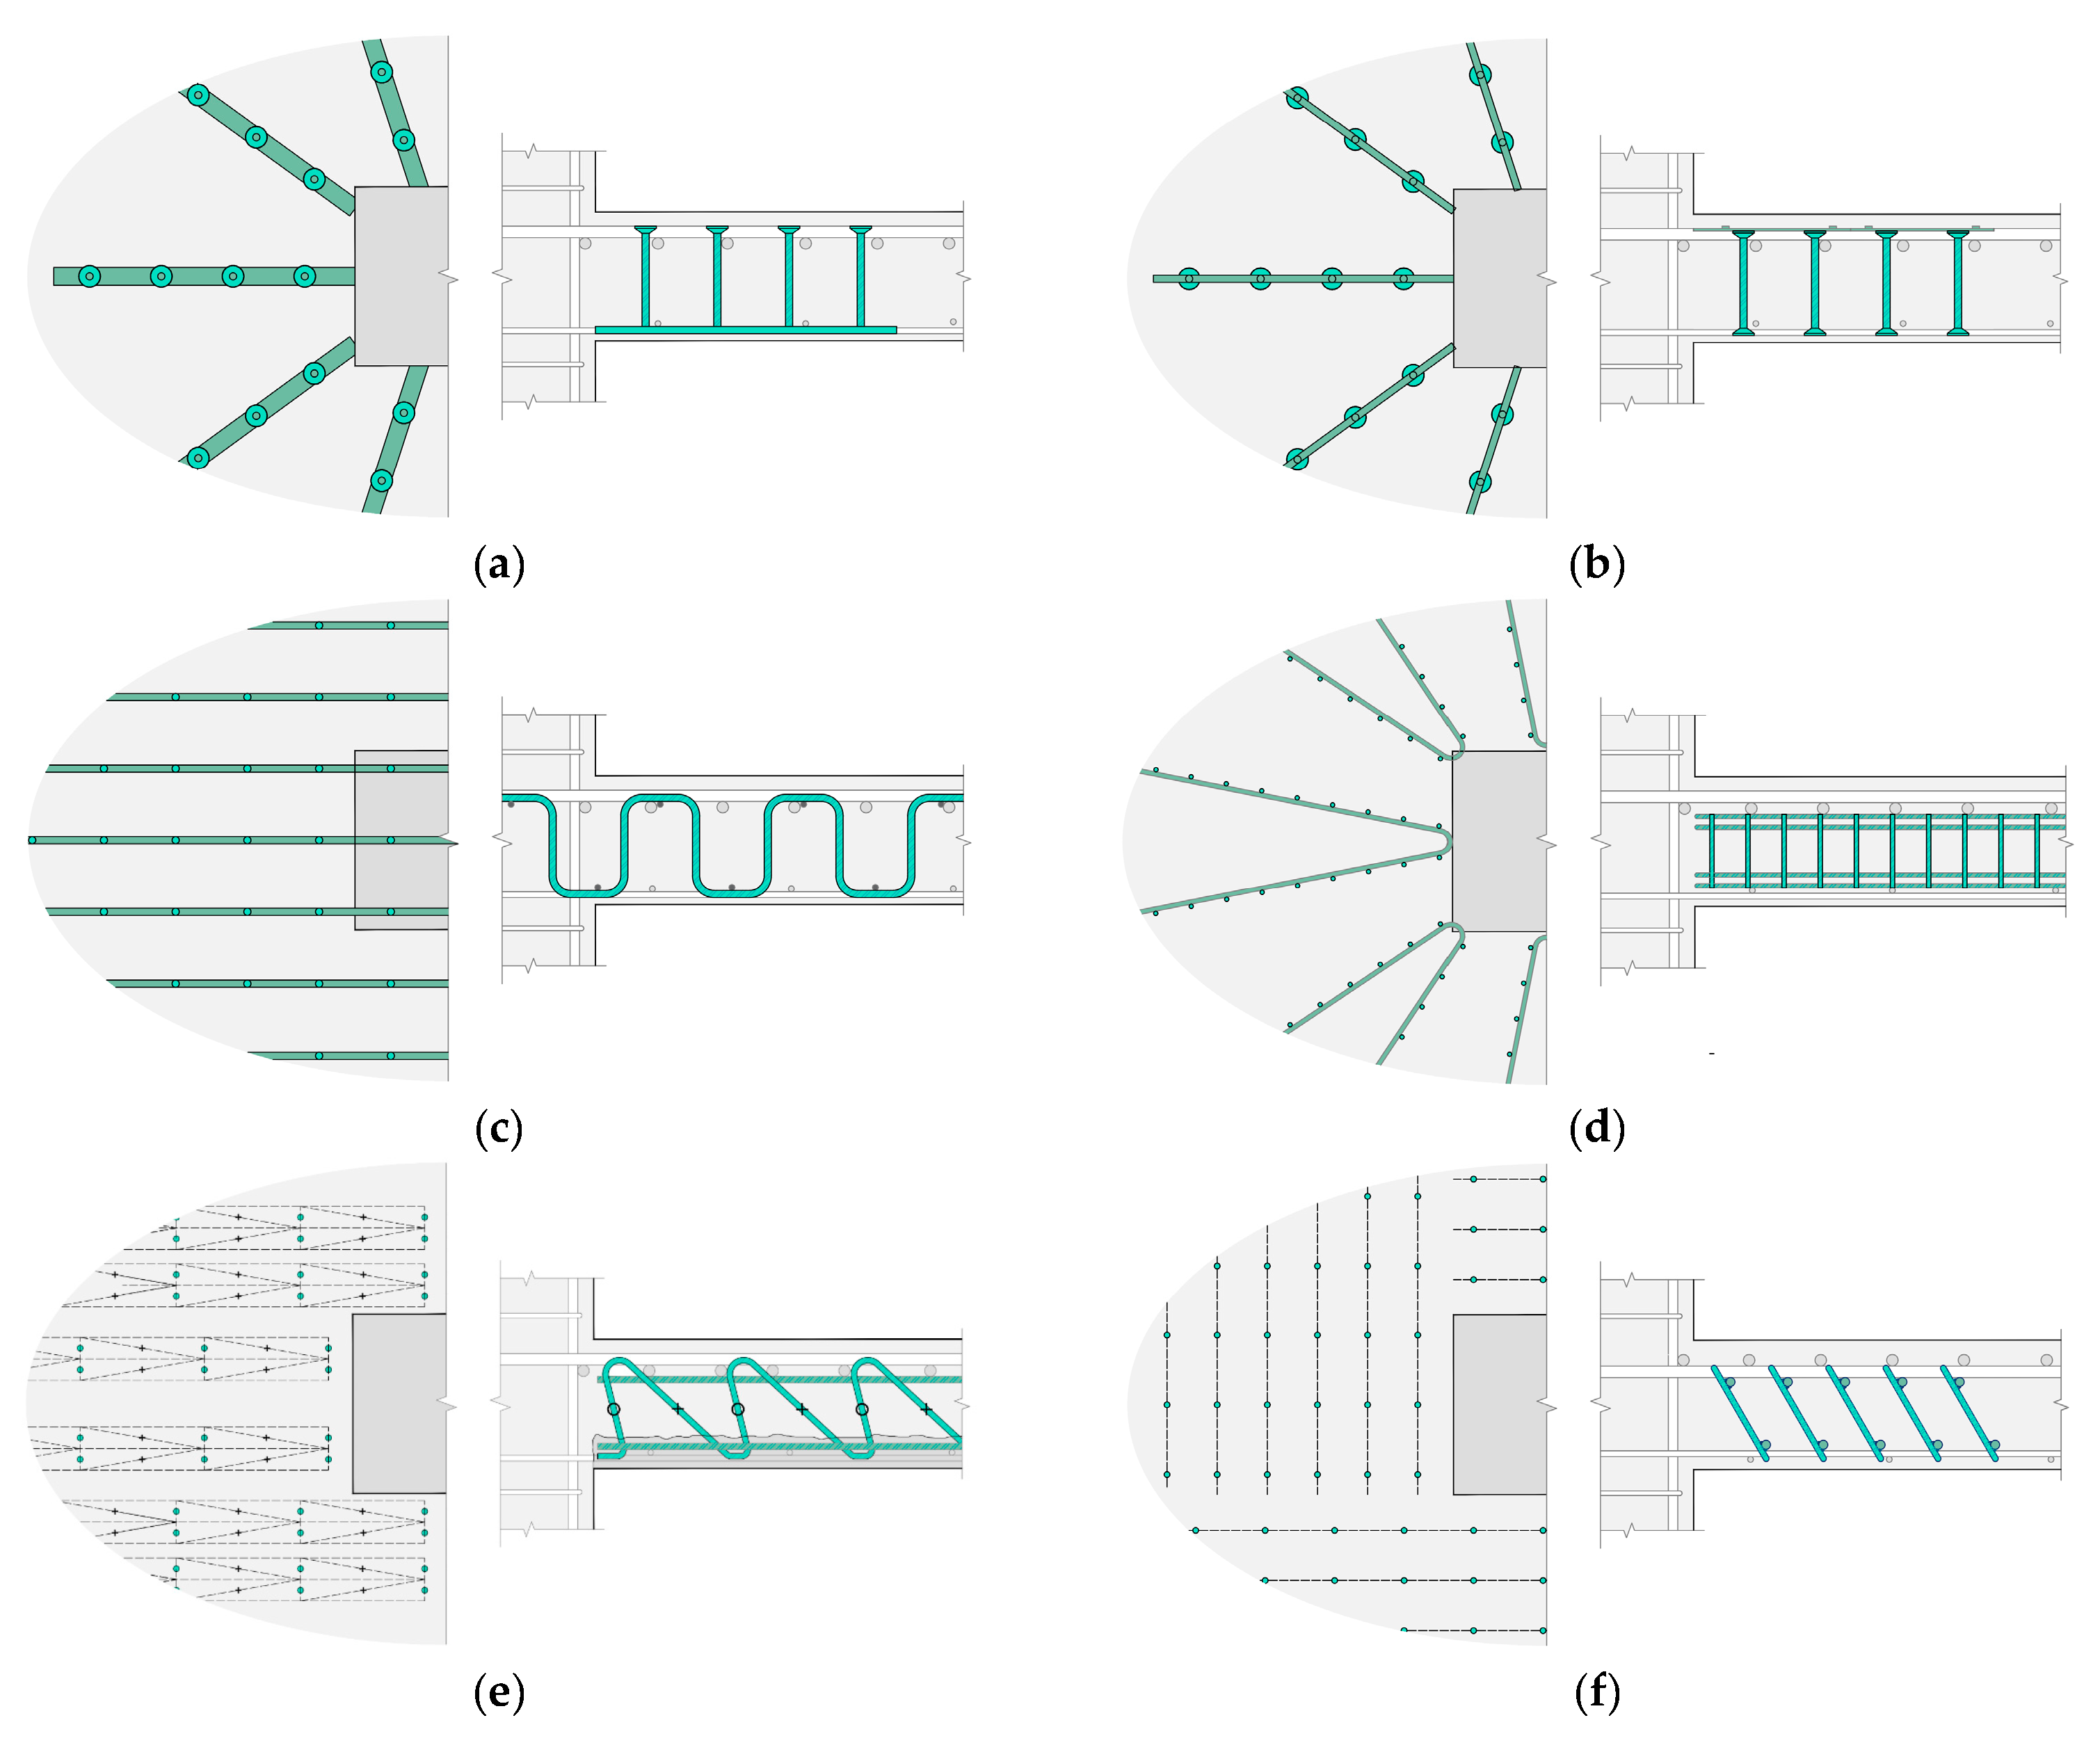
Figure 1. Types of punching shear reinforcement for flat slabs. (a) Stud rails; (b) double-headed studs; (c) continuous stirrups; (d) Riss Star (ladder-like stirrups); (e) Filigran® punching shear reinforcement; (f) prefabricated truss bars.
Buildings 15 00960 g001
Figure 2. Detailing of the flexural reinforcement of the selected slab-column connections (units in mm). (a) PL and PV series; (b) LS and LC series.
Buildings 15 00960 g002
Figure 3. Tests setup by [2,9] (units in mm). (a) PL and PV series; (b) LS and LC series.
Buildings 15 00960 g003
Figure 4. Test setup for series LC by [2].
Buildings 15 00960 g004
Figure 5. Arrangement of the double-headed studs [2,9]. (a) PL7; (b) PL11; (c) LC1, LC2, LC3, and LC7; (d) LC8.
Buildings 15 00960 g005
Figure 6. Constitutive model (adapted from [34]).
Buildings 15 00960 g006
Figure 7. Menétrey–Willam’s failure surface (adapted from [34]).
Buildings 15 00960 g007
Figure 8. Elements used in the computational modelling (adapted from [34]).
Buildings 15 00960 g008
Figure 9. Geometry, boundary conditions, and mesh for the numerical models. (a) Boundary conditions; (b) FE mesh for PV1 and PL series; (c) FE mesh for LS5; (d) FE mesh for LC series.
Buildings 15 00960 g009
Figure 10. Results of the calibration process.
Buildings 15 00960 g010
Figure 11. Final load–rotation results for the slab–column connections without punching shear reinforcement. (a) PV1; (b) LS05.
Buildings 15 00960 g011
Figure 12. Modelling of the studs (a) with explicit heads and (b) without their heads.
Buildings 15 00960 g012
Figure 13. Load–rotation curves for slab PL7.
Buildings 15 00960 g013
Figure 14. Comparison of load–rotation curves of slabs tested by [9]. (a) PV1. (b) PL11. (c) PL7.
Buildings 15 00960 g014
Figure 15. Load–rotation curves for the slabs tested by [2]. (a) LS05. (b) LC01. (c) LC02. (d) LC03. (e) LC07. (f) LC08.
Buildings 15 00960 g015
Figure 16. Load–strain curves in the flexural reinforcement for the slabs tested by [2].
Buildings 15 00960 g016
Figure 17. Load–strain curves in the punching shear reinforcement for the slabs tested by [2].
Buildings 15 00960 g017
Figure 18. Load–strain curves in the punching shear reinforcement for the slabs tested by [9].
Buildings 15 00960 g018
Figure 19. Cracking pattern for both experimental and computational models (series LC).
Buildings 15 00960 g019
Figure 20. Cracking pattern for both experimental and computational models (Series PL).
Buildings 15 00960 g020
Figure 21. The fib Model Code 2020 [19] control perimeters and detailing rules for flat slabs with shear reinforcement.
Buildings 15 00960 g021
Figure 22. Comparisons between the experimental and theoretical response and punching shear resistance (series LC).
Buildings 15 00960 g022
Figure 23. Comparisons between the experimental and theoretical response and punching shear resistance (series PL).
Buildings 15 00960 g023
Table 1. Characteristics of the selected experimental tests.
Slabc
(mm)
d
(mm)
ρflex
(%)
ρw
(%)
fcm (MPa)fy
(MPa)
Shear Reinforcement
No. of
Studs Per
Perimeter
Øw (mm)No. of
Perimeters
s0 (mm)sr (mm)fyw
(MPa)
Asw/perim. (mm²)
PV12602101.500---34.0709---------------------
PL72601971.590.93H35.95831614.07801605192463.0
PL112602011.560.23L34.2554810.0780160592628.3
LC12701431.480.61M47.85571010.0670100573785.4
LC23601401.520.50M46.95571010.0670100573785.4
LC34501421.490.42M48.95571010.0670100573785.4
LC73601441.470.62M49.05571010.0755100573785.4
LC83601441.470.60M48.15571210.0670100573942.5
LS53001431.480---50.5557---------------------
L, M, and H refer to slabs with a low, moderate, and high shear reinforcement ratio. The aggregate diameter is 16 mm for series PL and 9 mm for series LC.
Table 2. Parameters of calibration.
Tensile strength f ctm = 0.3 f c k 2 / 3  * fib Model Code 2010 [37]
f ct , inf = 0.7 f ctm fib Model Code 2010 [37]
Fracture energy G f = 0.073 f cm 0.18 fib Model Code 2010 [37]
G f = G f 0 f cm f cm 0 0.7 CEB-FIP Model Code 1990 [16]
Crack model---Fixed
---Rotating
* In calculations of fctm, fck was replaced by fcm, considering the values reported by the authors of the experimental tests, informed in Table 1.
Table 3. Properties of concrete and steel.
Concrete
Crack modelFixed
fcm (MPa)Experimental (see Table 1)
fct,inf (MPa)fib Model Code 2010 [38] (see Table 2)
Gf (N/m)CEB-FIP Model Code 1990 [17] (see Table 2)
Ec (GPa)fib Model Code 2010 [38] (see Table 2)
Steel
fy (MPa)Experimental (see Table 1)
Es (GPa)200
Table 4. Modelling strategies.
ConcreteStrategy IStrategy II
Crack modelFixedFixed
fc (MPa)fcm,Expfcm,Exp
ft (MPa)fct,inf (see Table 3)fct (see Table 3)
Gf (N/m)MC90 (see Table 3)MC90 (see Table 3)
Ec (GPa)MC10 (see Table 3)MC10 (see Table 3)
Shear factor20200
SteelStrategy IStrategy II
fy (MPa)fy,Expfy,Exp
Es (GPa)200200
Table 5. Comparisons between experimental, numerical, and design code estimates.
SlabVExp (kN)VFEA (kN)VMC10.LoAII
(kN)
VMC10.LoAIII (kN)VMC10.LoAIV (kN)VExp/VExp/VExp/VExp/
VFEAVMC10.LoAIIVMC10.LoAIIIVMC10.LoAIV
PL71773.01736.31400.0 *1500.0 *1375.0 *1.021.271.181.26
PL111176.0940.6870.0905.0863.01.251.351.301.09
LC01858.4894.7775.0712.0700.00.961.111.211.28
LC02955.71027.1815.0820.0785.00.931.171.171.31
LC031076.21201.2863.0895.0875.00.901.251.201.37
LC071110.41068.3845.0820.0810.01.041.311.351.32
LC081058.91083.8912.0938.0870.00.981.161.131.25
Mean1.011.281.271.31
CoV0.110.120.120.11
* The punching resistance estimated by Model Code 2010 was limited by Vmax.
Disclaimer/Publisher’s Note: The statements, opinions and data contained in all publications are solely those of the individual author(s) and contributor(s) and not of MDPI and/or the editor(s). MDPI and/or the editor(s) disclaim responsibility for any injury to people or property resulting from any ideas, methods, instructions or products referred to in the content.