Article

A Study on the Calculations of the Bottom Void Range of an Underground Pipe Gallery Structure Under the Action of Ground Fissure Dislocations

1
China Construction Silk Road Construction Investment Co., Ltd., Xi’an 710000, China
2
China Construction No. 6 Bureau Construction Engineering Co., Ltd., Tianjin 300000, China
3
School of Architecture and Civil Engineering, Xi’an University of Science and Technology, Xi’an 710000, China
*
Author to whom correspondence should be addressed.
Buildings 2025, 15(6), 920; https://doi.org/10.3390/buildings15060920
Submission received: 1 December 2024 / Revised: 28 December 2024 / Accepted: 29 December 2024 / Published: 14 March 2025

Abstract

Ground fissures are extraordinary urban geological disasters, and their harmful effects on underground structures have been highlighted in many cities. Differential settlements between strata can cause a void phenomenon at the bottom of a pipe gallery structure, significantly threatening the project’s construction and operation. This study analyzes the void phenomenon at the bottom of a pipe gallery structure, and a calculation method for the bottom void range is proposed. Through a model test, the stress and deformation laws of the pipe gallery structure under the conditions of orthogonal (90°) and oblique (45°) ground fissure displacements are analyzed. The results show that, owing to the dislocation of the ground fissure, the bottom void range of the pipe gallery is 2.87–3 times the length of the bottom edge of the pipe gallery section under the orthogonal condition and 3.125–3.5 times the length under the oblique condition. Under the dislocation of the ground fissure, the top plate of the structure is under tension; the bottom plate is under compression, and the strains on the side plates are significantly less than those on the top and bottom plates. The maximum contact pressure between the structure and the surrounding soil is distributed on the top plate of the hanging wall and the bottom plate of the footwall near the ground fissure. This study provides a theoretical basis for the optimal design of pipe gallery structures crossing ground fissures and has theoretical significance and application value.

1. Introduction

An underground pipe gallery is a modern, scientific, and intensive urban infrastructure formed by centrally setting up two or more pipelines, such as electricity, communication, and water supply, in the same underground space. It has been built on a large scale in many large cities [1,2]. As the core city in Northwest China, under the background of rapid economic and population growth, underground space development has become the best choice for the urban expansion of Xi’an [3]. In recent years, the planning and construction of urban underground pipe galleries in Xi’an has been in full swing, although the existence of ground fissures has become an essential obstacle in their construction [4,5,6]. As a type of geological disaster on a slow variation time scale, ground fissures have appeared in many countries and regions [7,8,9,10]. The stratum dislocation caused by ground fissure activity is similar to fault activity, which leads to damage to underground structures and threatens the operational safety of underground tunnels and pipelines. An urban underground pipe gallery is a typical linear structure that inevitably crosses ground fissures when it is built. A pipe gallery structure crossing ground fissures is affected by the dislocation of ground fissures for a long time during its operation [6,8].
At present, significant progress has been made in the research on the mechanical behavior of underground structures under fault dislocation at home and abroad, which can provide a reference for the study of the bottom void phenomenon of underground pipe gallery structures under the action of ground fissures [5,11,12,13,14,15,16,17,18,19]. Huang et al. [5] and Liu et al. [20] studied the denaturing characteristics, structural stress, earth-pressure variation law, and failure mode of water supply pipelines under the action of ground fissures through full-scale tests. Many studies have been conducted on the mechanism of the interaction between subway tunnels and ground fissures at different angles and the failure mode of tunnel structures [21,22,23,24,25,26,27,28,29,30,31]. Yan et al. [30,31] and Deng et al. [21,22] used finite element software packages, model tests, and theoretical analyses to analyze the mechanical properties, influence range of ground fissures, and failure mode of an underground pipe gallery in Xi’an, China. The study factors are different dislocations and angles between the comprehensive pipe gallery and the ground fissure. According to the characteristics of ground fissures in Xi’an, China, some prevention measures for underground structures have been proposed [32,33,34]. Maqsood, Z. [35], by loading GMS materials using different strain rates, found that the strength as well as the deformation of the material is affected by the loading rate. Li [36,37], Wang [34], and others took the research and development of equipment and materials for underground engineering model tests as a breakthrough and carried out research work on the loading and unloading devices for model tests and new similar materials based on geomechanical models and the coupling of flow–solid in underground engineering. The application of these new means and new materials has led to a large number of important results in reducing boundary effects and improving test accuracy in underground engineering model tests.
In our previous study on the stress deformation of a pipe gallery under the action of ground fissure dislocations [22], it was found that near the ground fissure, a stress reduction area appears at the bottom of the hanging wall of the pipe gallery structure along with the bottom void phenomenon. When the bottom of the pipe gallery is void, the foundation of the voiding part loses its support to the structure, changing the stress state of the structure. Several studies have been conducted on the phenomenon of the bottom void of the underground structure when it passes through ground fissures. Li et al. [38] conducted a model test of the Xi’an metro tunnel crossing a ground fissure zone and considered that with an increase in dislocation, the expansion process of the void area at the bottom of the pipe gallery can be divided into three stages: the simultaneous deformation stage, the critical void stage, and the void development stage. Pang et al. [39] studied the voiding distance and influence range of a subway tunnel under the action of ground crack dislocations. Hu et al. [40] and Zhang et al. [41] studied the deformation failure mode of a pipe gallery structure under oblique conditions through model tests. They concluded that the stress on the pipe gallery structure was primarily due to the constrained torsion of the thin-walled members. The reason for the torsion of the pipe gallery structure was that the resultant force of the shear flow in the void area did not pass through the shear center of the structural section. Mei et al. [42] studied the stress deformation and bottom voiding phenomenon under the intersection of pipe gallery structures and ground fissures at different angles through a numerical simulation and proposed corresponding early warning indicators and control measures. Yan et al. [30] studied the structure at an angle of 30° with the ground fissure and concluded that the angle between the ground fissure and the pipe gallery structure has a significant influence on the void area formation at the bottom of the pipe gallery structure.
Several studies have been conducted on the bottom void phenomenon of structures under the action of ground fissure dislocations; however, very few researchers have performed relevant research on the prediction of the formation range of the void area at the bottom of the pipe gallery structure. The determination of the void area directly affects the determination of the structural stress state and damage range. Therefore, this study considers an underground pipe gallery crossing a ground fissure in Xi’an, China, as the research background, using a method combining theoretical calculations and model tests, and attempts to develop a calculation method for the void area range. Thus, the void area range is obtained, which can provide a theoretical basis for the design optimization of pipe gallery structures crossing ground fissures.

2. Bottom Void Mechanism of Pipe Gallery

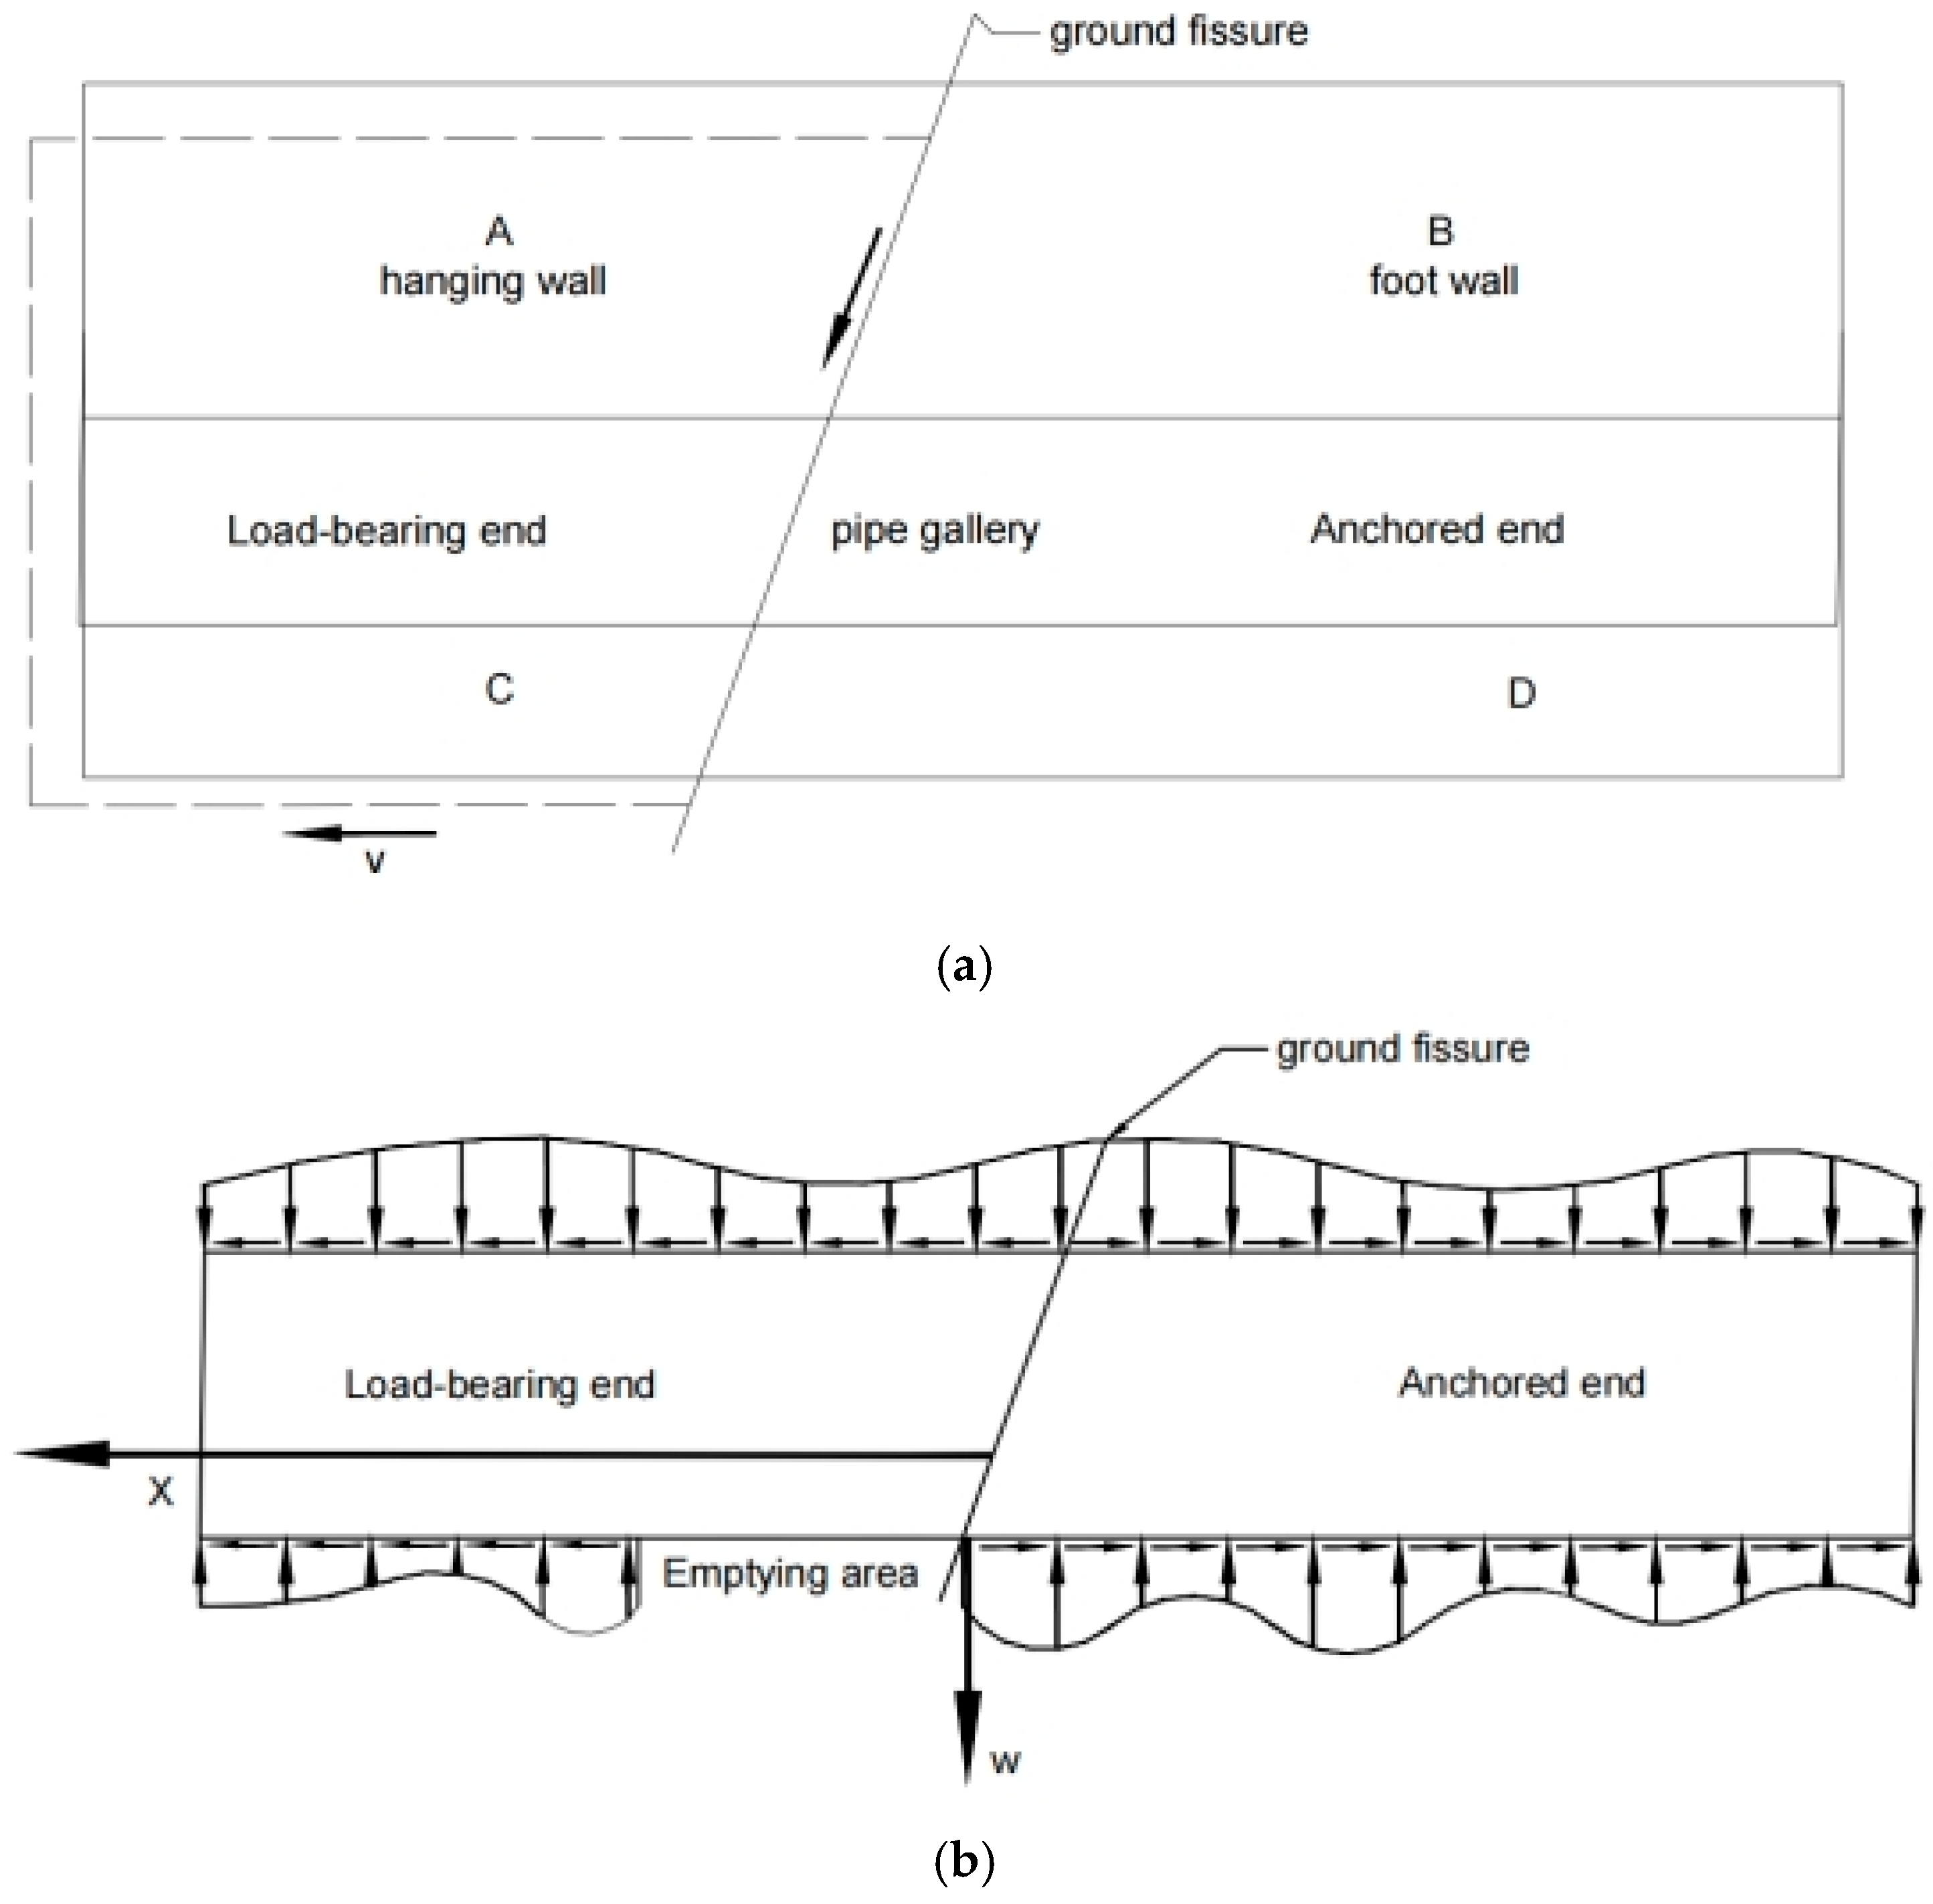
2.1. Mechanism Analysis of Structural De-Voiding in Pipeline Corridors in Region of Ground Cracks

During ground crack action, the upper disk descends and the lower disk is fixed relative to the upper disk. During the descent of the upper disk, there is movement in the soil body of the upper disk in two directions, vertically and horizontally, due to the existence of an 80° inclination angle in the ground crack. In the moving process in the ground crack, the upper disk of the soil body (the top of corridor A and the bottom of corridor B) and the corridor structure in the contact surface between the upper and lower disks of the soil body (the top of corridor C and the bottom of corridor D) produce friction in the overlaying load. Additionally, friction is generated under the joint action of the upper disk of the corridor and soil with the settling of deformation. In the process of settling, the soil body’s settlement displacement is greater than that of the corridor. In the settlement process, the soil’s settlement displacement is larger than the pipe corridor’s bending deformation displacement, and in the upper coil pipe corridor structure near the ground cracks, dehollowing appears. In the whole process, the upper disk corridor structure is subjected to drag, and the lower disk corridor structure is always in contact with the soil and is subjected to the anchoring effect of the soil. Therefore, the upper disk of the corridor can be regarded as a loaded section, and the lower disk of the corridor can be regarded as an anchored section by the soil constraints (see Figure 1) (longitudinal section).
From the ground cracks under the action of the pipe corridor structure and soil interaction mechanism and the existing pipe corridor through the ground cracks, a model test can be seen. In the early stage of upper plate settlement, the pipe corridor’s overlying load is uniformly distributed, and with the increase in the amount of the upper plate that is misaligned, the top of the pipe corridor’s contact pressure changes, the performance of the upper plate improves, and that of the lower plate decreases. Thus, it is necessary to explain the following: only the earth pressure acting on the pipe corridor is changed, and the contact pressure at the bottom of the pipe corridor is opposite to that at the top. The deformation of the pipe corridor mainly shows that the bottom of the lower disk is compressed and the bottom of the upper disk is strained. The lower coil corridor is deformed greatly near the ground crack, and the lower coil corridor remains unchanged away from the ground crack. The upper coil corridor forms a local hollow at the bottom of the pipe corridor due to the friction caused by the soil settlement. A schematic diagram of the structural deformation force of the tube corridor is shown in Figure 2.
To summarize, the reason for the bottom hollowing of the underground integrated pipe gallery in the ground fracture area is that the pipe gallery structure and soil deformation are not coordinated and inconsistent when the upper wall of the ground fracture falls.

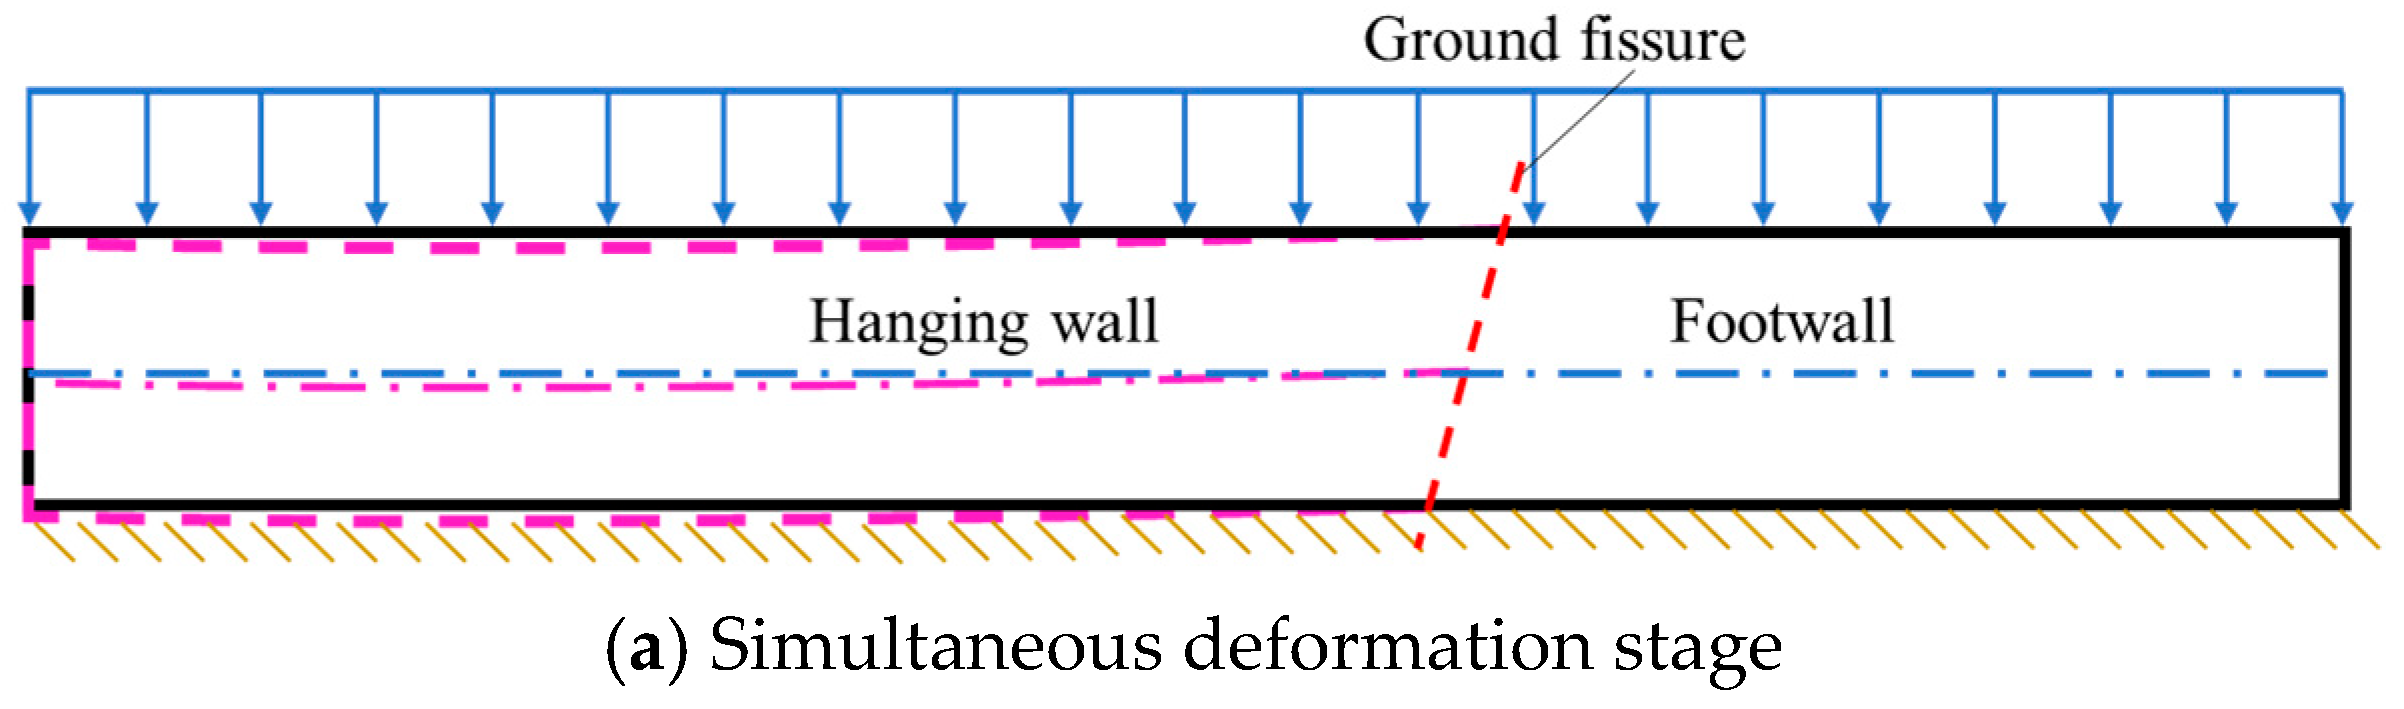
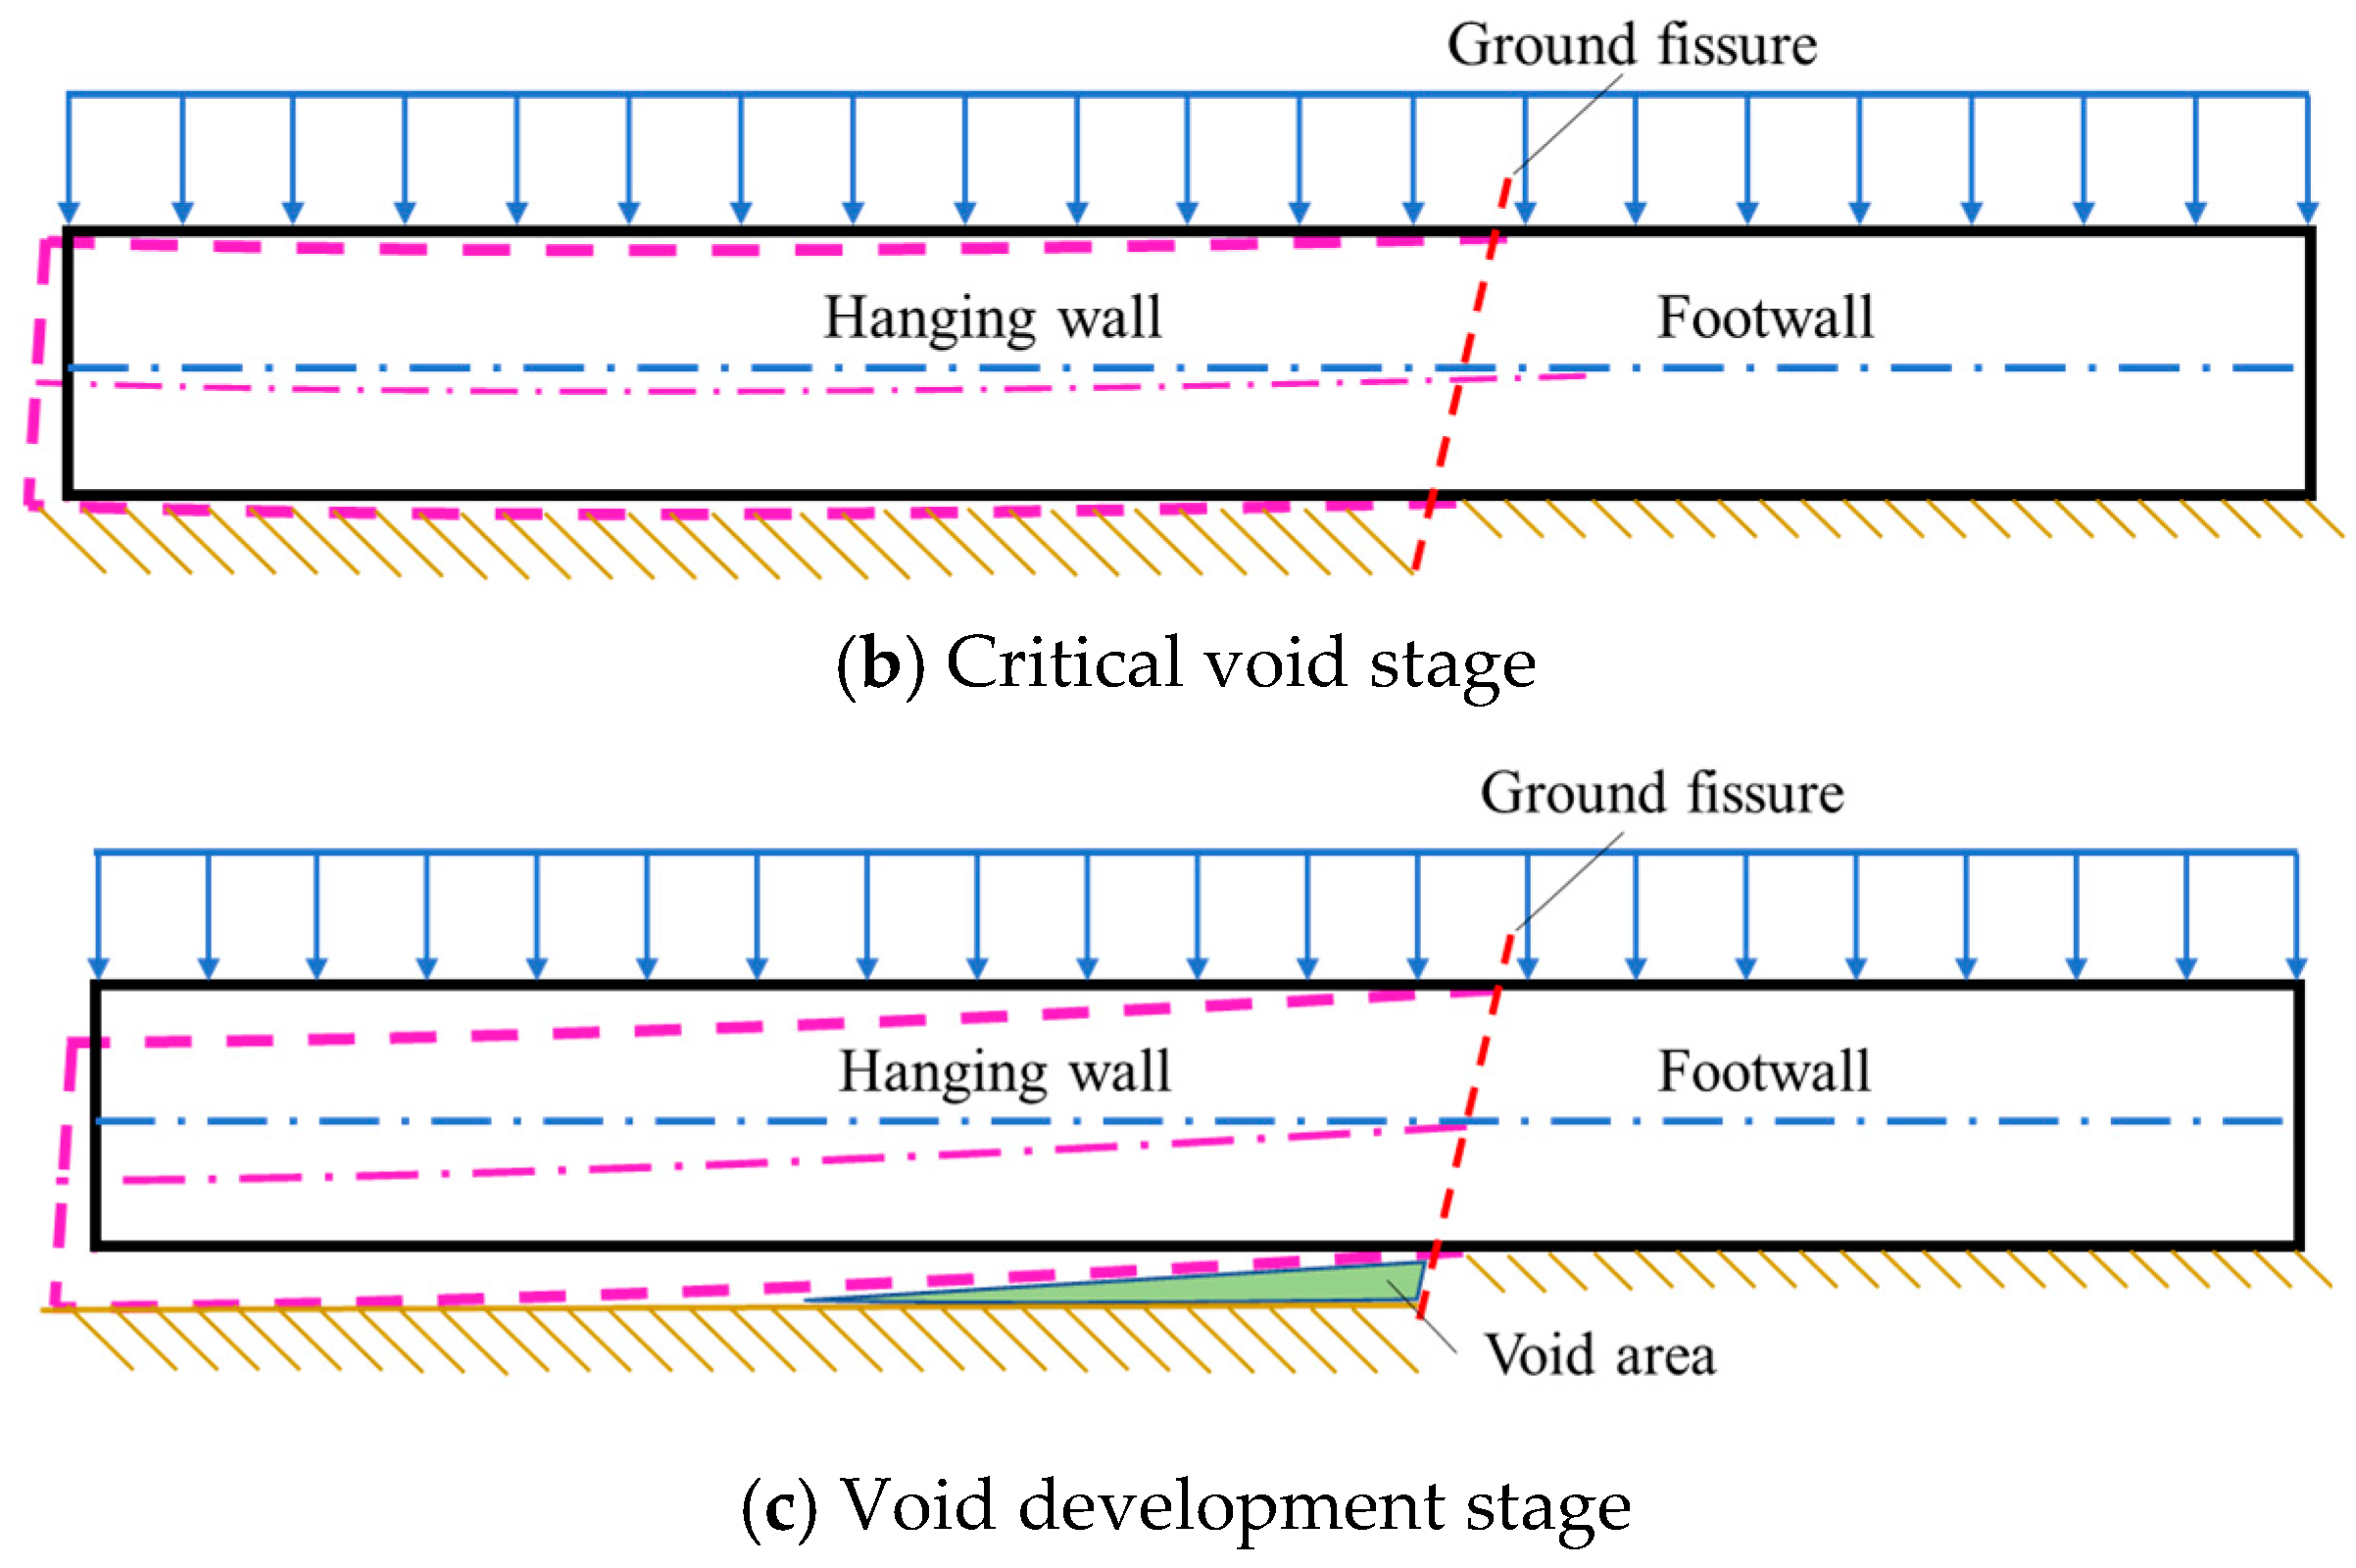
2.2. The Process of Dehollowing at the Bottom of the Pipeline Corridor

Ground crack misalignment is a slow-change geological disaster which occurs when the bottom of the corridor at all stages of the dehollowing phenomenon is not the same. According to the degree of contact between the corridor structure and the soil, dehollowing can occur at the bottom of the structure, and the process is divided into three stages.
The first stage is the common deformation stage. In this stage, the amount of ground crack misalignment is small, the bottom of the pipe corridor structure is in close contact with the foundation, the bottom of the upper and lower coil pipe corridors are subjected to the same base pressure at the ground crack, and the displacement does not change with the dislocation of the ground crack. Dehollowing does not occur during this stage, as shown in Figure 3a.
The second stage is the critical dehollowing stage. In this stage, the amount of ground crack misalignment increases, and the bottom of the upper and lower disks of the corridor are in contact with the ground cracks at the beginning, causing a difference in the base pressure. The upper disk depressurizes, and the soil under the pipe springs off. The bottom plate is pressurized, but its bottom still touches the ground. This stage lasts for a short time and is a prelude to the emergence of the dehollowing phenomenon, as shown in Figure 3b.
The third stage is the dehollowing development stage in which the amount of misalignment with the ground cracks continues to increase, the base pressure on the bottom of the upper coil corridor at the ground crack decreases to zero, and the detachment of the bottom of the corridor structure from the foundation begins to occur. A dehollowing region appears at this stage, and after this stage, the dehollowing region continues to increase, as shown in Figure 3c.

3. Theoretical Calculation of Void Area Range

Based on the mechanical characteristics and deformation mechanisms of the pipe gallery structure, a mechanical abstract model for calculating the void range at the bottom of the pipe gallery under the action of a ground fissure was established using the rigid bar method in the elastic foundation beam theory and selecting a semi-infinite elastic foundation and Euler–Bernoulli beam.

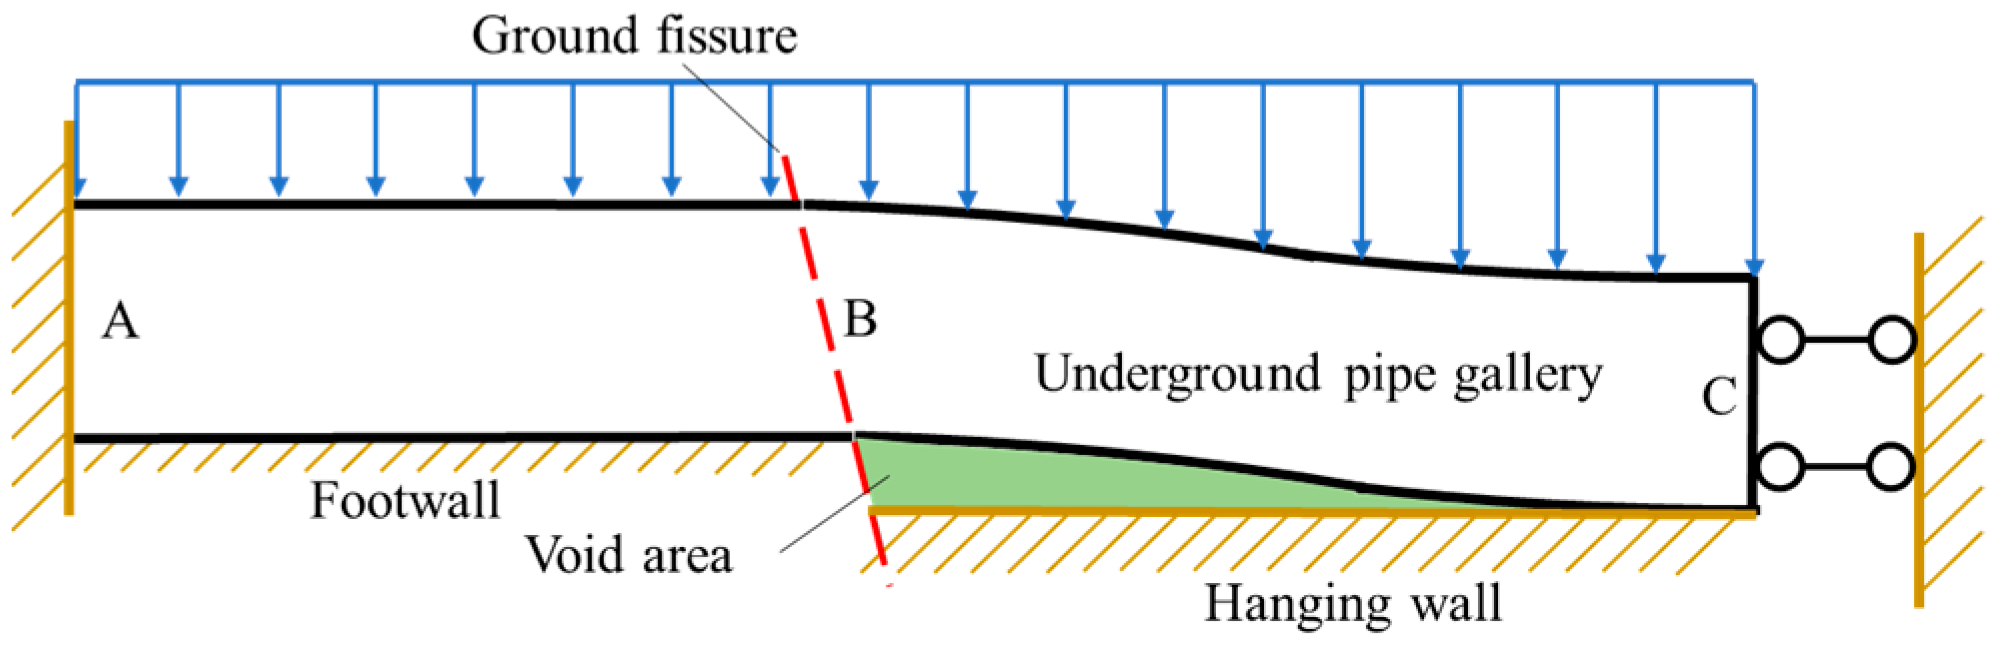
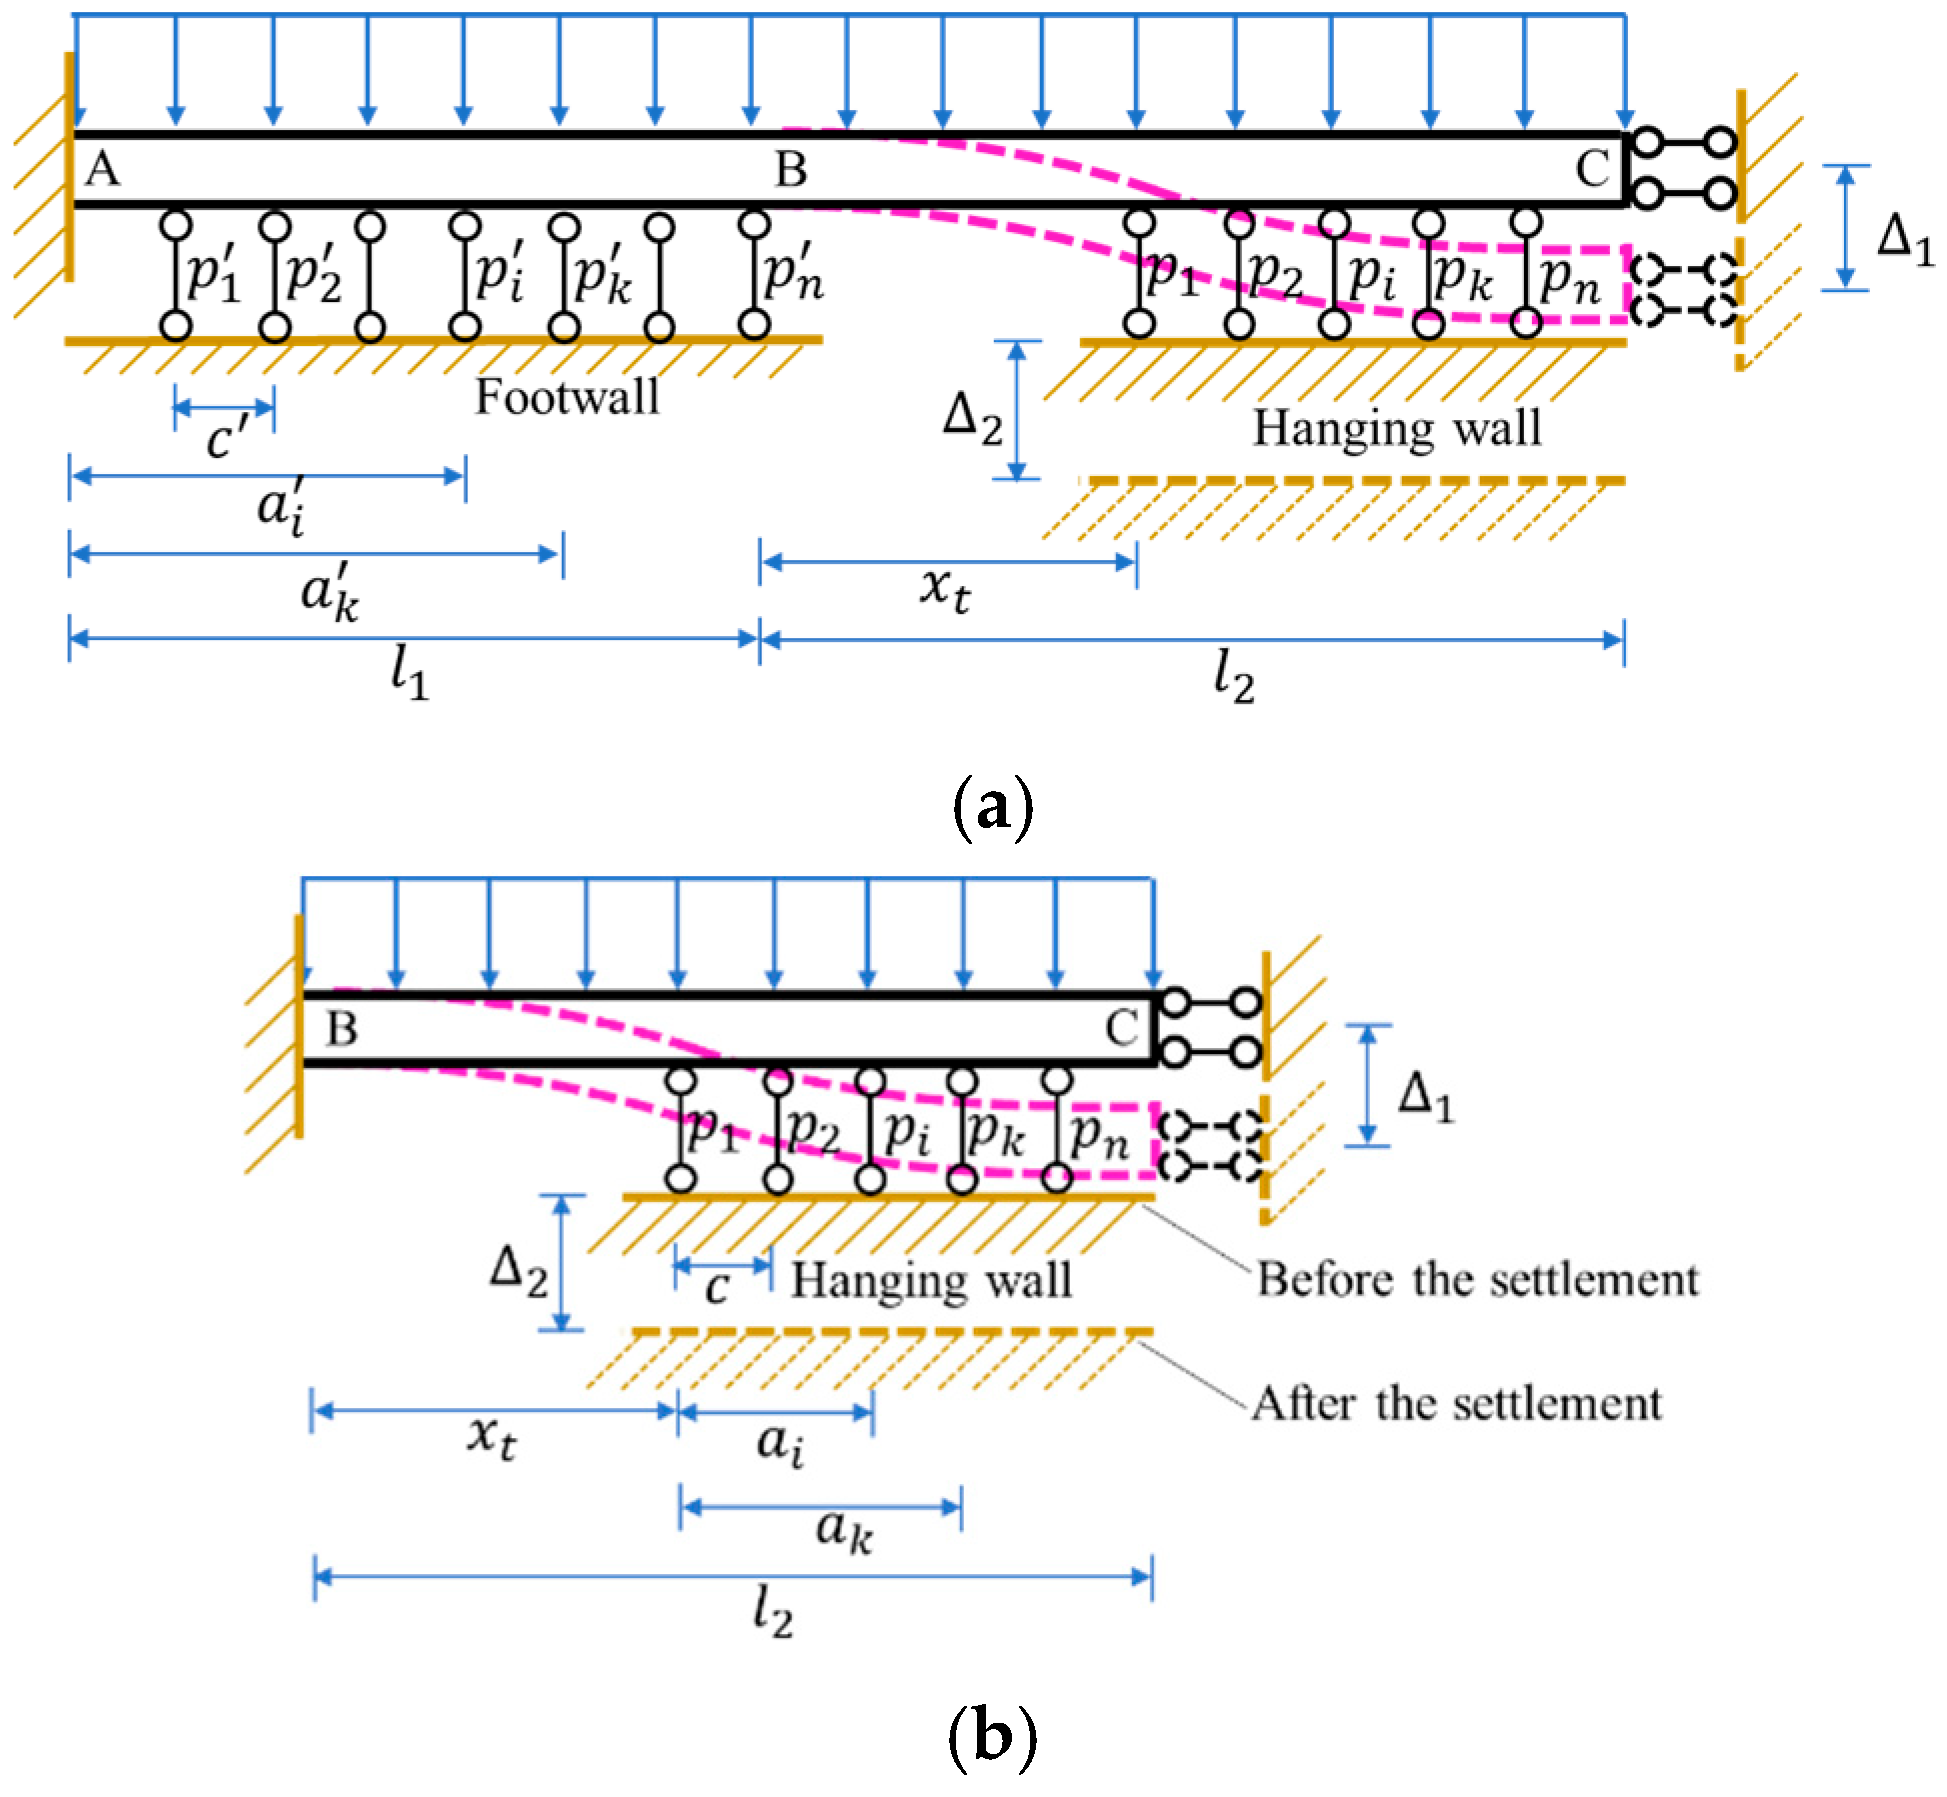
3.1. Establishing the Calculation Model

By referencing the calculation model of a tunnel crossing a ground fissure [43], the calculation model of the pipe gallery structure was established according to its mechanical characteristics. When the pipe gallery structure crosses the ground fissure, with the subsidence of the hanging wall at the ground fissure, the footwall of the pipe gallery structure is always in contact with the foundation, and the deformation of the pipe gallery near the ground fissure is the largest, whereas that far away from the ground fissure is close to zero. Therefore, the constraint on the footwall soil layer at the end of the pipe gallery far from the ground fissure can be assumed as a fixed end. When the hanging wall dislocation at the ground fissure reaches a certain value, the hanging wall of the pipe gallery is deformed along with the soil. Owing to the disharmony between the pipe gallery and the surrounding soil, a void area is formed between the bottom of the pipe gallery and the hanging wall. Therefore, the constraint on the soil layer at the end of the pipe gallery in contact with the hanging wall can be assumed as a directional support. To simplify the calculations, the variation in the contact pressure at the top of the pipe gallery is not considered, and it is calculated as the overburden load, q0. The calculation model is shown in Figure 4.
The pipe gallery was simplified as a Euler–Bernoulli beam in the Boussinesq foundation, referred to as the Euler–Bernoulli–Boussinesq model. According to the principle of the rigid bar method, n rigid bars were used to connect parts of the pipe gallery to the foundation. Here, c denotes the distance between adjacent chain rods; ak denotes the distance between the first bar and the kth bar; pn denotes the interaction force between the pipe gallery and the foundation; Δ1 denotes the end displacement of the hanging wall pipe corridor structure; and Δ2 denotes the dislocation of the ground fissure. The calculation model is shown in Figure 5a. As the footwall of the pipe gallery is always in contact with the foundation, only the hanging wall of the pipe gallery is considered in the calculation of the bottom void range of the pipe corridor. Therefore, the calculation model can be simplified to the basic system of a cantilever beam structure, with point B as the fixed end, as shown in Figure 5b.
By combining this study’s results with the existing literature on the relationship between the relative displacement of the underground tunnel structure and soil under the action of ground fissures [23,38,39,40,42], we can conclude that the vertical displacement of the hanging wall of the pipe gallery (∆1) and dislocation of the ground fissure (∆2) have the following relationship: ① With an increase in the dislocation of the ground fissure (∆2), the vertical displacement at the end of the hanging wall of the pipe gallery (∆1) exhibits an increasing trend. ② The bending stiffness of the pipe gallery structure has a tendency to hinder the increase in the end displacement of the pipe gallery (∆1). The hyperbolic tangent function has been used in the study of spatial effects in underground engineering [44]; therefore, the relationship between ∆1 and ∆2 can be fitted using a hyperbolic tangent function. A graph depicting the functional relationship between ∆1 and ∆2 is shown in Figure 6.
The functional relationship is expressed as Equation (1).
Δ 1 = b tanh Δ 2 b ,
where b denotes the maximum ground fissure dislocation; ∆1 denotes the vertical displacement at the end of the hanging wall of the pipe gallery; and ∆2 denotes the ground fissure dislocation.

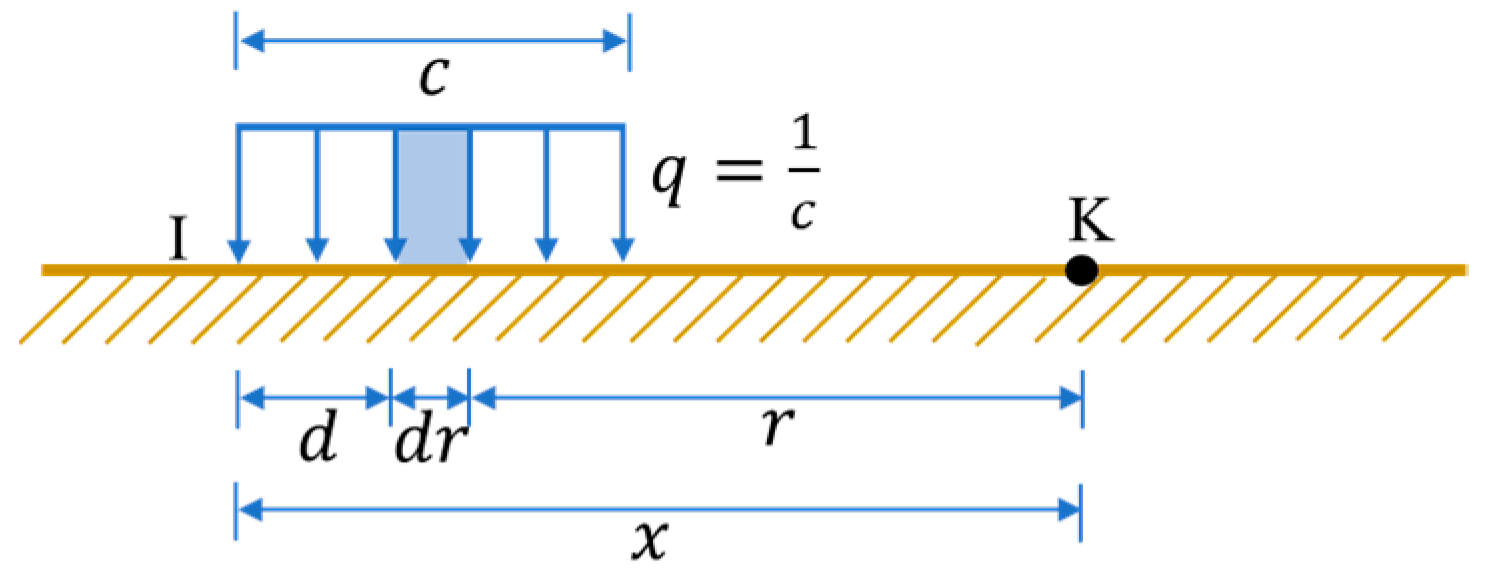
3.2. Calculation Method for Pipe Gallery’s Bottom Void Range

The calculation concept of a general elastic foundation beam can be used for the calculation and derivation of the pipe gallery’s bottom void range. First, the finite statically indeterminate structure shown in Figure 5b was transformed into a cantilever beam and used as the basic system to determine the various forces on the system. Second, according to the contact condition of the part with a void at the bottom of the pipe gallery structure, n equations were obtained. This is because, according to this contact condition, the relative displacement between the pipe gallery structure and foundation (the relative displacement includes the settlement value of the foundation at the bar and the displacement of the pipe gallery caused by the load at the bar) is zero. The pipe gallery’s bottom void range (xt) was included in the equation of the displacement caused by the load. In the end, the n equations obtained using the relative displacement contact conditions and the equations obtained using the static equilibrium conditions were combined. Finally, combined with the boundary conditions, a nonlinear system of equations was obtained, and the pipe gallery’s bottom void range (xt) was obtained using MATLAB R2022a programming.
Before a complete void occurred at the bottom of the pipe gallery structure, the relative displacement of the contact part between the pipe gallery structure and foundation was zero; that is, the relative displacement of the pipe gallery structure and foundation at any bar was zero. As shown in Figure 5b, the relative displacement of the pipe gallery structure and foundation at any bar k (∆k) is caused by four external loads: ∆kpi denotes the displacement caused by the foundation reaction force in the area where the hanging wall is not a void. Furthermore, ∆kq denotes the displacement along the pk direction caused by the overlying load at point k in the pipe gallery structure. ∆kMC denotes the displacement along the pk direction caused by the bending moment MC at the end of the pipe gallery structure at the k-point of the pipe gallery structure. Finally, ∆k1 denotes the displacement at the k-point of the pipe gallery structure caused by ∆1, the vertical displacement at the end of the pipe gallery structure. Therefore, Equation (2) can be expressed as
Δ k = Δ k p i + Δ k M C + Δ k q + Δ k 1 = 0 .
Subsequently, we solved for each term in Equation (2).
① ∆kpi denotes the sum of the settlement value caused by pi at the k-point of the foundation and the deflection caused by pi at the k-point of the pipe gallery, where pi is the interaction force between the pipe gallery and the foundation at any point i.
Δ k p i = i = 1 n δ k i p i ,
where δki is the sum of the settlement value, yki, generated by the foundation at the k-point and the deflection vki generated at the k-point of the pipe gallery’s hanging wall structure when pi = 1, that is, δki = yki + vki.
According to the subsidence of a semi-infinite plane, the following can be obtained:
y k i = 2 π E 0 c F k i ,
where E 0 = E 0 1 μ 0 2 ; E0 is the elastic modulus of the foundation; and μ0 is the Poisson coefficient of the foundation. Furthermore, F k i = c ln c c ln ( x c ) x ln x + x ln ( x c ) . For ease of calculation, the lnc and ln(x − c) power series is expanded, and it is assumed that 0 < c ≤ 2, 0 < x − c ≤ 2 to obtain F k i = 2 c ( a k a i ) .
v k i = 1 2 E 1 I a i + x t 2 2 3 x t + a k 1 3 a i ,
where E1 is the elastic modulus of the pipe gallery, and I is the moment of inertia of the pipe gallery section. The other parameters are shown in Figure 7.
Solving Equations (4) and (5) yields the following:
δ k i = 4 k i 1 n π E 0 l 2 x t + 1 2 E 1 I a i + x t 2 2 3 x t + a k 1 3 a i .
Finally, Equation (6) is input into Equation (3) to obtain ∆kpi.
② ∆kMC denotes the displacement caused by the bending moment MC at point C to the pipe gallery structure at the k-point in the hanging wall non-void area, which can be calculated using the deflection integral formula of structural mechanics.
Δ k M c = x t + a k 2 2 E 1 I M C ,
where M C = R θ c ; θ c is the angular displacement between the end parts of the components; R is the joint stiffness of the node; and R = E 1 I .
③ ∆kq denotes the displacement of the overlying load at the k-point of the pipe gallery structure in the hanging wall non-void area, which can be obtained using the integral formula of the structural mechanical deflection.
Δ k q = q 0 2 E 1 I l 2 2 2 x t + a k 2 l 2 3 x t + a k 3 + 1 12 x t + a k 4 .
④ The vertical displacement of point C at the end of the pipe gallery structure was small compared to the length of the hanging wall of the pipe gallery structure; therefore, ∆k1, the vertical displacement of point C at the end of the hanging wall of the pipe gallery structure, caused the downward vertical displacement at the k-point, which can be solved directly by using the geometric method.
Δ k 1 = Δ 1 l 2 x t + a k .
In conclusion, by inputting Equations (3), (7), (8), and (9) into Equation (2), the system of equations containing xt and the bottom void range can be obtained.
Because the structure of the hanging wall of the pipe gallery satisfies the static equilibrium condition, the following equation can be obtained by considering the moment at point B:
x t p 1 + x t + a 2 p 2 + + x t + a k p k + + x t + a n p n M q + M C = M B = θ B E 1 I ,
where Mq is the bending moment generated by the overlying load at point A at the end of the hanging wall of the pipe gallery structure; Mq = (q0/2)l22; and θB is the angular displacement at point B.
In addition, the end of the hanging wall of the pipe gallery structure satisfies the following end-constraint condition:
q 0 l 2 3 6 E I + θ B = θ C ,
q 0 l 2 4 E I + θ B l 2 = Δ 1 Δ 1 u ,
where 1 u is the maximum end vertical displacement.
To calculate the bottom void range, xt, of the pipe gallery, first, the different dislocations of the hanging wall (∆2) were substituted into Equation (1) to obtain the end displacement (∆1) of the hanging wall of the pipe gallery. Second, by inputting ∆1 into Equation (12), the angle θB at the fixed end of the hanging wall of the pipe gallery was obtained. Subsequently, θB was input into Equation (11) to obtain the angle θC at the end of the hanging wall of the pipe gallery. Finally, a system of equations was constructed using Equations (2) and (10). By solving the system of equations using MATLAB, the xt value and the bottom void range of the pipe gallery structure were obtained.

4. Model Test for Ground Fissure Dislocation

Using a self-designed device, model tests of orthogonal (90°) and oblique (45°) ground fissure dislocations between the pipe gallery and the ground fissure were conducted. Furthermore, the change law of the surface strain, bottom displacement, and contact pressure between the pipe gallery structure and its soil was obtained, and the bottom void range of the pipe gallery structure calculated using the theory was compared.

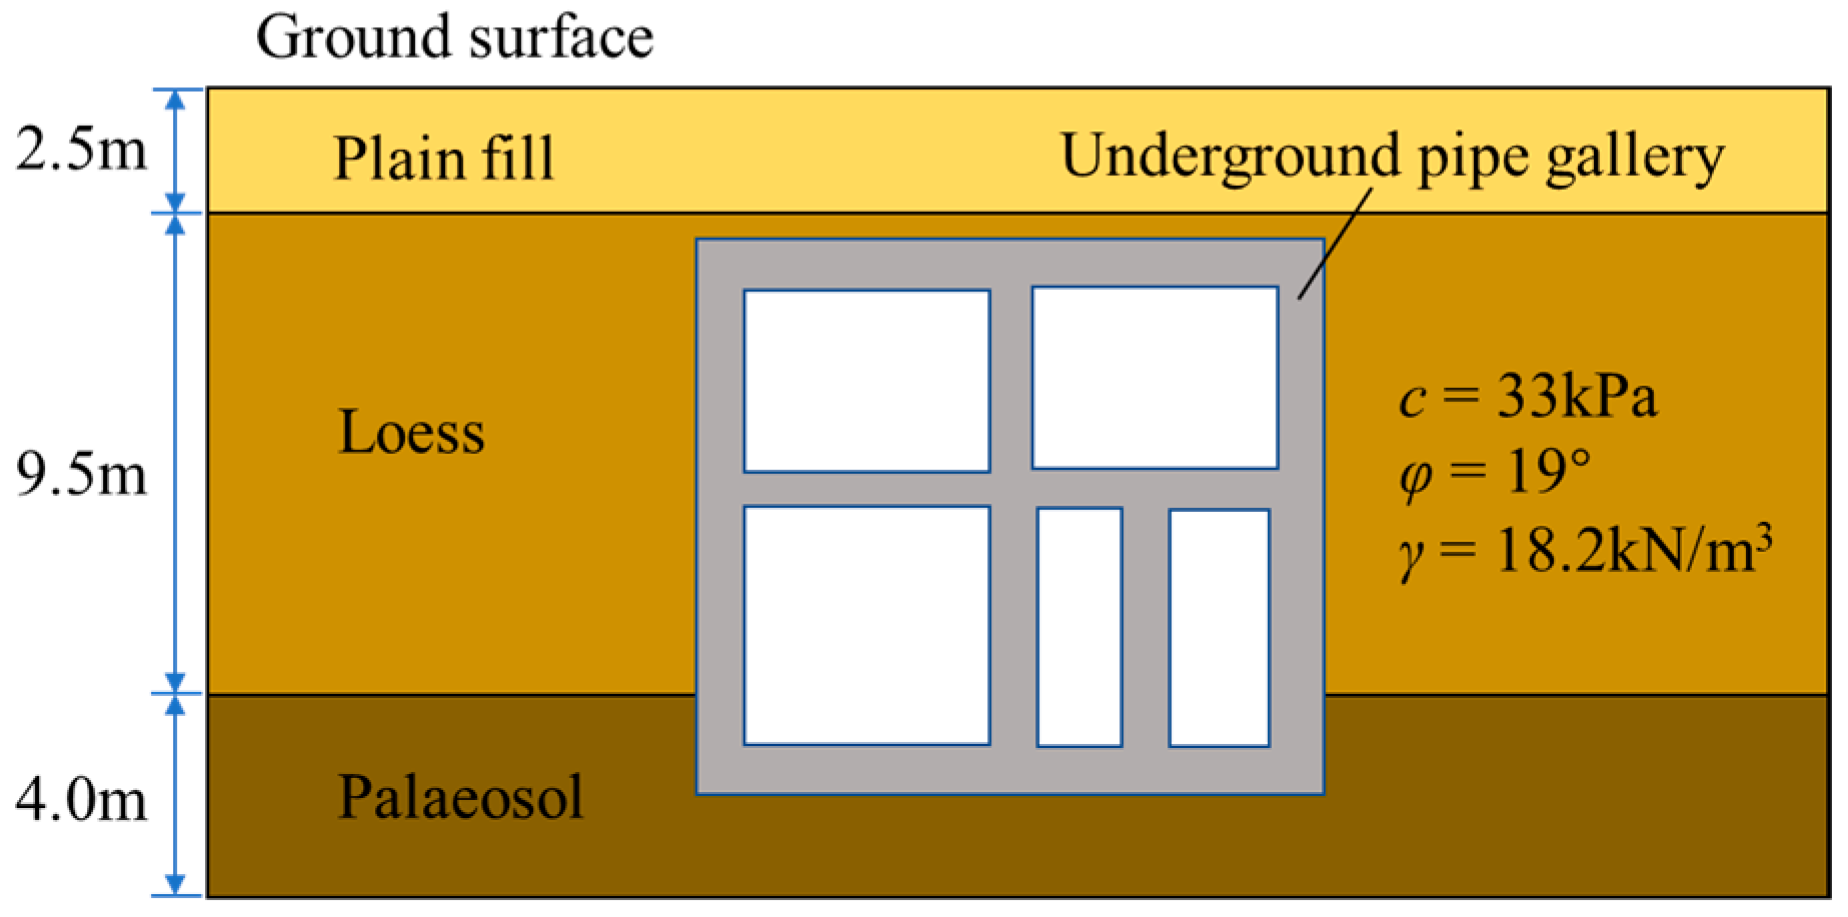
4.1. Test Background

The underground pipe gallery structure crossing the ground fissure in Xi’an is considered as the research object. According to the engineering geological survey report of the section, the main soil layers within the buried depth of the pipe gallery are prime fill soil, loess, and paleosol, as shown in Figure 8. Based on the stratigraphic mechanical parameters of other pipe galleries in Xi’an, the loess layer was selected as the representative prototype soil in the model tests, and its mechanical parameters are as follows: c = 33.0 kPa, φ = 19°, E0 = 8 MPa, and γ = 18.2 kN/m3. The prototype pipe gallery was constructed using open-cut cast-in-place construction. The design strength of the pipe gallery is C40; the compressive strength is 26.8 MPa; the tensile strength is 2.39 MPa; and the elastic modulus is 3.45 × 10⁴ MPa. The main aim of this model test was to determine the influence of the ground fissure on the pipe gallery structure in the loess region, focusing on the bottom void range of the pipe gallery structure. After comprehensive consideration, the pipe gallery structure was simplified as a single cabin pipe gallery; its size was determined to be 4.0 m × 4.0 m, and the wall thickness was 0.56 m. The dip angle of the ground fissure was 80°, and the vertical subsidence of the Xi’an ground fissure was predicted to be 0.8 m in one hundred years.
The model box used in this test is a cuboid with length, width, and height values of 2 m, 1.6 m, and 1.2 m, respectively. At one end of the box, there is a round hole with a diameter of 30 cm for observing the interior of the pipe gallery, and the other end is made of a removable steel plate spliced together. The front of the box is made of tempered glass, and the top of the model box is open for easy filling of the model soil, as shown in Figure 9a,b. The bottom plate of the model box comprises four plates, A, B, C, and D, which are spliced using latches. Plates A and B are spliced to perform orthogonal (90°) model tests, and plates A and C are spliced to perform oblique (45°) model tests, as shown in Figure 9c,d. A schematic of the model test device is shown in Figure 9e.

4.2. Similarity Ratio of Model Test

To simulate the stress of a comprehensive pipe gallery under the action of ground fissure displacement, similarity ratios between the main physical parameters of the pipe gallery and soil should be consistent to the greatest extent. Considering the size and bearing capacity of the model box, the similarity ratio of the model test was determined as 1:20. The model pipe gallery was prefabricated with deformable acrylic material; its elastic modulus was 2.7 × 10³ MPa; and the Poisson’s ratio was 0.372 at a test temperature of 14 °C. To make the pipe gallery model convenient and reflect the actual size of the prototype pipe gallery, based on the geometric similarity ratio Cl = 20, a model pipe gallery with a length of 1.9 m, a cross-sectional size of 0.20 m × 0.20 m, and a wall thickness of 6 mm was fabricated. According to the pipe gallery design report, the pipe gallery structure was cast in situ using C40 reinforced concrete, and its elastic modulus E was 32.5 GPa; therefore, the elastic modulus similarity ratio CE was 1:12.
According to the similarity theorem, the similarity ratios between the model structure and the model soil were designed and are listed in Table 1.

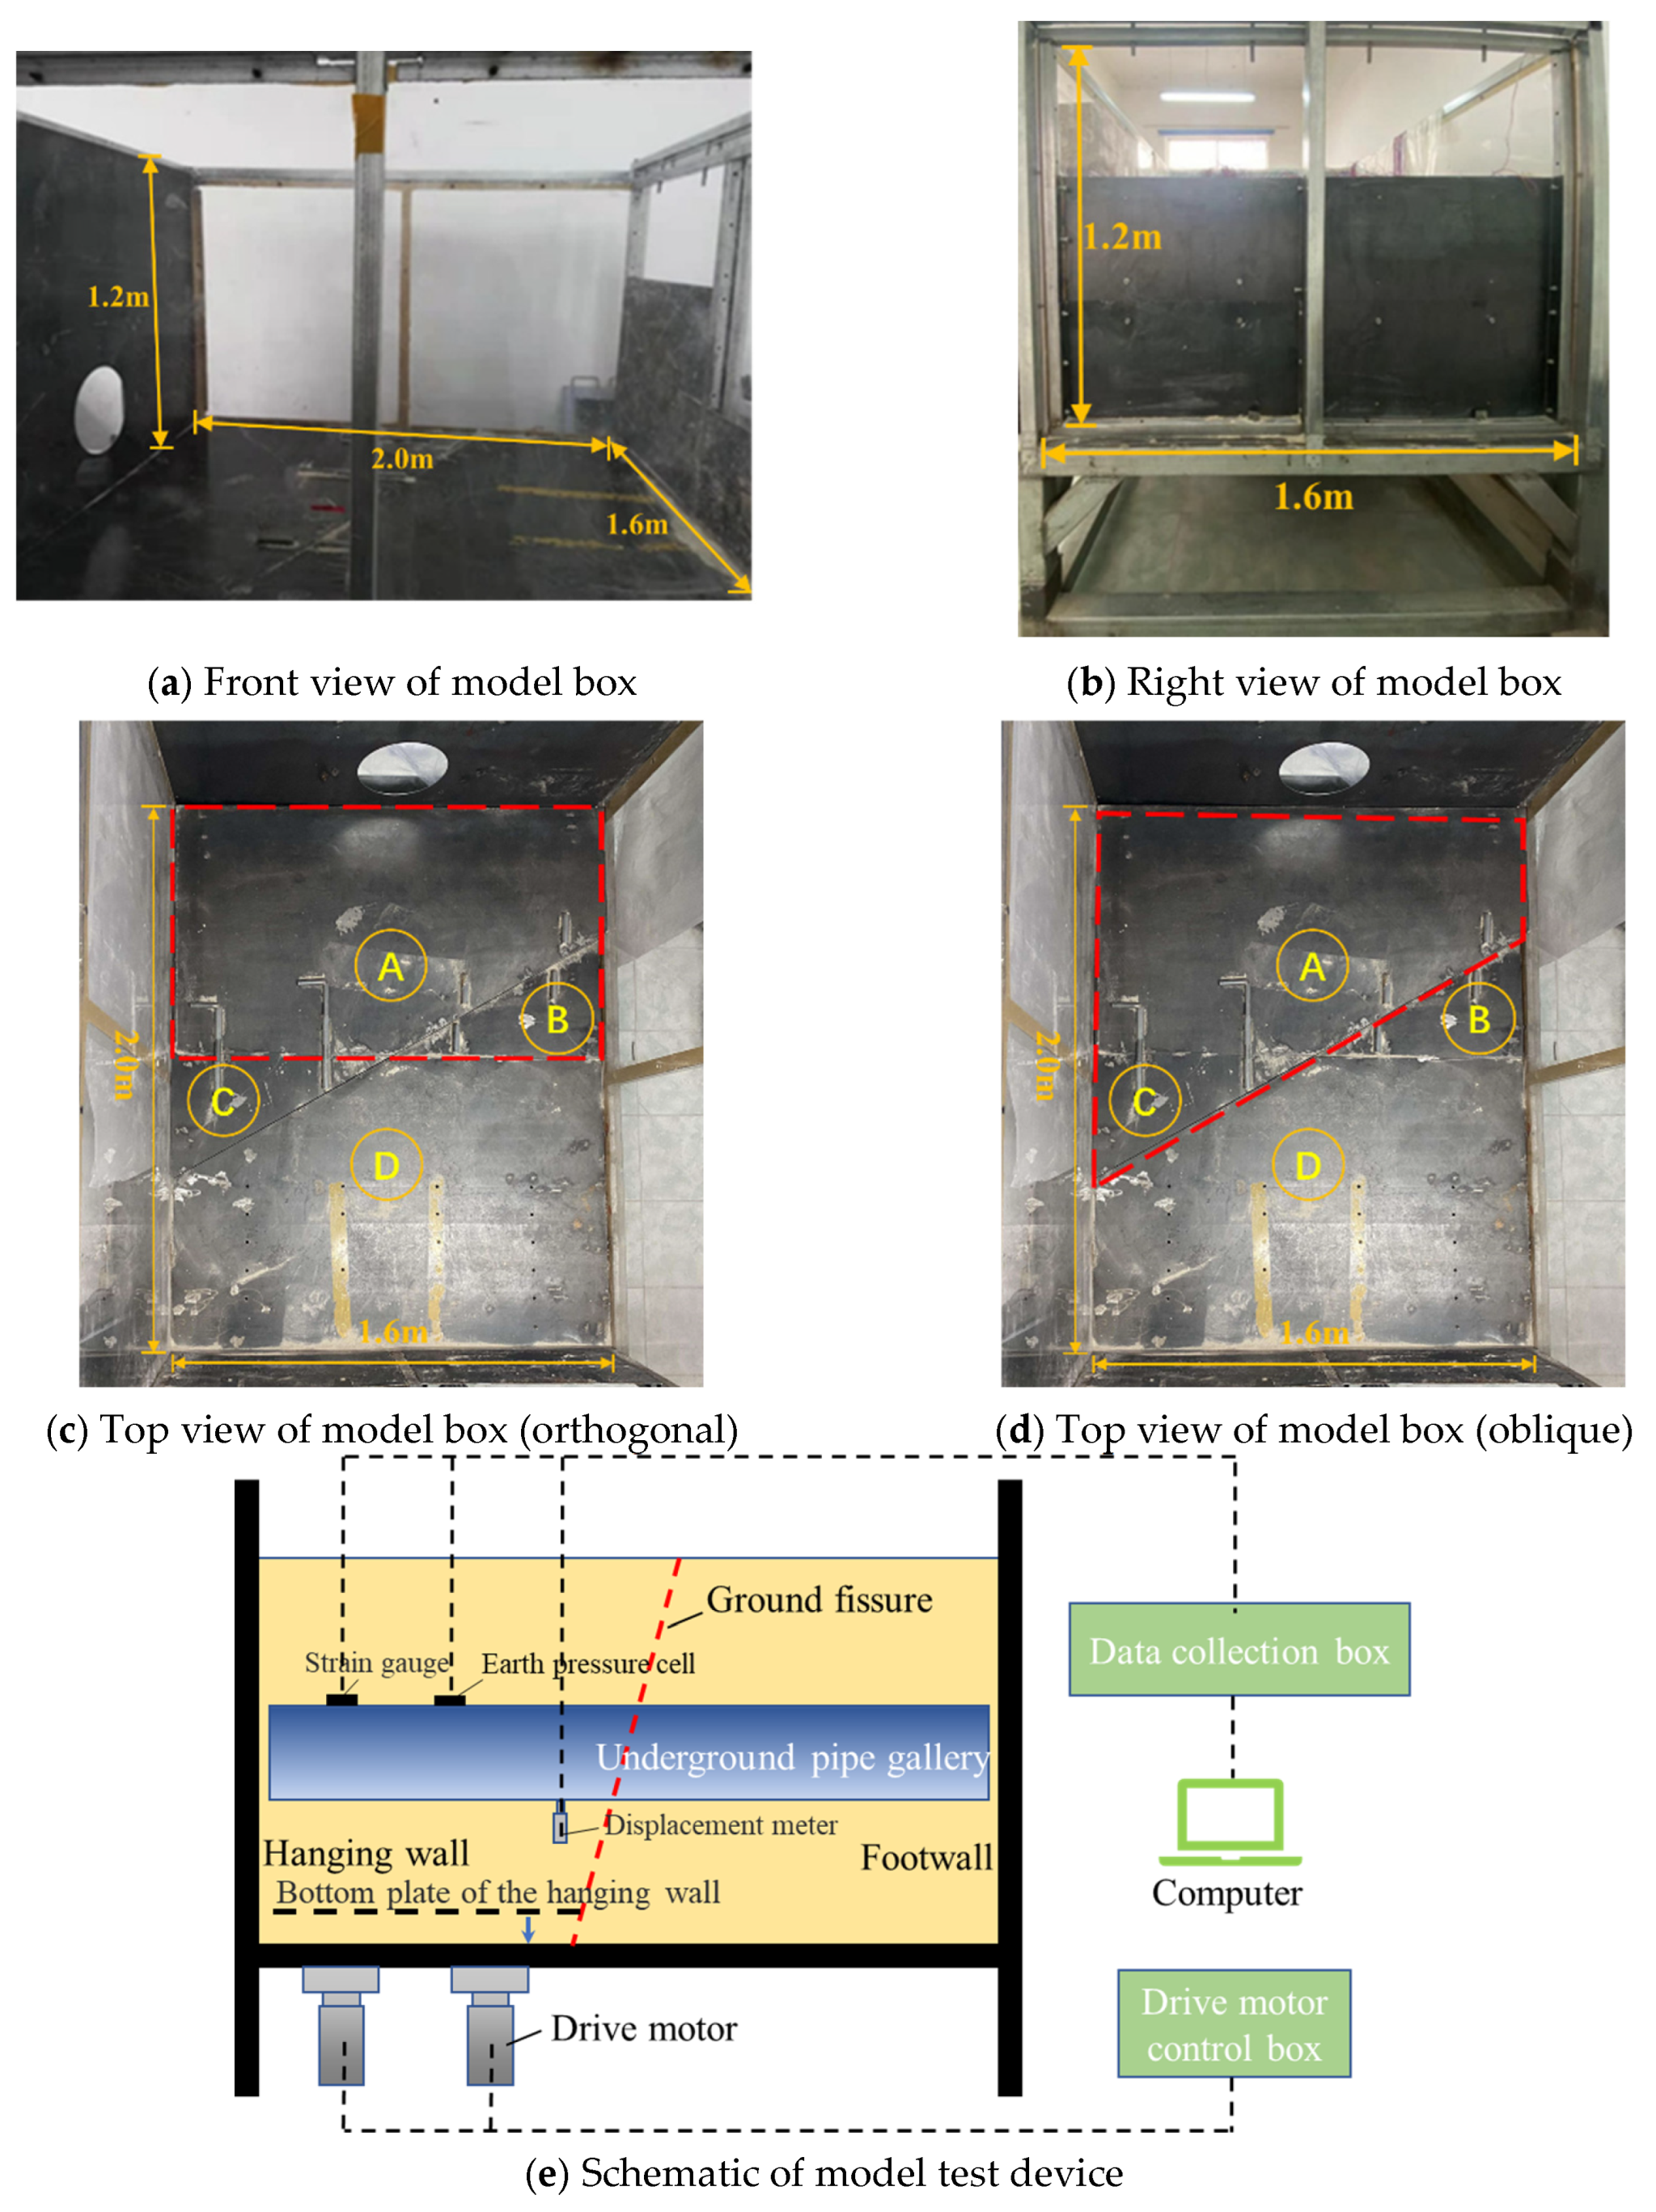
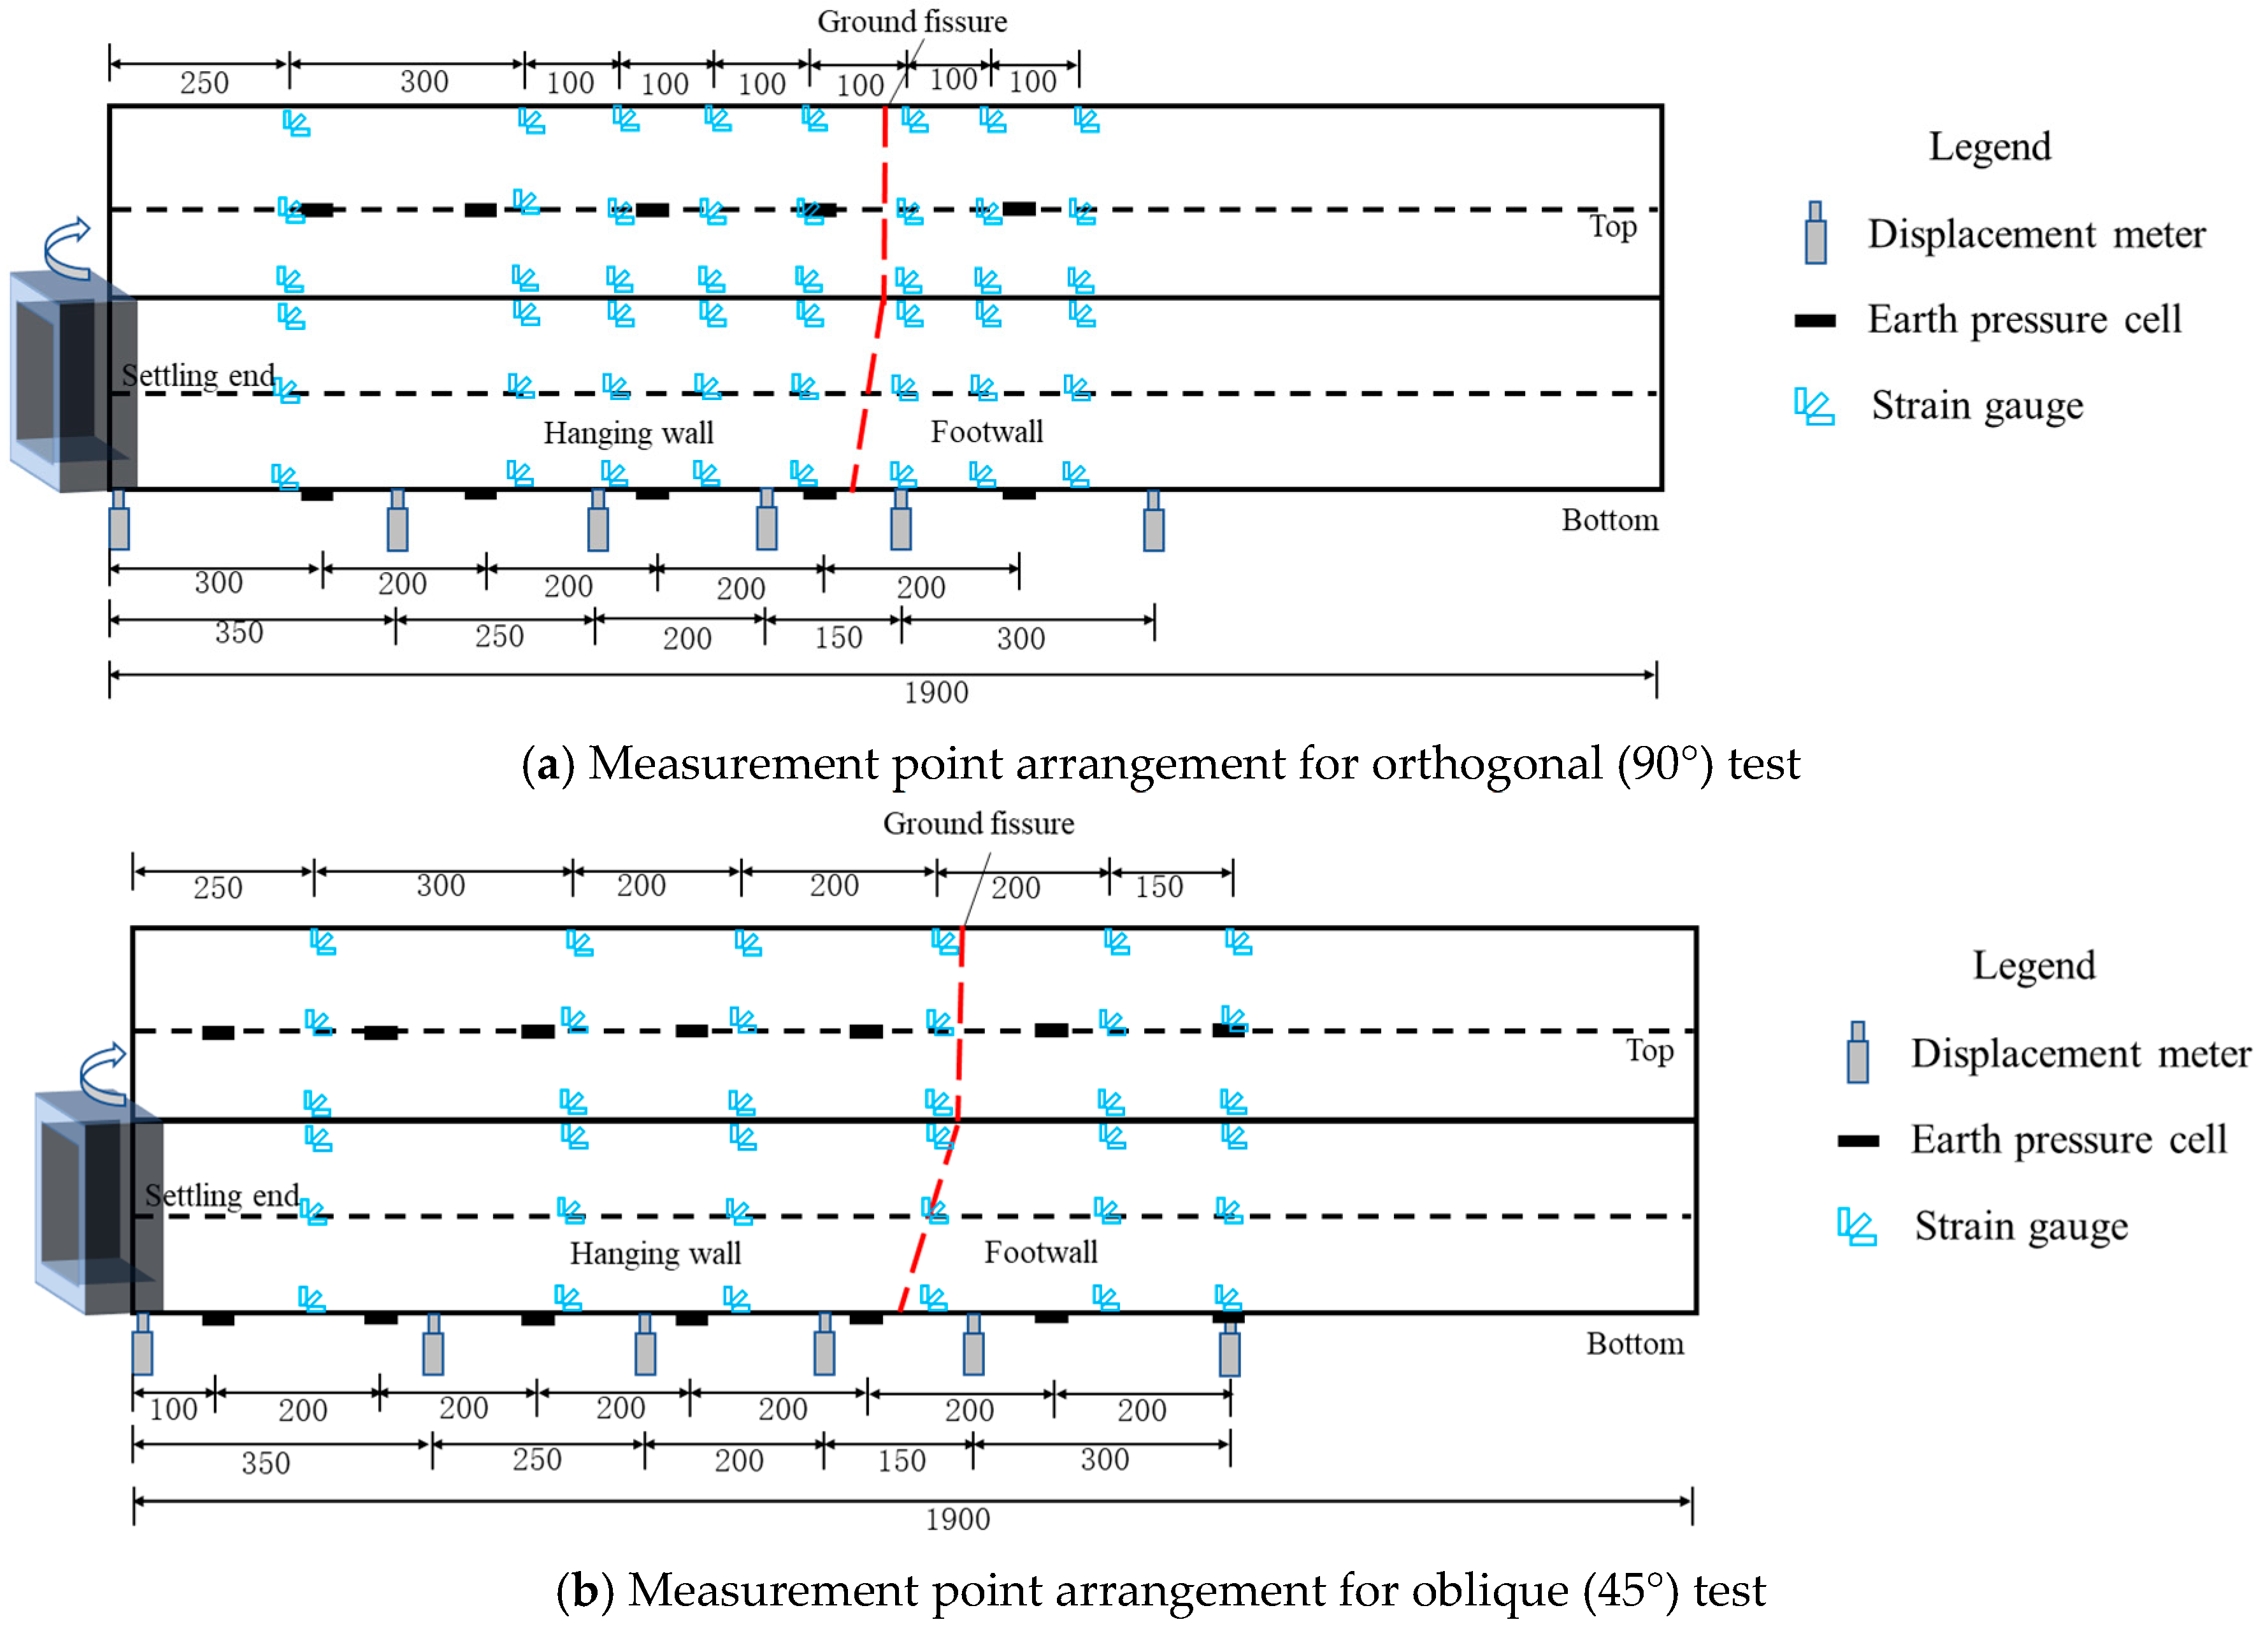
4.3. Sensor Layout and Loading Schemes

The model tests must measure the contact pressure, bottom displacement, and surface strain of the pipe gallery under two working conditions. The layout of the sensor used during the tests is shown in Figure 10.
The variation trends of the longitudinal stress and strain of the pipe gallery structure with an increase in displacement was monitored by arranging a row of strain gauges on the four sides of the structure. Owing to the symmetry of the orthogonal model test, the strain gauges were arranged only on one face of the side plate of the pipe gallery. Six displacement meters were arranged longitudinally along the central axis of the pipe gallery bottom to measure the hollowing out of the pipe gallery bottom. Micro-earth pressure boxes were laid along the top and bottom axes of the pipe gallery to measure the change in soil pressure during soil settlement.
Based on the maximum predicted number of ground fissures in Xi’an over 100 years, the expected design value of ground fissures in Xi’an within 100 years was set at 800 mm. The activity mode of ground fissures is creep. To simulate the ground fissure settlement reasonably, a graded settlement was adopted. Based on the geometric similarity ratio of 20, the dislocation of the ground fissures in the model test was determined to be 40 mm. In the test, the hanging wall plate was controlled to settle in incremental steps in a sequence of 5 mm, 10 mm, 15 mm, 20 mm, 25 mm, 30 mm, 35 mm, and 40 mm, with a settling speed of 5 mm/d. After each settlement, we allowed it to stand for 24 h, recorded the data every 8 h until the data no longer changed, and then started the next settlement process.

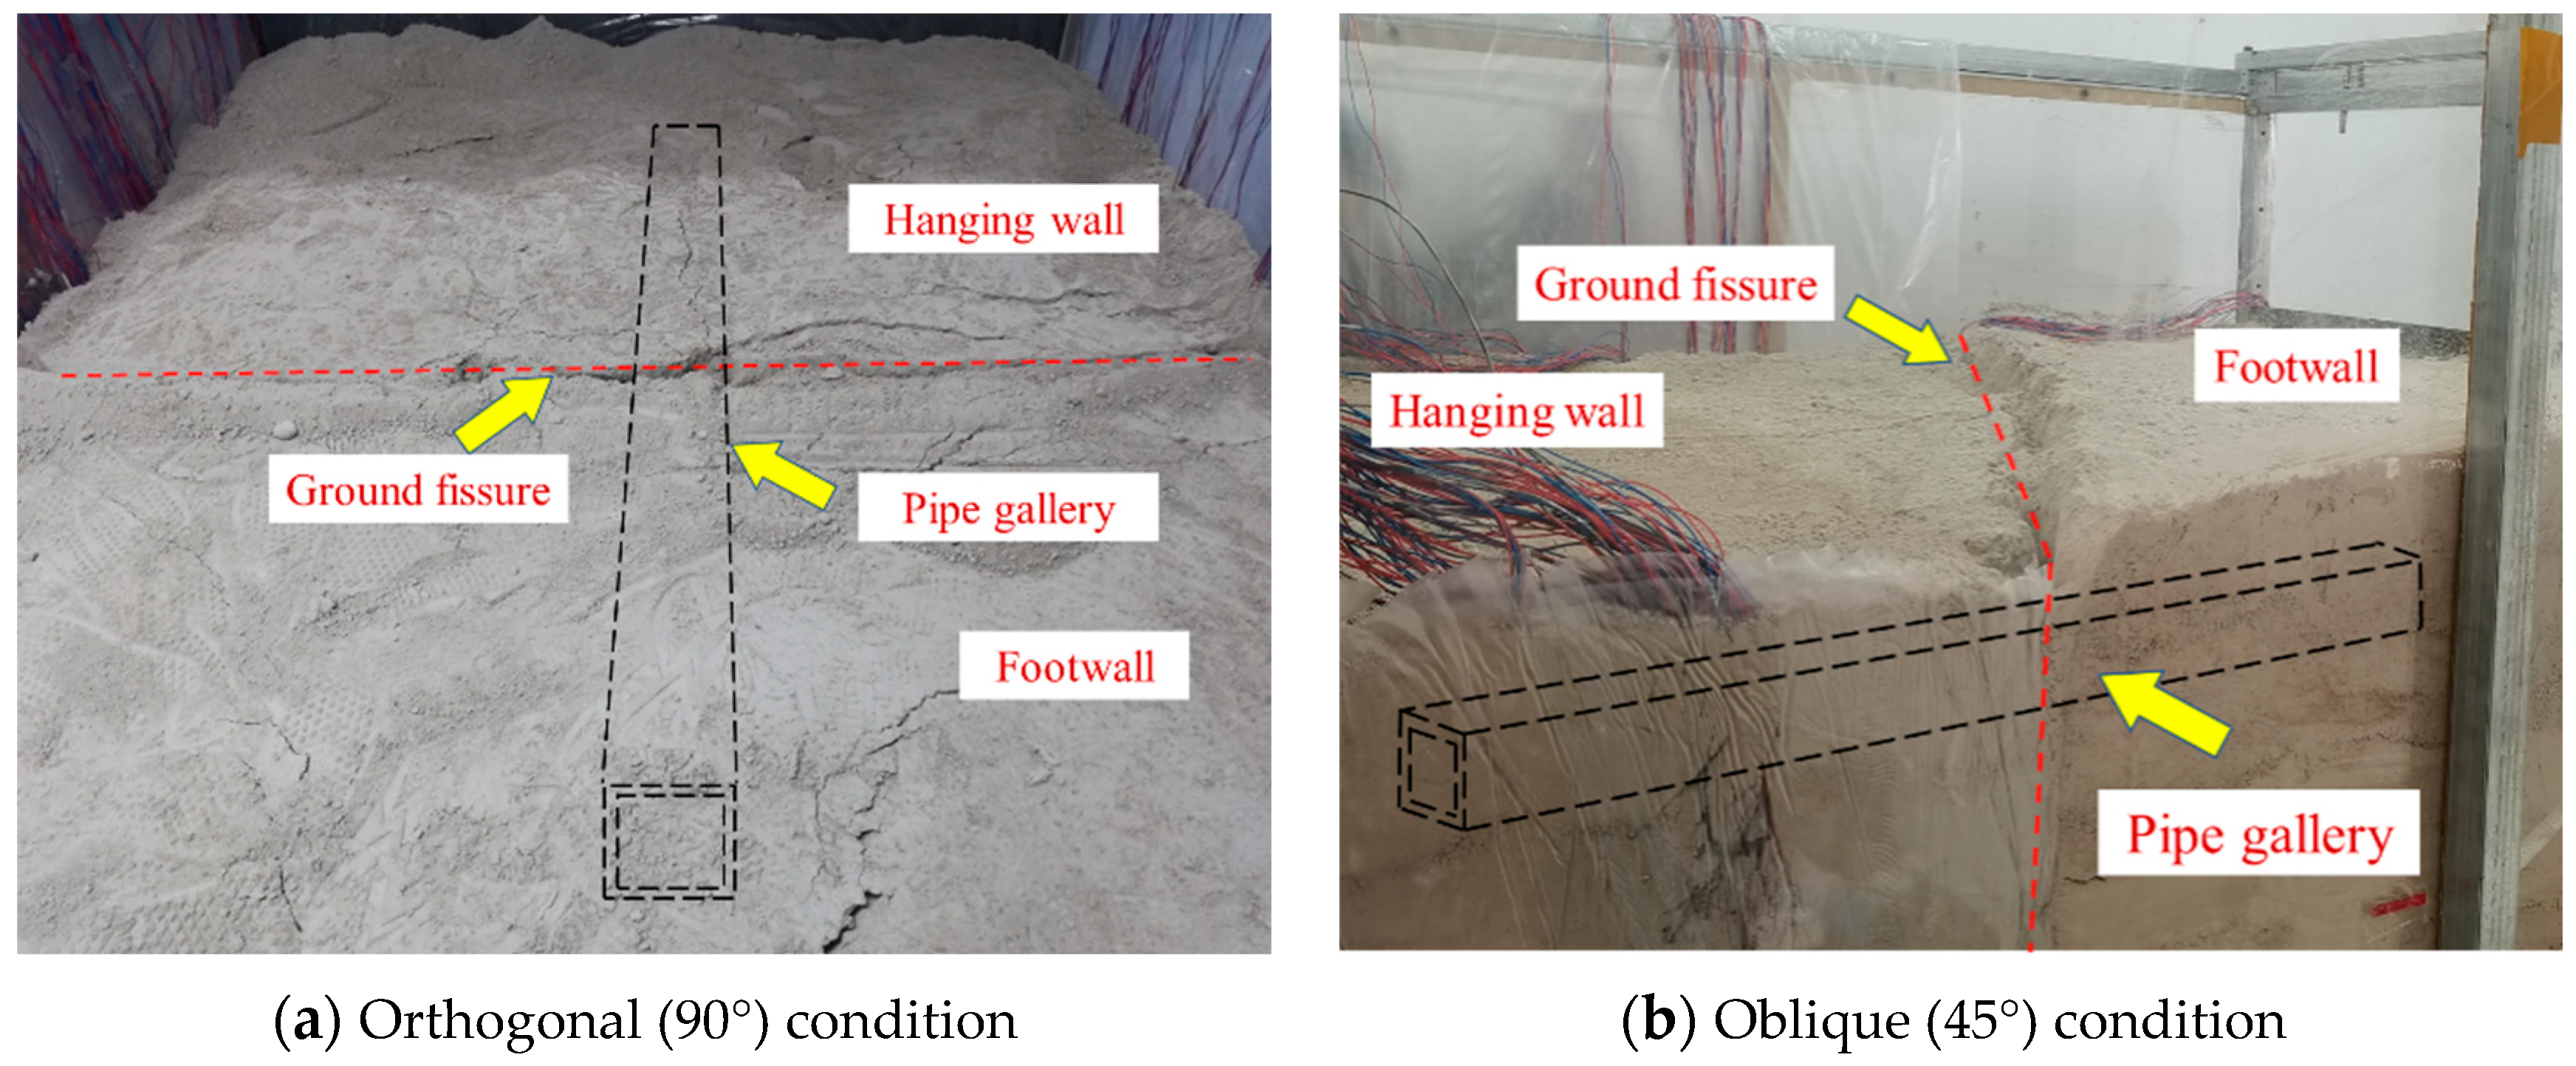
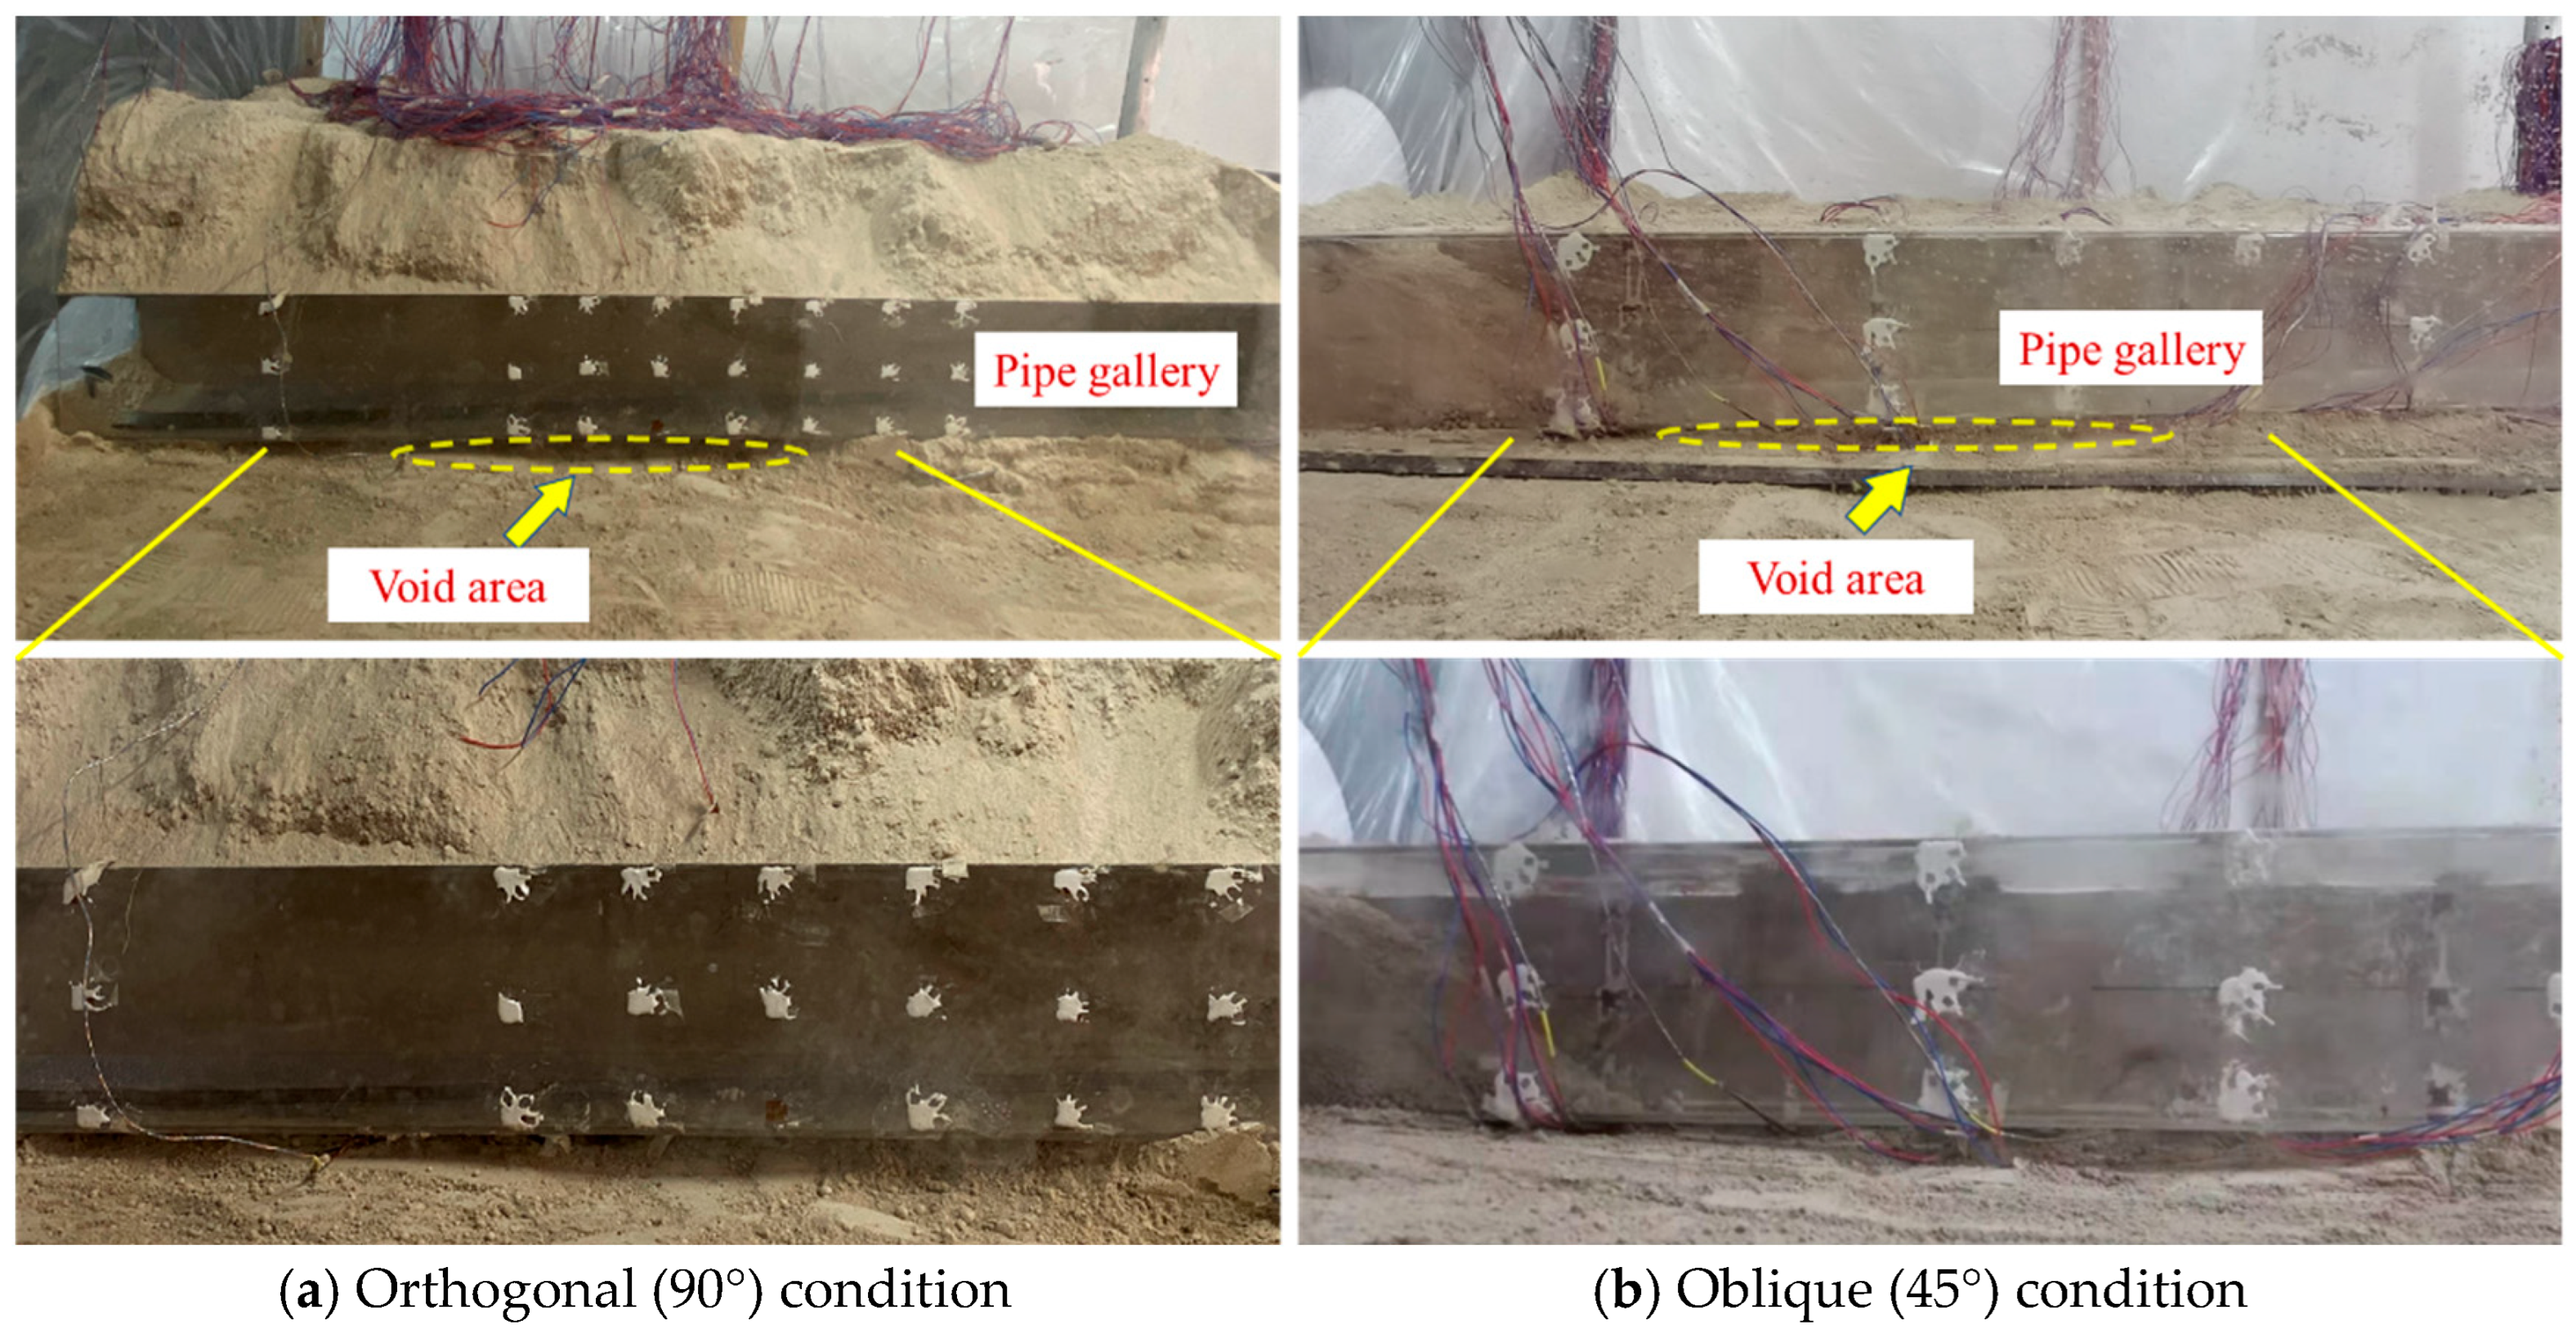
4.4. Test Phenomenon

Figure 11 shows the macroscopic phenomenon of the model soil after the test. Prior to the test, the soil surface in the model box was flat. With the subsidence process of the hanging wall and floor of the model box, the hanging wall soil sank along the ground fissure, resulting in a height difference with the footwall soil. After soil excavation, it was found that owing to the disharmony between the pipe gallery structure and soil deformation, bottom voids appeared under both orthogonal and oblique working conditions. The bottom void ranges of the pipe gallery structure were determined to be 0.6 m and 0.7 m under the orthogonal and oblique conditions, respectively. The maximum void displacement occurred near the ground fissure, and the footwall of the pipe gallery remained in contact with the foundation, as shown in Figure 12.

5. Analysis of Test Results

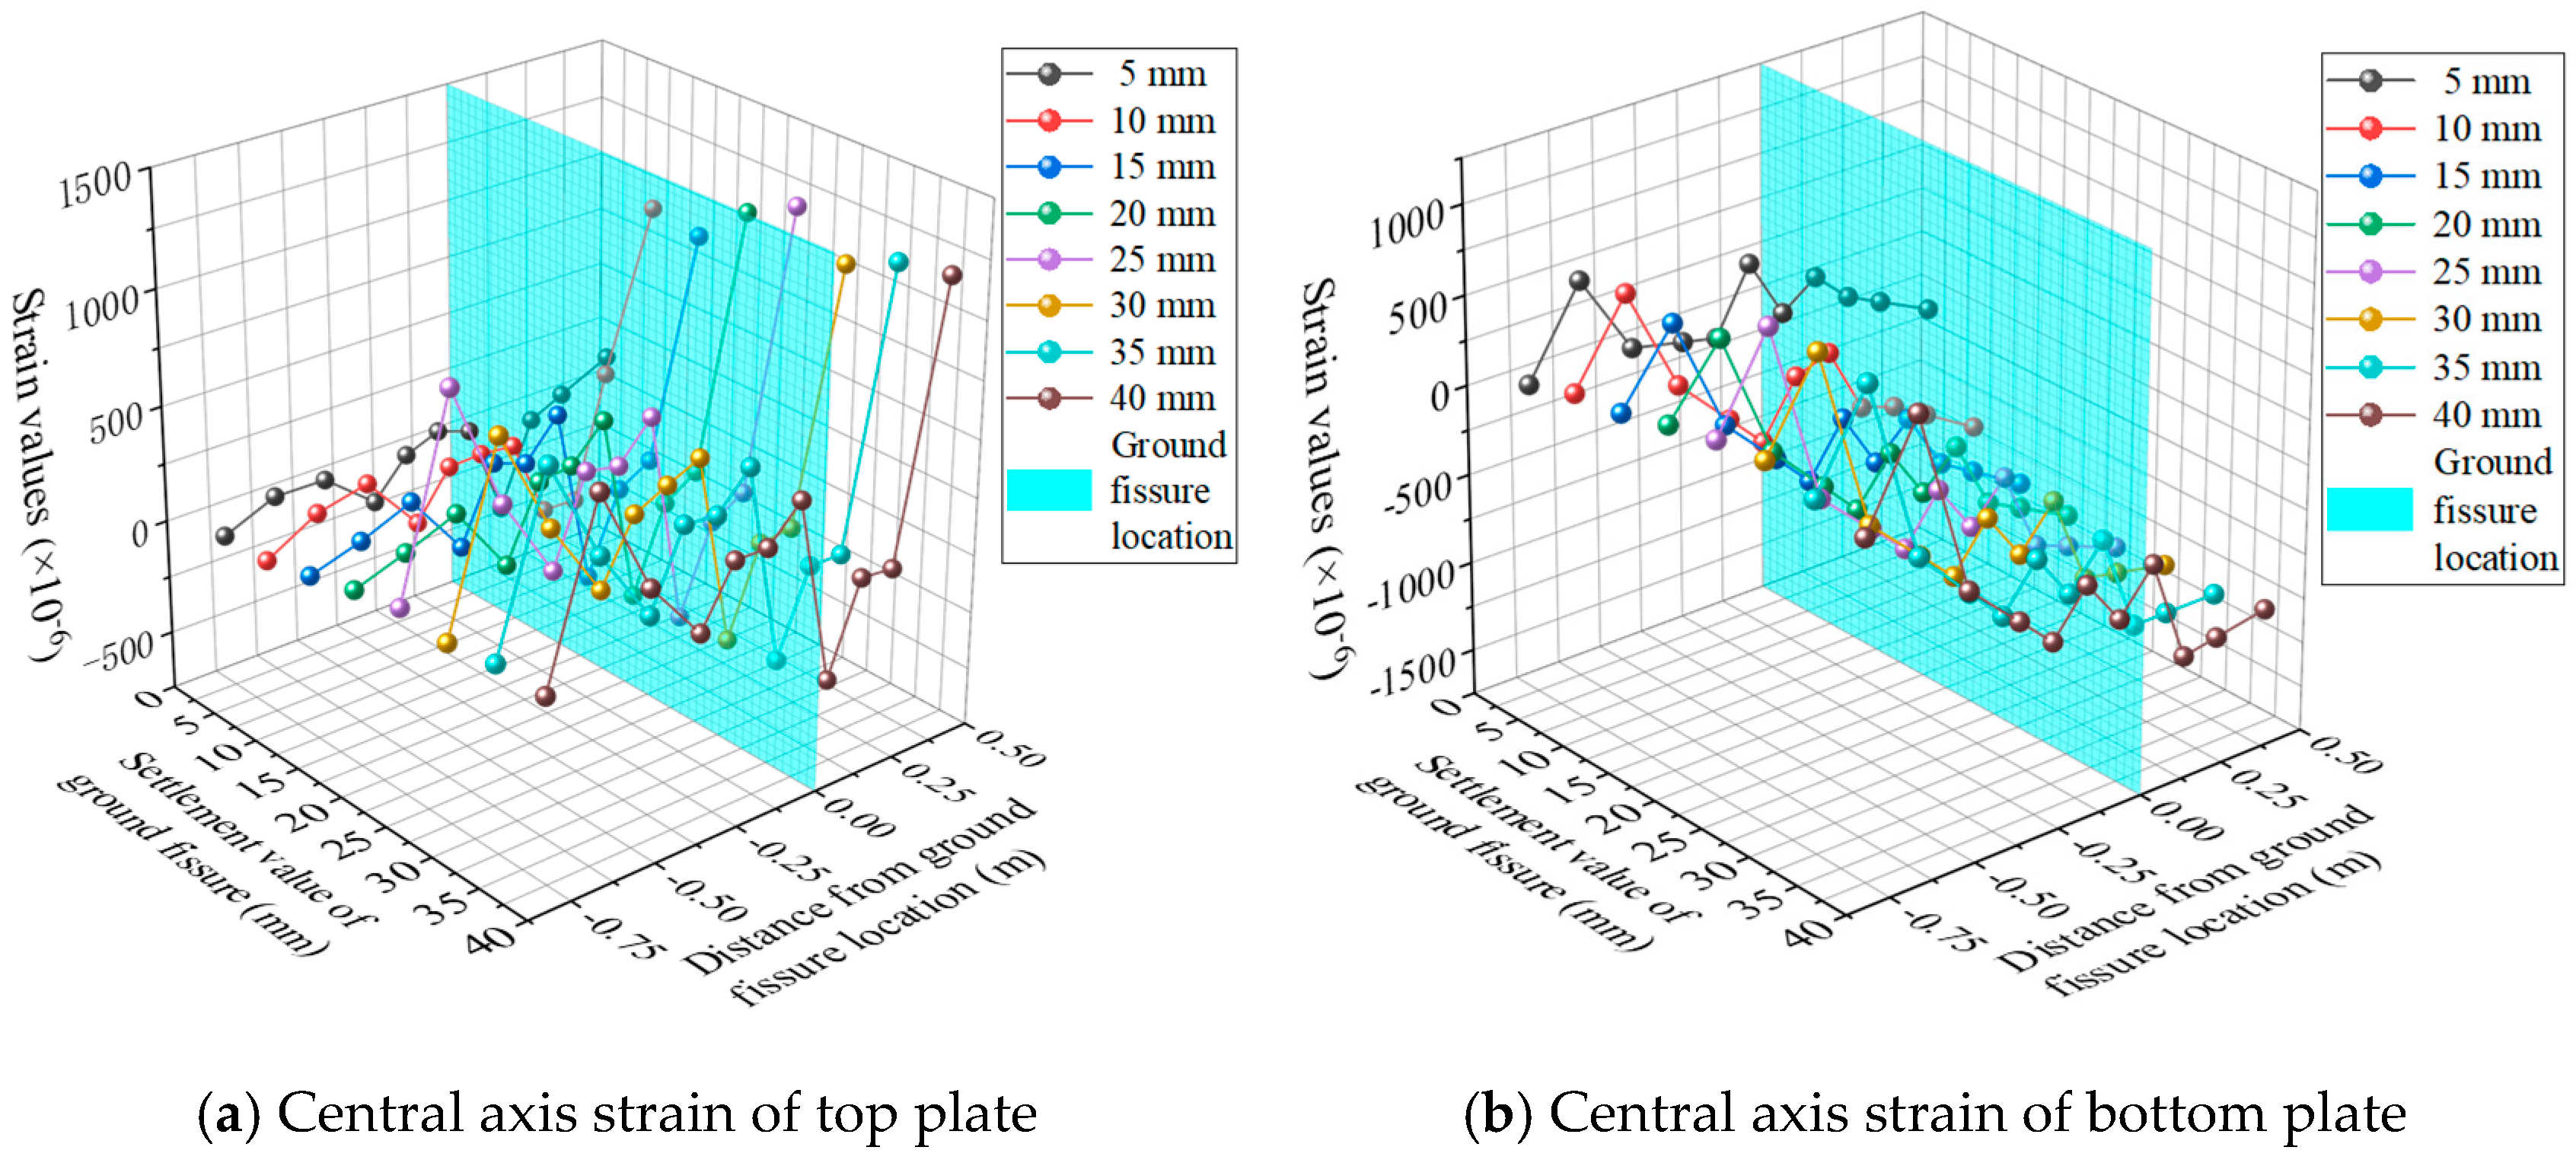
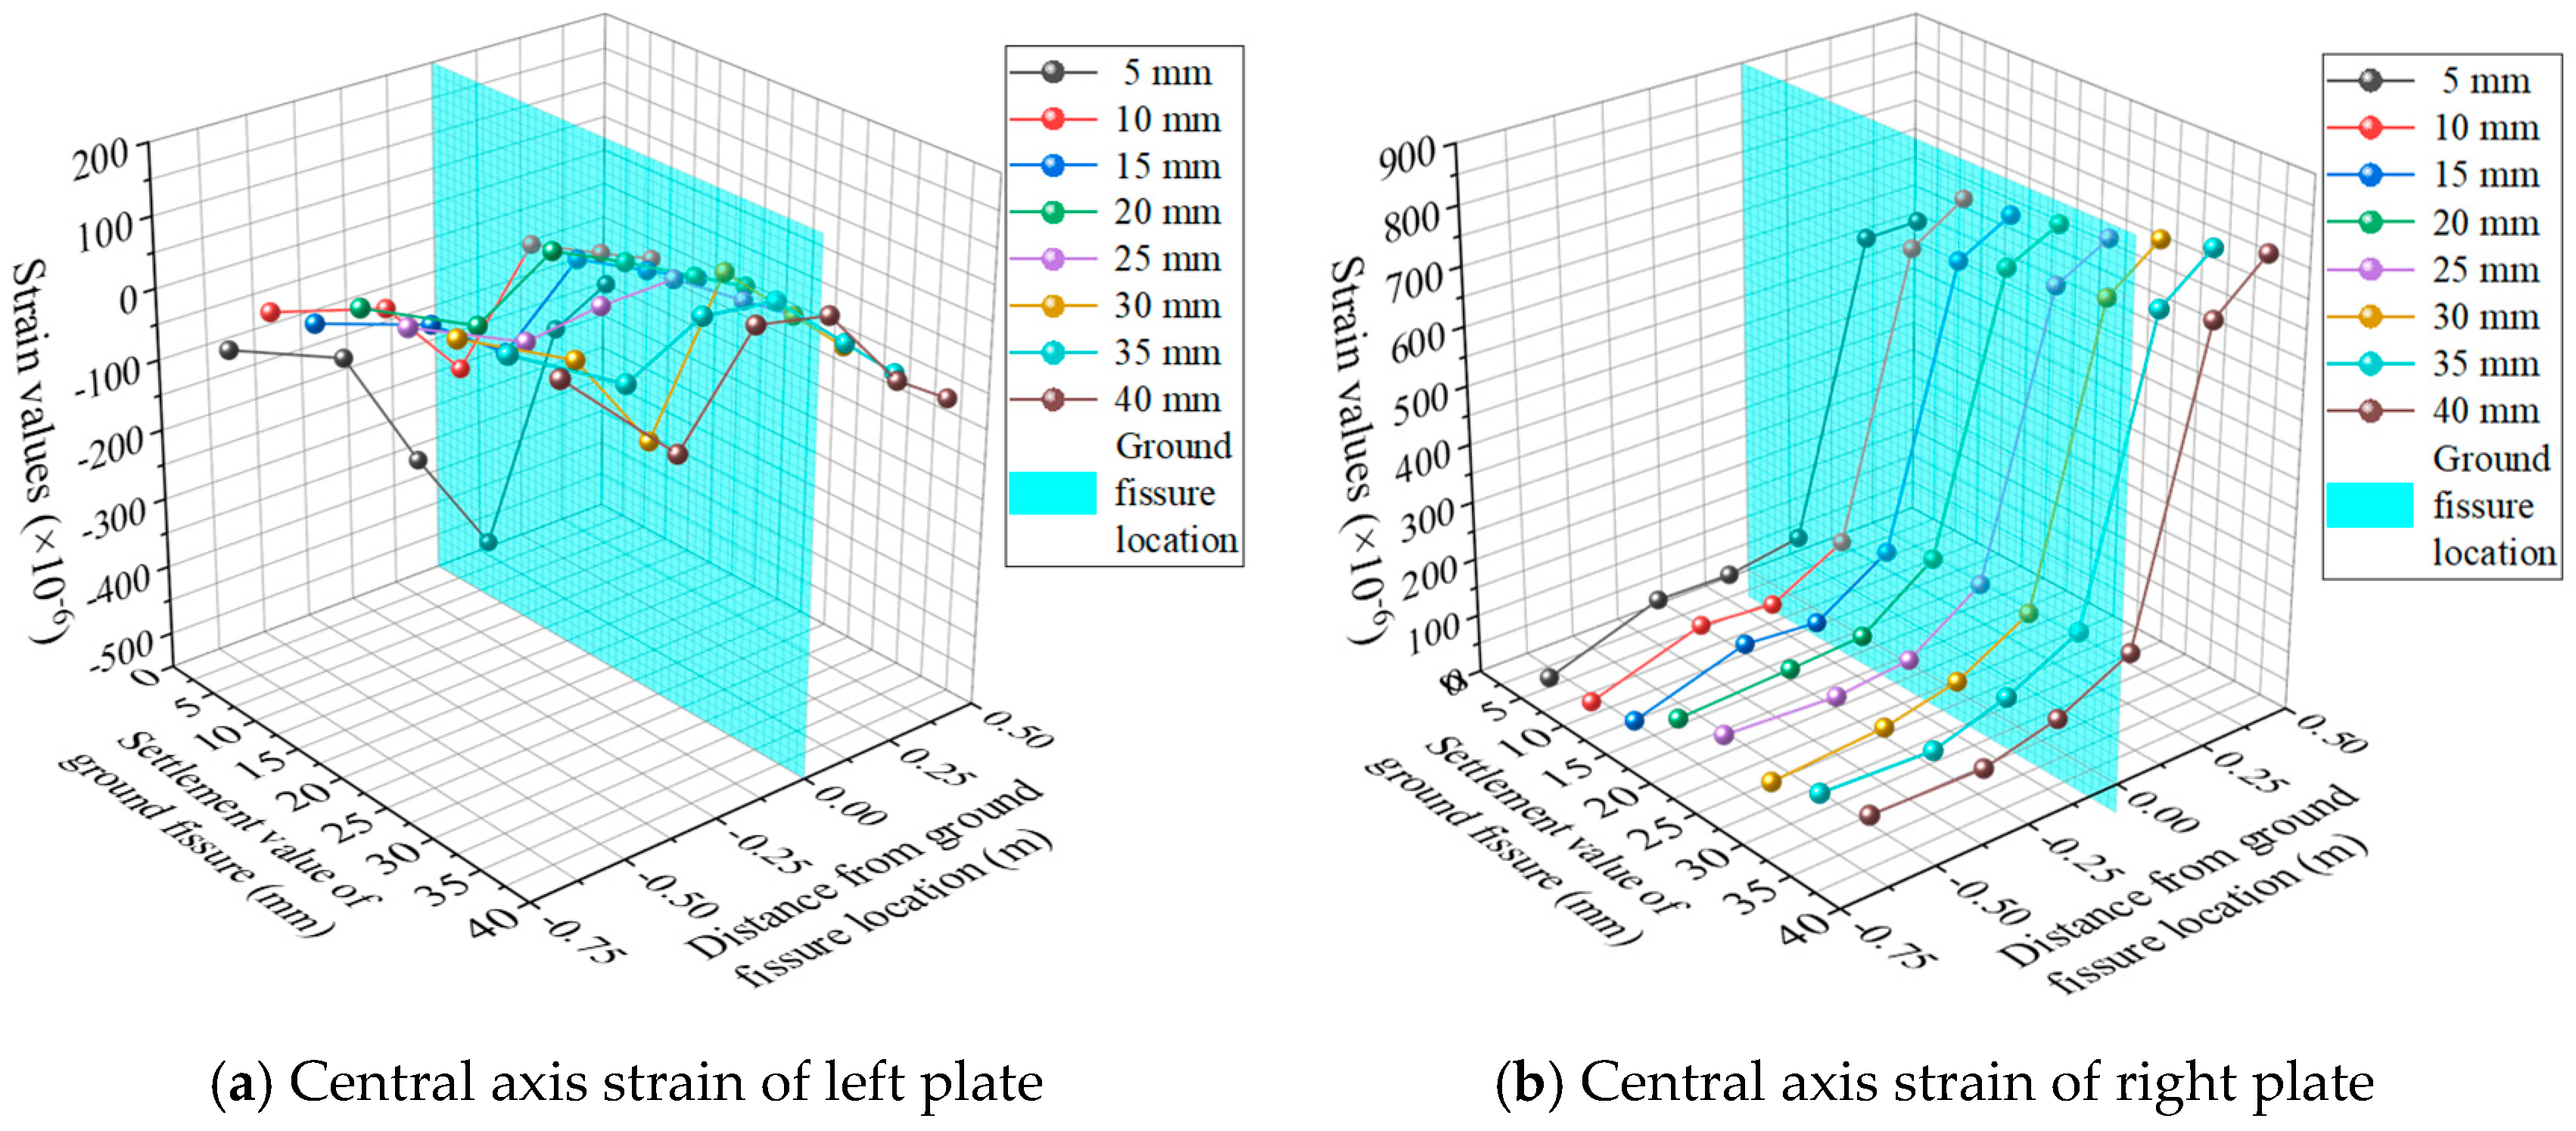
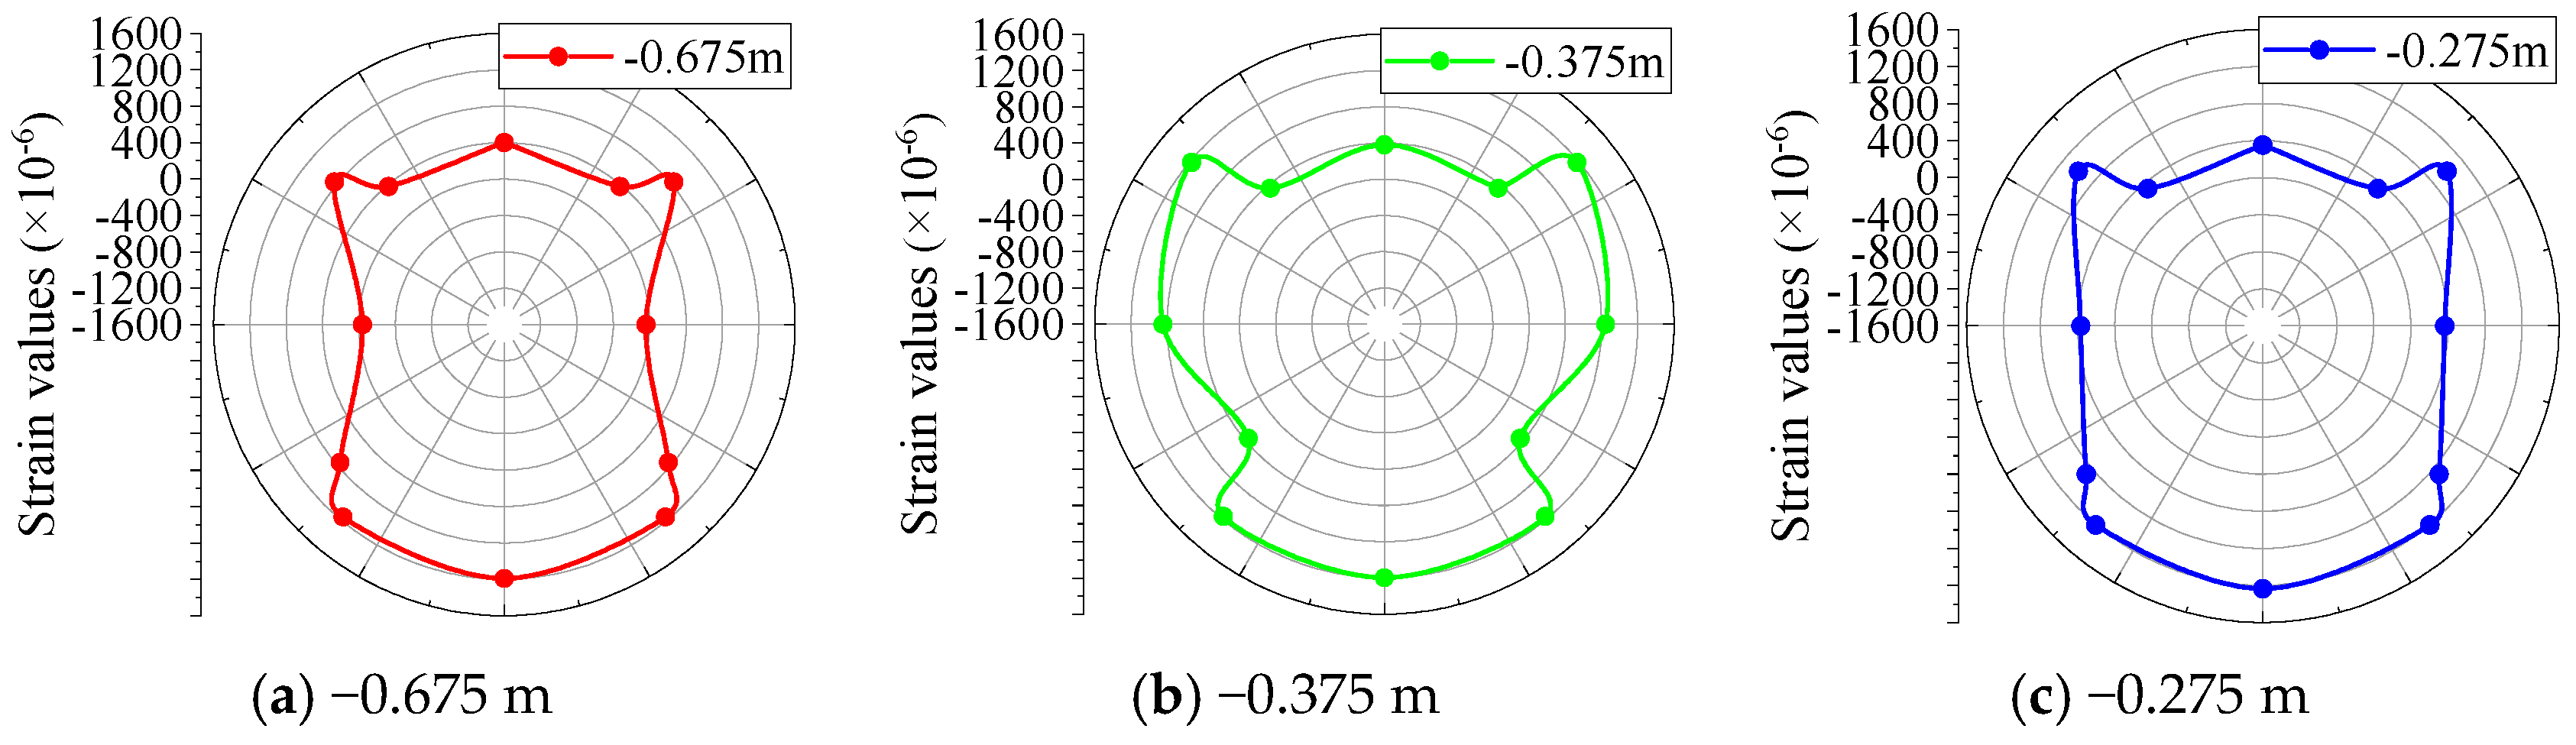
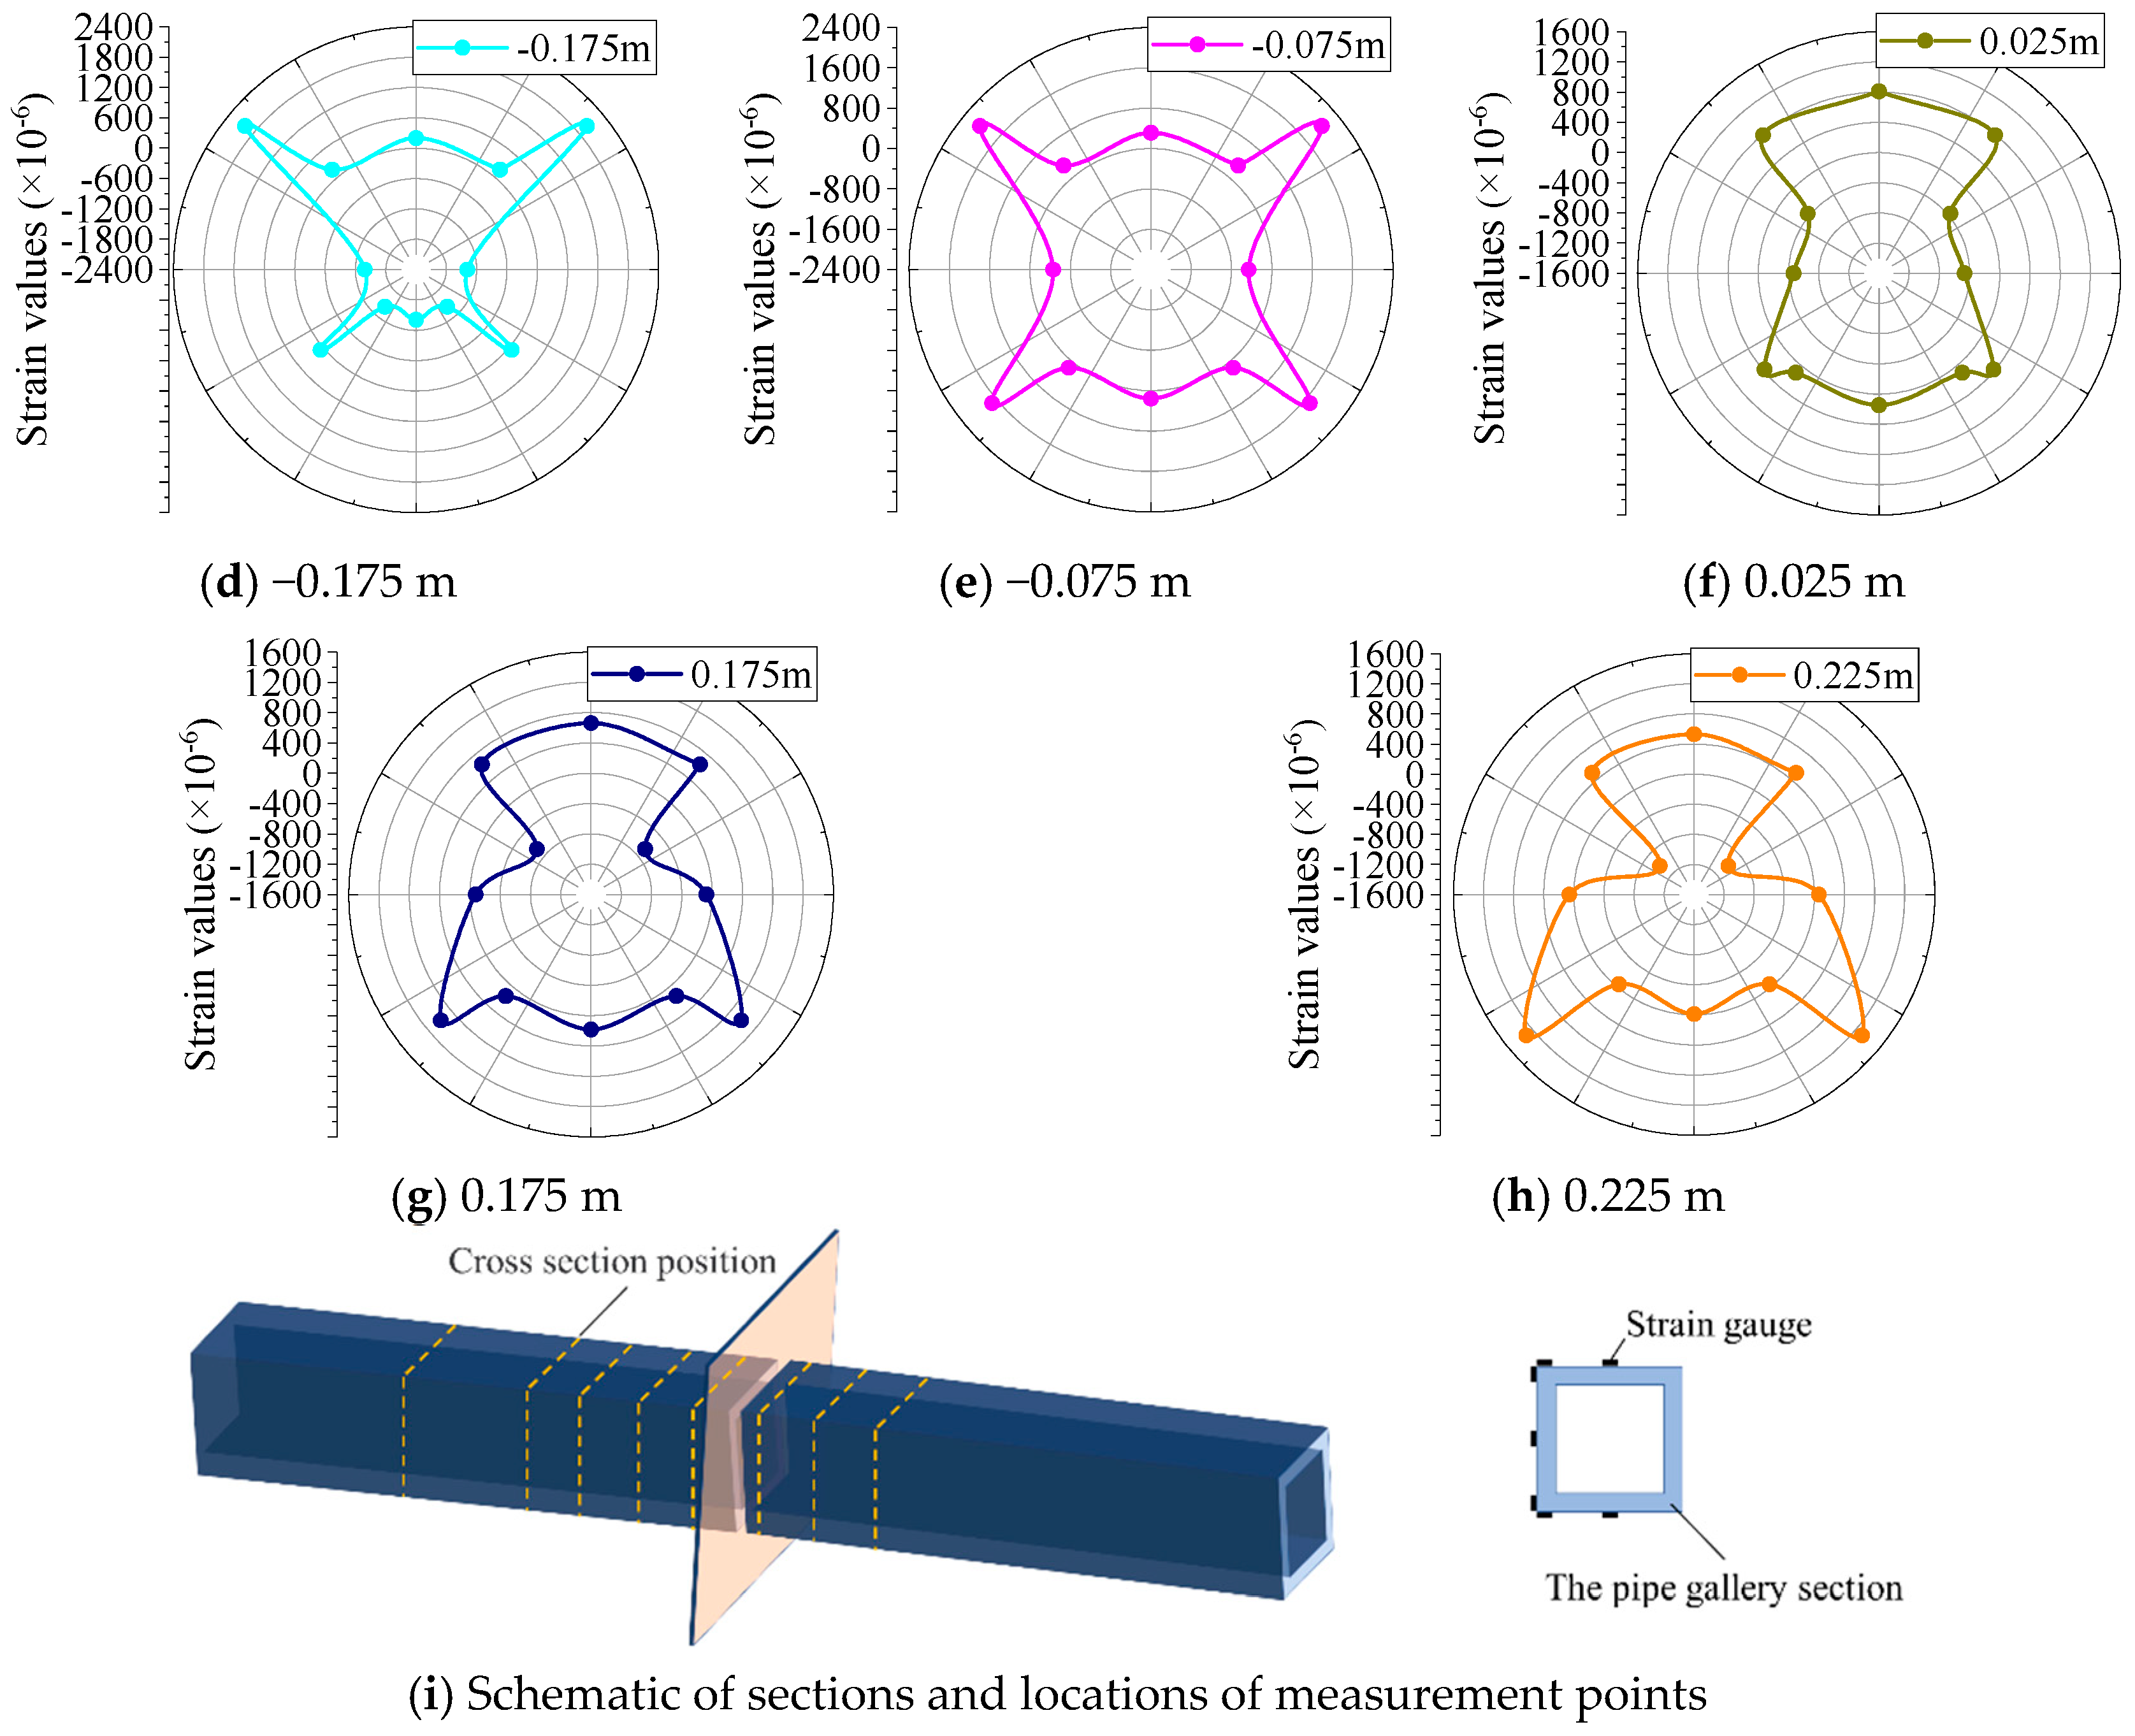
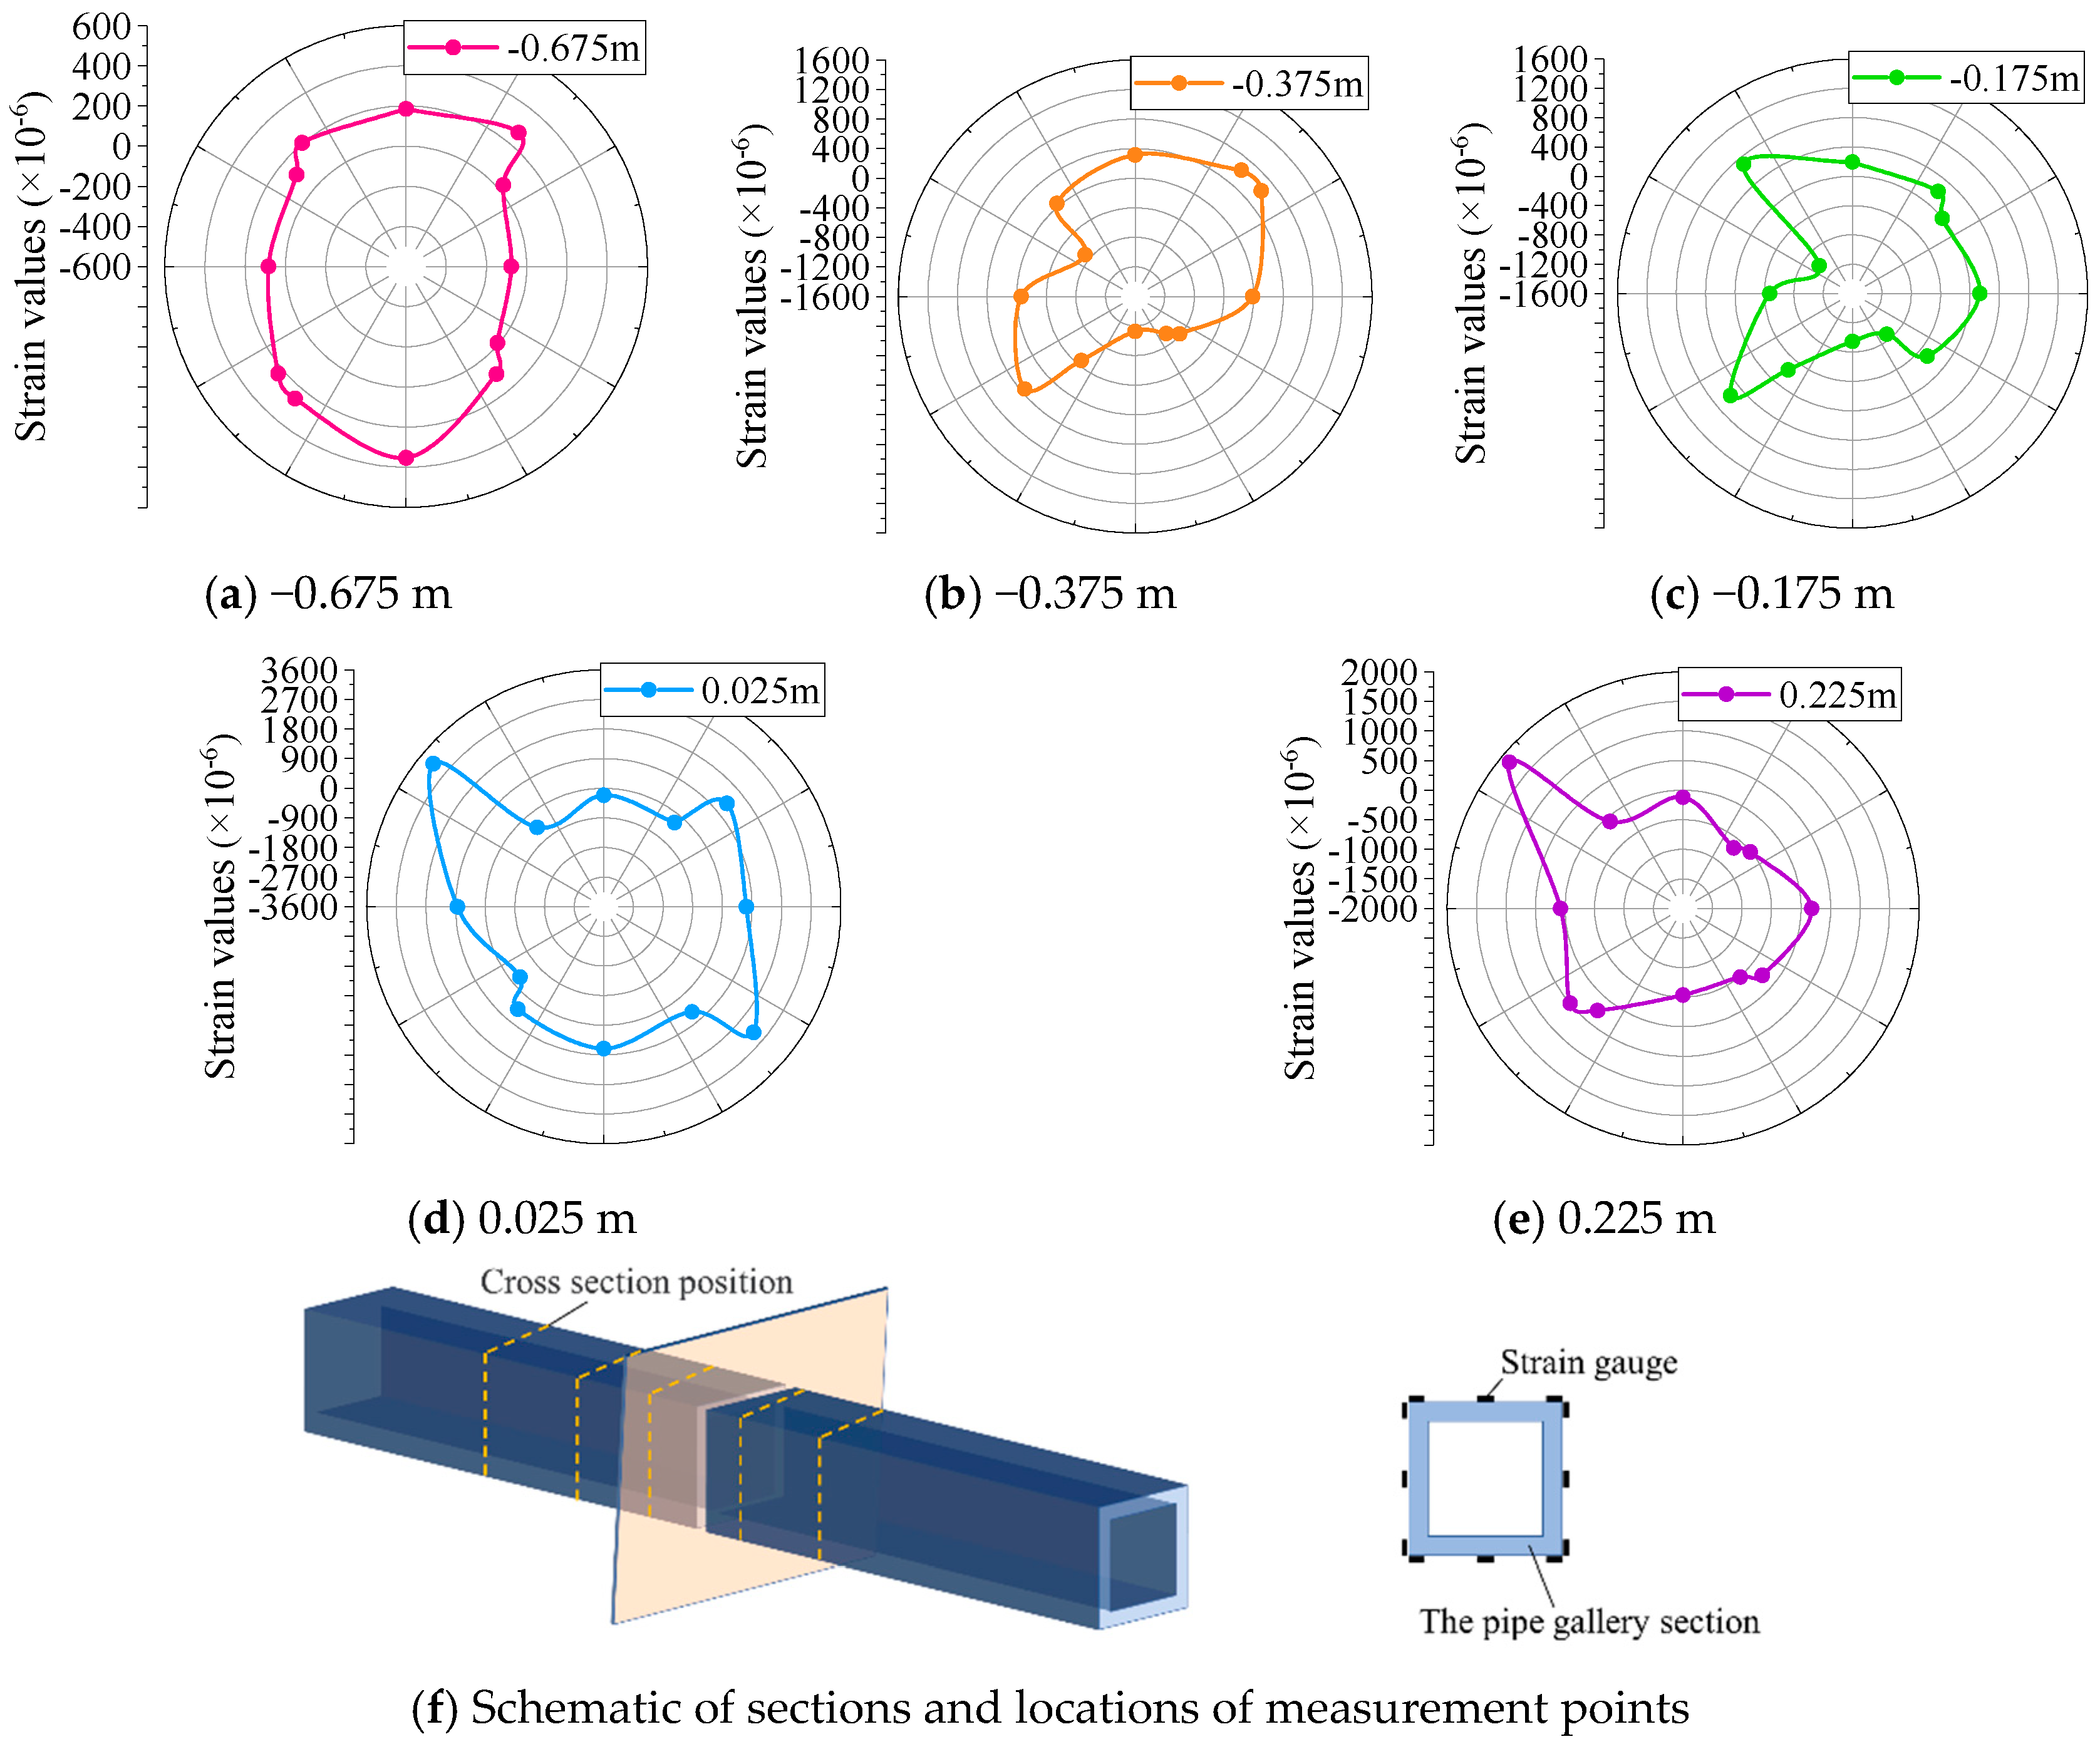
5.1. Structural Strain of Pipe Gallery

(1) Longitudinal strain analysis
Figure 13 and Figure 14 show the longitudinal strain curves of the top and bottom plates of the pipe gallery structure under different ground fissure displacements. As observed from the data shown in the figure, under the two conditions, the top plate of the pipe gallery was under tension. When the dislocation moment of the hanging wall was between 5 mm and 25 mm (that of the actual prototype was between 10 cm and 50 cm), the strain of the pipe gallery considerably increased. When the dislocation moment of the hanging wall exceeded 25 mm (that of the actual prototype was 50 cm), the strain change in the pipe gallery tended to be stable. The bottom plate of the pipe gallery was under pressure in the footwall area, whereas it was under pressure near the ground fissure in the hanging wall area and under tension far from the ground fissure. The relationship between the strains of the bottom plate and settlement was the same as that of the roof of the pipe gallery. Under the orthogonal condition, the strain of the pipe gallery increased most obviously at a hanging wall position that was 0.175 m (0.875 L, where L is the length of the bottom edge of the pipe gallery) away from the ground fissure. However, under the oblique condition, the obvious strain changes were mostly distributed near the ground fissure and at a footwall position that was 0.375 m (1.875 L) away from the ground fissure.
Owing to the dislocation of the hanging wall, the stress on the side plate of the pipe gallery became complicated; the footwall of the side plate was under compression, and the hanging wall was under both tension and compression. Because the stresses on the left- and right-side plates were symmetrical under the orthogonal condition, the strain on the side plate under the oblique condition was mainly analyzed here. The longitudinal strain curves along the central axis of the left- and right-side plates of the pipe gallery under the oblique condition are shown in Figure 15. As observed from the figure, the asymmetry of the left- and right-side plates of the pipe gallery is obvious, which indicates that both longitudinal bending and torsional deformation exist in the pipe gallery structure under the oblique condition. By comparing the strains on the top and bottom plates of the pipe gallery structure, it can be observed that the strains on the left- and right-side plates were significantly smaller than those on the top and bottom plates. This indicates that the bottom void of the pipe gallery structure had less influence on the left- and right-side plates than on the top and bottom plates. Therefore, the strengths of the top and bottom plates of the pipe gallery structure should be improved in practical engineering applications.
(2) Transverse strain analysis
Figure 16 and Figure 17 show the circumferential cross-sectional strain values of the pipe gallery at different positions from the ground fissure when the dislocation of the hanging wall reaches 40 mm. Because the stresses on the left- and right-side plates are symmetrical under the orthogonal condition, only the strain on the left side of the cross section was measured, and the strain on the right side was obtained according to the symmetry of the left side. From all the transverse strains of the pipe gallery structure, under the orthogonal condition, the top plate of the pipe gallery structure was under tension, the hanging wall of the bottom plate was under tension, and some footwall areas were under compression. The strain on the hanging wall was smaller than that on the footwall. Under the oblique condition, the top plate of the pipe gallery was under tension, the footwall was under compression, the bottom plate was under tension, and some hanging wall areas were under compression. Under ground fissure dislocation, the tensile and compressive properties of the side plates of the pipe gallery structure changed significantly; the hanging wall structure was mainly under tension, and the footwall was under compression. Under the oblique condition, the left- and right-side plates of the pipe gallery structure were subjected to torsion, which caused the tensile and compressive properties of the side plates of the pipe gallery structure to show obvious differences in the same section. The stress on the section of the structure was asymmetric, which indicates that the structure was subjected to torsional shear force the under oblique condition.

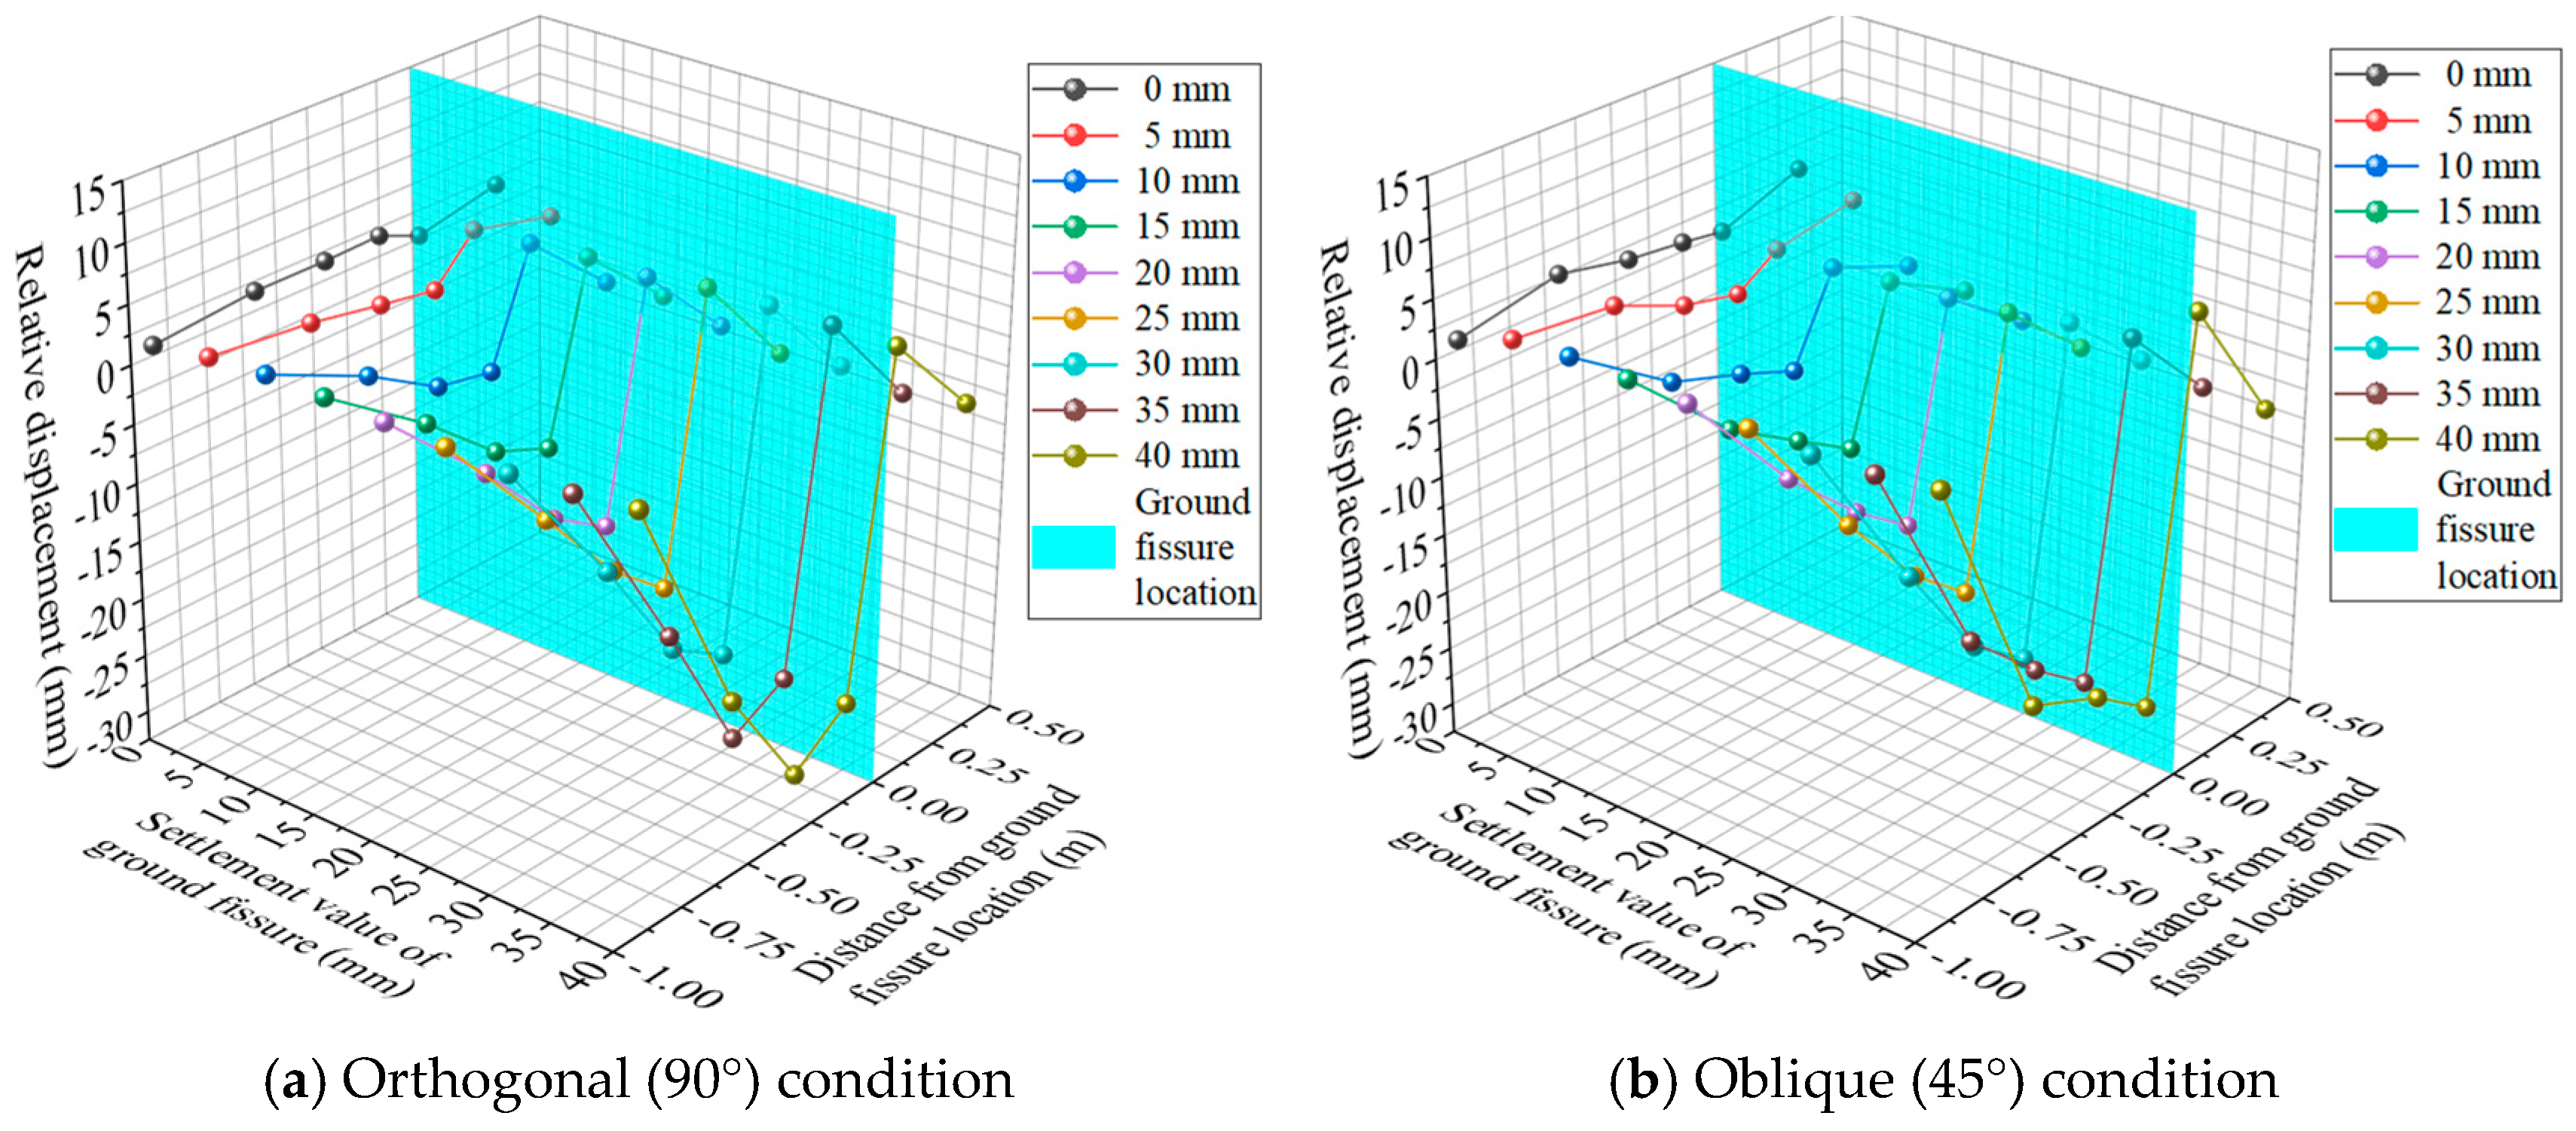
5.2. Displacement Analysis of Pipe Gallery’s Bottom

Figure 18a,b show the relative displacement diagrams between the bottom of the pipe gallery structure and the foundation soil under the orthogonal and oblique conditions, respectively. As observed from the figure, when the hanging wall at the ground fissure started to sink, the pipe gallery structure exhibited a small positive displacement under both conditions. Furthermore, the displacement of the pipe gallery structure at the edge of the ground fissure suddenly changed, indicating that the pipe gallery structure was squeezed by ground fissure dislocation. With an increase in the hanging wall dislocation, the vertical relative displacement between the bottom of the pipe gallery structure and the base near the ground fissures in the hanging wall area gradually increased, which directly reflects the occurrence of the void phenomenon at the bottom of the pipe gallery structure. Simultaneously, the phenomenon of increasing vertical relative displacement gradually extended in the direction of the hanging wall, away from the ground fissures, indicating that the range of the bottom void gradually increased. When the dislocation reached 35 mm, the bottom void was completely developed under both conditions, and it ranged between −0.575 and 0 m (between −2.875 and 0 L). Moreover, the displacement between the bottom and base of the pipe gallery structure did not increase subsequently. The variation law of the relative displacement between the bottom and base of the pipe gallery structure under the oblique condition was the same as that under the orthogonal condition, but the relative displacement at the same position was larger than that under the orthogonal condition.

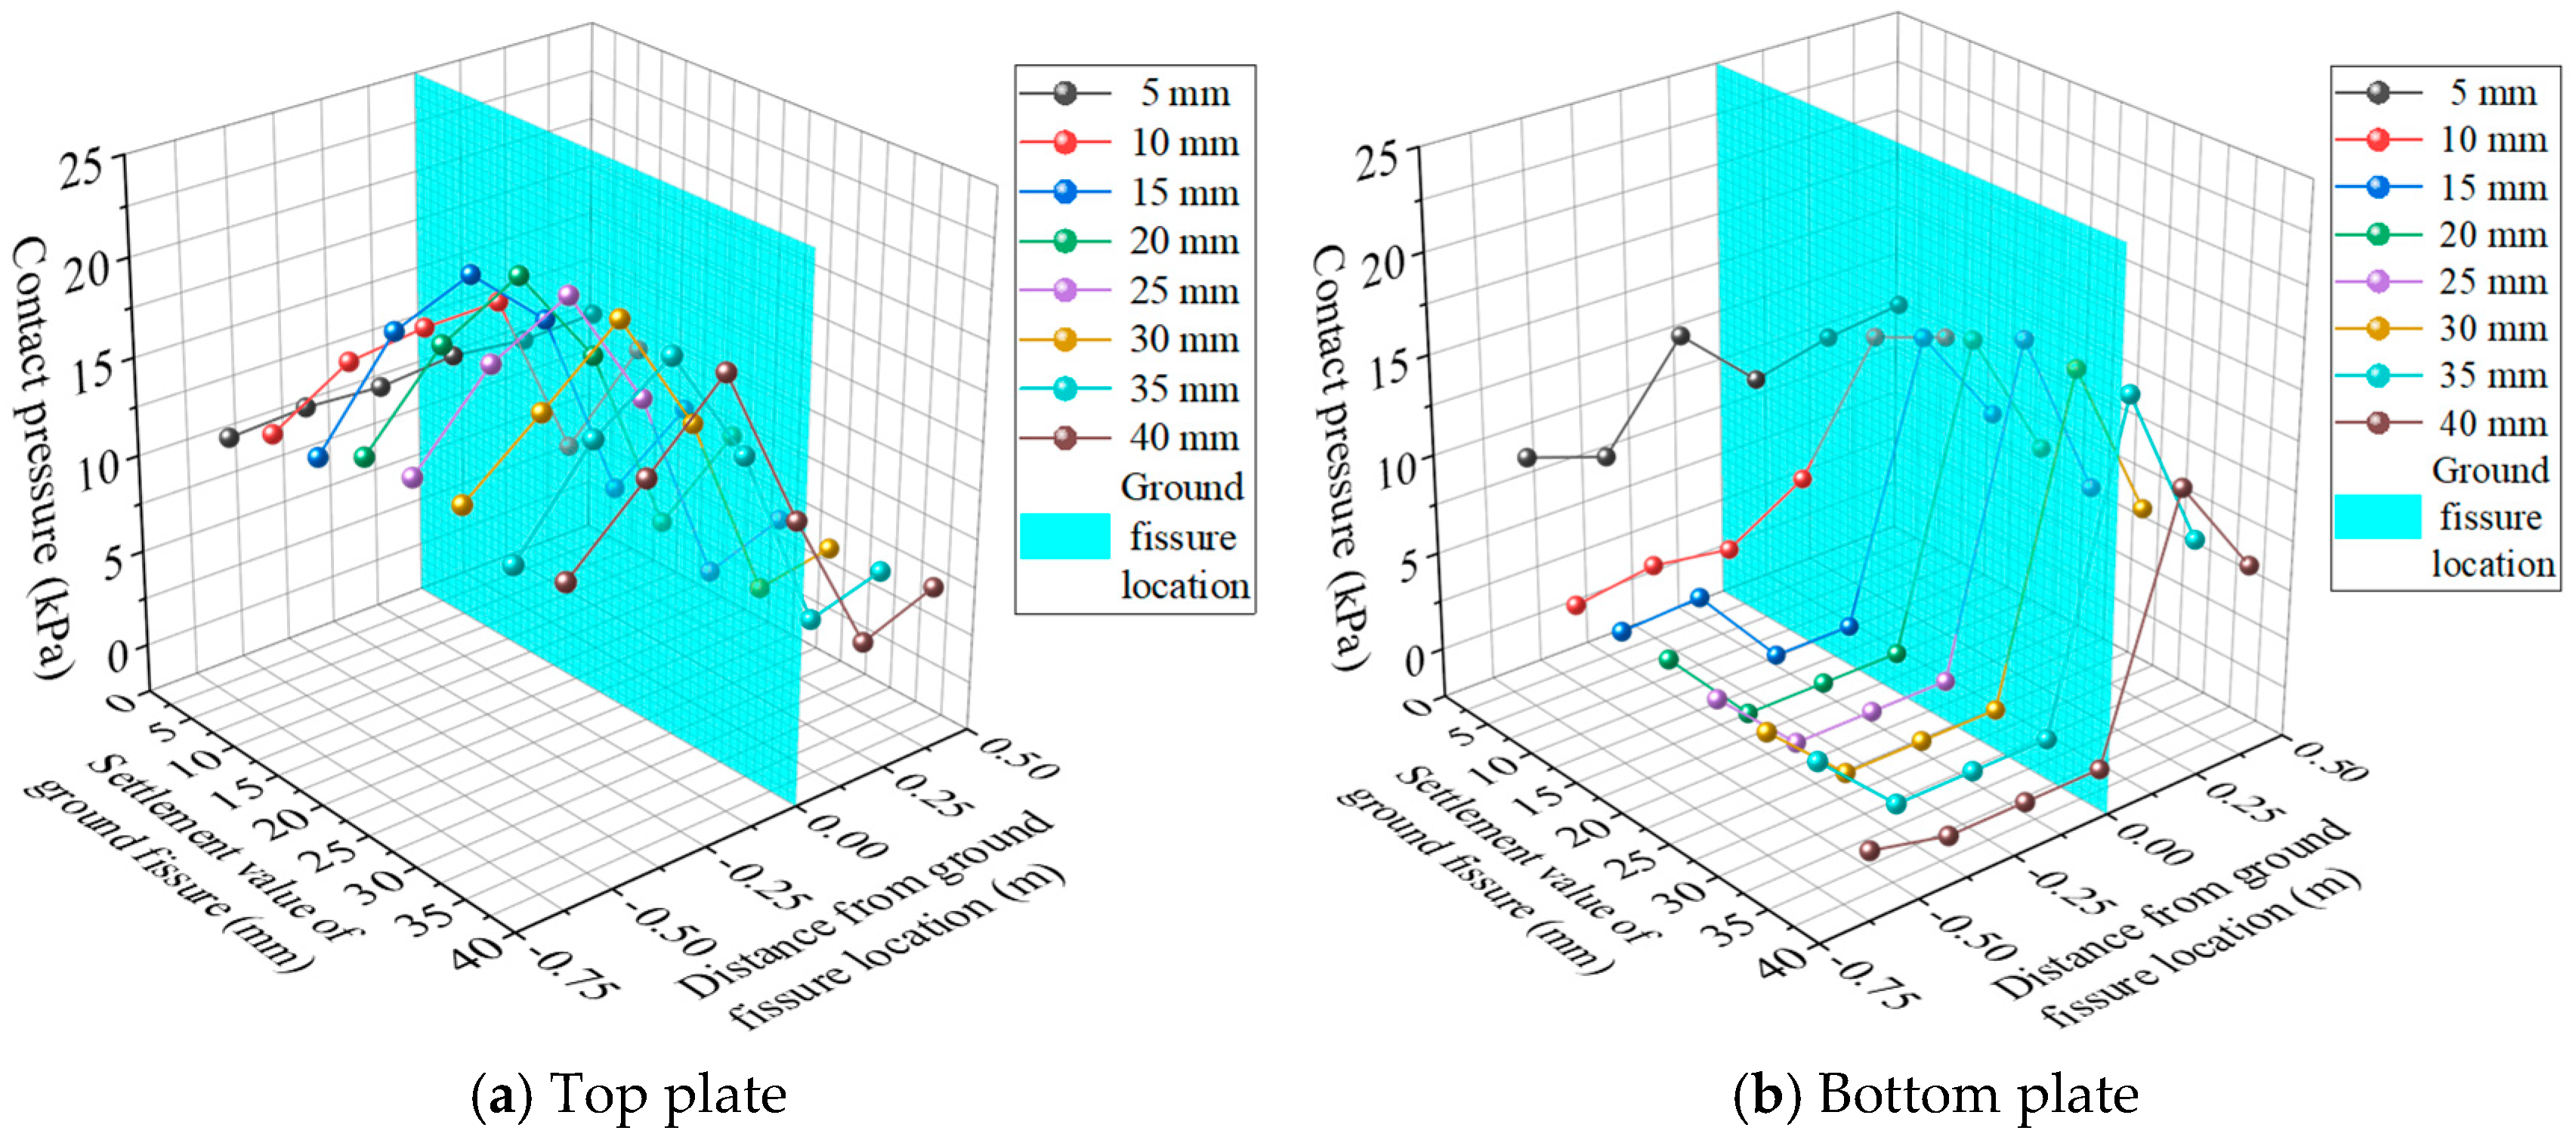
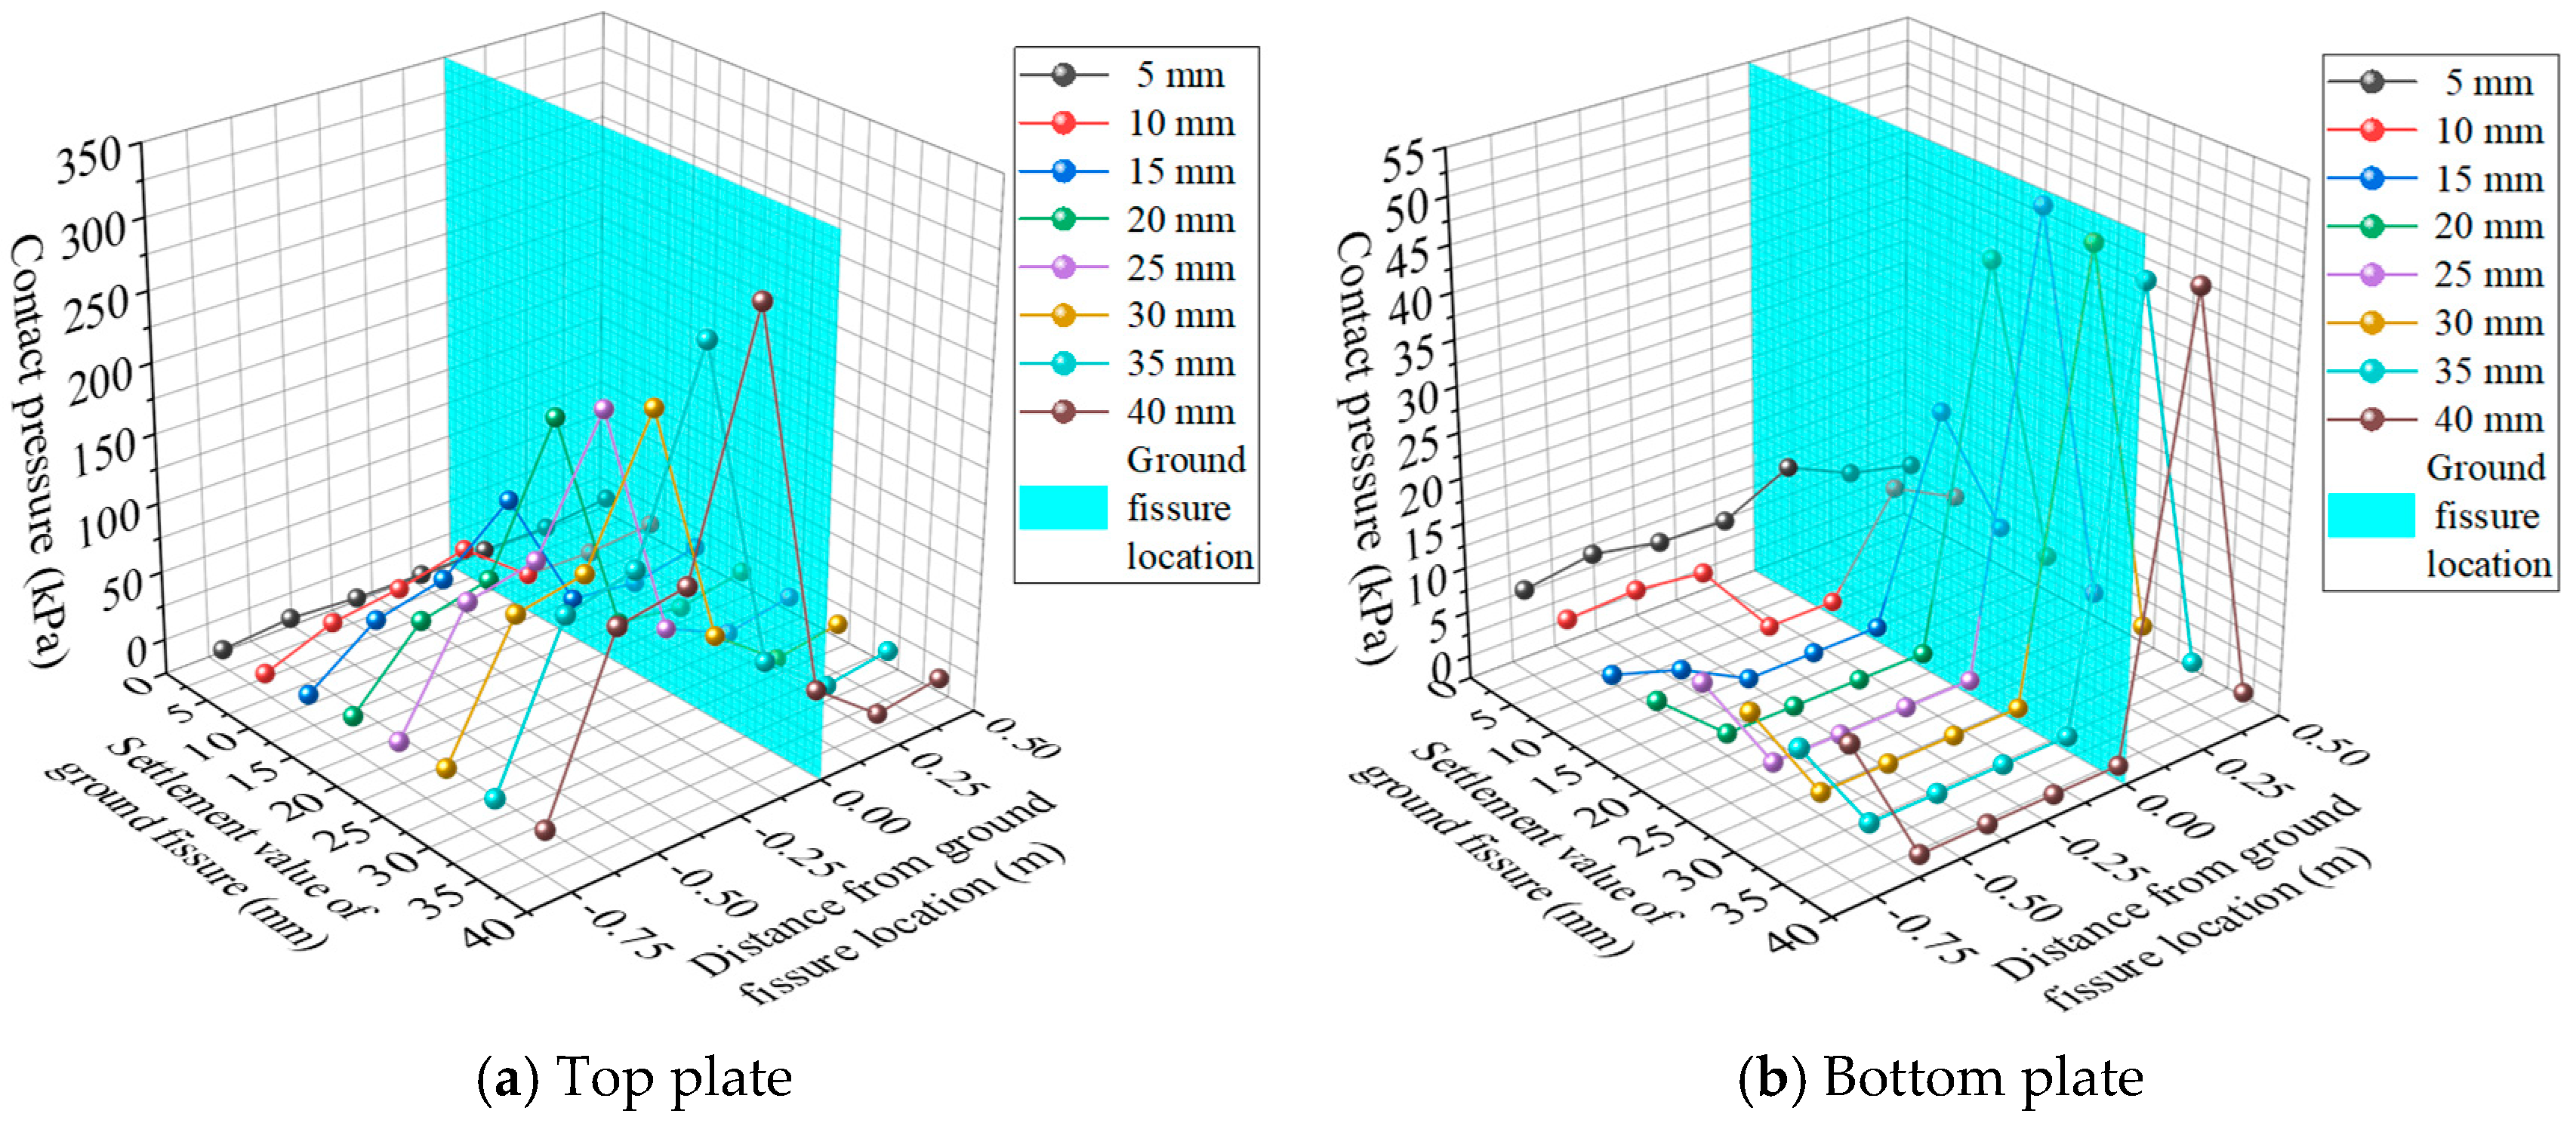
5.3. The Contact Pressure Between the Pipe Gallery Structure and the Surrounding Soil

Figure 19 and Figure 20 show the variation curves of the longitudinal contact pressure between the bottom plate, top plate, and soil layer of the pipe gallery structure under the orthogonal and oblique conditions, respectively. As observed from the figure, with an increase in the hanging wall dislocation, the longitudinal contact pressure between the bottom plate and the hanging wall decreased, and that between the bottom plate and the footwall increased. In contrast, the longitudinal contact pressure between the top plate of the pipe gallery and the hanging wall increased, and that between the top plate and the footwall decreased. Under the orthogonal condition, when the hanging wall dislocation reached 15 mm, the contact pressure between the hanging wall and the pipe gallery’s bottom plate decreased to zero in the range of −0.625 m to 0 m (−3.125–0 L). This indicates that the bottom plate of the hanging wall of the pipe gallery structure and the soil was voided; therefore, void formation under the oblique condition occurred earlier than that under the orthogonal condition. Under the load of the overlying soil, the hanging wall of the pipe gallery dragged the footwall of the pipe gallery, causing it to squeeze the soil layer near the ground fissures. With an increase in settlement, similar to the lever principle, the footwall of the pipe gallery structure was slightly upturned. Consequently, the contact pressure between the footwall and the pipe gallery increased near the ground fissure and decreased away from it. The maximum contact pressure between the structure and the soil was distributed on the top plate of the hanging wall of the pipe gallery structure and the bottom plate of the footwall of the pipe gallery structure near the junction between the ground fissure and the structure.

5.4. A Discussion of the Void Area

The test results of the three stages of the bottom void formation of the pipe gallery structure were analyzed, and the following observations were made: ① When the dislocation of the hanging wall was in the range of 0–5 mm, after the interaction between the pipe gallery and the foundation, a slight void occurred near the ground fissure, but the void range was very small. The pipe gallery structure was considered to have undergone a simultaneous deformation and critical void stage. ② When the hanging wall dislocation exceeded 5–10 mm, with an increase in the hanging wall dislocation, the void range at the bottom of the pipe gallery structure increased. When the settlement reached 40 mm, the pipe gallery’s bottom void range obtained from the model test under the orthogonal condition was in the range of 0.575–0.60 m (2.875–3 L), and that under the oblique condition was in the range of 0.625–0.70 m (3.125–3.5 L). Therefore, in the void development stage of the pipe gallery structure, after comparison, the pipe gallery’s bottom void range under the oblique condition in the model test was larger than that under the orthogonal condition in the model test.
The bottom void is an important factor affecting the strain change in the pipe gallery structure. When the hanging wall dislocation was 5 mm, the pipe gallery structure under both orthogonal and oblique conditions was mainly affected by the tensile failure of the top plate. With an increase in the hanging wall dislocation, the bottom plate of the pipe gallery structure was mainly affected by the compressive failure of the footwall. The above results are summarized in Table 2.
According to the model test results, the bottom hollowed-out corridor structure mainly influences the roof and bottom plate of the pipe corridor structure, where the roof can easily be strained and damaged, and the bottom plate can easily be fractured. Aiming at these specific areas in which it is easy to produce tension and compression failure, the strength of the steel bar and concrete can be locally strengthened within the 6D range of the upper and lower coil corridors. It can be seen from the model experiment that the roof of the pipe corridor is prone to tensile stress and the bottom floor is prone to compressive stress. In view of the stress concentration caused by the cavitation area, the stress concentration of the structure can be eliminated by setting deformation joints at reasonable positions of the structure. The range of setting deformation joints is consistent with that of locally strengthening the pipe corridor structure.

5.5. Verification of Calculation Method

To verify the rationality of the calculation method for the bottom void range of the pipe gallery structure, the calculation results were compared with the pipe gallery model test results. The basic parameters of the model are as follows: the length of the pipe gallery model is 1.9 m, the cross section is 0.20 m × 0.20 m, and the wall thickness is 0.006 m. The length of the hanging wall of the pipe gallery is 0.925 m, the elastic modulus of the model material is 2.47 × 10³ MPa, and the moment of inertia is 1.53 × 10⁻⁵ m4. The stratum was made using similar materials with a weight of 18.2 kN/m3, an elastic modulus of 8 MPa, a Poisson’s ratio of 0.25, a maximum settlement of ground fissures of 0.04 m, and an overlying soil depth of 1 m. When calculating, the number of rigid bars was set to 30. The theoretical calculation values of the bottom void range of the pipe gallery were obtained using MATLAB, as listed in Table 3.
The calculated values are compared to the test values, as listed in Table 4.
From the comparative analysis results, it can be seen that the calculation results of the bottom void range of the pipe gallery are consistent with the model test results, and the maximum error does not exceed 9.35%.

6. Conclusions

In this study, based on the phenomenon of voids at the bottom of a pipe gallery under the action of ground fissure dislocations, a mechanical model was established, and model tests under two working conditions were conducted. The following conclusions were drawn:
1. A calculation method for the void range at the bottom of a pipe gallery structure under the action of ground fissures was established, and the rationality of the method was verified through model tests.
2. When the ground fissure dislocation reached the predicted settlement of one hundred years, the void range at the bottom of the pipe gallery structure was 0.575–0.6 m (2.875–3 times the length of the bottom edge of the pipe gallery section) under the orthogonal condition and 0.575–0.7 m (3.125–3.5 times) under the oblique condition.
3. Based on the model test data, the following observations are made:
① During the process of ground fissure dislocation, the maximum tensile stress on the pipe gallery appears in the upper part of the structure, and the maximum compressive stress appears in the lower part of the structure.
② Longitudinal bending and torsion of the pipe gallery structure occur simultaneously under oblique conditions.
③ The maximum point of contact pressure between the structure and the surrounding soil is distributed at the top of the hanging wall and the bottom of the footwall near the junction of the ground fissure and the structure.
This study provides a theoretical basis for the design optimization of pipe gallery structures in ground fissure areas.

Author Contributions

Methodology, B.H. and H.L.; Validation, B.H.; Formal analysis, B.H., B.D. and H.L.; Investigation, B.D.; Resources, K.D.; Data curation, Y.Z. and K.D.; Writing—original draft, X.Y.; Writing—review & editing, X.Y.; Supervision, Y.Z.; Funding acquisition, B.D. All authors have read and agreed to the published version of the manuscript.

Funding

This work is funded by the National Natural Science Foundation of China (No. 42177155), the Open Fund of State Key Laboratory of Green Building in Western China (LSKF202323), and the Shanxi Provincial Key R&D Program (2023-YBSF-506).

Data Availability Statement

The original contributions presented in the study are included in the article, further inquiries can be directed to the corresponding author.

Conflicts of Interest

Authors Xintao Yu and Baoan Han were employed by the company China Construction Silk Road Construction Investment Co., Ltd. Author Yubo Zhao was employed by the company China Construction No. 6 Bureau Construction Engineering Co., Ltd. The remaining authors declare that the research was conducted in the absence of any commercial or financial relationships that could be construed as a potential conflict of interest.

References

  1. Canto-Perello, J.; Curiel-Esparza, J.; Calvo, V. Criticality and threat analysis on utility tunnels for planning security policies of utilities in urban underground Space. Expert Syst. Appl. 2013, 40, 4707–4714. [Google Scholar] [CrossRef]
  2. Canto-Perello, J.; Curiel-Esparza, J.; Calvo, V. Strategic Decision Support System for Utility Tunnel’s Planning Database A ’WOT Method. Tunn. Undergr. Space Technol. 2016, 55, 146–152. [Google Scholar] [CrossRef]
  3. Qian, Q. Construction of urban underground comprehensive pipe corridor and transformation of urban development mode. Tunn. Constr. 2017, 37, 647–654. [Google Scholar]
  4. Canto-perello, J.; Curielesparza, J. Assessing governance issues of urban utility tunnels. Tunn. Undergr. Space Technol. 2013, 33, 82–87. [Google Scholar] [CrossRef]
  5. Huang, Q.; Liang, A.; Men, Y.; Liu, H.; Ma, Y. A full-scale model test on the influence of ground fracture activity on underground water transmission pipeline. Chin. J. Rock Mech. Eng. 2016, 35, 2968–2977. [Google Scholar] [CrossRef]
  6. Peng, J. Ground Fissure Disaster in Xi’an; Science Press: Beijing, China, 2012. [Google Scholar]
  7. Peng, J.; Qiao, J.; Leng, Y.; Wang, F.; Xue, S. Distribution and mechanism of the ground fissures in Wei river basin, the origin of the silk road. Environ. Earth Sci. 2016, 75, 718. [Google Scholar] [CrossRef]
  8. Peng, J.; Sun, X.; Wang, W.; Sun, G. Characteristics of land subsidence, Earth Fissures and Related Disaster Chain Effects with Respect to Urban Hazards in Xi’an, China. Environ. Earth Sci. 2016, 75, 1190. [Google Scholar] [CrossRef]
  9. Wang, G.; You, G.; Zhu, J.; Yu, J.; Li, W. Earth Fissures in Su–Xi–Chang Region, Jiangsu, China. Surv. Geophys. 2016, 37, 1095–1116. [Google Scholar] [CrossRef]
  10. Youssef, A.M.; Sabtan, A.A.; Maerz, N.H.; Zabramawi, Y.A. Ground fissure in Wadi Najran. Kingdom of Saudi Arabia. Nat. Hazards 2014, 71, 2013–2027. [Google Scholar] [CrossRef]
  11. Ha, D.; Abdoun, T.H.; O’Rourke, M.J.; Symans, M.D.; O’Rourke, T.D.; Palmer, M.C.; Stewart, H.E. Centrifuge Modeling of Earthquake Effects on Buried High-Density Polyethylene (HDPE) Pipelines Crossing Fault Zones. J. Geotech. Geoenviron. Eng. 2008, 134, 1501–1515. [Google Scholar] [CrossRef]
  12. Michael, O.; Vikram, G.; Tarek, A. Centrifuge modeling of PGD response of buried pipe. Earthq. Eng. Eng. Vib. 2005, 4, 74–78. [Google Scholar]
  13. Polynikis, V.; Spyros, A.K.; Panos, D. Finite element analysis of buried steel pipelines under strike-slip fault displacements. Soil Dyn. Earthq. Eng. 2010, 30, 1361–1376. [Google Scholar] [CrossRef]
  14. Prentice, C.S.; Ponti, D.J. Coseismic deformation of the Wrights tunnel during the 1906 San Francisco earthquake: A key to understanding 1906 fault slip and 1989 surface ruptures in the southern Santa Cruz Mountains. J. Geophys. Res. 1997, 102, 635–648. [Google Scholar] [CrossRef]
  15. Rojhani, M.; Moradi, M. Centrifuge Modeling of Buried Pipelines Response Due to Normal Faulting. In Proceedings of the 14th Asian Regional Conference on Soil Mechanics and Geotechnical Engineering Geotechnics for transportation and infrastructure, Hong Kong, China, 23–27 May 2011. [Google Scholar]
  16. Russo, M.; Germani, G.; Amberg, W. Design and construction of large tunnel through active faults a recent application. In Proceedings of the International Conference of Tunnelling & Underground Space Use, Istanbul, Turkey, 16–18 October 2002. [Google Scholar]
  17. Susumu, Y.; Hiroya, K. Countermeasures of buried steel pipes against surface fault rapture. In Proceedings of the Canada 13th World Conference on Earthquake Engineering, Vancouver, BC, Canada, 1–6 August 2004; p. 916. [Google Scholar]
  18. Vazouras, P.; Dakoulas, P.; Karamanos, S.A. Pipe-soil interaction and pipeline performance under strike-slip fault movements. Soil Dyn. Earthq. Eng. 2015, 72, 48–65. [Google Scholar] [CrossRef]
  19. Zhou, M.; Moore Ian, D.; Lan, H. Experimental Study of Structural Response of Lined-Corrugated HDPE Pipe Subjected to Normal Fault. J. Geotech. Geoenviron. Eng. 2019, 145, 04019117. [Google Scholar] [CrossRef]
  20. Liu, C.; Qiao, J.; Yan, T.; Lu, Q.; Zhan, J.; Peng, J. Ground fissure water supply pipeline 45° inclined wear full scale model test research. J. Civ. Eng. 2022, 56, 1–12. [Google Scholar] [CrossRef]
  21. Deng, B.T.; Li, P.; Li, X.; Tian, J.T.; Zhi, B. Mechanical behavior of underground pipe gallery structure considering ground fissure. J. Mt. Sci. 2022, 19, 547–562. [Google Scholar] [CrossRef]
  22. Deng, B.T.; Li, P.; Li, X.; Tian, J.T.; Zhi, B. Rationality determination method and mechanical behavior of underground utility tunnels in a ground fissure environment. Bull. Eng. Geol. Environ. 2022, 81, 50. [Google Scholar] [CrossRef]
  23. Gou, Y.; Huang, Q.; Yang, X.; Wang, L.; Shi, W.; Yang, Z. Model test on deformation and failure mechanism of shield tunnel intersecting ground fissure with large angle. J. Civ. Eng. 2022, 55, 117–130. [Google Scholar] [CrossRef]
  24. Hu, Z.; Peng, J.; Wang, Q.; Zhu, Q.; Zhao, Z. Experimental study on deformation and failure mechanism of shield tunnel with 60° oblique penetrating crack. Chin. J. Rock Mech. Eng. 2010, 29, 176–183. [Google Scholar]
  25. Li, J.; Shao, S.; Xiong, T. Model test study of tunnel crossing ground crack in oblique direction. Rock Soil Mech. 2010, 31, 115–120+126. [Google Scholar] [CrossRef]
  26. Li, K.; Men, Y.; Yan, J.; Li, X. Experimental study on interaction mechanism of subway tunnel crossing ground crack in orthogonal way. Chin. J. Rock Mech. Eng. 2011, 30, 556–563. [Google Scholar]
  27. Liu, N.; Huang, Q.; Ma, Y.; Bulut, R.; Peng, J.; Fan, W.; Men, Y. Experimental study of a segmented metro tunnel in a ground fissure area. Soil Dyn. Earthq. Eng. 2017, 100, 410–416. [Google Scholar] [CrossRef]
  28. Peng, J.; He, K.; Tong, X.; Huang, Q.; Liu, C. Failure Mechanism of an Underground Metro Tunnel Intersecting Steep Ground Fissure at Low Angle. Int. J. Geomech. 2017, 17, E4016006. [Google Scholar] [CrossRef]
  29. Xiong, T.; Shao, S.; Wang, T.; Gao, Z. Model test study of orthogonal ground fracture tunnel in Xi’an metro. Rock Soil Mech. 2010, 31, 179–186. [Google Scholar] [CrossRef]
  30. Yan, Y.; Huang, Q.; Xie, Y.; Qiu, J.; Han, Y.; Teng, H.; Liu, T. Failure analysis and deformation mechanism of segmented utility tunnels crossing ground fissure zones with Different intersection angles. Eng. Fail. Anal. 2022, 139, 106456. [Google Scholar] [CrossRef]
  31. Yan, Y.; Huang, Q.; Yang, X. Wang P Research on the deformation and force characteristics of underground utility tunnel crossing ground fissure. J. Eng. Geol. 2018, 26, 1203–1210. [Google Scholar] [CrossRef]
  32. Peng, J.; Huang, Q.; Hu, Z.; Wang, M.; Li, T.; Men, Y.; Fan, W. A proposed solution to the ground fissure encountered in urban metro construction in Xi’an. Tunn. Undergr. Space Technol. 2017, 61, 12–25. [Google Scholar] [CrossRef]
  33. Yan, Y.; Qiu, J.; Huang, Q.; Wang, Z.; Xie, Y.; Liu, T. Ground fissures geology in Xi’an and failure mitigation measures for utility tunnel system due to geohazard. Arab. J. Geosci. 2021, 14, 1207. [Google Scholar] [CrossRef]
  34. Wang, H.; Li, S.; Zhang, Q.; Li, Y.; Guo, X. Development of A New Geomechanical Similar Material. Chin. J. Rock Mech. Eng. 2006, 9, 1842–1847. [Google Scholar]
  35. Maqsood, Z.; Koseki, J.; Ahsan, M.K.; Shaikh, M.; Kyokawa, H. Experimental study on hardening characteristics and loading rate dependent mechanical behaviour of gypsum mixed sand. Constr. Build. Mater. 2020, 262, 119992. [Google Scholar] [CrossRef]
  36. Li, S.; Zhou, Y.; Li, L.; Zhang, Q.; Song, S.; Li, J.; Wang, K.; Wang, Q. Development and Application of A New Similar Material For Underground Engineering Fluid-Solid Coupling Model Test. Chin. J. Rock Mech. Eng. 2012, 6, 1128–1137. [Google Scholar]
  37. Li, S.; Wang, Q.; Li, W.; Li, Z.; Wang, H.; Jiang, B.; Zhang, H. Research on application of flexible uniform pressure loading device to model test. Rock Soil Mech. 2014, 1, 61–66. [Google Scholar] [CrossRef]
  38. Li, K.; Men, Y.; Liu, Y.; Jiang, R. Model test study on influence of ground fracture profile morphology on metro tunnel deformation. Rock Soil Mech. 2011, 32, 1691–1697. [Google Scholar] [CrossRef]
  39. Pang, X.; Yan, J. Model test study on oblique crossing of subway tunnel through ground crack. J. Railw. Sci. Eng. 2016, 13, 1354–1359. [Google Scholar] [CrossRef]
  40. Hu, Z.; Zhang, D.; Zhang, Y.; Wang, S.; Li, F. Experimental study on deformation and failure mechanism of underground integrated pipe corridor structure through active ground cracks. Chin. J. Rock Mech. Eng. 2019, 38, 2550–2560. [Google Scholar] [CrossRef]
  41. Zhang, D.; Hu, Z.; Lu, G.; Wang, R.; Ren, X. Experimental Study on Deformation Mechanism of a Utility Tunnel in a Ground Fissure Area. Adv. Mater. Sci. Eng. 2020, 2020, 6758978. [Google Scholar] [CrossRef]
  42. Mei, Y.; Zhang, Y.; Yuan, Y.; Ma, H.; Zhang, L.; Zhao, J. Study on mechanical response and warning standard of underground integrated pipe corridor crossing ground cracks. J. Saf. Environ. 2020, 20, 1255–1304. [Google Scholar] [CrossRef]
  43. Men, Y.; Zhang, J.; Liu, H.; Han, D.; Wang, H. Discussion on calculation model of Xi’an subway tunnel crossing ground fissure zone. J. Earth Sci. Environ. 2011, 33, 95–100. [Google Scholar]
  44. Qiao, L.; Liu, J.; Li, S.; Wang, C.; Jiang, Y.; Wang, Z. Underground engineering excavation surface characteristics of the effect of space and application. Rock Soil Mech. 2014, 35, 481–487. (In Chinese) [Google Scholar]
Figure 1. A schematic diagram of the pipe gallery–soil interaction under the action of ground cracks. (a) The effect of pipe corridor on soil; (b) The effect of soil on the pipe corridor.
Buildings 15 00920 g001
Figure 2. Longitudinal force diagram of pipe corridor structure.
Buildings 15 00920 g002
Figure 3. Bottom void stage diagrams of a pipe gallery structure.
Buildings 15 00920 g003aBuildings 15 00920 g003b
Figure 4. The calculation model of a pipe gallery structure under the action of a ground fissure.
Buildings 15 00920 g004
Figure 5. Calculation diagrams of the pipe gallery structure under the action of the ground fissure.
Buildings 15 00920 g005
Figure 6. A graph of the functional relationship between ∆1 and ∆2.
Buildings 15 00920 g006
Figure 7. Settlement calculation model.
Buildings 15 00920 g007
Figure 8. Stratigraphic profile of pipe gallery structure.
Buildings 15 00920 g008
Figure 9. Model test device and schematics.
Buildings 15 00920 g009
Figure 10. Schematic of measurement point arrangements.
Buildings 15 00920 g010
Figure 11. Ground settlement of model test.
Buildings 15 00920 g011
Figure 12. Bottom void phenomenon of pipe gallery.
Buildings 15 00920 g012
Figure 13. Longitudinal strain curves under the orthogonal (90°) condition.
Buildings 15 00920 g013
Figure 14. Longitudinal strain curves under the oblique (45°) condition.
Buildings 15 00920 g014
Figure 15. Strain variation curves of the side plates under the oblique (45°) condition.
Buildings 15 00920 g015
Figure 16. Transverse strain distributions under the orthogonal (90°) condition.
Buildings 15 00920 g016aBuildings 15 00920 g016b
Figure 17. Transverse strain distributions under the oblique (45°) condition.
Buildings 15 00920 g017
Figure 18. Relative displacement variations between the bottom of the pipe gallery and the foundation.
Buildings 15 00920 g018
Figure 19. Contact pressure curves in the orthogonal (90°) condition.
Buildings 15 00920 g019
Figure 20. Contact pressure curves under the oblique (45°) condition.
Buildings 15 00920 g020
Table 1. The main similarity ratios of the model test.
TypePhysical ParametersSimilar RelationshipsSimilarity Ratios (Prototype/Model)
Pipe Gallery StructureSoil
Geometric featuresLength C l 20
Moment of inertia C I = C l 4 160,000
Displacement C u = C l 2020
Material characteristicsElasticity modulus C E 1215
Stress C σ = C E 12
Strain C ε 1
Bulk density C γ 1
Moisture content C ω 1
Cohesion C c = C l 20
Internal friction angle C φ 1
Table 2. Bottom void ranges of pipe gallery structure from model tests.
Hanging Wall DislocationsVoid StagesBottom Void Range of Pipe GalleryDamage Range of Pipe Gallery
5 mmSimultaneous deformation and critical void stagesThere is only a slight void between the pipe gallery and the foundation near the ground fissure.Tensile failure of the top plate occurs.
10 mmVoid development stageWith an increasing hanging wall dislocation, the bottom void of the pipe gallery structure gradually increased. At the end of the test, the bottom void ranges were 2.875–3 L and 3.125–3.5 L under the in orthogonal and oblique conditions, respectively.In the orthogonal test, fracturing failure occurred when the hanging wall dislocation was 10 mm. In the test under oblique conditions, compressive failure occurred when the hanging wall dislocation was 15 mm, and then the range gradually expanded, mainly in the footwall’s bottom plate.
15 mm
20 mm
25 mm
30 mm
35 mm
40 mm
Table 3. Bottom void ranges of the pipe gallery structure from theoretical calculations.
Hanging   Wall   Dislocation   Δ 2 Vertical   Displacement   of   Pipe   Gallery   End   Δ 1 (m)θBθCCalculated Value (m)
0.0050.00490.37570.31220.1230
0.0100.00970.37050.3070.2328
0.0150.01430.36560.30210.0811
0.0200.01840.36110.29760.1536
0.0250.02210.35710.29360.3876
0.0300.02540.35360.29010.4591
0.0350.02810.35060.28710.6737
0.0400.03040.34810.28460.6561
Table 4. A comparison of the calculated values and test values.
MethodOrthogonal Bottom Void RangeOblique Bottom Void Range
Theoretical calculations0.65610.6561
Model tests0.60.7
Calculated   value     Test   value Test   value × 100 % 9.35%−4.39%
Disclaimer/Publisher’s Note: The statements, opinions and data contained in all publications are solely those of the individual author(s) and contributor(s) and not of MDPI and/or the editor(s). MDPI and/or the editor(s) disclaim responsibility for any injury to people or property resulting from any ideas, methods, instructions or products referred to in the content.

