1. Introduction
In 2021, Germany produced 249 million square meters of gypsum drywall. Analyzing the material flows, it is evident that the 10.8 million tons of gypsum produced in this country came from three sources: 5.8 million tons were made from natural gypsum, 4.9 million tons were extracted as FGD gypsum from the flue gas desulphurization of coal-fired power plants, and 0.1 million tons were recycled gypsum, referred to as RC gypsum [
1].
Due to the planned shutdown of coal-fired power plants in Germany by 2030, FGD gypsum will be eliminated. Only a percentage of gypsum products that have reached the end of their lifecycle are recycled. In 2020, out of 741,000 tons of gypsum-based construction waste, only 63,000 tons were processed and returned to production as recycled gypsum [
1]. This results in a recycling rate of just under 9%, indicating that the recycling potential is largely untapped, primarily because of the non-recyclable components that adhere to the gypsum. Even if the production of RC gypsum increases, further actions will be necessary to compensate for the loss of FGD gypsum. The extent of this required compensation is illustrated in
Figure 1, which combines gypsum production data from 2021 and the maximum technically feasible recycling quantity from 2020, demonstrating the amount of FGD gypsum that will be lacking.
Instead of relying on gypsum, which can only be recycled to a limited extent, fully recyclable loam can be used. The LEGO research project explores the possibility of replacing plasterboard with extruded loam blocks. This initiative is a collaboration involving the Chair of Design, Construction, and Sustainable Building at Bochum University of Applied Sciences, Lücking GmbH & Co. KG, and the Federal Association of the German Brick and Tile Industry. It is funded by the Federal Institute for Research on Building, Urban Affairs, and Spatial Development on behalf of the Federal Ministry of Housing, Urban Development, and Building, using resources from the Zukunft Bau research funding program.
The advantages of loam construction include the local availability of the raw material in Germany [
2] and the absence of the firing process during production. In addition, the infrastructure necessary for producing loam bricks is well-established across the country due to existing brickworks. Based on this solid infrastructure, the energy requirement from non-renewable energies (PENRE) for producing (A1–A3) of a loam brick with technical drying is 0.911 MJ/kg [
3]. In comparison, the production of a gypsum board, according to DIN EN 520 and DIN 18180, has a PENRE of 2.43 MJ/kg [
4].
When construction components reach the end of their useful life in Germany, they are collected as construction waste, and 78.8% of them are recycled [
5]. In structural engineering, recycling is primarily limited to recycled aggregate, which can only be reused in conjunction with fresh materials like cement [
6]. In contrast, loam blocks can be reprocessed into bricks after demolition without the need for fresh material. Since the production of earth blocks relies on the evaporation of moisture rather than chemical processes for hardening, this building material possesses significant recycling potential [
7]. Compared with other mineral building materials, the previously mentioned advantages are offset by several drawbacks, including low strength, high moisture sensitivity, and significant cracking during the drying process. To address these issues, various additives were examined to stabilize loam.
One of the most comprehensive studies on the impact of various additives for weather protection was conducted by Braun [
8] as part of preliminary research for a citadel in Iran. The emphasis was on investigating water absorption and mass loss resulting from irrigation. A total of 33 different additives were evaluated and categorized into groups: mineral/organic, animal, vegetable, and synthetic additives. Each type was tested by applying water. Various additives have led to a reduction in both water absorption and surface erosion. The most effective of the mineral/organic additives is bitumen, followed by a mixture of lime hydrate and quark. While bitumen helps to bond the components together, it also alters the surface appearance, giving it an uneven dark color. In contrast, severe cracking occurs when the lime hydrate and quark mixture dries. Animal-based additives, whether derived from casein or feces, significantly reduce mass loss during irrigation and slightly decrease water absorption. However, casein-based additives can lead to mold growth immediately after production. Boiled linseed oil is the most effective among plant-based additives, forming a thin resin film on the surface. Conversely, mixtures with pure plant fibers do not positively affect water absorption; in fact, they increase it. The most effective synthetic additives create a film of silicone, latex, or acrylic, which completely envelops the clay particles. This results in reduced water absorption and lower mass loss due to irrigation. Overall, additives from three of the four product groups mentioned above improve weather resistance [
8].
A more extensive analysis of the wood fiber additive provides more precise insight into the relationship between shrinkage, strength, and the additives’ properties. For instance, incorporating 2.5% sawdust with particle sizes between 425 µm and 600 µm can enhance compressive strength by 15%. Simultaneously, the linear drying shrinkage decreases from 8.4% to 6.0%, although water absorption increases by 5% [
9].
Tretau [
10] examines the impact of various additives on strength and their effects on swelling and shrinkage processes. The addition of linseed oil varnish or bitumen emulsion results in lower moisture absorption at 20 °C and 90% relative humidity. In contrast, Acronal increases tensile strength without affecting moisture absorption. However, incorporating 10 wt.-% cement or 3 wt.-% quicklime significantly reduces tensile strength, both in dry conditions and after exposure to a humid climate [
10].
In Germany, there are no uniform standards for examining loam samples’ swelling and shrinkage processes. One approach to measure shrinkage is outlined in the now-withdrawn DIN 18952. To conduct this measurement, at least three test specimens should be created, each measuring 220 mm × 40 mm × 25 mm, using standard stiff loam. For the testing process, two marks are scratched into the moist loam at 200 mm intervals. The distance between these marks is used to determine the degree of shrinkage. Shrinkage is considered complete when the length of the specimen has stabilized during air drying [
2].
The most commonly used method for measuring loam blocks is with a vernier caliper, as outlined in DIN 18945 [
11]. This procedure requires taking two measurements on each side of the block, from which the arithmetic mean is calculated. A vernier caliper provides sufficiently accurate measurements to the millimeter for determining the dimensions of adobe blocks [
11]. For loam mortar prisms, the measuring method using a vernier caliper is somewhat different. To evaluate drying shrinkage, a measurement is taken in the center of three samples along the longitudinal direction using the vernier caliper. The result is recorded with an accuracy of one-tenth of a millimeter [
12].
Another method for determining the change in shape involves using a shrinkage measuring device in accordance with DIN EN 13454-2 [
13] or DIN EN 12390-16 [
14]. This process entails attaching measuring pins to the end faces of the test specimens, which allows for the observation of length changes over an extended period. The measuring accuracy is within a hundredths of a millimeter. In the field of earth building, this method is utilized, among others, by Vaculik et al. [
15]. Additionally, it is possible to measure a sample along its side surface, following DIN EN 12390-16 [
14]. For this purpose, suitable measuring plates must also be used, which can be recorded with the BAM settlement-strain meter. The accuracy requirements are consistent with the previously mentioned method.
For the examination of large objects, measuring with a 3D scanner has proven useful. This method involves scanning the surface with laser beams and converting it into a virtual model. The accuracy of these systems varies. For instance, Mendricky and Keller [
16] reported an accuracy of 0.12 mm when using a 3D scanner for deformation analysis of extruded concrete components. Similarly, a structured light scan performed on 3D-printed clay objects achieved an accuracy of 0.10 mm [
17]. However, when dealing with smaller geometries, maintaining both accuracy and the position of a reference plane can be challenging. To address this, low-deformation reference bodies are used as a stable base [
18].
This paper explores how to optimize the properties of a regional clay mixture from the Warburg area through the addition of various additives. The goal is to reduce deformation caused by changes in moisture while ensuring that the mixture maintains sufficient compressive strength. The final clay mixture should be suitable for producing vacuum-extruded bricks. Additionally, the study examines how different molding processes affect the deformation of the clay under varying moisture conditions.
3. Results and Discussion
3.1. Drying Shrinkage and Strength Analyses
Based on previous investigations, the combination of sand and brick dust additives has shown promise [
20].
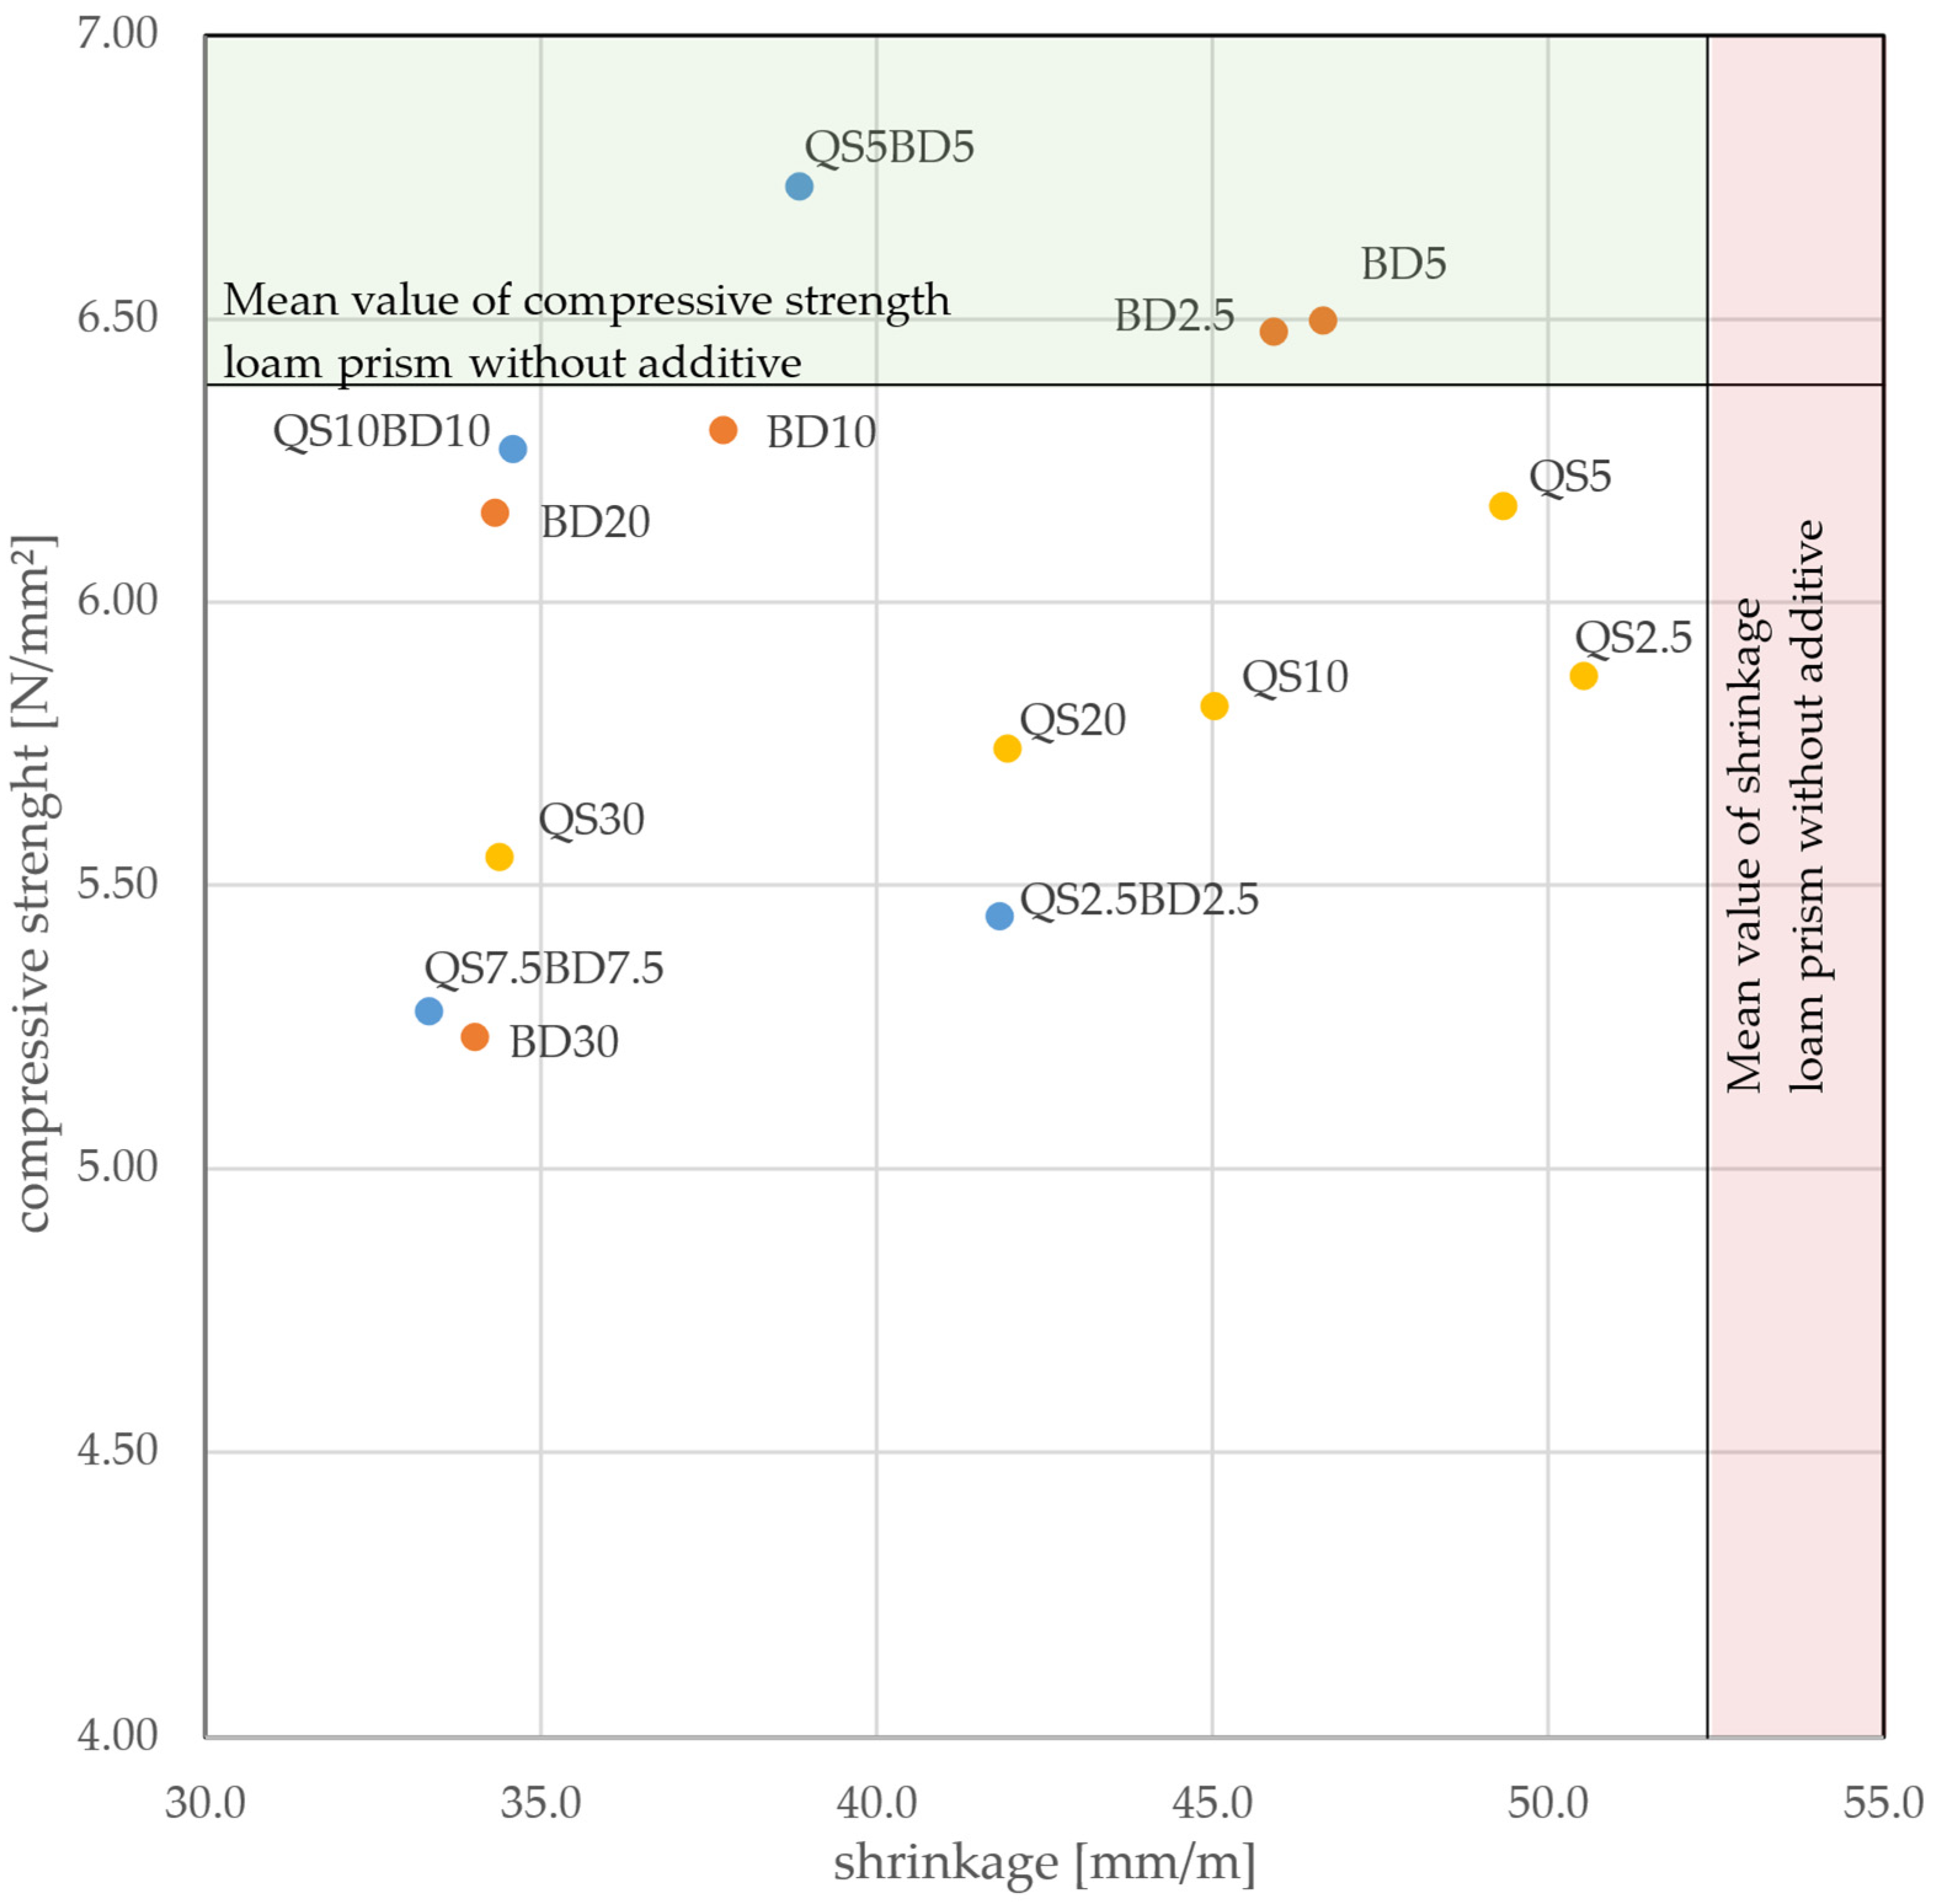
Consequently,
Figure 5 illustrates the relation between compressive strength and shrinkage for various concentrations of these additives.
Table 6 provides the corresponding mean values and standard deviations for better visualization.
A correlation emerges when examining the relation between the concentration of brick dust and the effects on shrinkage and compressive strength. Specifically, while decreasing the brick dust concentration from BD30 to BD20 does not significantly impact the degree of shrinkage, it does lead to a 15% reduction in compressive strength. When the concentration of brick dust is lowered further, compressive strength increases, although this increases shrinkage. Within the concentration range of 5% at BD5 to 2.5% at BD2.5, the compressive strength slightly surpasses that of the untreated loam mixture, and the shrinkage is reduced by 10 mm/m.
A similar relationship is observed for quartz sand with a grain size of 0 to 2 mm. Reducing the sand content from 30% at QS30 to 10% at QS10 primarily results in increased shrinkage and a slight increase in compressive strength. At QS10, the turning point is reached where the compressive strength improves faster than the shrinkage decreases. However, the strength of the untreated loam mixture is not surpassed. The measuring point QS2.5 does not align with the expected correlation due to insufficient compressive strength. Nevertheless, the shrinkage rate aligns with the hypothesis. It is important to note, that structural defects may occur during the manual production of the prisms by molding, which can lead to reduced compressive strength [
21].
The most effective additive mixture, QS5BD5, is achieved by combining 5% quartz sand and 5% brick dust, resulting in a 25% reduction in shrinkage. This combination will be explored in greater detail in subsequent studies. The second variant chosen is BD20, which reduces shrinkage by 34% compared to untreated loam and maintains a compressive strength exceeding 6 N/mm². This mixture is preferred over QS10BD10 due to the higher proportion of recycled materials.
The standard deviations for shrinkage range from 0.31 mm/m to 1.5 mm/m, while for compressive strength, they range from 0.09 N/mm² to 0.32 N/mm². The measurement error for shrinkage in the two preferred mixtures is 0.75 mm/m for QS5DB5 and 0.31 mm/m for BD20. Both values are below the error of REF, which is 1.04 mm/m. A similar trend is observed in the standard deviation of the compressive strength.
3.2. Sieve Analysis
The sieve passages of the dry sieving carried out are shown in
Figure 6.
The sieving curves of the raw materials for the two favored mixtures demonstrate the additives’ effective range. Including quartz sand modifies the loam mixture for grain size ranges larger than 0.25 mm while adding brick dust affects grain size below 0.125 mm. The starting material consists of 71% silt and clay particles.
The combination of 5% quartz sand and 5% brick dust reduces the size of grains across the entire size spectrum. However, when 20% brick dust is added, the silt and clay size decreases explicitly to a maximum grain size of 0.125 mm.
3.3. X-Ray Diffractometry
Figure 7 presents the results of the X-ray diffractometry measurement of the reference mixture, REF, overlaying the reflexes of the minerals muscovite, kaolinite, quartz, and dolomite, which are the most common in the mix, as detailed in
Table 1.
The measured data confirm the presence of the four main minerals, each with a proportion of over 5% in the clay mixture. The two preferred mixtures, as well as the brick dust additive, exhibit similar curves. Therefore, it can be concluded that no chemical processes occur during production that would result in the formation or transformation of minerals.
3.4. Comparison of Different Shrinkage Measurement Methods
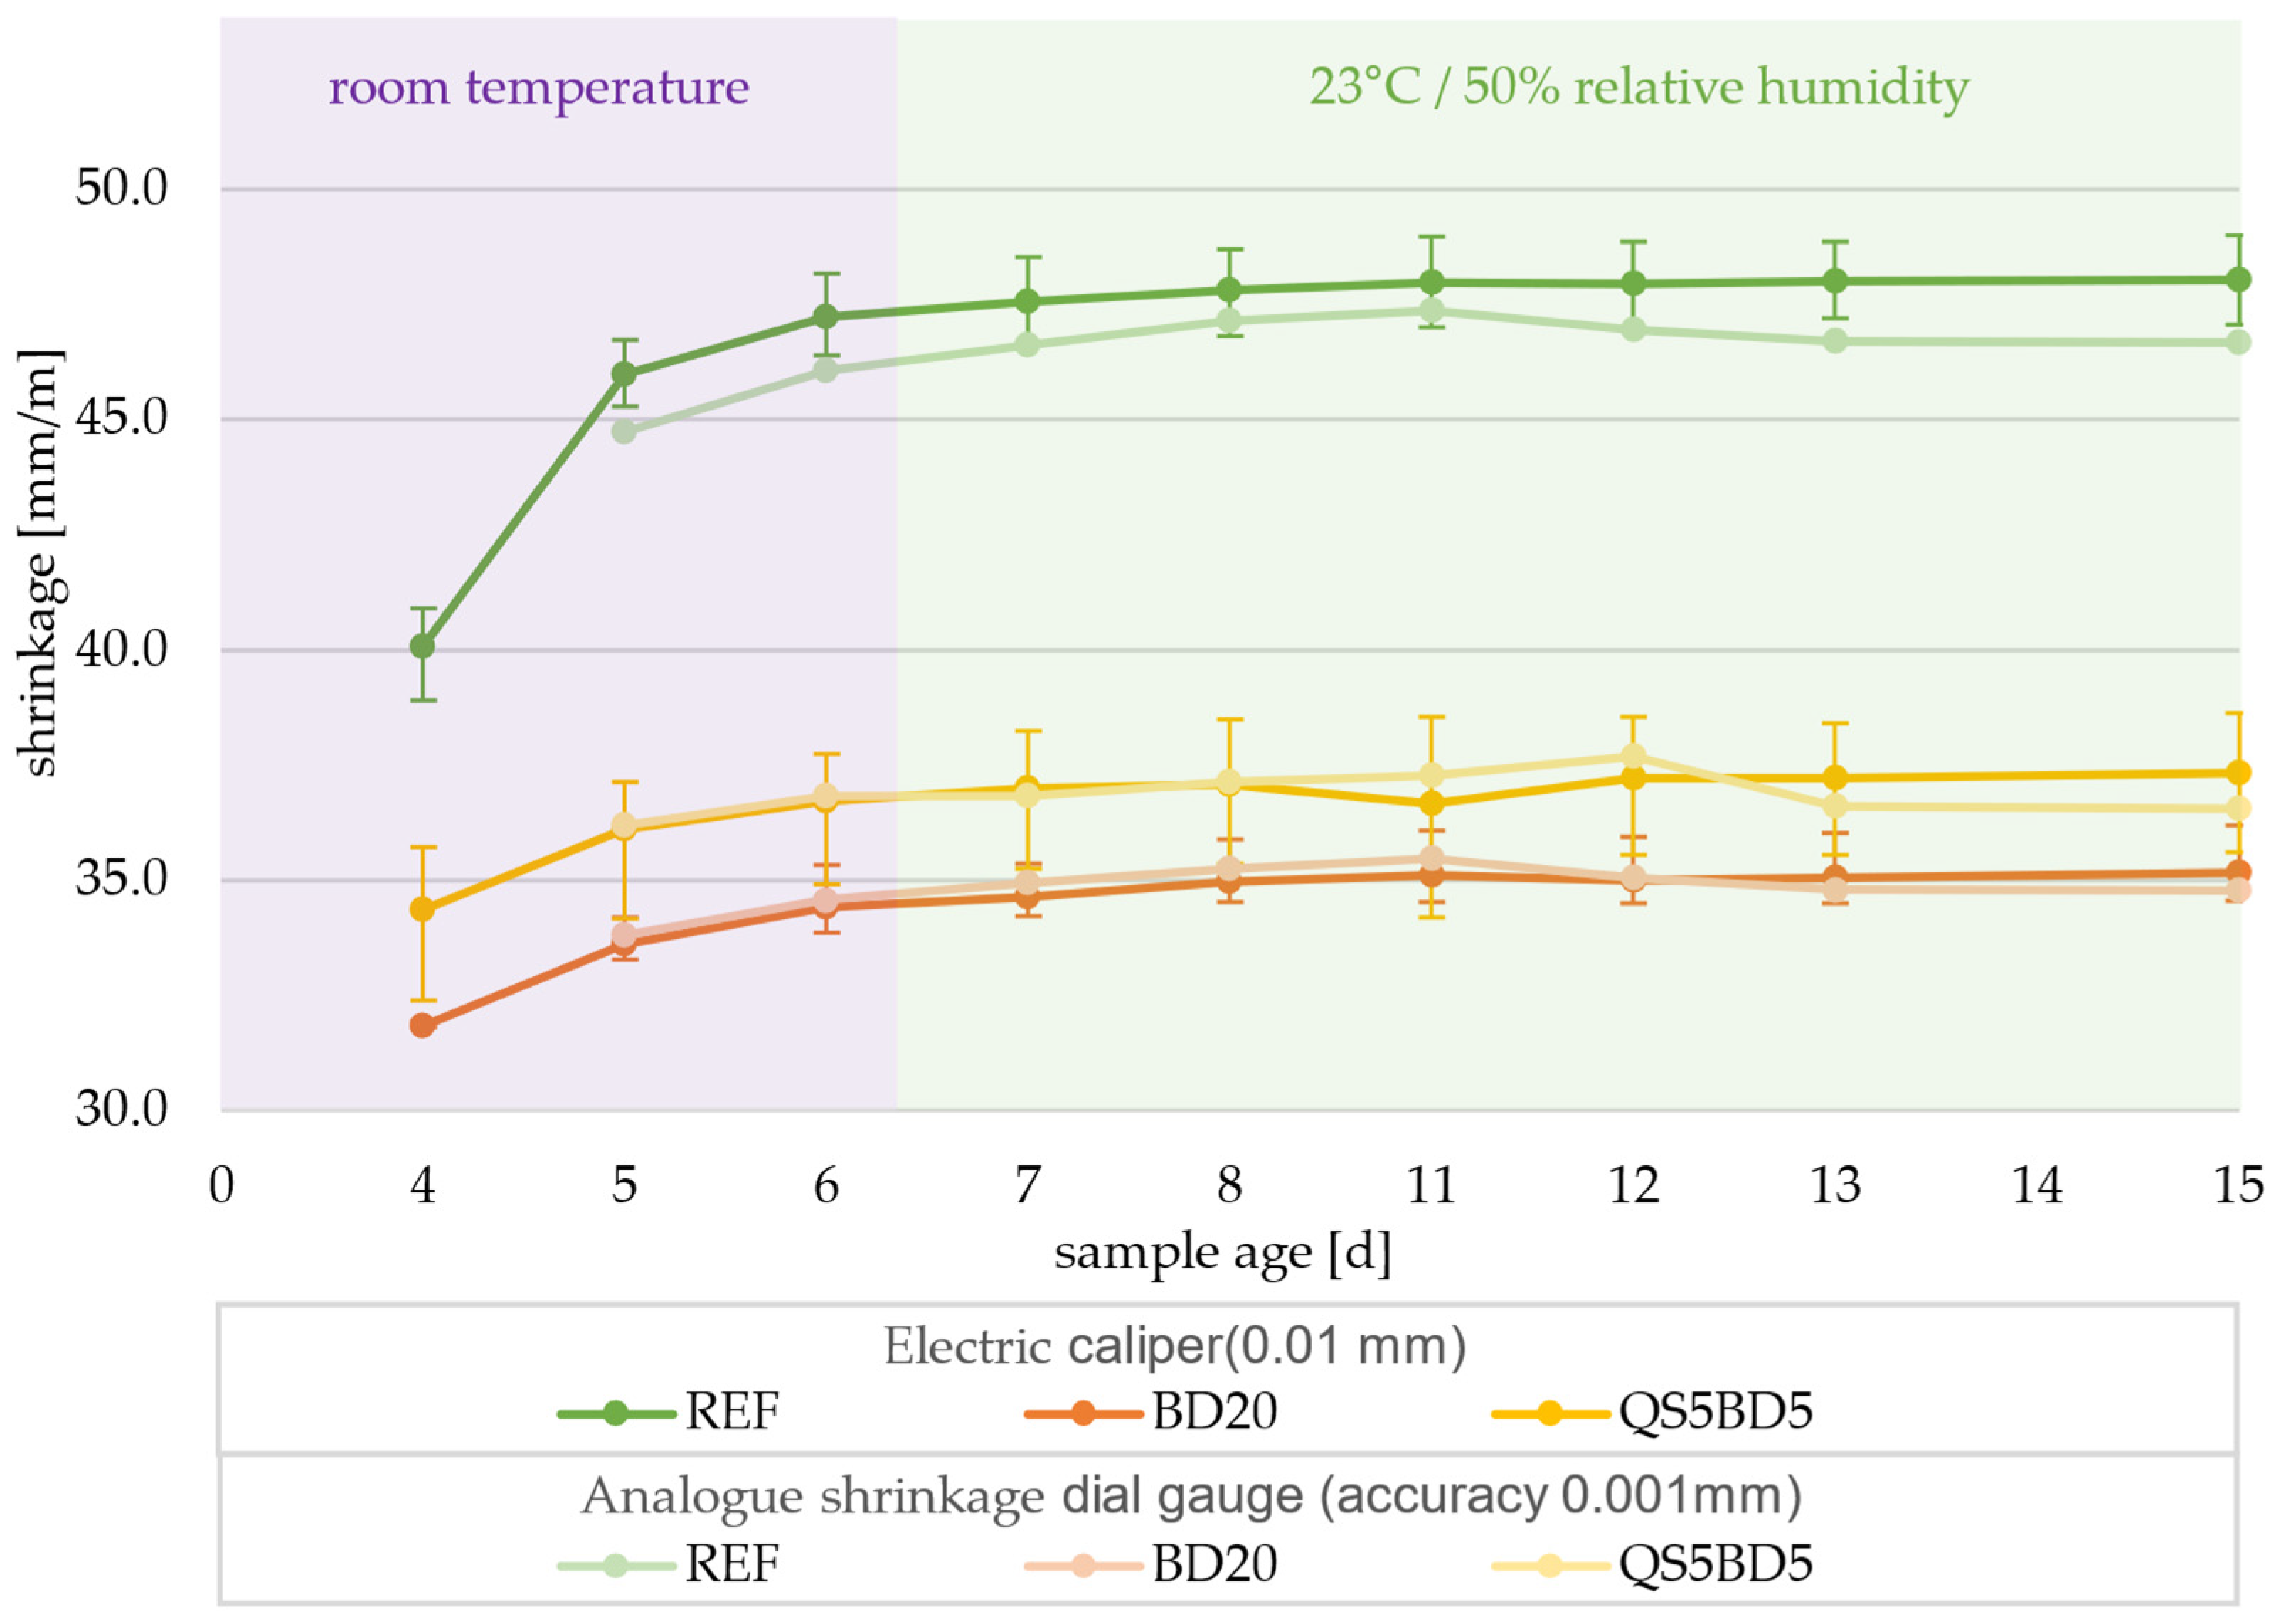
Three prisms are created from the three loam mixtures to compare the shrinkage measurement methods using shrinkage meter B and the electric caliper gauge. The first mixture is a pure, unmodified loam, the REF mixture. The other two mixtures include additives selected in the previous chapter: one contains QS5BD5 and BD20. All three mixtures are produced with the same water content relative to the clay content.
After three days, the samples are taken from the metal molds and measured for the first time using an electric caliper. This measurement continues for the next two weeks. On the first day, measuring pins are installed to examine the samples with a shrinkage meter. Starting the following day, shrinkage is measured in millimeters per meter (mm/m) using this method. The shrinkage results from both measuring techniques are illustrated in
Figure 8.
Both measuring methods show similar trends without significant fluctuations. The shrinkage measurement, which is accurate to 0.001 mm, falls within the range of results obtained using an electrical gauge, except for the first and last two REF points. The variation in the mean values determined from the shrinkage measuring device, which does not form a straight line over time, is attributed to the increased sensitivity of the comparative measuring method with the calibration rod.
3.5. Comparison of the Molding Processes
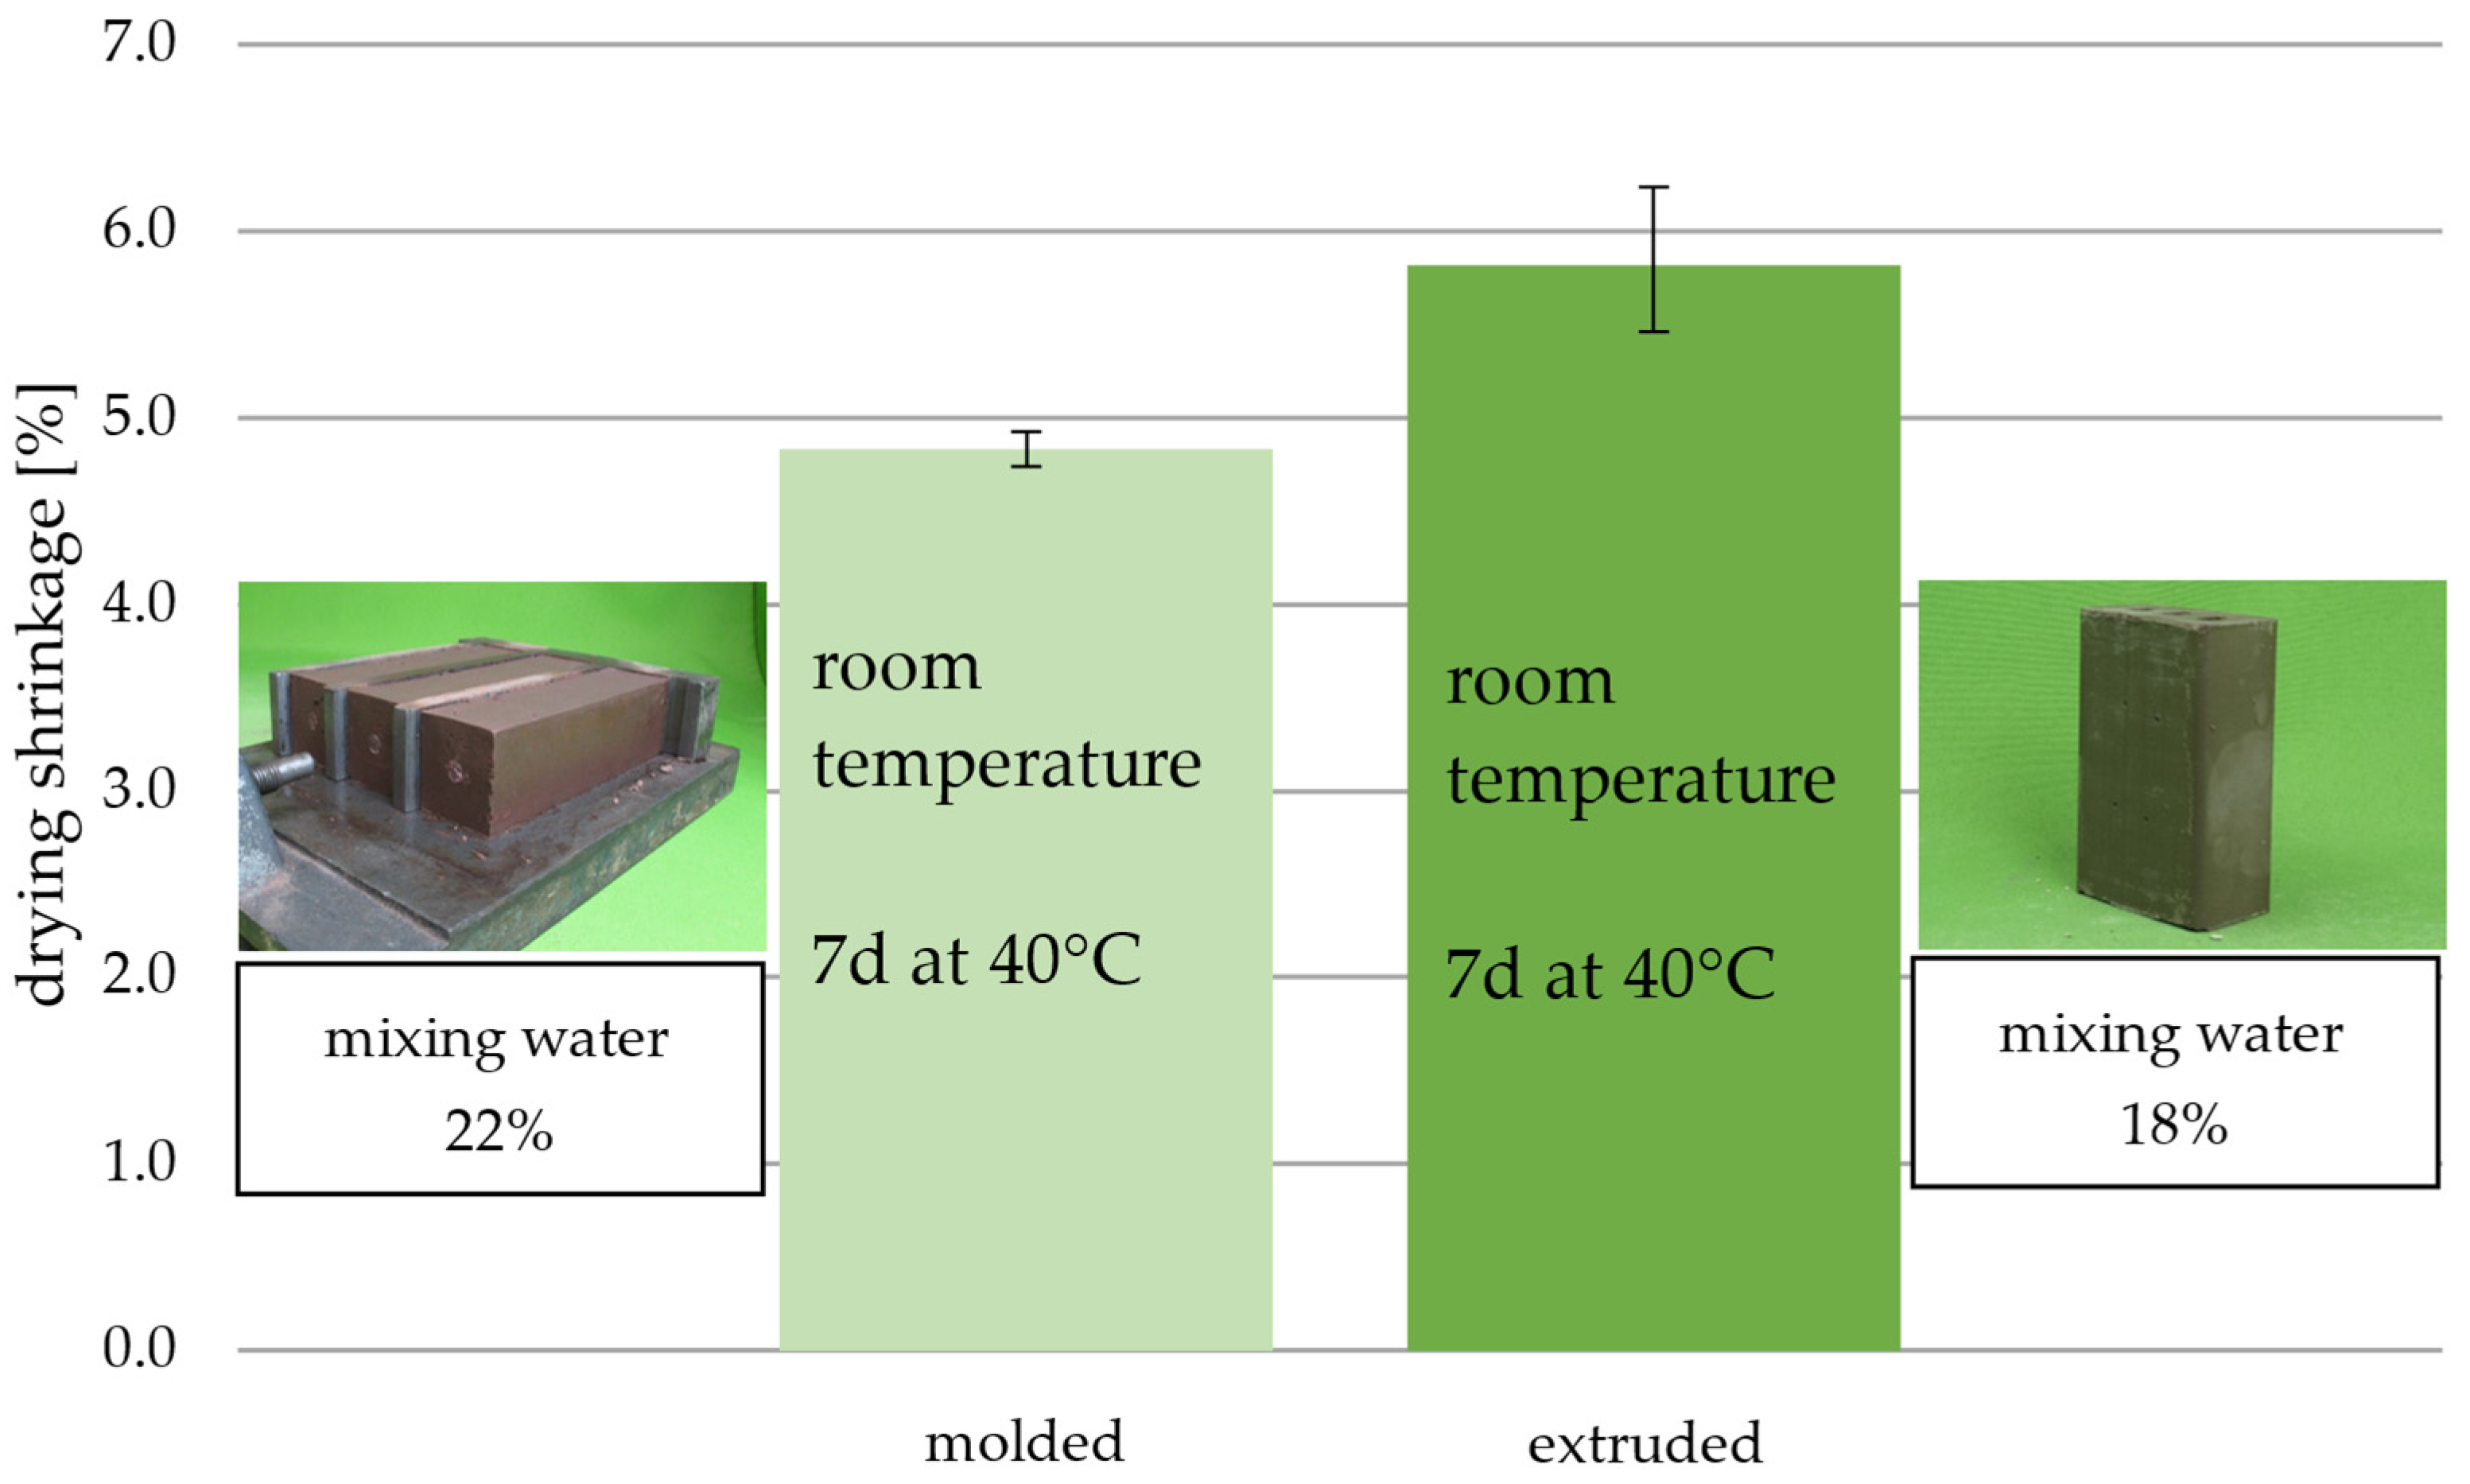
In addition to the molded prisms, extruded stones were produced using the same reference mixture. Both the molded prisms and extruded stones are initially air-dried at room temperature. Afterward, the molded prisms dry in an oven at 40 °C for seven days, while the extruded stones dry for three days. The drying shrinkage of both manufacturing processes is compared in
Figure 9.
Despite the higher amount of mixing water used, the molded prisms show a 1% reduction in drying shrinkage compared to the extruded stones. Additionally, the range of measurements for the molded stones is narrower than that of the extruded stones. One possible explanation for the more significant variability in the extruded stones measurement is the method used for assessment. The prisms are measured with an electronic caliper along the edges. In contrast, the extruded stones are measured using a device with a spike that is inserted into pre-stamped holes to evaluate drying shrinkage, which is marked immediately after production. However, the spikes have a certain tolerance in the stamped measuring points, which can lead to variations in the measurement results.
The notable difference in shrinkage values can be attributed to varying pressures during the production process. In molding, only local pressure is applied using a hammer, whereas, during extrusion, a nozzle pressure of several bars acts on the material. Furthermore, the device utilized is a vacuum extruder, which is also used on a larger scale to produce firebricks. This technique creates a vacuum around the loam mass before shaping, ensuring no air inclusions are present in the matrix. As a result of this compact structure, any water escaping from the matrix leads to an immediate contraction, translating mass loss directly into shrinkage. In contrast, molded bricks have a less dense structure that contains air-filled pore spaces. While this feature positively influences the degree of shrinkage, it also introduces a potential weak point in the clay brick matrix. The impact of the different processing methods on packing density and pore structure is outlined similarly to these findings in [
22].
Therefore, it can be stated that the vacuum extrusion molding process is preferable to manual molding due to the denser and more stable matrix.
3.6. Moisture Behavior
3.6.1. Swelling and Shrinkage Behavior
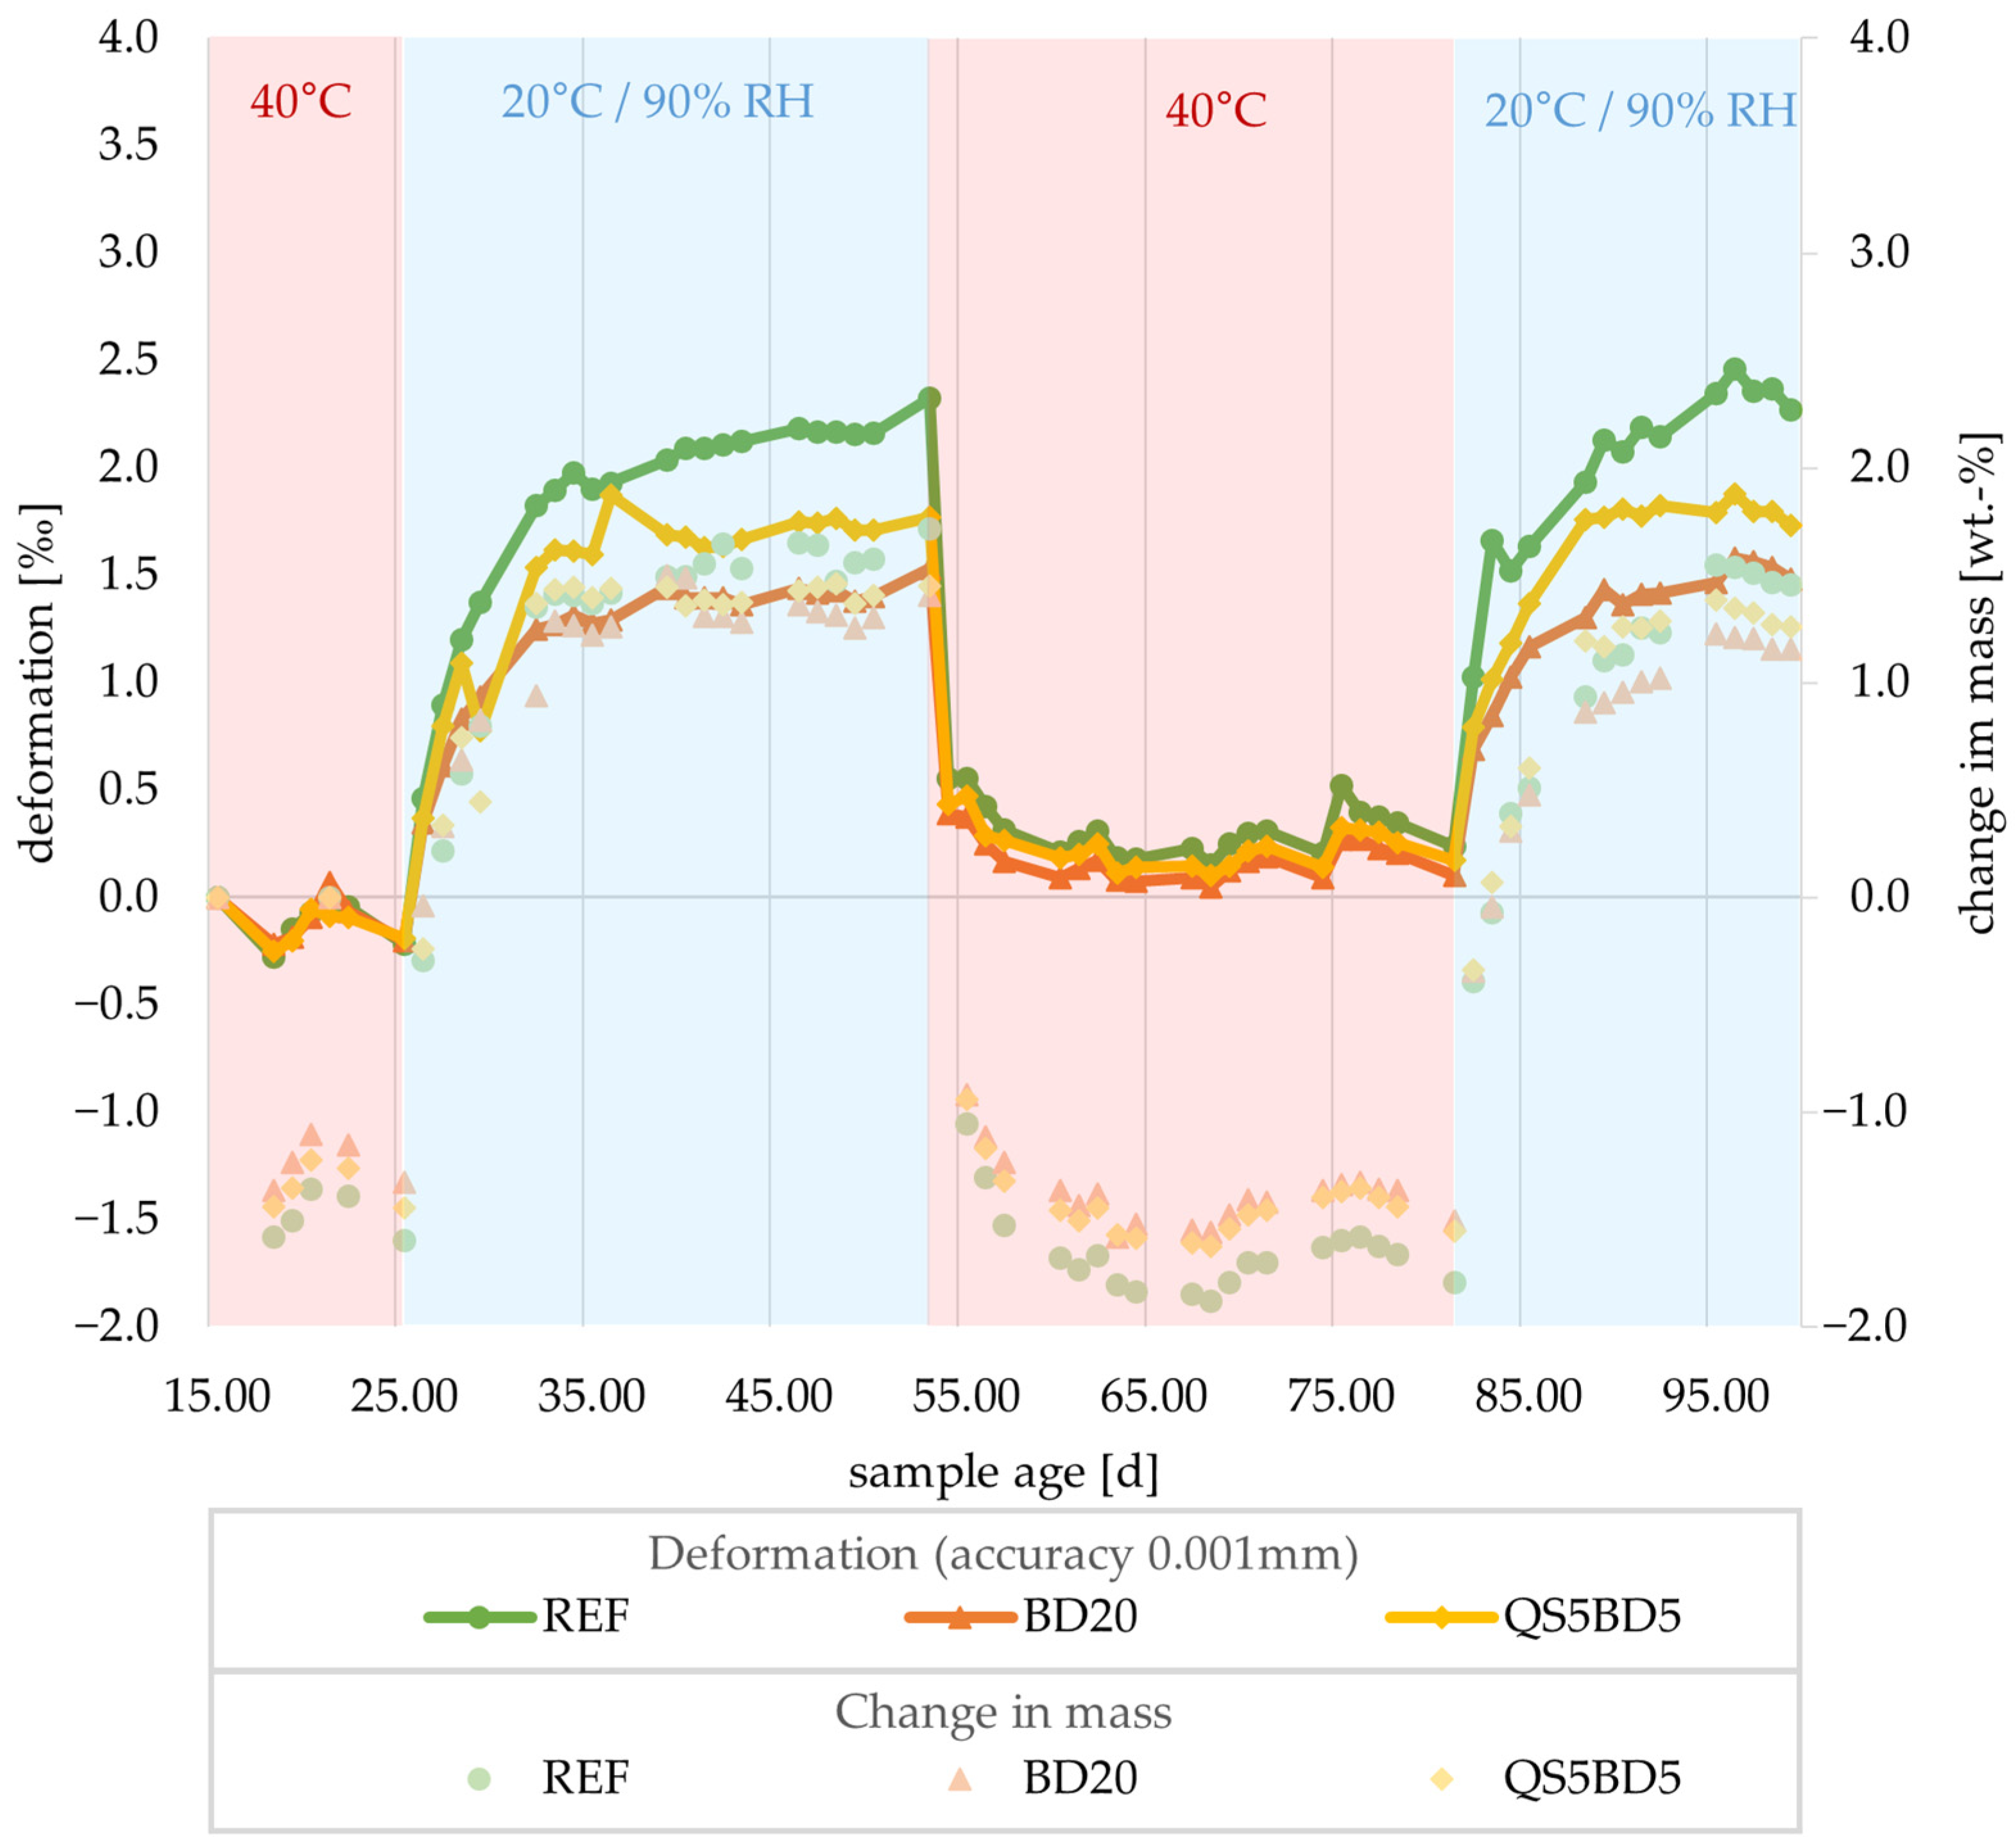
Over 95 days, long-term measurements of shaped loam prisms’ swelling and shrinkage behavior are conducted. This experiment is carried out following the selection and dosage of additives outlined in
Section 2.1.1. The results of the change in shape and mass are shown in
Figure 10.
During the initial drying cycle, all three test specimens exhibit a deformation of approximately −0.2‰. After an initial reduction in length during the first measurement, the deformation increases. This increase is attributed to other newly stored samples in the oven, which alter the humidity due to their high moisture retention. It takes an additional seven days for the deformation value and weight to stabilize, as they were measured after two consecutive days in the oven. At this point, all three mixtures achieve a similar deformation value of nearly −0.3‰. Throughout the first drying phase, weight loss parallels the deformations curve, with the most significant mass loss of 1.6% observed at REF. In contrast, the most minor mass loss of 1.35% occurs at BD20. This indicates that the prisms with the highest clay content experience the most significant mass loss, while those with the highest additive content experience the least loss. The behavior of the prisms is similar to loams with different proportions of natural leaning minerals [
15].
After the prisms are dried, they are placed in an environment with a temperature of 20 °C and 90% relative humidity. Initially, all mixtures experience a uniform increase in length. However, after four days, the curves begin to diverge. While REF continues to show a steep rise, QS5BD5 and BD20 begin to flatten out noticeably. After 28 days of storage in humid conditions, REF exhibits a swelling of 2.3. In contrast, the mixture QS5BD5 results in a 25% reduction in swelling. The BD20 sample shows the most minor change in shape, with a decrease of 35% compared to the untreated REF mixture. Additionally, a mass increase is monitored. A collapse in the change in the shape of the QS5BD5 sample occurs at 30 days, which can be attributed to a storage error. Those samples were exposed to significantly lower humidity for 16 h during this period. However, this storage error is compensated for after three days in the humid climate. At this point, the samples reach what is referred to as “shape constancy” aligning again with the behavior of the other samples.
When the subsequent drying cycle was initiated at an air temperature of 40 °C, the length was drastically reduced within one day. After seven days in the oven, it leveled off at a swelling of 0.1 to 0.2‰ compared to the initial state. A reduction in length below the initial state, as in the first drying cycle, could not be observed even after 28 days. At the same time, the weight decreases more significantly than during the first drying, reaching −1.8 wt.-%.
One possible explanation for the observed phenomenon is the enlargement of microscopic defects caused by molding. When molding occurs in three layers, defects tend to form along the layer boundaries. These defects cannot be entirely eliminated, even using a mallet for needling. After the initial drying, the mold-struck prisms have reached their maximum dryness. The significant moisture gradient during the rearrangement stage creates swelling pressure that causes these microcracks to expand. During the subsequent drying process, these cracks further enlarge due to both natural and internal shrinkage stress. At this point, the effects of microcracks can be seen in
Figure 9, as the contracting matrix is interrupted, resulting in a smaller length reduction. Additionally, these microcracks facilitate diffusion processes within the rock matrix, allowing moisture pockets that did not completely dry out during the initial drying phase to dry. This leads to a greater reduction in mass than what was observed in the first drying. However, the attempt to detect microcracks using saturated hydrocarbons yielded inconclusive results due to the rapid volatility of the pentane employed.
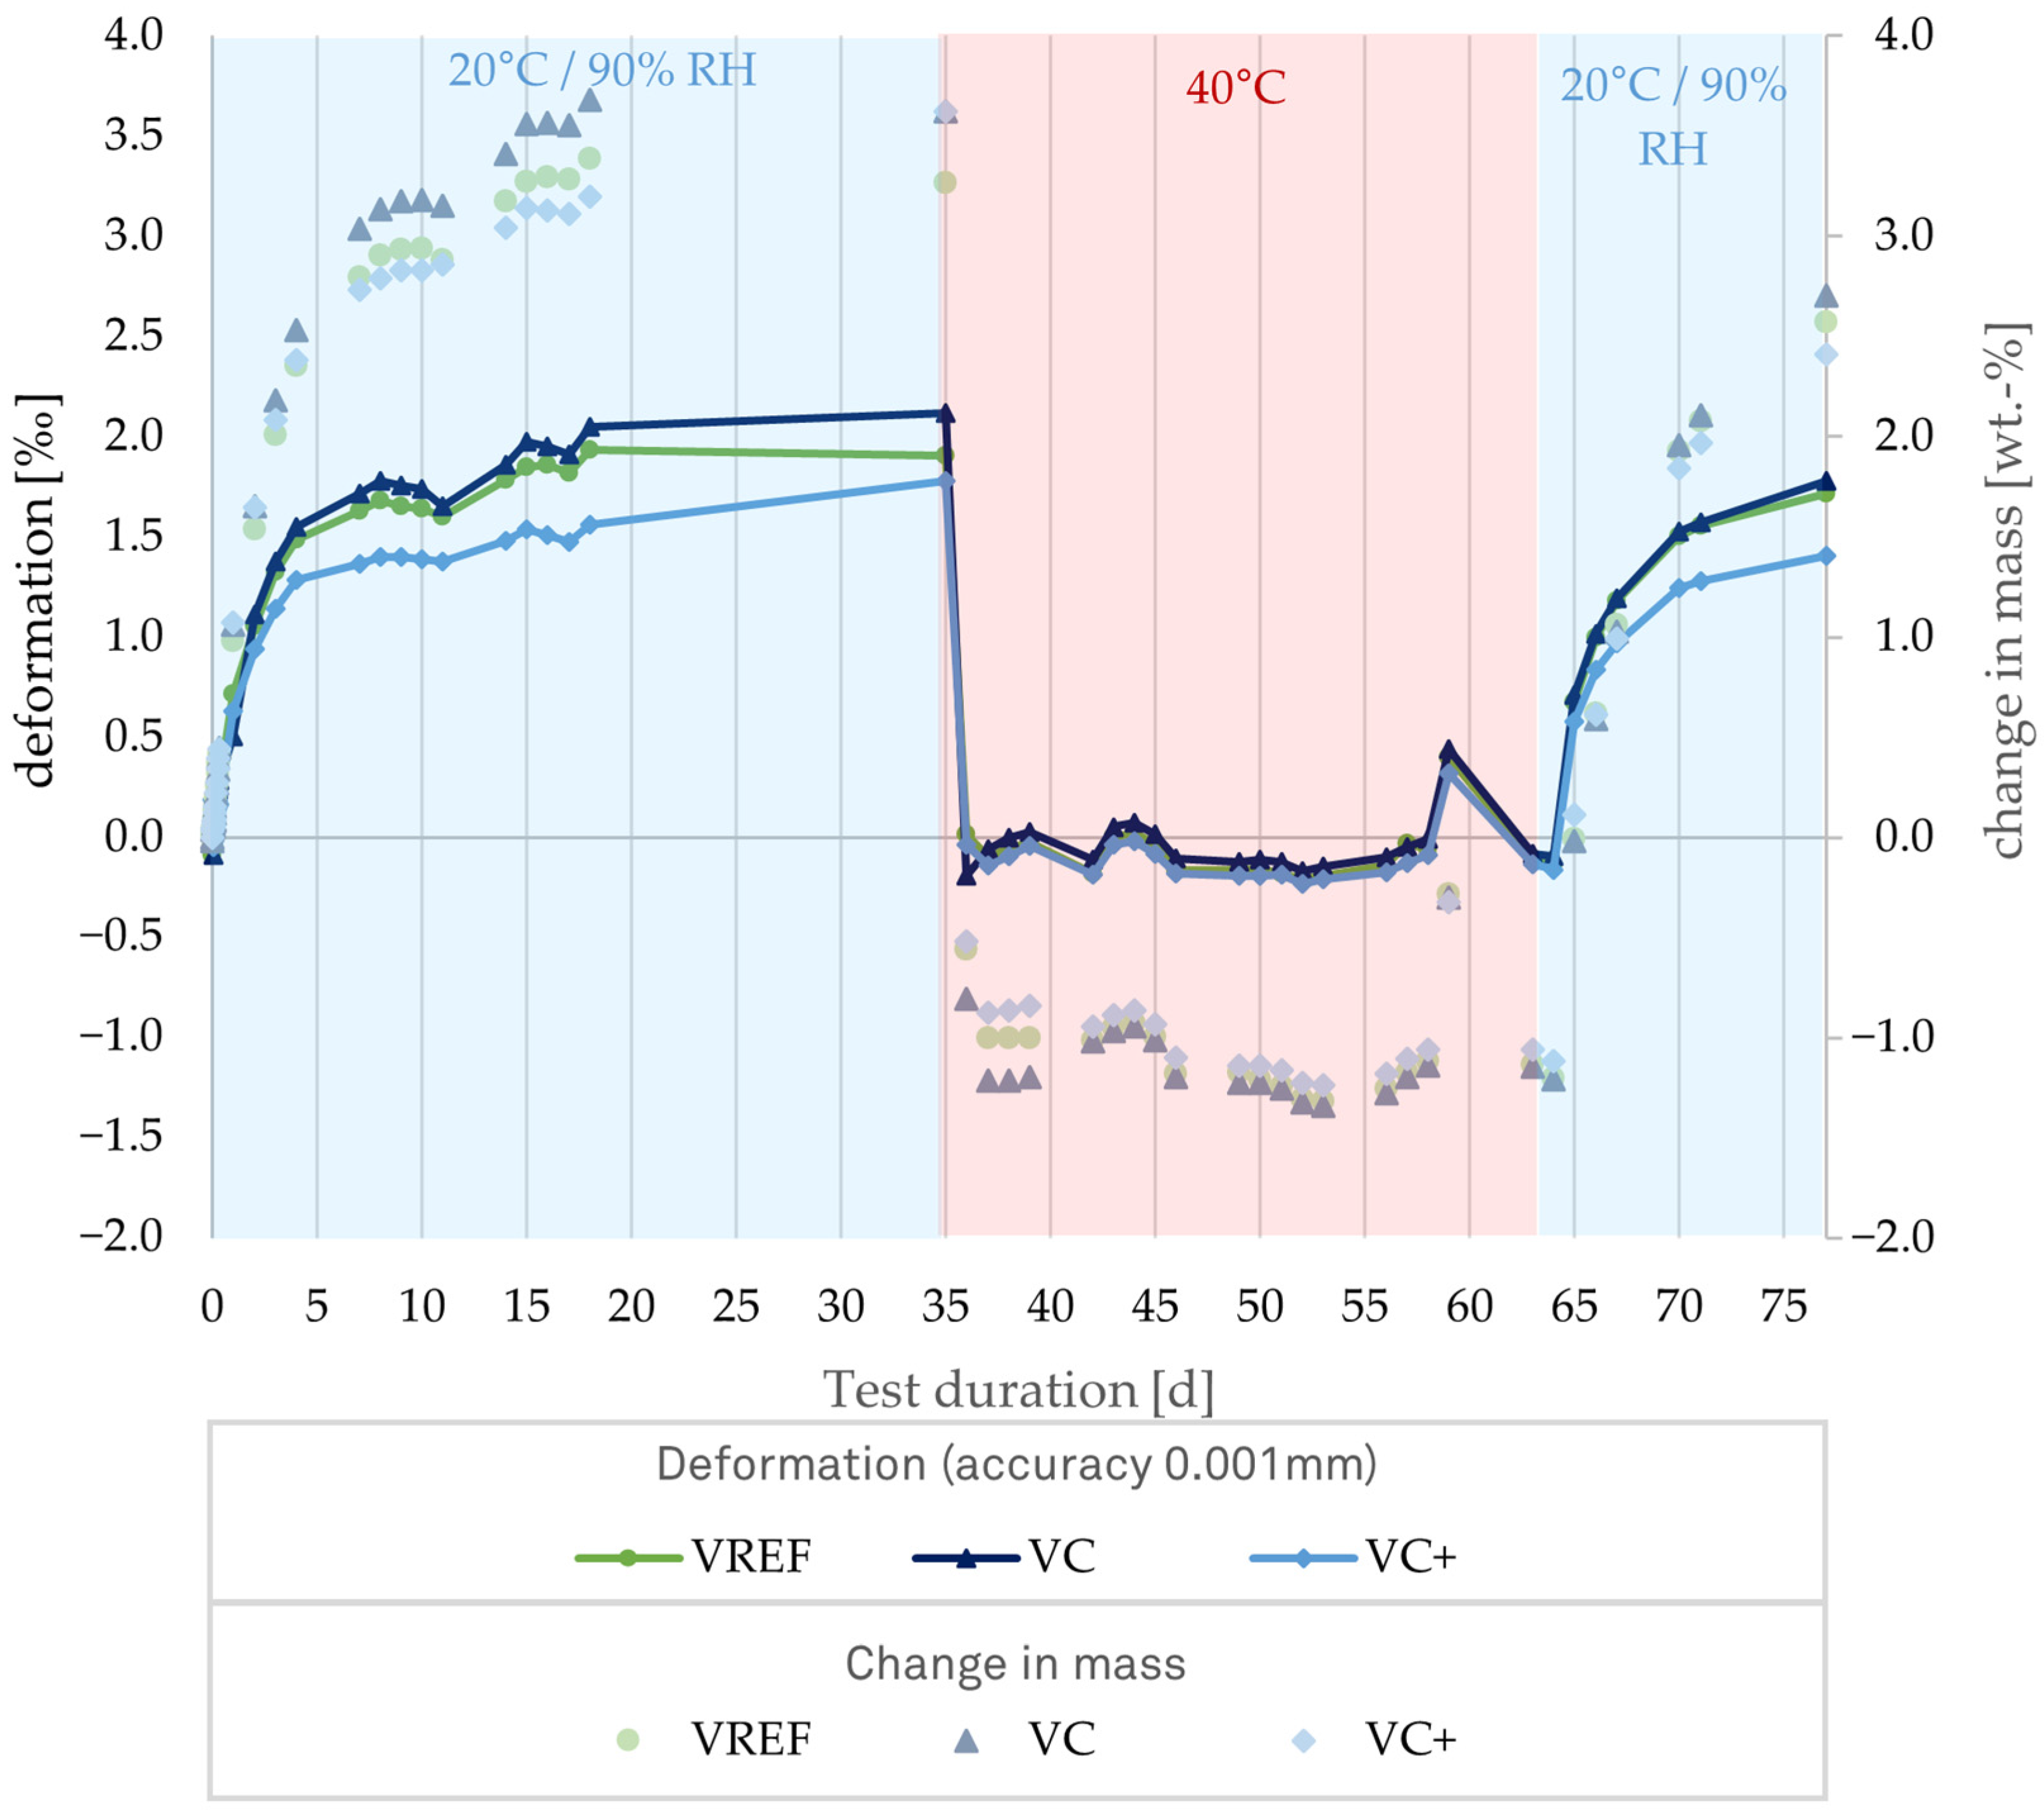
A similar experiment was conducted using a cycle on the extruded samples to compare swelling and shrinkage behavior. The measurement results are presented in
Figure 11. In this experiment, three different formulations were tested. The first formulation, VREF, has the same composition as REF in
Figure 10. The second formulation, VC, is a mixture with the same composition but coarser processing to a maximum of 2 mm. The third formulation, VC+, combines the coarser processed loam with 20 wt.-% added individual clay.
This alternating climate begins with moisture storage, unlike the previously tested molded prisms. Both mixtures, VREF and VC, show similar changes in shape, but the values for the VC mixture are consistently higher than those for the VREF mixture. The differences in shape changes between the two mixtures reach a maximum of 0.2‰ on the last day of storage in a humid climate. Meanwhile, the VC+ mixture remains 0.4‰ behind the other two mixtures for several days, only increasing to 0.2‰ below the VREF mixture on the final day. The weight development follows a similar trend. After the drying process begins, all samples stabilize in form constancy by the second day. The weight changes also reach a plateau within two days, with a mass decrease difference of 0.4 wt.-% between the samples. This difference initially adjusts after seven days in the oven. By that time, the three samples’ mass and shape changes are nearly identical.
During the second 14-day moisture cycle, the moisture and mass development of the VREF and VC mixture remain nearly identical. In contrast, the VC+ mixture exhibits a 17% lower swelling deformation.
The findings of this investigation indicate that lean clay was used as an additive. The inert components present serve as a natural thinning agent, reducing both swelling deformation and potential weight fluctuations. Compared to the results shown in
Figure 9, it can be observed that the mold-struck loam mixture QS5BD5, with a swelling deformation of 1.7‰, is in the same range as the extruded VC+, which has a swelling deformation of 1.8‰.
When comparing
Figure 10 and
Figure 11, it is evident that the extruded samples with +3.2 wt.-% exhibit a more significant increase in mass than the prism samples with +1.5 wt.-%. Additionally, the mass decrease at 40 °C is 0.5% lower for the extruded stones. One possible explanation for this difference is that the extruded stones have a larger surface area than their volume.
When examining the effects of the additives, it is observed that the BD20 mixture exhibits values comparable to the VC+ mixture after being stored at 90% relative humidity. This suggests that the added clay is lean with a high proportion of inert minerals.
Additionally, there is a difference of 0.4‰ between the REF and VREF mixture at the end of storage at 20 °C and 90% rel. humidity. One possible explanation for this difference could be the changes in the molding process. The impact of the molding process is already evident in the drying shrinkage observed.
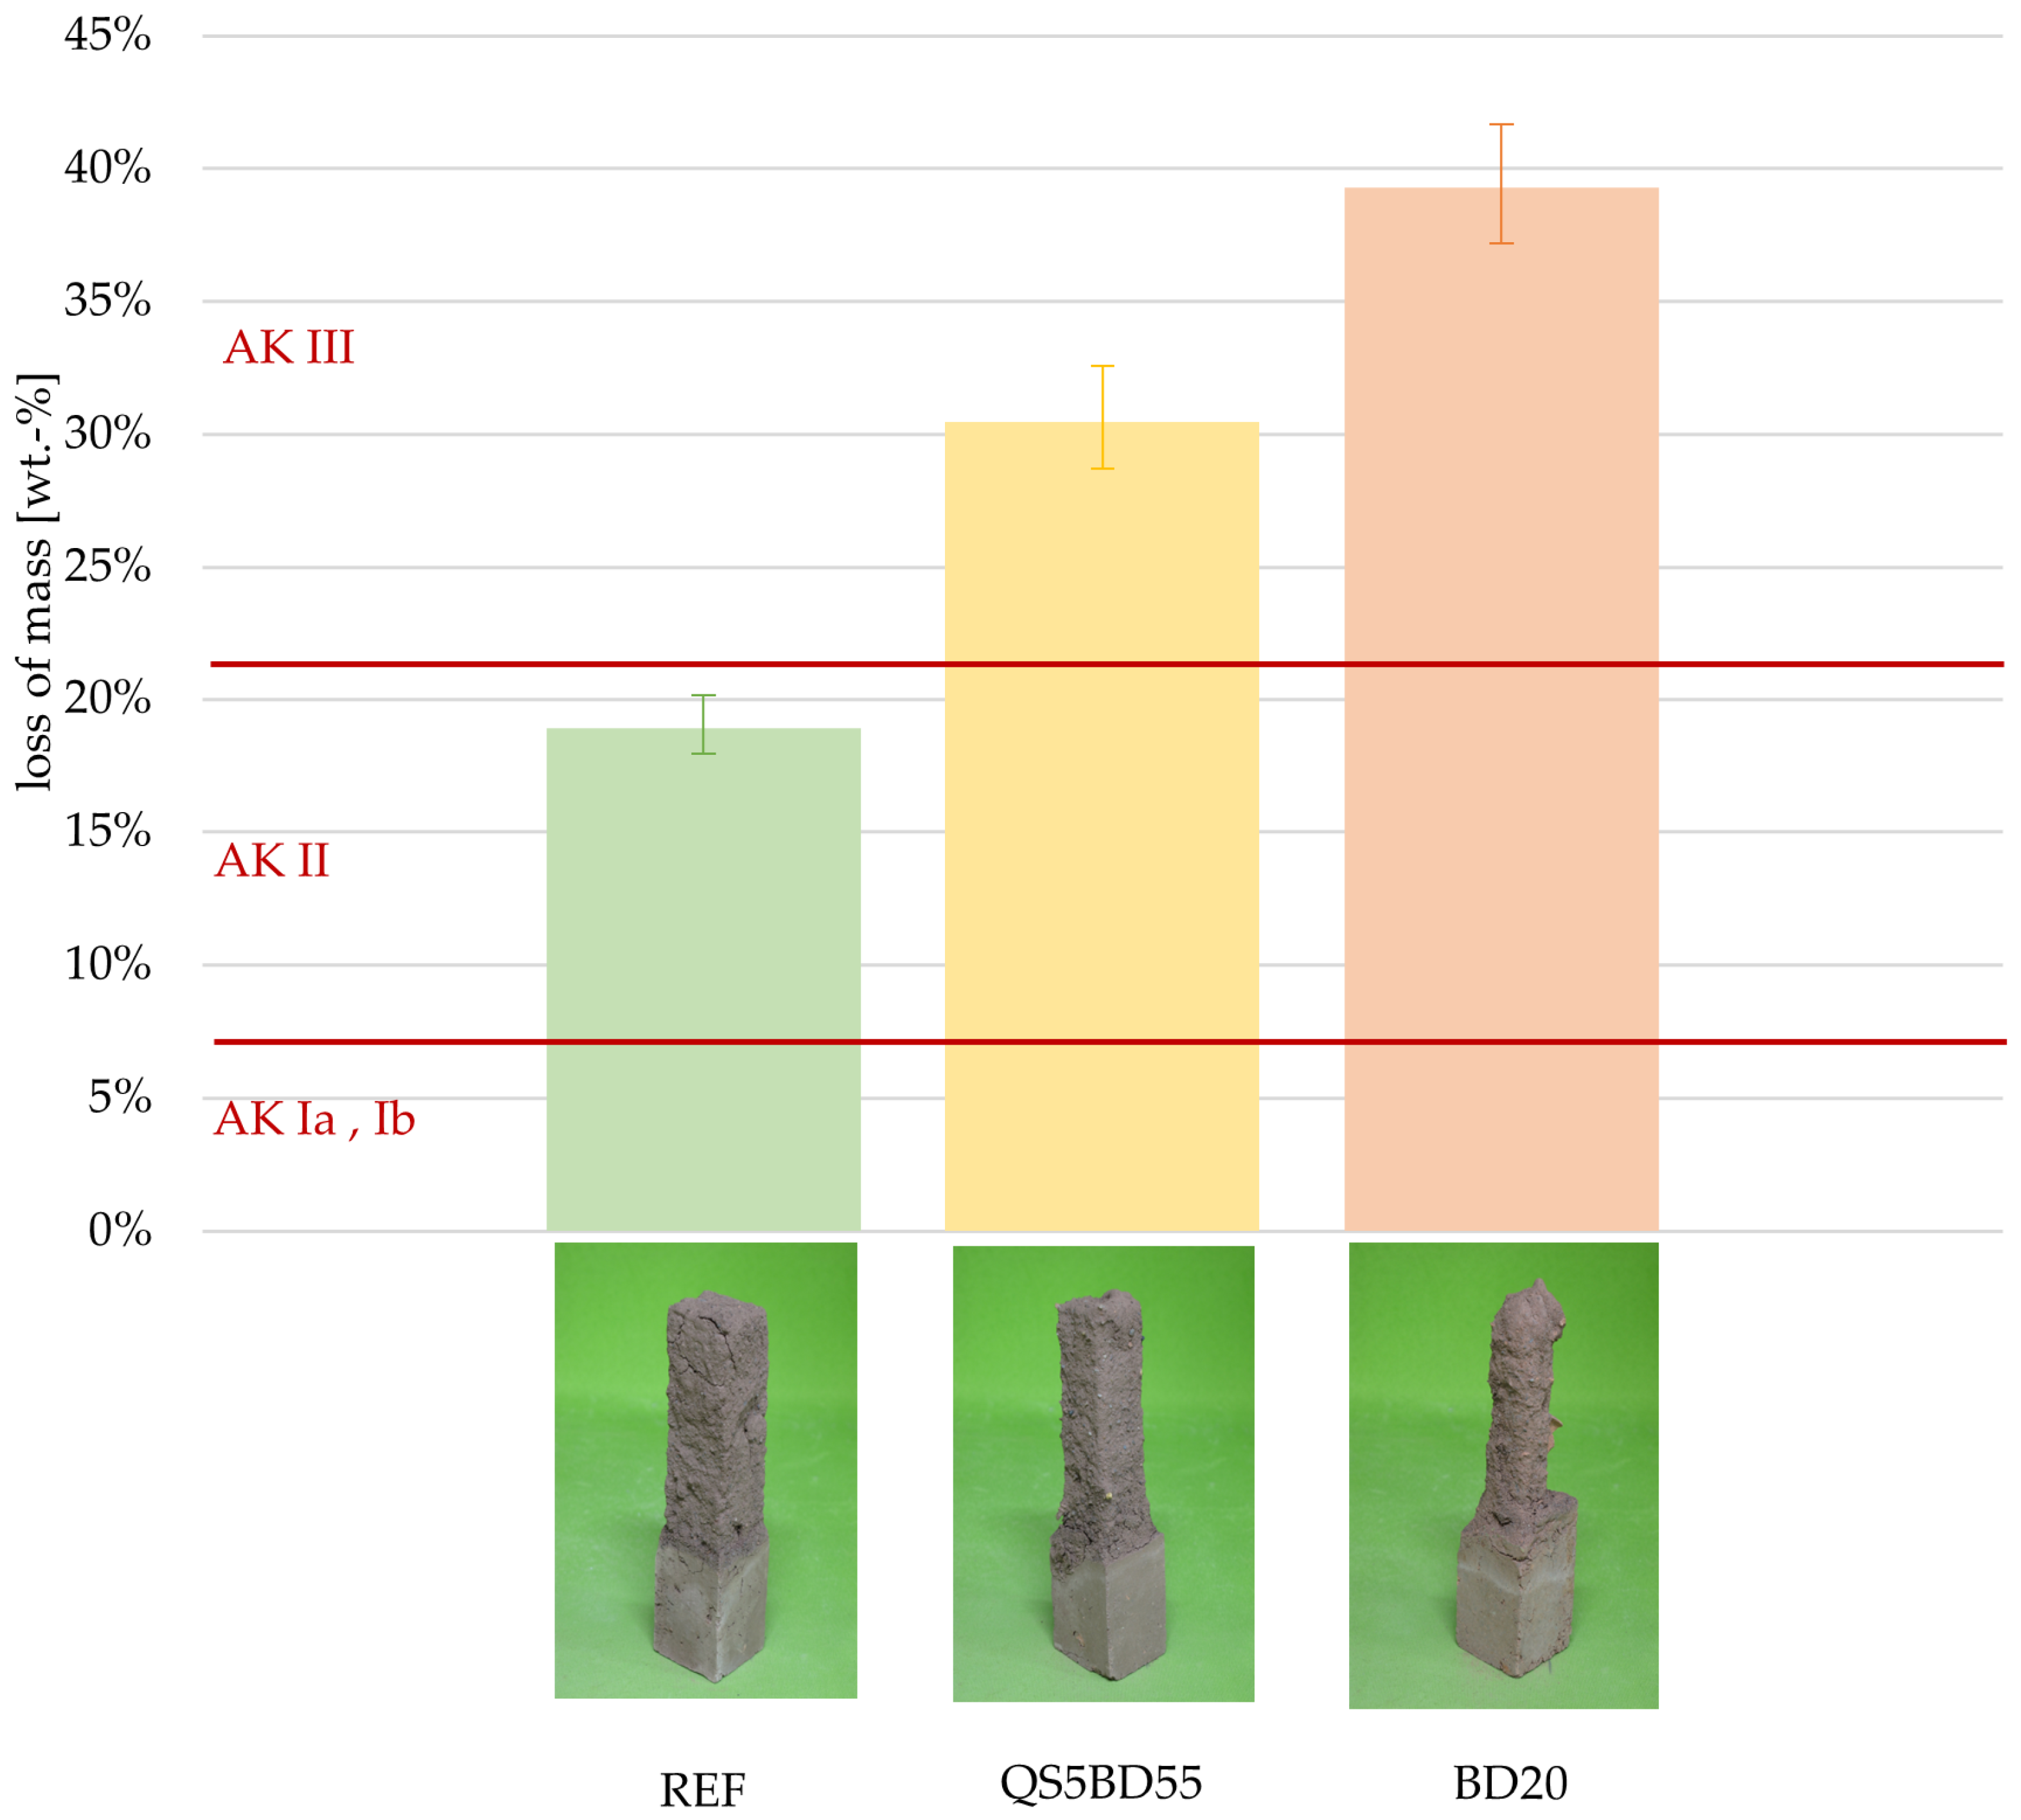
3.6.2. Immersion Test
The mass percentage losses observed during the immersion test after 10 min in a water bath are displayed in
Figure 12. An example of a prism stump following the test is shown next to the corresponding columns.
Among the three variants examined, the REF sample exhibits the lowest loss on immersion, maintaining a classification of AK II at 19 wt.-%. In contrast, the BD20 mixture shows the highest loss on immersion at 39 wt.-%. These results indicate that adding inert additives, such as sand and brick dust, increases immersion loss. The positive effects of the additives discussed in the previous chapters are not reflected in the dipping test results. One possible explanation is the molding process, which may result in a lower compaction of the structure compared to vacuum extrusion. As a result, the water can penetrate the matrix more quickly through the existing pore spaces, causing damage to deeper layers more quickly. Another reason, as noted in the literature, is the positive impact of high clay content on the binding force of loam mixtures [
22].


