Article

Optimization of Heat Transfer and Flow Performance of Microchannel Liquid-Cooled Plate Based on Orthogonal Test

1
College of Urban Construction, Nanjing Tech University, Nanjing 211816, China
2
Zhongtian Broadband Technology Co., Ltd., Nantong 226463, China
*
Author to whom correspondence should be addressed.
These authors contributed equally to this work.
Buildings 2025, 15(6), 905; https://doi.org/10.3390/buildings15060905
Submission received: 29 January 2025 / Revised: 10 March 2025 / Accepted: 11 March 2025 / Published: 13 March 2025

Abstract

Microchannel liquid-cooled plates are widely used in high-performance electronic devices, but their heat transfer performance and pressure drop characteristics face complex challenges in the design process. In this paper, a counter-flow rectangular microchannel liquid-cooled plate is designed, and the effects of velocity, aspect ratio, and inlet/outlet forms on its heat transfer and pressure drop performance are investigated through orthogonal tests and numerical simulations. The results indicate that the velocity plays a crucial role in determining the plate’s performance. While increasing the velocity substantially enhances heat transfer efficiency, it also causes a steep rise in pressure drop. The aspect ratio has a lesser effect on the performance than the velocity, and smaller aspect ratios help to achieve a balance between thermal and flow properties. The comprehensive optimization of the inlet and outlet forms and velocity has a significant effect on the temperature uniformity and pressure drop, and the design of the cooling fluid inlet and outlet form of CM (side inlet and middle outlet) can effectively improve the temperature distribution and reduce the pressure drop at high velocity. The design parameters with the best overall performance are the aspect ratio of 2, the velocity of 0.5 m/s, and the CM inlet/outlet form (K2V0.5CM). Comparison with other design parameter sets verified that this parameter set showed significant advantages in cooling effect, temperature uniformity, flow and heat transfer performance. Finally, the correlation equation on Nu is established, and the simulated Nu as well as the calculated Nu are compared. In this thesis, a counter-flow rectangular microchannel cold plate is designed to optimize the flow rate, channel structure and other parameters through orthogonal tests to reduce the temperature gradient and balance the heat transfer and flow resistance to meet the demand for efficient heat dissipation of 350 W CPU. This study provides an important reference for the structural optimization of microchannel liquid-cooled panels and the engineering application of high-efficiency heat dissipation systems.

1. Introduction

The exponential advancement of artificial intelligence and cloud computing has positioned data centers as energy-intensive nodal points in modern building ecosystems. With escalating heat flux resulting from high-power equipment clustering, thermal energy regulation has become a critical determinant of building energy performance. Conventional HVAC systems demonstrate limited capacity to reconcile the conflicting requirements of precision thermal control and energy efficiency optimization in hyperscale data centers. This energy management paradox necessitates the synergistic integration of advanced heat recovery architectures and adaptive cooling technologies within building energy systems.
Effective data center thermal design requires the co-optimization of facility-scale thermodynamic loads and equipment-level heat dissipation strategies. Through the systemic integration of liquid cooling circuits, waste heat redistribution mechanisms, and AI-driven predictive thermal controls, building energy systems can achieve concurrent improvements in the coefficient of performance (COP) and power usage effectiveness (PUE). The convergence of chip-level thermal challenges (driven by increased transistor density and heterogeneous integration) and facility-scale cooling demands underscores the imperative for holistic energy management frameworks.
The advancement of electronic chips toward higher performance, increased centralization, and miniaturization, coupled with the associated rise in heat generation, presents significant challenges for chip thermal management as well as for data center design and thermal control. For high heat flux electronic chips, traditional air natural cooling makes it difficult to meet the heat dissipation demand, and, although the parameter and structure optimization of air-cooled fins can achieve 60 W chip heat dissipation [1], it is difficult to cope with higher power consumption. In contrast, liquid water, with a specific heat capacity 3500 times higher than that of air and a thermal conductivity 25 times higher [2], it has become an effective means of heat dissipation for high heat flux chips [3]. Liquid cooling is divided into two categories: direct contact and indirect contact. Direct contact liquid cooling includes jet cooling [4], spray cooling [5], submerged cooling [6], and submerged jet cooling [7], etc., but the requirements for the cooling medium are high. Among the indirect contact liquid cooling, cold plate cooling is the most mature and widely used [8], and it is viewed as a crucial technology for addressing the thermal management challenges of chips with high power consumption [9].
Numerous studies have verified the effectiveness of liquid-cooled plates in heat dissipation of high heat flow density chips. Zhao J [10] et al. found that square pin ribs have better thermal performance compared to columnar pin ribs by adding pin ribs and optimizing the shape and angle of the pin ribs in the liquid-cooled plates. Song H [11] et al. designed and numerically simulated four different runner shapes, and the results showed that the double-layer structure of liquid-cooled plates is better than the other three types in terms of thermal and flow properties, and the best cooling performance is achieved with a 20% ethylene glycol–water solution as the cooling medium. Chiu H C [12] et al. investigated the effect of the diameter and gap rate of circular ribs on heat transfer and flow properties in liquid-cooled plates and found that the circular ribs significantly reduced the overall thermal resistance of the plates, whereas changes in the gap rate did not have a significant effect on the thermal resistance. As an improvement, Zhao K [13] et al. added circular ribs versus finned ribs to a conventional refolded liquid-cooled plate, and the results showed that the cold plate with added finned ribs outperformed the circular-ribbed cold plate with respect to overall performance. Unlike the traditional large runner cold plate, the microchannel cold plate has a leap in heat transfer efficiency, and the microchannel cold plate has a significant cooling effect on electronic chips with high heat flux [14,15].
Researchers have conducted in-depth studies on the structural parameters of the flow channels of straight microchannel cold plates. Chiu H C [16] et al. explored the effects of aspect ratio and cross-sectional porosity on the performance of cold plates. The findings indicated that the aspect ratio influences the thermal resistance of the cold plates to some extent. In contrast, the porosity in the range from 53% to 75% does not significantly affect the thermal resistance. Wang H [17] et al. analyzed the performance of microchannels of different geometrical shapes (rectangular, trapezoidal, and triangular), and it was observed that rectangular microchannels with aspect ratios between 8.904 and 11.442 performed the best, while increasing the number of channels reduced the thermal resistance but was accompanied by a higher pressure drop. Kumavat P S [18] et al. investigated the effect of sinusoidal waves with different pulsation frequencies in the range of 0.02 Hz to 25 Hz on the flow of the cooling work mass, and the findings revealed that heat transfer is poor at low frequencies, while high frequencies significantly enhance the heat transfer performance. Subsequently, they further analyzed the impact of asymmetric sinusoidal pulsating flow on thermal performance [19] and found that its fast-fluctuating characteristics enhanced the fluid momentum and improved the heat transfer performance by 11% compared with the steady-state flow.
It has been shown that the addition of perturbation structures in straight microchannels can significantly reduce the thermal resistance of liquid-cooled plates, but it also increases the challenge of flow resistance. Haque I [20] et al. added rhombic pin ribs to rectangular microchannel cold plates to investigate the influence of various aspect ratios on thermal performance and flow characteristics, and the results show that incorporating rhombic pin ribs can substantially enhance thermal performance, with the largest increase in Nu at an aspect ratio of 1.00. Rehman M M U [21] et al. performed numerical simulations by adding different-shaped wall ribs (elliptical, trapezoidal, hydrofoil, rectangular) on both sides of a rectangular microchannel and found that hydrofoil-shaped wall ribs had the best overall performance with the least enhancement in entropy generation rate. Chu X [22] et al. introduced a vortex generator (SMA-VG) based on the automatic deformation of fluid temperature and found that the SMA-VG was better than the non-deformed vortex generator (NDF) and had a better performance than the non-deformed vortex generator (NDF). The deformed vortex generator (NDF-VG) significantly improves the heat transfer performance, and the Nu is increased by 112% and 9% compared to no generator and NDF-VG, respectively, at a heat flux of 100,000 W/m². Xia G D [23] et al. examined the impacts of inlet/outlet position, head shape, and cross-sectional shape regarding the efficiency of a microchannel cold plate, with the findings indicating that the intermediate inlet/outlet position has the best flow performance, the rectangular head shape has better flow uniformity, and the microchannel cold plate with offset semicircular or triangular concave cavity has better heat transfer than the rectangular microchannel.
Researchers have developed various non-straight microchannel designs to lower thermal resistance and pressure drop. Ahmed F. Al-Neama [24] et al. evaluated the performance of straight rectangular, single, double, and triple serpentine microchannel cold plates. Their findings revealed that the single serpentine design achieved a 35% increase in Nu and a 19% reduction in total thermal resistance at a volumetric velocity of 0.51 L/min, albeit with a higher pressure drop compared to the straight rectangular design. Toghraie D [25] et al. examined smooth, sinusoidal, and serrated microchannel cold plates, along with nanofluids, and found that serrated designs provided the best thermal performance. Furthermore, modifying the channel shape had a greater effect on heat transfer than using nanofluids. Wang X Q [26] et al. analyzed tree-branching microchannels, identifying the bifurcation angle as a critical parameter, with smaller angles significantly reducing temperature and pressure drop. Naqiuddin N H [27] et al. proposed a segmented microchannel design, optimizing fin and flow parameters using the Taguchi gray method. Their study concluded that a three-segment structure, with a fin width of 1 mm, length of 2 mm, transversal distance of 5 mm, and channel width is 1 mm, minimizes the pressure drop.
Researchers have explored better cold plate performance by innovatively improving traditional microchannel structures. Gilmore N [28] et al. designed an open manifold microchannel cold plate and compared its performance with that of traditional manifold microchannels, finding that the pressure drop was reduced by 45%~75%, but the change in thermal resistance was not significant, and the improvement in the thermal performance of the chamfering treatment of the tips of the microchannel walls was poor. Tan H [29] et al. proposed four numerical simulations to show that the spider web structure has the best thermal performance, and experiments further verify that the thermal performance of the optimized spider web microchannel cold plate is much better than that of the straight microchannel cold plate. Zhou J [30] et al. combined manifold microchannels with topology optimization and designed three kinds of optimized manifold microchannel structures, and the study shows that increasing the density in topology optimization leads to a more pronounced enhancement in heat transfer performance, but the pressure drop increases accordingly. Hung T [29] et al. proposed four kinds of biomimetic microchannel structures, and numerical simulations show that the topology optimization density and the heat transfer performance improvement are more significant. However, this is accompanied by a corresponding increase in pressure drop. Hung T C [31] et al. analyzed the thermal performance of a double-layer microchannel cold plate, and numerical simulation results showed that the thermal efficiency of a double-layer microchannel cold plate was enhanced by 6.3% compared to a single layer under the same geometry.
In summary, on the one hand, researchers have enhanced the heat transfer performance by optimizing the geometric parameters of straight microchannel cross-sections or adding perturbation structures [16,17,18,19,20,21,22,23], but there are large temperature gradients in the upstream and downstream of the straight microchannels, which may reduce the reliability of the electronic chip [27]. On the other hand, innovative designs of non-straight microchannel structures have been developed to reduce the temperature gradient and achieve a better balance between heat transfer performance and flow resistance [24,25,26,27,28,29,30,
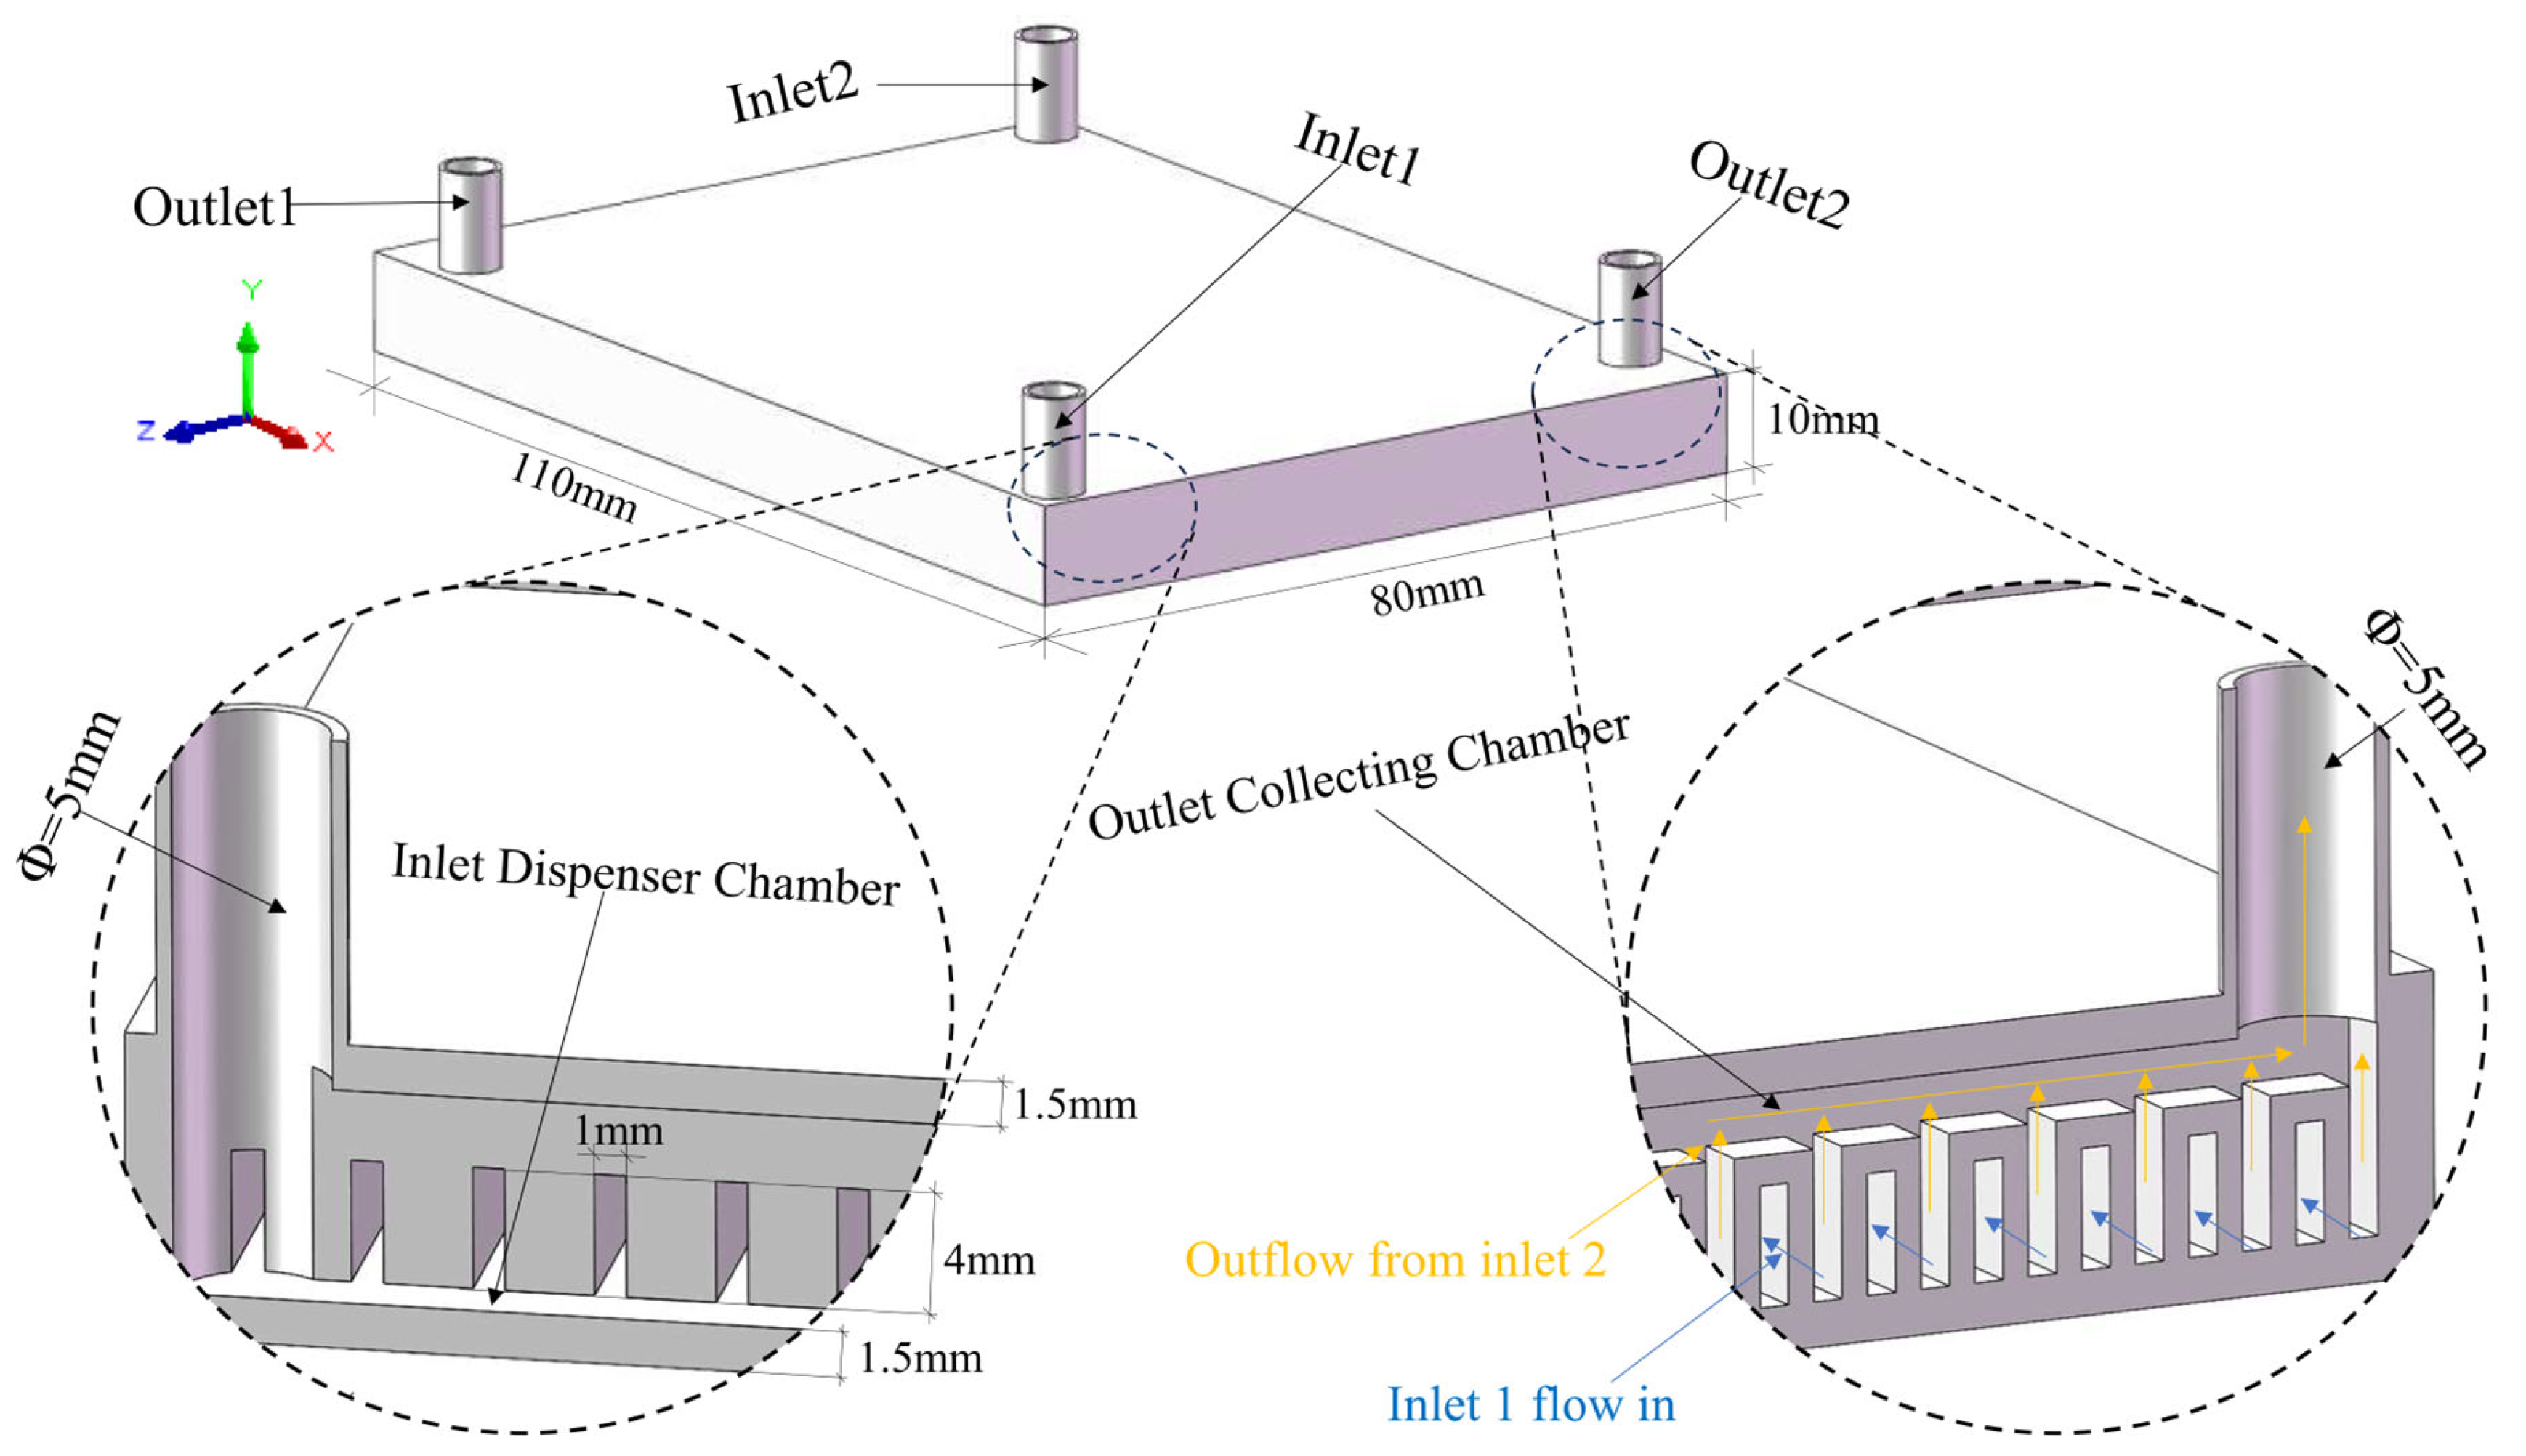
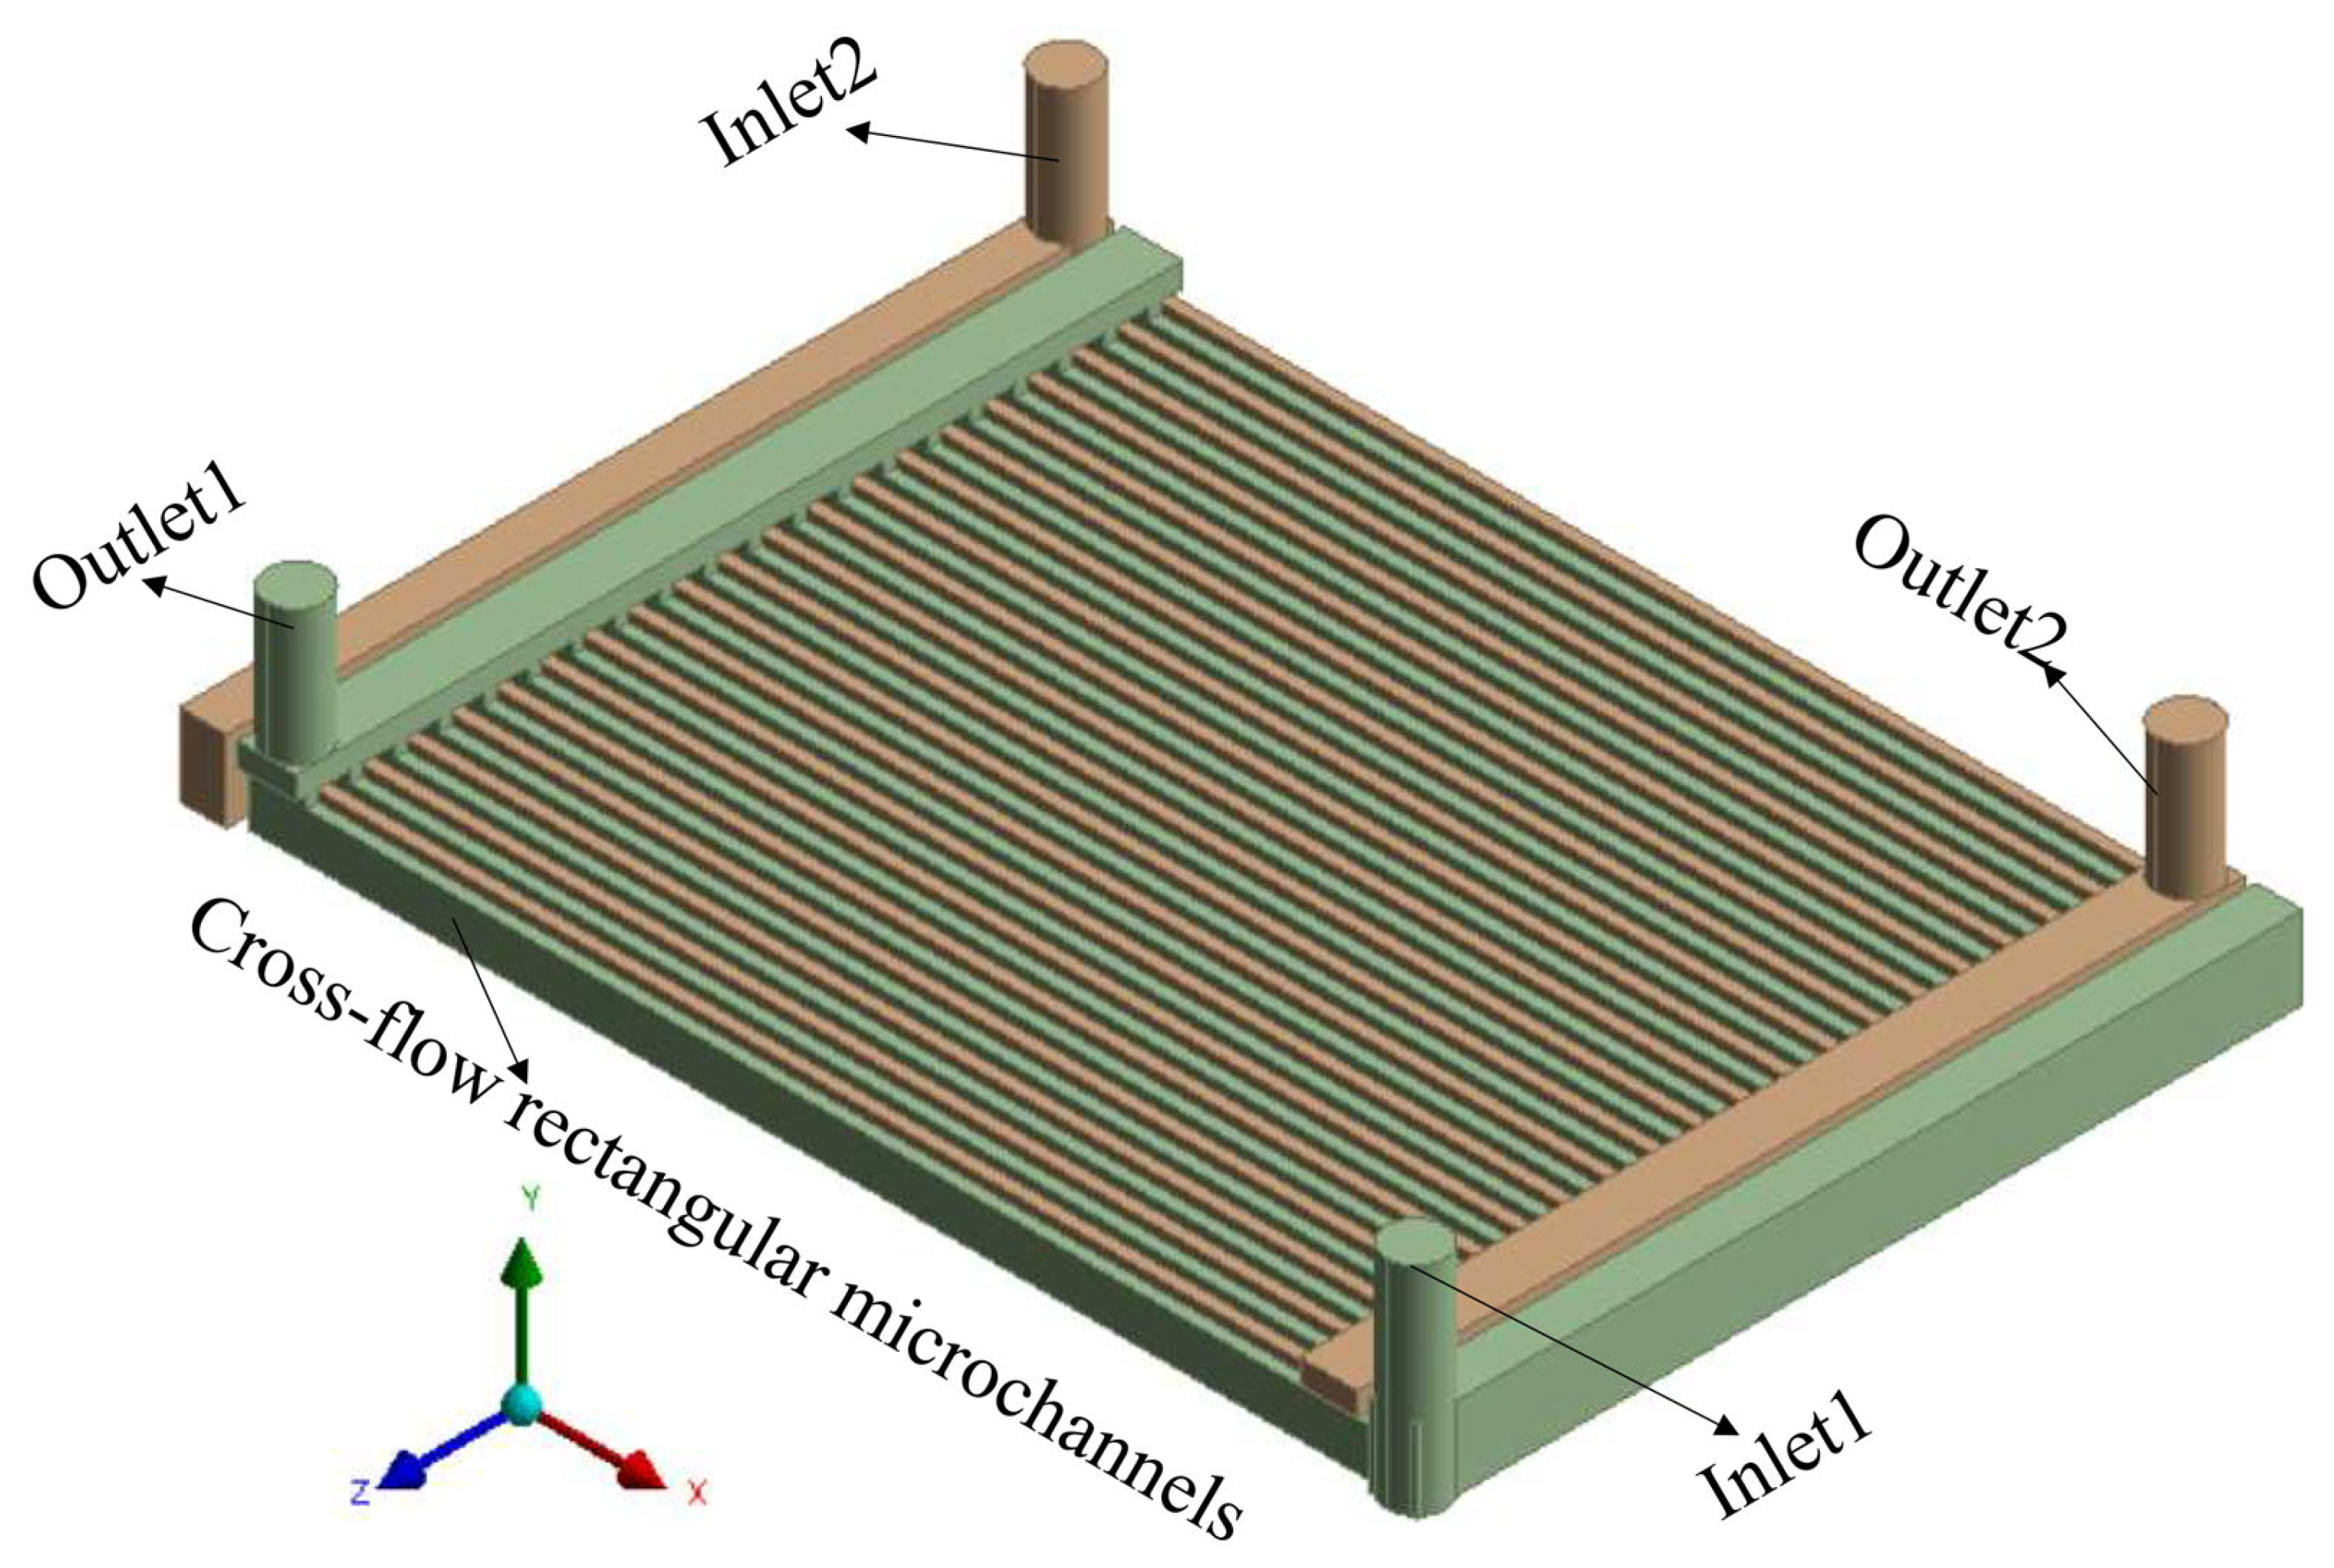
31]. Despite the problem of a large temperature gradient in a straight microchannel cold plate, the advantage of a smaller pressure drop relative to other microchannel cold plates is often overlooked. If this problem can be solved effectively, an optimal balance between heat transfer performance and flow resistance may be achieved. To this end, a counter-flow rectangular microchannel cold plate is designed in this paper to study the impact of velocity, rectangular flow, the channel aspect ratio, the form of import and export of the cooling medium on heat transfer, and flow efficiency of the cold plate. By designing orthogonal tests and numerical simulations, the effects of single-factor and multi-factor interactions on the efficiency of the cold plate is analyzed to identify the optimal parameter combinations, and the cold plate of the optimal parameter group is compared with the cold plate of the other parameter groups to verify the superiority of its cold plate performance. Finally, a correlation equation about Nu is established based on the simulation data, and the calculated Nu is fitted to the simulated Nu to determine the accuracy and predictability of the correlation equation.
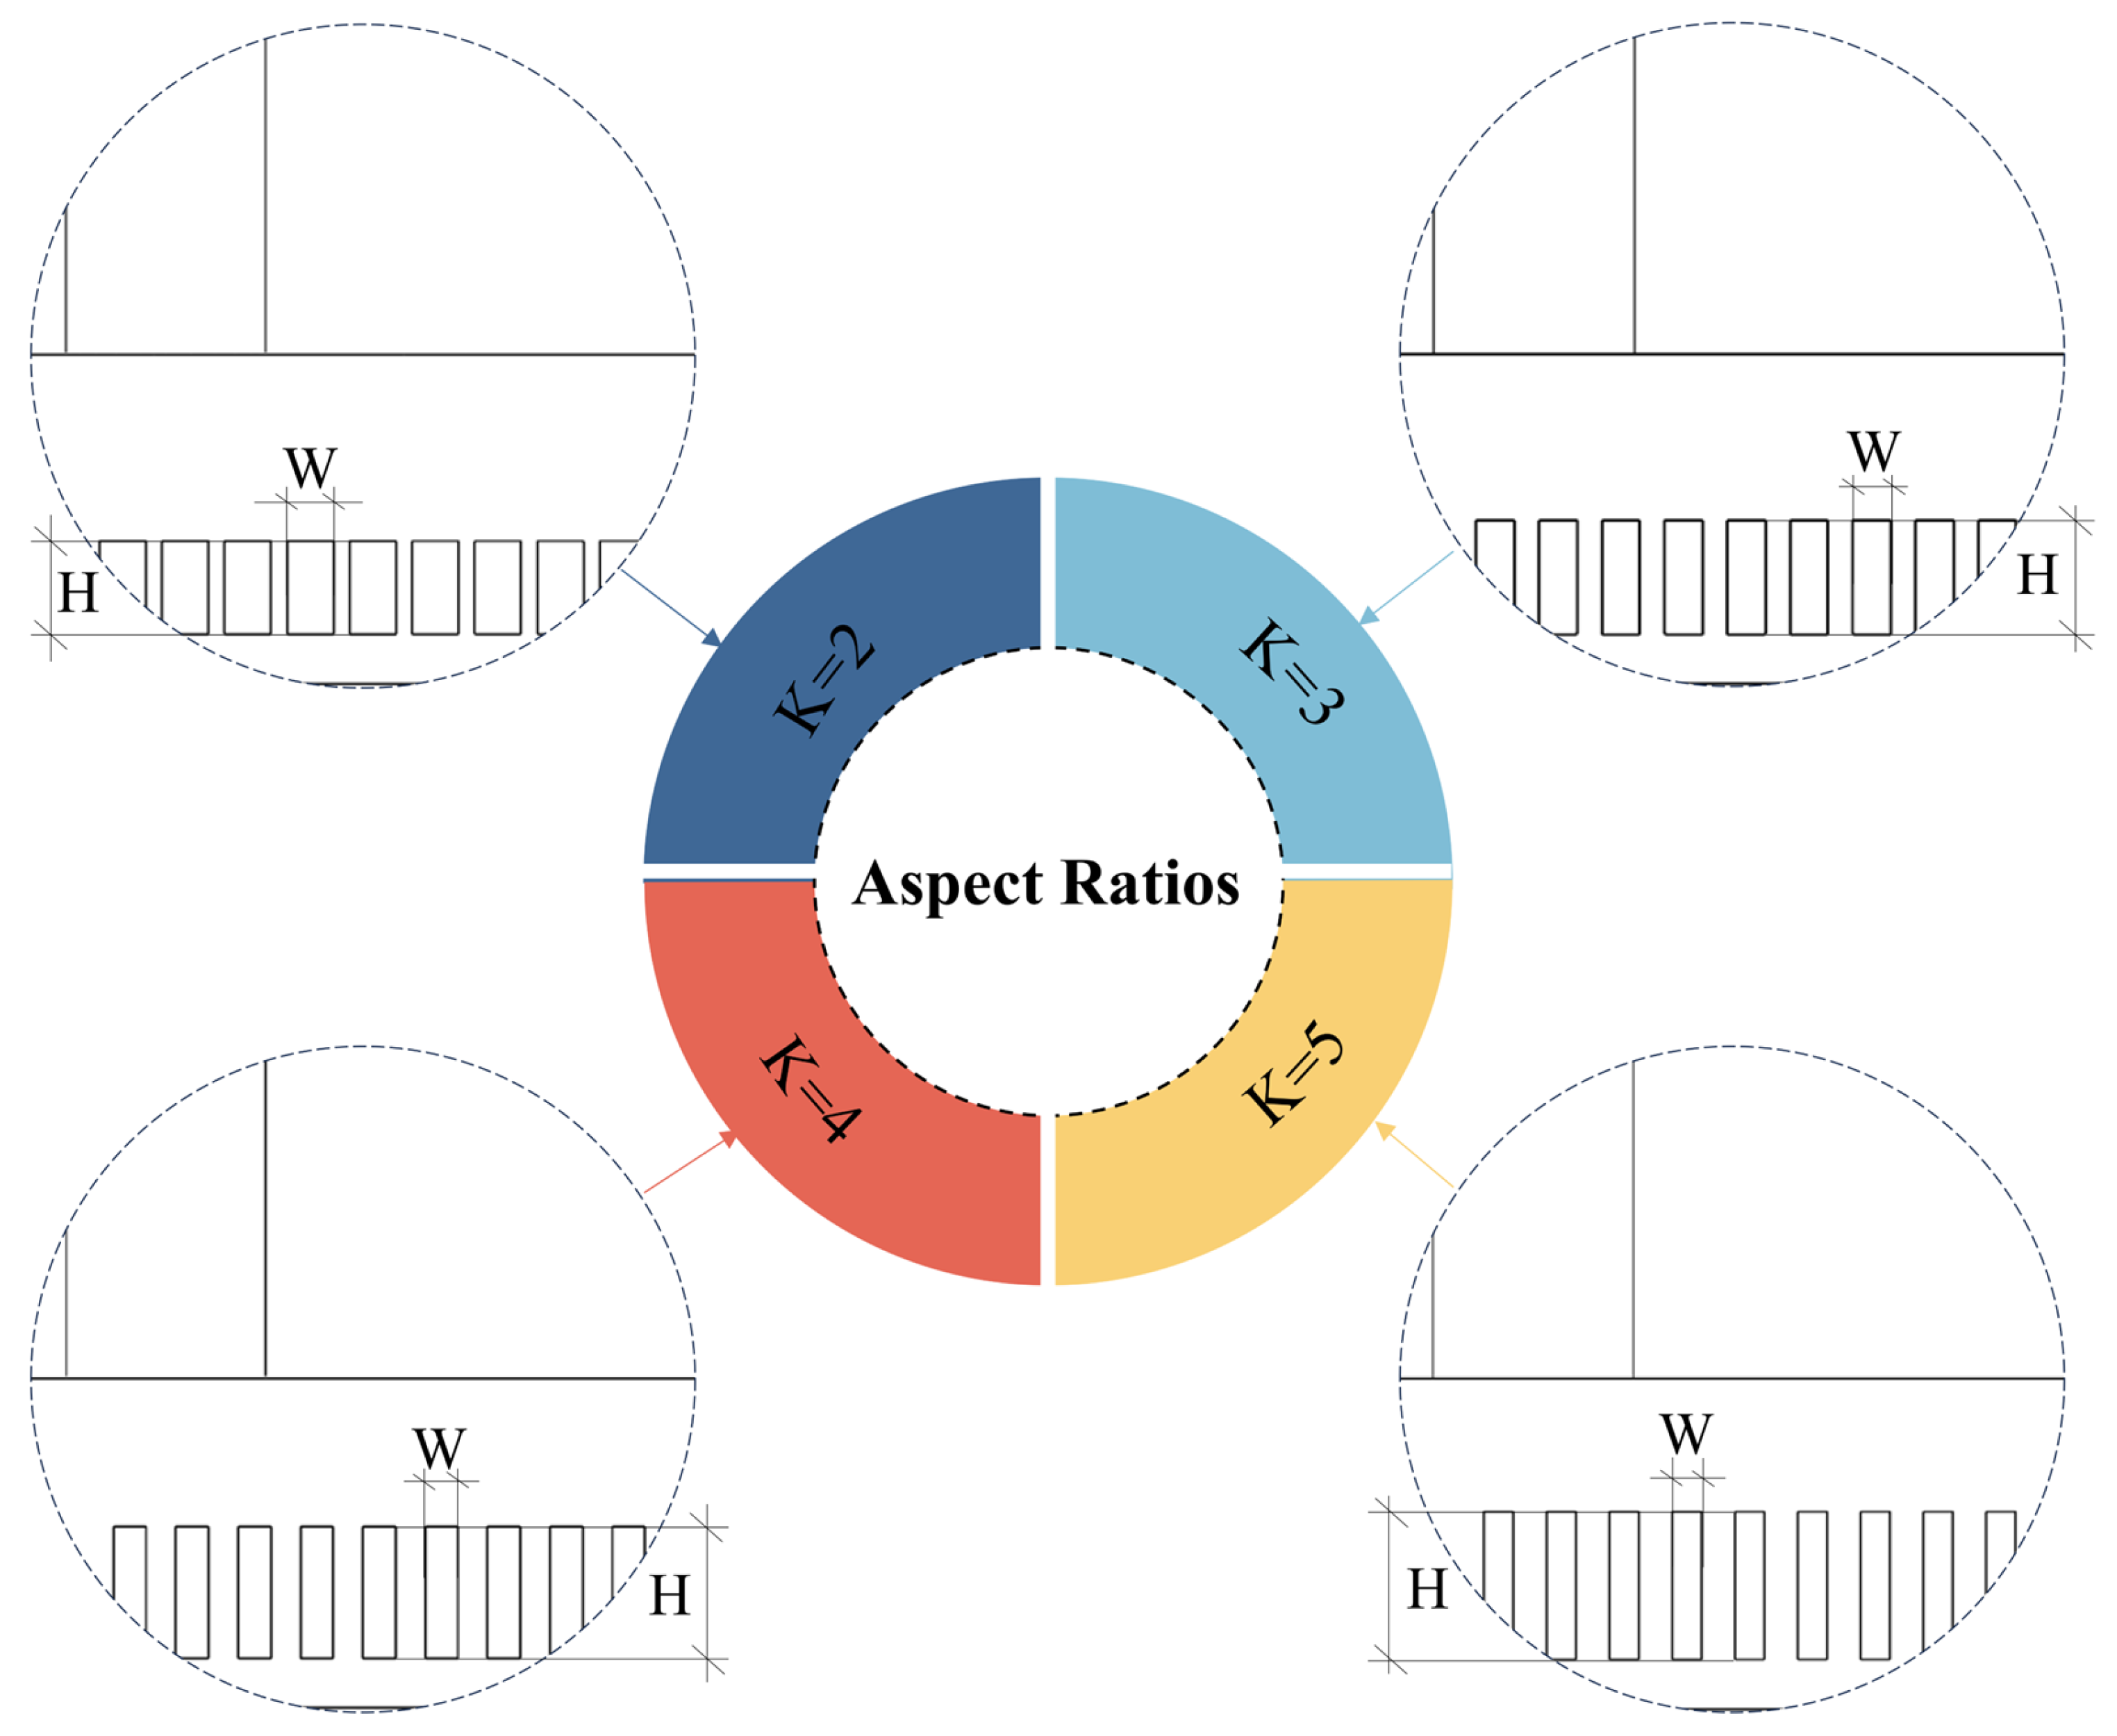
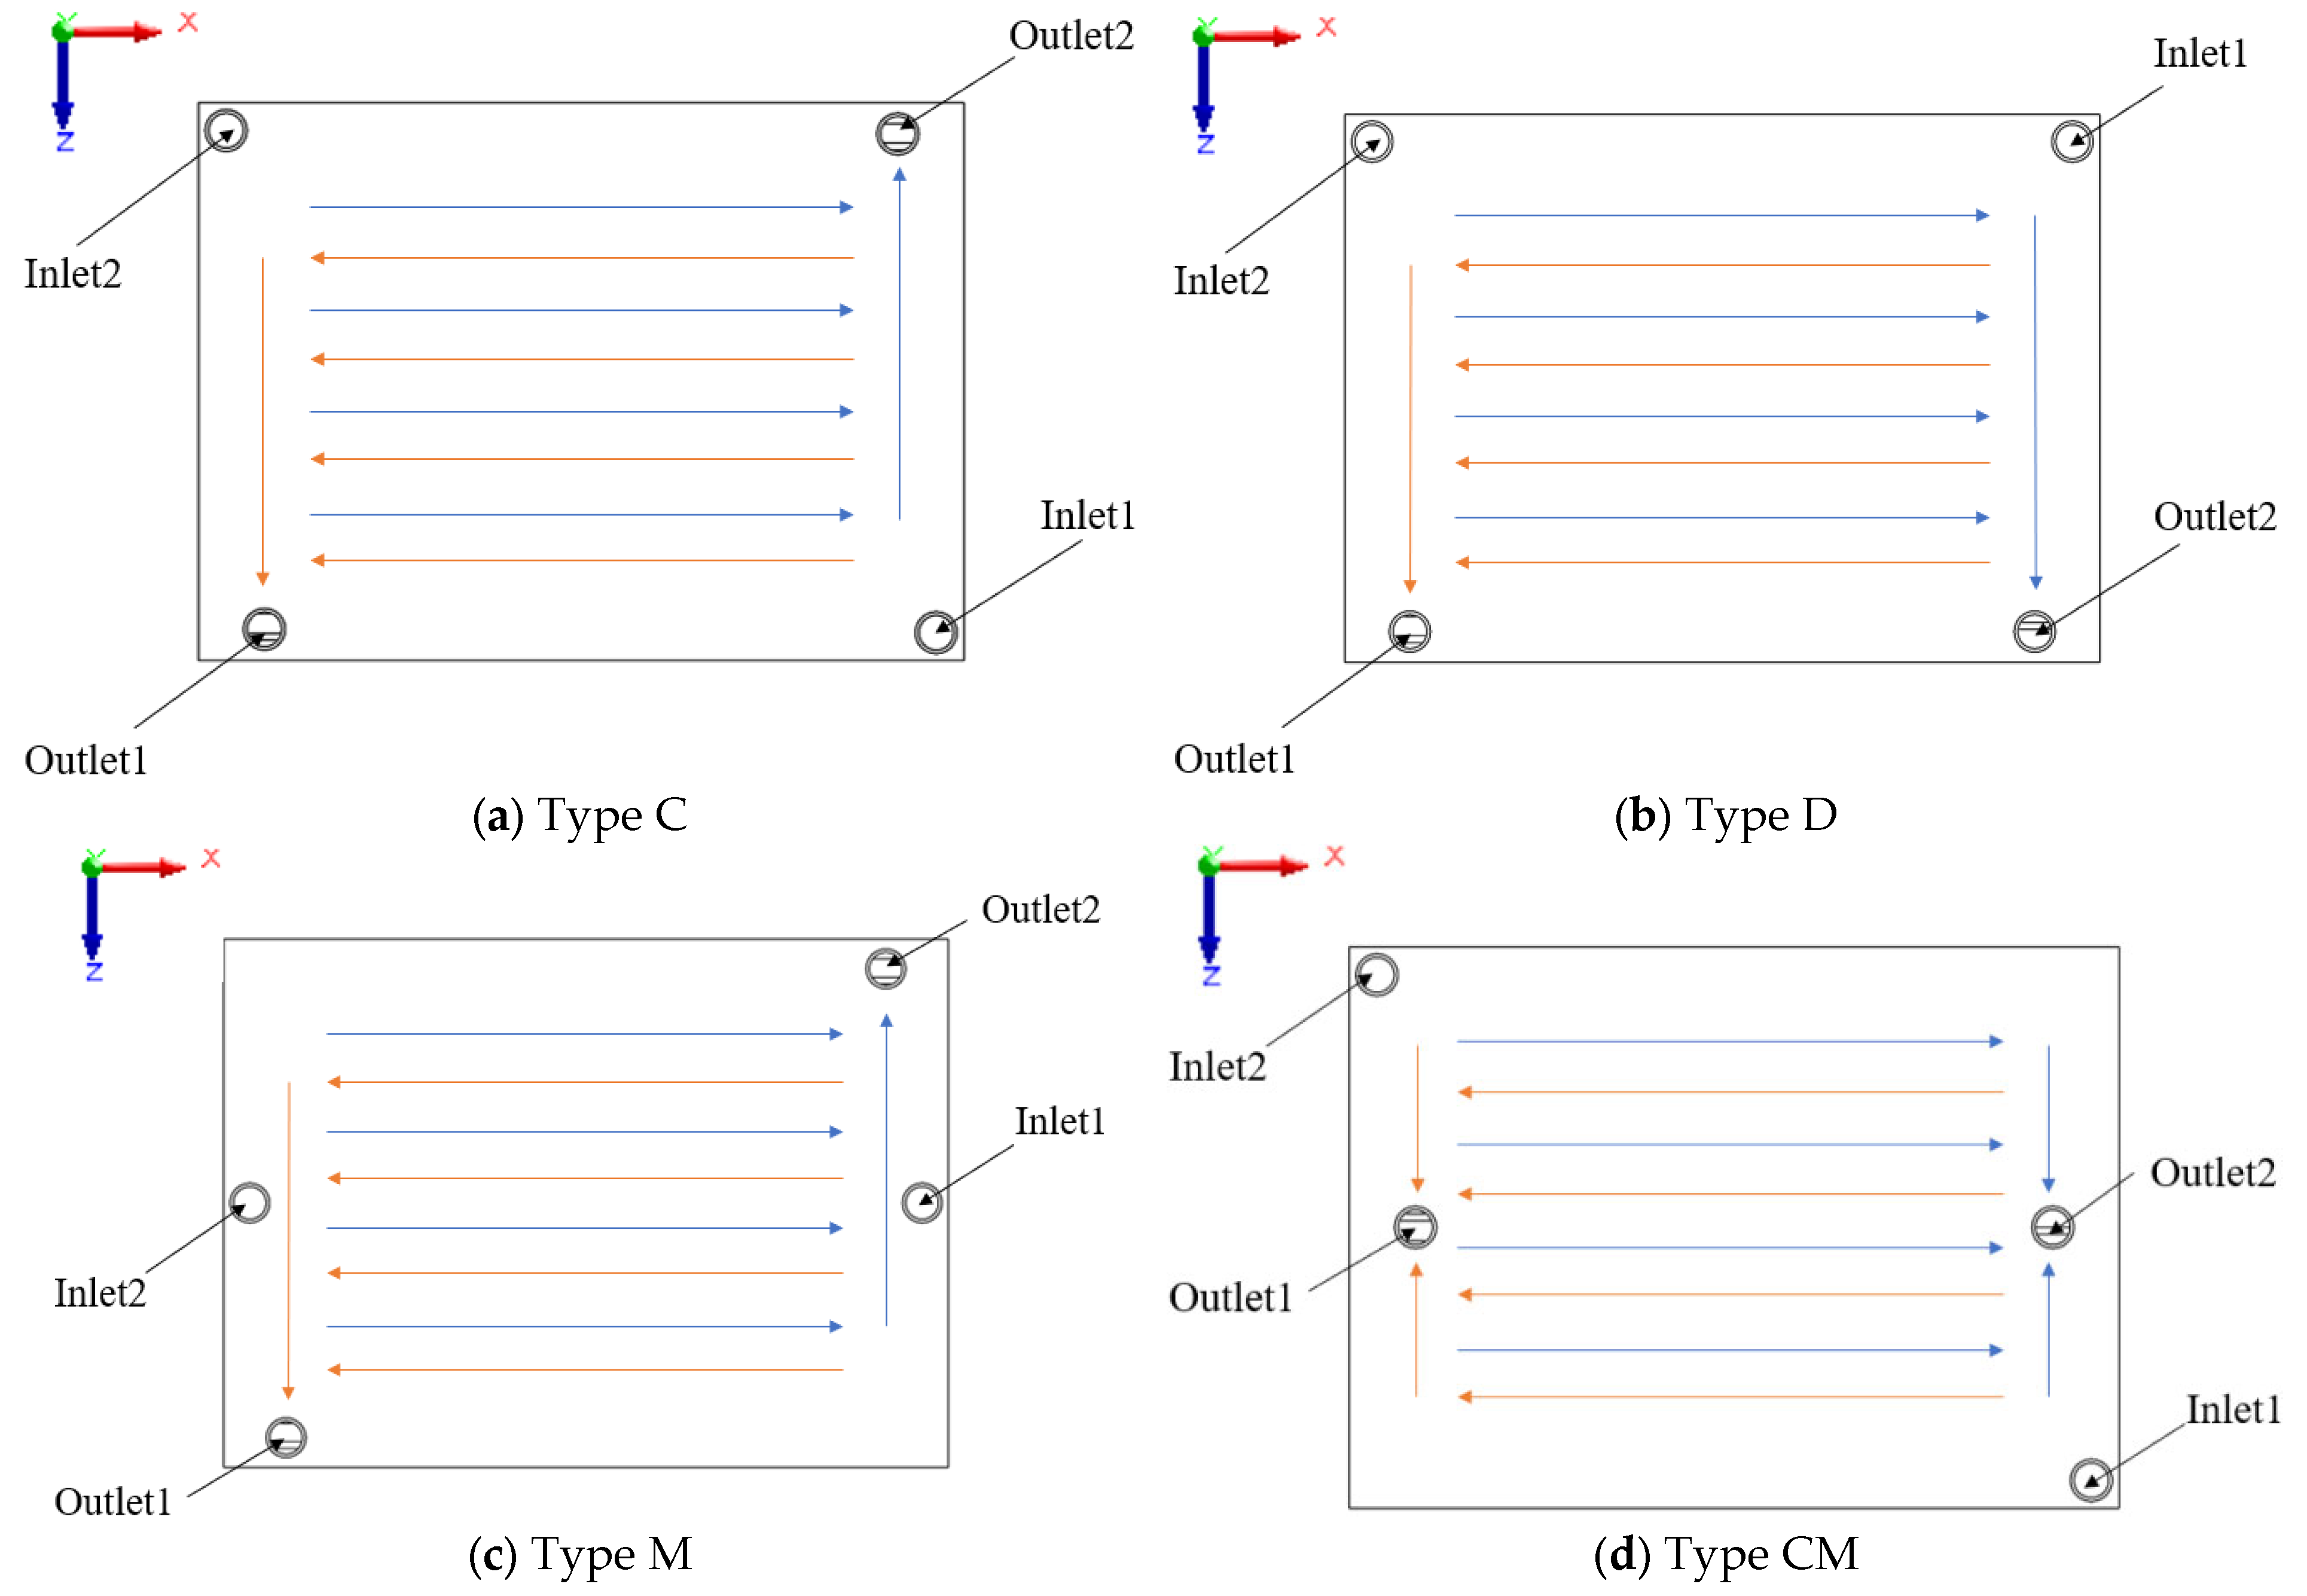
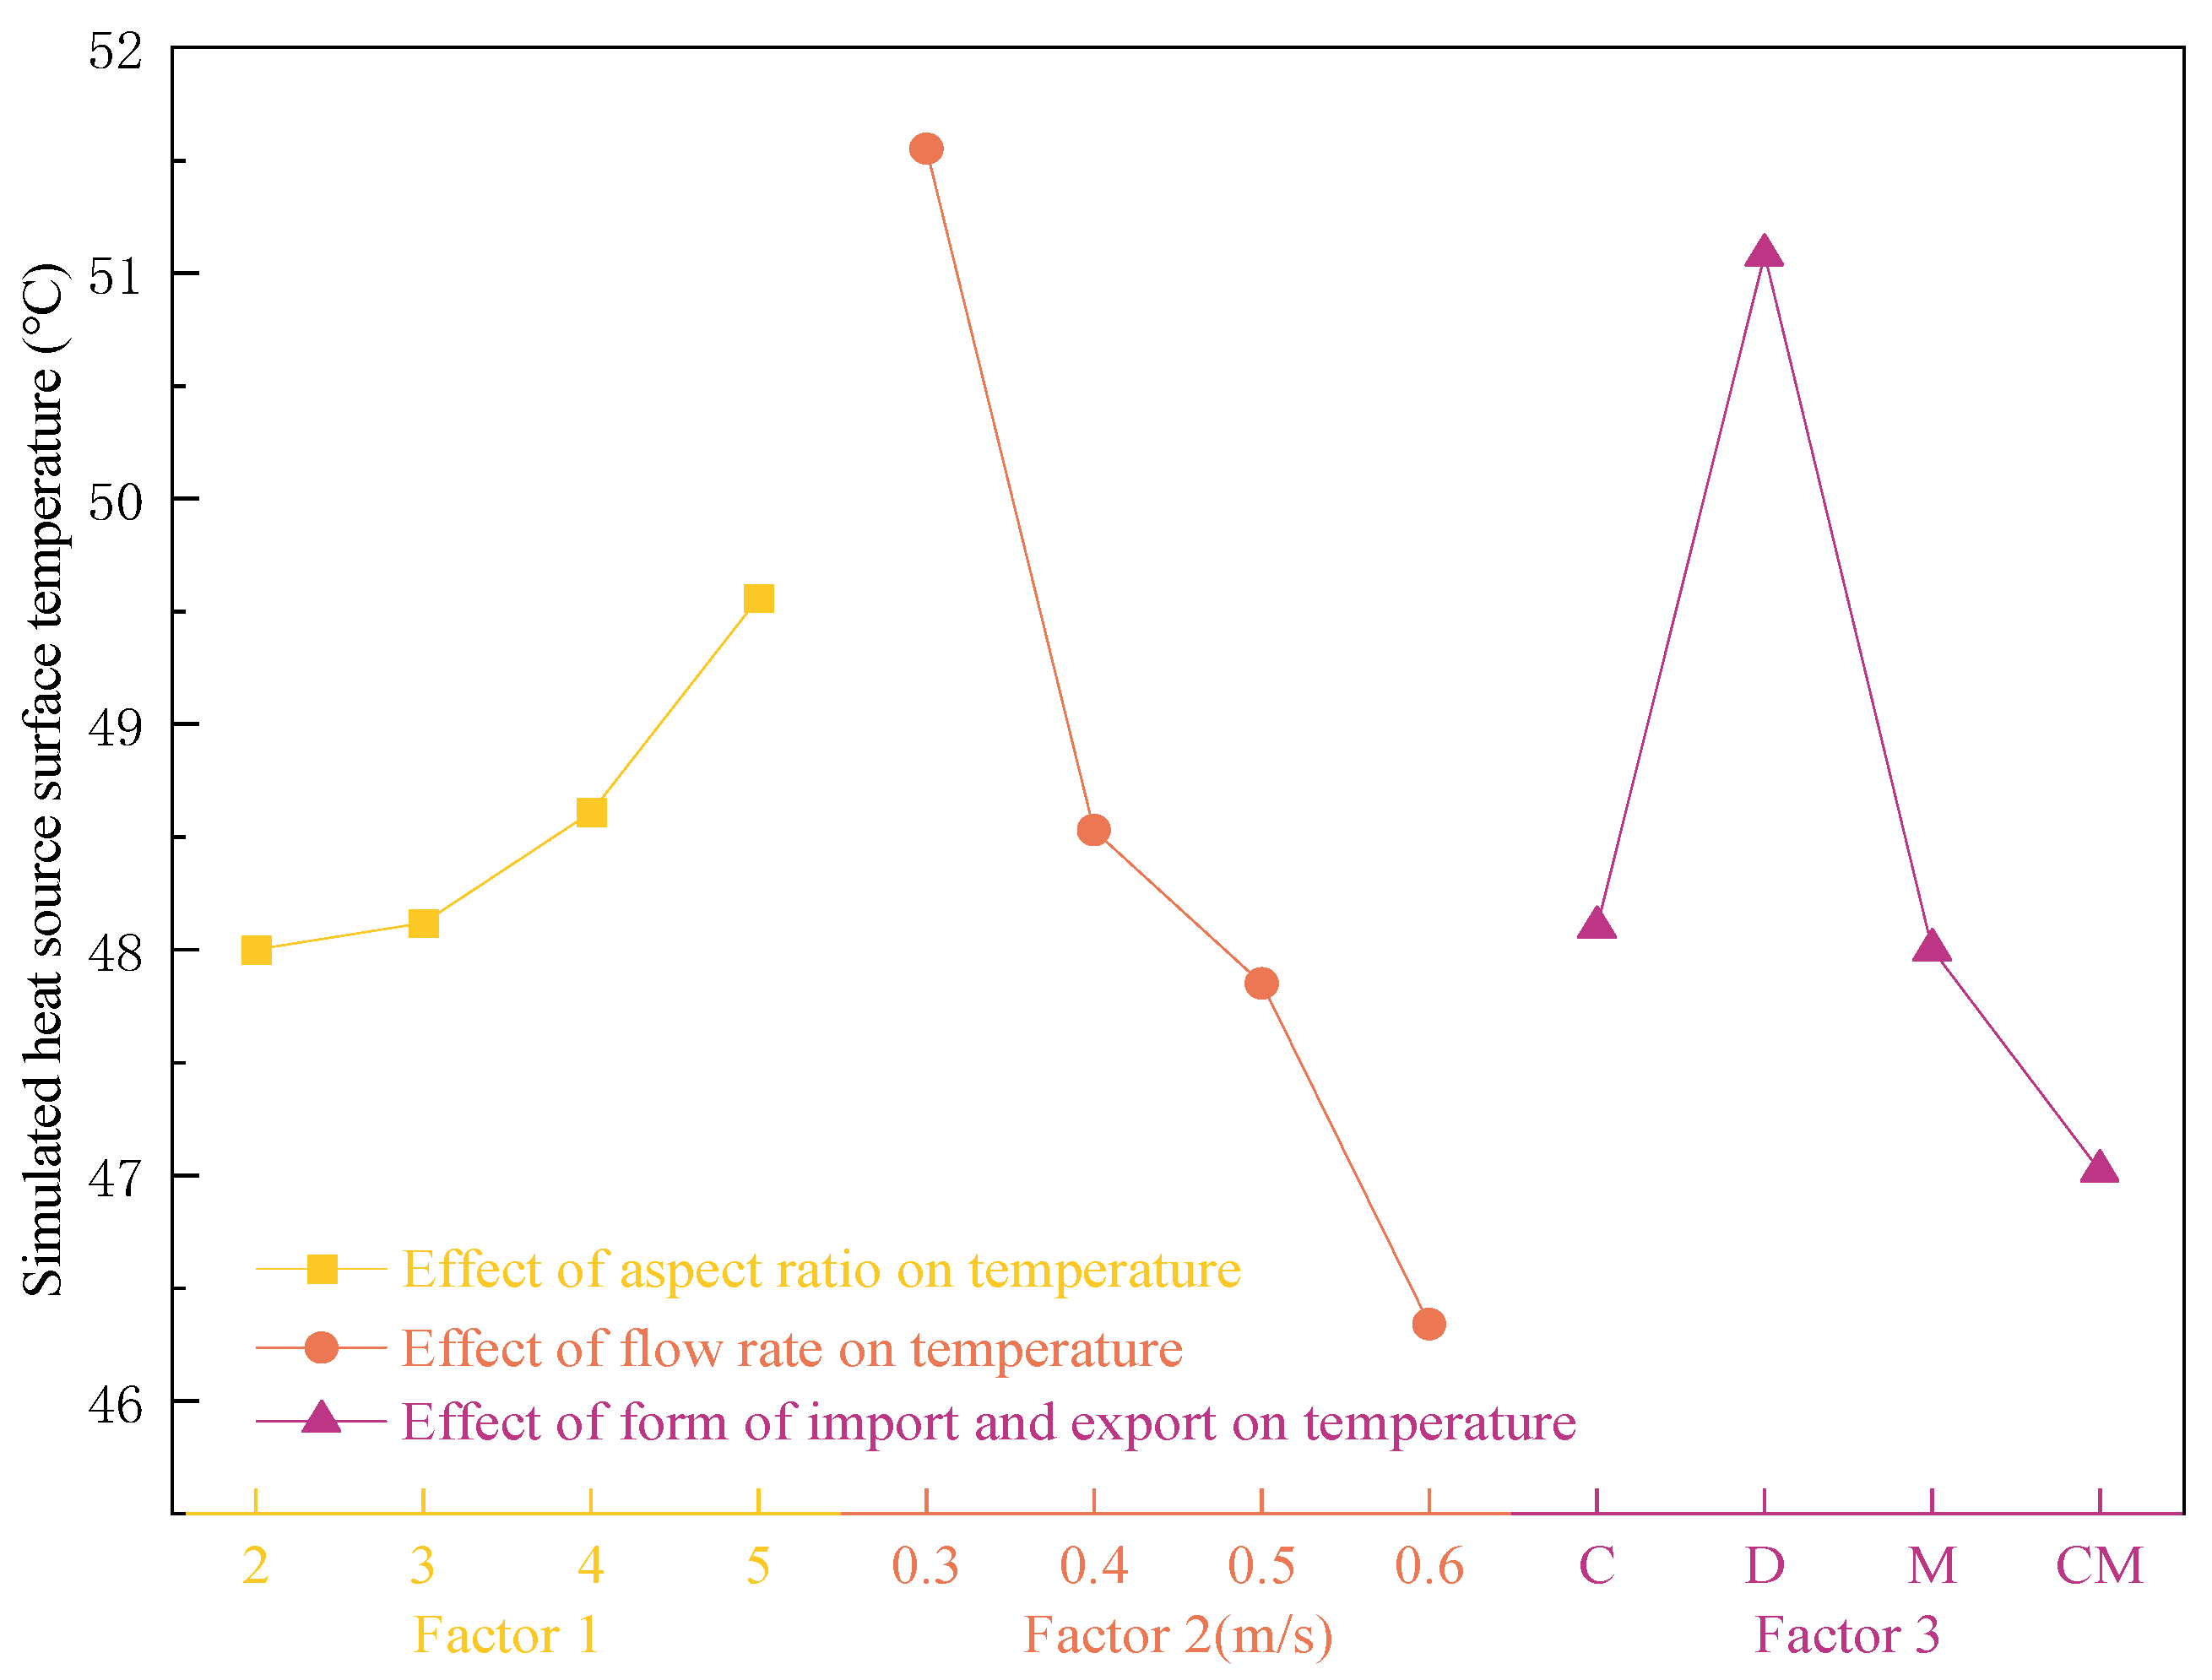
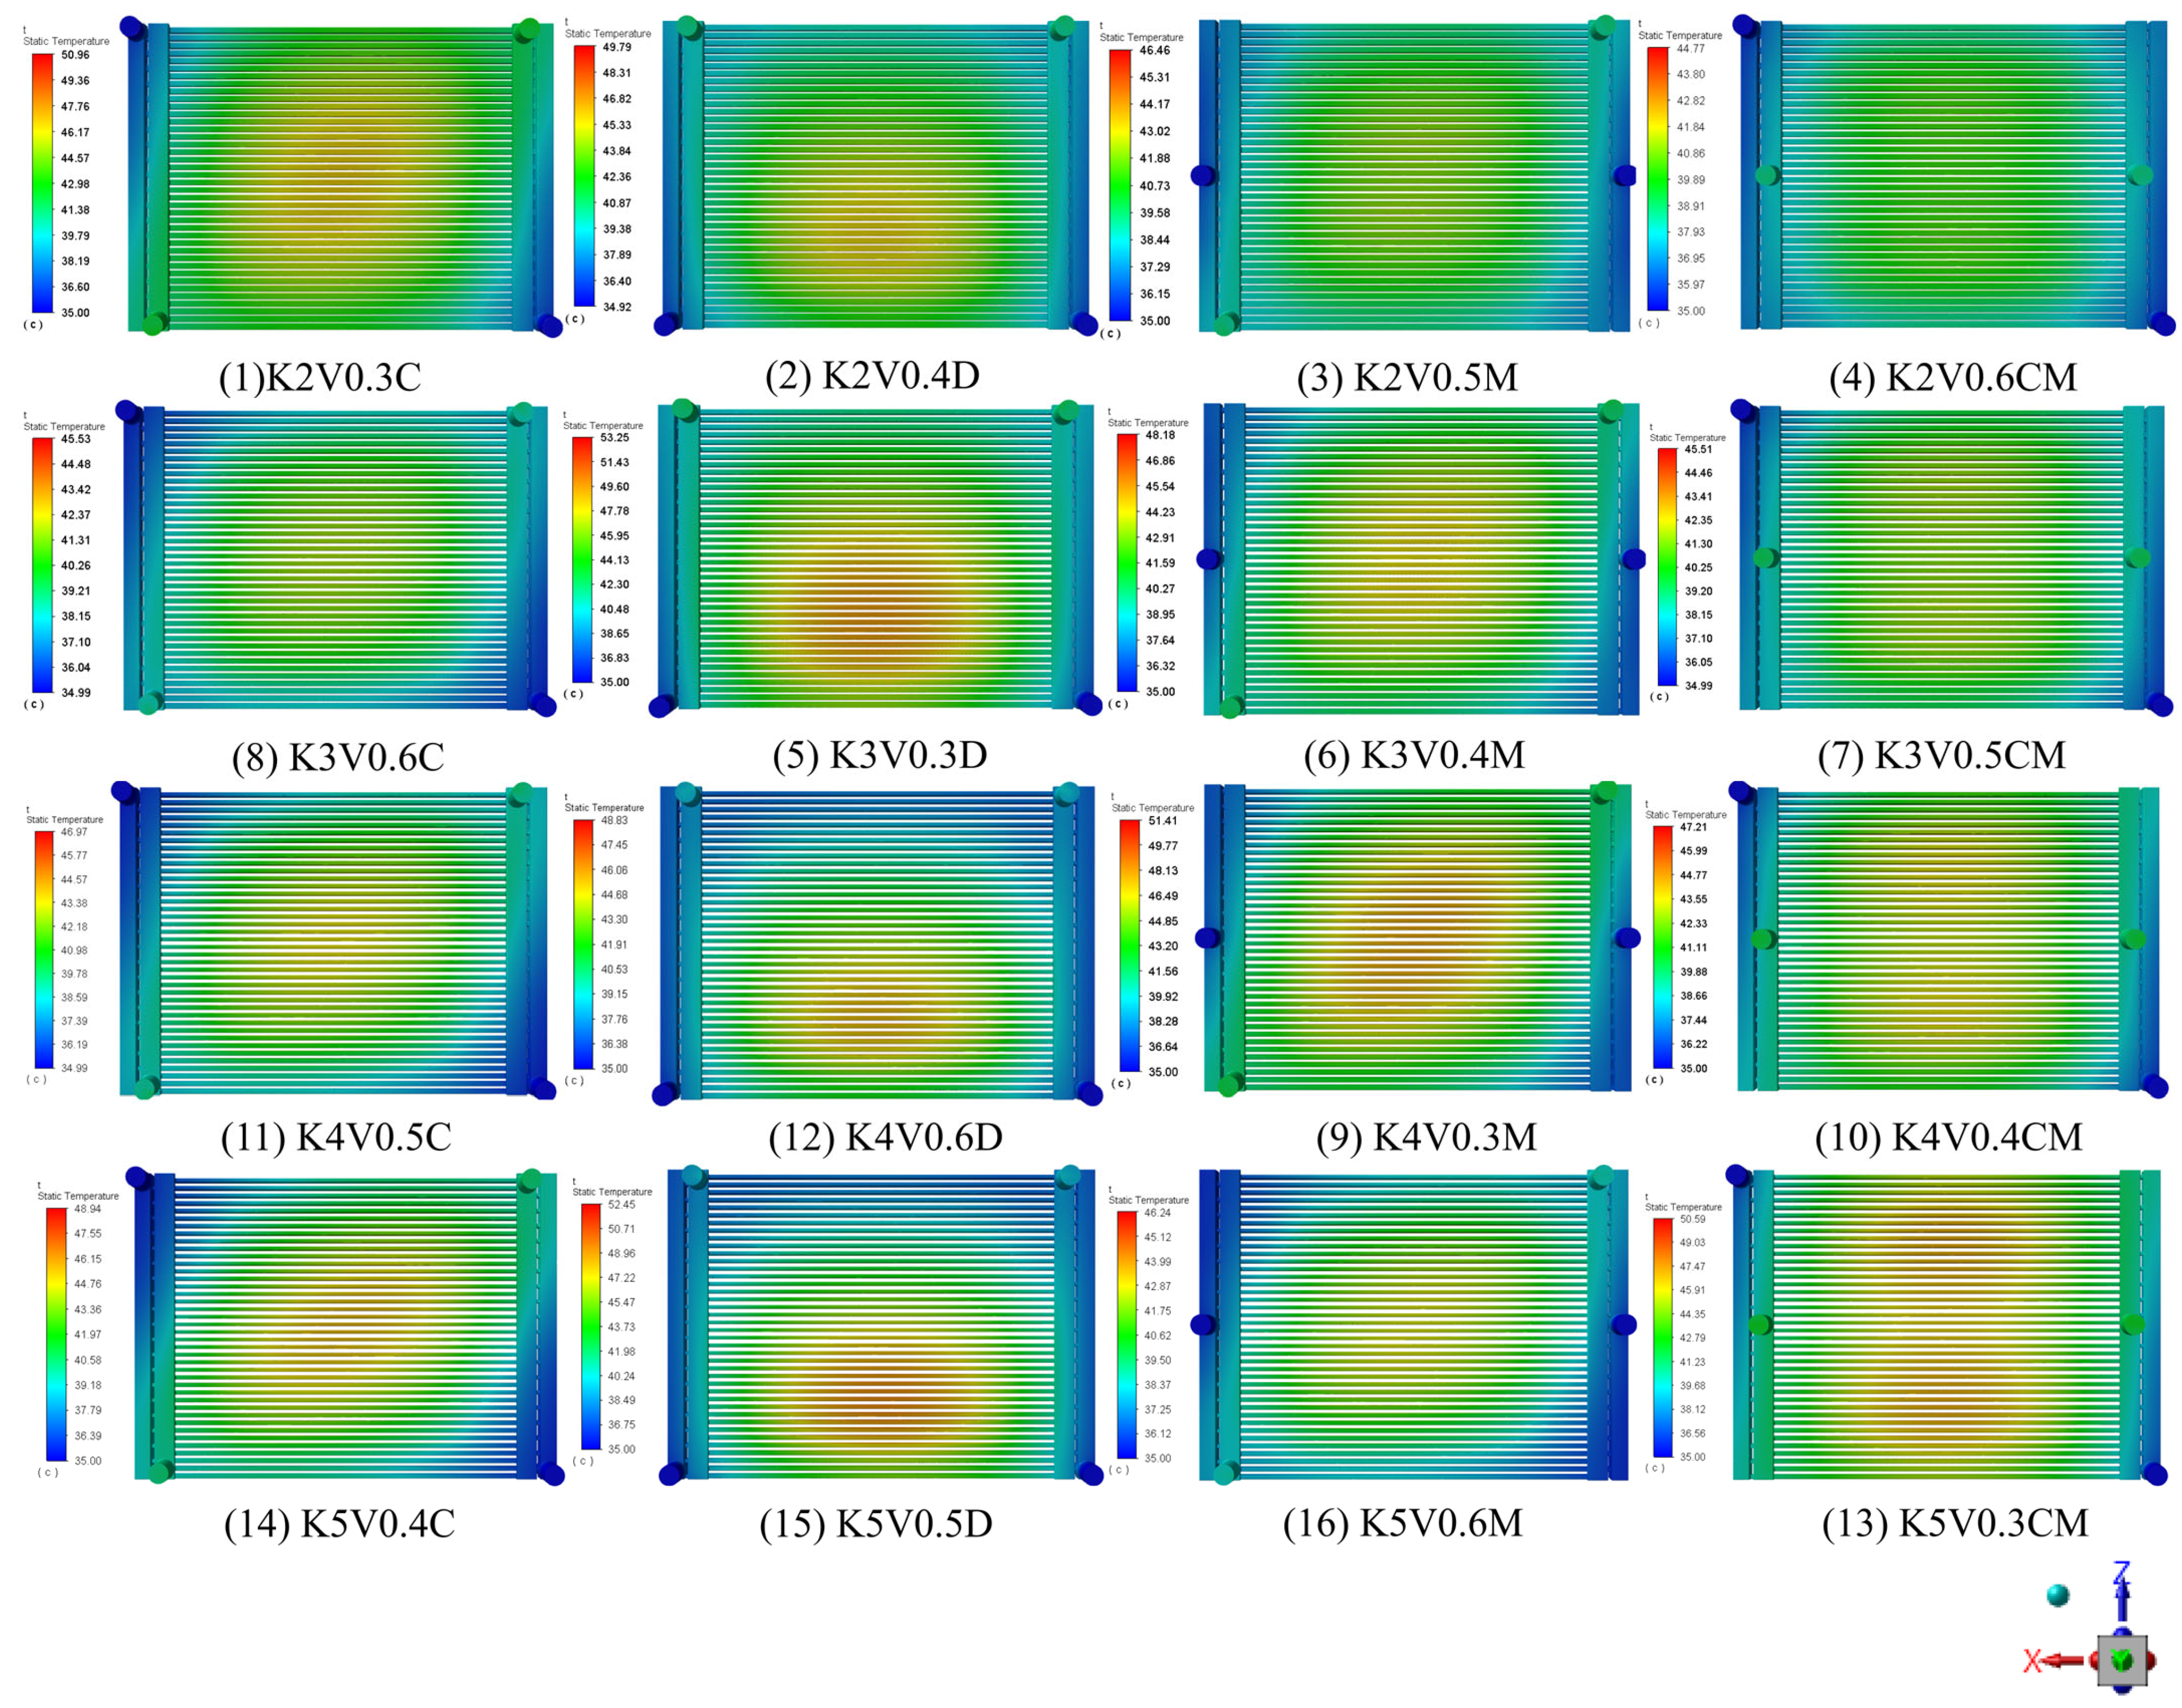
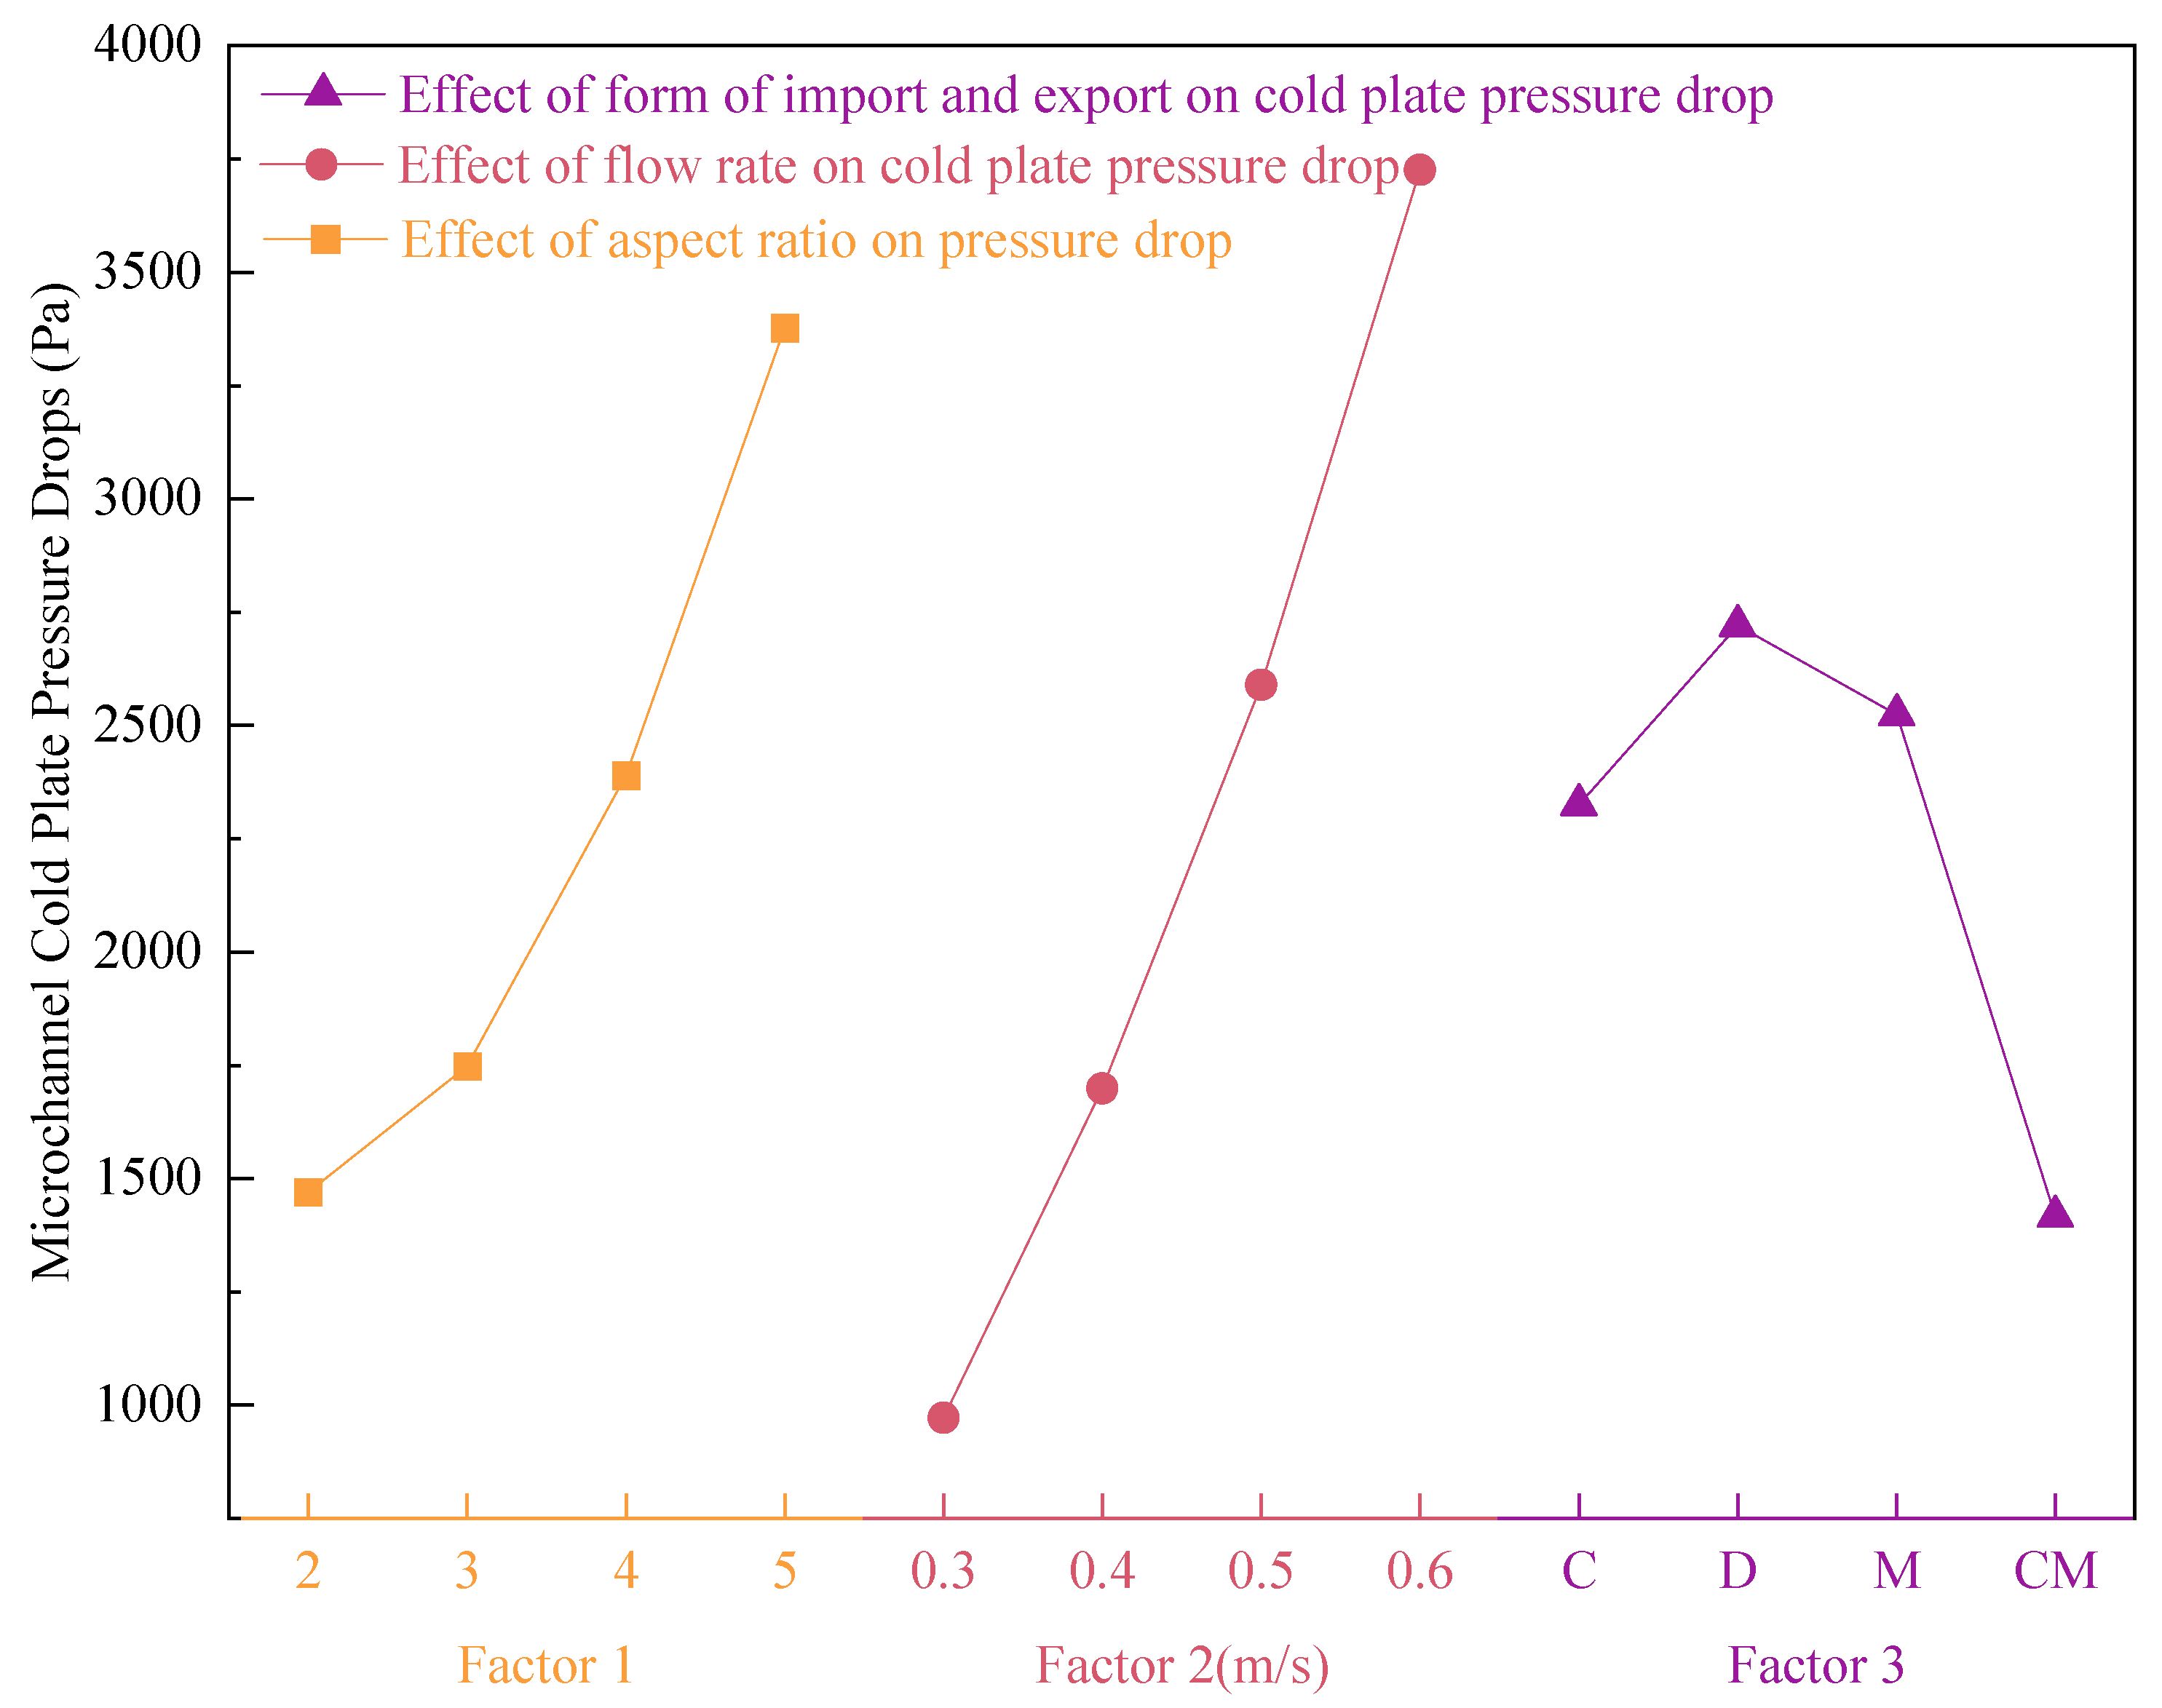
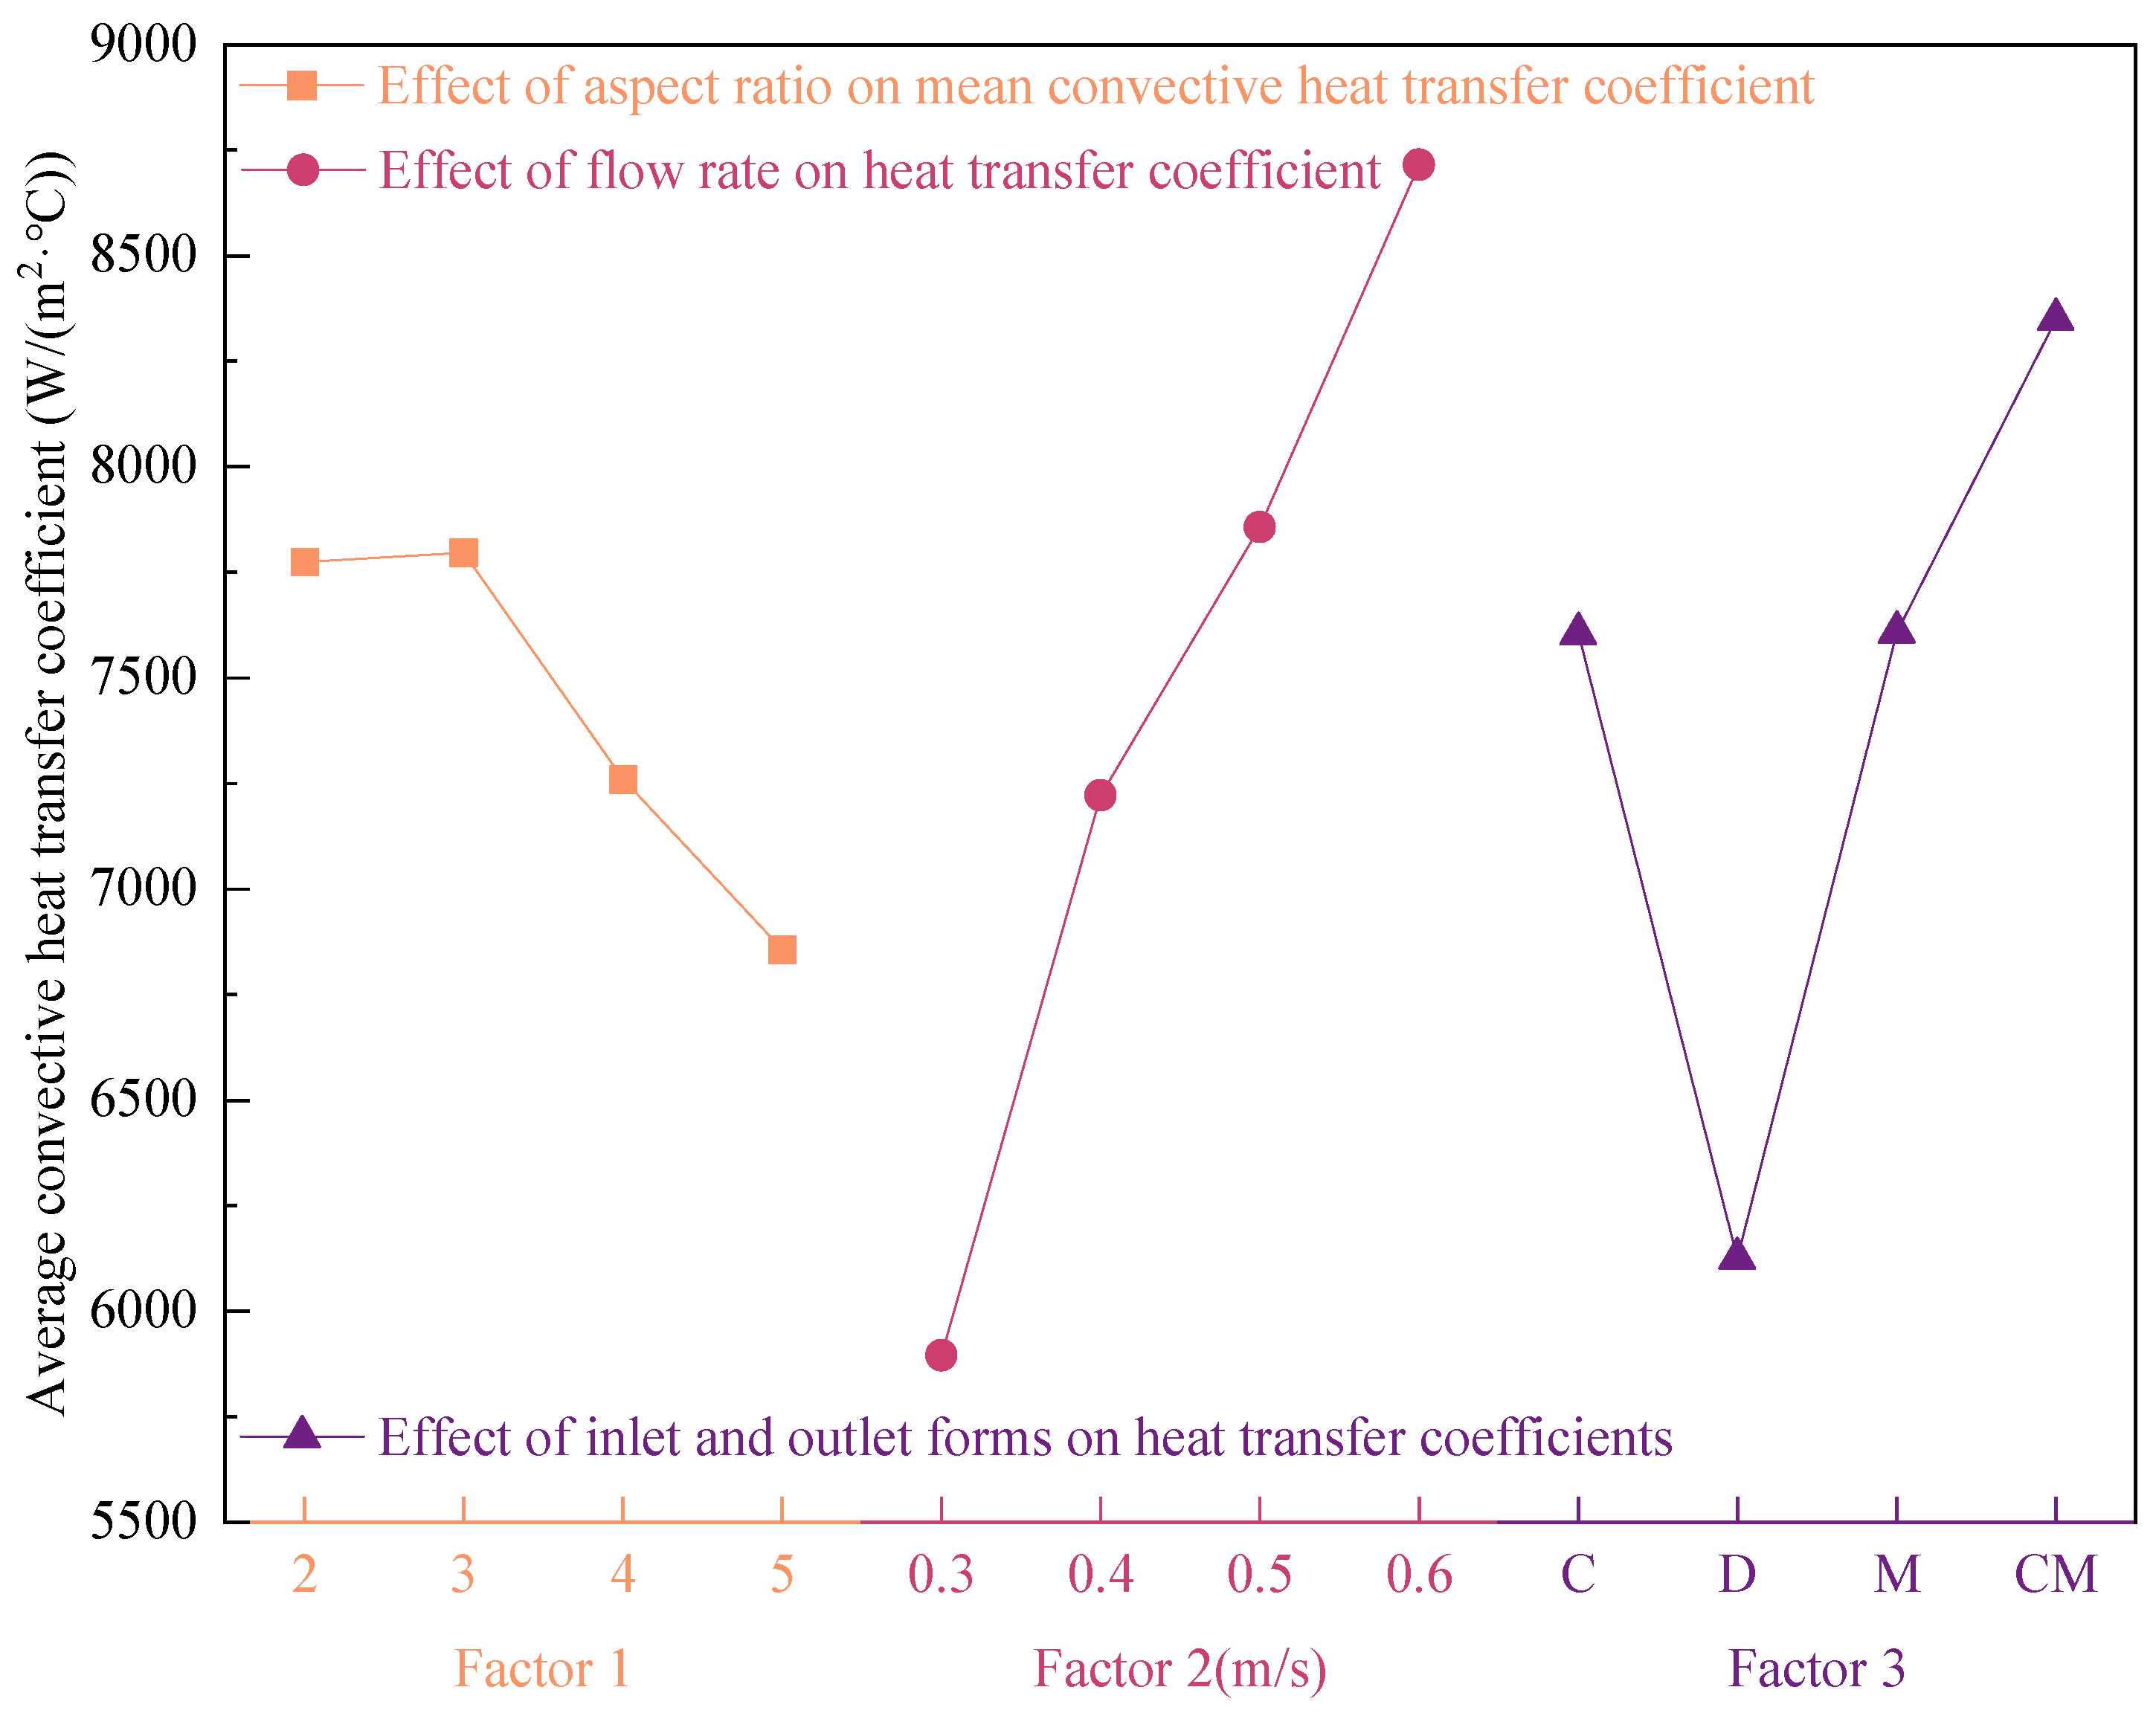
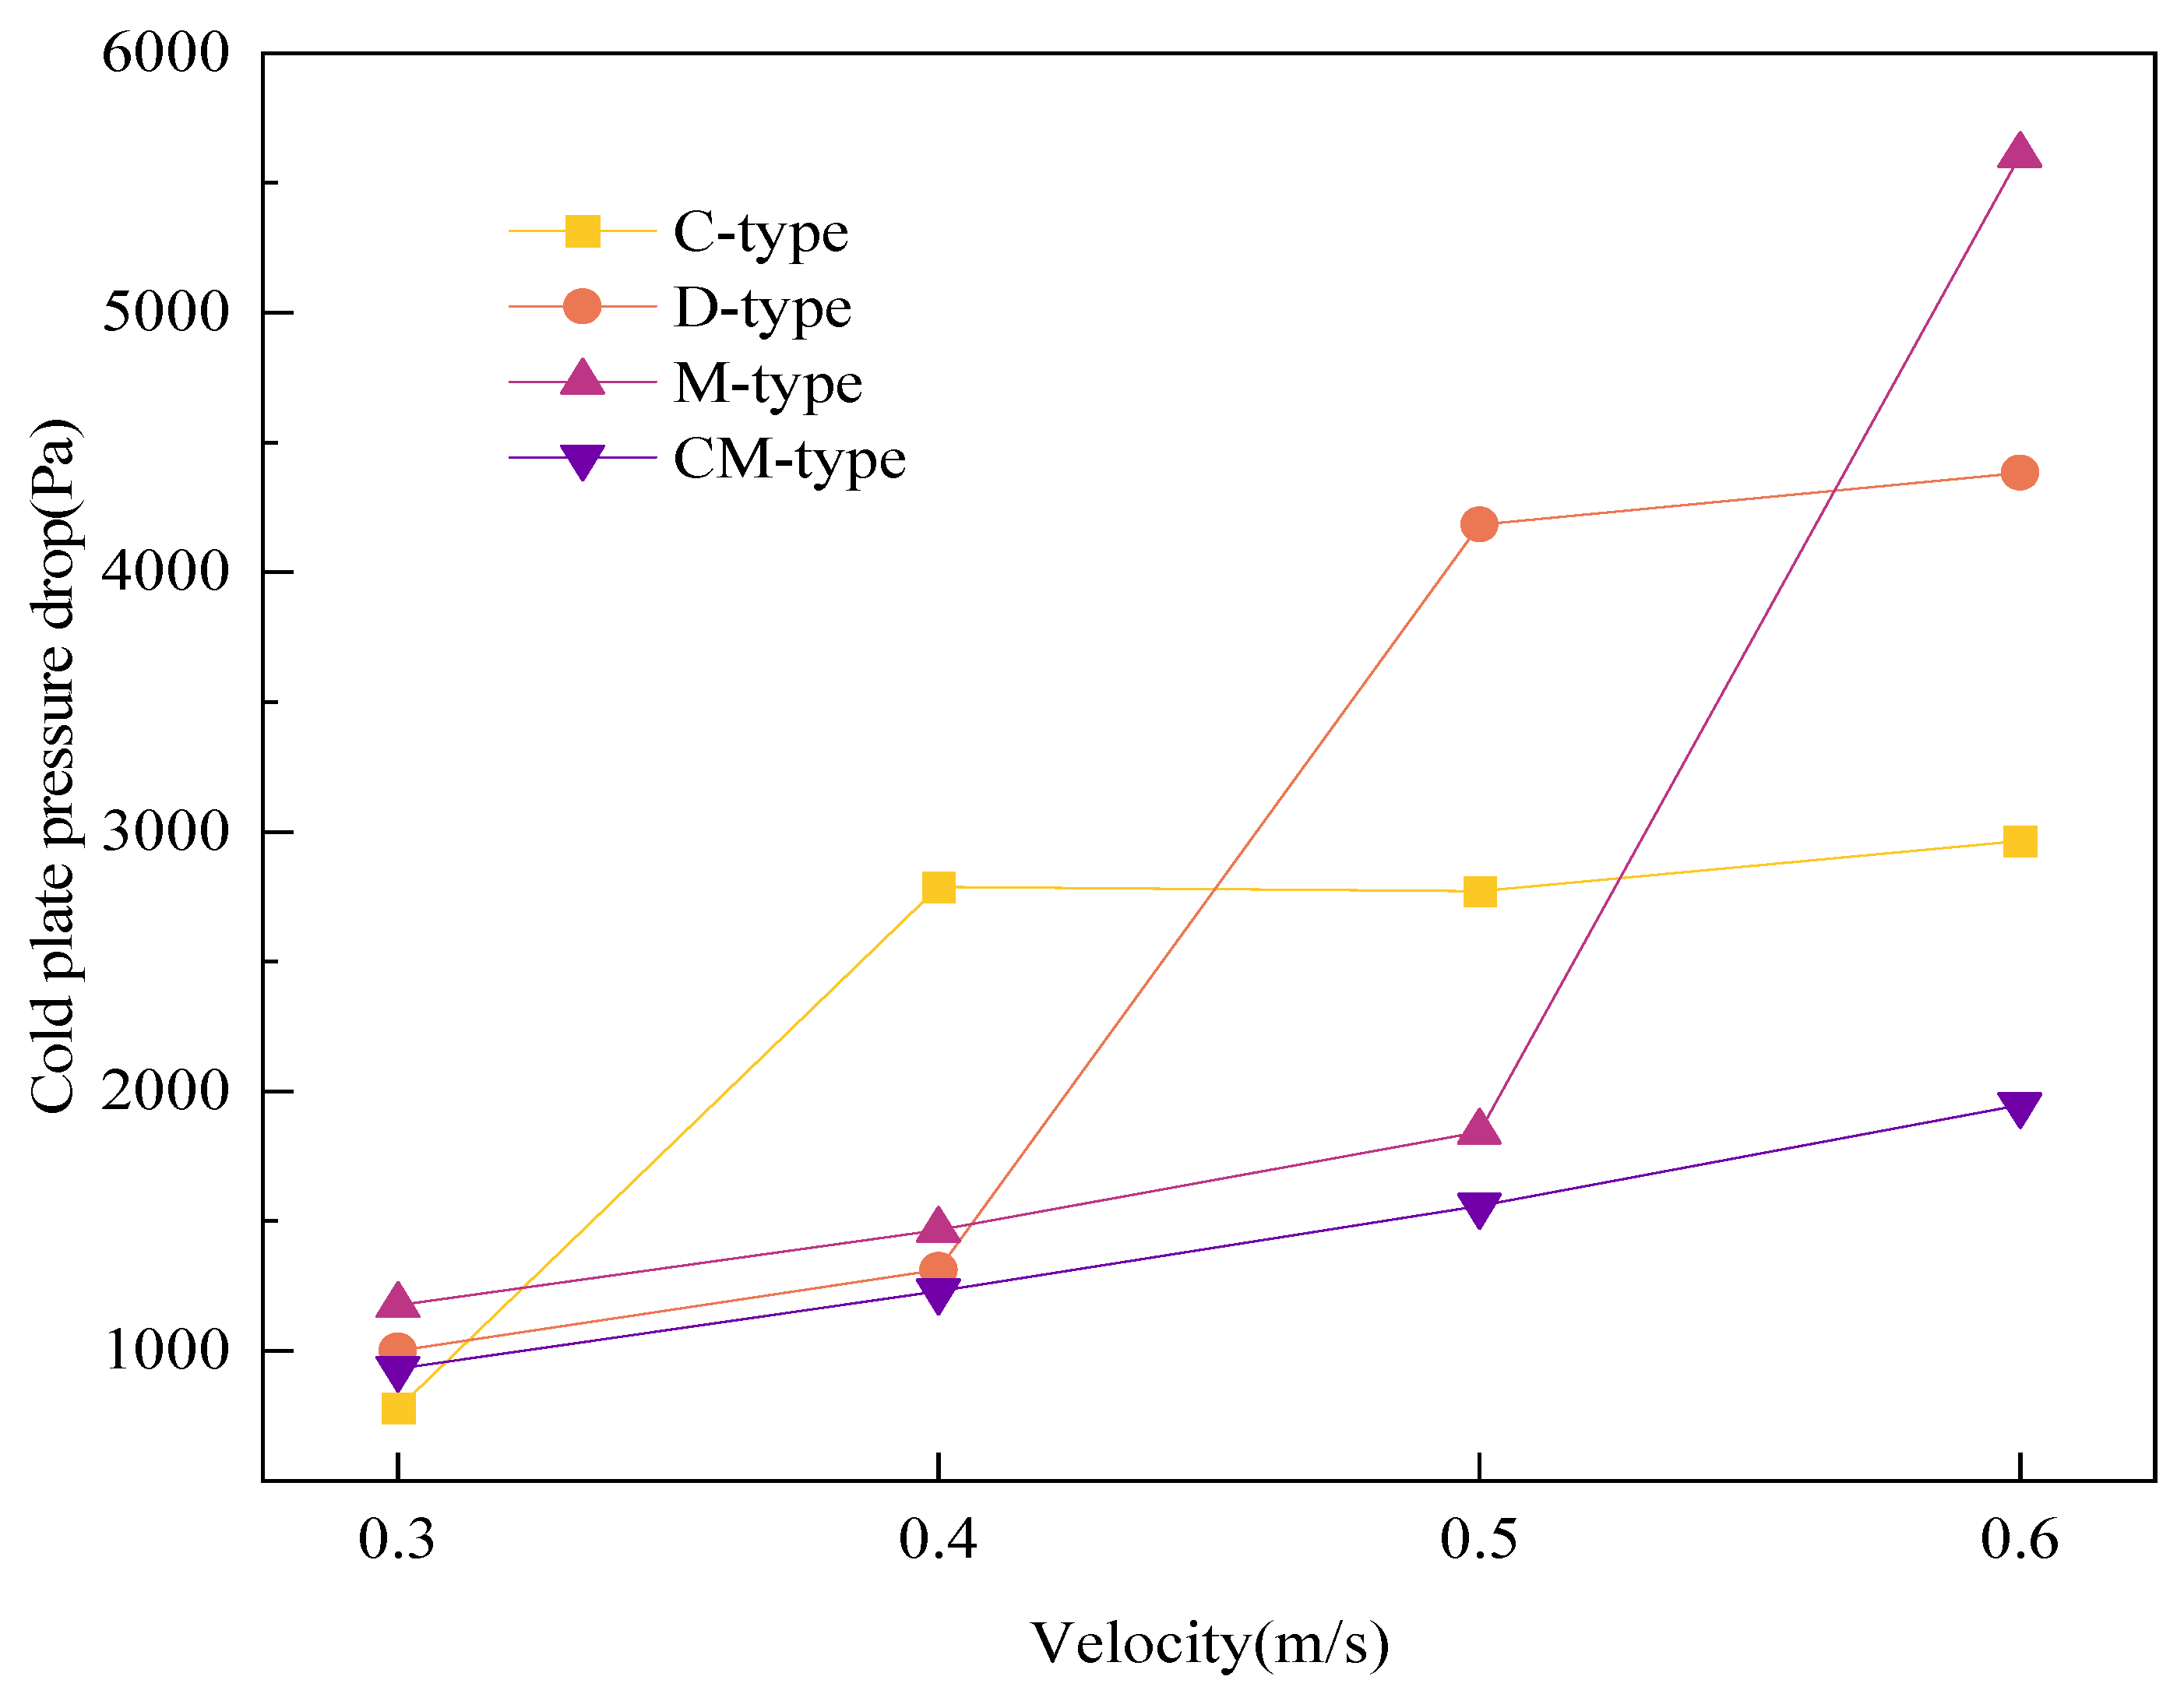
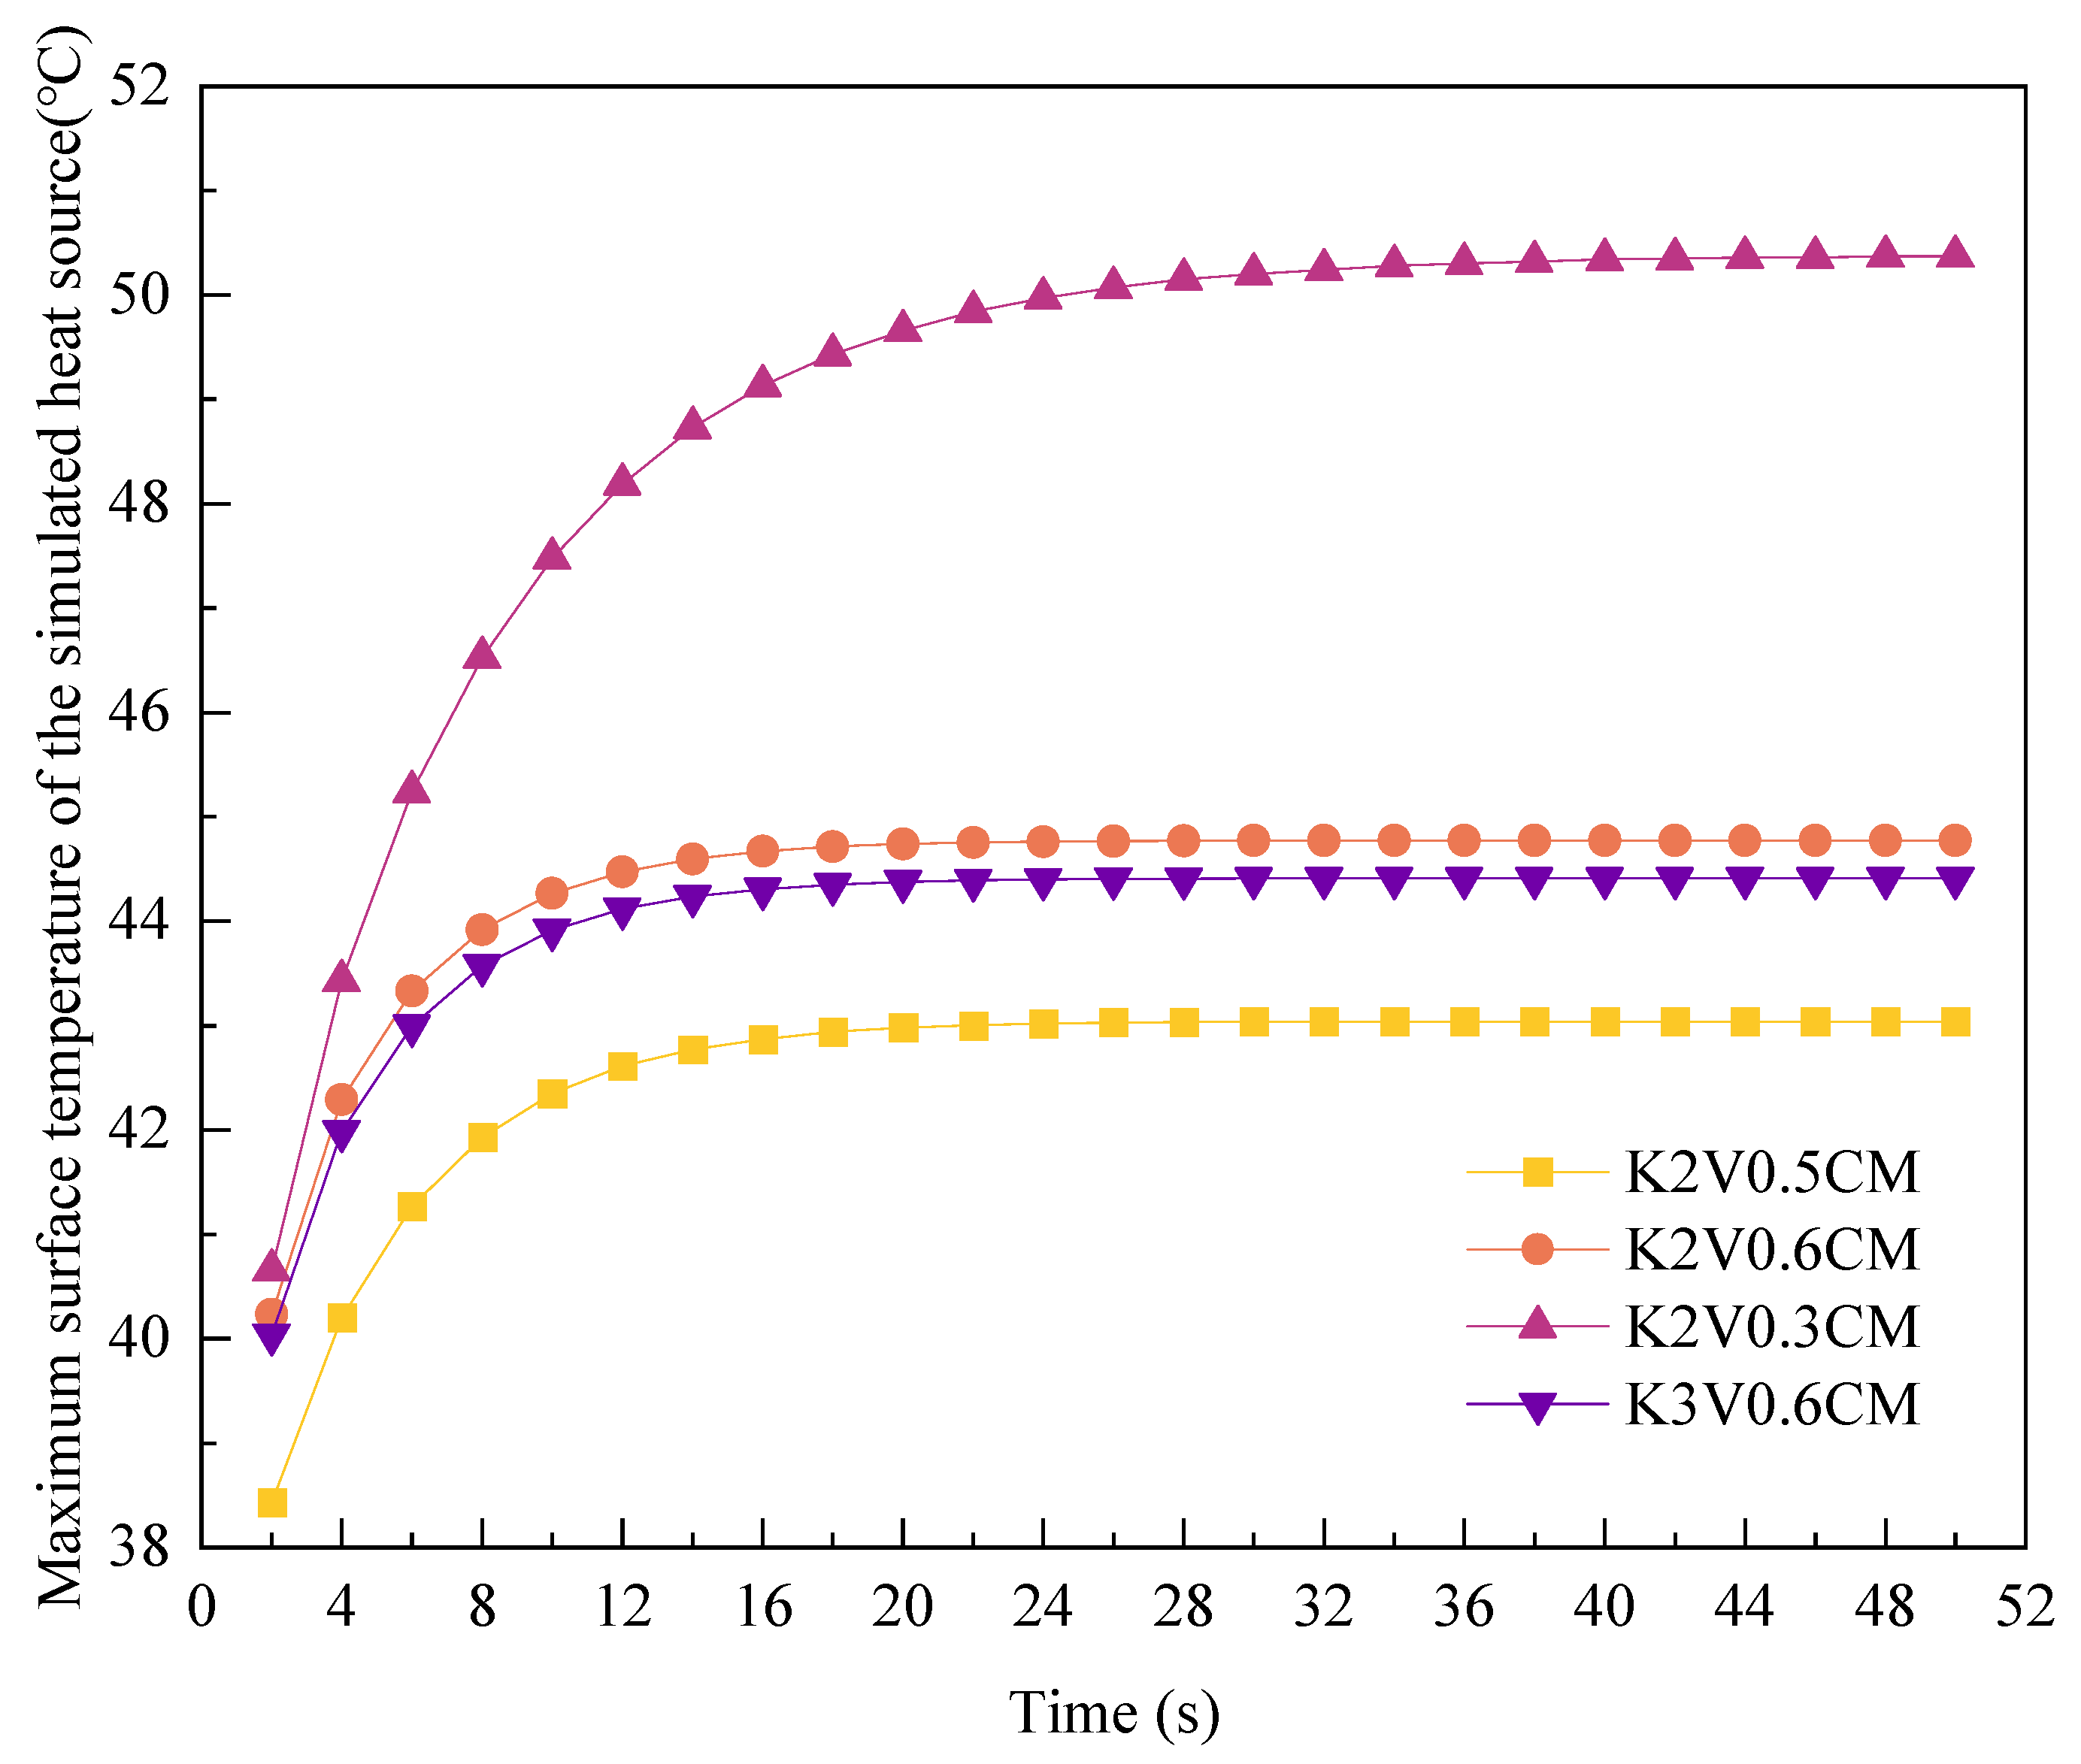
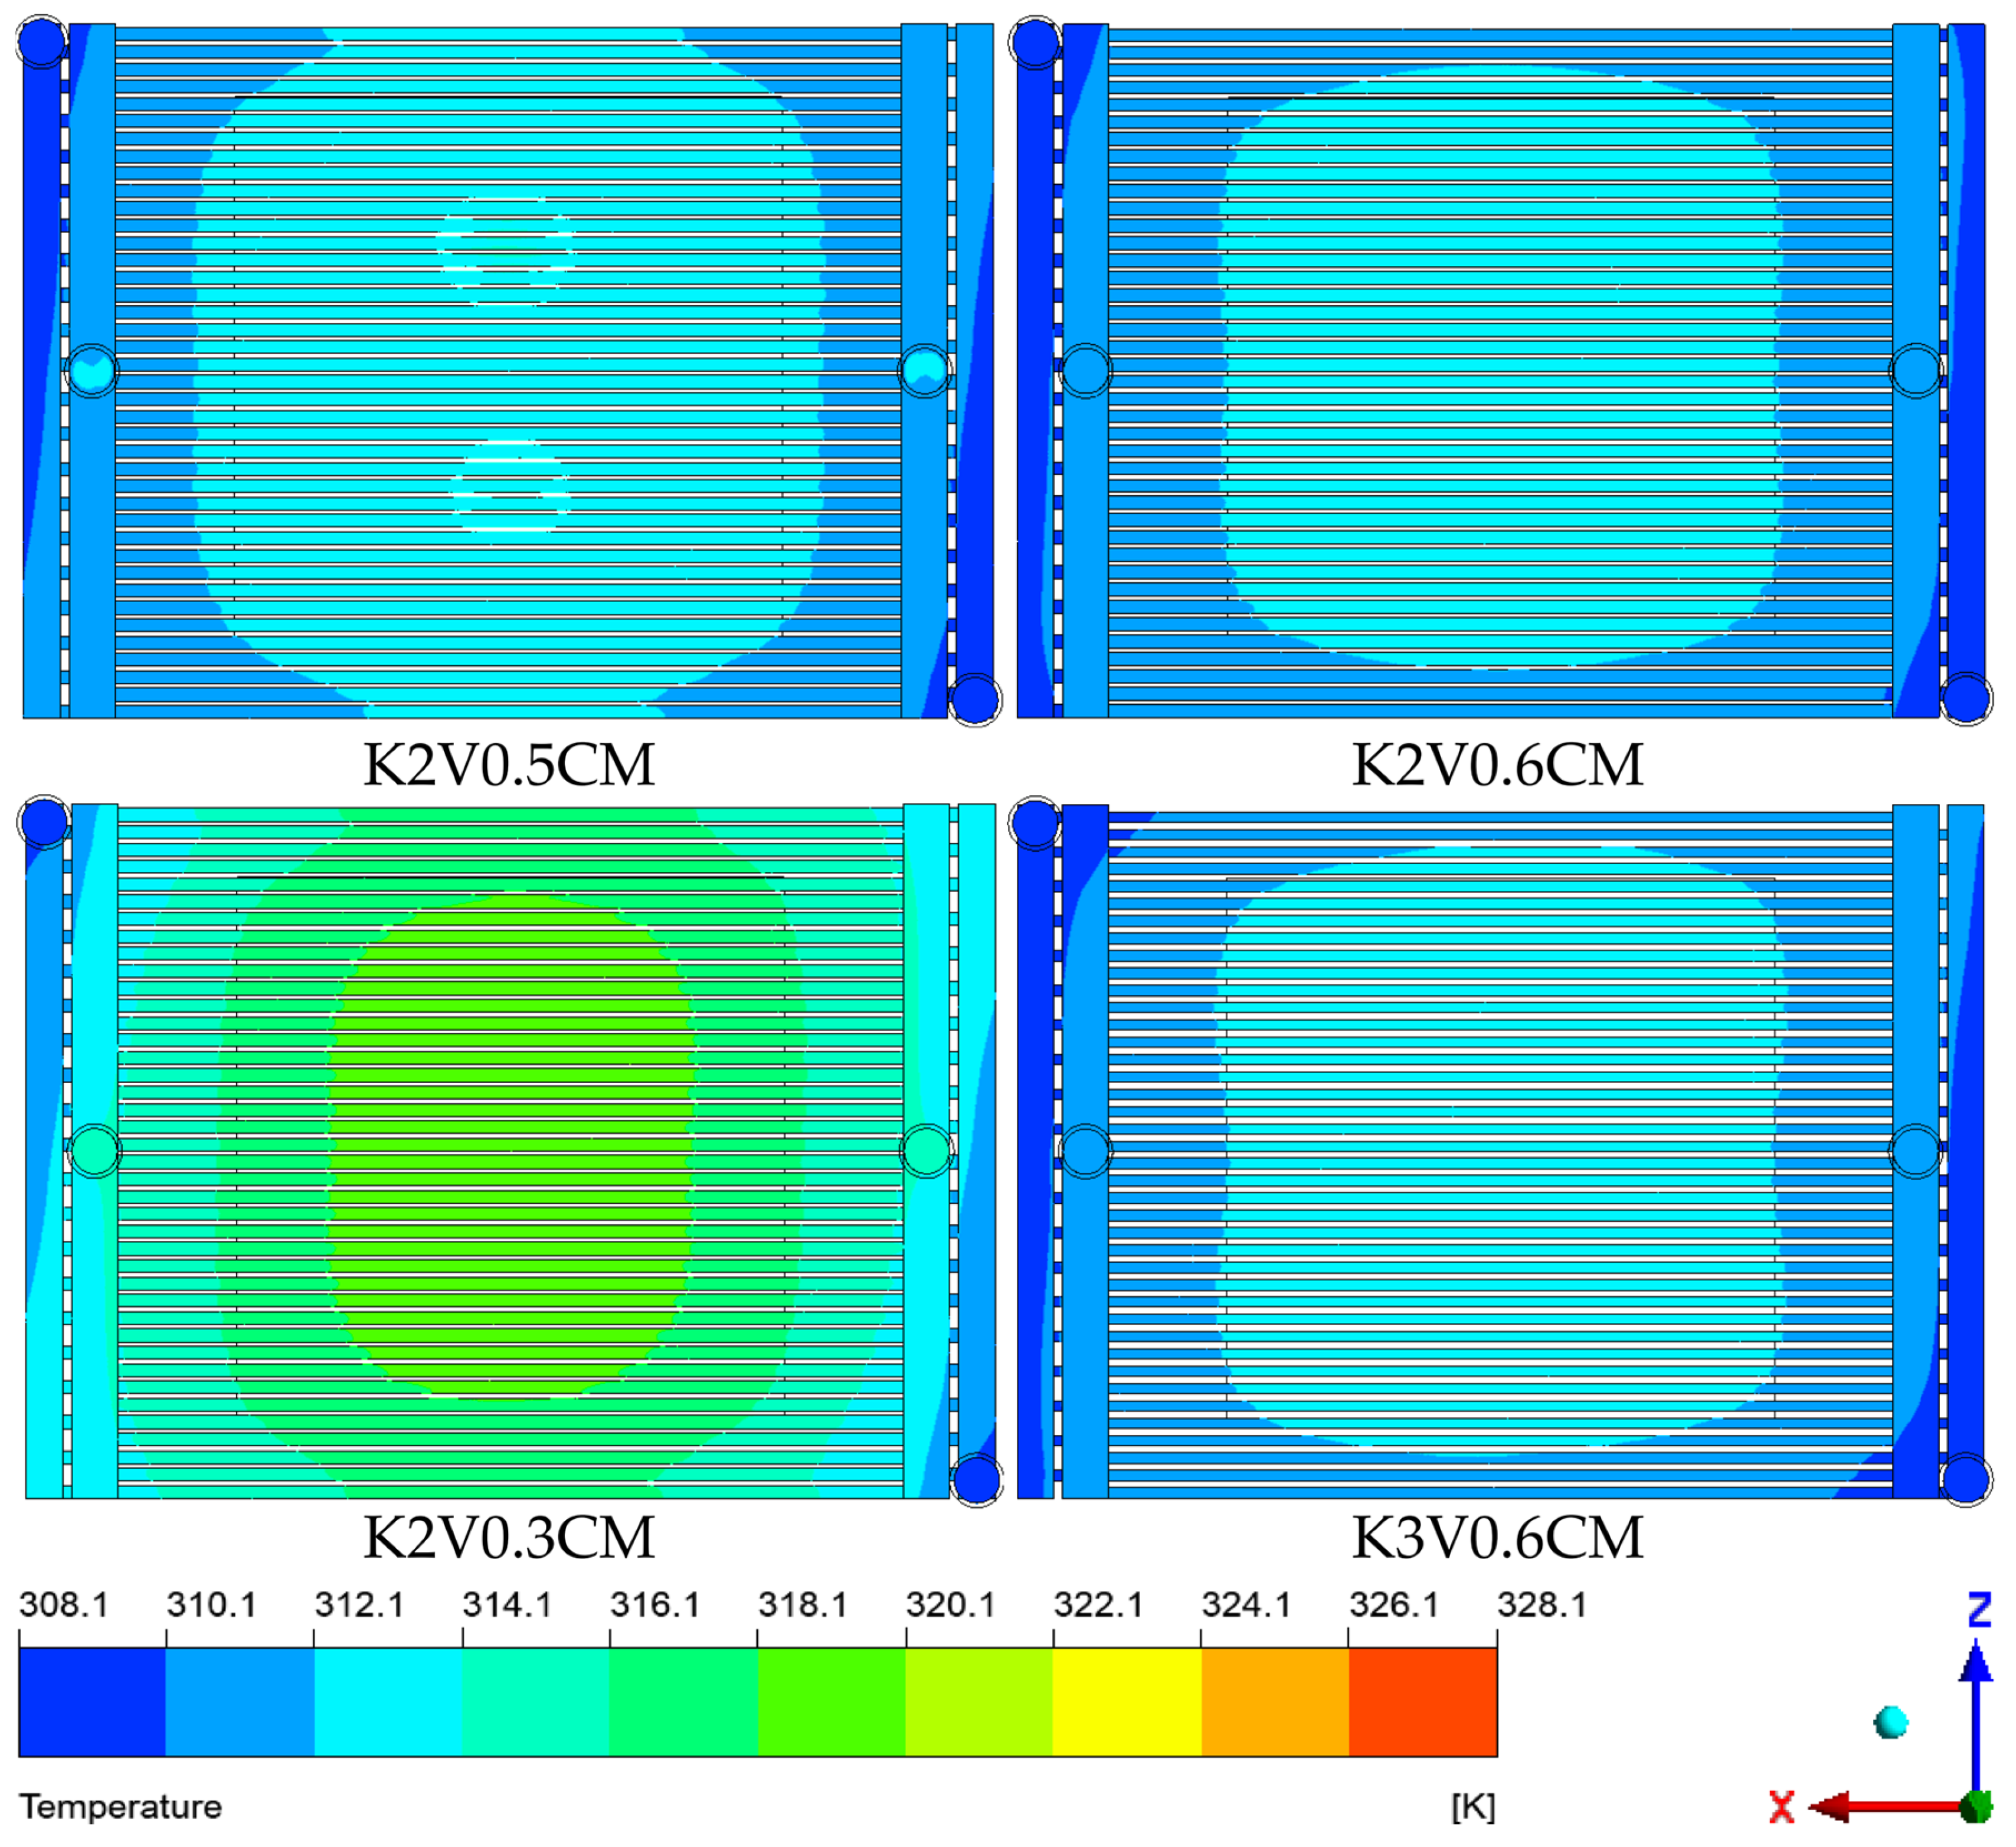
The novelty of this paper lies in the design of a counter-flow rectangular microchannel cold plate for the heat dissipation of high-power electronic chips. This cold plate improves the issue of a significant temperature gradient of a straight microchannel cold plate and realizes a greater uniformity in temperature distribution through the cross-reverse flow of the cooling medium. Through orthogonal tests, the key factors of cooling medium velocity (0.3 m/s, 0.4 m/s, 0.5 m/s, 0.6 m/s), microchannel aspect ratio (2, 3, 4, 5), and inlet/outlet forms (side-in-side-out, side-in-diagonal-out, side-in-in-side-out, side-in-middle-out) are set up to analyze the effects of single factors and interactions on the performance of the plate and to determine the optimal parameter combinations, so that the thermal performance and the flow resistance balance of the plate can be optimized. The best parameter combination is identified to achieve an improved balance between heat transfer efficiency and flow resistance in the cold plate. The designed and optimized cold plate structure in this paper can meet the heat dissipation requirements of CPUs with power consumption of up to 350 W.

2. Model Design

2.1. Physical Model

In this paper, the cold plate was designed according to the principles of data center server CPU chip design, to meet the power consumption of up to 350 W CPU cooling requirements, to maintain a low CPU surface temperature and temperature distribution uniformity, while the cold plate flow resistance has low requirements. The liquid cooling plate uses a counter-flow rectangular microchannel structure. A counter-flow rectangular micro-channel cold plate set up two pairs of disconnected imports and exports, constituting two disconnected fluid flow channels, and the flow channel staggered arrangement. Cooling medium in inlet 1 is in the entrance to each micro-channel, in outlet 1 of the outlet collection cavity in the pooling, discharge cold plate; similarly, the cooling medium in inlet 2 is in the inlet to each micro-channel, in outlet 2 of the outlet collection cavity in the pooling, discharge cold plate, the export form for the imitation of the manifold micro-channel design. To microchannel aspect ratio of 4, import and export form into the side at the cold plate, for example, the structure shown in Figure 1. Counter-flow rectangular microchannel cold-plate fluid-domain schematic is shown in Figure 2. The CPU heat source of 60 mm × 60 mm × 5 mm is fixed below the center of the cold plate. The liquid cold plate cooling system is shown in Figure 3.

2.2. Fluid Governing Equations

Since the cooling medium used in this study is single-phase, it was assumed that the cooling medium is an incompressible Newtonian fluid, and the thermal effect produced by the viscous dissipative action of the fluid flow is neglected. The control equation expression is as follows:
( ρ u i ) x i = 0 ρ u j u i x j = P x i + μ x j u i x j u i T x i = α x i T x i ,
where i, j = 1, 2, 3; ρ is the fluid density; P is the pressure; u is the flow velocity; and α is the thermal diffusion coefficient.

2.3. Boundary Conditions

The inlet adopted velocity inlet, and the cooling medium was liquid water. To reduce energy consumption, the inlet temperature adopted 35 °C, the outlet adopted pressure outlet condition, and the outlet pressure was set as standard atmospheric pressure. There was no velocity slip at the flow–solid interface. According to the design requirements, the CPU was set at the center below the microchannel cold plate, the CPU was close to the microchannel cold plate, the power consumption was 350 W, and the cold plate and CPU materials were aluminum and copper, respectively. The boundary conditions were set as shown in Table 1.

2.4. Solution

In this study, numerical simulations were performed using ANSYS FLUENT (ANSYS Fluent; 2020 R2; ANSYS, Inc.; Canonsburg, PA, USA) [32], flow was modeled as laminar flow, all empirical constants were selected as default values, the computational procedure was performed using a steady-state solution configuration, the SIMPLE algorithm was used for the solution, the discrete format of the control equations were all in second-order windward format, and the numerical solution was considered to be converged when the residuals of the variables in the continuity and momentum equations were less than 10−6.

2.5. Grid-Independent Analysis

The number of meshes directly affects the accuracy and calculation time of the simulation results. In this paper, the Meshing module in ANSYS FLUENT was used to divide the poly-hexacore mesh, and the mesh independence was verified by analyzing the trend of the simulated CPU heat source temperature with the number of meshes. Computational models were constructed for 653,423, 917,818, 1,371,379, 2,085,913, and 3,766,833 cells, respectively. Figure 4 shows that the simulated heat source temperature decreases gradually as the number of grids increases, but the rate of temperature change decreases significantly. The temperature change is only 0.02 °C when the number of grids increases from 2,085,913 to 3,766,833. Considering the calculation accuracy and efficiency, 2,085,913 cells were selected for simulation, with this number of meshes, the minimum orthogonal quality of the delineated mesh is 0.19 > 0.1, and the maximum skewness is 0.82 < 0.95. The mesh quality meets the computational accuracy required for the simulation. The grid structure after division is shown in Figure 5.

2.6. Experimental Validation

2.6.1. Data Handling

Re is an important parameter characterizing the state of the fluid flow and can be calculated by the following:
Re = ρ f u D h μ ,
where ρf is the density of liquid water at 35 °C, kg/m3; u is the velocity of water at the entrance of the microchannel, m/s; and μ is the dynamic viscosity of water, N·s/m2. Dh can be calculated according to the following formula:
D h = 4 A m c P m c ,
where Amc and Pmc are the cross-sectional area (m2) and wet perimeter (m) of the microchannel inlet, respectively.
In this paper, the average convective heat transfer coefficient h is used to express the heat transfer capacity of the liquid-cooled plate, and h can be calculated from the following:
h = Q T c p u T m ,
where h is the average convective heat transfer coefficient per unit area, W/(m2·°C); Q is the power of the simulated CPU heat source, W; TCPU is the surface temperature of the simulated CPU heat source, °C; and Tm is the average temperature of the fluid, °C.
Using the differential pressure between the inlet and outlet to reflect the flow resistance of the liquid-cooled plate can be derived from the following calculation equation:
Δ P = P i n P o u t ,
where Pin is the inlet pressure of the cold plate, Pa; Pout is the outlet pressure of the cold plate, Pa.
The average surface temperature of the simulated CPU heat source, TCPUm, is calculated as follows:
T C P U m = 1 7 T i 7 ,
where Ti is the individual temperature measurement point temperature, °C.

2.6.2. Experimental Platform

To verify the accuracy of the numerical simulation, a counter-flow rectangular microchannel liquid cooling plate (the size of the flow channel is 1 mm × 4 mm) was fabricated using 3D metal printing (the material is aluminum), and the experimental system shown in Figure 6 was built. The experimental set up consists of a liquid-cooling circulation system (including hoses, variable-frequency pumps, filters, test sections, flow-regulating valves, heat exchangers, constant-temperature tanks, and storage tanks), a heating system (power supply and electric heating plates), a data-acquisition system (a turbine flowmeter, a digital-display manometer, a temperature recorder, a type K thermocouple, and a fast pyrometer).
To minimize the contact thermal resistance between the electric heating plate and the cold plate, thermally conductive silicone grease was applied to the surface of the electric heating plate, which was then bonded to the base of the cold plate. The contact area was 80 mm × 50 mm, and there were seven temperature measurement points (K1~K7) to record the temperatures T1~T7. The schematic diagram of the K-type thermocouple arrangement as well as the physical drawings of the cooling plate are shown in Figure 7 and Figure 8.

2.6.3. Error Analysis

Type K thermocouples were used to measure the temperature of seven measurement points on the electric heating plate with an uncertainty of ±0.8 °C. The uncertainty of the temperature gradient of the fitted seven thermocouples is ±0.01, and the exit digital display rapid thermometer was used to measure the cooling mass’s outlet temperature in the cold plate, with an uncertainty of ±0.15 °C. The uncertainty in the mounting position of the type K thermocouples is ±0.1 mm.
According to the error transfer equation [33],
δ R R = δ X 1 X 1 2 + δ X 2 X 2 2 + + δ X M X M 2 ,
Then, the uncertainty of the heat flow density:
δ q q = δ λ λ 2 + δ T T 2 + δ y y 2 + δ b b 2 ,
Uncertainty in the surface temperature of an electrically heated plate:
δ T W T W = δ T 1 T 1 2 + δ Δ T Δ T 2 ,
Uncertainty in surface heat transfer coefficients:
δ h h = δ q q 2 + δ T W T W T i n 2 + δ T i n T W T i n 2 ,
The uncertainties in the experimental heat flow density, surface temperature, and surface heat transfer coefficient were calculated to be 2.51%, 1.33%, and 2.71%, respectively.

2.6.4. Model Validation

The accuracy of the model can be verified by comparing the numerical simulation results of the simulated CPU heat source surface temperature with the experimental results. A comparison of the simulation and experimental results is shown in Figure 9.
From Figure 9, it can be seen that the numerical simulation results have the same trend as the experimental results, and the numerical simulation and experimental values of the simulated CPU heat source surface temperature are 46.63 °C and 46.11 °C at 0.5 m/s flow velocity, respectively, which is the maximum error of 1.11%. Therefore, the numerical simulation has high accuracy, and its analysis results are reliable.

3. Orthogonal Experimental Design

In this paper, three main factors affecting the rectangular microchannel cold plate are set up: flow velocity, microchannel aspect ratio, and inlet/outlet form. For the flow velocity, four levels are studied, which are 0.3 m/s, 0.4 m/s, 0.5 m/s, and 0.6 m/s. For the aspect ratio, the cross-sectional area of individual microchannels will be changed if the fixed height or width is not changed, and, in this study, to control the variables, a height of 4 mm and a width of 1 mm are taken as the standard to ensure that the cross-sectional area of the individual microchannels is always 4 mm2. For the setting of the microchannel, in this study, to control the variables, a height of 4 mm and width of 1 mm are used as the standard to ensure that the cross-sectional area of individual microchannels is always 4 mm2, and the number of microchannels is set to 40, which ensures that the cross-sectional area of the total microchannels is constant. Four types of aspect ratios K (K is the ratio of the height H to the width W of the rectangular microchannel) are set. Figure 10 shows the schematic diagram of the geometric parameters of the rectangular microchannel, and the specific values are shown in Table 2.
In this study, four types of inlet and outlet forms are set up, namely, side-in-side-out (type C), side-in-diagonal-out (type D), middle-in-side-out (type M), and side-in-center-out (type CM), and the various inlet and outlet forms are shown in Figure 11.
Based on the above influencing factors, the L16 orthogonal test table was designed, and the orthogonal test table is shown in Table 3.

4. Orthogonal Test Results and One-Way Analysis

4.1. Orthogonal Test Results

Numerical simulations were performed according to the orthogonal test table, and the simulation results are shown in Table 4.
From the single-factor data in Table 4, it can be seen that, when the simulated heat source is the research objective, the design scheme of Group 4 is optimal, i.e., K2V0.6CM (which means that the aspect ratio is 2, the velocity is 0.6 m/s, and the import and export forms are the side inlet and center outlet); when the pressure drop of the cold plate is the research objective, Group 1 is optimal, i.e., K2V0.3C (which means that the aspect ratio is 2, the velocity is 0.3 m/s, and the import and export forms are the side inlet and center outlet); and, when the average heat transfer coefficient of the cold plate is the research objective, the design scheme of Group 1 is optimal, i.e., K2V0.6CM. The form of import and export is side-in and side-out; when the average heat transfer coefficient of the cold plate is the research objective, the design scheme design is optimal, i.e., K2V0.6CM (indicating that the aspect ratio is 2, the speed is 0.6 m/s, and the form of import and export is side-in and center-out).
The results of orthogonal tests show that the flow velocity significantly affects the cold plate performance. The increase in flow rate (0.3~0.6 m/s) can strengthen convective heat transfer, and the maximum temperature difference under the same K value reaches 7.72 °C. Still, along with the increase in pressure drop to three times the initial value, it is necessary to weigh the thermal resistance of the cold plate with the consumption of the pump power; among the import and export forms, the CM structure (side inlet and center outlet) achieves the lowest average temperature by optimizing the symmetry of the flow path. Its low-resistance characteristics effectively alleviate the problem of energy consumption brought about by the high flow rate.
However, the orthogonal test is based on orthogonality from the full factorial test to select part of the representative points for the test; therefore, the orthogonal test can obtain the trend of the factor change, as the optimal parameter group cannot be obtained from the data of the orthogonal test only.

4.2. Single-Factor Impact Analysis

4.2.1. Influence of Factors on Cold Plate Temperature

In this paper, the orthogonal test data were analyzed by using the polar analysis of variance, including the calculation of Ki (the sum of test results of a factor at the same level), ki (the corresponding mean value), R (the range value), and s (mean square deviation). The formulae for calculating the range value and mean square deviation are shown in Equations (11)–(13). For the aspect ratio factor, K1, K2, K3, and K4 represent the sum of test results when the aspect ratio is 2, 3, 4, and 5, respectively, and k1, k2, k3, and k4 are their corresponding mean values; for the velocity factor, K1, K2, K3, and K4 represent the sum of test results when the velocity is 0.3 m/s, 0.4 m/s, 0.5 m/s, and 0.6 m/s, respectively, and k1, k2, k3, and k4 are their corresponding average values; for the inlet and outlet forms, K1, K2, K3, and K4 represent the sum of test results when the inlet and outlet forms are C, D, M, and CM, respectively, and k1, k2, k3, and k4 are their corresponding average values. Table 5 shows the results of the polar analysis of each factor on the surface temperature of the simulated heat source.
R = max k i min k i , i = 1 , 2 , 3 , 4 ,
where ki is the average of the test results of a factor at the same level.
s = i = 1 4 k i k i ¯ 2 4 ,
where k i ¯ is the average value of ki, calculated as
k i ¯ = i = 1 4 k i 4 ,
Based on the extreme difference analysis in Table 5, the order of influence for the three factors is R2 > R3 > R1. This indicates that velocity exerts the most significant effect on the surface temperature of the simulated heat source, while the aspect ratio has the least impact. The overall degree of influence follows the sequence: velocity > import/export form > height/width ratio. To examine the relationship between varying influence levels on the surface temperature of the simulated heat source for each factor, a corresponding graph is provided in Figure 12.
The influence of different levels on the surface temperature of the simulated heat source under each factor is illustrated in Figure 12. Among the three factors, the aspect ratio has the smallest impact, but it still shows a certain effect. Specifically, a smaller aspect ratio corresponds to a lower surface temperature, with the lowest value observed when K = 2. The velocity exerts the most significant effect on the surface temperature. As the velocity increases, the surface temperature decreases, reaching its minimum at a velocity of 0.6 m/s.
Regarding the import and export forms, the surface temperature difference between the C-type and M-type forms is negligible, making it difficult to establish a clear relationship between these forms and the surface temperature. However, the D-type form results in the highest surface temperature, while the CM-type form yields the lowest. Furthermore, the surface temperature in the D-type inlet and outlet set up shows a significant deviation from other configurations, whereas the CM-type inlet and outlet achieve the most stable and preferable results for simulating the surface temperature of the heat source.
For the heat transfer performance of the cold plate, temperature is an important reference standard, and the uniformity of temperature is equally important. Figure 13 shows the temperature cloud diagram of the microchannel cold plate under each parameter group, from which the temperature distribution under each parameter group can be clearly understood.
From Figure 13, it can be seen that the import and export forms that make the temperature uniformity of the cold plate better are C-type and M-type, and the import and export form with the worst temperature uniformity is D-type, with the highest temperature as a whole skewed downward. While the CM type import and export form has poor temperature uniformity at a low velocity, there are two obvious temperature partitions. When the velocity is increased, the temperature inhomogeneity is improved, and when the velocity is 0.6 m/s, the temperature uniformity of the cold plate is the best compared to other import and export forms. According to the above analysis, the cold plate with parameter set K2V0.6CM has the superior ability to cool the simulated heat source and has better temperature uniformity.

4.2.2. Influence of Factors on Cold Plate Pressure Drop

Table 6 shows the table of polar analysis of factors on the pressure drop of the microchannel cold plate.
Table 6 provides an analysis of the extreme differences among the factors influencing the cold plate pressure drop. The results indicate that the magnitude of influence follows the order R2 > R1 > R3, where velocity has the most significant impact on the pressure drop, while the import/export form has the least. The overall ranking of the factors’ influence on the pressure drop is the following: velocity > height-to-width ratio > import/export form. To further explore how different levels of each factor affect the cold plate pressure drop, a relationship graph is presented in Figure 14.
Figure 14 analyzes the effects of three factors on the pressure drop across the microchannel cold plate. The pressure drop rises significantly with the increase in aspect ratio and velocity, and the effect of velocity on the pressure drop is the most significant, showing an approximately exponential growth trend, while the impact of aspect ratio is the second most significant, which also shows an obvious nonlinear growth characteristic. The effect of inlet and outlet forms on the pressure drop is relatively small, in which the cold plate pressure drop is higher for the D-type and M-type inlets and outlets, while the CM-type has the lowest cold plate pressure drop. Overall, the velocity and aspect ratio are the main factors determining the pressure drop of the cold plate, and the influence of the inlet and outlet forms is relatively minor but cannot be ignored. Therefore, the preferred parameter set for the objective of microchannel cold plate pressure drop is K2V0.3CM.

4.2.3. Influence of Factors on the Heat Transfer Coefficient of Cold Plates

Table 7 shows the table of the polar analysis of factors on the average convective heat transfer coefficient of the microchannel cold plate.
Table 7 presents an extreme difference analysis of the factors influencing the average convection heat transfer coefficient of the cold plate. The results show that the size of the extreme difference follows the order R2 > R3 > R1, indicating that velocity has the most significant impact, while the aspect ratio has the least. The overall ranking of the factors’ influence is as follows: velocity > import/export form > height ratio > aspect ratio. To further examine how different levels of these factors affect the average convection heat transfer coefficient, a relationship graph is provided in Figure 15.
Figure 15 illustrates the impact of various factors on the mean convective heat transfer coefficient. The results indicate that velocity is the most influential factor. Additionally, the design of the inlet and outlet significantly affects heat transfer performance, with the CM type achieving the highest heat transfer coefficient and the D type the lowest. In contrast, the influence of the aspect ratio is relatively small, as the aspect ratio increases from 3 to 5, the heat transfer coefficient shows a gradual decline in the trend, and the height and width ratio of 3 is slightly higher than the heat transfer coefficient at the height and width ratio of 2. Comprehensive analysis shows that enhancing the velocity is the most effective means to improve the heat transfer performance of the cold plate while optimizing the inlet and outlet forms (selecting CM type) can further strengthen the heat transfer performance. Therefore, for the heat transfer coefficient of the cold plate, the optimum parameter set is K3V0.6CM.

4.3. Optimal Parameter Set Evaluation

In summary, although the cross-sectional area remains constant, narrow rectangular microchannels with large aspect ratios exhibit poor performance in terms of surface temperature, pressure drop, and the average convective heat transfer coefficient of the cooling simulated heat source. In contrast, channels with smaller aspect ratios achieve better heat transfer performance due to the increased contact area between the bottom surface and the cooling medium. Velocity plays a critical role in determining the cold plate’s performance, and increasing the flow rate increases the degree of fluid turbulence and thus the heat transfer coefficient. However, the increased fluid wall and internal friction lead to a significant increase in the resistance to flow (pressure drop) as a function of the square of the flow rate, resulting in an exponential increase in pressure drop, which negatively affects the overall performance, making the selection of the appropriate velocity critical.
The design of inlet and outlet forms also influences pressure drop and temperature uniformity. For instance, the CM-type design significantly reduces pressure drop, whereas the D-type design suffers from poor temperature uniformity. Optimal parameter combinations for each evaluation index are determined through single-factor analysis, with the advantages and disadvantages of each configuration summarized in Table 8.
According to the analysis of advantages and disadvantages in Table 8, the cold plate with aspect ratio K = 2 is preferred. For the selection of velocity and inlet/outlet form, the higher the velocity, the better the thermal performance of the cold plate, and the CM-type inlet/outlet form has better temperature uniformity at high velocity. However, the velocity has a significant effect on the pressure drop of the cold plate and the temperature uniformity of the CM-type inlet and outlet forms. Therefore, the interaction of velocity and inlet/outlet form may have an effect on the cold plate pressure drop, which should not be ignored if it has a large effect on the cold plate performance. Based on the data in Table 4, the interaction of velocity and inlet/outlet form is plotted as shown in Figure 16.
Figure 16 illustrates the variation in cold plate pressure drop across different inlet and outlet configurations as the velocity changes. At a velocity of 0.3 m/s, the pressure drop differences among the configurations are minimal. However, as the velocity increases, these differences become more pronounced. Notably, the pressure drop for C-type, D-type, and M-type configurations rises significantly at flow velocities of 0.4 m/s, 0.5 m/s, and 0.6 m/s, respectively, and exceeds that of the CM-type configuration at 0.6 m/s. In contrast, the CM-type maintains a more stable pressure drop within the range of 0.3 to 0.6 m/s.
Considering both cold plate temperature uniformity and the relationship between velocity and pressure drop, the optimal combination was determined to be a velocity of 0.5 m/s with the CM-type inlet and outlet configuration. Accordingly, the parameter group K2V0.5CM was selected as the best design.

5. Model Performance Analysis

5.1. Performance Analytics

In order to verify the cold plate performance of this parameter group, the optimal parameter group under each evaluation index was selected for comparison with it, i.e., parameter groups K2V0.6CM, K2V0.3CM, and K3V0.6CM were compared and analyzed with parameter group K2V0.5CM. The cold plate performance analysis under each parameter group is shown in Figure 17, Figure 18, Figure 19, Figure 20 and Figure 21.
Figure 17 compares the surface temperature of the simulated heat source cooled by the cold plate under different parameter groups. The results show that, with the increase in time, the surface temperature of the simulated heat source gradually tends to stabilize, and the cooling effect of the cold plate in different parameter groups varies significantly. The cooling effect of parameter group K2V0.5CM is the best, and the cooling surface temperature is the lowest under this parameter group, while the cooling effect of parameter group K2V0.3CM is the worst, and the cooling temperature of parameter group K2V0.3CM is 14.06% higher than that of parameter group K2V0.5CM, which is related to the fact that the parameter group K2V0.3CM has a lower velocity. Parameter groups K2V0.6CM and K3V0.6CM have higher velocities, but the cooling effects are all significantly worse than parameter group K2V0.5CM.
Figure 18 shows the temperature distribution of the cold plate under each parameter group. It can be seen that the temperature distribution of the cold plate in parameter groups K2V0.6CM and K3V0.6CM is more uniform, while the cold plate in parameter group K2V0.3CM exists in a large high-temperature core area, which is detrimental to the operation and life of the electronic chip. In contrast, the cold plate of the parameter group K2V0.5CM has two well-defined high-temperature core areas, but they are smaller, and the maximum temperatures are 12.33% lower than the maximum temperature of the K2V0.3CM and 0.61 °C lower than the maximum temperature of the K2V0.6CM. Therefore, the temperature inhomogeneity of the K2V0.5CM cold plate is negligible and has no significant effect on the operation and lifetime of the electronic chip.
Figure 19 shows the trend of the average convective heat transfer coefficient of the cold plate under each parameter group. The results show that the convective heat transfer coefficients of each parameter group decreased rapidly in the initial stage (0–4 s) and then gradually stabilized, in which the parameter group K2V0.5CM always maintained the highest convective heat transfer coefficient of about 12,092.31 W/(m2·°C), with the optimal performance of the heat transfer; the parameter groups K2V0.6CM and K3V0.6CM were next to the parameter group and have similar heat transfer properties. K2V0.3CM has the lowest heat transfer coefficient, which is about 6325.45 W/(m2·°C), with the worst performance. Overall, the parameter group K2V0.5CM has the best heat transfer.
Figure 20 shows the cold plate pressure drop under each parameter group. From the figure, it can be seen that the cold plate pressure drop of parameter groups K3V0.6CM and K2V0.6CM are both significantly higher than that of the other two parameter groups, and their cold plate flow performance is poor, while parameter group K2V0.3CM has the smallest cold plate pressure drop and has better flow performance. Parameter group K2V0.5CM has only 0.1 m/s lower velocity than K2V0.6CM, but the pressure drop of the cold plate is 44.47% lower than that of the other two parameter groups, and the cold plate of parameter group K2V0.5CM also has better fluidity performance.
Figure 21 shows the pressure distribution cloud diagram of the cold plate of each parameter group. The results show that the pressure distribution of the cold plate in parameter group K3V0.6CM is the worst, with a large range of high-pressure areas and seriously uneven distribution. In contrast, parameter group K2V0.6CM improved the uniformity of pressure distribution by adjusting the aspect ratio from K = 3 to K = 2, but the pressure difference between the inlet and outlet is still large. The pressure distribution of parameter groups K2V0.5CM and K2V0.3CM is better, and the difference between them is not obvious, but there is still some unevenness. Combining the thermal and flow properties of the cold plate, the parameter group K2V0.5CM cold plate has the best performance.

5.2. Dimensionless Analysis

The Reynolds number and Prandtl number are two essential dimensionless parameters that characterize the relationship between fluid flow behavior, the thermal boundary layer, and the velocity boundary layer. These parameters are crucial for analyzing the fluid dynamics and thermal performance of the cooling medium in cold plates. Based on a comprehensive analysis and regression of the Numerical simulation data, this study derives a corresponding correlation equation. The curve representing this correlation equation is presented in Figure 22, and the derived equation is as follows:
N u = 0.1547 R e 0.647 P r 1 / 3
Applicable conditions are as follows: Re = 700~1600, and the cooling medium is water.
As shown in Figure 22, the correlation law between Nu and Re can be accurately fitted by a quadratic polynomial equation (coefficient of determination R2 = 0.998), indicating that the model has a very high prediction accuracy. The correlation reveals a significant positive correlation between the Re and Nu, which provides a theoretical basis for the quantitative characterization of the forced convection heat transfer behavior in microchannels. The empirical relationship can accurately characterize the coupling mechanism of flow and heat transfer in the microchannel, which is of great significance for the optimization of the structural parameters of the liquid-cooled plate: based on the model, the thermal resistance can be minimized and the thermal efficiency can be maximized by adjusting the geometric characteristics of the channel (aspect ratio) and the flow conditions (flow velocity), which can satisfy the thermal management requirements of a 350W-class CPU.
Figure 23 compares the numerically simulated Nu with the Nu calculated using the fitted formula. The results reveal a strong linear correlation, with a coefficient of determination (R2) of 0.998, demonstrating the high predictive accuracy of the fitted formula. The presence of a 95% confidence band and a narrower 95% prediction band further confirms the model’s reliability and precision.

6. Conclusions

In this paper, a counter-flow rectangular microchannel liquid cooling plate is designed and numerically simulated by designing orthogonal tests. The effects of single-factor and multi-factor interactions of velocity, rectangular microchannel aspect ratio, and the form of import and export of cooling medium on the cooling performance, temperature uniformity, and pressure drop of the cold plate are investigated, and the optimal parameter combinations are determined. Finally, the cold plate of the optimal parameter group is compared with the cold plate of other parameter groups, and the following conclusions are drawn:
  • Velocity plays a critical role in determining cold plate performance. Among all factors, it has the most notable impact on the cooling capacity, pressure drop, and average convective heat transfer coefficient of the cold plate. An increase in velocity effectively enhances heat transfer performance; however, it also significantly raises the pressure drop. Thus, a balance must be struck between improving heat transfer efficiency and managing pressure drop. Based on the analysis, a velocity of 0.5 m/s was identified as the optimal value, achieving a compromise between cooling efficiency and flow resistance.
  • The narrower large-aspect-ratio cold plate performance is poor, while the smaller aspect ratio is more conducive to improving the cold plate heat transfer and fluidity performance, the cold plate in the thermal performance, fluidity, and temperature uniformity when K = 2. The CM type inlet and outlet form according to the cooling capacity of the cold plate and the uniformity of the cold plate temperature, and, reducing the pressure drop has a significant advantage in the cold plate. In the high velocity conditions of the cold plate, temperature uniformity is optimal. For comprehensive consideration, the optimum aspect ratio is 2, and the optimum inlet and outlet form is the CM type.
  • The parameter group K2V0.5CM has the best overall performance. Its cooling surface temperature is the lowest, 14.06% lower than that of K2V0.3CM, and the temperature uniformity is good. The average convective heat transfer coefficient reaches 12,092.31 W/(m2·°C), which is significantly better than other parameter groups. The velocity was only 0.1 m/s lower than that of parameter group K2V0.6CM, but the pressure drop was reduced by 44.47%, and the flow performance was better. Therefore, the parameter group K2V0.5CM has optimal heat transfer and flow performance.
  • A correlation equation for Nu was derived from numerical simulation data, and a comparison between the simulated and calculated Nu reveals a strong linear correlation with an R2 of 0.998, indicating high accuracy. The narrow 95% confidence and prediction bands further confirm the formula’s stability in estimating model parameters.
  • This study demonstrates the efficacy of reverse-flow rectangular microchannel cold plates for high-power CPU cooling, but there are still some limitations to consider. First, the simplification of the theoretical calculations leads to a slight deviation of the theoretically calculated values from the numerically simulated values; second, the parametric analysis is limited to rectangular microchannels with fixed equivalent diameters; variations in cross-sectional shapes (e.g., trapezoidal, etc.) and multiscale channel designs may further improve the overall performance of the cold plate. Finally, the cooling medium is limited to single-phase water, ignoring the potential advantages of nanofluids or two-phase flow for enhanced heat transfer.
  • Future work focuses on finding theoretical computational methods more suitable for microchannel liquid-cooled plates, exploring hybrid channel geometries, advanced cooling media (e.g., nanofluids or phase-change materials, etc.), and transient thermo-fluid coupling mechanisms. In addition, experimental validation under real-world operating conditions and the cost–benefit analysis of fabrication scalability are critical for industrial applications. Expanding the application scope of this microchannel liquid-cooled plate contributes to an excellent solution for data center thermal management.

Author Contributions

Conceptualization, Z.Y. (Zhengchao Yang); methodology, Y.W.; software, J.G., Z.Y. (Zhichen Yu), Q.L., X.S. and X.Y.; validation, J.G., Z.Y. (Zhichen Yu), Q.L., X.S. and X.Y.; formal analysis, J.G., Z.Y. (Zhichen Yu), Q.L., X.S. and X.Y.; investigation, Z.Y. (Zhengchao Yang); resources, Z.Y. (Zhengchao Yang); data curation, Z.Y. (Zhengchao Yang); writing—original draft preparation, Z.Y. (Zhengchao Yang) and Q.Y.; writing—review and editing, Y.W.; visualization, Z.Y. (Zhengchao Yang); supervision, Y.W.; project administration, Y.W.; funding acquisition, Q.Y. All authors have read and agreed to the published version of the manuscript.

Funding

This research received no external funding.

Data Availability Statement

Data can be provided upon request.

Acknowledgments

Zhongtian Broadband Technology Co., Ltd. provides support in this research project. Thanks to Yu Wang for the guidance provided on this research project.

Conflicts of Interest

Authors Qiufei Yao and Zhichen Yu were employed by the company Zhongtian Broadband Technology Co., Ltd. The remaining authors declare that the research was conducted in the absence of any commercial or financial relationships that could be construed as a potential conflict of interest.

References

  1. Habib, N.; Tahir, M. Thermal analysis of proposed heat sink design under natural convection for the thermal management of electronics. Therm. Sci. 2022, 26 Pt B, 1487–1501. [Google Scholar] [CrossRef]
  2. Zimmermann, S.; Meijer, I.; Tiwari, M.K.; Paredes, S.; Michel, B.; Poulikakos, D. Aquasar: A hot water cooled data center with direct energy reuse. Energy 2012, 43, 237–245. [Google Scholar] [CrossRef]
  3. Chen, H.; Li, D. Current Status and Challenges for Liquid-Cooled Data Centers. Front. Energy Res. 2022, 10, 952680. [Google Scholar] [CrossRef]
  4. Paniagua-Guerra, L.E.; Sehgal, S.; Gonzalez-Valle, C.U.; Ramos-Alvarado, B. Fractal channel manifolds for microjet liquid-cooled heat sinks. Int. J. Heat Mass Transf. 2019, 138, 257–266. [Google Scholar] [CrossRef]
  5. Bao, J.; Wang, Y.; Kosonen, R.; Xu, X.-J.; Liu, J.-X. Investigation on spray cooling heat transfer performance with different nanoparticles and surfactants. Heat Mass Transf. 2022, 58, 887–901. [Google Scholar] [CrossRef]
  6. Sabato, M.; Fregni, A.; Stalio, E.; Brusiani, F.; Tranchero, M.; Baritaud, T. Numerical study of submerged impinging jets for power electronics cooling. Int. J. Heat Mass Transf. 2019, 141, 707–718. [Google Scholar] [CrossRef]
  7. Zhang, Y.-Y.; Wang, Y.; Kosonen, R.; Khan, D.A.; Wang, X.-C. Numerical research on the flow and heat transfer characteristics in the immersion jet cooling for servers. Case Stud. Therm. Eng. 2024, 60, 104748. [Google Scholar] [CrossRef]
  8. Zhang, Y.; Fan, C.; Li, G. Discussions of cold plate liquid cooling technology and its applications in data center thermal management. Front. Energy Res. 2022, 10, 954718. [Google Scholar] [CrossRef]
  9. Khalaj, A.H.; Scherer, T.; Siriwardana, J.; Halgamuge, S.K. Multi-objective efficiency enhancement using workload spreading in an operational data center. Appl. Energy 2015, 138, 432–444. [Google Scholar] [CrossRef]
  10. Zhao, J.; Huang, S.; Gong, L.; Huang, Z.-Q. Numerical study and optimizing on micro square pin-fin heat sink for electronic cooling. Appl. Therm. Eng. 2016, 93, 1347–1359. [Google Scholar] [CrossRef]
  11. Song, H.; Zheng, M.; Ma, Z.; Li, Y.-J.; Shao, W. Numerical simulation of thermal performance of cold plates for high heat flux electronics cooling. Therm. Sci. 2024, 28 Pt B, 2669–2681. [Google Scholar] [CrossRef]
  12. Chiu, H.-C.; Hsieh, R.H.; Wang, K.; Jang, J.-H.; Yu, C.-R. The heat transfer characteristics of liquid cooling heat sink with micro pin fins. Int. Commun. Heat Mass Transf. 2017, 86, 174–180. [Google Scholar] [CrossRef]
  13. Zhao, K.; Sun, X.; Xia, Y.; Li, Q.-Q.; Shen, L.-L.; Lin, M. Cold plate performance enhancement based on parametric modeling of multiple structures. Front. Energy Res. 2023, 10, 1087682. [Google Scholar] [CrossRef]
  14. Kadam, S.T.; Kumar, R. Twenty first century cooling solution: Microchannel heat sinks. Int. J. Therm. Sci. 2014, 85, 73–92. [Google Scholar]
  15. Asadi, M.; Xie, G.; Sunden, B. A review of heat transfer and pressure drop characteristics of single and two-phase microchannels. Int. J. Heat Mass Transf. 2014, 79, 34–53. [Google Scholar] [CrossRef]
  16. Chiu, H.-C.; Jang, J.-H.; Yeh, H.W.; Wu, M.-S. The heat transfer characteristics of liquid cooling heatsink containing microchannels. Int. J. Heat Mass Transf. 2011, 54, 34–42. [Google Scholar] [CrossRef]
  17. Wang, H.; Chen, Z.; Gao, J. Influence of geometric parameters on flow and heat transfer performance of micro-channel heat sinks. Appl. Therm. Eng. 2016, 107, 870–879. [Google Scholar] [CrossRef]
  18. Kumavat, P.S.; Alimohammadi, S.; O’Shaughnessy, S.M. A computational conjugate heat transfer study of a rectangular minichannel undergoing sinusoidal flow pulsations. Int. J. Therm. Sci. 2022, 182, 107790. [Google Scholar]
  19. Kumavat, P.S.; Alimohammadi, S.; O’Shaughnessy, S.M. An experimental-numerical study of heat transfer enhancement in a minichannel using asymmetric pulsating flows. IEEE Trans. Compon. Packag. Manuf. Technol. 2023, 13, 1147–1154. [Google Scholar]
  20. Haque, I.; Alam, T.; Yadav, J.; Gupta, N.K.; Haque, S.M.I.; Siddiqui, T.U.; Ali, N.; Srivastava, S.; Yadav, A.S.; Sharma, A.; et al. Numerical analysis of various shapes of lozenge pin-fins in microchannel heat sink. Int. J. Chem. React. Eng. 2024, 22, 31–43. [Google Scholar] [CrossRef]
  21. Rehman, M.M.U.; Cheema, T.A.; Ahmad, F.; Khan, M. Thermodynamic assessment of microchannel heat sinks with novel sidewall ribs. J. Thermophys. Heat Transf. 2020, 34, 243–254. [Google Scholar] [CrossRef]
  22. Chu, X.; You, H.; Tang, X.; Zhou, W.; Li, X.-Y.; Yuan, D.; Zhou, S.-P. Smart microchannel heat exchanger based on the adaptive deformation effect of shape memory alloys. Energy Convers. Manag. 2021, 250, 114910. [Google Scholar] [CrossRef]
  23. Xia, G.-D.; Jiang, J.; Wang, J.; Zhai, Y.-L.; Ma, D.-D. Effects of different geometric structures on fluid flow and heat transfer performance in microchannel heat sinks. Int. J. Heat Mass Transf. 2015, 80, 439–447. [Google Scholar] [CrossRef]
  24. Al-Neama, A.F.; Kapur, N.; Summers, J.; Thompson, H.M. An experimental and numerical investigation of the use of liquid flow in serpentine microchannels for microelectronics cooling. Appl. Therm. Eng. 2017, 116, 709–723. [Google Scholar] [CrossRef]
  25. Toghraie, D.; Abdollah, M.M.D.; Pourfattah, F.; Akbari, O.A.; Ruhani, B. Numerical investigation of flow and heat transfer characteristics in smooth, sinusoidal and zigzag-shaped microchannel with and without nanofluid. J. Therm. Anal. Calorim. 2018, 131, 1757–1766. [Google Scholar] [CrossRef]
  26. Wang, X.-Q.; Mujumdar, A.S.; Yap, C. Effect of bifurcation angle in tree-shaped microchannel networks. J. Appl. Phys. 2007, 7, 102. [Google Scholar] [CrossRef]
  27. Naqiuddin, N.H.; Saw, L.H.; Yew, M.C.; Yusof, F.; Poon, H.M.; Cai, Z.S.; Thiam, H.S. Numerical investigation for optimizing segmented micro-channel heat sink by Taguchi-Grey method. Appl. Energy 2018, 222, 437–450. [Google Scholar] [CrossRef]
  28. Gilmore, N.; Timchenko, V.; Menictas, C. Open manifold microchannel heat sink for high heat flux electronic cooling with a reduced pressure drop. Int. J. Heat Mass Transf. 2020, 163, 120395. [Google Scholar] [CrossRef]
  29. Tan, H.; Wu, L.-W.; Wang, M.-Y.; Yang, Z.-H.; Du, P.-A. Heat transfer improvement in microchannel heat sink by topology design and optimization for high heat flux chip cooling. Int. J. Heat Mass Transf. 2019, 129, 681–689. [Google Scholar] [CrossRef]
  30. Zhou, J.; Li, Q.; Chen, X. Micro pin fins with topologically optimized configurations enhance flow boiling heat transfer in manifold microchannel heat sinks. Int. J. Heat Mass Transf. 2023, 206, 123956. [Google Scholar] [CrossRef]
  31. Hung, T.-C.; Yan, W.-M.; Li, W.-P. Analysis of heat transfer characteristics of double-layered microchannel heat sink. Int. J. Heat Mass Transf. 2012, 55, 3090–3099. [Google Scholar] [CrossRef]
  32. ANSYS Fluent, 2020 R2. ANSYS Fluent User’s Guide. In ANSYS Fluent 2020 R2 Documentation; ANSYS Inc.: Canonsburg, PA, USA, 2020.
  33. Kline, S.J.; Mcclintock, F.A. Describing uncertainties in single sample experiments. Mech. Eng. 1953, 75, 3–7. [Google Scholar]
Figure 1. Schematic structure of counter-flow rectangular microchannel liquid cooling plate.
Buildings 15 00905 g001
Figure 2. Schematic diagram of the fluid domain of a counter-flow rectangular microchannel cold plate.
Buildings 15 00905 g002
Figure 3. Liquid-cooled plate cooling system.
Buildings 15 00905 g003
Figure 4. Number of grid divisions vs. simulated heat source temperature.
Buildings 15 00905 g004
Figure 5. Schematic diagram of grid structure.
Buildings 15 00905 g005
Figure 6. Schematic diagram of the experimental set up: 1. Constant temperature water tank. 2. Water storage tank. 3. Frequency conversion pump. 4. Turbine flowmeter. 5. Inlet digital pressure gauge. 6. Micro-channel liquid cooling plate. 7. Power supply. 8. Temperature recorder, 9. Computer. 10. Export digital fast thermometer. 11. Export digital pressure gauge. 12. Flow control valve.
Buildings 15 00905 g006
Figure 7. K-type thermocouple arrangement diagram.
Buildings 15 00905 g007
Figure 8. Liquid cooling plate physical.
Buildings 15 00905 g008
Figure 9. Comparison of simulation results with experimental results.
Buildings 15 00905 g009
Figure 10. Schematic of the geometric parameters of the rectangular microchannel.
Buildings 15 00905 g010
Figure 11. Schematic diagram of various forms of import and export.
Buildings 15 00905 g011
Figure 12. Relationship between the effect of different levels of each factor on the surface temperature of the simulated heat source.
Buildings 15 00905 g012
Figure 13. Temperature cloud of microchannel cold plate under each parameter set.
Buildings 15 00905 g013
Figure 14. Relationship between the effect of different levels of each factor on cold plate pressure drop.
Buildings 15 00905 g014
Figure 15. Relationship between the effect of different levels of each factor on the average convective heat transfer coefficient of the cold plate.
Buildings 15 00905 g015
Figure 16. Interaction of velocity with inlet and outlet forms.
Buildings 15 00905 g016
Figure 17. Surface temperature of simulated heat source for cold plate cooling under each parameter set.
Buildings 15 00905 g017
Figure 18. Cold plate temperature cloud for each parameter group.
Buildings 15 00905 g018
Figure 19. Variation in average convective heat transfer coefficient of the cold plate for each parameter set.
Buildings 15 00905 g019
Figure 20. Cold plate pressure drop under each parameter group.
Buildings 15 00905 g020
Figure 21. Cold plate pressure cloud for each parameter group.
Buildings 15 00905 g021
Figure 22. Correlative equation curves.
Buildings 15 00905 g022
Figure 23. Relationship between numerical simulation and calculated Nu.
Buildings 15 00905 g023
Table 1. Boundary condition settings.
NumbersBoundary ConditionsMode
1Entrance settingVelocity inlet
2Outlet settingPressure outlet
3Inlet temperature35 °C
4Cooling mediumLiquid water
5Cold plate materialAluminum
6CPU materialCopper
7Heat flux97,222.2 W/m2
Table 2. Four different aspect ratios.
ModelAspect Ratio (K)Widths (W)Heights (H)IntervalsNumberCross-Sectional Area
(mm)(mm)(mm)(pcs)(mm2)
Case121.4142.8280.48640160
Case231.1553.4650.74540160
Case341.004.000.940160
Case450.8944.4721.00640160
Table 3. Table of orthogonal tests.
FactorsFactor AFactor BFactor C
Numbers Aspect Ratio (K)VelocityForms of Inlet/Outlet
(m/s)
120.3C
220.4D
320.5M
420.6CM
530.3D
630.4M
730.5CM
830.6C
940.3M
1040.4CM
1140.5C
1240.6D
1350.3CM
1450.4C
1550.5D
1650.6M
Table 4. Orthogonal test results.
ObjectivesSimulated Heat Source TemperatureCold Plate Pressure DropAverage Convective Heat Transfer Coefficient of Cold Plate
Numbers T/°CΔP/Pah/(W/(m2·°C))
150.96778.806091.62
249.791312.406573.51
346.461844.528483.61
444.771947.689951.10
553.251000.605327.24
648.181465.947376.49
745.511559.609250.45
845.532965.729232.88
951.411176.385924.57
1047.211229.787962.51
1146.972769.988122.16
1248.834382.347029.80
1350.59932.426236.19
1448.942787.786974.33
1552.454183.185571.47
1646.245606.328649.66
Table 5. Polar analysis of the factors on the surface temperature of the simulated heat source.
StatisticiansFactor 1 (Aspect Ratio)Factor 2 (Velocity)Factor 3 (Forms of Inlet/Outlet)
K1191.98206.21192.40
K2192.47194.12204.32
K3194.42191.39192.29
K4198.22185.37188.08
k148.0051.5548.10
k248.1248.5351.08
k348.6147.8548. 07
k449.5646.3447.02
R1.565.214.06
s0.611.901.52
Table 6. Extreme variance analysis of microchannel cold plate pressure drop by factors.
StatisticiansFactor 1 (Aspect Ratio)Factor 2 (Velocity)Factor 3 (Forms of Inlet/Outlet)
K15883.403888.209302.28
K26991.866795.9010,878.52
K39558.4810,357.2810,093.16
K413,509.7014,902.065669.48
k11470.85972.052325.57
k21747.971698.9752719.63
k32389.622589.322523.29
k43377.433725.521417.37
R1906.582753.471302.26
s733.201028.24498.56
Table 7. Polar analysis of factors on the average convective heat transfer coefficient of microchannel cold plate.
StatisticiansFactor 1 (Aspect Ratio)Factor 2 (Velocity)Factor 3 (Forms of Inlet/Outlet)
K131,099.8423,579.6230,420.99
K231,187.0628,886.8424,502.02
K329,039.0431,427.6930,434.33
K427,431.6534,863.4433,400.25
k17774.965894.917605.25
k27796.777221.716125.51
k37259.767856.927608.58
k46857.918715.868350.06
R938.862820.952224.55
s390.361029.00807.85
Table 8. Advantages and disadvantages of each parameter group.
Parameter GroupAdvantagesDisadvantages
K2V0.6CMSimulating the optimal parameter set of the surface temperature of heat source, there is the lowest surface temperature at this aspect ratio, the temperature distribution of the cold plate in the form of CM-type inlet and outlet is more uniform, and the thermal performance is better under the condition of 0.6 m/s.This inlet and outlet form has uneven temperature distribution at low velocity (0.3 m/s), and the 0.6 m/s velocity in this parameter set results in a large pressure drop across the cold plate.
K2V0.3CMThe optimal parameter set for the cold plate pressure drop has the lowest cold plate pressure drop for this aspect ratio and is lowest at 0.3 m/s.The temperature distribution of the cold plate in the form of CM-type inlet and outlet is not uniform at 0.3 m/s, and the thermal performance of the cold plate is low.
K3V0.6CMThe best parameter set of average convective heat transfer coefficients of the cold plate has the highest heat transfer coefficient at this aspect ratio, the temperature distribution of the cold plate in the form of CM-type inlet and outlet is more uniform, and the thermal performance is better under the condition of 0.6 m/s.This inlet and outlet form has uneven temperature distribution at low velocity (0.3 m/s), and the 0.6 m/s velocity in this parameter set results in a large pressure drop across the cold plate.
Disclaimer/Publisher’s Note: The statements, opinions and data contained in all publications are solely those of the individual author(s) and contributor(s) and not of MDPI and/or the editor(s). MDPI and/or the editor(s) disclaim responsibility for any injury to people or property resulting from any ideas, methods, instructions or products referred to in the content.

