
Study of Factors Influencing Thermal Comfort at Tram Stations in Guangzhou Based on Machine Learning

Abstract
1. Introduction
2. Methodology
2.1. Data Collection
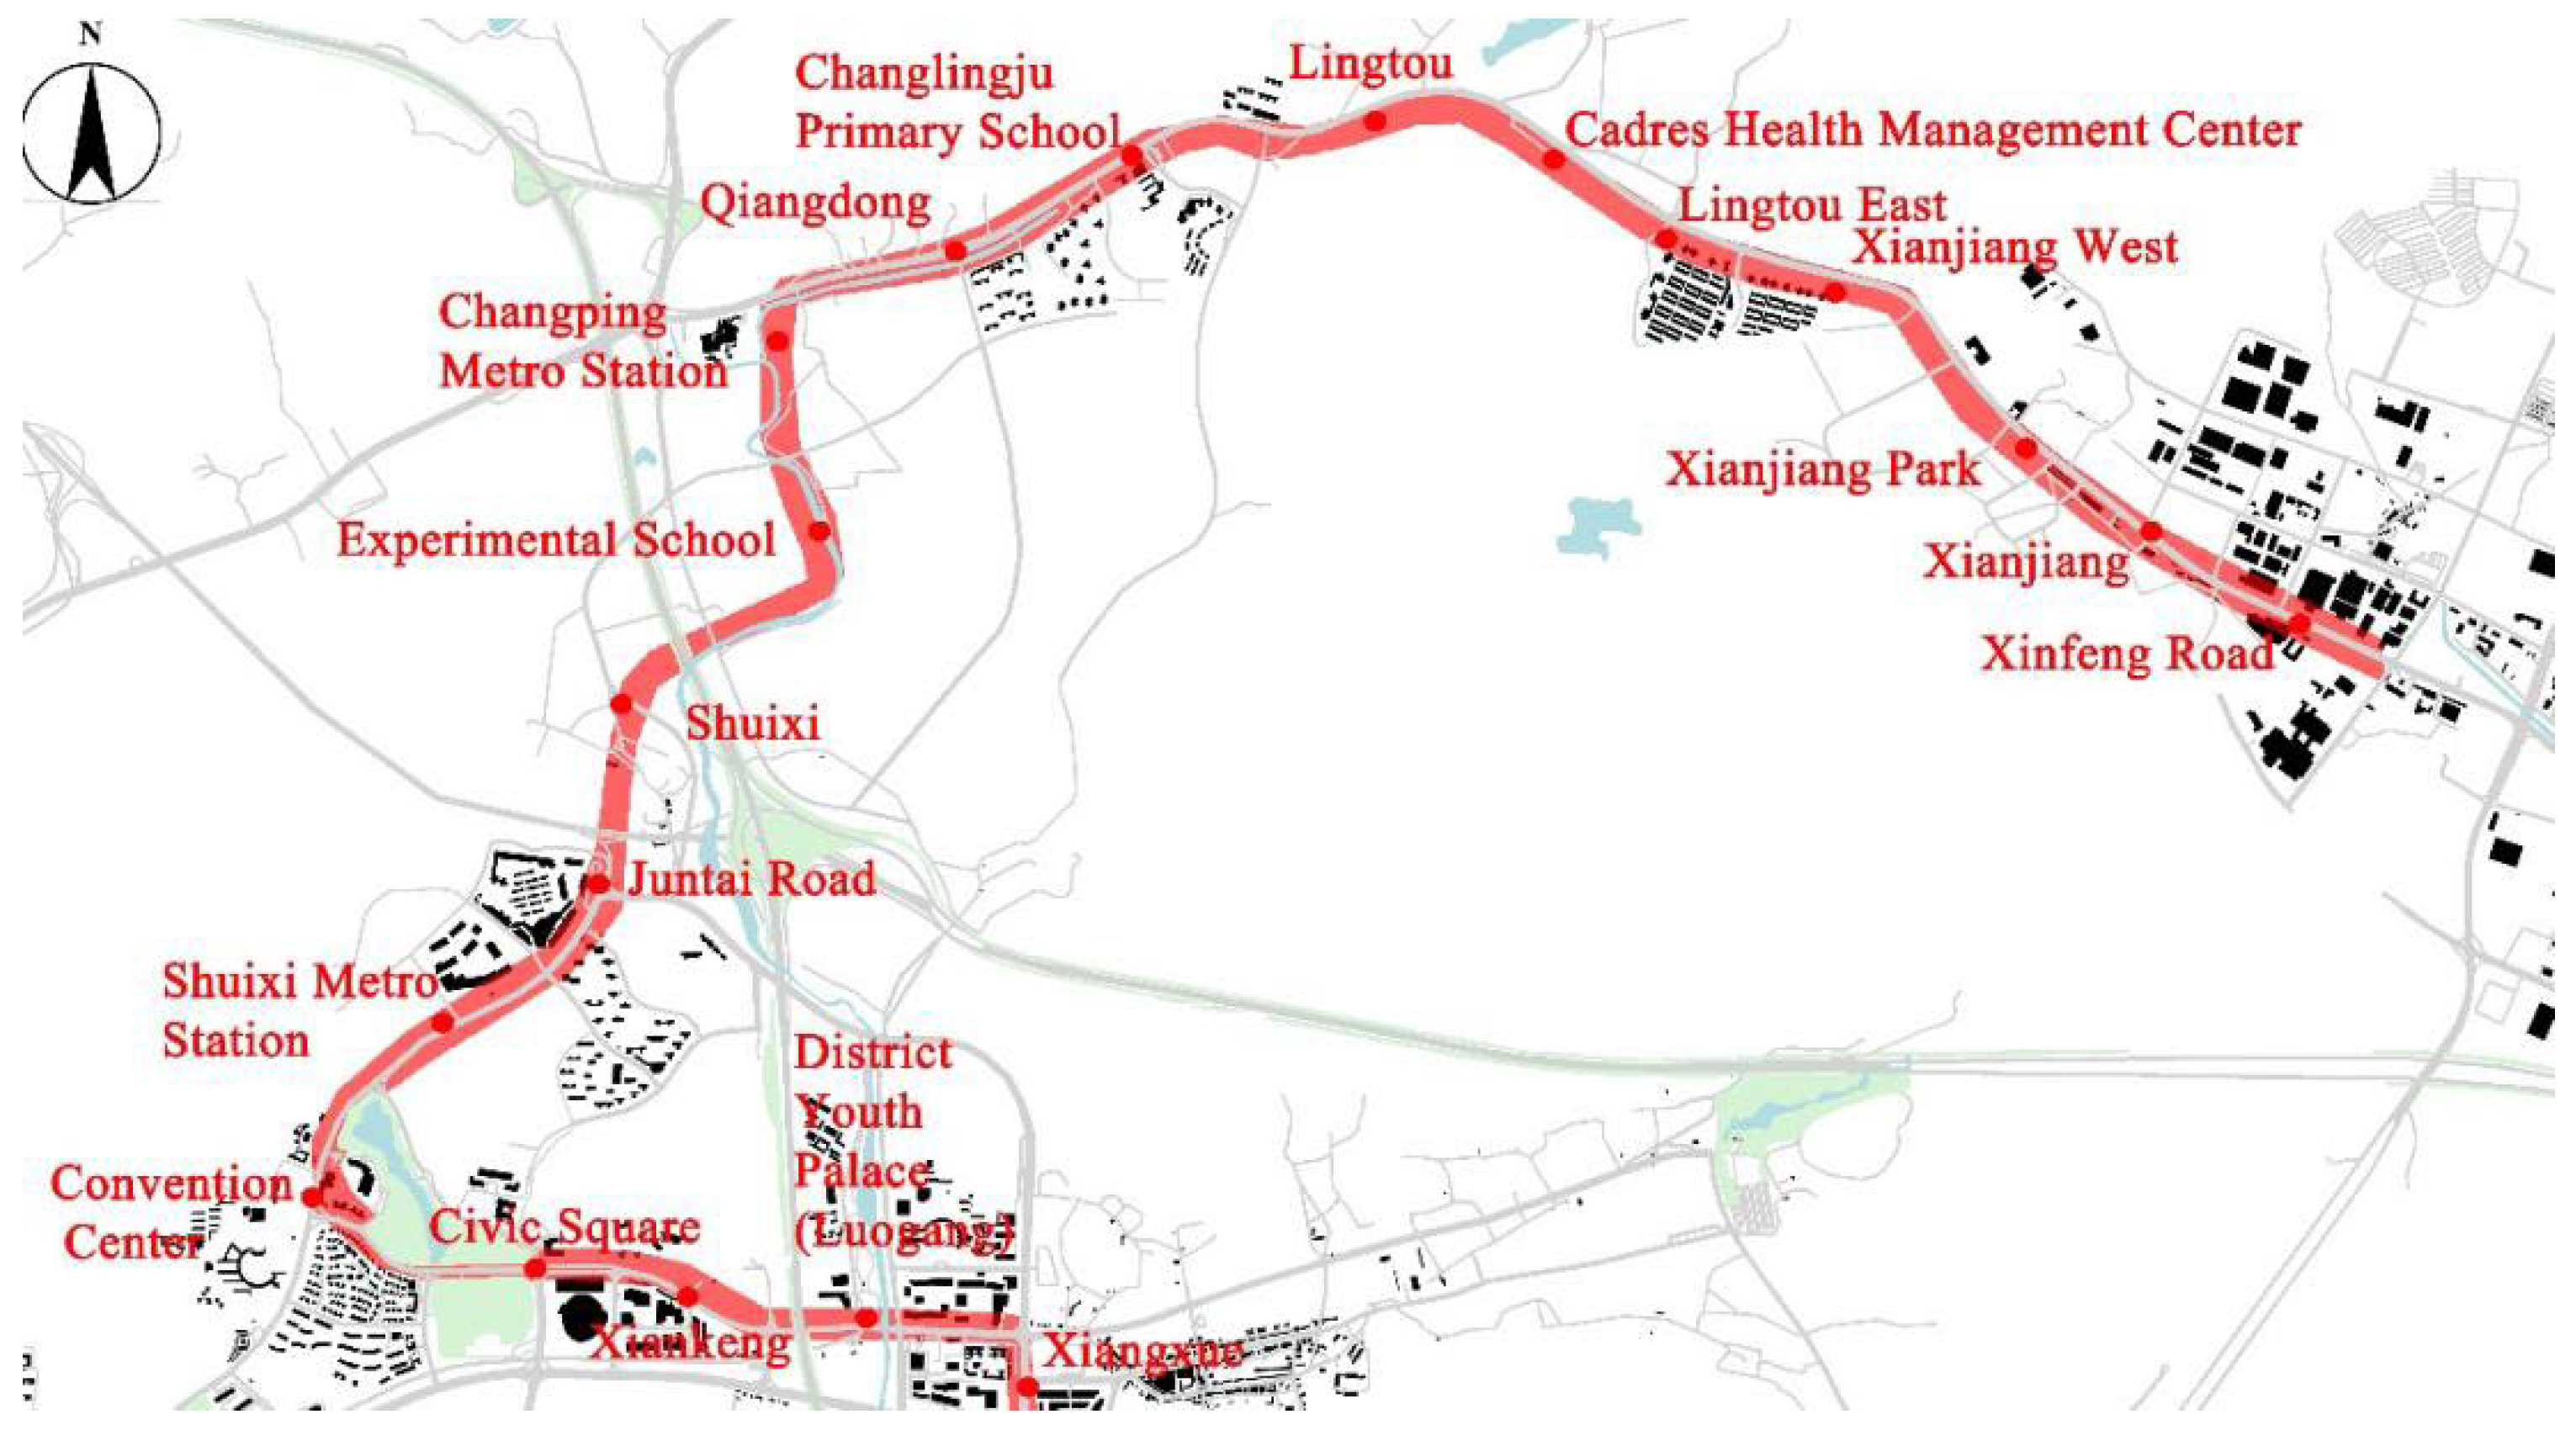
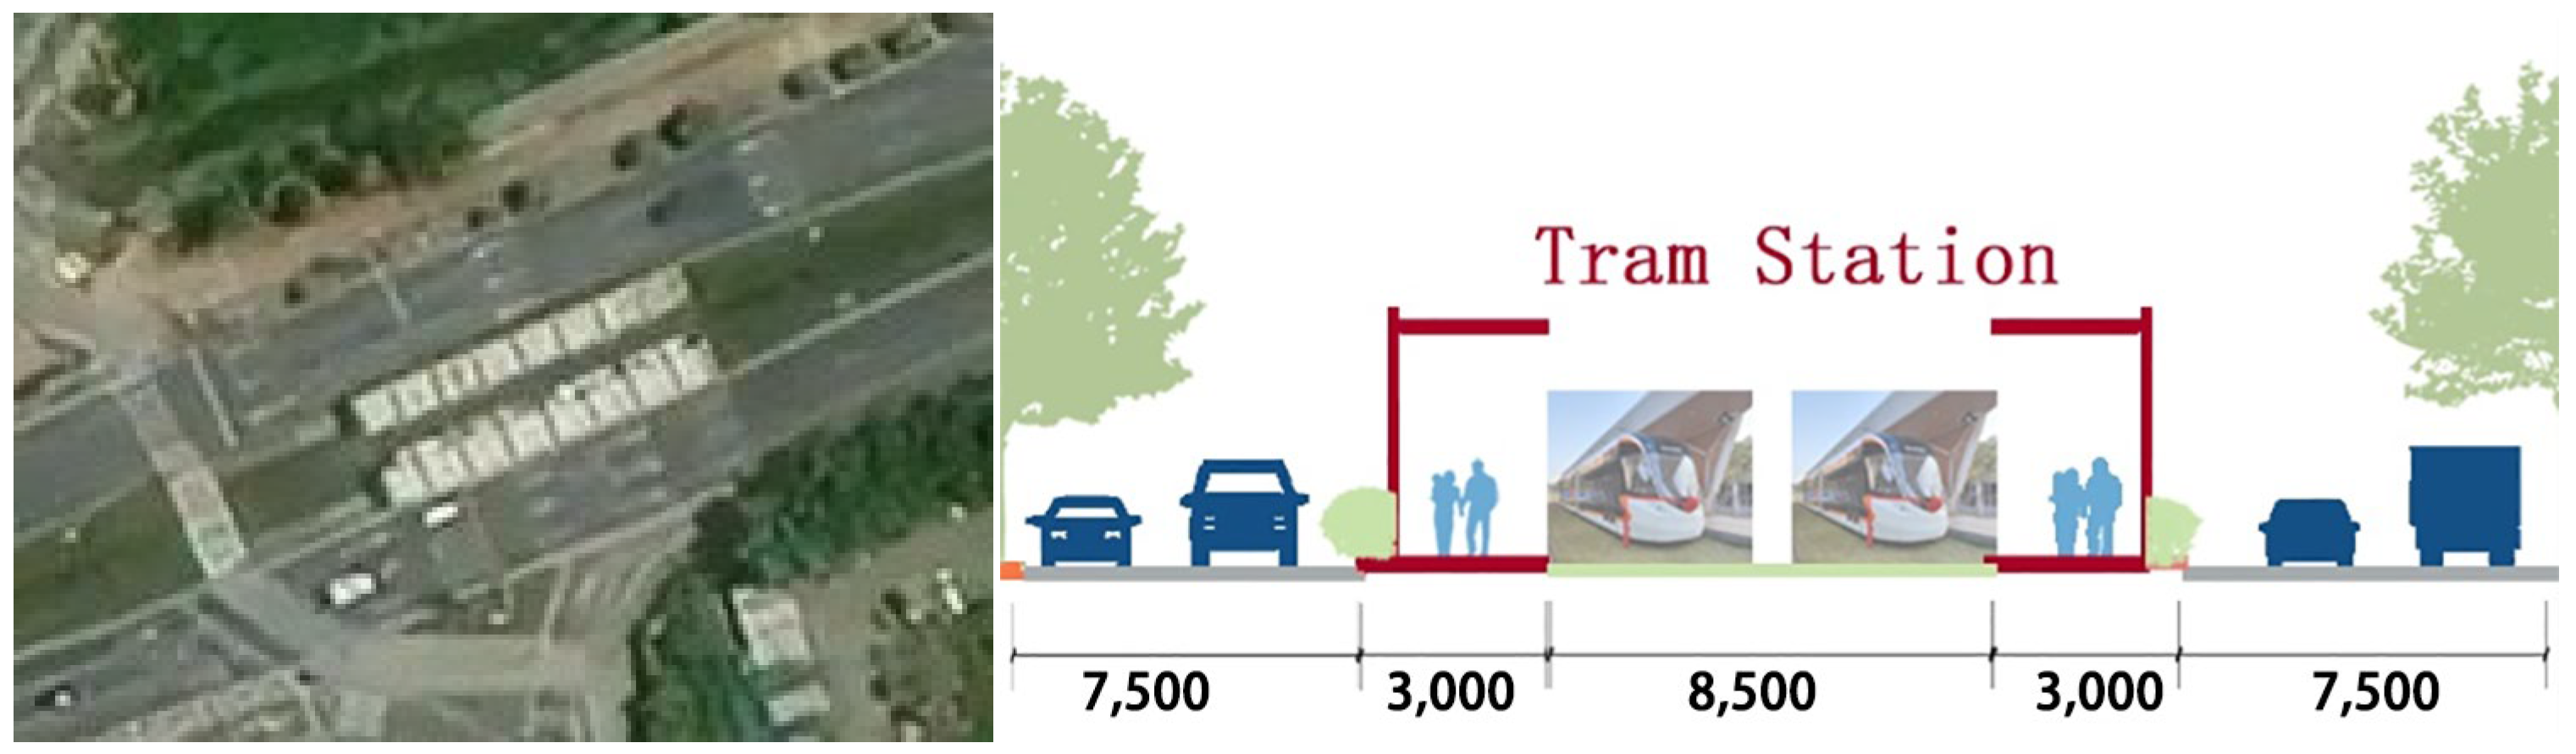
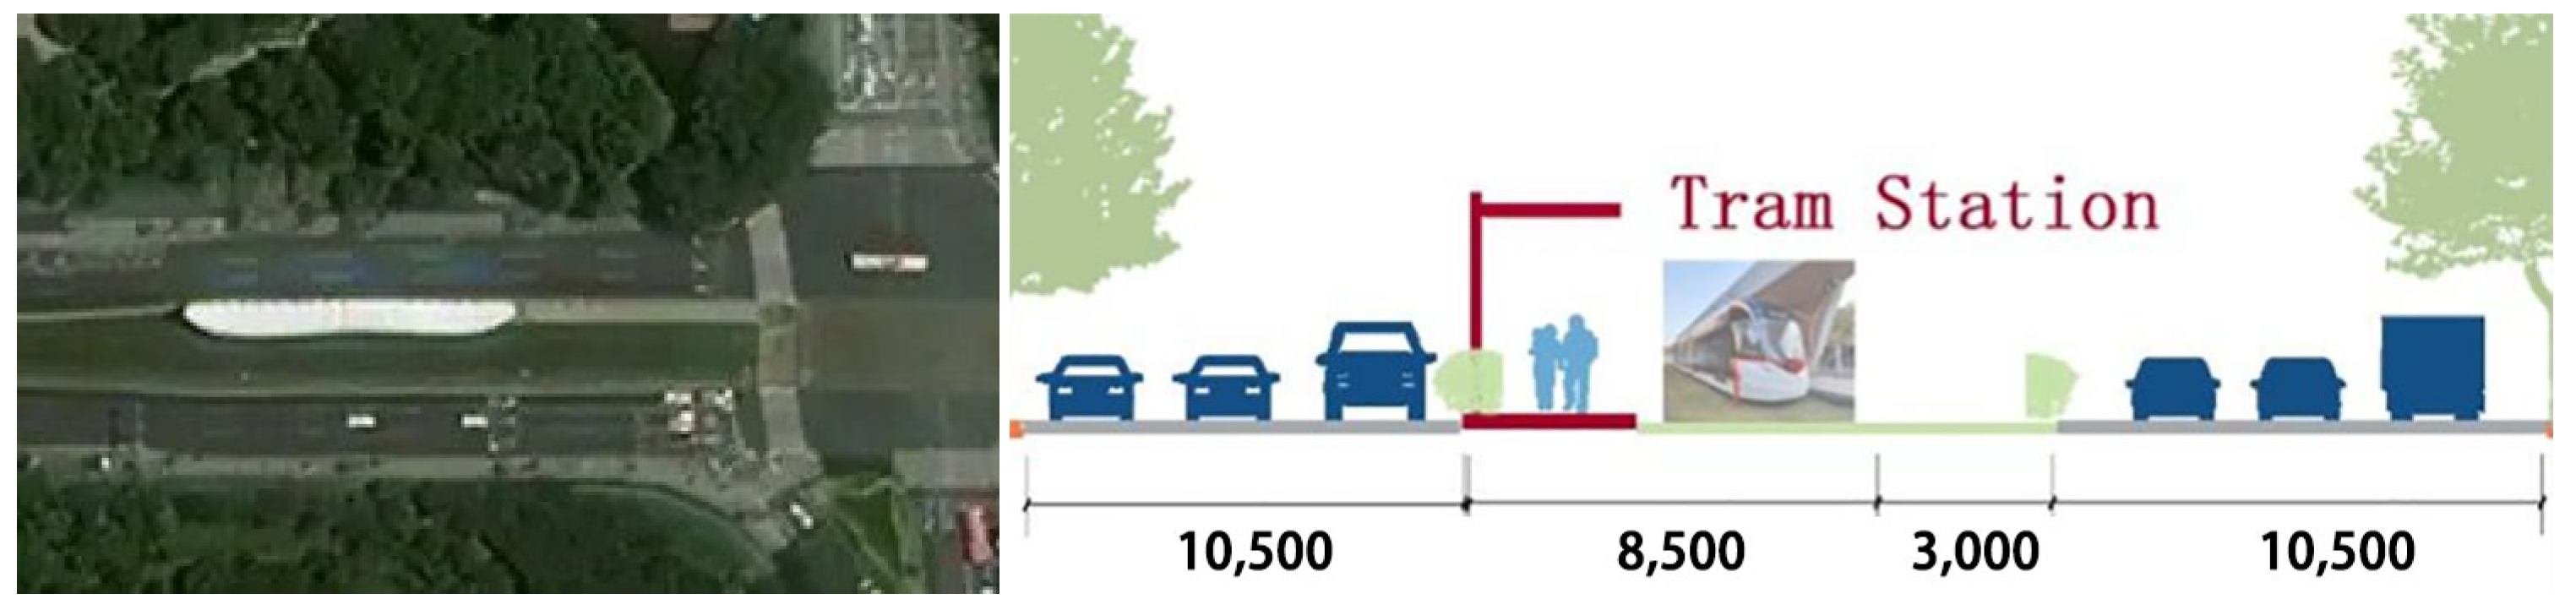
2.1.1. Study Area
2.1.2. Physical Measurements
2.1.3. Questionnaire Surveys
2.2. ML Model Establishment and Optimization
2.2.1. Data Preprocess
2.2.2. Model Construction and Evaluation
2.2.3. Model Explanation
3. Results
3.1. Model Optimization and Selection
3.2. SHAP Analysis of Feature Impacts
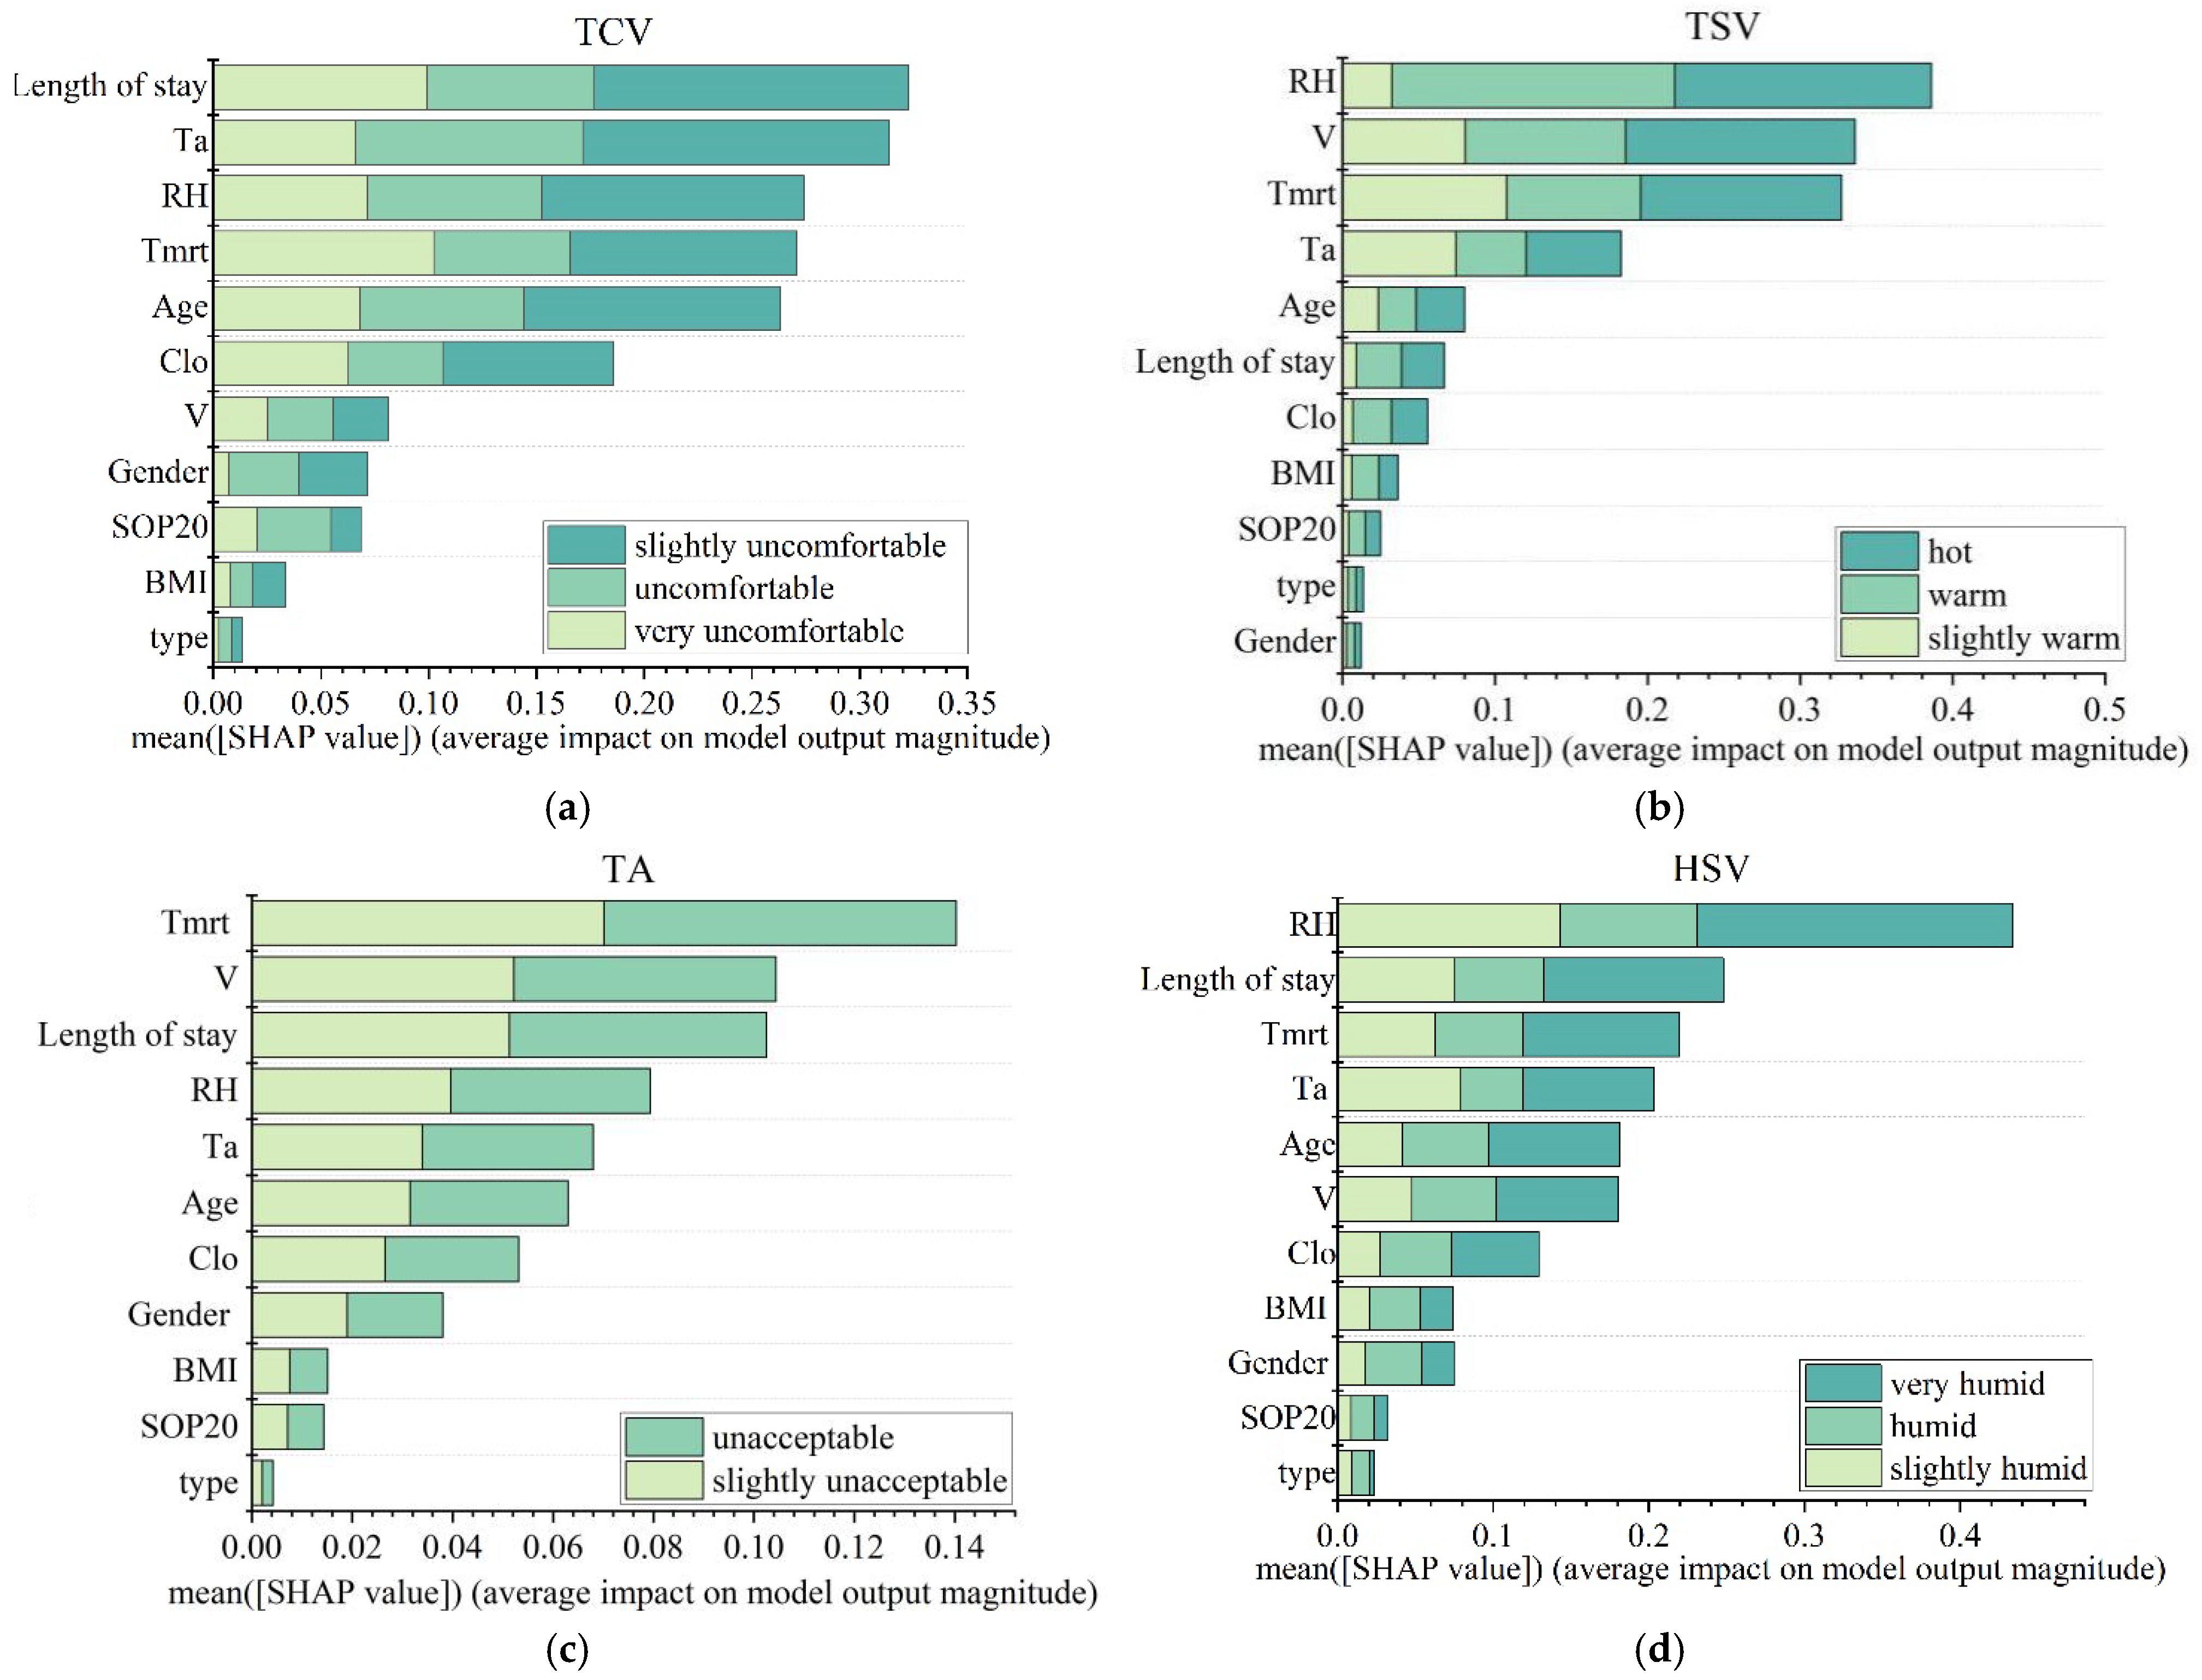
3.2.1. Importance Ranking of Features
3.2.2. Impact of Features: Positive or Negative
4. Discussion
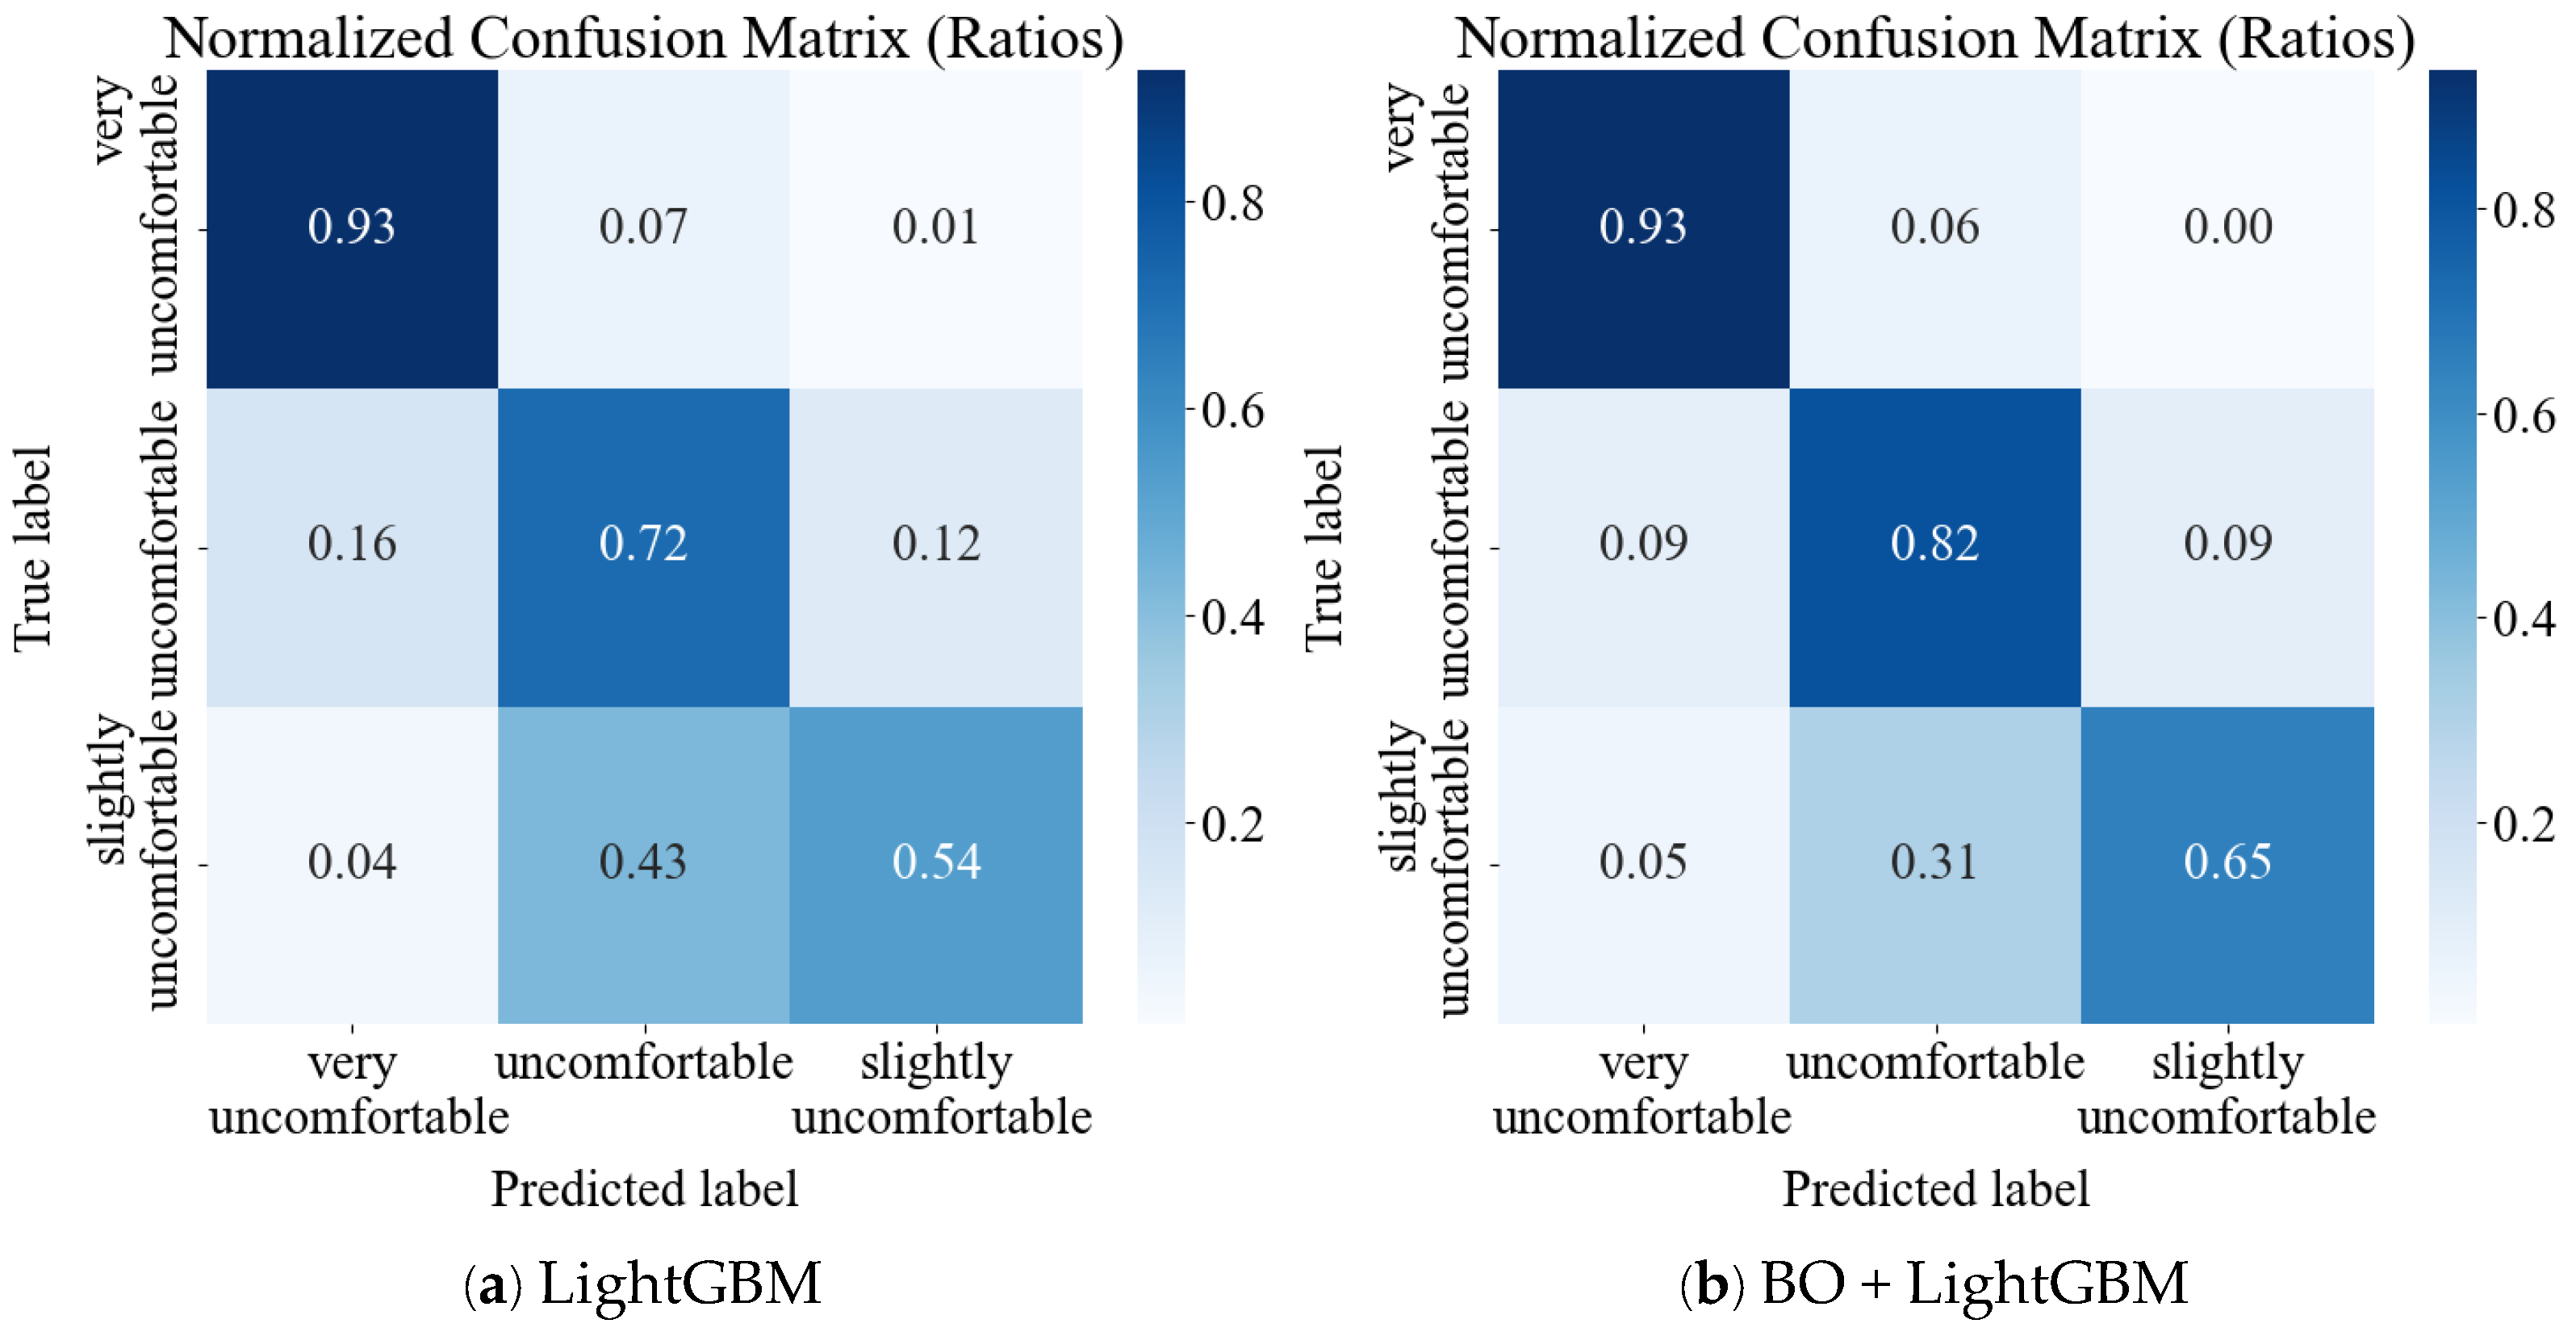
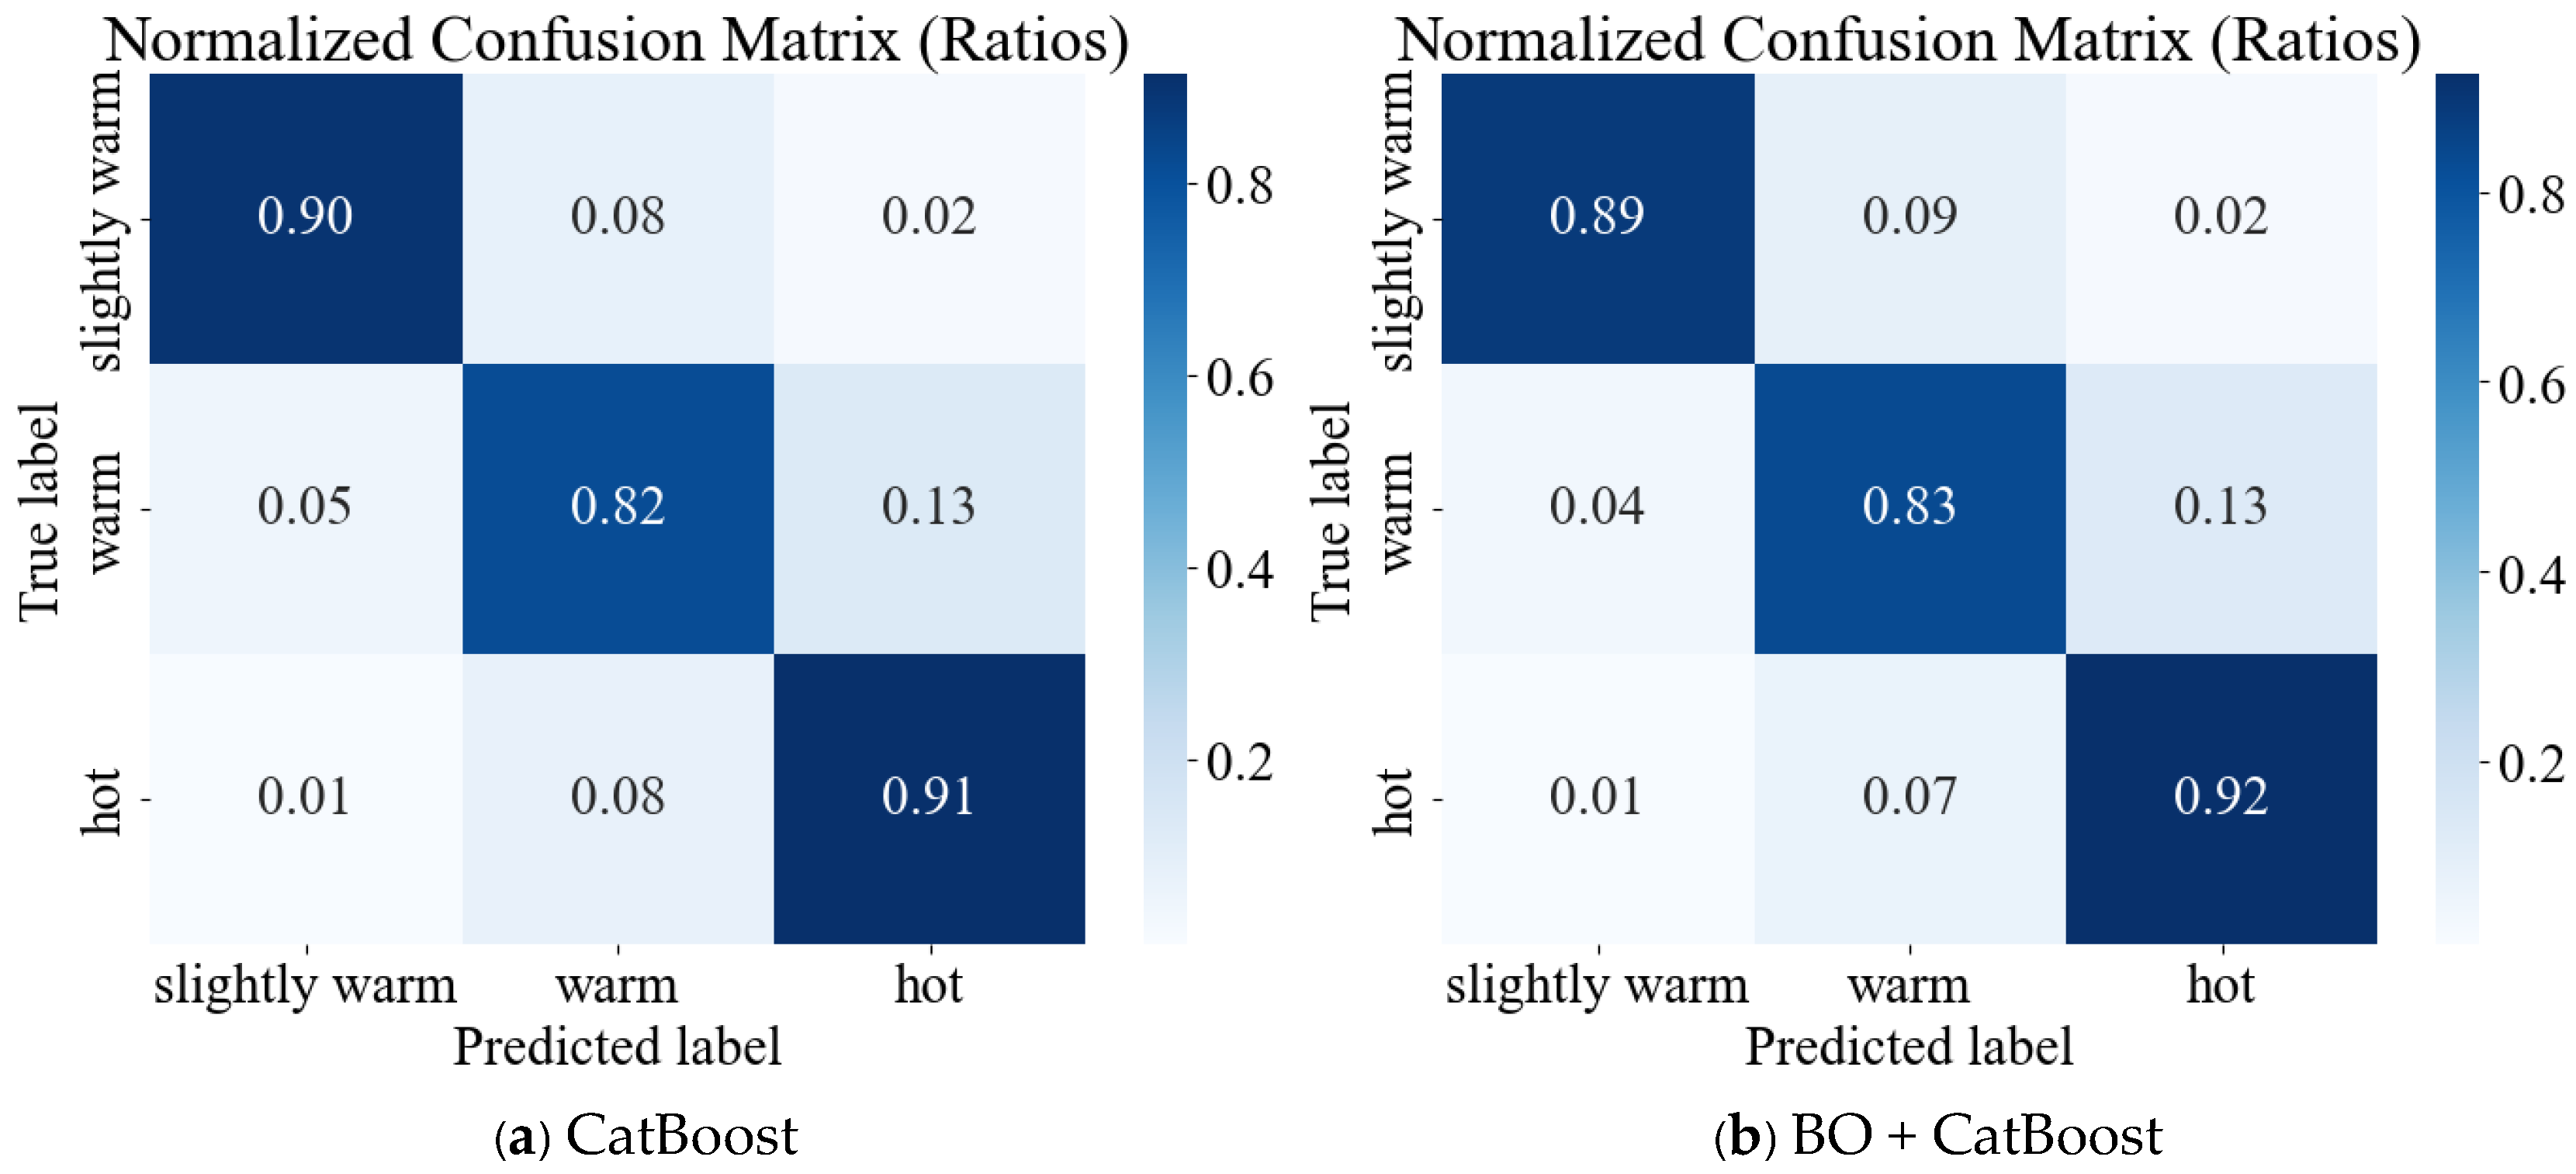
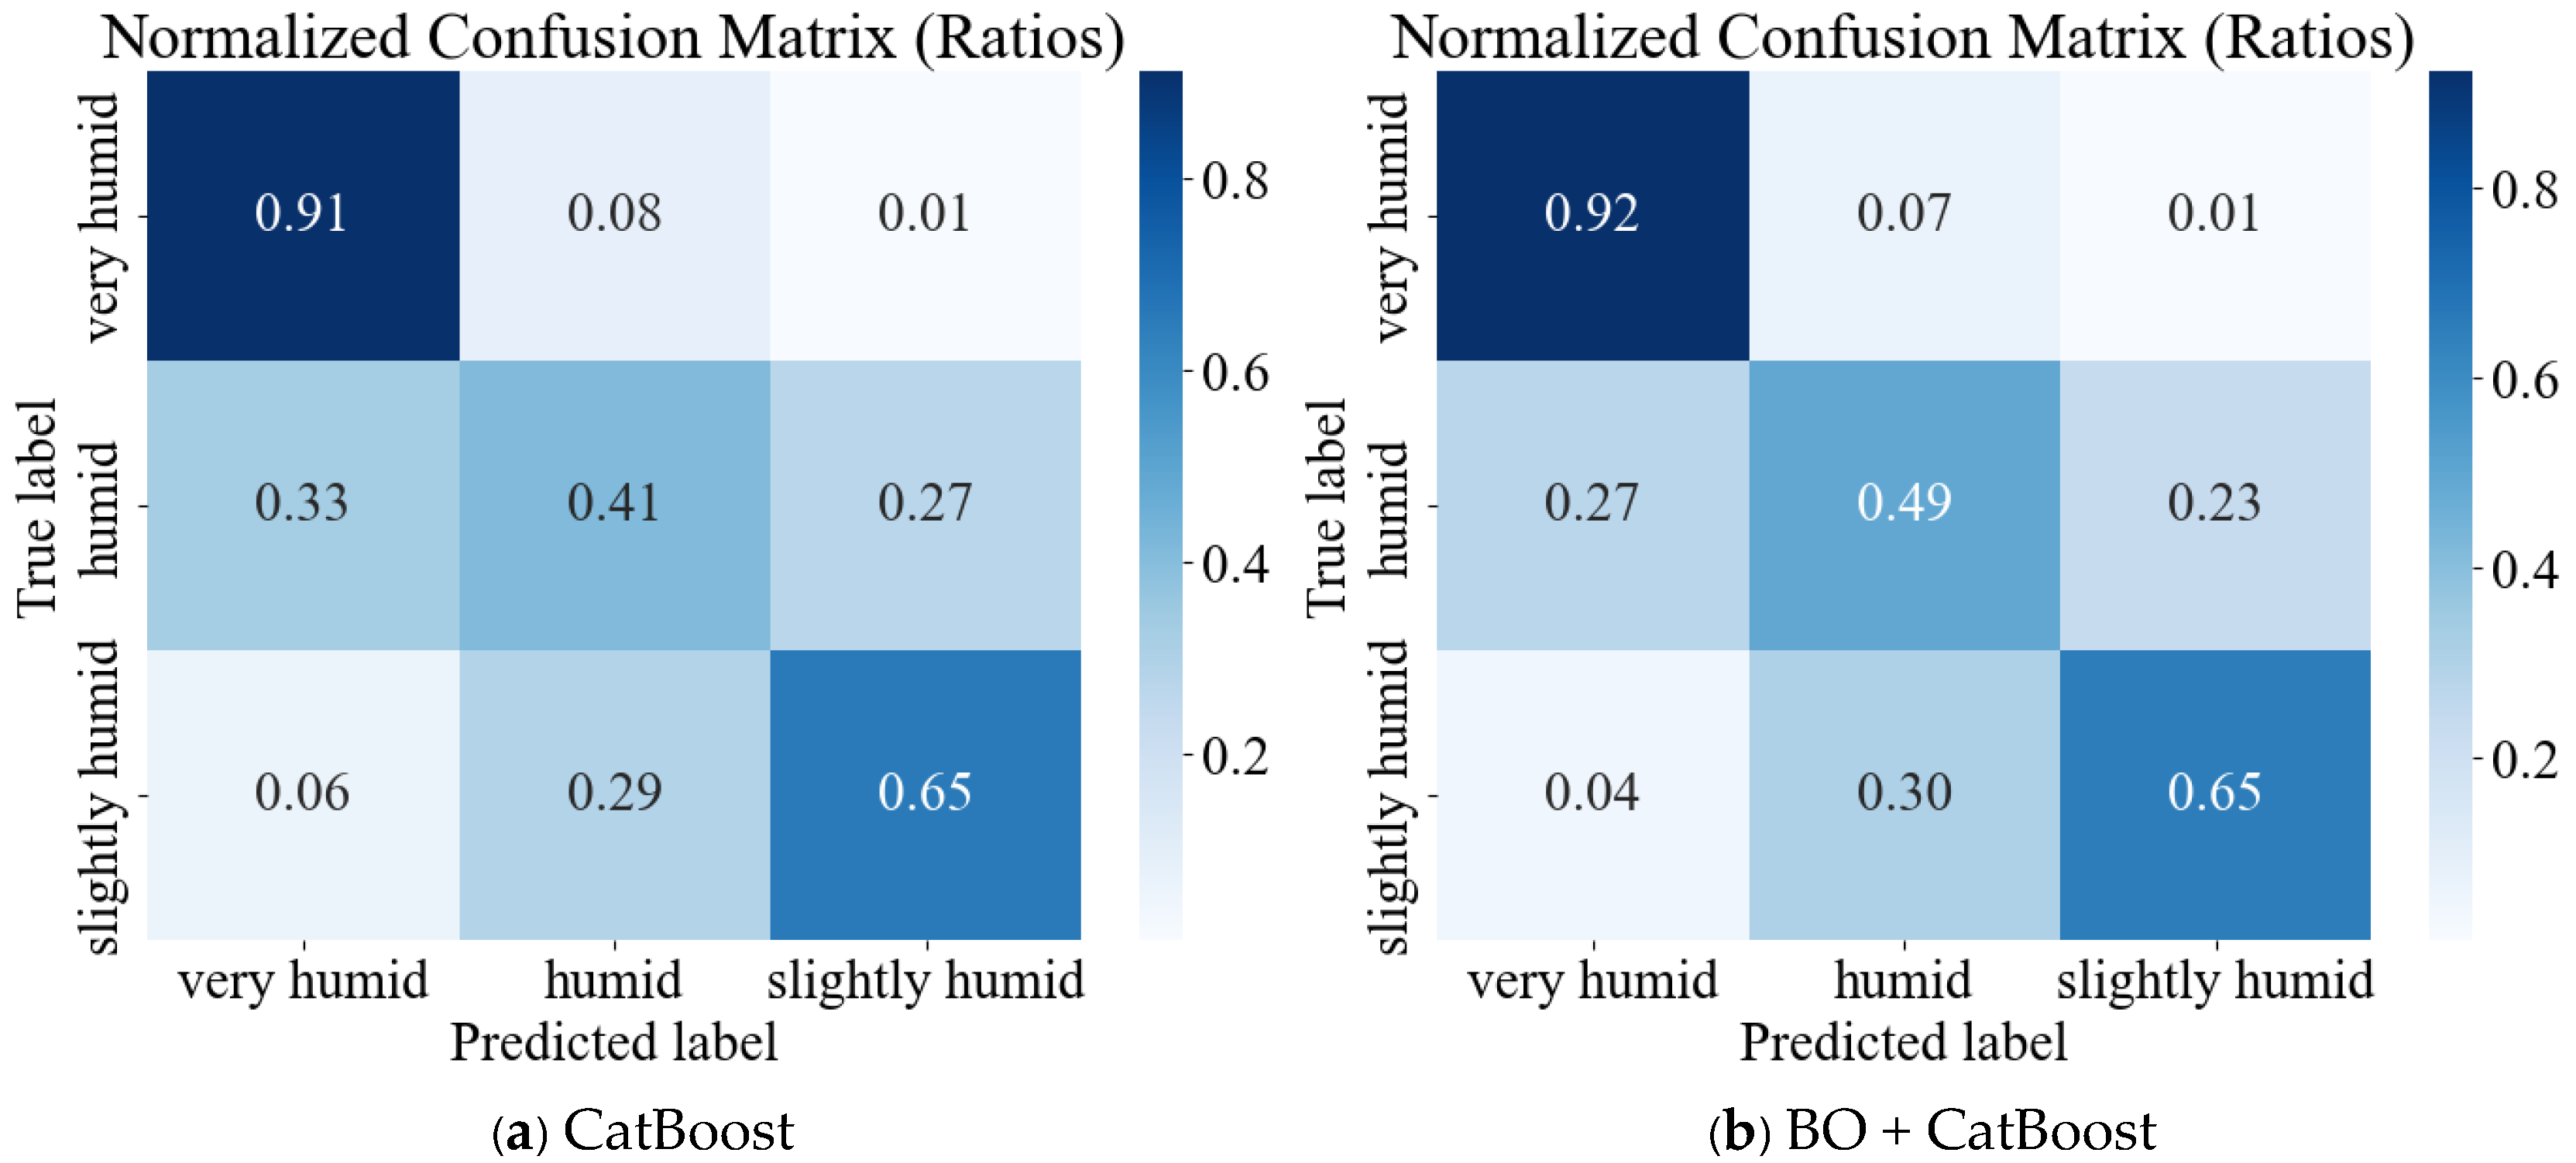
4.1. Comparison in TSV, TA, TCV, and HSV
4.2. Model BO Optimization
4.3. Comparison with Other Studies
4.3.1. Selection of Influencing Factors
4.3.2. Research Metrics and Ranking of Influencing Factors
4.4. Limitations and Future Research
- (1)
- Limitations of Data Collection: This study combines survey responses and physical measurements; however, the survey results may be influenced by participants’ subjective factors, potentially introducing bias. Future research could incorporate more objective measurement tools, such as thermal comfort sensors or physiological data (e.g., skin temperature and heart rate), to complement subjective data. Additionally, optimizing the survey design to reduce subjective bias would improve the reliability of the results.
- (2)
- Limitations of Time Span: The study’s time frame is relatively short, covering only July 2024, which may not fully capture the long-term effects of climate change on thermal comfort. Future research should extend the time span to include multiple seasons or years and consider factors such as air pollution and seasonal variations, providing a more comprehensive analysis of thermal comfort and a deeper understanding of the long-term effects of climate change.
- (3)
- Limitations of Model Selection: This study utilizes supervised learning models for analysis, but the performance of these models may be limited by the algorithms themselves and may vary across different scenarios. Future research could explore additional machine learning algorithms, such as deep learning or ensemble learning, and conduct cross-validation and repeated experiments to improve model stability and generalization. Moreover, incorporating more complex models or deep learning techniques could enhance prediction accuracy and interpretability [76,77,78].
- (4)
- Limitations of Data Coverage: This study primarily focuses on data from the Guangzhou tram stations. Future research should expand to include more cities and regions to enhance the generalizability and applicability of the findings. Cross-regional studies will provide a more comprehensive evaluation of thermal comfort across different urban climates.
- (5)
- Exploring Additional Influencing Factors: While this study considers various environmental and individual factors affecting outdoor thermal comfort, future research should explore other potential influences, such as cultural differences and individual health conditions. These factors could significantly affect perceptions of thermal comfort. A deeper investigation into these elements would contribute to refining thermal comfort assessment methods [79,80].
5. Conclusions
- (1)
- Among the ML models utilized in this study, LightGBM and CatBoost demonstrated particularly notable performance. LightGBM exhibited high predictive accuracy for TCV and TA, while CatBoost excelled in predicting TSV and HSV.
- (2)
- SHAP analysis revealed that the key factors influencing outdoor thermal comfort at tram stations primarily include RH, Ta, Tmrt, and Clo, alongside gender, age, BMI, and SOP20. Notably, the significance of physical parameters surpassed that of physiological and behavioral parameters.
- (3)
- In terms of predictive accuracy in machine learning models, the accuracy of binary classification models is significantly higher than that of multi-class classification models.
Author Contributions
Funding
Data Availability Statement
Conflicts of Interest
References
- Cardoso, V.E.; Ramos, N.M.; Almeida, R.M.; Barreira, E.; Martins, J.P.; Simões, M.L.; Sanhudo, L. A discussion about thermal comfort evaluation in a bus terminal. Energy Build. 2018, 168, 86–96. [Google Scholar] [CrossRef]
- Kotopouleas, A.; Nikolopoulou, M. Thermal comfort conditions in airport terminals: Indoor or transition spaces? Build. Environ. 2016, 99, 184–199. [Google Scholar] [CrossRef]
- Katavoutas, G.; Assimakopoulos, M.N.; Asimakopoulos, D.N. On the determination of the thermal comfort conditions of a metropolitan city underground railway. Sci. Total Environ. 2016, 566, 877–887. [Google Scholar] [CrossRef] [PubMed]
- Liu, G.; Cen, C.; Zhang, Q.; Liu, K.; Dang, R. Field study on thermal comfort of passenger at high-speed railway station in transition season. Build. Environ. 2016, 108, 220–229. [Google Scholar] [CrossRef]
- Han, J.; Kwon, S.-B.; Chun, C. Indoor environment and passengers’ comfort in subway stations in Seoul. Build. Environ. 2016, 104, 221–231. [Google Scholar] [CrossRef]
- Deb, C.; Ramachandraiah, A. Evaluation of thermal comfort in a rail terminal location in India. Build. Environ. 2010, 45, 2571–2580. [Google Scholar] [CrossRef]
- Shanghai Tram Engineering Technology Center. The length of tram operating lines in China steadily increased in 2022. Urban Rail Transit Res. 2023, 26, 246. [Google Scholar]
- Sadakorn, W.; Tetiranont, S.; Prasittisopin, L.; Kaewunruen, S. Assessing thermal comfort in hot and humid (tropical) climates: Urban outdoor and semi-outdoor conditions in waiting areas of railway stations. Build. Environ. 2025, 267, 112240. [Google Scholar] [CrossRef]
- Feng, T.; Peng, R. Outdoor thermal comfort and the cooling effect in different layouts of shaded spaces: A study of Guangzhou, China. Energy Build. 2025, 331, 115403. [Google Scholar] [CrossRef]
- Chen, W.-A.; Fang, P.-L.; Hwang, R.-L. Calibrating the UTCI scale for hot and humid climates through comprehensive year-round field surveys to improve the adaptability. Urban Clim. 2025, 59, 102267. [Google Scholar] [CrossRef]
- Jiang, J.; Li, Z.; Bedra, K.B.; Xie, L.; An, Y.; Zhong, Q. Assessing outdoor thermal comfort variations between residents and tourists in a hot-humid traditional village setting. Build. Environ. 2025, 269, 112398. [Google Scholar] [CrossRef]
- Guo, T.; Lin, Z.; Zhao, Y.; Fang, Z.; Fan, Y.; Zhang, X.; Yang, J.; Li, Y. Investigation and optimization of outdoor thermal comfort in elementary school campuses: Example from a humid-hot area in China. Build. Environ. 2024, 248, 111055. [Google Scholar] [CrossRef]
- Lam, C.K.C.; Cui, S.; Liu, J.; Kong, X.; Ou, C.; Hang, J. Influence of acclimatization and short-term thermal history on outdoor thermal comfort in subtropical South China. Energy Build. 2021, 231, 110541. [Google Scholar] [CrossRef]
- Villadiego, K.; Velay-Dabat, M.A. Outdoor thermal comfort in a hot and humid climate of Colombia: A field study in Barranquilla. Build. Environ. 2014, 75, 142–152. [Google Scholar] [CrossRef]
- Editorial Department of “Tunnel Construction (Chinese and English)”. Annual Data Statistics of Urban Rail Transit in China 2019. Tunn. Constr. 2020, 40, 762–767. [Google Scholar]
- Chun, C.; Kwok, A.; Tamura, A. Thermal comfort in transitional spaces—Basic concepts: Literature review and trial measurement. Build. Environ. 2004, 39, 1187–1192. [Google Scholar] [CrossRef]
- Hwang, R.-L.; Lin, T.-P. Thermal comfort requirements for occupants of semi-outdoor and outdoor environments in hot-humid regions. Archit. Sci. Rev. 2007, 50, 357–364. [Google Scholar] [CrossRef]
- Zhou, X.; Xu, L.; Zhang, J.; Niu, B.; Luo, M.; Zhou, G.; Zhang, X. Data-driven thermal comfort model via support vector machine algorithms: Insights from ASHRAE RP-884 database. Energy Build. 2020, 211, 109795. [Google Scholar] [CrossRef]
- Lin, T.P.; de Dear, R.; Hwang, R.L. Effect of thermal adaptation on seasonal outdoor thermal comfort. Int. J. Climatol. 2011, 31, 302–312. [Google Scholar] [CrossRef]
- Jeong, J.; Jeong, J.; Lee, M.; Lee, J.; Chang, S. Data-driven approach to develop prediction model for outdoor thermal comfort using optimized tree-type algorithms. Build. Environ. 2022, 226, 109663. [Google Scholar] [CrossRef]
- Xi, T.; Wang, M.; Cao, E.; Li, J.; Wang, Y.; Sa’ad, S.U. Preliminary Research on Outdoor Thermal Comfort Evaluation in Severe Cold Regions by Machine Learning. Buildings 2024, 14, 284. [Google Scholar] [CrossRef]
- Kuang, W. Seasonal Variation in Air Temperature and Relative Humidity on Building Areas and in Green Spaces in Beijing, China. Chin. Geogr. Sci. 2020, 30, 75–88. [Google Scholar] [CrossRef]
- Lam, C.K.C.; Gao, Y.; Yang, H.; Chen, T.; Zhang, Y.; Ou, C.; Hang, J. Interactive effect between long-term and short-term thermal history on outdoor thermal comfort: Comparison between Guangzhou, Zhuhai and Melbourne. Sci. Total Environ. 2021, 760, 144141. [Google Scholar] [CrossRef] [PubMed]
- Ji, Y.; Song, J.; Shen, P. A review of studies and modelling of solar radiation on human thermal comfort in outdoor environment. Build. Environ. 2022, 214, 108891. [Google Scholar] [CrossRef]
- Zafarmandi, S.; Matzarakis, A.; Norford, L. Effects of clothing’s thermal insulation on outdoor thermal comfort and thermal sensation: A case study in Tehran, Iran. Sustain. Cities Soc. 2024, 100, 104988. [Google Scholar] [CrossRef]
- Xu, T.; Yao, R.; Du, C.; Li, B. Outdoor thermal perception and heatwave adaptation effects in summer—A case study of a humid subtropical city in China. Urban Clim. 2023, 52, 101724. [Google Scholar] [CrossRef]
- Lai, D.; Lian, Z.; Liu, W.; Guo, C.; Liu, W.; Liu, K.; Chen, Q. A comprehensive review of thermal comfort studies in urban open spaces. Sci. Total Environ. 2020, 742, 140092. [Google Scholar] [CrossRef]
- Fanger, P.O. Thermal comfort. In Analysis and Applications in Environmental Engineering; Danish Technical Press: Copenhagen, Denmark, 1970. [Google Scholar]
- Cheung, T.; Schiavon, S.; Parkinson, T.; Li, P.; Brager, G. Analysis of the accuracy on PMV—PPD model using the ASHRAE Global Thermal Comfort Database II. Build. Environ. 2019, 153, 205–217. [Google Scholar] [CrossRef]
- Guo, R.; Yang, B.; Guo, Y.; Li, H.; Li, Z.; Zhou, B.; Hong, B.; Wang, F. Machine learning-based prediction of outdoor thermal comfort: Combining Bayesian optimization and the SHAP model. Build. Environ. 2024, 254, 111301. [Google Scholar] [CrossRef]
- Potchter, O.; Cohen, P.; Lin, T.-P.; Matzarakis, A. Outdoor human thermal perception in various climates: A comprehensive review of approaches, methods and quantification. Sci. Total Environ. 2018, 631–632, 390–406. [Google Scholar] [CrossRef]
- Staiger, H.; Laschewski, G.; Matzarakis, A. Selection of Appropriate Thermal Indices for Applications in Human Biometeorological Studies. Atmosphere 2019, 10, 18. [Google Scholar] [CrossRef]
- Blazejczyk, K.; Epstein, Y.; Jendritzky, G.; Staiger, H.; Tinz, B. Comparison of UTCI to selected thermal indices. Int. J. Biometeorol. 2012, 56, 515–535. [Google Scholar] [CrossRef] [PubMed]
- Fang, Z.; Feng, X.; Liu, J.; Lin, Z.; Mak, C.M.; Niu, J.; Tse, K.-T.; Xu, X. Investigation into the differences among several outdoor thermal comfort indices against field survey in subtropics. Sustain. Cities Soc. 2019, 44, 676–690. [Google Scholar] [CrossRef]
- Huang, B.; Hong, B.; Tian, Y.; Yuan, T.; Su, M. Outdoor thermal benchmarks and thermal safety for children: A study in China’s cold region. Sci. Total Environ. 2021, 787, 147603. [Google Scholar] [CrossRef]
- Jendritzky, G.; de Dear, R.; Havenith, G. UTCI—Why another thermal index? Int. J. Biometeorol. 2012, 56, 421–428. [Google Scholar] [CrossRef]
- Chan, S.Y.; Chau, C.K. Development of artificial neural network models for predicting thermal comfort evaluation in urban parks in summer and winter. Build. Environ. 2019, 164, 106364. [Google Scholar] [CrossRef]
- Feng, X.; Zheng, Z.; Yang, Y.; Fang, Z. Quantitative seasonal outdoor thermal sensitivity in Guangzhou, China. Urban Clim. 2021, 39, 100938. [Google Scholar] [CrossRef]
- Lee, S.; Bilionis, I.; Karava, P.; Tzempelikos, A. A Bayesian approach for probabilistic classification and inference of occupant thermal preferences in office buildings. Build. Environ 2017, 118, 323–343. [Google Scholar] [CrossRef]
- Wu, Y.; Liu, H.; Li, B.; Kosonen, R.; Wei, S.; Jokisalo, J.; Cheng, Y. Individual thermal comfort prediction using classification tree model based on physiological parameters and thermal history in winter. Build. Simul. 2021, 14, 1651–1665. [Google Scholar] [CrossRef]
- Zhang, J.; Zhang, F.; Gou, Z.; Liu, J. Assessment of macroclimate and microclimate effects on outdoor thermal comfort via artificial neural network models. Urban Clim. 2022, 42, 101134. [Google Scholar] [CrossRef]
- Vučković, D.; Jovic, S.; Bozovic, R.; Dżamić, V.; Kićović, D. Potential of neuro-fuzzy methodology for forecasting of outdoor thermal comfort index at urban open spaces. Urban Clim. 2019, 28, 100467. [Google Scholar] [CrossRef]
- Jiang, L.; Yao, R. Modelling personal thermal sensations using C-Support Vector Classification (C-SVC) algorithm. Build. Environ. 2016, 99, 98–106. [Google Scholar] [CrossRef]
- Farhan, A.A.; Pattipati, K.; Wang, B.; Luh, P. Predicting individual thermal comfort using machine learning algorithms. In Proceedings of the 2015 IEEE International Conference on Automation Science and Engineering (CASE), Gothenburg, Sweden, 24–28 August 2015; pp. 708–713. [Google Scholar]
- Kim, J.; Zhou, Y.; Schiavon, S.; Raftery, P.; Brager, G. Personal comfort models: Predicting individuals’ thermal preference using occupant heating and cooling behavior and machine learning. Build. Environ. 2018, 129, 96–106. [Google Scholar] [CrossRef]
- Zheng, G.; Zhang, Y.; Yue, X.; Li, K. Interpretable prediction of thermal sensation for elderly people based on data sampling, machine learning and SHapley Additive exPlanations (SHAP). Build. Environ. 2023, 242, 110602. [Google Scholar] [CrossRef]
- Yang, B.; Li, X.; Liu, Y.; Chen, L.; Guo, R.; Wang, F.; Yan, K. Comparison of models for predicting winter individual thermal comfort based on machine learning algorithms. Build. Environ. 2022, 215, 108970. [Google Scholar] [CrossRef]
- Molnar, C. Interpretable Machine Learning; Lulu: Morrisville, NC, USA, 2020. [Google Scholar]
- Chen, G.; Chen, Y.; Tan, X.; Zhao, L.; Cai, Y.; Li, L. Assessing the urban heat island effect of different local climate zones in Guangzhou, China. Build. Environ. 2023, 244, 110770. [Google Scholar] [CrossRef]
- ISO 7726:2002; Ergonomía de Los Ambientes Térmicos. Instrumentos de Medida de las Magnitudes Físicas. ISO: Geneva, Switzerland, 2002.
- ASHRAE 55-2020; Thermal Environmental Conditions for Human Occupancy. American Society of Heating, Refrigerating and Air Conditioning Engineers: Atlanta, GA, USA, 2020.
- An, N.; Yao, J.; Zhou, Y. Study on Outdoor Thermal Comfort in Summer on Campus in Shanghai: A Case Study of Tongji University. Build. Sci. 2022, 38, 250–260. [Google Scholar] [CrossRef]
- Zhou, L.; Pan, S.; Wang, J.; Vasilakos, A.V. Machine learning on big data: Opportunities and challenges. Neurocomputing 2017, 237, 350–361. [Google Scholar] [CrossRef]
- Yao, F.; Fang, H.; Han, J.; Zhang, Y. Study on the outdoor thermal comfort evaluation of the elderly in the Tibetan plateau. Sustain. Cities Soc. 2022, 77, 103582. [Google Scholar] [CrossRef]
- Nuttall, F.Q. Body mass index: Obesity, BMI, and health: A critical review. Nutr. Today 2015, 50, 117–128. [Google Scholar] [CrossRef]
- Chen, T.; Guestrin, C. Xgboost: A scalable tree boosting system. In Proceedings of the 22nd Acm Sigkdd International Conference on Knowledge Discovery and Data Mining, San Francisco, CA, USA, 13–17 August 2016; pp. 785–794. [Google Scholar]
- Ke, G.; Meng, Q.; Finley, T.; Wang, T.; Chen, W.; Ma, W.; Ye, Q.; Liu, T.-Y. Lightgbm: A highly efficient gradient boosting decision tree. Adv. Neural Inf. Process. Syst. 2017, 30, 3149–3157. [Google Scholar]
- Prokhorenkova, L.; Gusev, G.; Vorobev, A.; Dorogush, A.V.; Gulin, A. CatBoost: Unbiased boosting with categorical features. Adv. Neural Inf. Process. Syst. 2018, 31, 6639–6649. [Google Scholar] [CrossRef]
- Breiman, L. Random forests. Mach. Learn. 2001, 45, 5–32. [Google Scholar] [CrossRef]
- Lan, H.; Hou, H.; Gou, Z. A machine learning led investigation to understand individual difference and the human-environment interactive effect on classroom thermal comfort. Build. Environ. 2023, 236, 110259. [Google Scholar] [CrossRef]
- Lundberg, S.M.; Erion, G.G.; Lee, S.-I. Consistent individualized feature attribution for tree ensembles. arXiv 2018, arXiv:1802.03888. [Google Scholar]
- Hosenie, Z.; Lyon, R.J.; Stappers, B.W.; Mootoovaloo, A. Comparing Multiclass, Binary, and Hierarchical Machine Learning Classification schemes for variable stars. Mon. Not. R. Astron. Soc. 2019, 488, 4858–4872. [Google Scholar] [CrossRef]
- Watanabe, S.; Horikoshi, T.; Ishii, J.; Tomita, A. The measurement of the solar absorptance of the clothed human body—The case of Japanese, college-aged male subjects. Build. Environ. 2013, 59, 492–500. [Google Scholar] [CrossRef]
- Saito, M.; Ishii, A.; Oi, H. Prediction of clothing insulation in a outdoor environment, based on questionnaires. In Environmental Ergonomics; Elsevier Ergonomics Book Series; Elsevier: Amsterdam, The Netherlands, 2005; Volume 3, pp. 355–360. [Google Scholar]
- Li, J.; Sun, R.; Chen, L. Identifying sensitive population associated with summer extreme heat in Beijing. Sustain. Cities Soc. 2022, 83, 103925. [Google Scholar] [CrossRef]
- Zhen, M.; Dong, Q.; Chen, P.; Ding, W.; Zhou, D.; Feng, W. Urban outdoor thermal comfort in western China. J. Asian Archit. Build. Eng. 2020, 20, 222–236. [Google Scholar] [CrossRef]
- Salata, F.; Golasi, I.; Ciancio, V.; Rosso, F. Dressed for the season: Clothing and outdoor thermal comfort in the Mediterranean population. Build. Environ. 2018, 146, 50–63. [Google Scholar] [CrossRef]
- Amindeldar, S.; Heidari, S.; Khalili, M. The effect of personal and microclimatic variables on outdoor thermal comfort: A field study in Tehran in cold season. Sustain. Cities Soc. 2017, 32, 153–159. [Google Scholar] [CrossRef]
- De Dear, R.; Brager, G.S. Developing an Adaptive Model of Thermal Comfort and Preference. Ph.D. Thesis, University of California, Berkeley, CA, USA, 1998. [Google Scholar]
- Humphreys, M.A.; Nicol, J.F. The validity of ISO-PMV for predicting comfort votes in every-day thermal environments. Energy Build. 2002, 34, 667–684. [Google Scholar] [CrossRef]
- Zhang, H.; Arens, E.; Huizenga, C.; Han, T. Thermal sensation and comfort models for non-uniform and transient environments: Part I: Local sensation of individual body parts. Build. Environ. 2010, 45, 380–388. [Google Scholar] [CrossRef]
- ISO 7730:2005.; Ergonomics of the Thermal Environment–Analytical Determination and Interpretation of Thermal Comfort Using Calculation of the PMV and PPD Indices and Local Thermal Comfort Criteria. ISO: Geneva, Switzerland, 2005.
- Deng, Y.; Gan, D.; Tang, N.; Cai, Z.; Li, X.; Chen, S.; Li, X. Research on outdoor thermal comfort and activities in residential areas in subtropical China. Atmosphere 2022, 13, 1357. [Google Scholar] [CrossRef]
- Frazier, P.I. A tutorial on Bayesian optimization. arXiv 2018, arXiv:1807.02811. [Google Scholar]
- Snoek, J.; Larochelle, H.; Adams, R.P. Practical bayesian optimization of machine learning algorithms. Adv. Neural Inf. Process. Syst. 2012, 25. [Google Scholar]
- Dou, J.; Yunus, A.P.; Bui, D.T.; Merghadi, A.; Sahana, M.; Zhu, Z.; Chen, C.-W.; Han, Z.; Pham, B.T. Improved landslide assessment using support vector machine with bagging, boosting, and stacking ensemble machine learning framework in a mountainous watershed, Japan. Landslides 2020, 17, 641–658. [Google Scholar] [CrossRef]
- Mohammed, A.; Kora, R. A comprehensive review on ensemble deep learning: Opportunities and challenges. J. King Saud Univ. Comput. Inf. Sci. 2023, 35, 757–774. [Google Scholar] [CrossRef]
- Ganaie, M.A.; Hu, M.; Malik, A.K.; Tanveer, M.; Suganthan, P.N. Ensemble deep learning: A review. Eng. Appl. Artif. Intell. 2022, 115, 105151. [Google Scholar] [CrossRef]
- Kenawy, I.; Elkadi, H. Effects of cultural diversity and climatic background on outdoor thermal perception in Melbourne city, Australia. Build. Environ. 2021, 195, 107746. [Google Scholar] [CrossRef]
- Aljawabra, F.; Nikolopoulou, M. Influence of hot arid climate on the use of outdoor urban spaces and thermal comfort: Do cultural and social backgrounds matter? Intell. Build. Int. 2010, 2, 198–217. [Google Scholar] [CrossRef]


| Literature | Predictive Index | Data Source | Influencing Factors (Input Features) | Algorithms and Results |
|---|---|---|---|---|
| 2015 [44] | TSV | HVAC artificial climate chamber | Clo, air turbulence, Ti, age, Ta, MET, Tmrt | SVM (76.7%) |
| 2016 [44] | TSV | HVAC artificial climate chamber, Chongqing | Ta, Tmrt, V, RH, MET, Clo | C-SVC (89%) |
| 2017 [45] | TP | office, Northern California | Device usage, Ti, Ta, HVAC system data, Clo | CT, GPC, GBM, SVM, regLR, RF (Median AUC = 0.71) |
| 2019 [37] | TCV | Park, Hong Kong, China | age, education level, income level, occupation, gender, health status, thermal sensitivity, Ta, Tg, V, RH, Sr, thermal sensation, humidity sensation, purpose of visit, Clo, perceived number of water space in the park, metabolic rate, perceived density of trees in the park | ANN (Summer average R value 0.821) |
| 2022 [20] | PET | Construction Site, Korea | Ta, RH, V, Tmrt, PET, Sr, season | DT, RF, XGB, AdaBoost, Bayesian Ridge (Different models perform differently on different datasets; DT consistently lowest, all greater than or equal to 80%) |
| 2024 [21] | TCV | Shenyang University Outdoor Space, China | length of stay, distance between hometown and residence, Clo, age, height, weight, RH, V, Ta, Tg | extreme gradient lifting (93.13%) gradient lifting RF neural network |
| 2024 [30] | TCV, TSV, TA | Xi’an Park around City, China | length of stay of park, emotion, Clo, age, BMI, RH, V, Ta, Tmrt, SVF | KNN, MLR, OPM, DT, RF, SVM, XGB, LightGBM, CatBoost (65.49%) |
| Measurement Point Name | Platform Type | Platform Image |
|---|---|---|
| Xiankeng | ground-level side platforms | 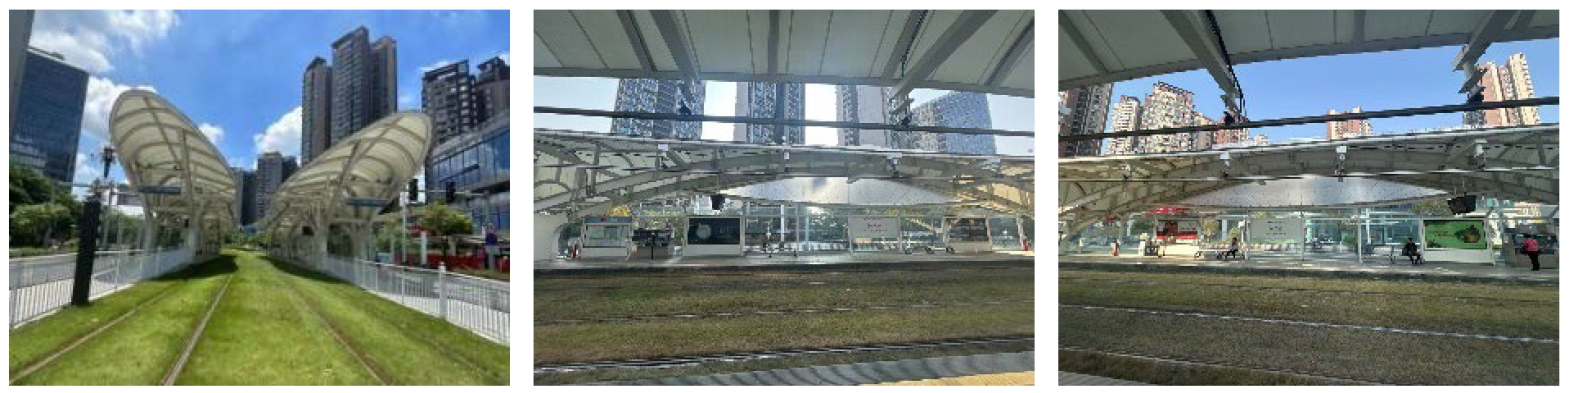 |
| Civic Square | ground-level separated platforms | 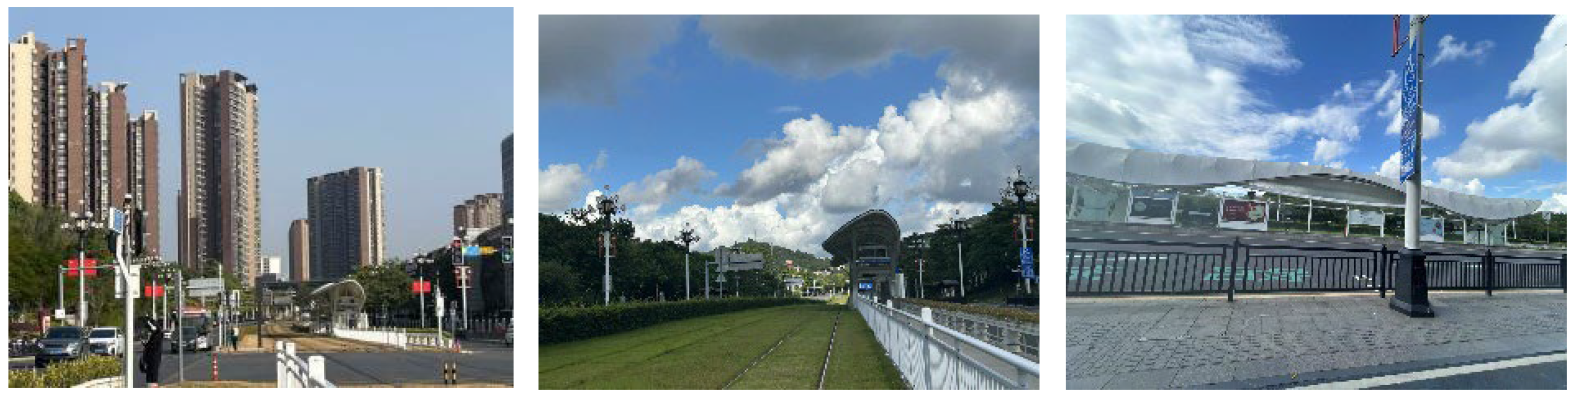 |
| Convention Center | ground-level separated platforms | 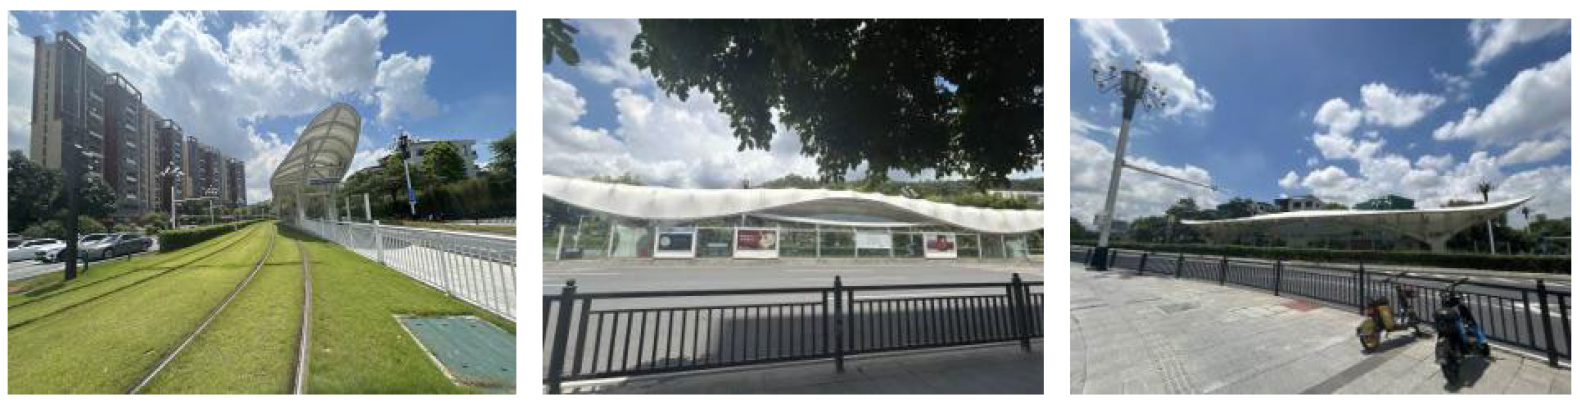 |
| Juntai Road | ground-level side platforms |  |
| Lingtou | ground-level side platforms |  |
| Xinfeng Road | ground-level side platforms | 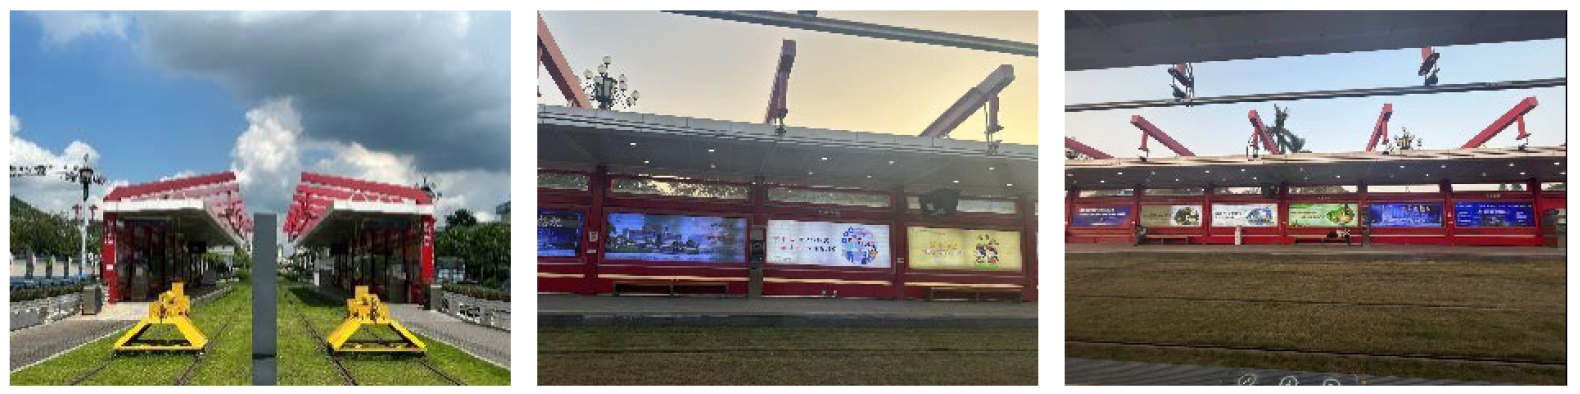 |
| Time Interval | Temperature | Globe Temperature | Humidity |
|---|---|---|---|
| 30 min | 0.8 °C | 0.9 °C | 8% |
| 15 min | 0.6 °C | 0.5 °C | 4% |
| 5 min | 0.3 °C | 0.2 °C | 2% |
| 3 min | 0.2 °C | 0.2 °C | 2% |
| Parameters | Instruments | Accuracy |
|---|---|---|
| Black globe temperature | TR-102 black globe temperature meter (Extech Instruments, Inc., Hudson, NH, USA) | ±0.2 °C |
| Air temperature Relative humidity | TR-72Ui temperature and humidity meter (Extech Instruments, Inc.) | ±0.3 °C ±5% |
| Air velocity | HD 2303.0 omni-directional anemometer (Extech Instruments, Inc.) | ±0.02 m/s (0–0.99 m/s) ±0.1 m/s (1–5 m/s) |
| Variable | Min | Max | Mean | Std |
|---|---|---|---|---|
| Ta (°C) | 29.20 | 38.79 | 34.13 | 2.65 |
| Tmrt (°C) | 28.45 | 39.05 | 33.90 | 2.87 |
| RH (%) | 42.50 | 69.05 | 57.52 | 7.03 |
| V (m/s) | 0.02 | 1.90 | 0.72 | 0.47 |
| Gender | Number | Age (Years) | Height (cm) | Weight (kg) |
|---|---|---|---|---|
| Male | 354 | 41.5 ± 27.50 | 165 ± 9.5 | 65 ± 12.9 |
| Female | 432 | 39.5 ± 23.50 | 158 ± 8.5 | 58 ± 9.3 |
| Scale Points | Reference Standard | ||
|---|---|---|---|
| TSV | 7 points | −3: very cold; −2: cold; −1: cool; 0: neutral; 1: warm; 2: hot; 3: very hot | ASHRAE 55-2020 |
| TA | 5 points | −2: very unacceptable; −1: unacceptable; 0: neutral; 1: acceptable; 2: very acceptable | |
| TCV | 7 points | −3: very uncomfortable; −2: uncomfortable; −1: slightly uncomfortable; 0: neutral; 1: slightly comfortable; 2: comfortable; 3: very comfortable | |
| HSV | 7 points | −3: very dry; −2: dry; −1: slightly dry; 0: neutral; 1: slightly humid; 2: humid; 3: very humid | ASHRAE standard 55-2020 in conjunction with [52] |
| Model | Key Advantage | Applicable Scenarios |
|---|---|---|
| XGB | Efficiency (optimized algorithms, parallel processing) and high accuracy (gradient boosting, regularization) | Complex predictive tasks requiring high precision and flexibility |
| LightGBM | Speed (histogram-based algorithm) and memory efficiency (reduces computation time and memory usage) | Large-scale data scenarios, memory-constrained environments |
| RF | Resistance to overfitting (through Bagging and random feature selection) and robustness (handles noise and missing data) | Suitable for various types of data, especially noisy or missing data |
| CatBoost | Handling categorical features and training speed (ordered target encoding, symmetric tree structure) | Complex data processing, especially for data with categorical features |
| KNN | Simplicity and intuitiveness, easy to understand and implement | Small datasets and beginner-level tasks, problems with well-distributed feature spaces |
| Types of ML | Hyperparameter Types |
|---|---|
| XGB | learning Rate; max_depth;n_estimators; booster; min_child_weight; subsample; colsample_bytree; colsample_bylevel; reg_lambda; reg_alpha; gamma |
| LightGBM | n_estimators; learning_rate; max_depth; min_samples_split; min_samples_leaf; max_features; subsample |
| CatBoost | Iterations; depth; learning_rate; l2_leaf_reg; border_count |
| RF | max_depth; min_samples_leaf; min_samples_split; n_estimators; bootstrap; oob_score; class_weight; max_samples; max features |
| KNN | n_neighbors; weights; p; algorithm; leaf_size; metric |
| Algorithm | Macro-P | Macro-R | Macro-F1 | Macro-P | Macro-R | Macro-F1 |
|---|---|---|---|---|---|---|
| Default | Model + BO | |||||
| XGB | 80.66 | 80.84 | 80.37 | 83.37 | 83.84 | 83.27 |
| LightGBM | 78.95 | 79.67 | 78.78 | 85.22 | 85.45 | 84.90 |
| CatBoost | 83.06 | 83.56 | 82.97 | 84.83 | 85.07 | 84.55 |
| RF | 78.99 | 79.74 | 78.87 | 79.41 | 80.12 | 79.28 |
| KNN | 69.50 | 69.99 | 67.85 | 73.56 | 74.13 | 72.63 |
| Algorithm | Macro-P | Macro-R | Macro-F1 | Macro-P | Macro-R | Macro-F1 |
|---|---|---|---|---|---|---|
| Default | Model + BO | |||||
| XGB | 87.83 | 80.65 | 83.35 | 88.65 | 81.19 | 82.99 |
| LightGBM | 88.00 | 76.68 | 80.22 | 88.56 | 81.35 | 83.31 |
| CatBoost | 87.78 | 80.76 | 83.33 | 88.69 | 81.61 | 83.93 |
| RF | 86.39 | 79.38 | 81.53 | 87.75 | 80.70 | 82.88 |
| KNN | 73.24 | 67.74 | 73.57 | 77.97 | 72.07 | 75.42 |
| Algorithm | Macro-P | Macro-R | Macro-F1 | Macro-P | Macro-R | Macro-F1 |
|---|---|---|---|---|---|---|
| Default | Model + BO | |||||
| XGB | 92.67 | 93.25 | 92.83 | 93.18 | 93.67 | 92.95 |
| LightGBM | 91.74 | 92.30 | 91.92 | 94.22 | 94.26 | 94.20 |
| CatBoost | 92.26 | 93.02 | 92.42 | 93.66 | 94.15 | 93.80 |
| RF | 89.58 | 90.98 | 89.91 | 92.82 | 98.96 | 92.88 |
| KNN | 89.32 | 90.89 | 89.03 | 91.78 | 92.46 | 91.61 |
| Algorithm | Macro-P | Macro-R | Macro-F1 | Macro-P | Macro-R | Macro-F1 |
|---|---|---|---|---|---|---|
| Default | Model + BO | |||||
| XGB | 70.77 | 72.59 | 71.49 | 74.48 | 76.66 | 75.39 |
| LightGBM | 72.11 | 74.63 | 73.11 | 76.27 | 77.62 | 76.69 |
| CatBoost | 73.38 | 75.34 | 74.06 | 76.63 | 78.31 | 77.24 |
| RF | 69.92 | 73.84 | 71.23 | 70.17 | 73.87 | 71.25 |
| KNN | 59.94 | 68.11 | 62.46 | 63.50 | 70.99 | 65.81 |
Disclaimer/Publisher’s Note: The statements, opinions and data contained in all publications are solely those of the individual author(s) and contributor(s) and not of MDPI and/or the editor(s). MDPI and/or the editor(s) disclaim responsibility for any injury to people or property resulting from any ideas, methods, instructions or products referred to in the content. |
© 2025 by the authors. Licensee MDPI, Basel, Switzerland. This article is an open access article distributed under the terms and conditions of the Creative Commons Attribution (CC BY) license (https://creativecommons.org/licenses/by/4.0/).
Share and Cite
Chen, X.; Zhao, H.; Wang, B.; Xia, B. Study of Factors Influencing Thermal Comfort at Tram Stations in Guangzhou Based on Machine Learning. Buildings 2025, 15, 865. https://doi.org/10.3390/buildings15060865
Chen X, Zhao H, Wang B, Xia B. Study of Factors Influencing Thermal Comfort at Tram Stations in Guangzhou Based on Machine Learning. Buildings. 2025; 15(6):865. https://doi.org/10.3390/buildings15060865
Chicago/Turabian StyleChen, Xin, Huanchen Zhao, Beini Wang, and Bo Xia. 2025. "Study of Factors Influencing Thermal Comfort at Tram Stations in Guangzhou Based on Machine Learning" Buildings 15, no. 6: 865. https://doi.org/10.3390/buildings15060865
APA StyleChen, X., Zhao, H., Wang, B., & Xia, B. (2025). Study of Factors Influencing Thermal Comfort at Tram Stations in Guangzhou Based on Machine Learning. Buildings, 15(6), 865. https://doi.org/10.3390/buildings15060865