
Demand Response Strategy Optimization Method Based on Differentiated Comprehensive Benefit Model of Air-Conditioning Customers


Abstract
1. Introduction
- (1)
- The existing air-conditioning user demand elasticity model is mostly based on simple regression analysis, ignoring the complex mechanism of economic benefits and thermal comfort on the user’s willingness to participate in the demand response, so it is difficult to accurately quantify the benefit needs of DR control strategies for different air-conditioning users.
- (2)
- Existing demand response regulation methods ignore the differentiated economic benefits and thermal comfort needs of different users, failing to establish a unified multi-objective coordination mechanism. This results in suboptimal outcomes that do not align with user’s dual requirements for economic benefits and thermal comfort, ultimately diminishing user engagement in demand response initiatives.
- (1)
- A comprehensive benefit quantification model for air-conditioning users that takes into account the DR economic benefits and thermal comfort is established, which aims to accurately quantify the benefit of DR control strategies for different types of air-conditioning users.
- (2)
- An optimization method for DR regulation strategies is proposed, with the objective of best comprehensive benefits for air conditioning users, which aims to meet the differentiated benefit needs of different users.
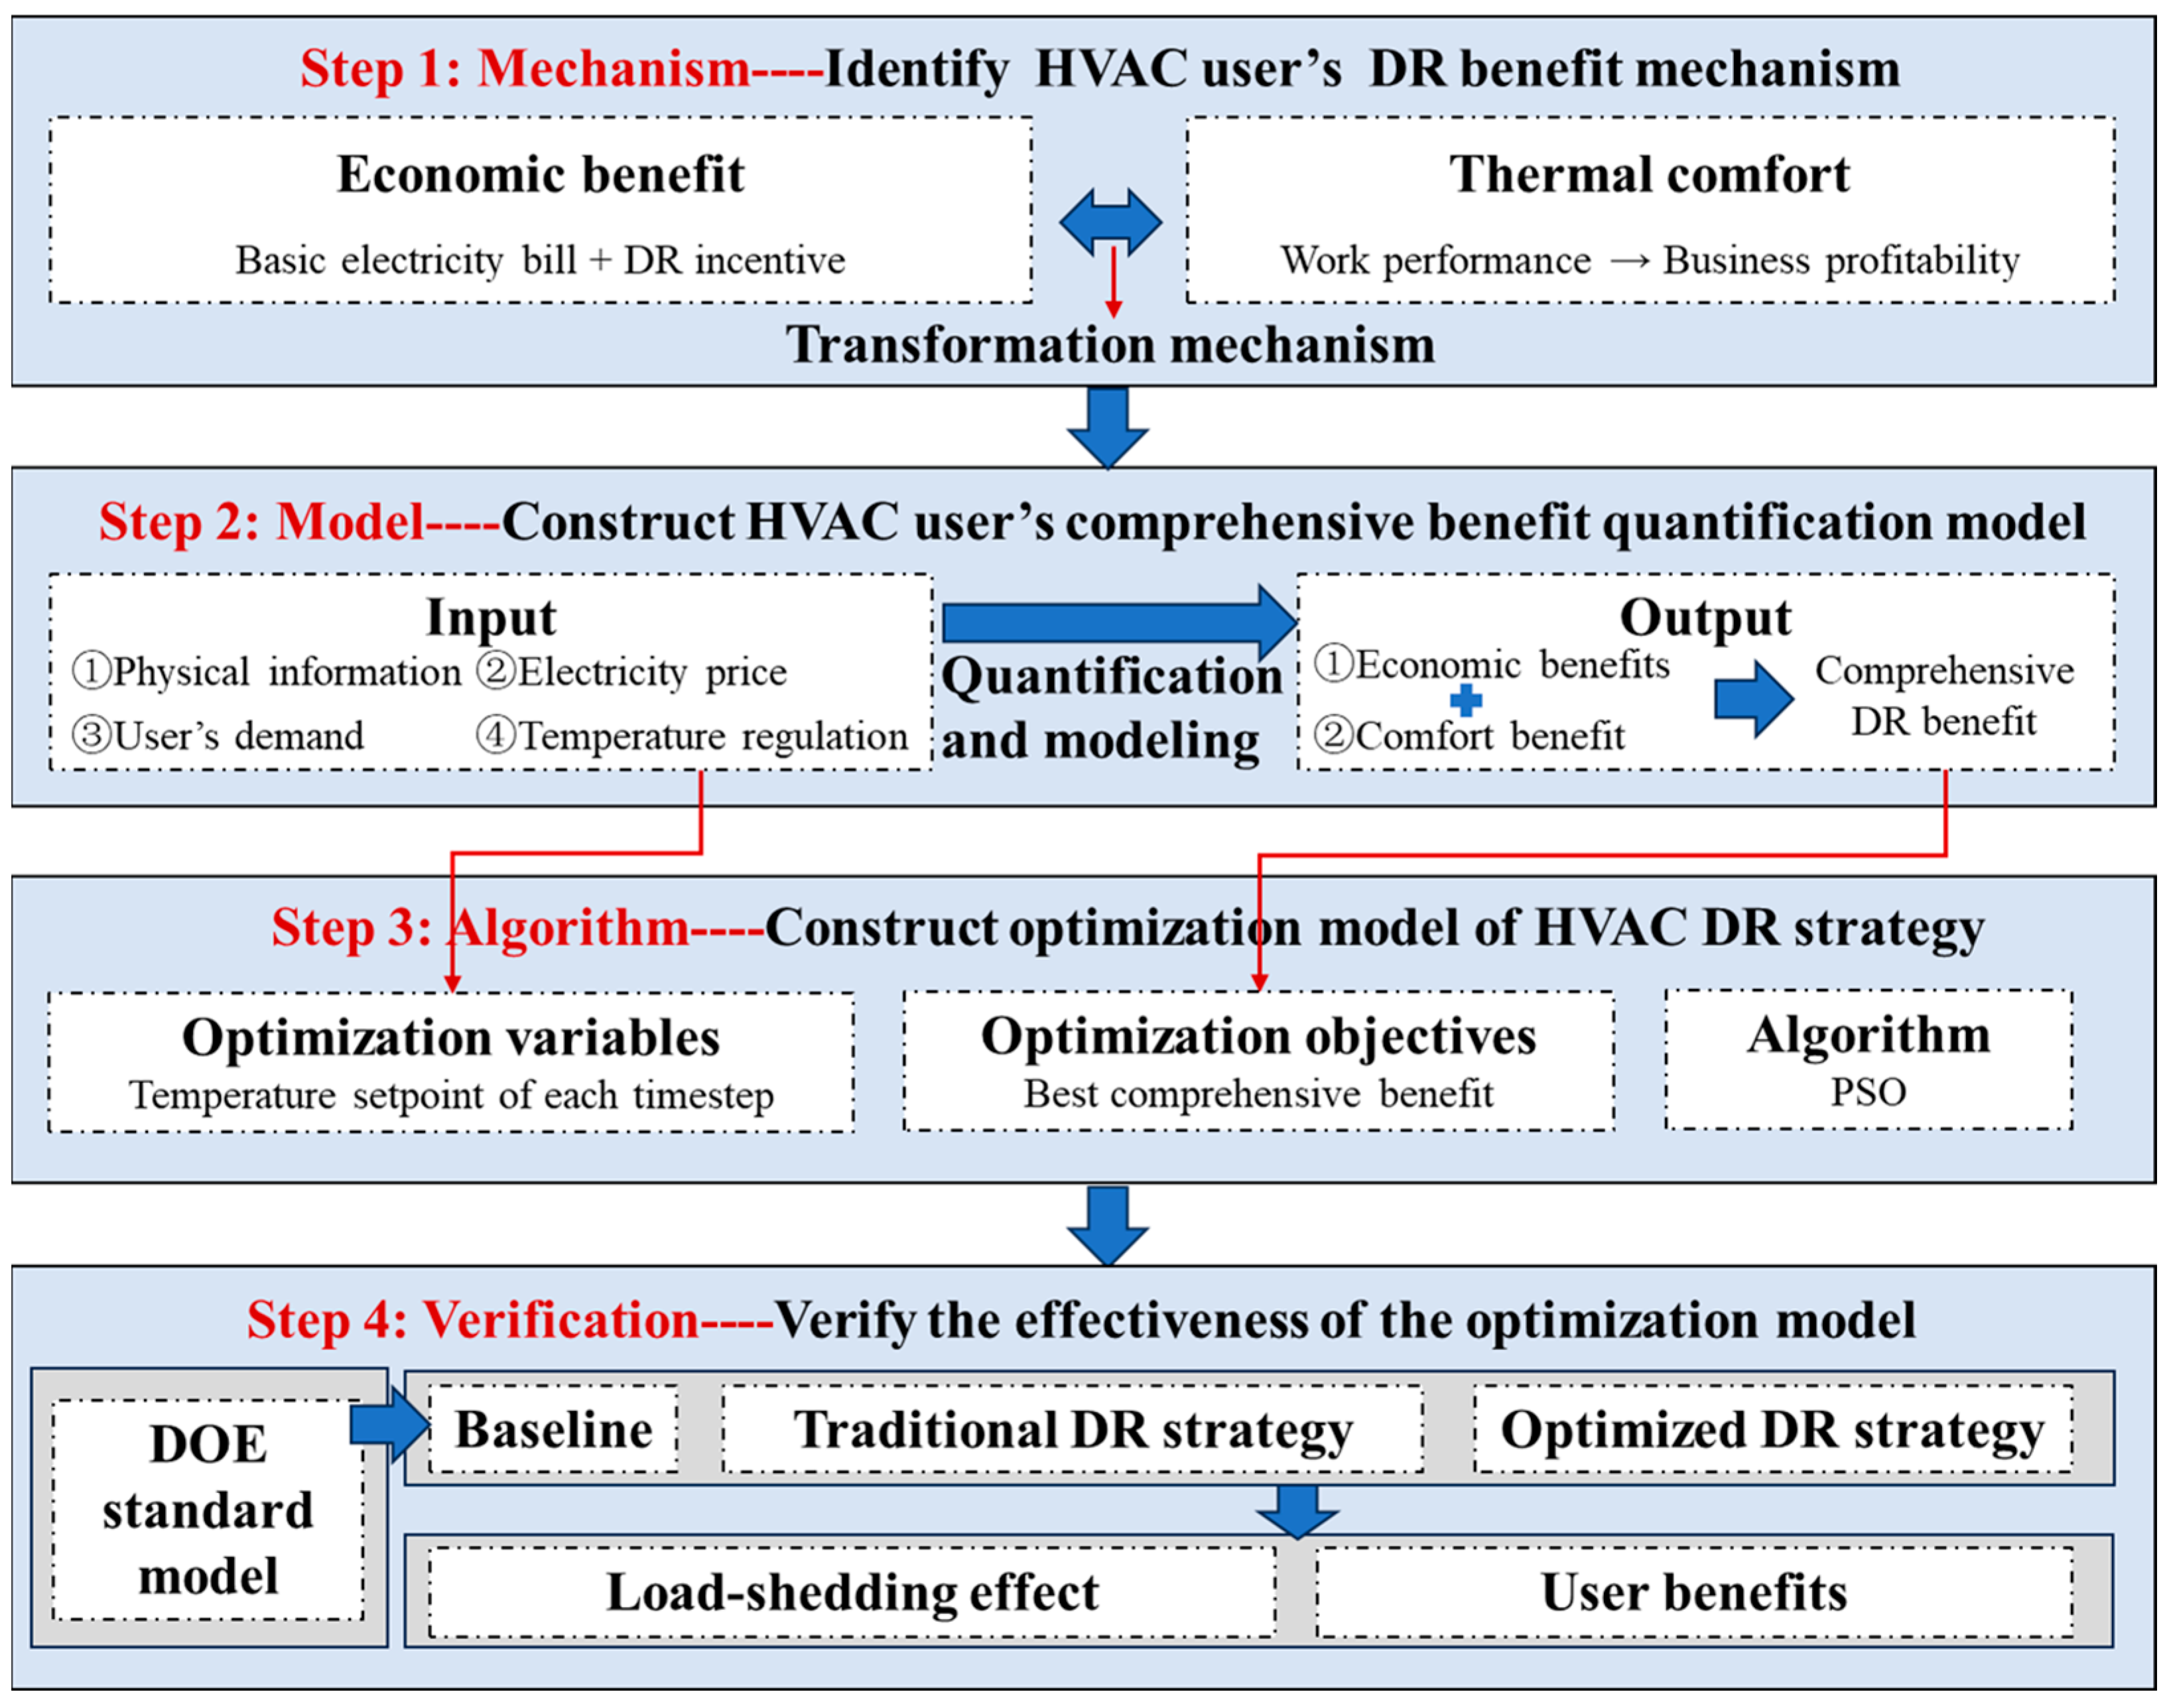
2. Methods
2.1. HVAC Customer’s DR Benefit Mechanism
2.2. Comprehensive Benefit Quantification Model of Air-Conditioning Customers
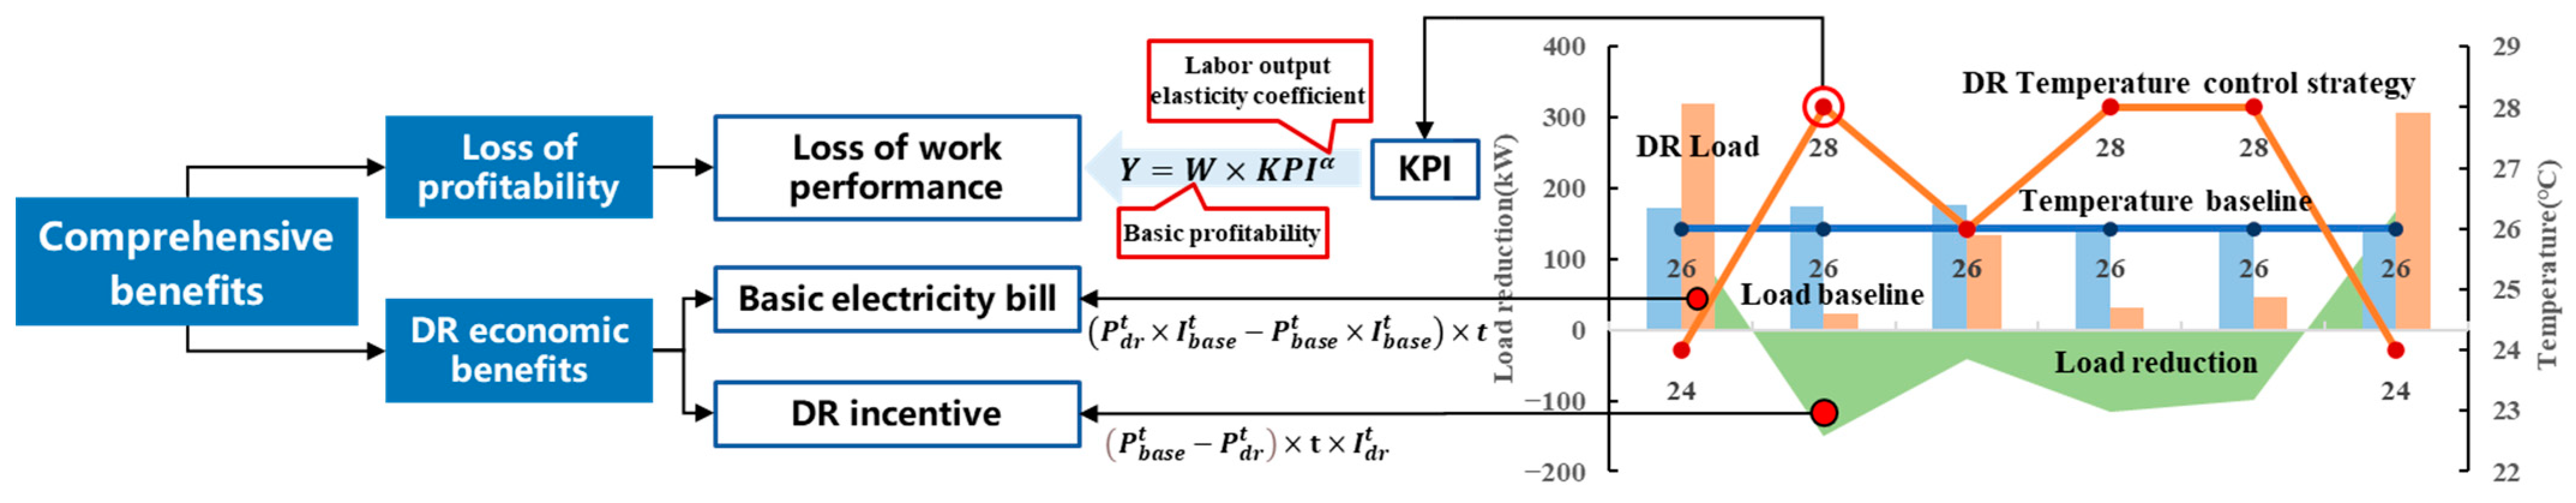
- (1)
- Comprehensive benefit composition and calculation modelAccording to the demand of office building DR customers, the comprehensive benefit calculation model of air conditioner users can be established. The total benefit is the sum of the comprehensive benefits in the pre-cooling period, response period, and recovery period.where is the total comprehensive benefit of DR customer at all time steps. and are the comprehensive benefits of the pre-cooling and recovery period. is the comprehensive benefit of a certain time step in the response period. The user’s benefit is measured in the unit of the electricity price, which is taken in CNY. The time scale of summer peak-shaving demand response events is generally 2 h. Every 15 min in the control system is a regulation time step, and the comprehensive benefit is calculated in each time step. The n-pc, n-DR, and n-rc are the number of time steps in the pre-cooling, response, and recovery periods, which can be set reasonably according to the actual regulation demand and scheduling arrangement of the power grid and the aggregator.The comprehensive benefit of each time step comprises two elements. The calculation formula is as follows:where represent the comprehensive benefit of customers at a certain time step in the response, pre-cooling, and recovery period, respectively. represent the economic benefit caused by air conditioning load fluctuation in a certain time step of the response time, pre-cooling, and recovery period. represent the loss of profitability of customers at a certain time step in the response period, pre-cooling period, and recovery period, which is caused by the change in work performance due to the loss of thermal comfort. All values are in CNY.
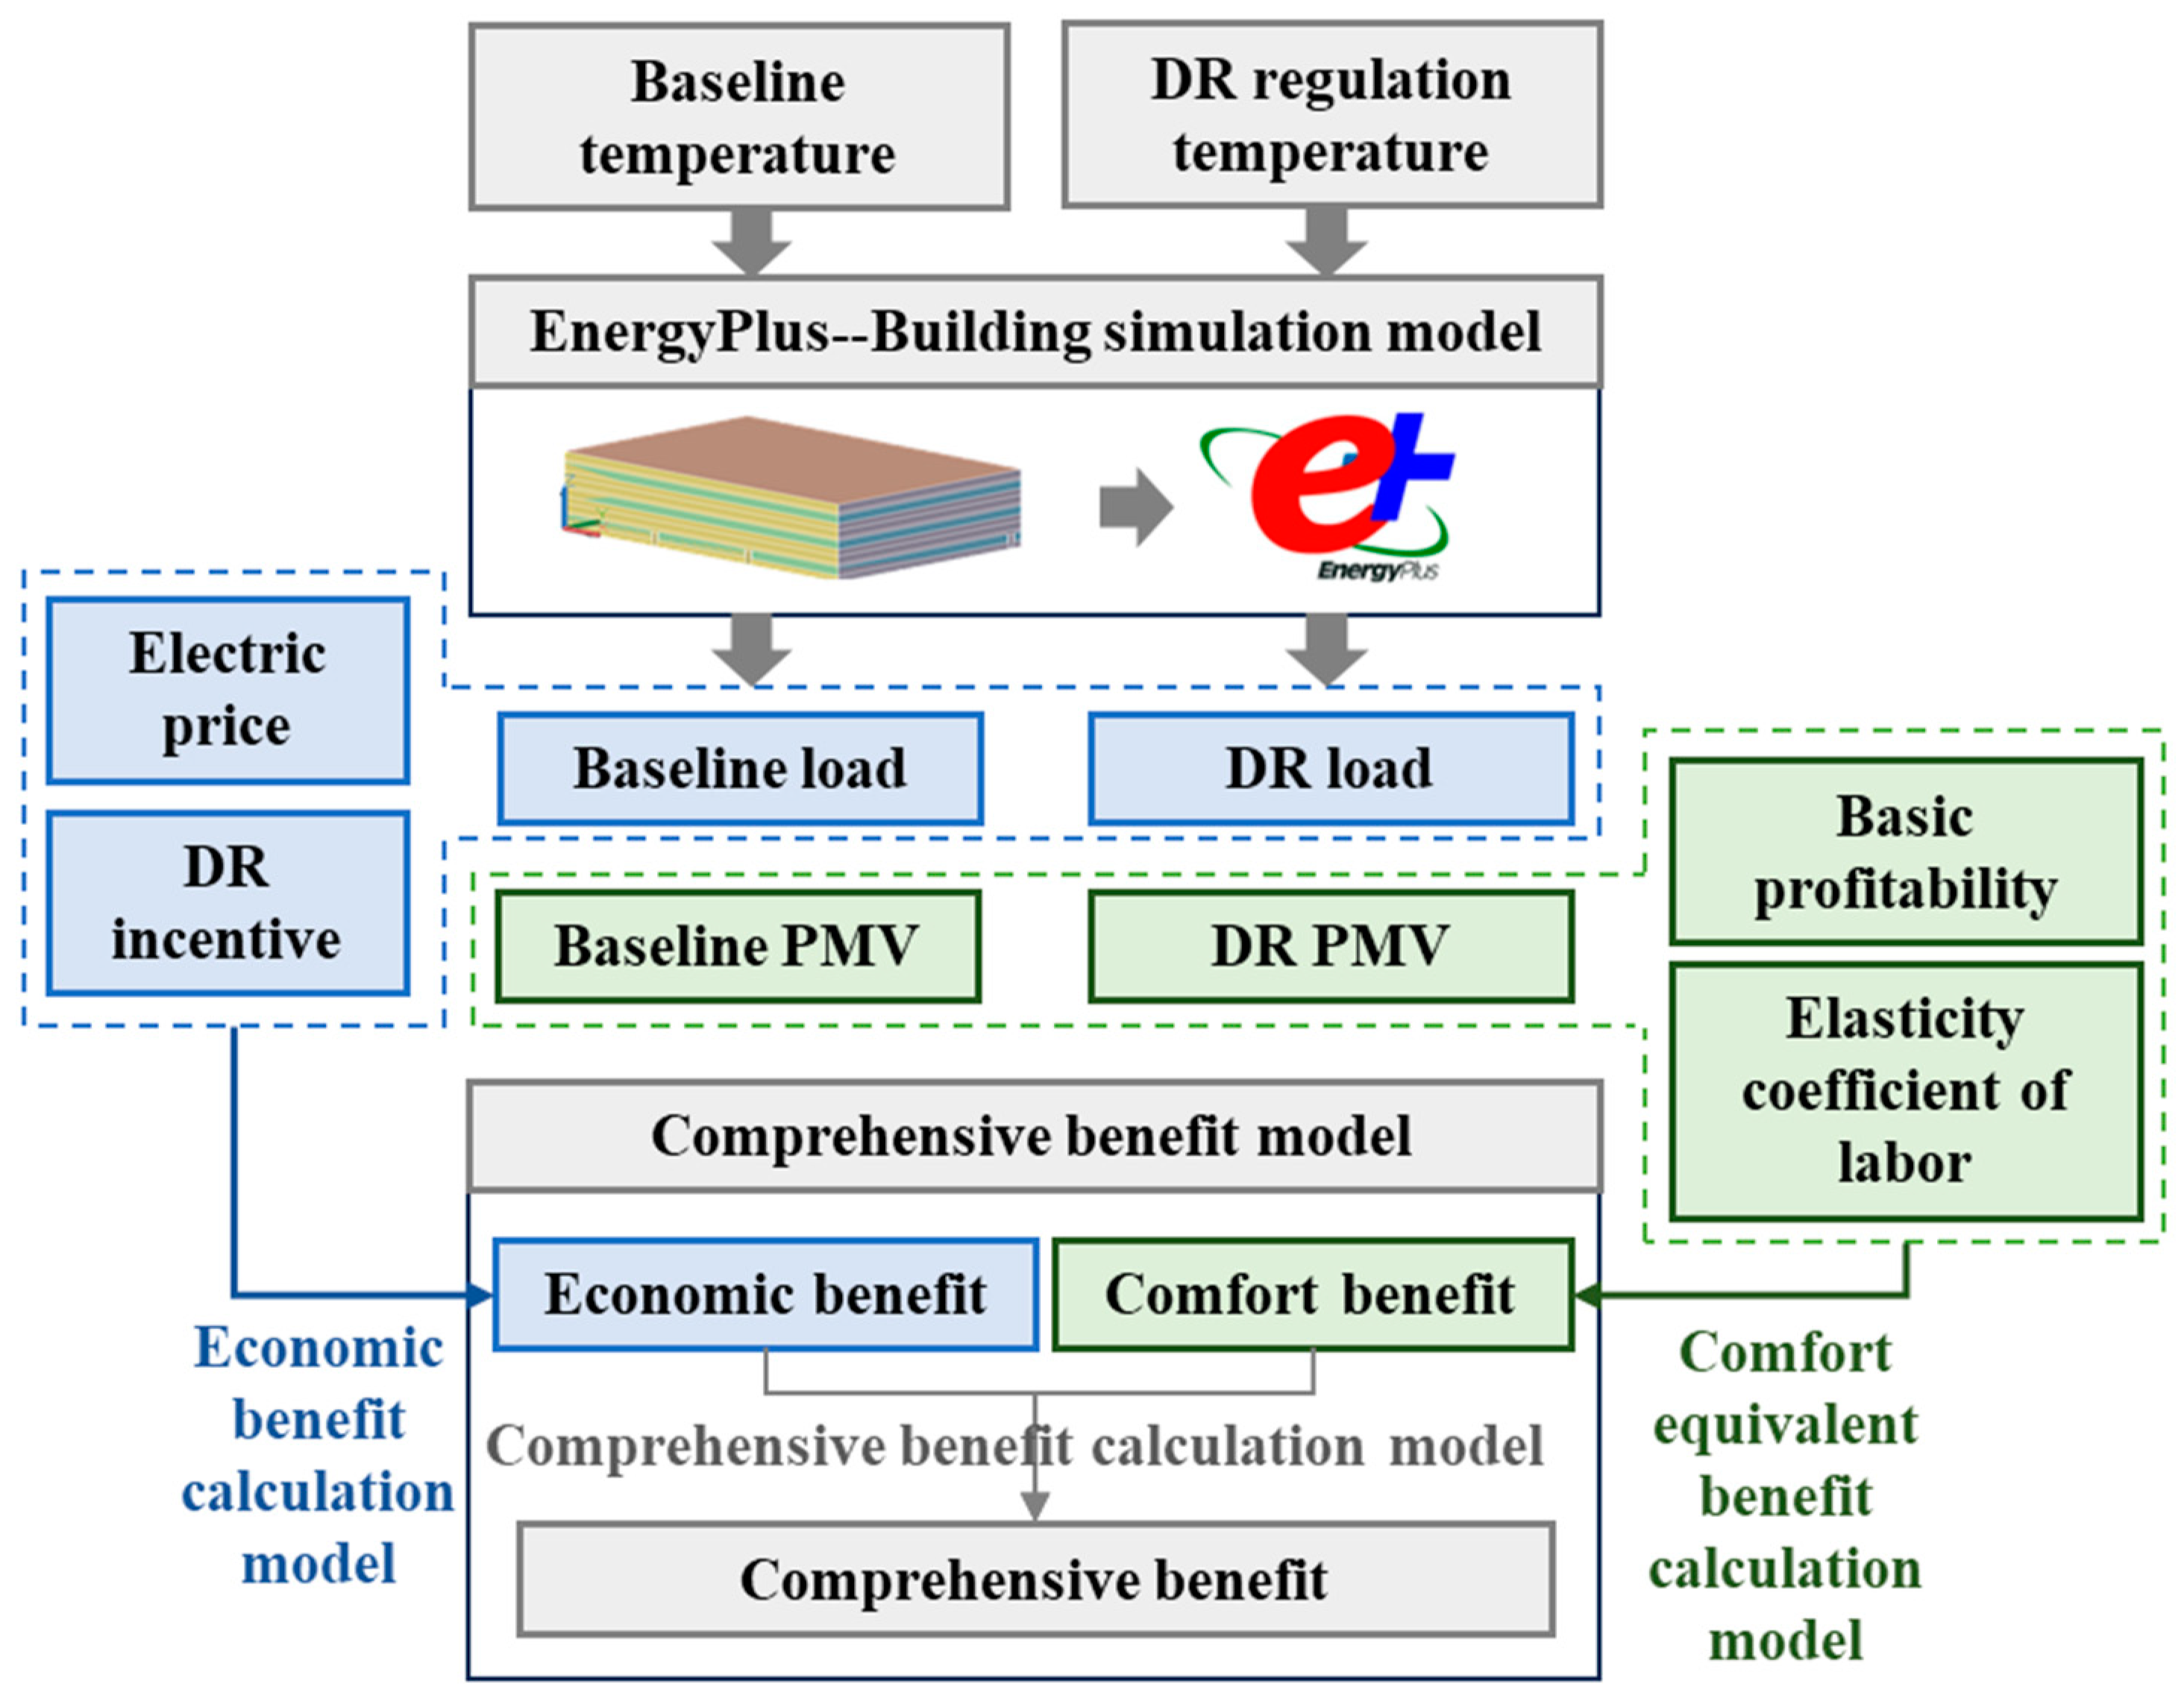
- (2)
- Economic benefit calculation modelThe economic benefit comprises the electricity economic cost and the DR economic incentive. The calculation formula is as follows:where refers to the baseline load of the user at a time step, in kW, which can be calculated according to the baseline of the indoor temperature setpoint, combined with the current meteorological temperature and the building physical model established in the EnergyPlus (v22-2-0) software; refer to the pre-cooling, response, and recovery load of the user at the time step t, in kW, calculated according to the response value of the indoor temperature control point, combined with the current meteorological temperature and the building physical model established in the EnergyPlus software; refers to the time-of-use electricity price of the grid for office building users at the time step, in CNY; refers to the response incentive of the time step, in CNY; and t refers to the length of each control time step.
- (3)
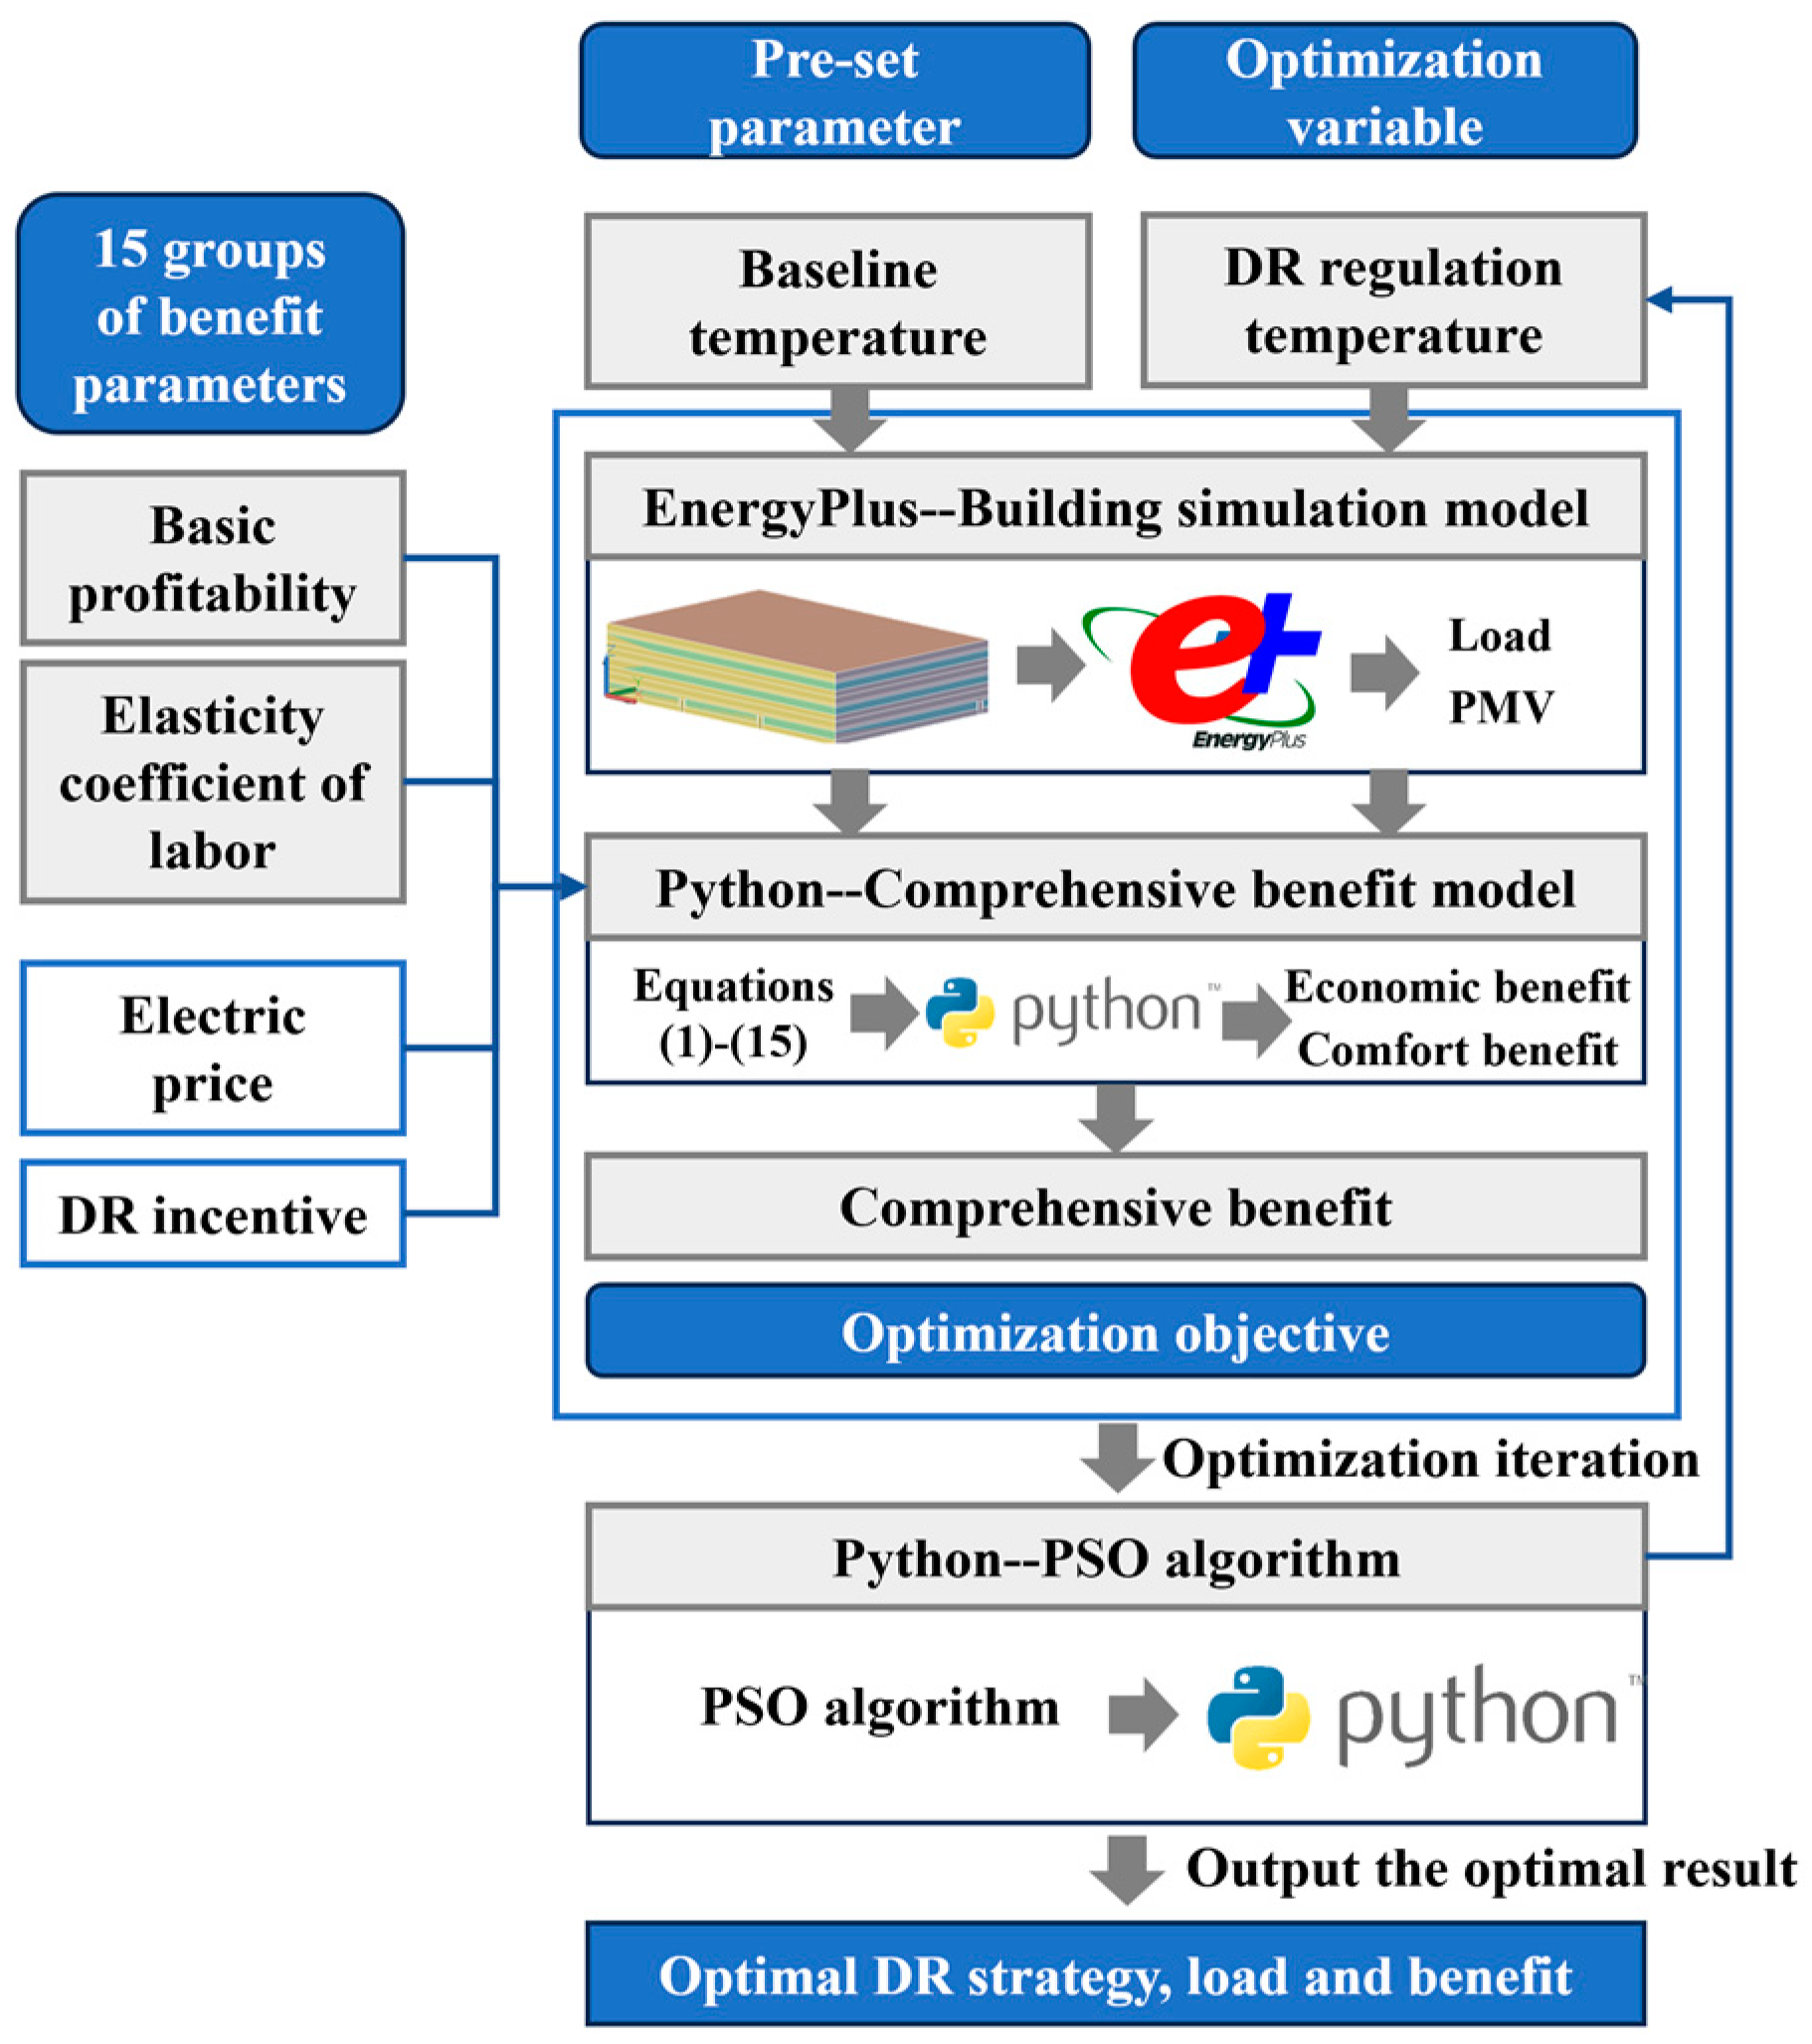
- Comfort equivalent benefit calculation modelIt has been evidenced by research that building infrastructure, sanitary conditions, and thermal environment have significant impacts on employee performance, which subsequently influences the economic benefits of enterprises [34]. The change in equivalent economic benefits caused by the change in the user’s thermal comfort during the DR period is defined as the difference between the benefit at a certain time in the process of pre-cooling, response, and recovery, and the benefit at the baseline temperature, which is calculated as follows:represent the profitability of office building customers at a certain time step in the response period, pre-cooling period, and recovery period, where the unit is CNY. is the basic profitability of the same customer at the baseline temperature, in CNY. The profitability discussed in this model is mainly affected by personnel comfort, with a complex transformation mechanism between the two variables. In accordance with the Cobb–Douglas production function [35], the total output value of an enterprise is determined by its production factors as follows:Y represents the total output value of the enterprise, which is usually expressed in monetary units. A(t) denotes the level of integrated technology and is a dimensionless parameter. L is the input labor force, which is usually 10,000 people, and sometimes it can also be working hours. K refers to the input capital, usually expressed in monetary units, which is typically defined as net fixed assets. α is the elasticity coefficient of the output of labor; β is the elasticity coefficient of the output of capital; and μ symbolizes the impact of random disturbances. The labor input can be transformed into a product of the basic labor input and labor efficiency, as shown in Equations (12) and (13):where l is the amount of basic labor input, and KPI represents the personnel work efficiency affected by thermal comfort, which refers to the percentage of work performance relative to full performance. In the short term, the changes in the net fixed assets, total labor input, capital input, and random interference are very small and can be regarded as a constant, so the above formula can be transformed into:W represents the basic profitability of an office building, calculated by combining the net fixed asset value, total labor input, invested capital, random interference, and other factors, in CNY. This figure can be used to represent the profitability of office building users when the work performance of personnel is 100% in the target period. The basic profitability W and the labor output elasticity coefficient α require the input value of the user side. Consequently, the two parameters can be adjusted individually in accordance with the operational status of different customers over different time periods.The work performance percentage KPI here is affected by the environmental thermal comfort. According to GB/T 50785-2012 “Civil Thermal and Humid Environment Evaluation Standard” [36], the Predicted Mean Vote (PMV) is used to characterize the comfort of the indoor environment. The typical model in the existing research is selected to describe the influence of the PMV on employees’ work performance [37], and the calculation expression of KPI is as follows:The PMV is calculated by building simulation software according to the indoor set temperature of the air-conditioning system in the response period, with consideration of the external environmental parameters, the building’s physical characteristics, and the status of the building’s occupants. As formalized in Equations (1)–(15), the transformation relationship between the DR strategy and office building customers’ comprehensive benefit can be obtained, as shown in Figure 3.
2.3. DR Strategy Optimization Model of Air-Conditioning Customers
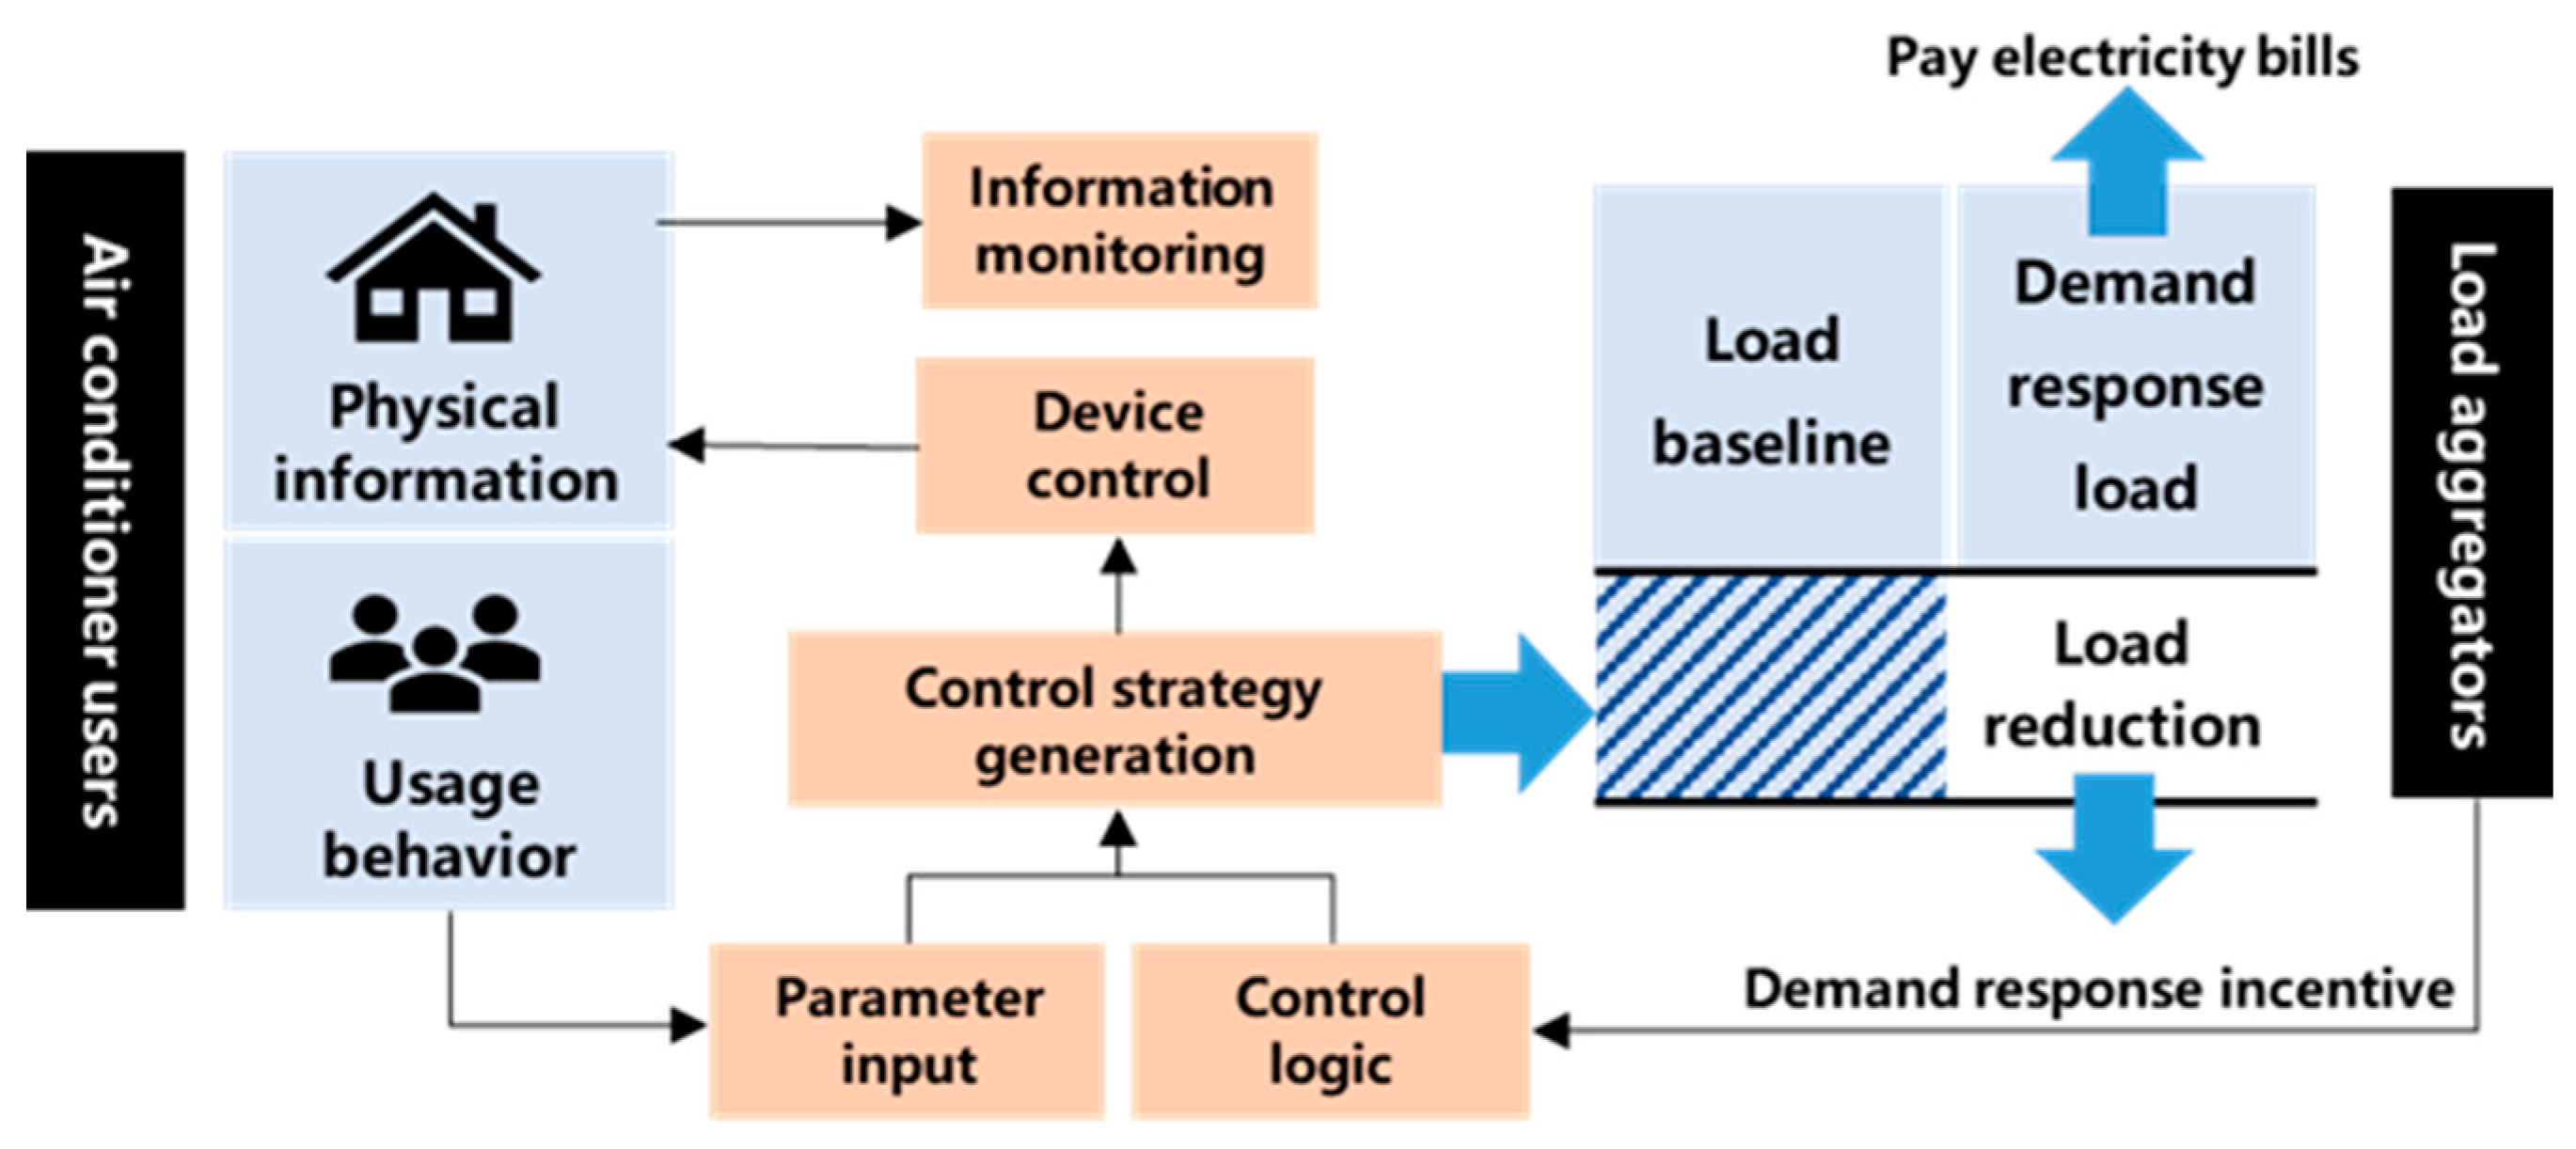
2.3.1. Demand Response Implementation Model
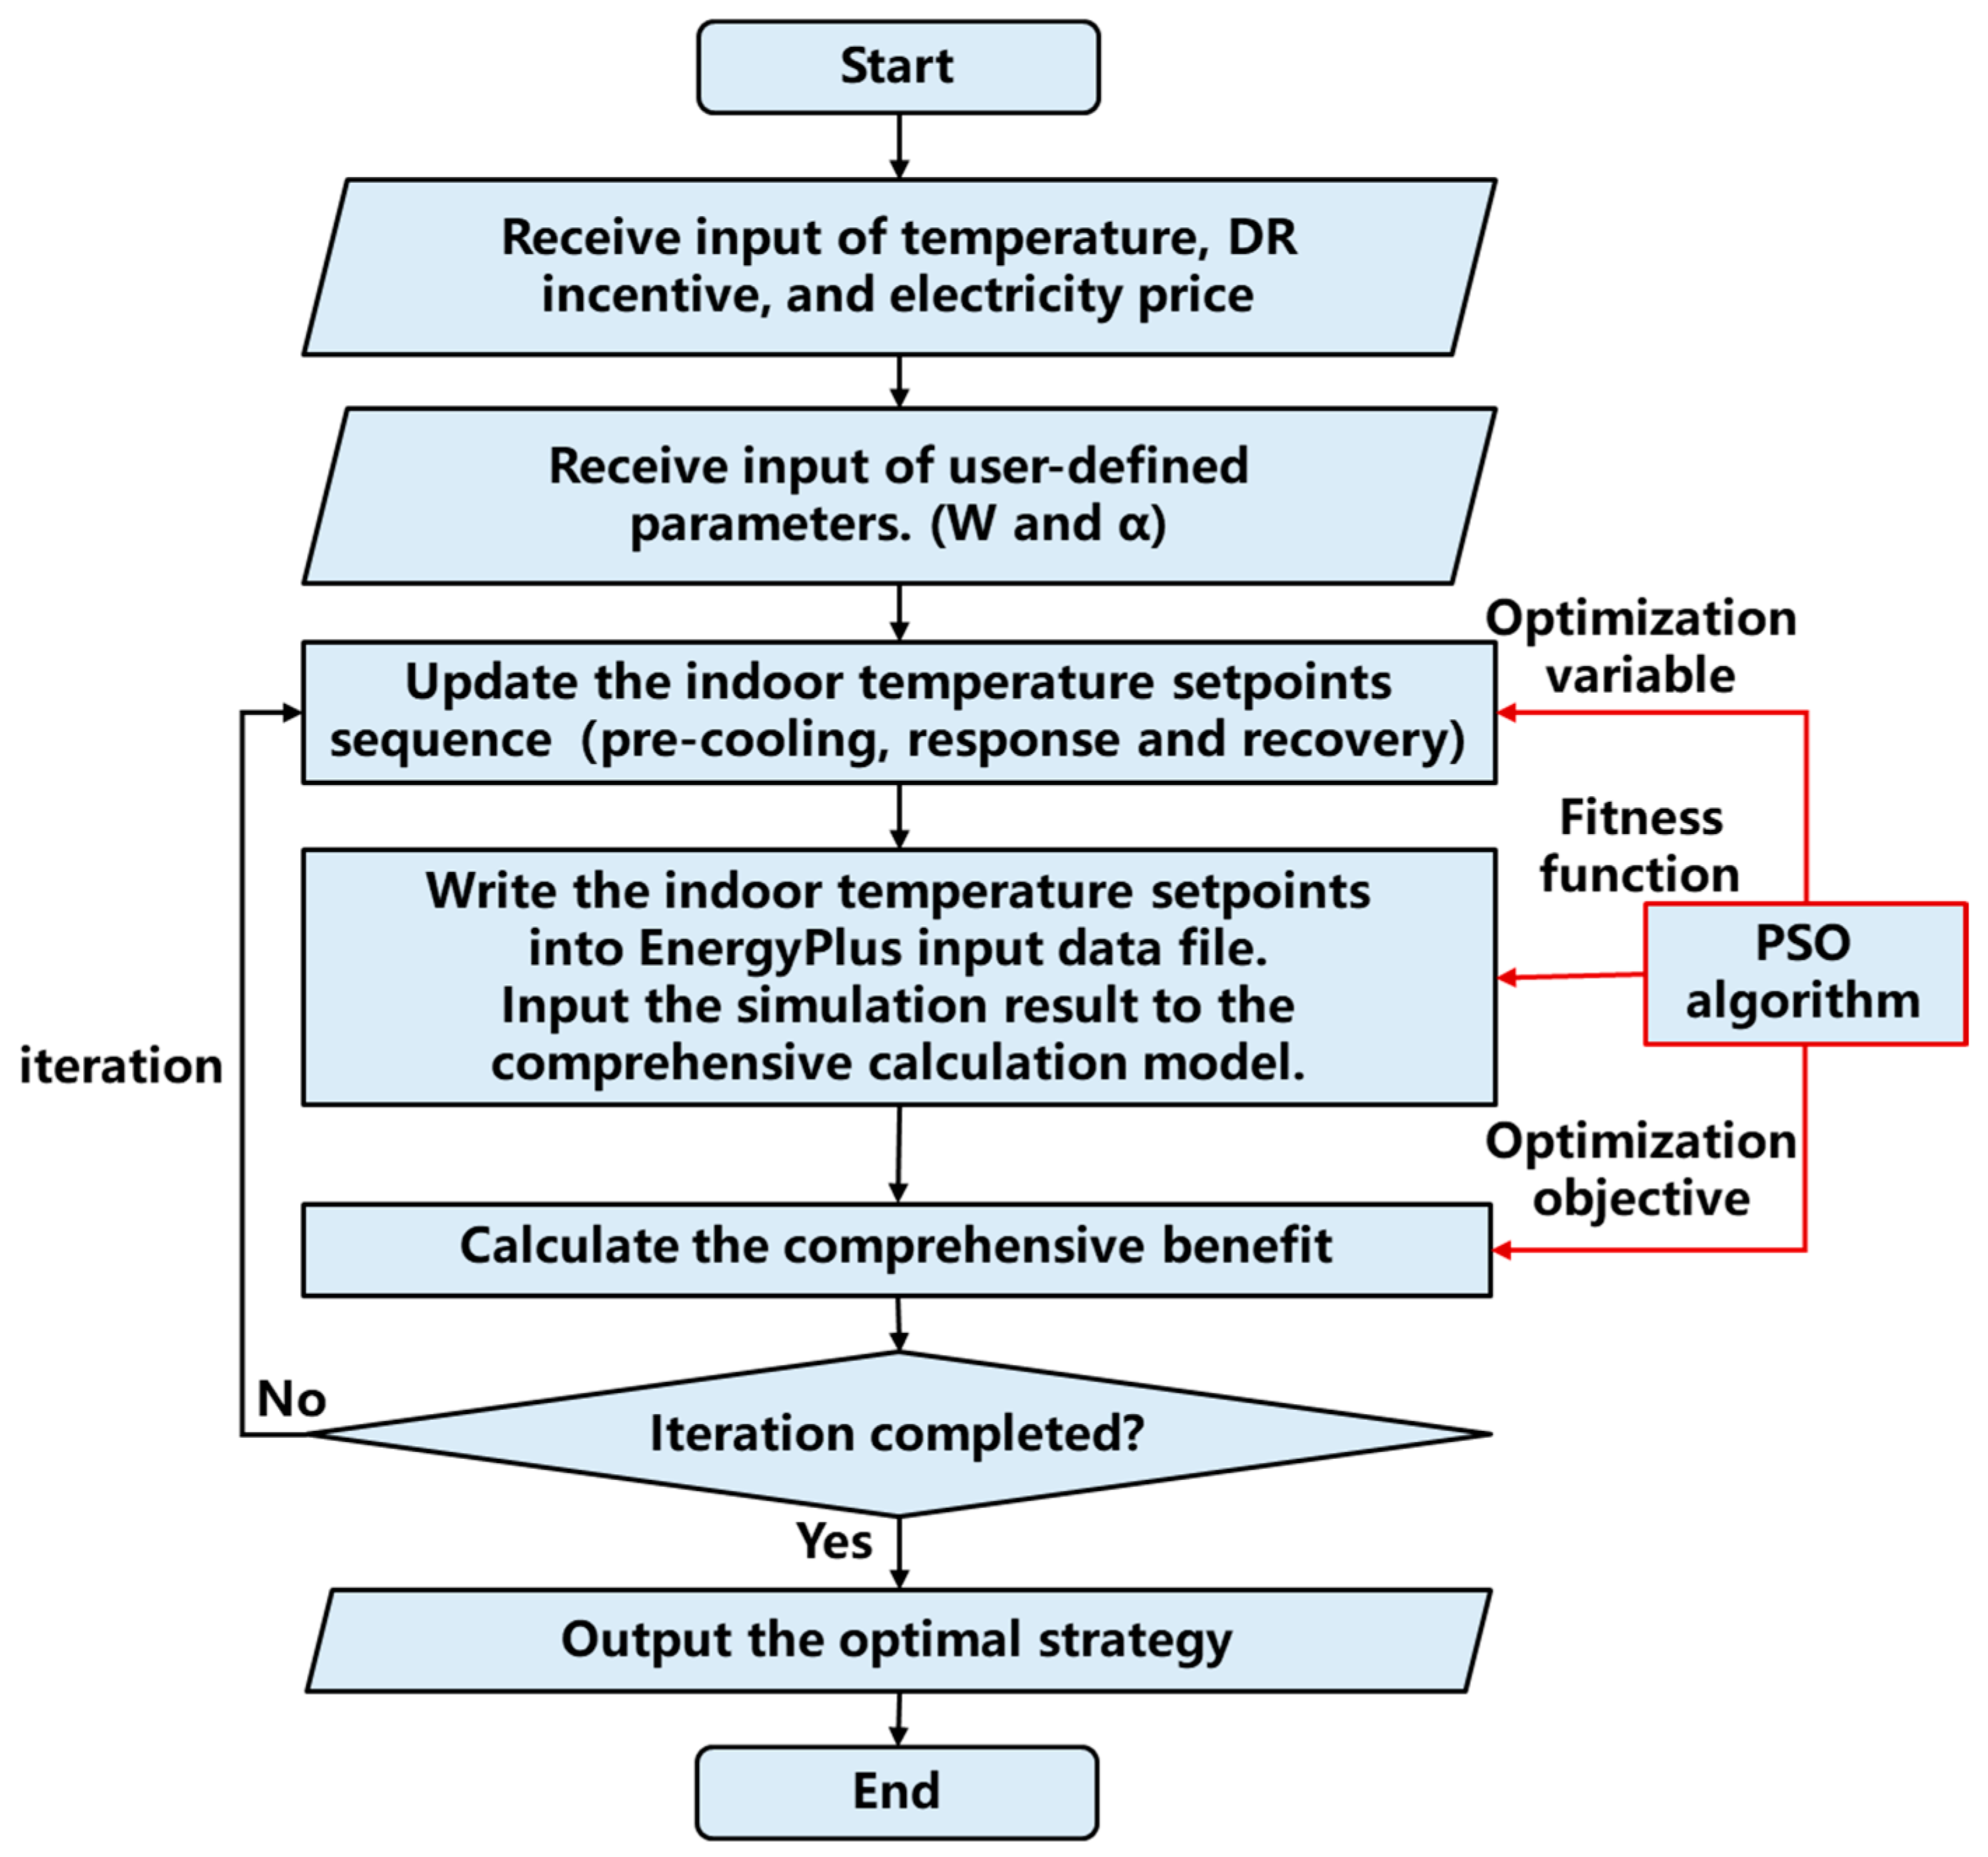
2.3.2. User-Side Demand Response Strategy Optimization Process
2.4. Effectiveness Validation Method of the Optimized DR Strategy: A Case Study
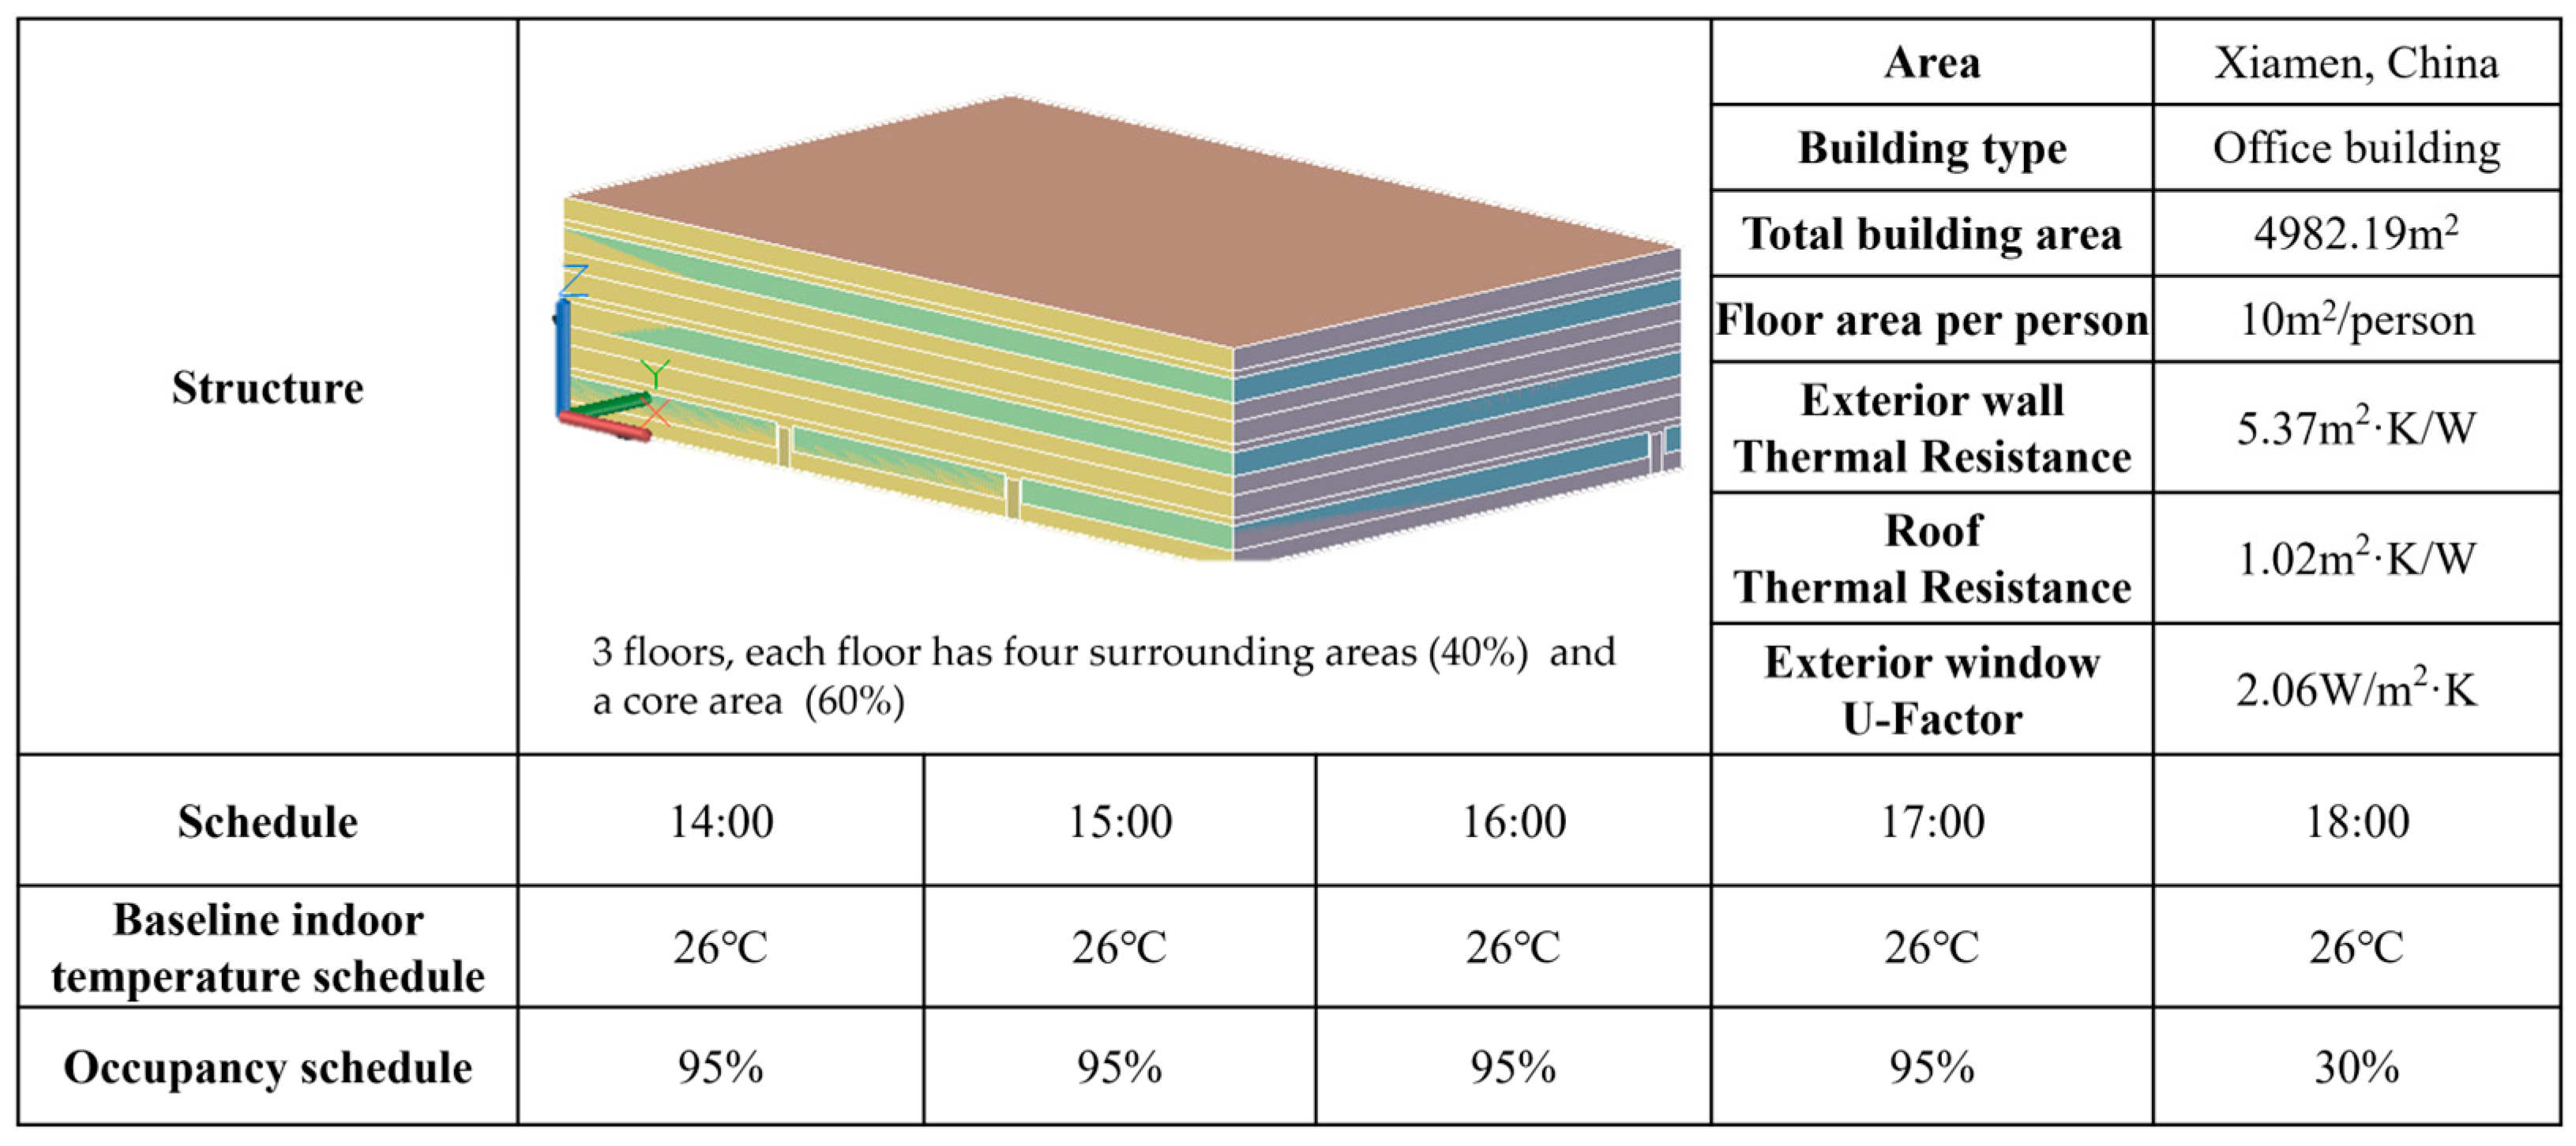
2.4.1. Boundary Condition of Building Case
2.4.2. Air-Conditioning Customers’ Benefit Parameters Setting
2.4.3. Control Strategy Setting
- (1)
- Grid-side power curtailmentFor the predefined 1 h demand response period with 15 min timesteps, power curtailment is defined as the average difference between baseline power and response power across four timesteps (t = 2 to 5). Greater curtailment indicates greater alignment with grid-side objectives. The power curtailment for an individual user is calculated according to Formula (16).where denotes the power curtailment of a single user during a response event, represents the user’s response power at timestep t, and is the baseline power at timestep t.
- (2)
- User-side benefitsUser benefits are evaluated across six timesteps encompassing pre-cooling, response, and recovery periods. Higher benefits reflect greater user-friendliness of the strategy. The benefits are quantified according to Formulae (17)–(19):where denotes the total economic benefit, represents the comfort-equivalent benefit, and corresponds to the comprehensive benefit for a user during the response event. The summation spans six timesteps (t = 1 to 6) to capture holistic impacts across all DR periods.
2.4.4. Simulation Verification Process
3. Results
3.1. Optimized DR Temperature Setpoints and Load Sequences
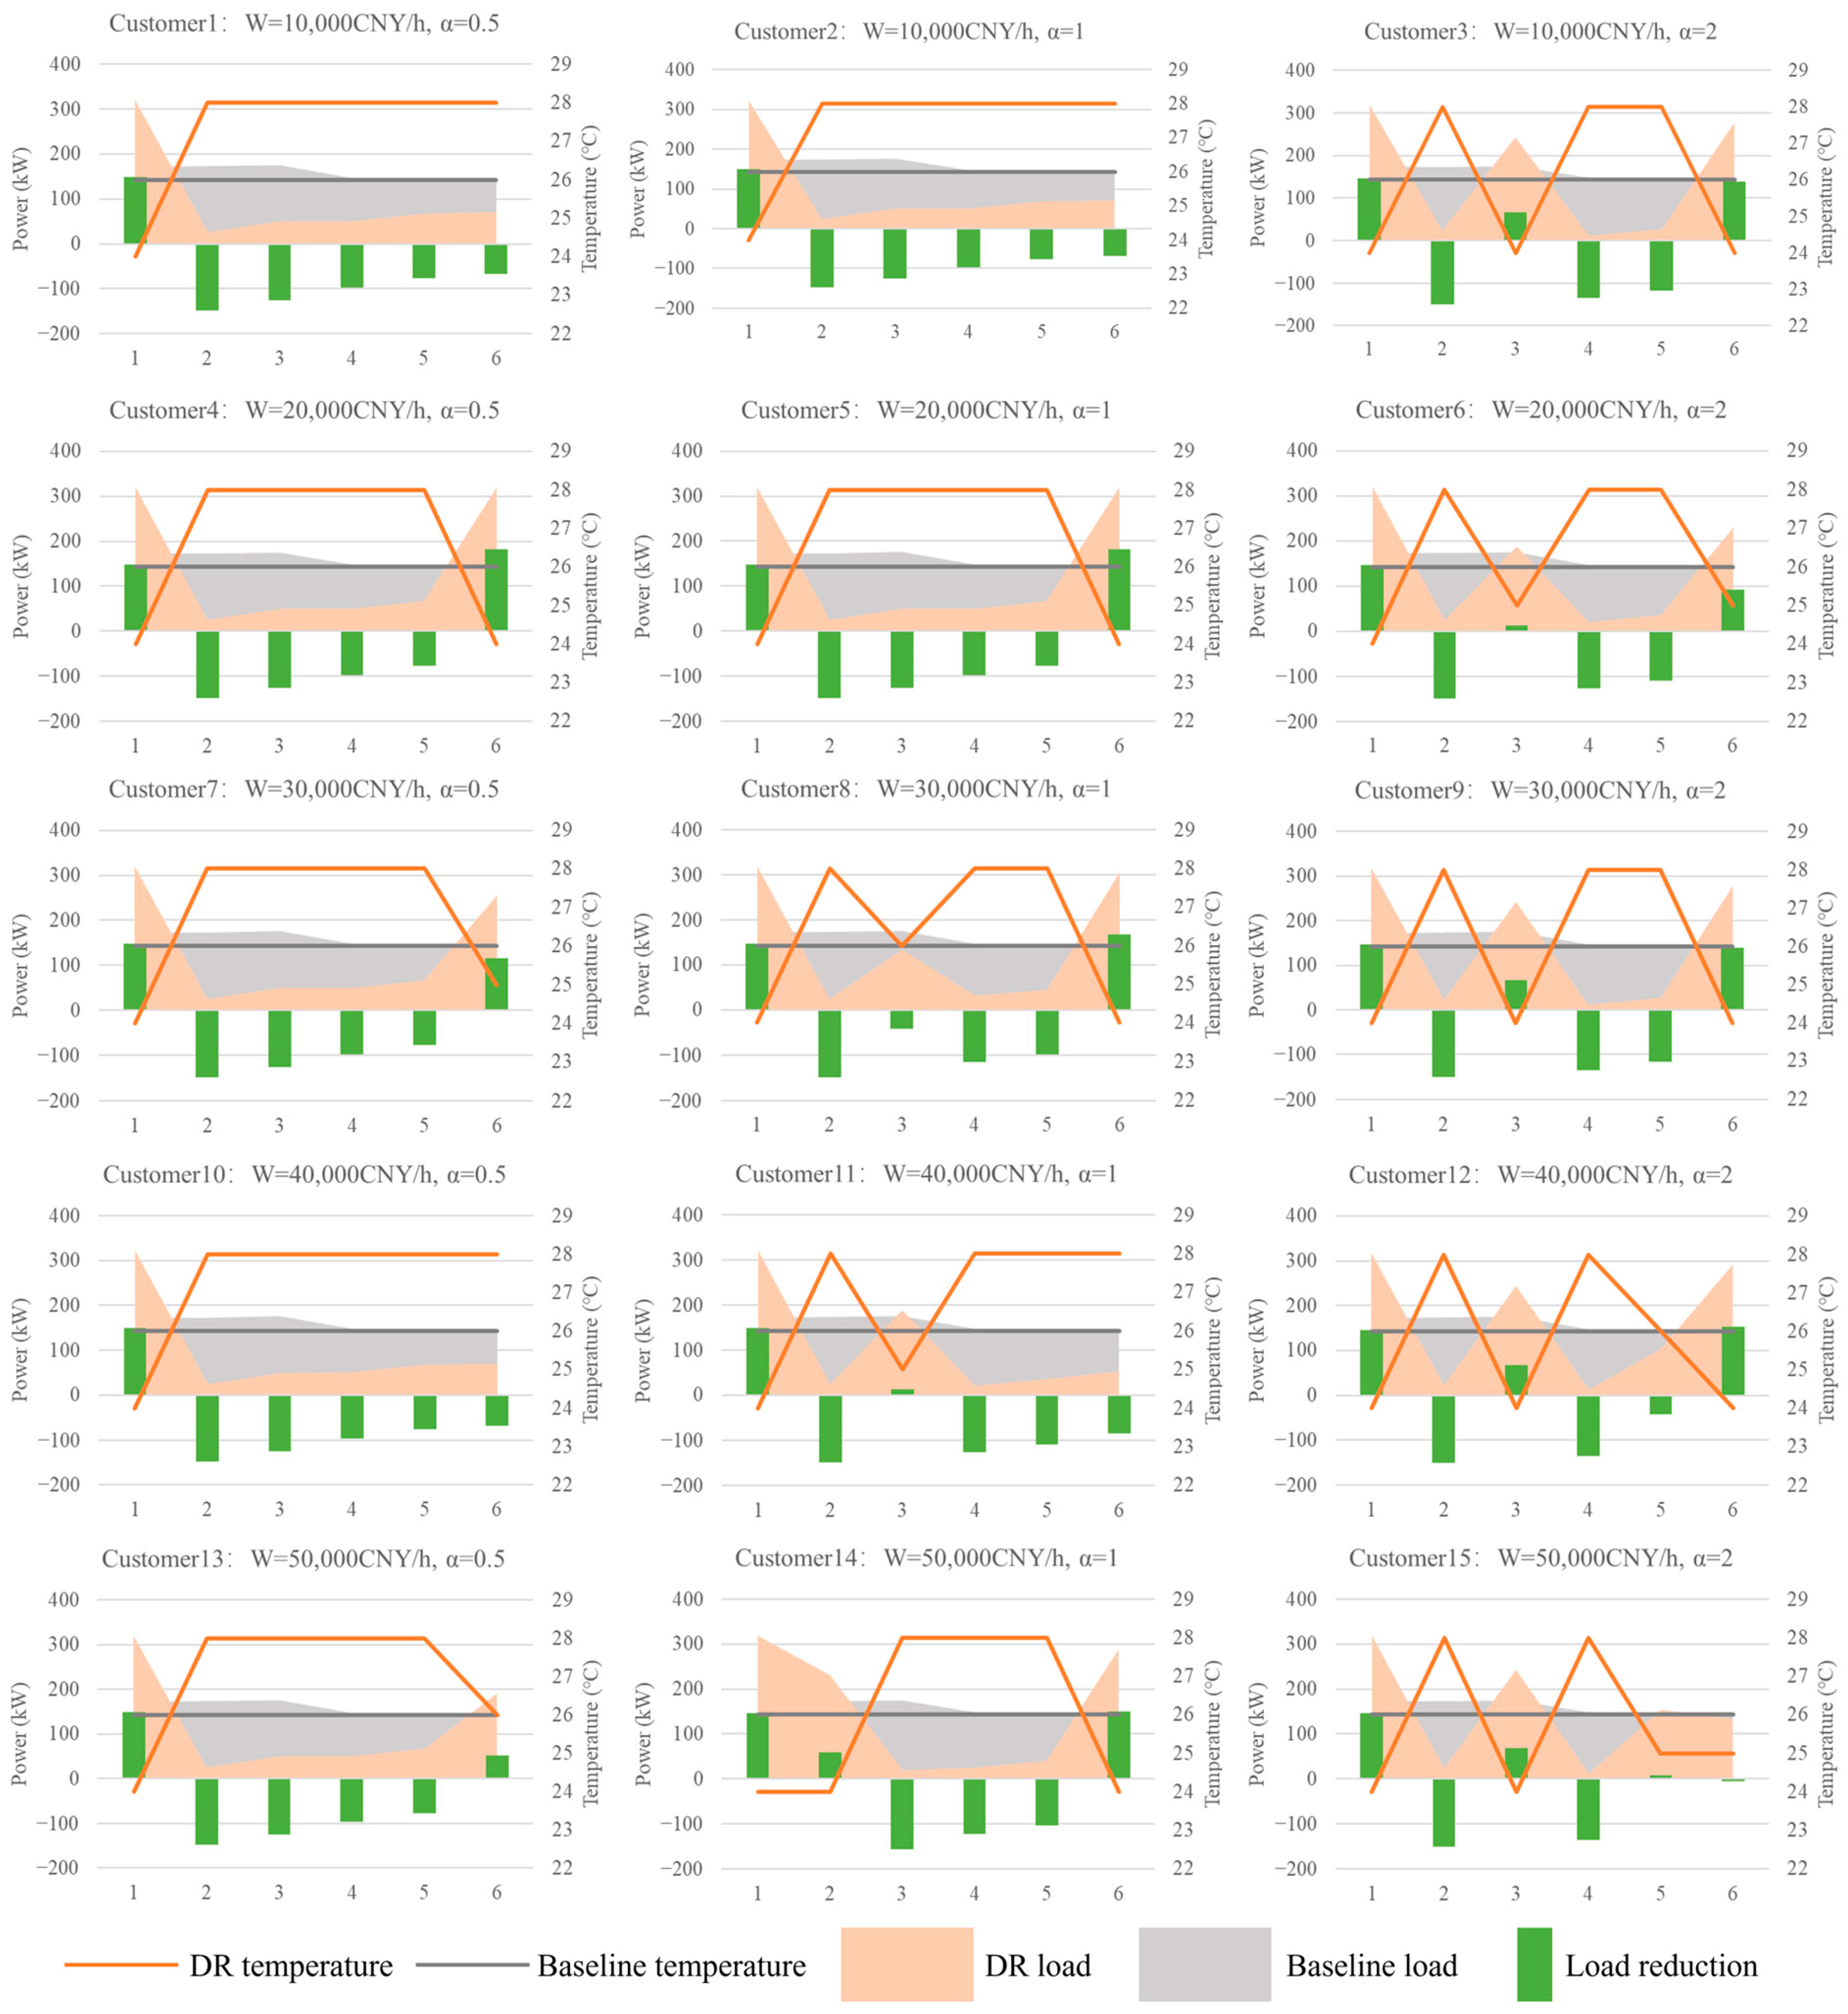
- (1)
- Analysis of optimal temperature setpointsDuring the pre-cooling period, most users adopted a strategy of lowering the temperature setpoint to its minimum value. In the response period, significant inter-user differences emerged:
- (a)
- Customers with smaller labor elasticity coefficients (α) and lower baseline profitability (W) (customers 1, 2, 4, 5, 7, 10, and 13) maintained a constant elevated setpoint of 28 °C.
- (b)
- Users with larger α and higher W (customers 3, 6, 8, 9, 11, 12, 14, and 15) exhibited fluctuating temperature adjustments, characterized by alternating increases and decreases in setpoints during the response period. During the recovery period, most users reduced their temperature setpoints to a low level.
- (2)
- Analysis of optimal load sequencesThe pre-cooling phase led to an increase in load due to the reduced temperature settings. In the response period, the following occurred:
- (a)
- Customers with smaller α and W (customers 1, 2, 4, 5, 7, 10, and 13) achieved stable load reductions.
- (b)
- Customers with larger α and W (customers 3, 6, 8, 9, 11, 12, 14, and 15) displayed intermittent load fluctuations, with temporary load increases corresponding to temperature adjustments. During the recovery period, load levels rose as users readjusted setpoints downward.
3.2. Effectiveness Analysis of Dynamic Optimal DR Strategy
- (1)
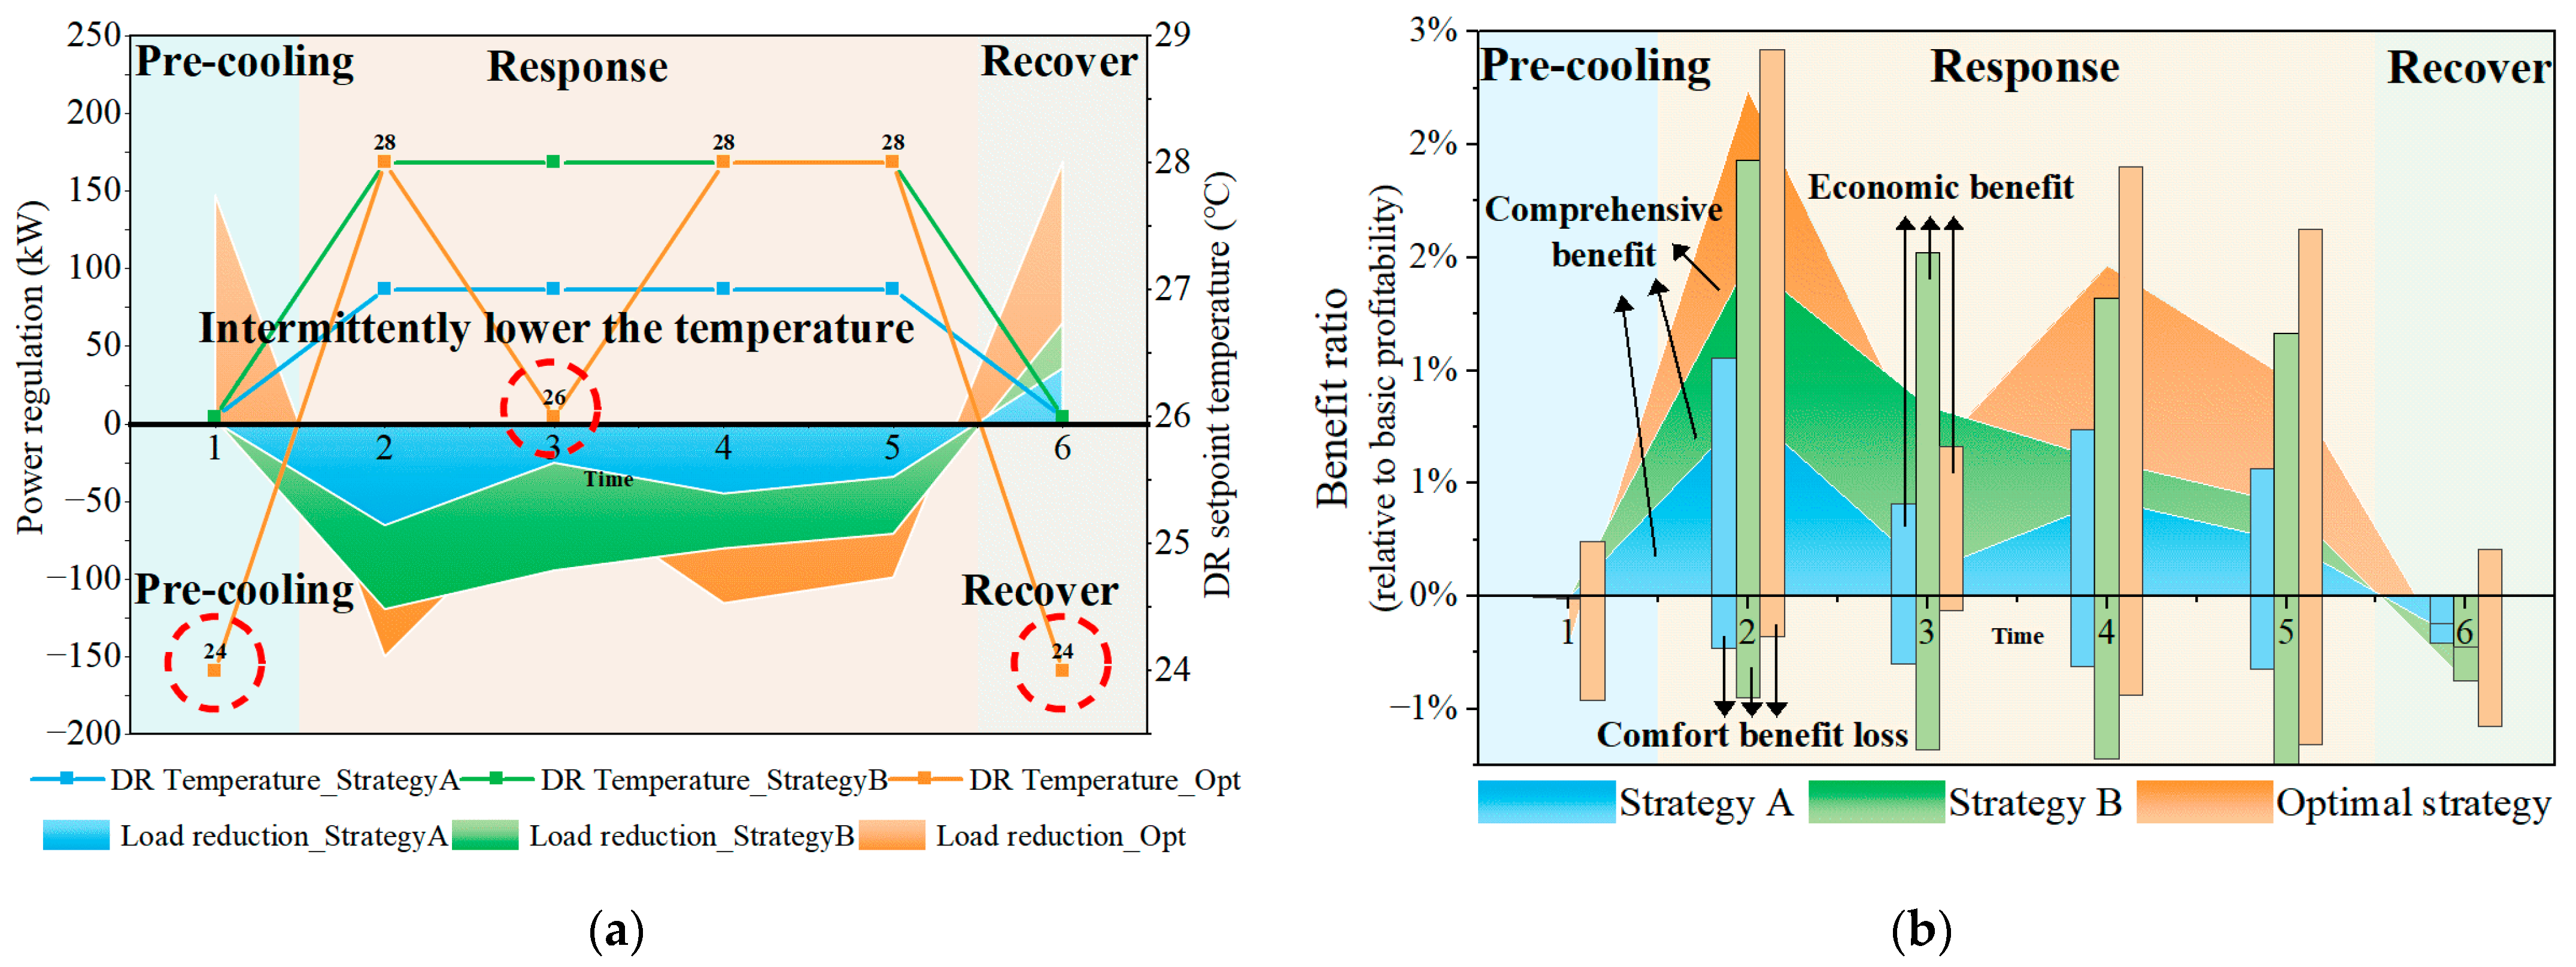
- Effectiveness of the dynamic optimal strategy for individual customersUsing customer 8 as a representative case, Figure 9 compares the performance of three control strategies: optimized strategy (orange, dynamic optimal temperature adjustments), traditional strategy A (blue, fixed 1 °C temperature increase), and traditional strategy B (green, Fixed 2 °C temperature increase). Figure 9a illustrates load reduction and temperature setpoints, with vertical color blocks demarcating pre-cooling, response, and recovery periods. Figure 9b quantifies economic benefits (upward bars), comfort loss (downward bars), and comprehensive benefits (area plots).At time steps 1 and 3, the optimized strategy lowered the setpoint temperature, increasing load reduction. Subsequent adjustments at time steps 2 and 4 raised setpoints from lower baseline values, further enhancing economic benefits without significantly compromising comfort. This demonstrates that the optimized strategy leverages the building envelope’s thermal inertia to balance economic gains and comfort preservation. Across all periods, the optimized strategy achieved higher average load reduction and greater comprehensive benefits than traditional strategies, confirming its ability to maximize user-specific trade-offs between economic and comfort benefits.
- (2)
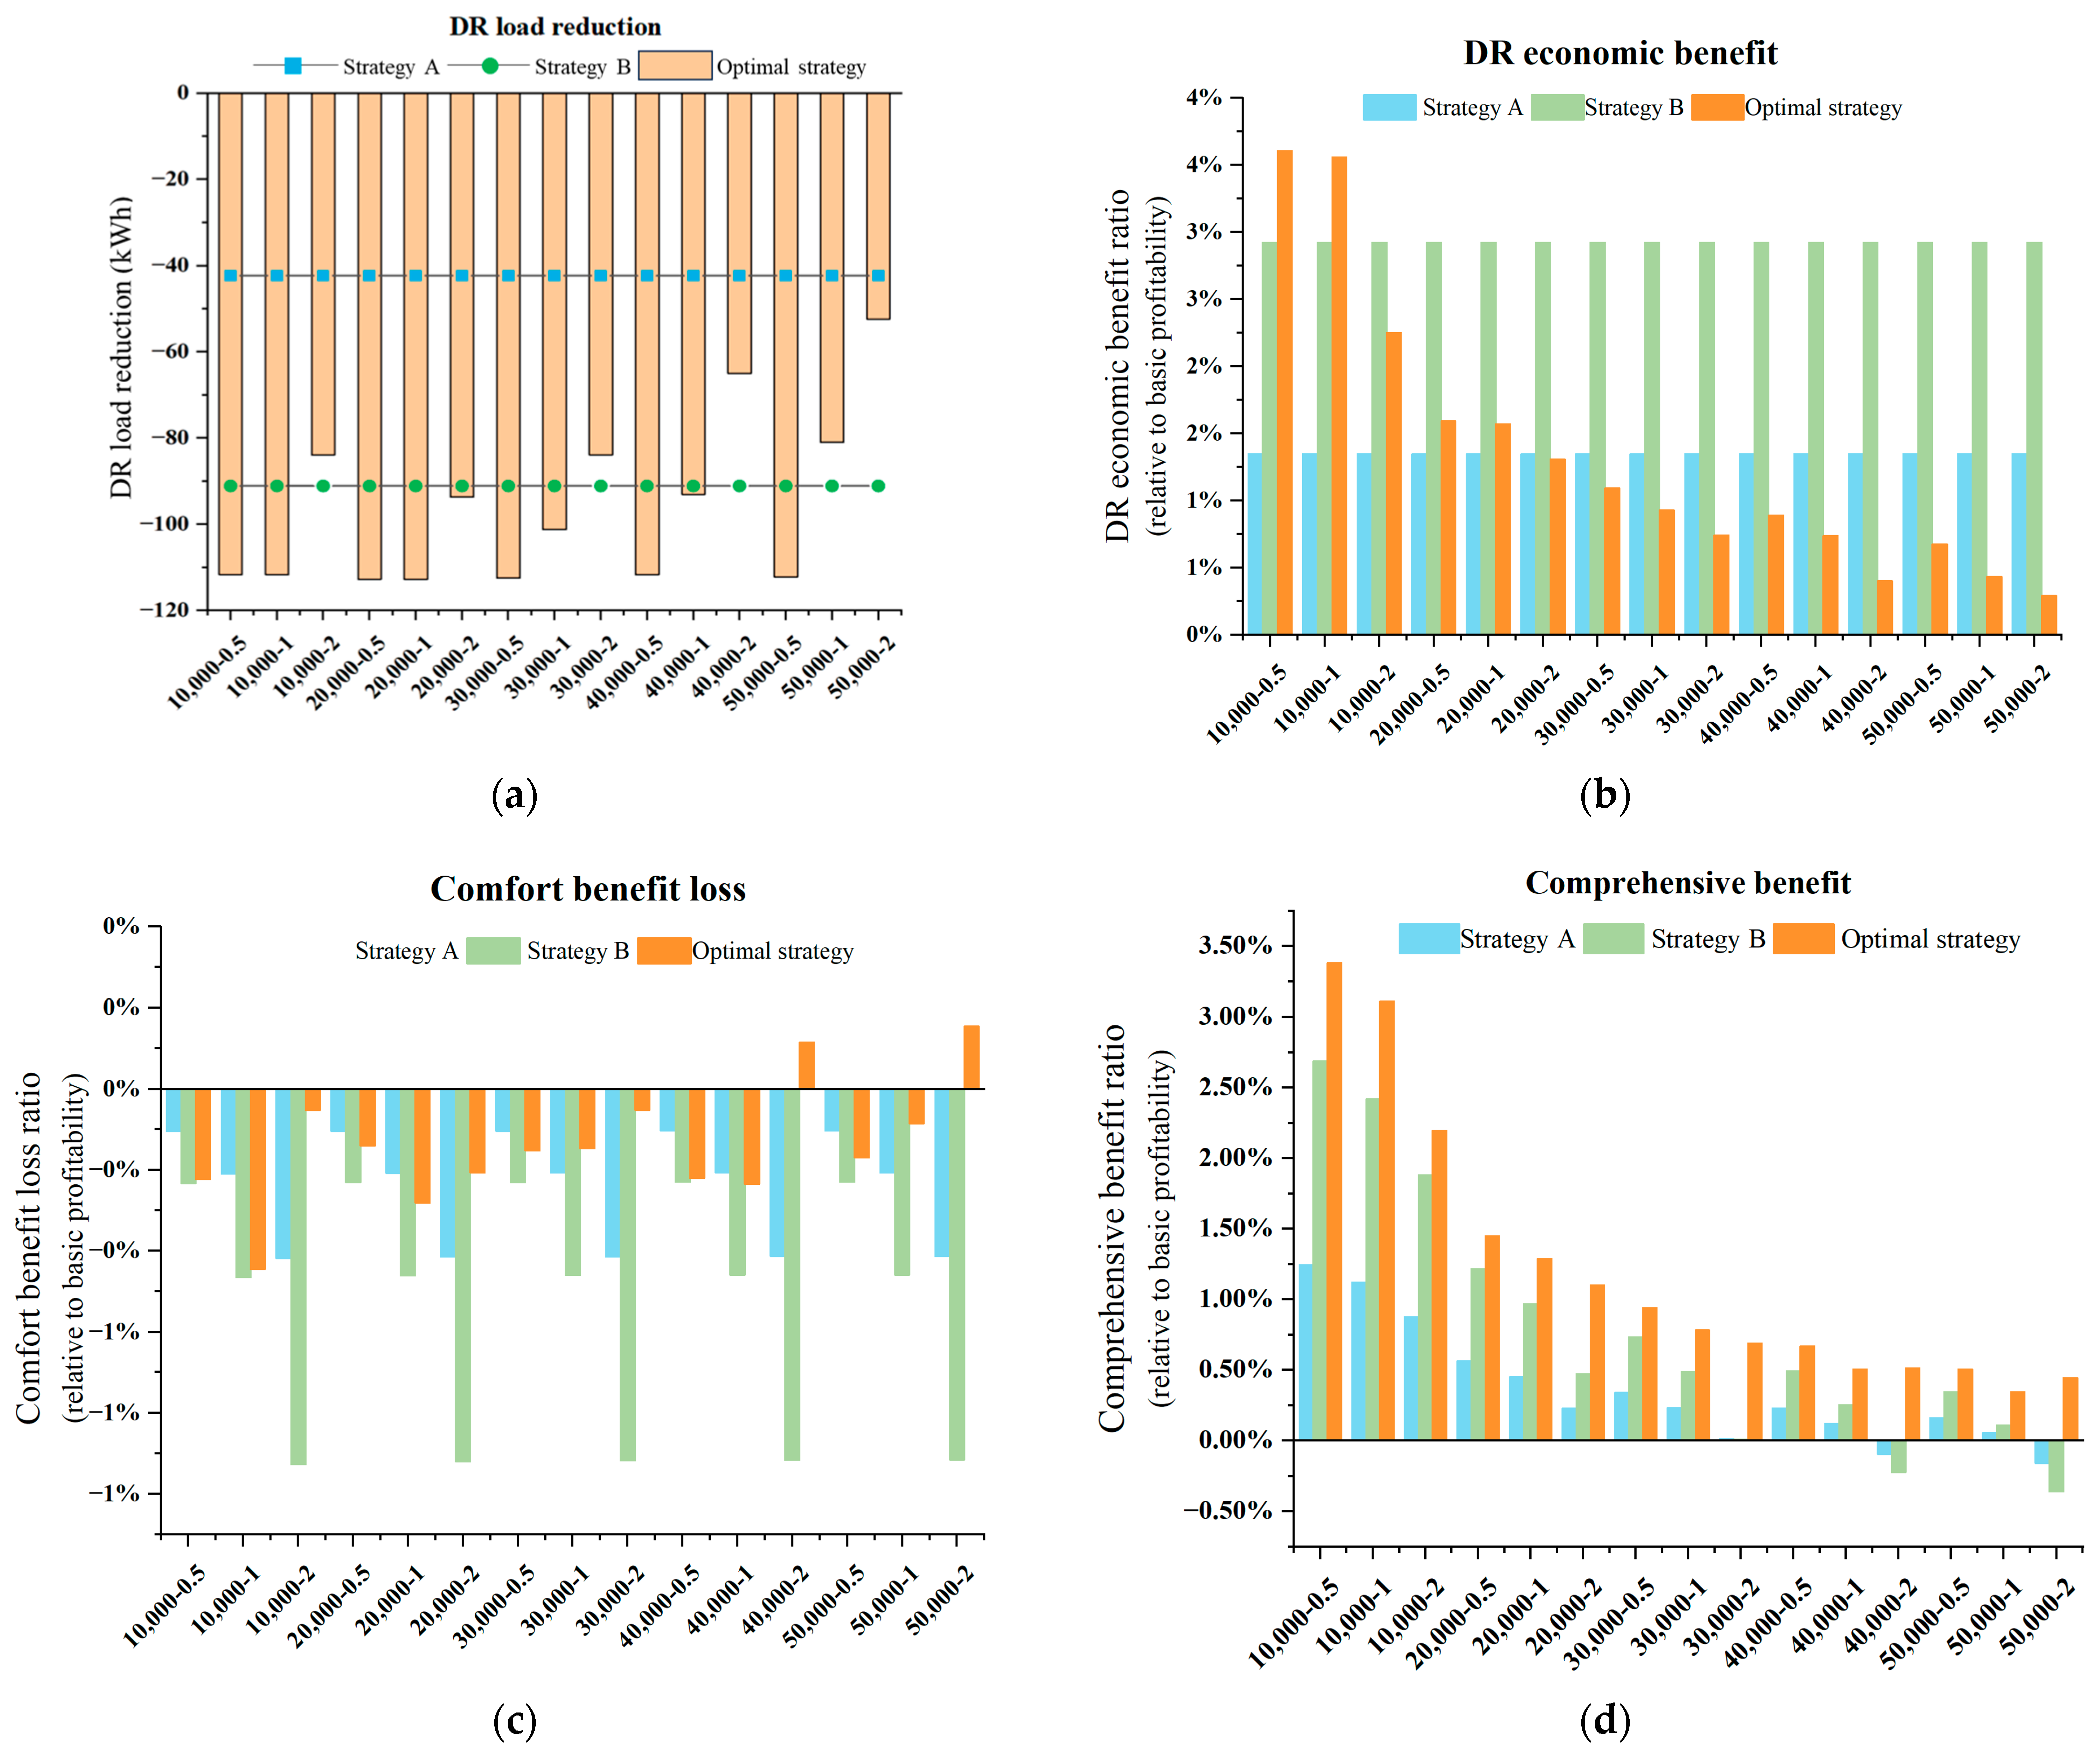
- Effectiveness of dynamic optimal strategy at the population levelFigure 10 quantifies the optimized strategy’s superiority over traditional methods at the population level using the four metrics defined in Section 2.4.3:
- (a)
- Load ReductionAs illustrated in Figure 10a, during the response period, the load reduction effect of all samples was superior to strategy A. And the load reduction effect of 61% of samples demonstrated a higher reduction than that of strategy B.
- (b)
- Economic BenefitsAs illustrated in Figure 10b, all air-conditioning users exhibited a greater economic benefit than the baseline.
- (c)
- Comfort LossAs illustrated in Figure 10c, the loss of comfort benefits for the 50% of consumers in the sample cluster was less than that of the two traditional strategies. And the loss of comfort benefits for the remaining 50% of consumers was less than that of strategy B and more than that of strategy A.
- (d)
- Comprehensive BenefitsAs illustrated in Figure 10d, the comprehensive benefit of the entire sample population was superior to the two traditional strategies A and B.
3.3. Characteristic Difference Analysis of Culture Customers
4. Discussion
5. Conclusions
- (1)
- Compared with the two traditional flexible strategies, the optimization strategy effectively improves the load reduction effect and comprehensive benefits. From the perspective of load reduction effect, the load reduction effect of all HVAC users adopting the optimization strategy is higher than that of traditional strategy A (indoor temperature control point increased by 1 °C), and the load reduction effect of 61% of users is higher than that of traditional strategy B (indoor temperature control point increased by 2 °C). From the perspective of comprehensive benefits, the comprehensive benefits of all users adopting the optimization strategy are higher than those of the two traditional strategies.
- (2)
- The optimization strategy effectively improves the thermal comfort of HVAC users. In total, 50% of customers adopting the optimization strategy have less comfort benefit loss than the two traditional strategies, and the remaining 50% are between the two traditional flexible strategies.
- (3)
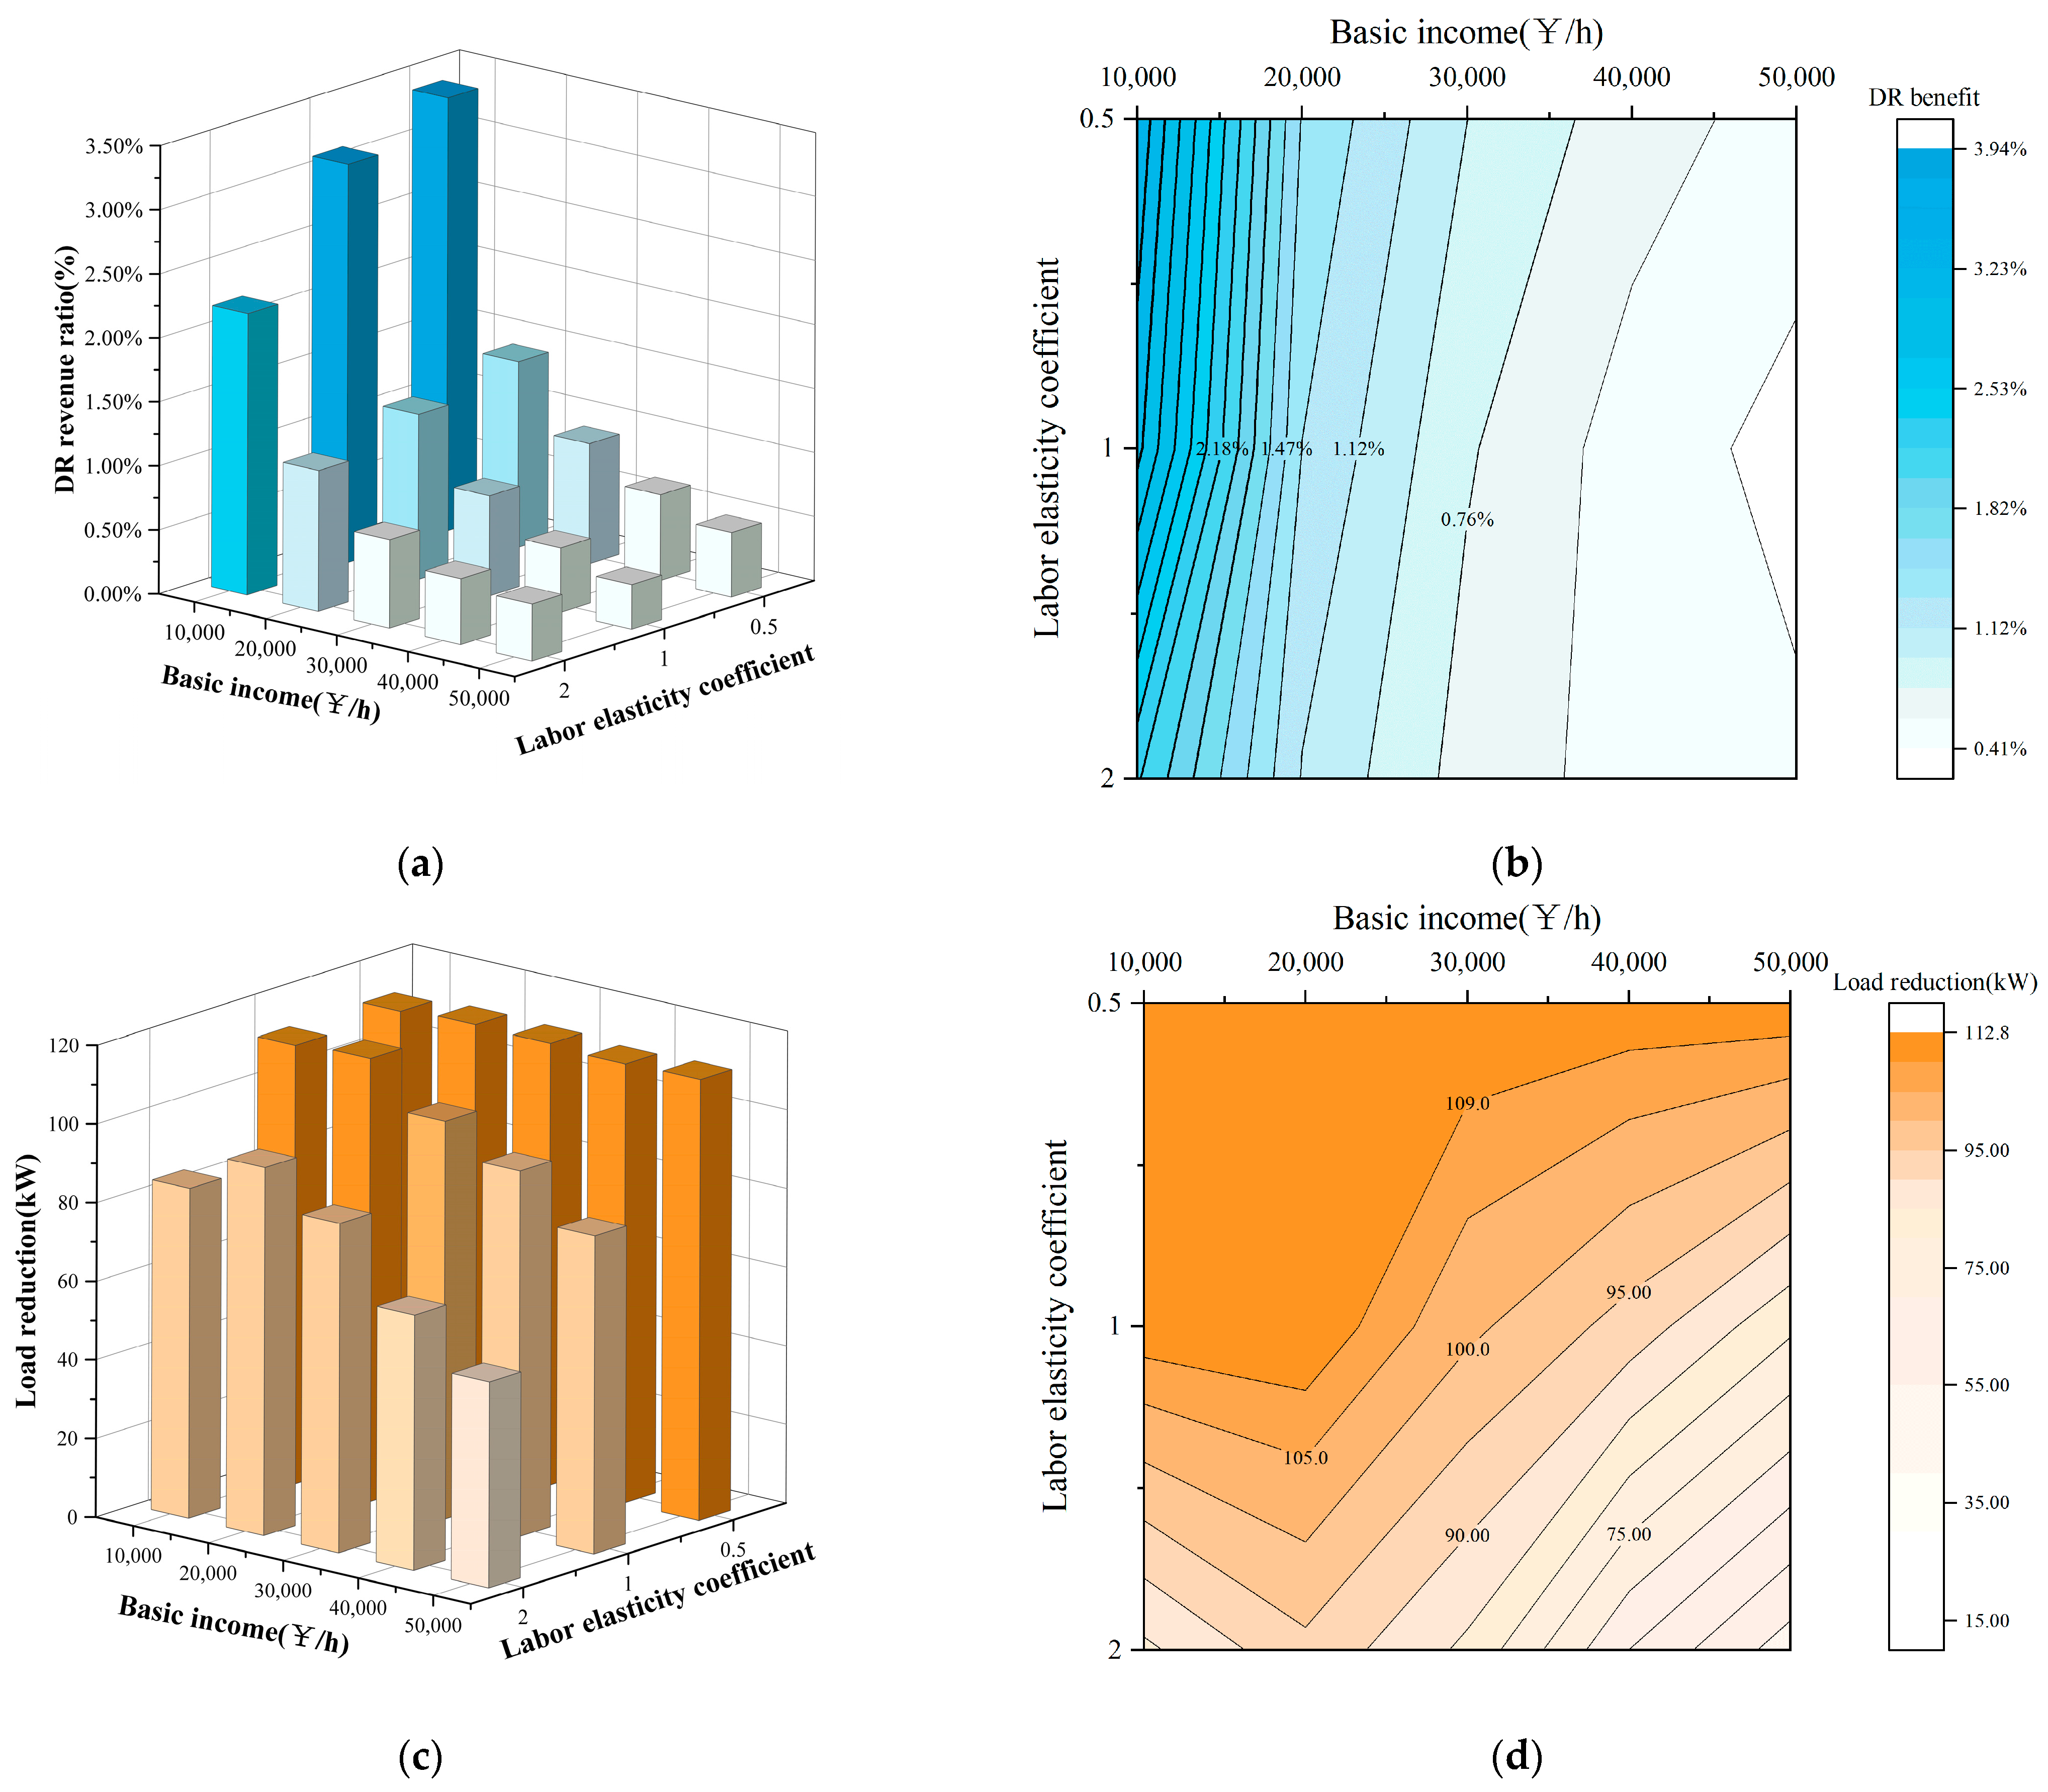
- HVAC users with lower basic profitability and a lower labor elasticity coefficient are better targets for air-conditioning load demand response. Users with lower basic profitability and a lower labor elasticity coefficient have higher load reduction potential and greater comprehensive benefit. In the application scenario involving the optimal scheduling of DR customer clusters, this type of customer should have a higher priority.
Author Contributions
Funding
Data Availability Statement
Conflicts of Interest
References
- Meng, Q.; Gao, T.; Zhang, X.; Zhao, F.; Wang, L.; Lei, Y.; Wu, X.; Li, H. Load rebound suppression strategy and demand response potential of thermal storage HVAC systems: An experimental and simulation study. J. Energy Storage 2023, 73, 108872. [Google Scholar] [CrossRef]
- Dyson, M.; Borgeson, S.; Tabone, M.; Callaway, D. Using smart meter data to estimate demand response potential, with ap-plication to solar energy integration. Energy Policy 2014, 73, 607–619. [Google Scholar]
- Hao, H.; Middelkoop, T.; Barooah, P.; Meyn, S. How demand response from commercial buildings will provide the regulation needs of the grid. In Proceedings of the 50th Annual Allerton Conference on Communication, Control, and Computing, Monticello, IL, USA, 1–5 October 2012. [Google Scholar]
- Lin, Y.; Barooah, P.; Meyn, S.; Middelkoop, T. Experimental Evaluation of Frequency Regulation from Commercial Building HVAC Systems. IEEE Trans. Smart Grid 2015, 6, 776–783. [Google Scholar] [CrossRef]
- Zhu, M.; Pan, Y.; Wu, Z. An occupant-centric air-conditioning system for occupant thermal preference recognition control in personal micro-environment. Build. Environ. 2021, 196, 107749. [Google Scholar]
- Scislo, L.; Szczepanik-Scislo, N. Near Real-Time Access Monitoring Based on IoT Dynamic Measurements of Indoor Air Pollutant. In Proceedings of the 2023 IEEE 12th International Conference on Intelligent Data Acquisition and Advanced Computing Systems: Technology and Applications (IDAACS), Dortmund, Germany, 7–9 September 2023. [Google Scholar]
- Szczepanik-Scislo, N.; Flaga-Maryanczyk, A. Indoor Air Quality Modelling and Measurements of a Studio Apartment with a Mechanical Exhaust System. E3S Web Conf. 2018, 44, 00171. [Google Scholar]
- Tang, R.; Wang, S.; Xu, L. An MPC-Based Optimal Control Strategy of Active Thermal Storage in Commercial Buildings during Fast Demand Response Events in Smart Grids. Energy Procedia 2019, 158, 2506–2511. [Google Scholar] [CrossRef]
- Lakeridou, M.; Ucci, M.; Marmot, A.; Ridley, I. The potential of increasing cooling set-points in air-conditioned offices in the UK. Appl. Energy 2012, 94, 338–348. [Google Scholar] [CrossRef]
- Meimand, M.; Jazizadeh, F. A personal touch to demand response: An occupant-centric control strategy for HVAC systems using personalized comfort models. Energy Build. 2024, 303, 113769. [Google Scholar] [CrossRef]
- Su, Y.; Zou, X.; Tan, M.; Peng, H.; Chen, J. Integrating few-shot personalized thermal comfort model and reinforcement learning for HVAC demand response optimization. J. Build. Eng. 2024, 91, 109509. [Google Scholar]
- Aghniaey, S.; Lawrence, T.M. The impact of increased cooling setpoint temperature during demand response events on occupant thermal comfort in commercial buildings: A review. Energy Build. 2018, 173, 19–27. [Google Scholar] [CrossRef]
- Zahid, H.; Elmansoury, O.; Yaagoubi, R. Dynamic Predicted Mean Vote: An IoT-BIM integrated approach for indoor thermal comfort optimization. Autom. Constr. 2021, 129, 103805. [Google Scholar] [CrossRef]
- Zhang, Y.; Zhao, R. Overall thermal sensation, acceptability and comfort. Build. Environ. 2008, 43, 44–50. [Google Scholar] [CrossRef]
- Winkler, D.A.; Beltran, A.; Esfahani, N.P.; Maglio, P.P.; Cerpa, A.E. FORCES: Feedback and control for Occupants to Refine Comfort and Energy Savings. In Proceedings of the 2016 ACM International Joint Conference on Pervasive and Ubiquitous Computing, Heidelberg, Germany, 12–26 September 2016; Lawrence Berkeley National Laboratory: Berkeley, CA, USA, 2006. [Google Scholar]
- ANSI/ASHRAE Standard 55-2023; Thermal Environmental Conditions for Human Occupancy. ASHRAE: Peachtree Corners, GA, USA, 2023.
- Lee, H.; Rim, D.; Ahn, H. Evaluation of local thermal comfort during demand response. Energy 2025, 320, 135085. [Google Scholar] [CrossRef]
- Li, W.; Cheng, L.; Sui, W.; Chen, S.; Zhu, J.; Yang, L.; Zhao, J.R. Incorporating Occupant cooling behaviors into novel thermal comfort models for residential demand response. Energy Build. 2024, 311, 114173. [Google Scholar] [CrossRef]
- Szczepanik-Scislo, N.; Schnotale, J. An Air Terminal Device with a Changing Geometry to Improve Indoor Air Quality for VAV Ventilation Systems. Energies 2020, 13, 4947. [Google Scholar] [CrossRef]
- Amin, U.; Hossain, M.J.; Fernandez, E. Optimal price based control of HVAC systems in multizone office buildings for demand response. J. Clean. Prod. 2020, 270, 122059. [Google Scholar] [CrossRef]
- Seppänen, O.; Fisk, W.J.; Lei, Q.H. Effect of temperature on task performance in office environment. Energy Build. 2011, 43, 1057–1062. [Google Scholar]
- Cui, W.; Cao, G.; Park, H.J. Influence of indoor air temperature on human thermal comfort, motivation and performance. Build. Environ. 2013, 68, 114–122. [Google Scholar] [CrossRef]
- Han, J.; Piette, M.A. Solutions for Summer Electric Power Shortages: Demand Response andits Applications in Air Conditioning and Refrigerating Systems. Refrig. Air-Cond. 2007, 29, 1–4. [Google Scholar]
- Wang, H.; Wang, S.; Tang, R. Development of grid-responsive buildings: Opportunities, challenges, capabilities and applications of HVAC systems in non-residential buildings in providing ancillary services by fast demand responses to smart grids. Appl. Energy 2019, 250, 697–712. [Google Scholar] [CrossRef]
- Yoon, A.-Y.; Kang, H.-K.; Moon, S.-I. Optimal Price Based Demand Response of HVAC Systems in Commercial Buildings Considering Peak Load Reduction. Energies 2020, 13, 862. [Google Scholar] [CrossRef]
- Jordehi, A.R. Optimisation of demand response in electric power systems, a review. Renew. Sustain. Energy Rev. 2019, 103, 308–319. [Google Scholar]
- Azuatalam, D.; Lee, W.; de Nijs, F.; Liebman, A. Reinforcement learning for whole-building HVAC control and demand response. Energy AI 2020, 2, 100020. [Google Scholar] [CrossRef]
- Sun, Y.; Shen, Q.; Liu, X.; Zhang, L.; Li, X.; Zhang, T.; Lin, M. Optimal control strategy for building HVAC systems: Satisfying flexible demand response with different value-based selection. Energy Build. 2024, 323, 114823. [Google Scholar]
- Schierloh, R.M.; Bragagnolo, S.N.; Vega, J.R.; Vaschetti, J.C. Real-Time predictive management of a multi-unit HVAC system based on heuristic optimization. A health center case study. Energy Build. 2023, 295, 113315. [Google Scholar] [CrossRef]
- Sun, Y.; Huang, G. Recent Developments in HVAC System Control and Building Demand Management. Curr. Sustain. Renew. Energy Rep. 2017, 4, 15–21. [Google Scholar]
- Bai, Y.; Zhang, W.; Yu, T. Flexibility quantification and enhancement of flexible electric energy systems in buildings. J. Build. Eng. 2023, 68, 106114. [Google Scholar]
- Esrafilian-Najafabadi, M.; Haghighat, F. Occupancy-based HVAC control systems in buildings: A state-of-the-art review. Build. Environ. 2021, 197, 107810. [Google Scholar]
- Wei, C.; Wu, Q.; Xu, J. Distributed scheduling of smart buildings to smooth power fluctuations considering load rebound. Appl. Energy 2020, 276, 115396. [Google Scholar] [CrossRef]
- Arata, S.; Sugiuchi, M.; Ikaga, T. Economic benefits of the effects of office environment on perceived work efficiency and presenteeism. Build. Environ. 2023, 243, 110712. [Google Scholar] [CrossRef]
- Colther, C.; Doussoulin, J.P. Recent Applications and Developments of the Cobb–Douglas Function: From Productivity to Sustainability. J. Knowl. Econ 2024, 1–21. [Google Scholar] [CrossRef]
- GB/T 50785-2012; Standard for Indoor Thermal and Humid Environment Assessment of Civil Buildings. Standardization Administration of China: Beijing, China, 2012.
- Liu, C. Study on the Influence Mechanism and Evaluation of Middle and High Thermal Environment on Personnel Work Efficiency. Master’s Thesis, Zhejiang University of Science and Technology, Hangzhou, China, 2021. [Google Scholar] [CrossRef]
- Song, Y.; Wu, S.; Yan, Y.Y. Control strategies for indoor environment quality and energy efficiency—A review. Int. J. Low Carbon Technol. 2015, 10, 305–312. [Google Scholar] [CrossRef]
- Park, J.Y.; Ouf, M.M.; Gunay, B. A critical review of field implementations of occupant-centric building controls. Build. Environ. 2019, 165, 106351. [Google Scholar] [CrossRef]
- Ludao’s Continuous High Temperature Electricity Load Soared, and 130,000 Air Conditioners Were “Turned on” in More than a Day. Available online: https://xm.fjsen.com/2014-07/07/content_14438876.htm (accessed on 15 July 2024).
- Notice of the Xiamen Municipal Development and Reform Commission and the Xiamen Municipal Bureau of Finance on Printing and Distributing the Implementation Plan for Electricity Demand Response in Xiamen (2023–2025). Available online: https://dpc.xm.gov.cn/xxgk/zc/gfxwj/202306/t20230609_2767219.htm (accessed on 16 July 2024).
- GB 50189-2015; Design Standard for Energy Efficiency of Public Buildings. Standardization Administration of China: Beijing, China, 2015.
- National Bureau of Statistics. International Statistical Yearbook 2023. Available online: https://data.stats.gov.cn/files/lastestpub/gjnj/2023/zk/indexch.htm (accessed on 10 October 2024).
- GB 50736-2012; Design Code for Heating, Ventilation and Air Conditioning in Civil Buildings. Standardization Administration of China: Beijing, China, 2012.
- García, A.; Olivieri, F.; Larrumbide, E.; Ávila, P. Thermal comfort assessment in naturally ventilated offices located in a cold tropical climate, Bogotá. Build. Environ. 2019, 158, 237–247. [Google Scholar] [CrossRef]

| Phase | DR Incentives | Economic Benefit | Comfort Equivalent Benefit | Profit Function |
|---|---|---|---|---|
| Response period | ✓ | Generating economic benefit through load reduction (+) | Operational efficiency losses (−) | Economic benefit + Operational efficiency losses |
| Pre-response and post-response | ✗ | Increases energy consumption and electricity costs (−) | Operational efficiency increase (+) | Electricity costs + Operational efficiency increase |
| Customer Characteristics | W1 = 10,000 CNY/h | W2 = 20,000 CNY/h | W3 = 30,000 CNY/h | W4 = 40,000 CNY/h | W5 = 50,000 CNY/h |
|---|---|---|---|---|---|
| α1 = 0.5 | Customer 1 | Customer 4 | Customer 7 | Customer 10 | Customer 13 |
| α2 = 1 | Customer 2 | Customer 5 | Customer 8 | Customer 11 | Customer 14 |
| α3 = 2 | Customer 3 | Customer 6 | Customer 9 | Customer 12 | Customer 15 |
| Control Strategies | Stages | |||
|---|---|---|---|---|
| Pre-Cooling | Response | Recovery | ||
| Optimization Strategies | Optimization of the Room Temperature Setting Within the Adjustable Range | |||
| Conventional strategies | Strategy A | No pre-cooling | Indoor temperature set point up to 27 °C | Indoor temperature set point down to baseline 26 °C |
| Strategy B | No pre-cooling | Indoor temperature set point up to 28 °C | Indoor temperature set point down to baseline 26 °C | |
Disclaimer/Publisher’s Note: The statements, opinions and data contained in all publications are solely those of the individual author(s) and contributor(s) and not of MDPI and/or the editor(s). MDPI and/or the editor(s) disclaim responsibility for any injury to people or property resulting from any ideas, methods, instructions or products referred to in the content. |
© 2025 by the authors. Licensee MDPI, Basel, Switzerland. This article is an open access article distributed under the terms and conditions of the Creative Commons Attribution (CC BY) license (https://creativecommons.org/licenses/by/4.0/).
Share and Cite
Li, B.; Wang, Y.; Jiang, H.; Wang, R.; Lu, S. Demand Response Strategy Optimization Method Based on Differentiated Comprehensive Benefit Model of Air-Conditioning Customers. Buildings 2025, 15, 1065. https://doi.org/10.3390/buildings15071065
Li B, Wang Y, Jiang H, Wang R, Lu S. Demand Response Strategy Optimization Method Based on Differentiated Comprehensive Benefit Model of Air-Conditioning Customers. Buildings. 2025; 15(7):1065. https://doi.org/10.3390/buildings15071065
Chicago/Turabian StyleLi, Boyang, Yuhan Wang, Houze Jiang, Ran Wang, and Shilei Lu. 2025. "Demand Response Strategy Optimization Method Based on Differentiated Comprehensive Benefit Model of Air-Conditioning Customers" Buildings 15, no. 7: 1065. https://doi.org/10.3390/buildings15071065
APA StyleLi, B., Wang, Y., Jiang, H., Wang, R., & Lu, S. (2025). Demand Response Strategy Optimization Method Based on Differentiated Comprehensive Benefit Model of Air-Conditioning Customers. Buildings, 15(7), 1065. https://doi.org/10.3390/buildings15071065