
Development, Performance, and Mechanism of Fluidized Solidified Soil Treated with Multi-Source Industrial Solid Waste Cementitious Materials


Abstract
1. Introduction
2. Materials
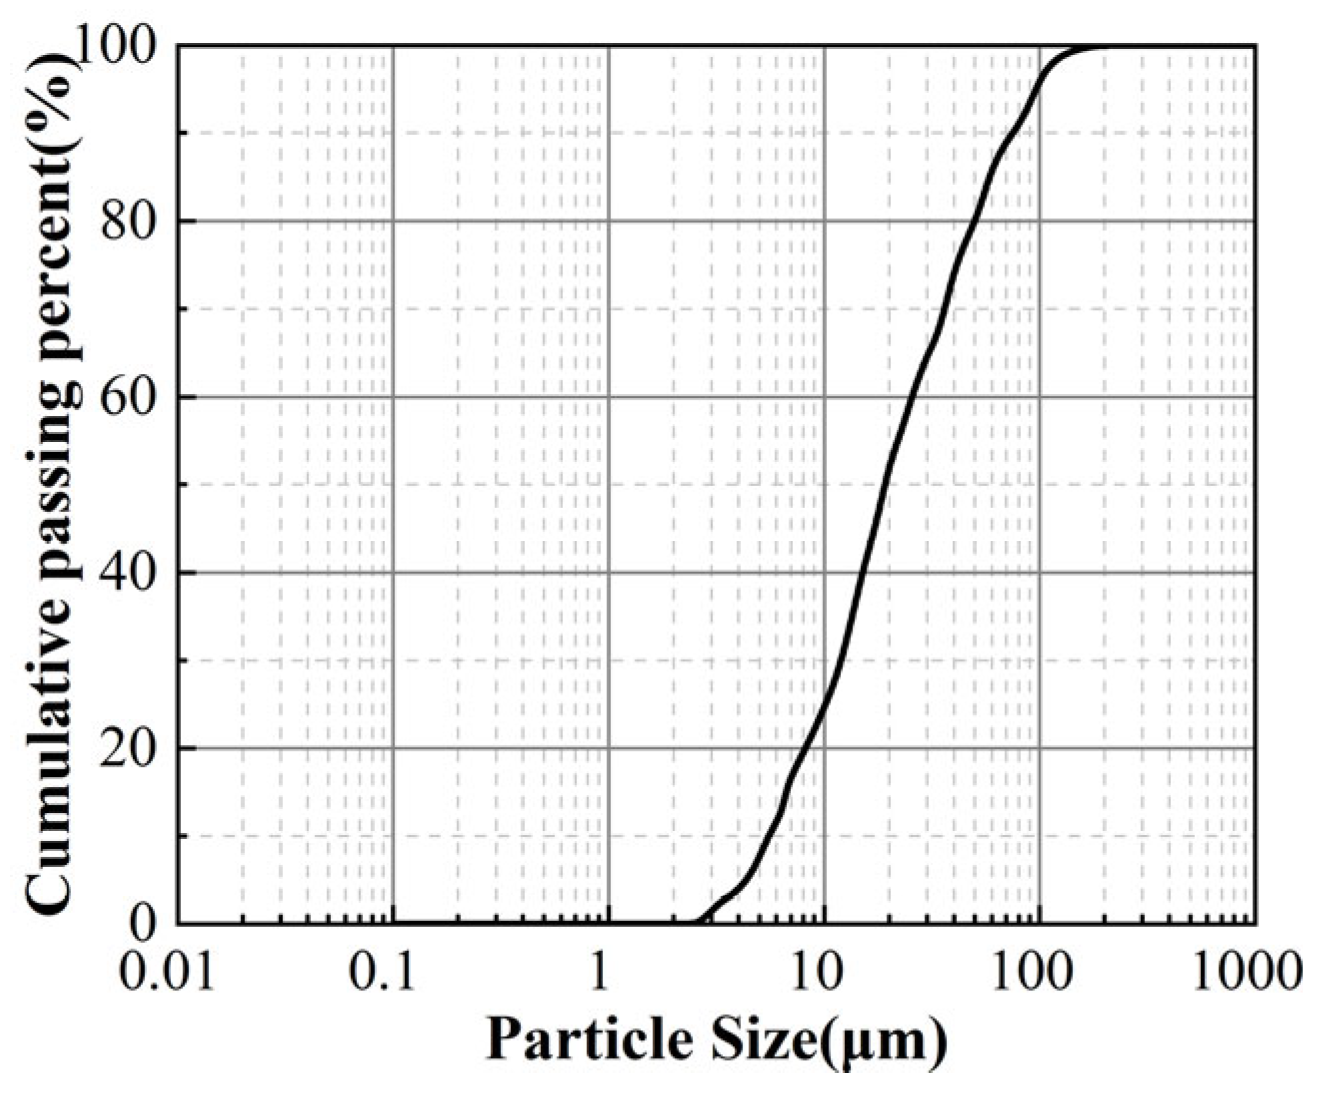
2.1. Soil
2.2. Raw Materials of MSWC
3. Experimental Methods
3.1. Test Method
3.1.1. Unconfined Compressive Strength (UCS) Test
3.1.2. Flow Expansion Test
3.1.3. Drying Shrinkage Test
3.1.4. On-Site Test
3.1.5. X-Ray Diffraction (XRD) Test
3.1.6. Scanning Electron Microscope (SEM) Test
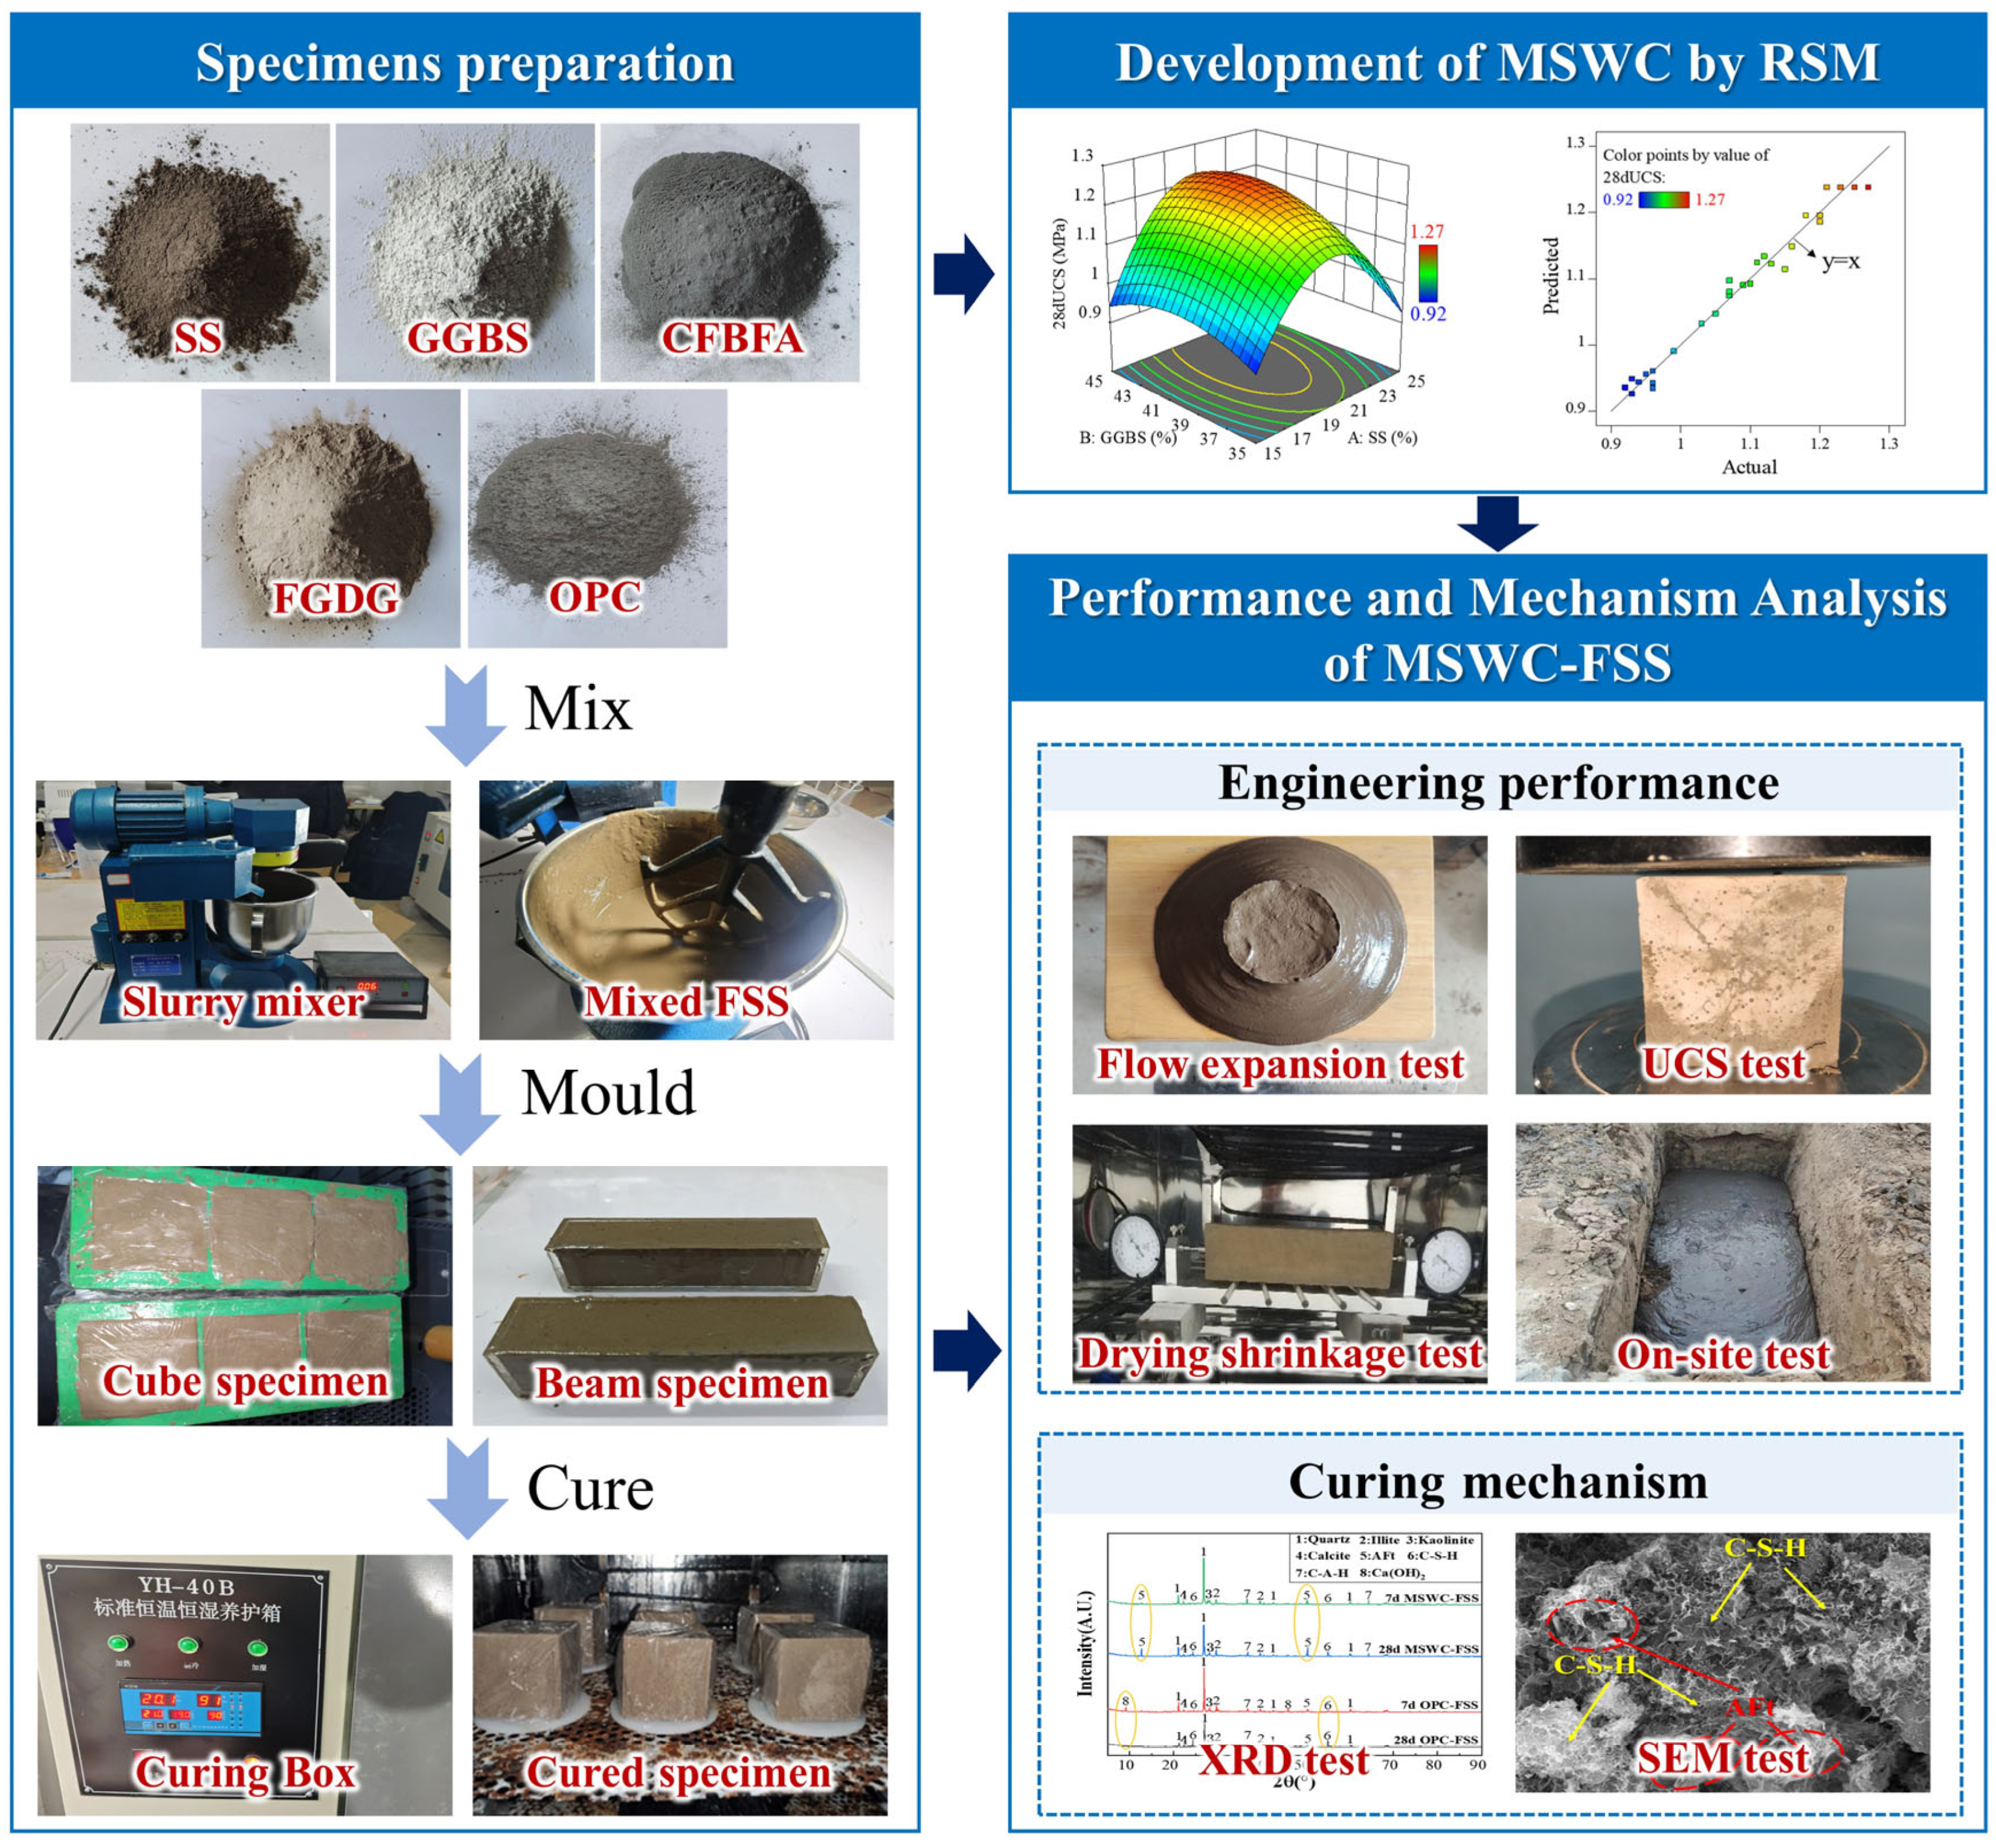
3.1.7. Specimen Preparation
3.2. Experimental Program and Flowchart
3.3. Experimental Design and Statistical Analysis
4. Results and Discussion
4.1. Development of MSWC by RSM
4.1.1. BBD Experimental Results
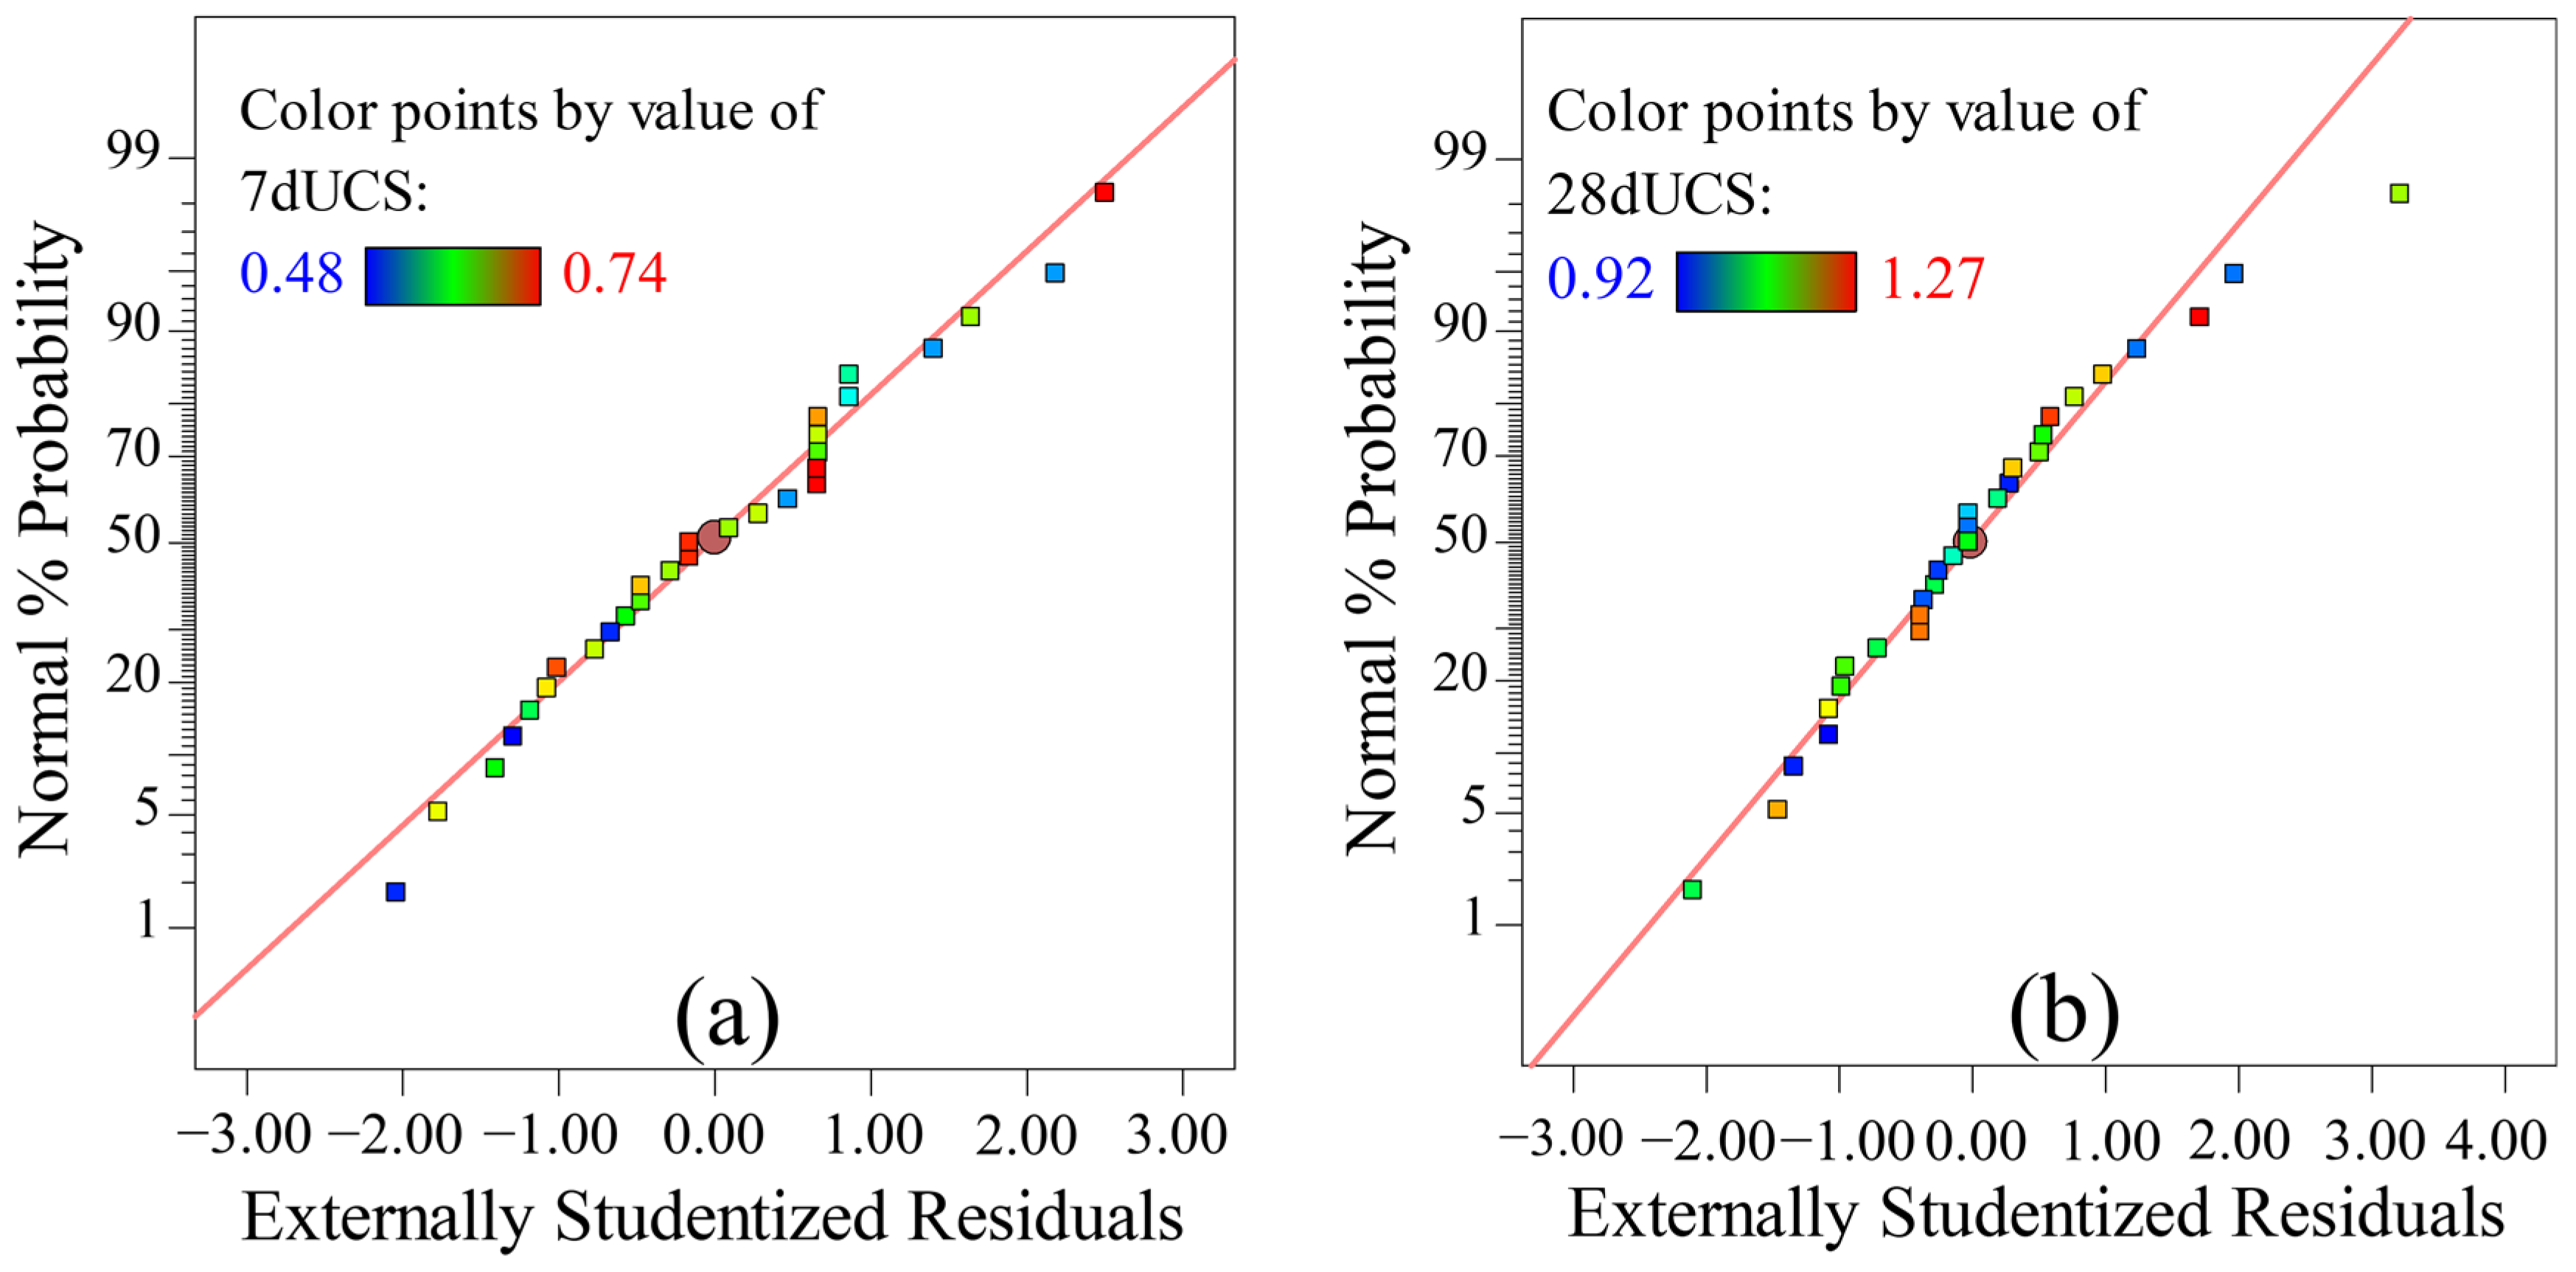
4.1.2. Response Surface Fitting Model
4.1.3. Analysis of Variance (ANOVA)
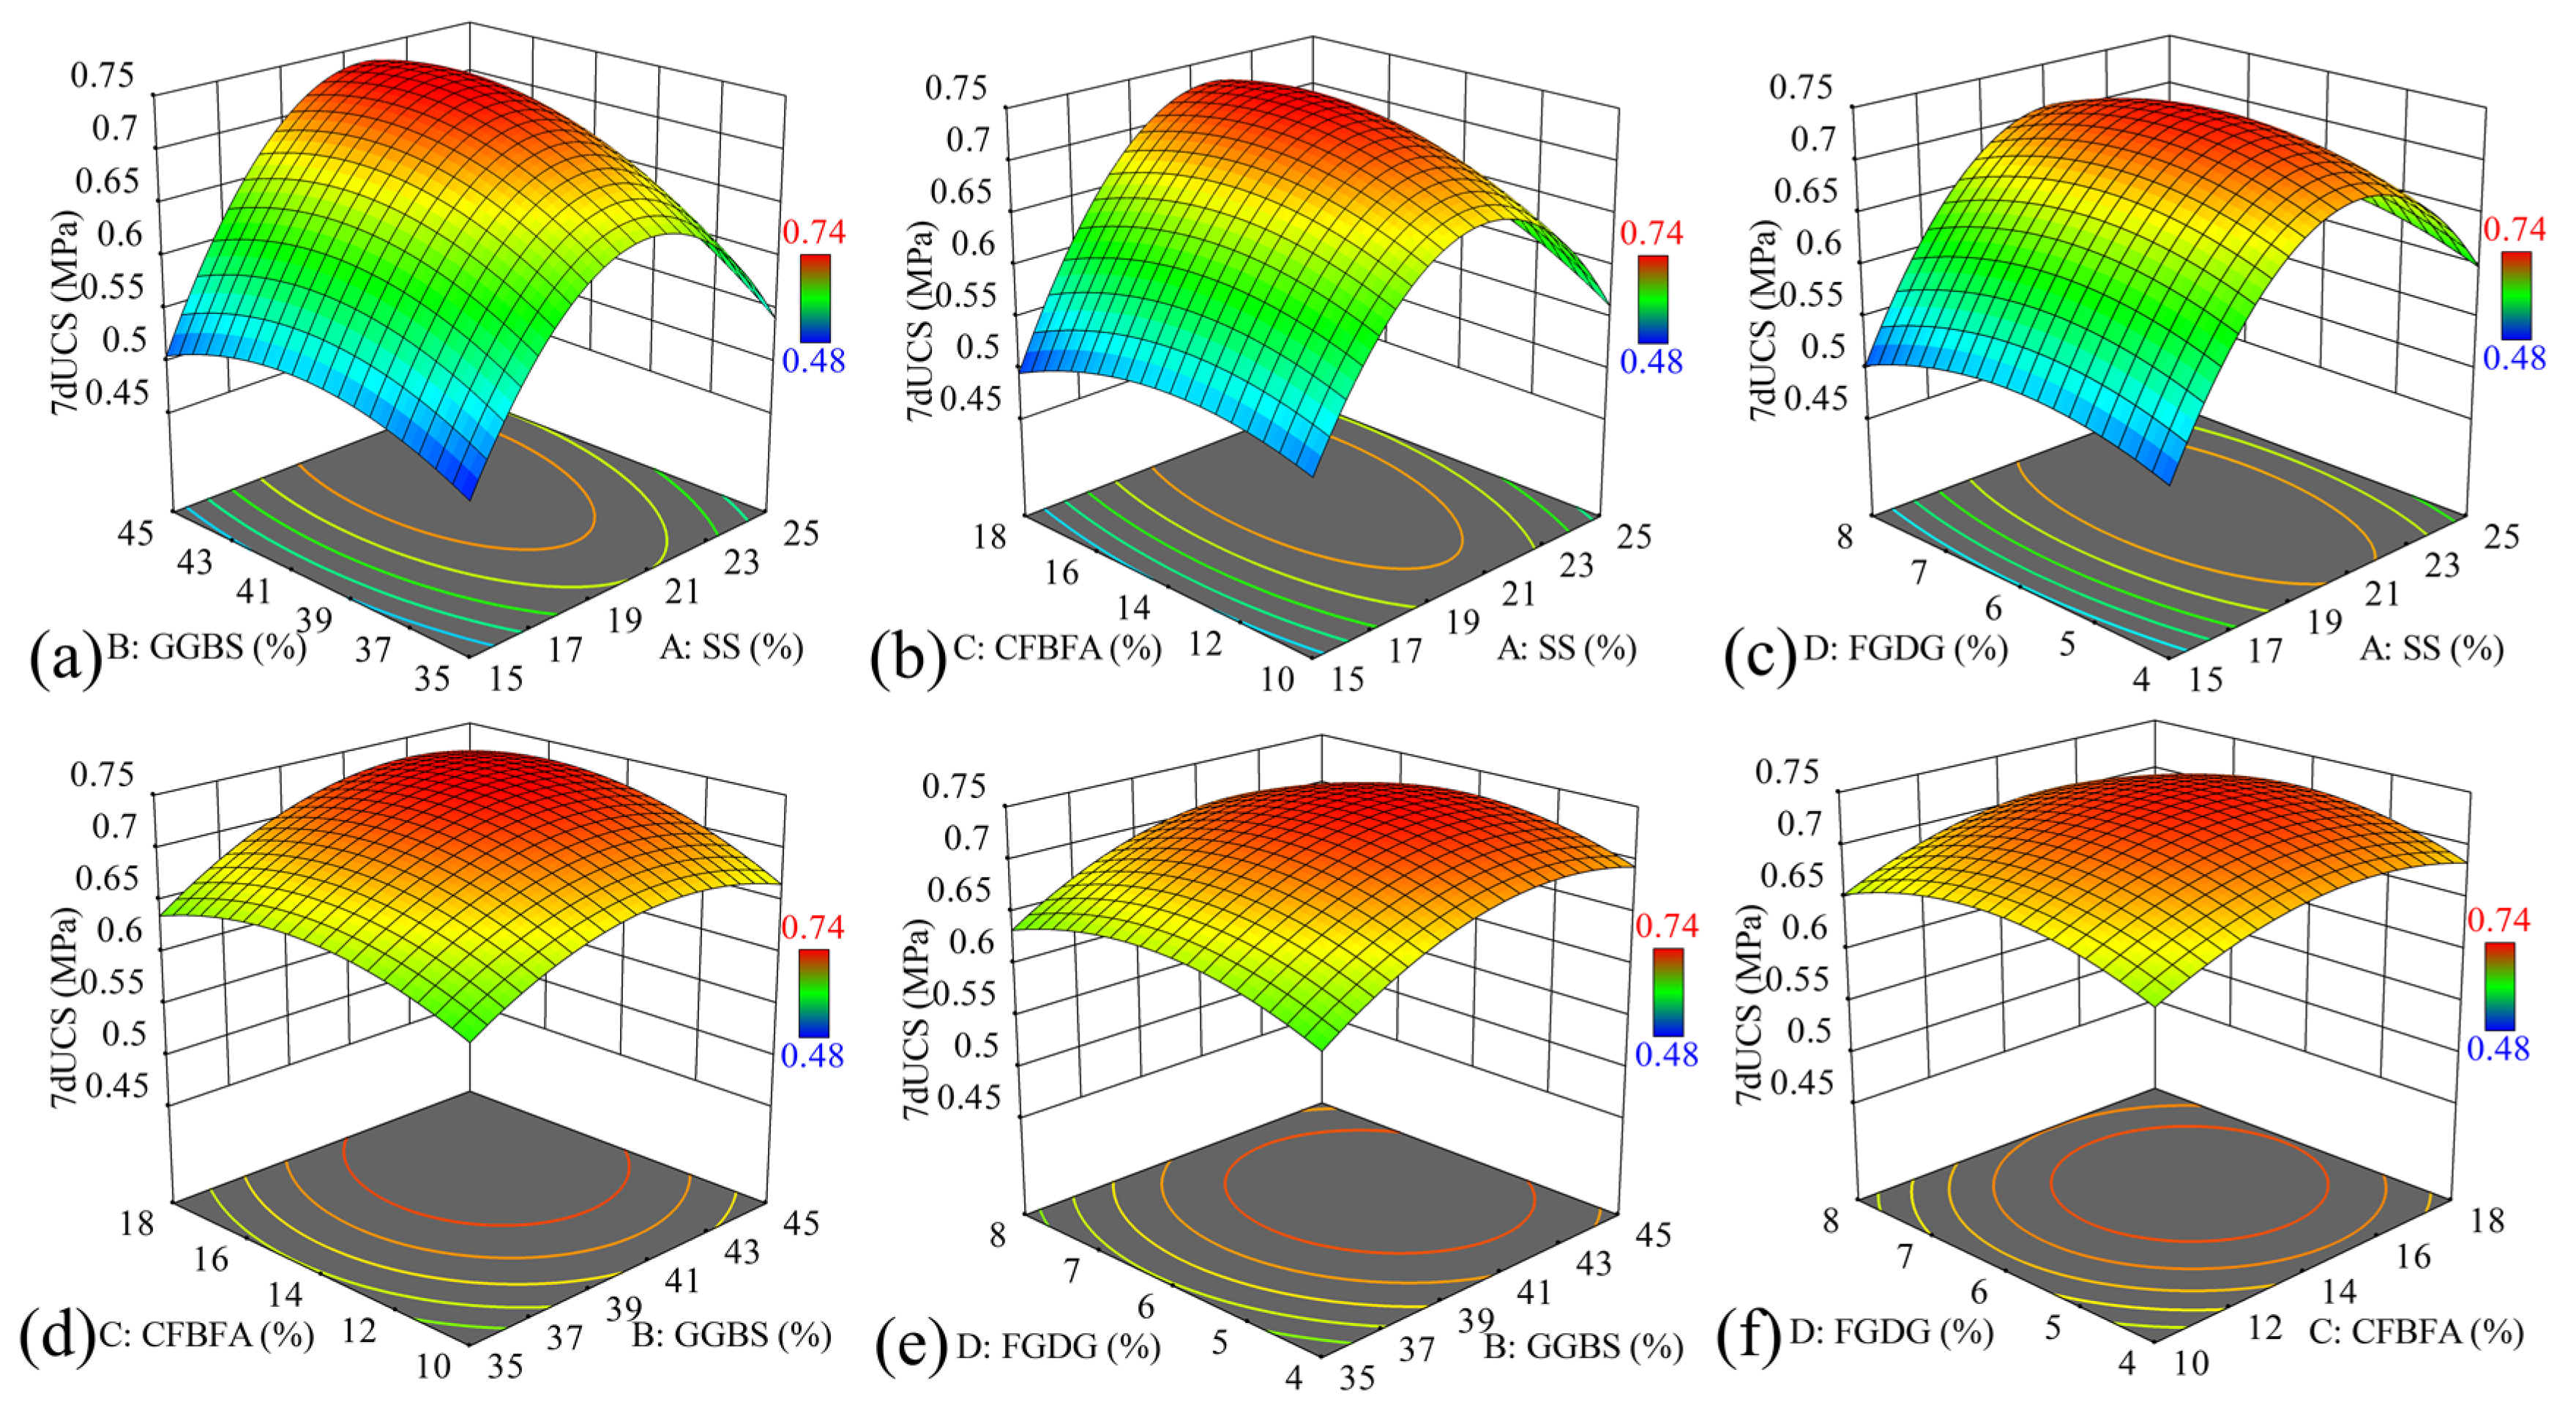
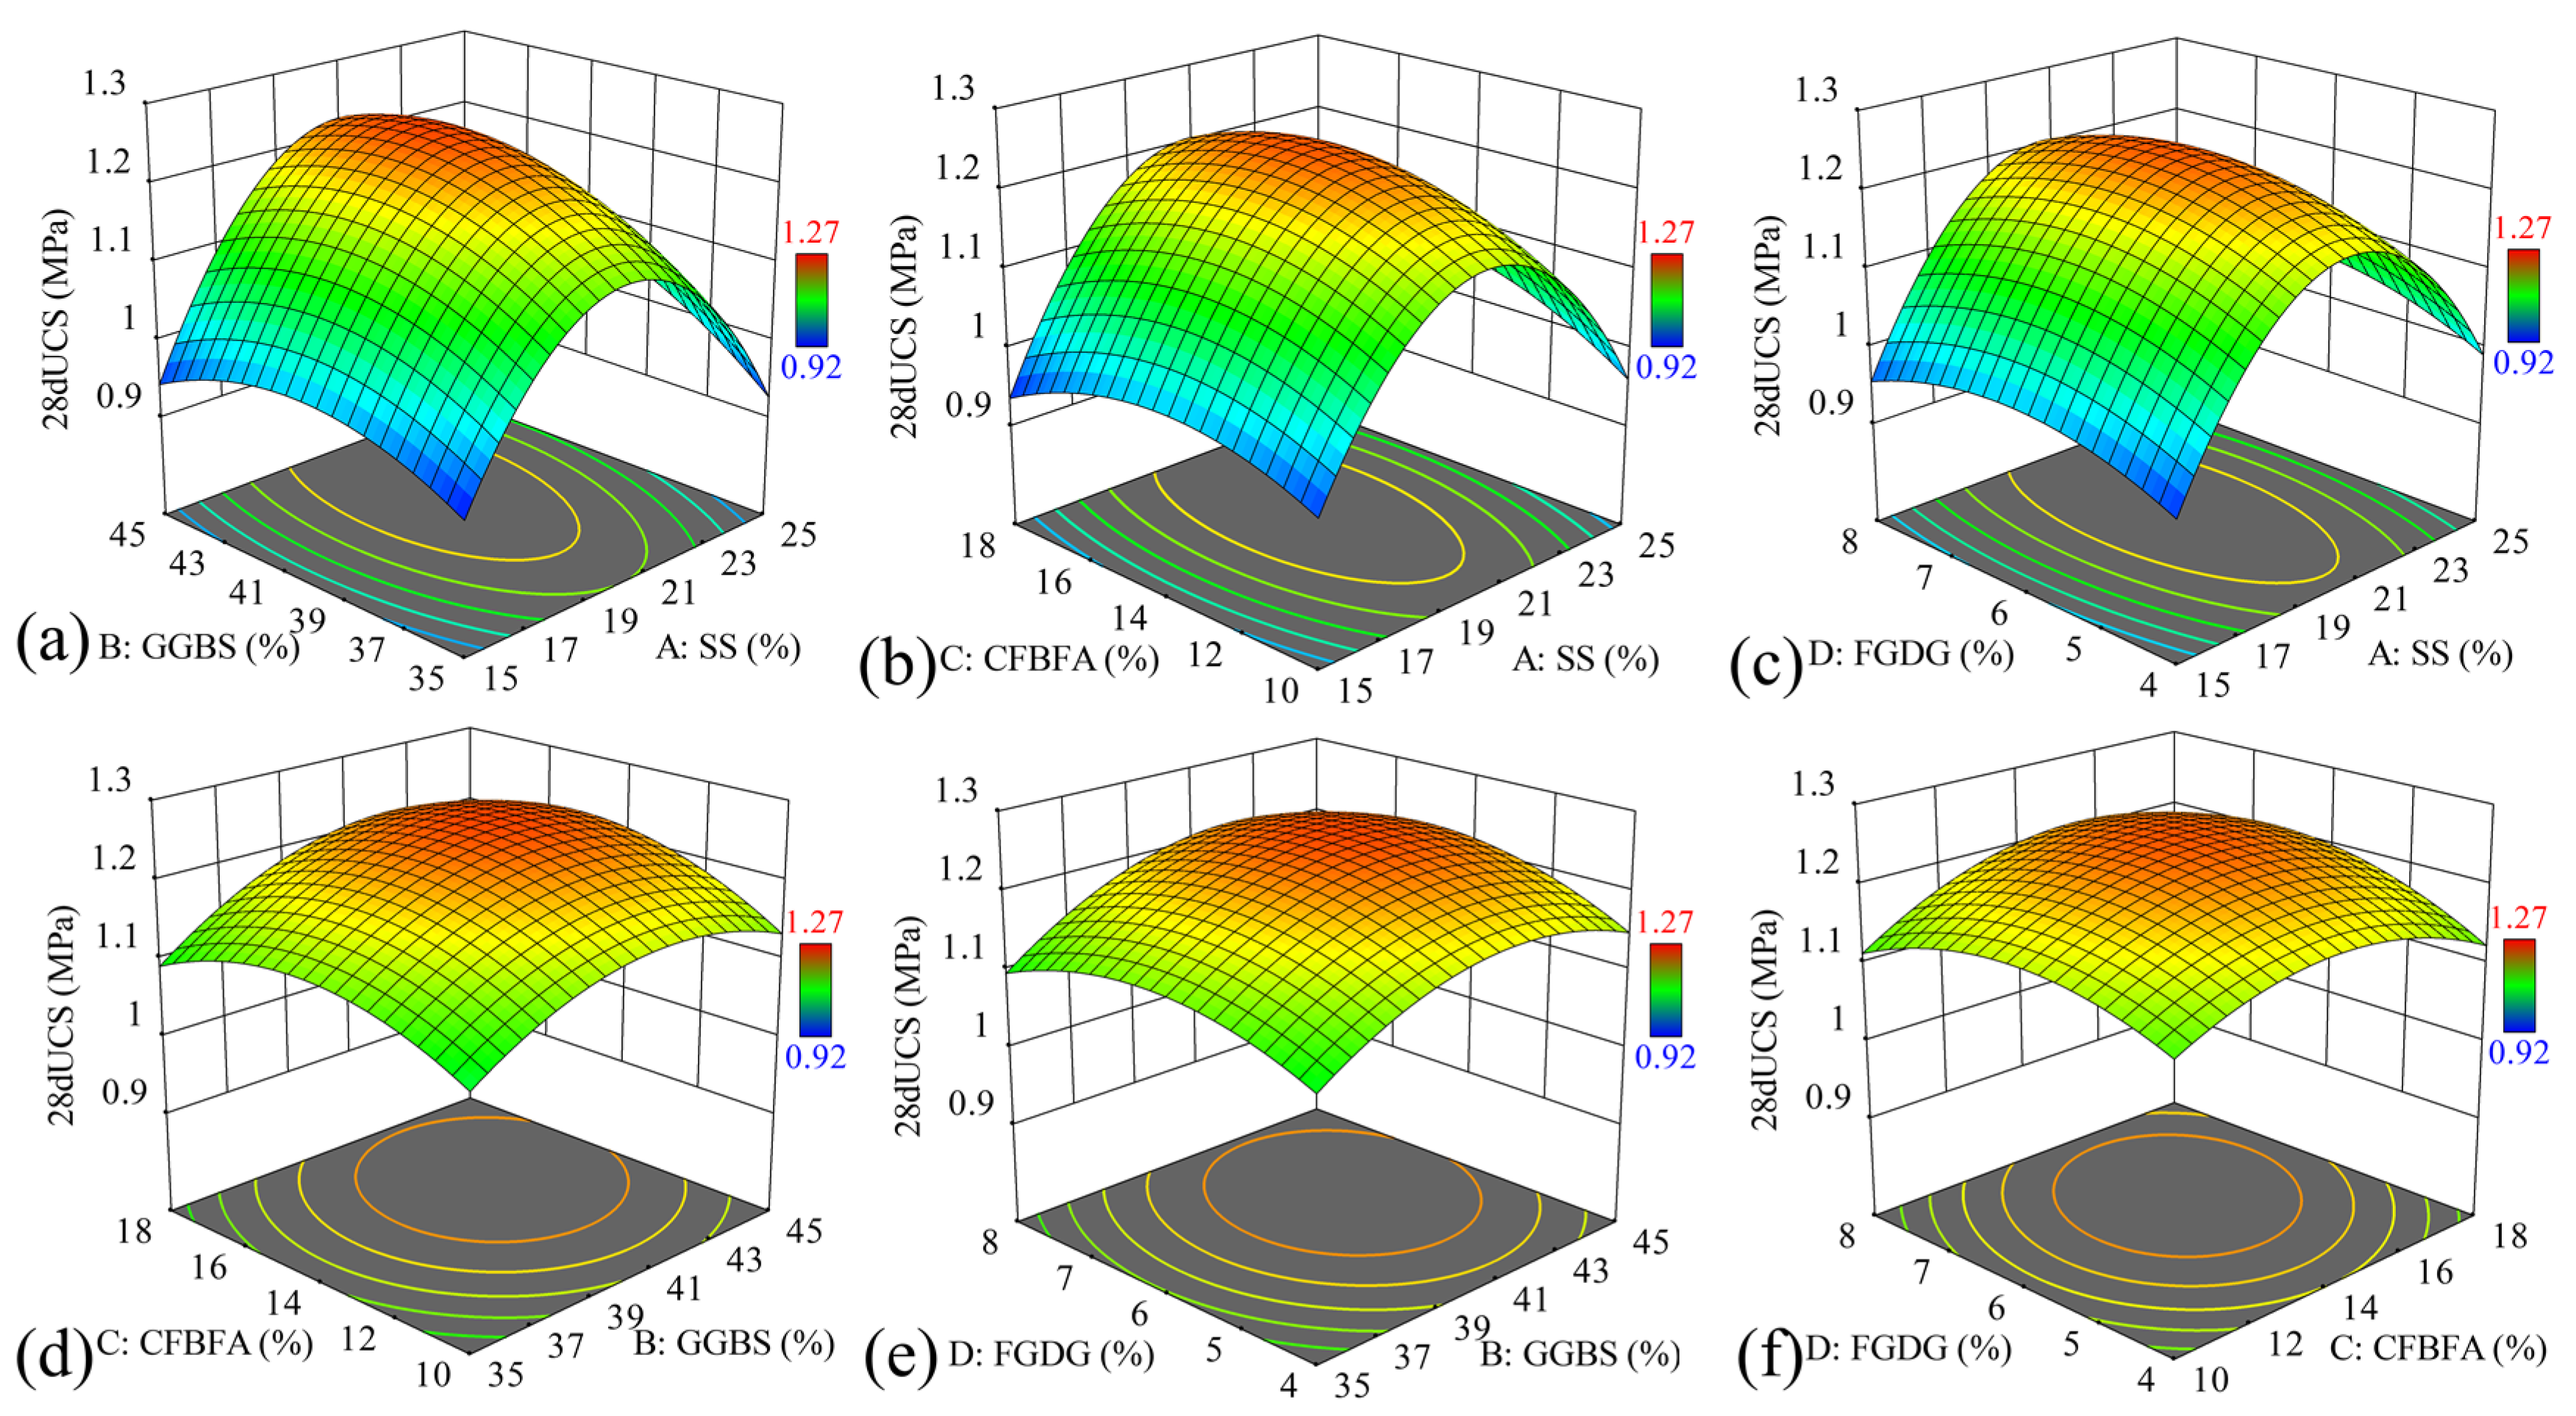
4.1.4. Effect of Solid Waste Dosage on UCS of MSWC-FSS
4.1.5. Optimization and Validation
4.2. Performance and Mechanism Analysis of MSWC-FSS
4.2.1. Flow Expansion
4.2.2. Unconfined Compressive Strength (UCS)
4.2.3. Drying Shrinkage
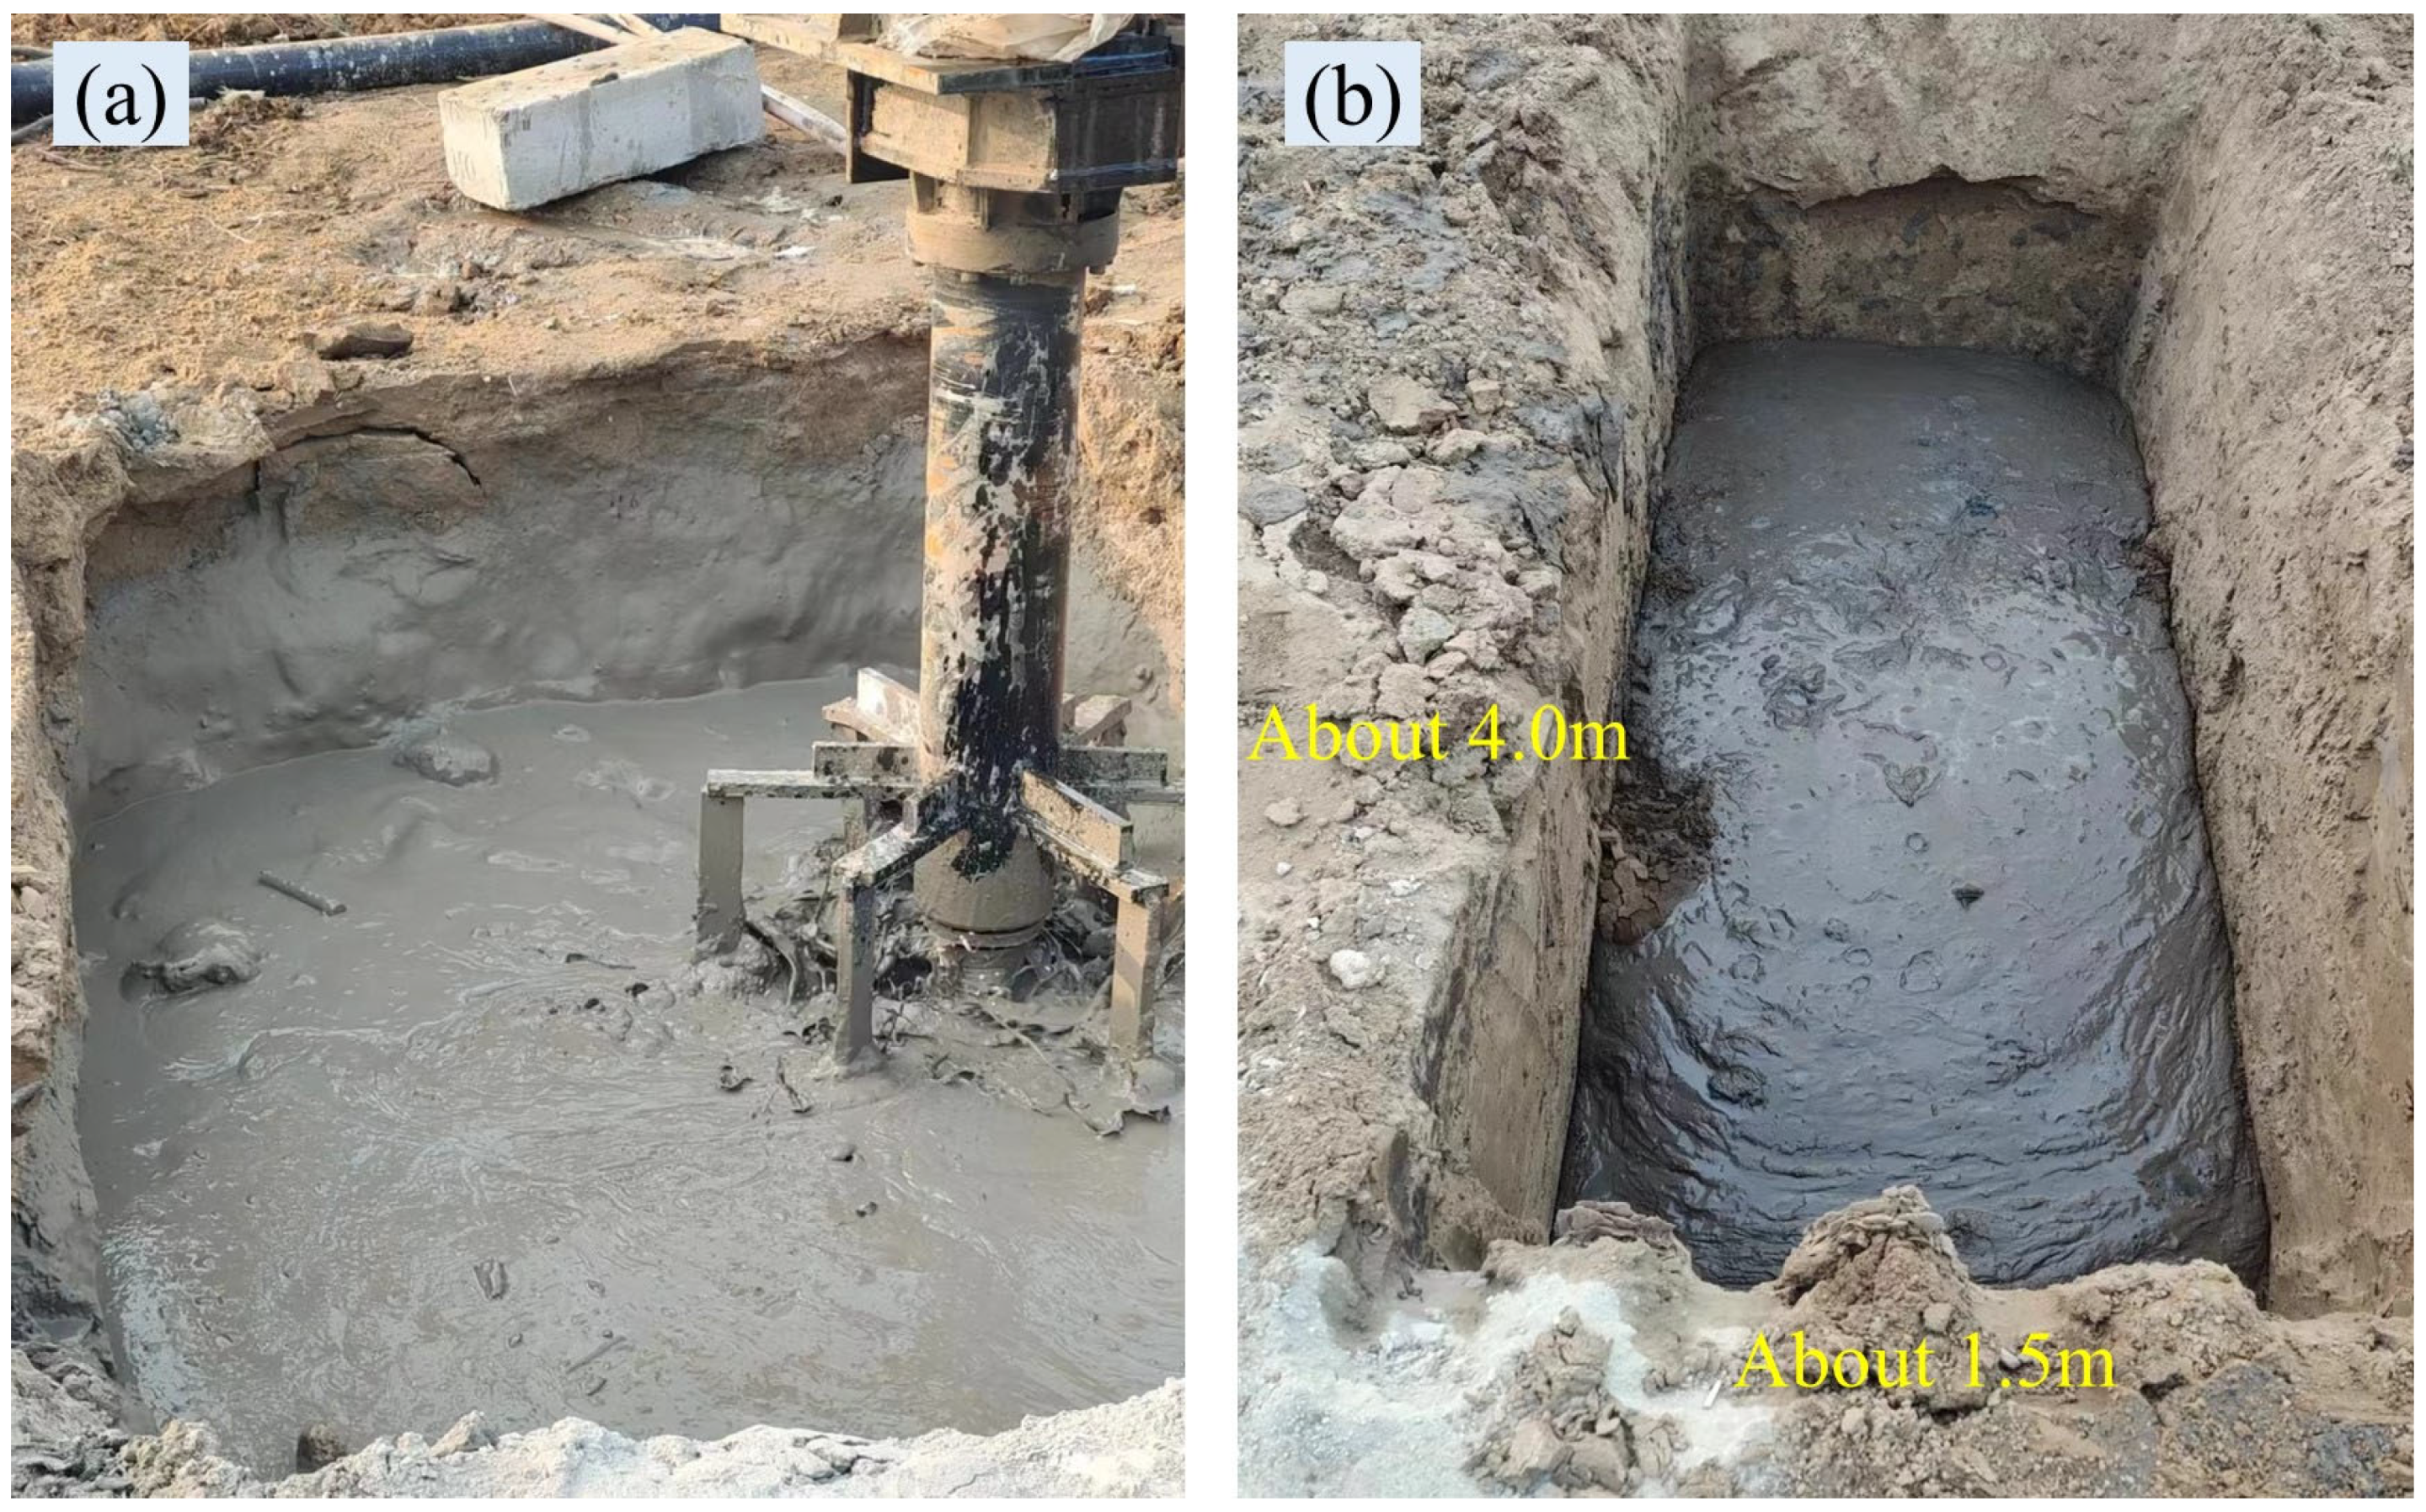
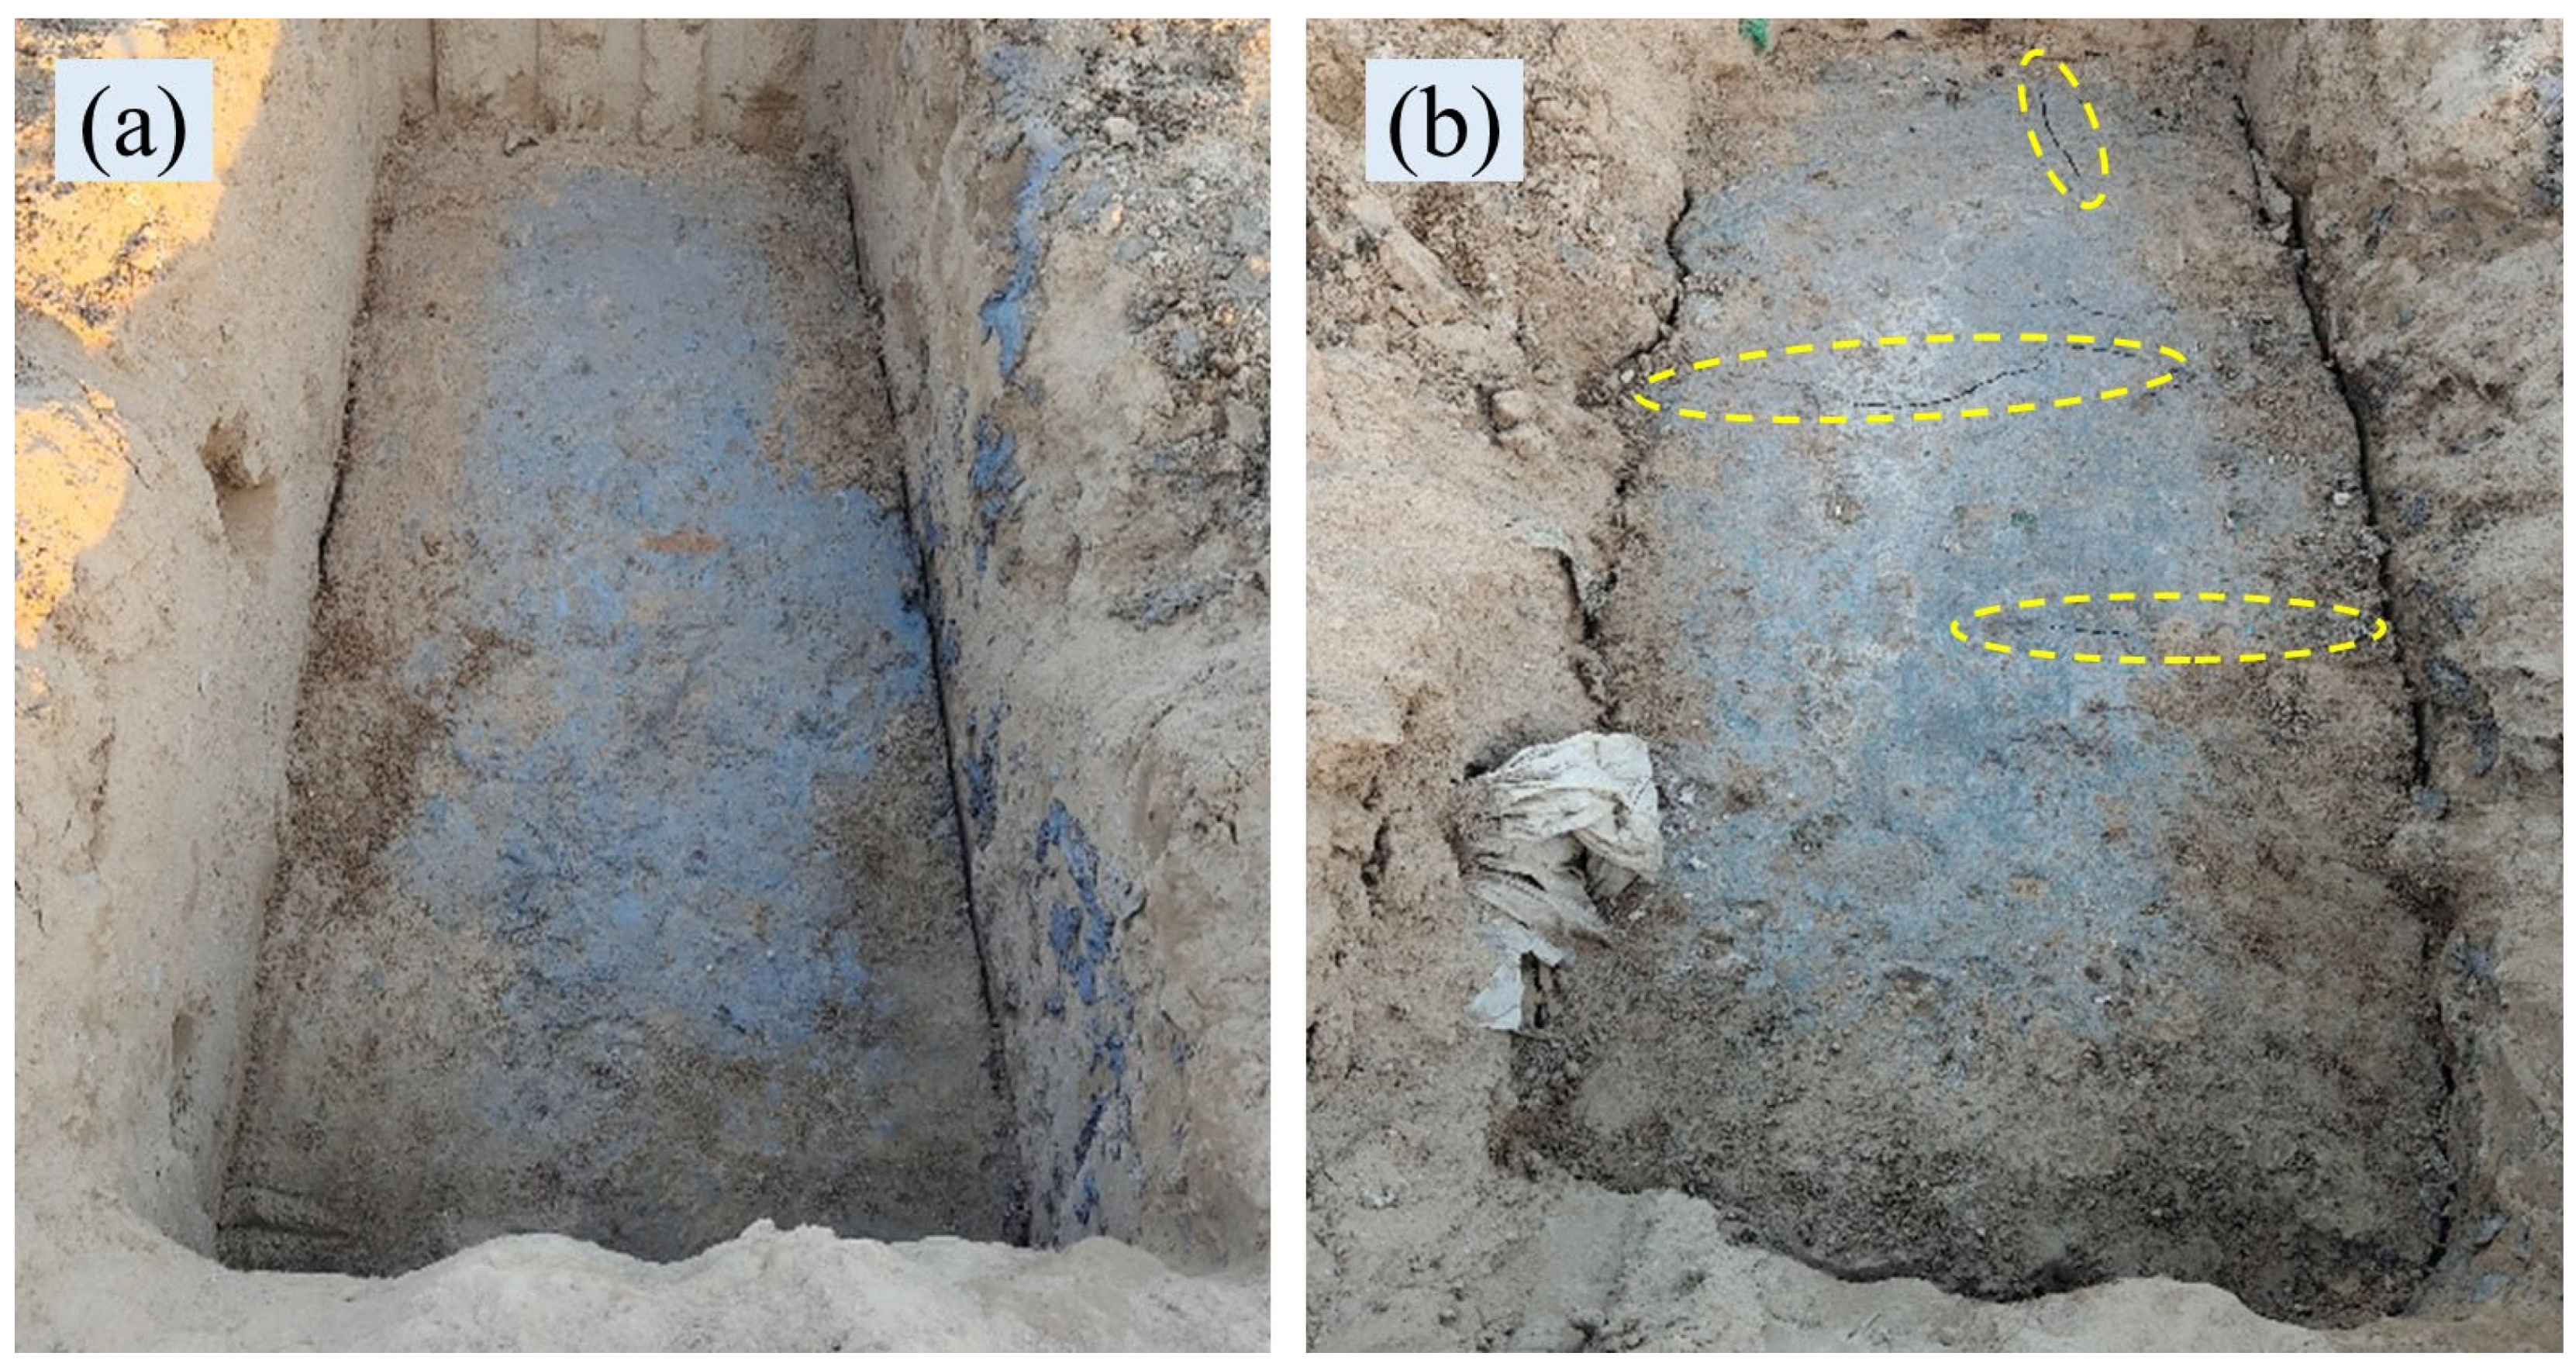
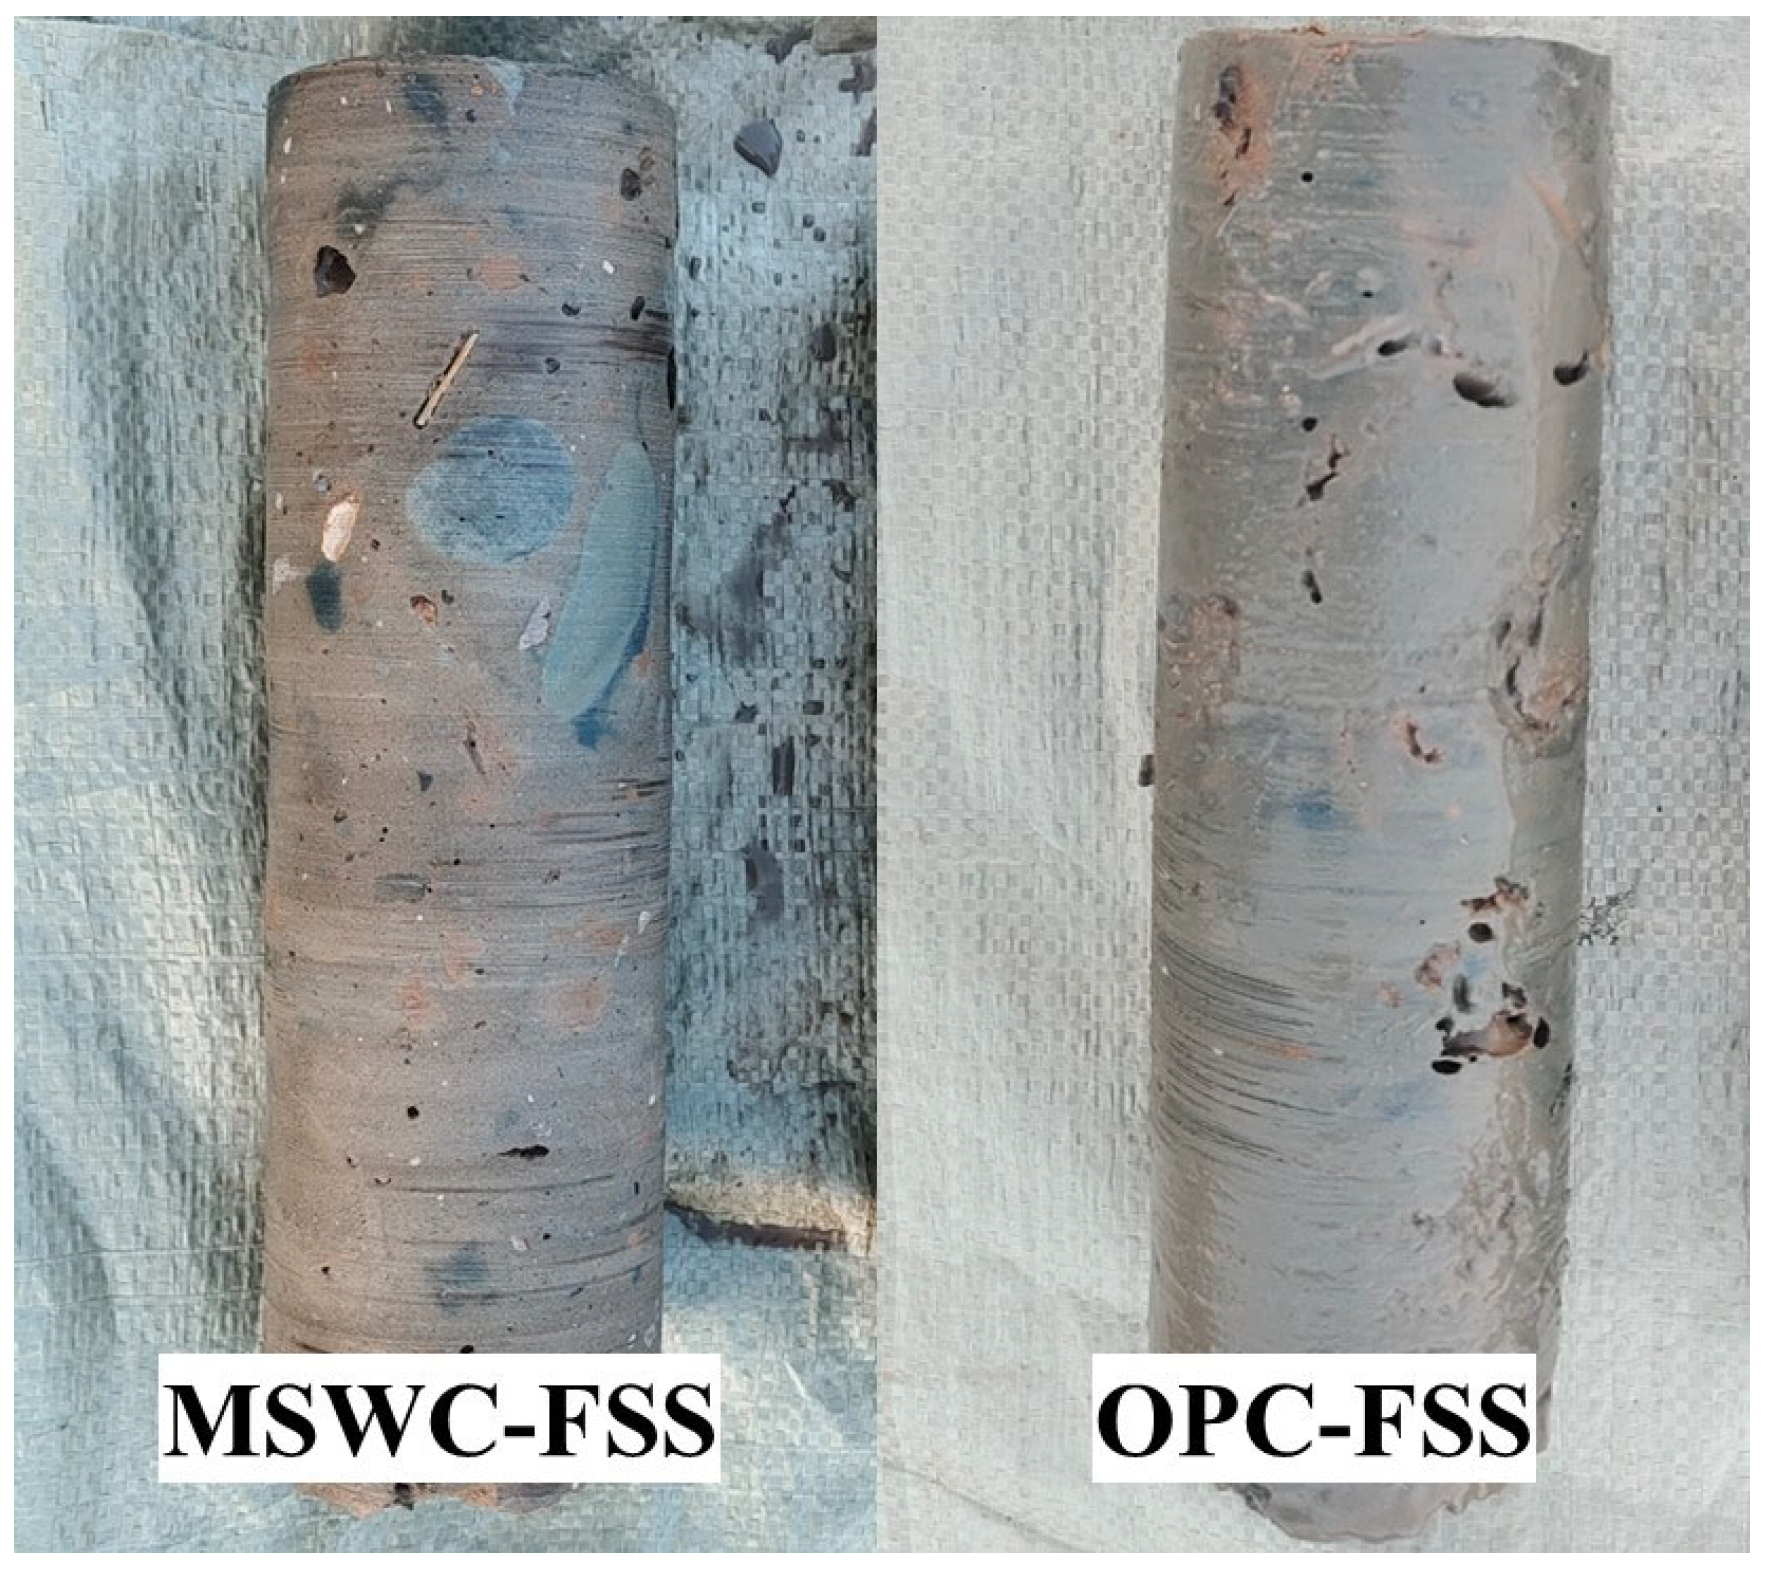
4.2.4. On-Site Test Analysis
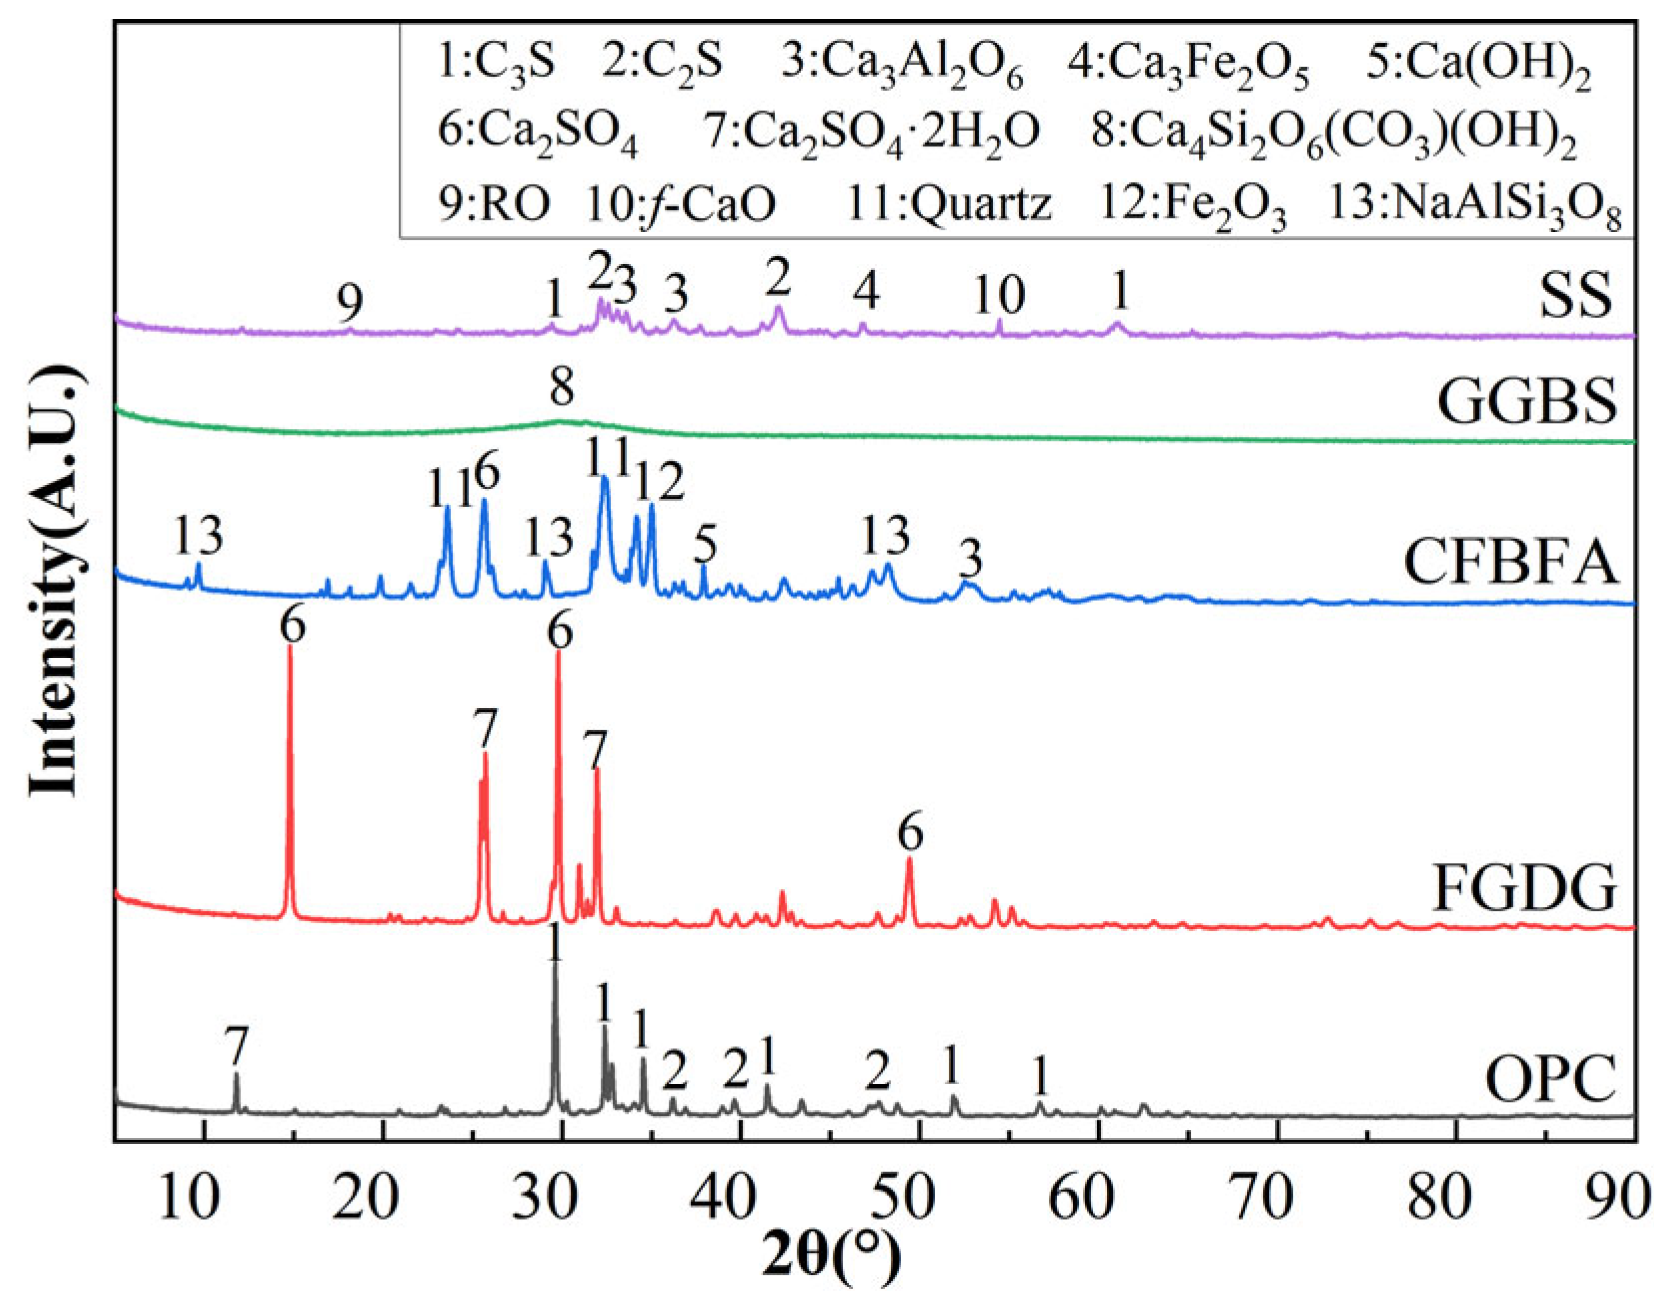
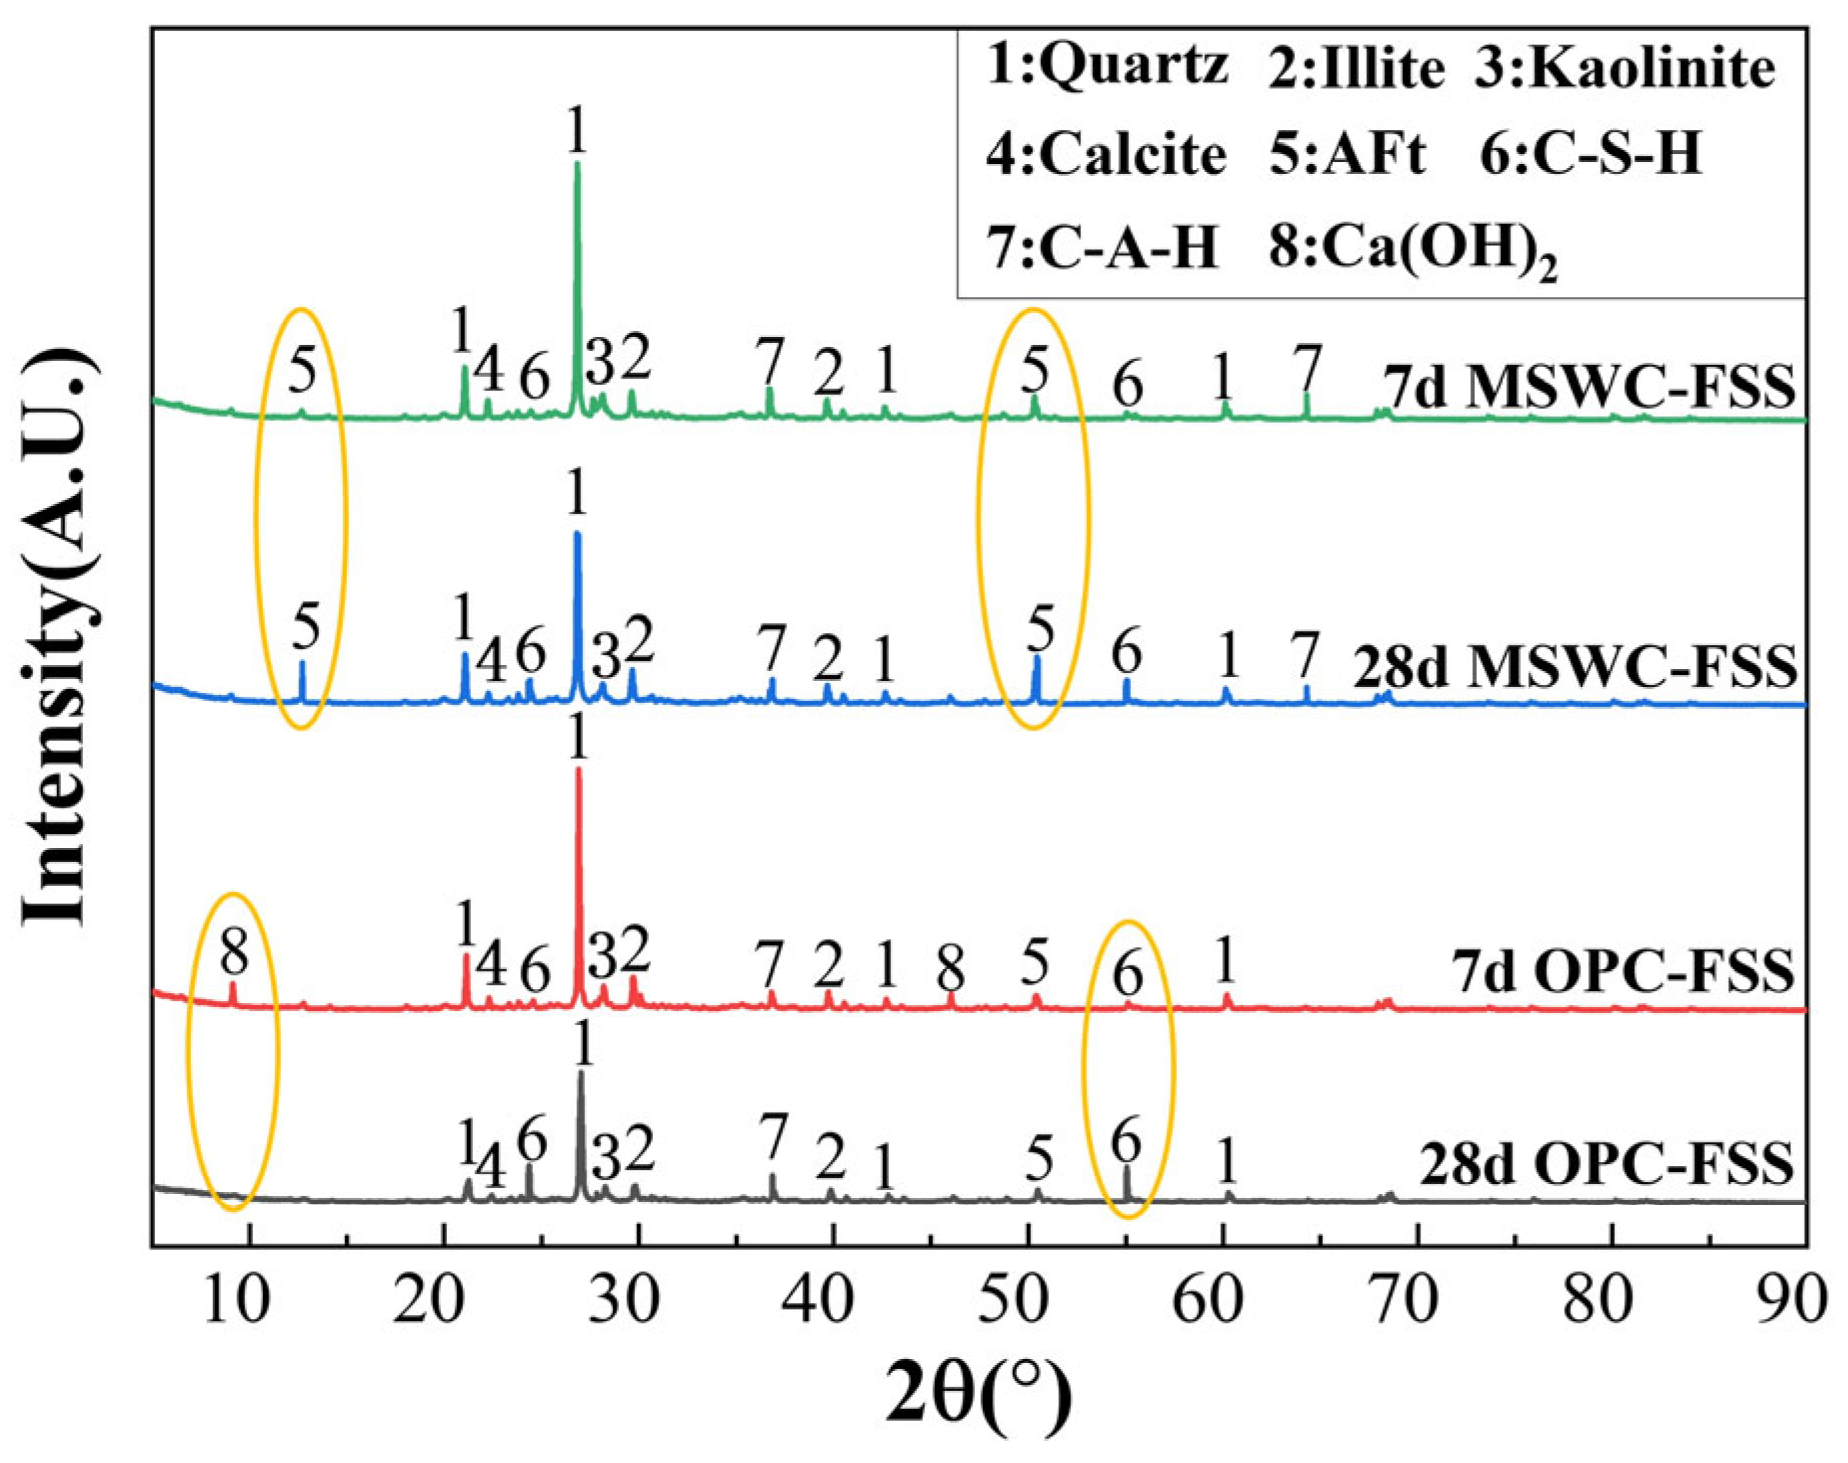
4.2.5. XRD Analysis
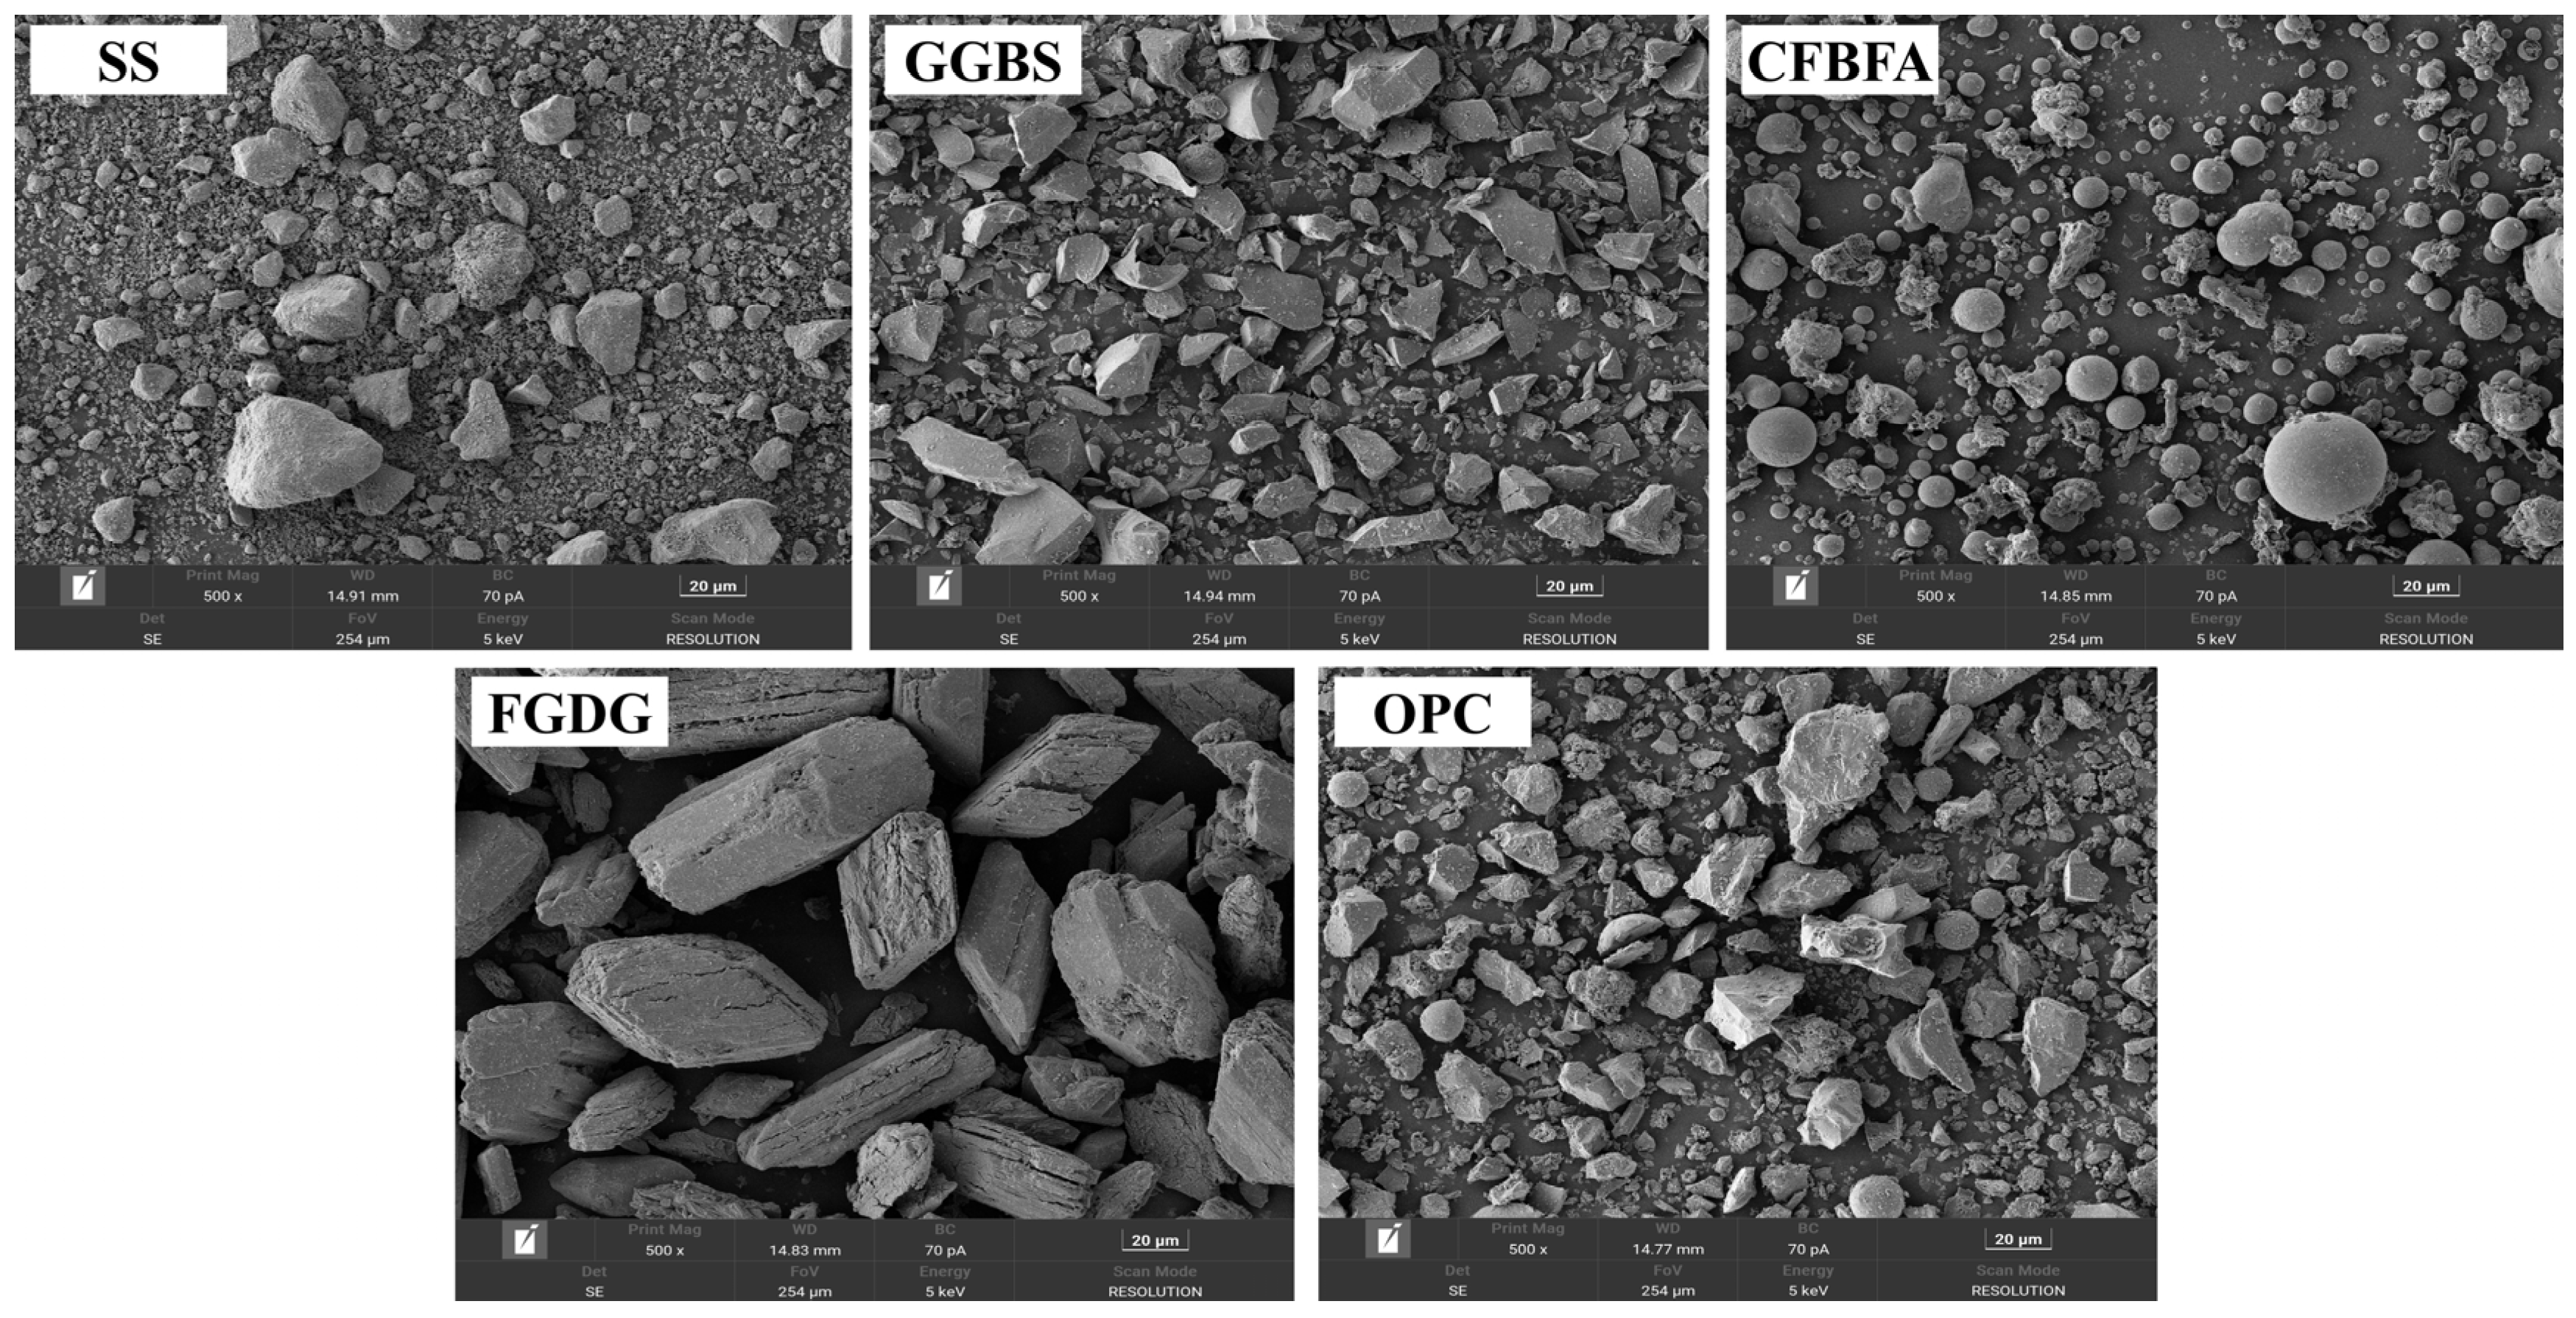
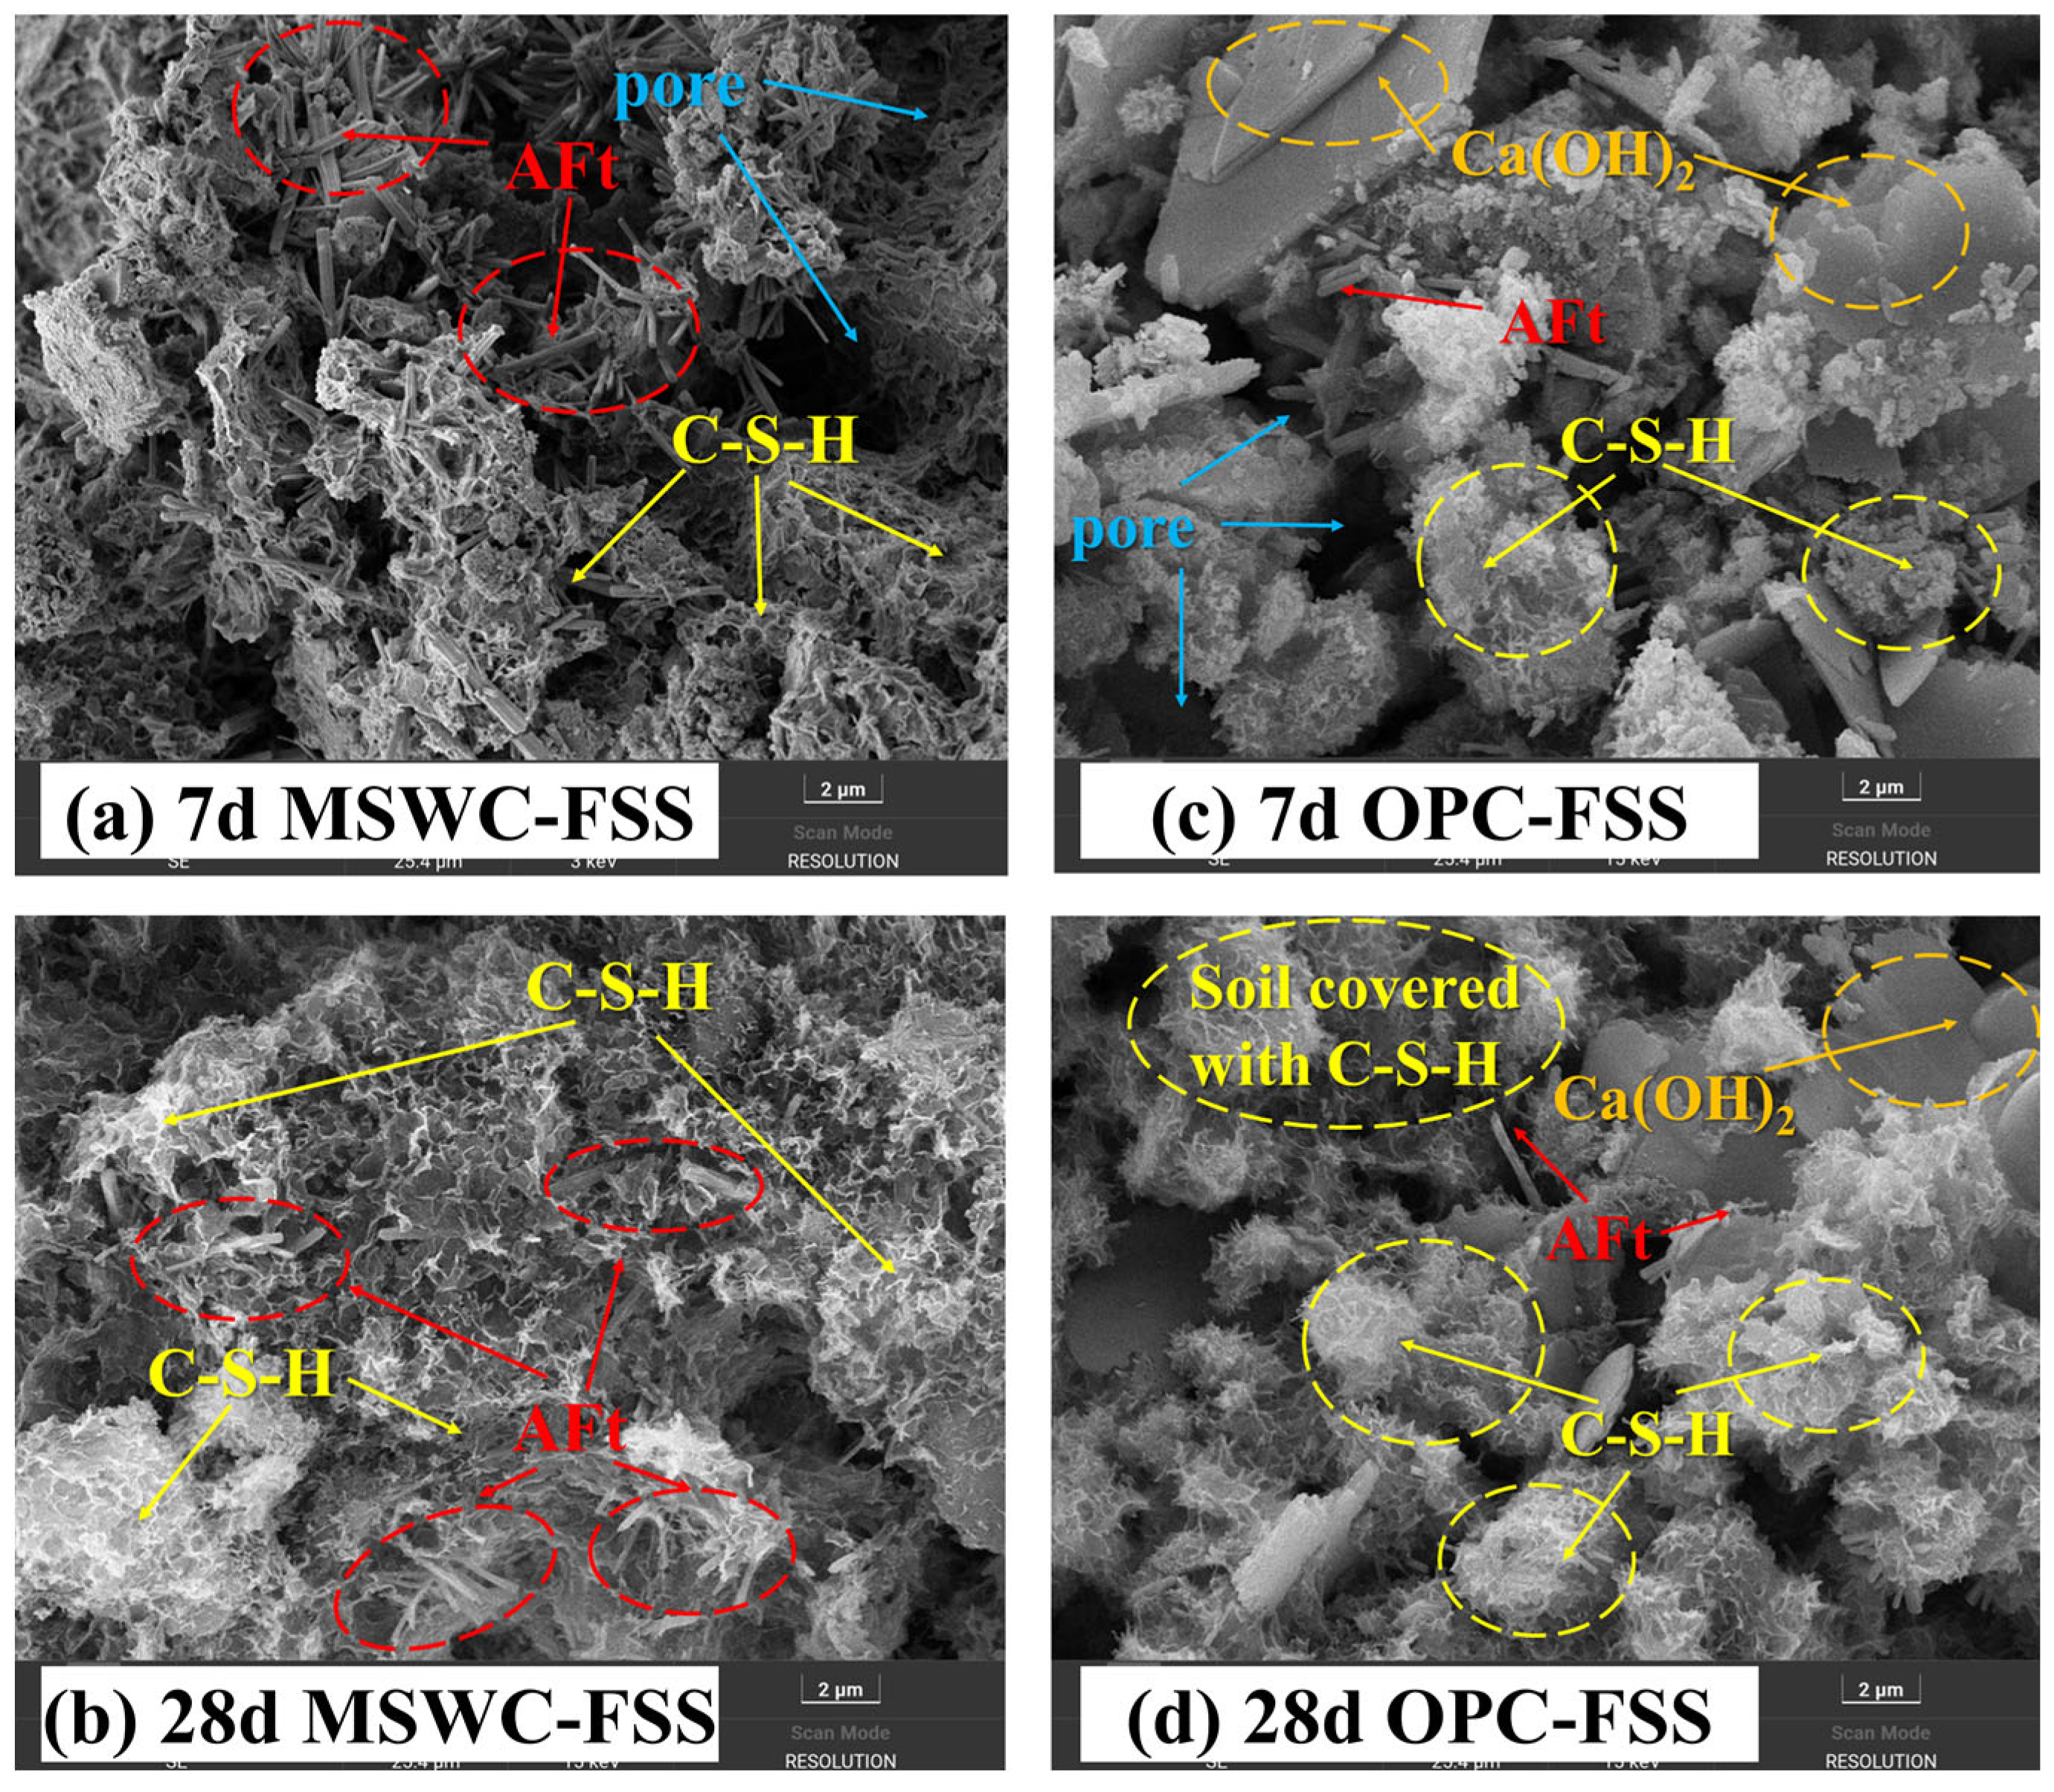
4.2.6. SEM Analysis
5. Conclusions
- (1)
- Based on the BBD of RSM, the high-reliability UCS models of MSWC-FSS were established. The optimal mix ratio of MSWC determined by the models was SS:GGBS:CFBFA:FGDG:OPC = 20:40:15:5:20. SS, GGBS, and CFBFA had an extremely significant impact on UCS of MSWC-FSS, and SS and GGBS played a dominant role in the UCS. The combined interaction effects of SS and GGBS, as well as SS and CFBFA, had a significant influence on UCS of MSWC-FSS.
- (2)
- At the same Cb and Cw, the flow expansion of MSWC-FSS was less than 5% lower than that of OPC-FSS, while the UCS of MSWC-FSS was more than 10% higher than that of OPC-FSS. MSWC-FSS with a Cw of 45% and a Cb of 15% could simultaneously meet the requirements for slump and strength in the Chinese standard and had better resistance to dry shrinkage than OPC-FSS. The above conclusion has been confirmed by both laboratory and on-site tests, indicating that MSWC was more suitable for FSS than OPC.
- (3)
- The chemical composition and microstructure analysis showed that the curing mechanism of MSWC-FSS and OPC-FSS was similar. However, compared with OPC-FSS, MSWC-FSS generated more AFt with an expansion effect during the solidification process, making MSWC-FSS denser. This was the reason why MSWC-FSS had stronger strength and resistance to drying shrinkage.
Author Contributions
Funding
Data Availability Statement
Conflicts of Interest
References
- Zhou, Y.X.; Liu, Q.; Wang, Z.Q.; Hao, T.; Leng, F.G. Properties of Cementitious Materials Without Clinker for Fluid Solidified Soil. Bull. Chin. Ceram. Soc. 2022, 41, 3548–3555. (In Chinese) [Google Scholar] [CrossRef]
- Liu, Q. Experimental study on the preparation of fluid backfillmaterial by solid waste cementitious material curing shale soil. Master’s Thesis, Zhengzhou University, Zhenzhou, China, 2022. (In Chinese). [Google Scholar]
- Shigematsu, Y.; Inazumi, S.; Hashimoto, R.; Yamauchi, H. Experimental study on properties of liquefied stabilized soil produced with different types of solidifiers and thickeners. Case Stud. Constr. Mater. 2023, 19, e02407. [Google Scholar] [CrossRef]
- Shigematsu, Y.; Inazumi, S.; Chaiprakaikeow, S.; Nontananandh, S. Properties of High-Flowability Liquefied Stabilized Soil Made of Recycled Construction Sludge. Recycling 2023, 8, 67. [Google Scholar] [CrossRef]
- Gartner, E. Industrially interesting approaches to “low-CO2” cements. Cem. Concr. Res. 2004, 34, 1489–1498. [Google Scholar] [CrossRef]
- Hanein, T.; Galvez-Martos, J.L.; Bannerman, M.N. Carbon footprint of calcium sulfoaluminate clinker production. J. Clean. Prod. 2018, 172, 2278–2287. [Google Scholar] [CrossRef]
- Amini, O.; Ghasemi, M. Laboratory study of the effects of using magnesium slag on the geotechnical properties of cement stabilized soil. Constr. Build. Mater. 2019, 223, 409–420. [Google Scholar] [CrossRef]
- Zhou, Y.X.; Wang, J.Z. Principle of ready-mixed solidified soil and its prospects for engineering application. New Build. Mater. 2019, 46, 117–120. (In Chinese) [Google Scholar]
- Wu, J.; Deng, Y.F.; Zhang, G.P.; Zhou, A.N.; Tan, Y.Z.; Xiao, H.L.; Zheng, Q.S. A Generic Framework of Unifying Industrial By-products for Soil Stabilization. J. Clean. Prod. 2021, 321, 128920. [Google Scholar] [CrossRef]
- Wu, J.; Deng, Z.H.; Deng, Y.F.; Zhou, A.; Zhang, Y.S. Interaction between cement clinker constituents and clay minerals and their influence on the strength of cement-based stabilized soft clay. Can. Geotech. J. 2022, 59, 889–900. [Google Scholar] [CrossRef]
- Yang, W.F.; Xue, Y.J.; Wu, S.P.; Xiao, Y.; Zhou, M. Performance investigation and environmental application of basic oxygen furnace slag-Rice husk ash based composite cementitious materials. Constr. Build. Mater. 2016, 123, 493–500. [Google Scholar] [CrossRef]
- Peng, L.; Chen, B. Study on the basic properties and mechanism of waste sludge solidified by magnesium phosphate cement containing different active magnesium oxide. Constr. Build. Mater. 2021, 281, 122609. [Google Scholar] [CrossRef]
- Kang, P.; Zhang, H.; Duan, H.B. Characterizing the implications of waste dumping surrounding the Yangtze River economic belt in China. J. Hazard. Mater. 2020, 383, 121207. [Google Scholar] [CrossRef] [PubMed]
- Xie, J.W.; Zhang, J.H.; Cao, Z.; Blom, J.; Vuye, C.; Gu, F. Feasibility of using building-related construction and demolition waste-derived geopolymer for subgrade soil stabilization. J. Clean. Prod. 2024, 450, 142001. [Google Scholar] [CrossRef]
- Gao, W.H.; Zhou, W.T.; Lyu, X.; Liu, X.; Su, H.L.; Li, C.M.; Wang, H. Comprehensive utilization of steel slag: A review. Powder Technol. 2023, 422, 118449. [Google Scholar] [CrossRef]
- Nedunuri, S.; Sertse, S.G.; Muhammad, S. Microstructural study of Portland cement partially replaced with fly ash, ground granulated blast furnace slag and silica fume as determined by pozzolanic activity. Constr. Build. Mater. 2020, 238, 117561. [Google Scholar] [CrossRef]
- Wan, Y.; Hui, X.M.N.; He, X.X.; Li, J.S.; Xue, J.F.; Feng, D.Z.; Liu, X.L.; Wang, S.Q. Performance of green binder developed from flue gas desulfurization gypsum incorporating Portland cement and large-volume fly ash. Constr. Build. Mater. 2022, 348, 128679. [Google Scholar] [CrossRef]
- Zhang, W.; Gu, J.R.; Zhou, X.; Li, Y.; Wang, Y.G.; Xue, Y.; Liu, X.M. Circulating fluidized bed fly ash based multi-solid wastes road base materials: Hydration characteristics and utilization of SO3 and f -CaO. J. Clean. Prod. 2021, 316, 128355. [Google Scholar] [CrossRef]
- Feng, Z.M. Laboratory Test Study on Silt Flow Solidified Soil in Dalianwan Lake Bottom. Master’s Thesis, Hebei University, Baoding, China, 2020. (In Chinese) [Google Scholar] [CrossRef]
- Zhao, Y.W.; Zhang, N.; Chen, X.M. Test study on mechanical properties of compound municipal solid waste incinerator bottom ash premixed fluidized solidified soil. iScience 2023, 26, 107651. [Google Scholar] [CrossRef]
- Gu, Y.; Zhang, P.Y.; Dong, W.T.; Sun, Q.; Yao, G.; Lv, R.C. Research on the preparation and properties of GBFS-based mud solidification materials. Constr. Build. Mater. 2024, 423, 135900. [Google Scholar] [CrossRef]
- Li, L.S.; Chen, T.F.; Gao, X.J. Synergistic effect of CO2-mineralized steel slag and carbonation curing on cement paste. Cem. Concr. Compos. 2024, 145, 105357. [Google Scholar] [CrossRef]
- Shi, Y.X.; Zhao, Q.X.; Xue, C.H.; Jia, Y.L.; Guo, W.C.; Zhang, Y.Y.; Qiu, Y.X. Preparation and curing method of red mud-calcium carbide slag synergistically activated fly ash-ground granulated blast furnace slag based eco-friendly geopolymer. Cem. Concr. Compos. 2023, 139, 104999. [Google Scholar] [CrossRef]
- JTG.E40; Test Methods of Soils for Highway Engineering. The Ministry of Transport of the People’s Republic of China: Beijing, China, 2007.
- DBJ51/T.188; Technical Standard for Engineering Application by Using Premixed Fluidized Stabilized Soil. Sichuan Provincial Department of Housing and Urban Rural Development: Chengdu, China, 2022.
- ASTM.D6103; Standard Test Method for Flow Consistency of Controlled Low Strength Material (CLSM). American Society Testing and Materials: Denver, CO, USA, 2002.
- JTG.3441; Test Methods of Materials Stabilized with Dnorganic Bindersfor Highway Engineering. The Ministry of Transport of the People’s Republic of China: Beijing, China, 2024.
- Zhang, X.N.; Sun, H.; Jiang, P.; Cui, X.Z.; Wang, J.R. Development and performance characterization of a composite dust suppressant for Yellow River alluvial silt using response surface methodology. J. Clean. Prod. 2022, 376, 134293. [Google Scholar] [CrossRef]
- Sulaiman, N.S.; Hashim, R.; Amini, M.H.M.; Danish, M.; Sulaiman, O. Optimization of activated carbon preparation from cassava stem using response surface methodology on surface area and yield. J. Clean. Prod. 2018, 198, 1422–1430. [Google Scholar] [CrossRef]
- Ebrahimzade, I.; Ebrahimi-Nik, M.; Rohani, A.; Tedesco, S. Higher energy conversion ef fi ciency in anaerobic degradation of bioplastic by response surface methodology. J. Clean. Prod. 2021, 290, 125840. [Google Scholar] [CrossRef]
- Mohammed, B.S.; Khed, V.C.; Nuruddin, M.F. Rubbercrete mixture optimization using response surface methodology. J. Clean. Prod. 2018, 171, 1605–1621. [Google Scholar] [CrossRef]
- Pouladi, B.; Fanaei, M.A.; Baghmisheh, G. Optimization of oxidative desulfurization of gas condensate via response surface methodology approach. J. Clean. Prod. 2019, 209, 965–977. [Google Scholar] [CrossRef]
- Jawad, A.H.; Abdulhameed, A.S.; Surip, S.N.; Alothman, Z.A. Hybrid multifunctional biocomposite of chitosan grafted benzaldehyde/montmorillonite/algae for effective removal of brilliant green and reactive blue 19 dyes: Optimization and adsorption mechanism. J. Clean. Prod. 2023, 393, 136334. [Google Scholar] [CrossRef]
- Xu, C.W.; Ni, W.; Li, K.Q.; Zhang, S.Q.; Xu, D. Activation mechanisms of three types of industrial by-product gypsums on steel slag-granulated blast furnace slag-based binders. Constr. Build. Mater. 2021, 288, 123111. [Google Scholar] [CrossRef]
- Li, Y.; Qiao, C.Y.; Ni, W. Green concrete with ground granulated blast-furnace slag activated by desulfurization gypsum and electric arc furnace reducing slag. J. Clean. Prod. 2020, 269, 122212. [Google Scholar] [CrossRef]
- Biswal, D.R.; Sahoo, U.C.; Dash, S.R. Durability and shrinkage studies of cement stabilsed granular lateritic soils. Int. J. Pavement Eng. 2019, 20, 1451–1462. [Google Scholar] [CrossRef]
- Zhou, M.K.; Liu, X.Y.; Chen, X.; Gao, P. Study on Strength, Water Stability, Shrinkage, and Microstructure of CFB Slag Modified Cement Stabilized Clay. Materials 2021, 14, 7460. [Google Scholar] [CrossRef] [PubMed]
- Wu, J.; Liu, L.; Deng, Y.F.; Zhang, G.P.; Zhou, A.N.; Xiao, H.L. Use of recycled gypsum in the cement-based stabilization of very soft clays and its micro-mechanism. J. Rock Mech. Geotech. Eng. 2022, 14, 909–921. [Google Scholar] [CrossRef]
- Han, Y.M.; Xia, J.W.; Chang, H.F.; Xu, J. The Influence Mechanism of Ettringite Crystals and Microstructure Characteristics on the Strength of Calcium-Based Stabilized Soil. Materials 2021, 14, 1359. [Google Scholar] [CrossRef] [PubMed]
- Yang, Q.S.; Zhang, N.; Han, L.B.; Shi, P.N.; Rong, Y.; Ba, M.F.; Li, S.Y.; Miao, H.K.; Zhao, Y.W. Preparation and characterization of premixed fluidized solidified soil with municipal solid waste incineration bottom ash. Constr. Build. Mater. 2024, 442, 137541. [Google Scholar] [CrossRef]


| Items | Values |
|---|---|
| Initial water content (%) | 5.9 |
| Specific gravity | 2.69 |
| Liquid limit (%) | 23.5 |
| Plastic limit (%) | 18.0 |
| Plasticity index (%) | 5.5 |
| Clay fraction (%) | 7.58 |
| Silt fraction (%) | 82.59 |
| Sand fraction (%) | 9.83 |
| Maximum dry density (g/cm3) | 1.71 |
| Optimum moisture content (%) | 13.1 |
| Setting Time (min) | Compressive Strength (MPa) | |||
|---|---|---|---|---|
| Initial | Final | 3 d | 7 d | 28 d |
| 115 | 184 | 33.8 | 43.5 | 51.6 |
| Materials | Specific Surface Area (m2/kg) |
|---|---|
| SS | 497 |
| GGBS | 463 |
| CFBFA | 536 |
| FGDG | 358 |
| OPC | 381 |
| Materials | Chemical Composition (wt%) | |||||||
|---|---|---|---|---|---|---|---|---|
| CaO | SiO2 | Al2O3 | MgO | Fe2O3 | SO3 | TiO2 | K2O | |
| SS | 30.62 | 16.28 | 8.72 | 6.29 | 28.57 | — | — | — |
| GGBS | 44.71 | 29.29 | 14.85 | 7.33 | 0.39 | 1.28 | 0.68 | 0.41 |
| CFBFA | 3.44 | 49.93 | 36.17 | 0.79 | 5.8 | 1.12 | 1.01 | 1.17 |
| FGDG | 45.35 | 1.56 | 0.8 | 0.35 | 0.12 | 50.63 | 0.02 | 0.41 |
| OPC | 51.42 | 24.99 | 8.26 | 3.71 | 4.03 | 2.51 | — | — |
| Research Objective | Type of Test | Cb (%) | Cw (%) |
|---|---|---|---|
| Development of MSWC by RSM | UCS test | 15 | 45 |
| Performance and mechanism analysis of MSWC-FSS | Flow expansion test, UCS test | 10, 15, 20 | 45, 50 |
| Drying shrinkage test, SEM test, XRD test, on-site test | 15 | 45 |
| Number | Factors | Variable Level | ||
|---|---|---|---|---|
| −1 | 0 | 1 | ||
| A | SS (%) | 15 | 20 | 25 |
| B | GGBS (%) | 35 | 40 | 45 |
| C | CFBFA (%) | 10 | 14 | 18 |
| D | FGDG (%) | 4 | 6 | 8 |
| Run | Variables | Responses | ||||
|---|---|---|---|---|---|---|
| A | B | C | D | Y1 | Y2 | |
| SS (%) | GGBS (%) | CFBFA (%) | FGDG (%) | 7 d UCS (MPa) | 28 d UCS (MPa) | |
| 1 | 20 | 35 | 14 | 8 | 0.63 | 1.07 |
| 2 | 20 | 35 | 18 | 6 | 0.65 | 1.10 |
| 3 | 15 | 40 | 18 | 6 | 0.49 | 0.92 |
| 4 | 15 | 35 | 14 | 6 | 0.48 | 0.94 |
| 5 | 20 | 40 | 18 | 4 | 0.67 | 1.11 |
| 6 | 15 | 40 | 14 | 8 | 0.52 | 0.95 |
| 7 | 15 | 40 | 10 | 6 | 0.52 | 0.93 |
| 8 | 20 | 45 | 14 | 4 | 0.70 | 1.16 |
| 9 | 20 | 40 | 14 | 6 | 0.74 | 1.23 |
| 10 | 20 | 40 | 14 | 6 | 0.73 | 1.27 |
| 11 | 20 | 45 | 10 | 6 | 0.66 | 1.12 |
| 12 | 25 | 40 | 14 | 8 | 0.61 | 1.03 |
| 13 | 20 | 40 | 14 | 6 | 0.72 | 1.23 |
| 14 | 25 | 45 | 14 | 6 | 0.66 | 1.07 |
| 15 | 20 | 45 | 14 | 8 | 0.69 | 1.18 |
| 16 | 15 | 45 | 14 | 6 | 0.49 | 0.96 |
| 17 | 25 | 40 | 14 | 4 | 0.59 | 0.99 |
| 18 | 20 | 40 | 14 | 6 | 0.73 | 1.25 |
| 19 | 20 | 40 | 18 | 8 | 0.68 | 1.20 |
| 20 | 25 | 40 | 10 | 6 | 0.57 | 0.96 |
| 21 | 20 | 40 | 14 | 6 | 0.74 | 1.21 |
| 22 | 20 | 35 | 14 | 4 | 0.63 | 1.09 |
| 23 | 15 | 40 | 14 | 4 | 0.52 | 0.94 |
| 24 | 20 | 45 | 18 | 6 | 0.74 | 1.20 |
| 25 | 25 | 35 | 14 | 6 | 0.55 | 0.93 |
| 26 | 20 | 40 | 10 | 8 | 0.66 | 1.15 |
| 27 | 20 | 40 | 10 | 4 | 0.65 | 1.13 |
| 28 | 25 | 40 | 18 | 6 | 0.65 | 1.05 |
| 29 | 20 | 35 | 10 | 6 | 0.61 | 1.07 |
| Source | Degree of Freedom | 7 d UCS (Y1) | 28 d UCS (Y2) | ||||||
|---|---|---|---|---|---|---|---|---|---|
| Sum of Squares | Mean Square | F-Value | p-Value | Sum of Squares | Mean Square | F-Value | p-Value | ||
| Model | 14 | 0.1888 | 0.0135 | 76.14 | <0.0001 * | 0.3370 | 0.0241 | 48.45 | <0.0001 * |
| A (SS) | 1 | 0.0310 | 0.0310 | 175.05 | <0.0001 * | 0.0114 | 0.0114 | 22.96 | 0.0003 * |
| B (GGBS) | 1 | 0.0127 | 0.0127 | 71.55 | <0.0001 * | 0.0184 | 0.0184 | 37.05 | <0.0001 * |
| C (CFBFA) | 1 | 0.0037 | 0.0037 | 20.75 | 0.0004 * | 0.0040 | 0.0040 | 8.12 | 0.0129 * |
| D (FGDG) | 1 | 0.0001 | 0.0001 | 0.4234 | 0.5258 | 0.0021 | 0.0021 | 4.29 | 0.0572 |
| AB | 1 | 0.0025 | 0.0025 | 14.11 | 0.0021 * | 0.0049 | 0.0049 | 9.86 | 0.0072 * |
| AC | 1 | 0.0030 | 0.0030 | 17.08 | 0.0010 * | 0.0025 | 0.0025 | 5.03 | 0.0416 * |
| AD | 1 | 0.0001 | 0.0001 | 0.5645 | 0.4649 | 0.0002 | 0.0002 | 0.4529 | 0.5119 |
| BC | 1 | 0.0004 | 0.0004 | 2.26 | 0.1551 | 0.0006 | 0.0006 | 1.26 | 0.2809 |
| BD | 1 | 0.0000 | 0.0000 | 0.1411 | 0.7128 | 0.0004 | 0.0004 | 0.8052 | 0.3847 |
| CD | 1 | 0.0000 | 0.0000 | 0.0000 | 1.0000 | 0.0012 | 0.0012 | 2.47 | 0.1387 |
| A2 | 1 | 0.1343 | 0.1343 | 758.42 | <0.0001 * | 0.2879 | 0.2879 | 579.47 | <0.0001 * |
| B2 | 1 | 0.0098 | 0.0098 | 55.46 | <0.0001 * | 0.0219 | 0.0219 | 44.18 | <0.0001 * |
| C2 | 1 | 0.0064 | 0.0064 | 36.14 | <0.0001 * | 0.0192 | 0.0192 | 38.66 | <0.0001 * |
| D2 | 1 | 0.0064 | 0.0064 | 36.14 | <0.0001 * | 0.0143 | 0.0143 | 28.74 | 0.0001 * |
| Residual Error | 14 | 0.0025 | 0.0002 | - | - | 0.0070 | 0.0005 | - | - |
| Lack of Fit | 10 | 0.0022 | 0.0002 | 3.14 | 0.1405 | 0.0049 | 0.0005 | 0.9375 | 0.5778 |
| Pure Error | 4 | 0.0003 | 0.0001 | - | - | 0.0021 | 0.0005 | - | - |
| Total | 28 | 0.1913 | - | - | - | 0.3439 | - | - | - |
| Index | 7 d UCS (MPa) | 28 d UCS (MPa) |
|---|---|---|
| Measured values | 0.77 | 1.21 |
| Predicted values | 0.75 | 1.25 |
| Relative error | 2.67% | 3.20% |
| Binder Type | Time (h) | ||
|---|---|---|---|
| 0.0 | 0.5 | 1.0 | |
| MSWC | 183 | 167 | 121 |
| OPC | 191 | 169 | 114 |
| Binder Type | Curing Time | |
|---|---|---|
| 7 d | 28 d | |
| MSWC | 0.78 | 1.12 |
| OPC | 0.66 | 1.06 |
Disclaimer/Publisher’s Note: The statements, opinions and data contained in all publications are solely those of the individual author(s) and contributor(s) and not of MDPI and/or the editor(s). MDPI and/or the editor(s) disclaim responsibility for any injury to people or property resulting from any ideas, methods, instructions or products referred to in the content. |
© 2025 by the authors. Licensee MDPI, Basel, Switzerland. This article is an open access article distributed under the terms and conditions of the Creative Commons Attribution (CC BY) license (https://creativecommons.org/licenses/by/4.0/).
Share and Cite
Cui, X.; Meng, H.; Liu, Z.; Sun, H.; Zhang, X.; Jin, Q.; Wang, L. Development, Performance, and Mechanism of Fluidized Solidified Soil Treated with Multi-Source Industrial Solid Waste Cementitious Materials. Buildings 2025, 15, 864. https://doi.org/10.3390/buildings15060864
Cui X, Meng H, Liu Z, Sun H, Zhang X, Jin Q, Wang L. Development, Performance, and Mechanism of Fluidized Solidified Soil Treated with Multi-Source Industrial Solid Waste Cementitious Materials. Buildings. 2025; 15(6):864. https://doi.org/10.3390/buildings15060864
Chicago/Turabian StyleCui, Xinzhuang, Huaming Meng, Zhanghong Liu, Hao Sun, Xiaoning Zhang, Qing Jin, and Lei Wang. 2025. "Development, Performance, and Mechanism of Fluidized Solidified Soil Treated with Multi-Source Industrial Solid Waste Cementitious Materials" Buildings 15, no. 6: 864. https://doi.org/10.3390/buildings15060864
APA StyleCui, X., Meng, H., Liu, Z., Sun, H., Zhang, X., Jin, Q., & Wang, L. (2025). Development, Performance, and Mechanism of Fluidized Solidified Soil Treated with Multi-Source Industrial Solid Waste Cementitious Materials. Buildings, 15(6), 864. https://doi.org/10.3390/buildings15060864